Article

Assessing Student Engagement: A Machine Learning Approach to Qualitative Analysis of Institutional Effectiveness

Department of Electronic and Computer Engineering, University of Limerick, V94 TP9X Limerick, Ireland
*
Authors to whom correspondence should be addressed.
Future Internet 2025, 17(10), 453; https://doi.org/10.3390/fi17100453
Submission received: 16 August 2025 / Revised: 24 September 2025 / Accepted: 25 September 2025 / Published: 1 October 2025
(This article belongs to the Special Issue Machine Learning and Natural Language Processing)

Abstract

In higher education, institutional quality is traditionally assessed through metrics such as academic programs, research output, educational resources, and community services. However, it is important that their activities align with student expectations, particularly in relation to interactive learning environments, learning management system interaction, curricular and co-curricular activities, accessibility, support services and other learning resources that ensure academic success and, jointly, career readiness. The growing popularity of student engagement metrics as one of the key measures to evaluate institutional efficacy is now a feature across higher education. By monitoring student engagement, institutions assess the impact of existing resources and make necessary improvements or interventions to ensure student success. This study presents a comprehensive analysis of student feedback from the StudentSurvey.ie dataset (2016–2022), which consists of approximately 275,000 student responses, focusing on student self-perception of engagement in the learning process. By using classical topic modelling techniques such as Latent Dirichlet Allocation (LDA) and Bi-term Topic Modelling (BTM), along with the advanced transformer-based BERTopic model, we identify key themes in student responses that can impact institutional strength performance metrics. BTM proved more effective than LDA for short text analysis, whereas BERTopic offered greater semantic coherence and uncovered hidden themes using deep learning embeddings. Moreover, a custom Named Entity Recognition (NER) model successfully extracted entities such as university personnel, digital tools, and educational resources, with improved performance as the training data size increased. To enable students to offer actionable feedback, suggesting areas of improvement, an n-gram and bigram network analysis was used to focus on common modifiers such as “more” and “better” and trends across student groups. This study introduces a fully automated, scalable pipeline that integrates topic modelling, NER, and n-gram analysis to interpret student feedback, offering reportable insights and supporting structured enhancements to the student learning experience.

1. Introduction

Globally, the Higher Education sector is experiencing rapid growth driven by technological advancements, increasing demand of skilled professionals, infrastructure enhancement, and improved accessibility. This development also necessitates the regular assessment and enhancement of policies, procedures, infrastructure, and both academic and support services [1]. Student feedback surveys provide valuable insights that help Higher Education Institutions (HEIs) better understand the aspects that are favorable to the students and identify the areas that necessitate improvements. Recently, HEIs have adopted the practice of soliciting feedback from students through comprehensive satisfaction surveys. Examples of this include studentsurvey.ie https://studentsurvey.ie/ in Ireland and UK’s National Student Survey https://www.thestudentsurvey.com/ (NSS). In the Irish context StudentSurvey.ie is a national student engagement survey, established in 2016 and conducted annually to gather feedback from first-year undergraduate, final-year undergraduate, and taught postgraduate students across 21 higher education institutions in Ireland. Between 2016 and 2022, approximately 275,000 responses were collected. These surveys not only reflect the concerns associated with various aspects of students academic lives but also emphasise the improvement of their experiences at HEIs.
In addition to teaching and assessment, student engagement plays a crucial role in the learning process. It not only facilitates the achievement of learning outcomes but also serves as an indicator of students’ satisfaction with the quality of education. The term “engagement” is commonly defined as “commitment” or “active involvement” and is also described in emotional terms as “to involve or attract” in various dictionaries [2]. However, Fredricks et al. categorize student engagement into three distinct dimensions: (1) Behavioral Engagement, which refers to students’ participation in both academic and extracurricular activities; (2) Emotional Engagement, which encompasses students’ positive or negative reactions toward instructors, academic content, departments, and institutions; and (3) Cognitive Engagement, which reflects students’ willingness to invest effort in mastering difficult skills and comprehending complex concepts [3]. Student engagement is essential for achieving positive academic outcomes, fostering a strong sense of connection with the institution, and motivating individuals to pursue continuous skill development and personal growth. Therefore, a comprehensive and detailed analysis of feedback surveys is essential to identify both academic and non-academic factors that students find valuable. This process not only provides insights into improving institutional facilities and the overall educational experience but also ensures that no important aspect is overlooked or neglected. The sheer size of the corpus under consideration is an important feature to be considered. Automated tools are required to help humans make sense of this data in a tractable time window so that interventions, if necessary, can take place in a reasonable time.
Generally, student feedback surveys are categorised as either quantitative or qualitative. Quantitative surveys rely heavily on measures such as the Likert scale. Although they are useful for identifying shortcomings, they may fail to uncover the underlying causes of these issues. Qualitative surveys, on the other hand, utilise open-ended responses to provide detailed insights into the underlying reasons for issues. They also suggest remedial tools to prevent or overcome these issues. Therefore, employing a mixed-methods approach can be a powerful research tool by leveraging the strengths of both Multiple-Choice-Questions (MCQs) and Open-ended responses. It is relatively straightforward to analyse responses to MCQs, determining average scores or frequencies for specific items of interest. However, it is important to note that these ratings or frequencies alone do not provide insight into why an item is perceived positively or negatively, or why it is relatively common. Open-ended student feedback offers rich data regarding student engagement, perceived challenges, and satisfaction with the institution, faculty, and programme of study. However, manual analysis of this qualitative data can be laborious, time-consuming, and intricate. This is especially true for large datasets, for instance, feedback collected from large cohorts, where the complexity of thematic analysis grows with the number of responses [4]. Despite being challenging and the complex nature of qualitative feedback analysis, this analysis is crucial in making and deploying effective decisions and actions.
In data analysis, text mining is regarded as a primary area for extracting meaningful insights from unstructured data. It employs techniques such as sentiment analysis and topic modelling to analyse large amounts of open-ended responses, identify patterns, and uncover hidden trends [5]. Text mining techniques are broadly divided into two main categories: Supervised and Unsupervised. Supervised techniques rely on labelled data to train the text mining models, enabling them to predict predefined categories, labels, or sentiments for new, unseen documents or text content. This approach requires a dataset with annotated examples to learn from, allowing the model to classify or predict outcomes based on the patterns identified in the labelled data. On the other hand, supervised models require no labelled data and help identify hidden patterns and themes present in the data without prior training of the models. While supervised methods require manual annotation that can be costly as well as time-consuming, unsupervised models offer multiple advantages especially for unlabelled and unstructured data. These techniques automatically uncover hidden information and patterns without the need for labelled data. They can be effectively employed to analyse unstructured textual data by clustering similar content and identifying key topics, enabling a deeper understanding of underlying themes [6]. The goal of this work is to evaluate the effectiveness of both supervised and unsupervised text mining techniques for qualitative analysis of student surveys. To this end, we have experimented with deploying text mining techniques to analyse the results of the Irish national student survey.
The primary objective of StudentSurvey.ie is to evaluate student engagement, measuring the extent of time and effort students dedicate to meaningful and purposeful learning activities, as well as assessing how effectively educational institutions provide these opportunities. The survey consists of 62 multiple-choice questions and four open-ended questions, which can be answered in either English or Irish.
The four qualitative open-ended questions of the survey are as follows:
  • Q1. What does your institution do best to engage students in learning?
  • Q2. What could your institution do to improve students’ engagement in learning?
  • Q3. What are the positive elements of the online/blended learning experience, you want to keep when on-campus studies resume?
  • Q4. In what way(s) could your higher education institution improve its support for you during the current circumstances?
In addition to first two questions, Q3 and Q4 were introduced to the survey in 2021 to assess the impact of the COVID-19 pandemic and its associated restrictions on student engagement and overall experience. Meanwhile, a significant amount of natural language data has been gathered for the first two questions, requiring in-depth qualitative analysis that requires automated AI tools to assist humans in the task of assessment. Since the primary objective of this work is to analyse open-ended student responses, we employed state-of-the-art text mining techniques that are described in Section 3.
Our contributions in this study compared to existing work are as follows: (1) state of the art unsupervised Machine Learning (ML) and natural language Processing (NLP) techniques are deployed and combined into a unified framework to effectively analyse the StudentSurvey dataset; (2) a novel framework is proposed to automate the analysis process of open-ended responses to reduce manual effort and improve scalability; (3) a detailed comparative performance analysis of the techniques used to identify the most suitable technique(s) is provided, offering clear evidence of effective approaches for student survey data analysis; (4) real-world student data are utilized to offer necessary tools and guidelines for practitioners to adopt and integrate the most promising techniques into their workstreams.
The rest of the paper is organised as follows: Section 2 provides a comprehensive review of the relevant studies. Section 3 presents the methodology. Section 4 presents details about the experiments, while Section 5 gives a detailed analysis of results and findings. Finally, Section 6 outlines some future recommendations and provides conclusions.

2. Literature Review

Academic factors such as teaching quality, assessments, and course content play a crucial role in student success. Numerous authors have identified non-academic factors such as campus facilities, mental health support, social integration, student services, and various student activities also significantly impact the overall student experience [1], and the references therein.
To evaluate teaching quality, a widely recognised method known as Student Evaluation of Teaching (SET) has been commonly employed by HEIs [7,8]. However, student evaluation data not only address teaching and learning but also cover other factors such as administration, social and non-academic aspects. These factors help HEIs advance their overall services and foster a more supportive and holistic learning environment. Therefore, it is essential to gain a deeper insight into the student feedback and develop effective methods and tools for more detailed analysis. Since open-ended questions yield detailed and in-depth information compared to closed-ended ones, the manual analysis of these responses demands substantial resources. Consequently, the majority of studies [9,10] in this area limit their analysis to a small subset of responses, underscoring the need for more efficient methods to process and interpret large volumes of qualitative data.
Recent technological advancements have inspired researchers to utilise machine learning and deep learning algorithms to assist humans in the analysis of the huge number of open-ended responses that tend to be gathered in these large-scale surveys by education and industry. This approach enables the efficient processing of student responses, allowing humans the time and space to focus on critical reflection and improving educational outcomes rather than lover level processing tasks.
Sentiment Analysis [11] is one of the common methods used in various studies [12,13,14,15,16,17,18,19] to analyse open-ended student responses that can help to identify and analyse teaching-related aspects and teachers’ performance. A relevant research study [20] employed sentiment topic modelling techniques to examine responses from the PGR StudentSurvey.ie, an Irish survey of postgraduate research student engagement. Using Microsoft Azure Power BI’s text analytics features, the researchers extracted sentiment scores to evaluate the emotional tone of the feedback and utilise LDA for topic modelling. Their analysis revealed that the most prevalent topic in the survey concerned the student–supervisor relationship, highlighting both positive and negative aspects. Using the two open-ended questions from the StudentSurvey.ie dataset for student engagement analysis, another study [21] utilised sentiment analysis by first generate the keywords from student responses then determine the sentiments in the sentence containing those keywords. They identified that academic staff, library services and campus facilities are the key aspects for high student engagement. For the “improve_how” question, they employed bigram network and identify that students generally made suggestion with the indicator “more” associated with the most frequent keywords like “more feedback”, “more tutorials” and “more activities”, highlighting their importance in the students learning process.
It aims to determine the polarity and sentiment of the responses in relation to a particular entity, e.g., person, place, or event. It can be performed at a document level sentence level to identify the polarity of the sentence and also at an aspect-based level that focuses on determining the attributes or aspects of a piece of text and classifying the opinions based on those aspects. While sentiment analysis is widely used to analyse open-ended responses, it sometimes struggles to interpret contextual information, capture the nuances of complex human language, understand underlying reasons, and highlight specific topics or entities discussed in the text.
Topic modeling [22] is another effective approach to analyse open-ended responses that helps in finding common themes and hidden topics within the text. It identifies the patterns and relationships of words to find the common topic and then groups all related documents into the respective topic. Jie and Lu [23] highlighted the effectiveness of Latent Dirichlet Allocation (LDA) method to identify the themes related to teaching and learning in student evaluation of teaching. Nanda et al. [24] employed LDA to identify the main aspects in a massive open online course (MOOC) that affect students learning experience. They highlighted the key factors such as course content quality, quality of assessment and feedback, clarity on prerequisites, awareness of the time needed to cover the syllabus, interaction with class fellows and instructors, instructor engagement, and access to teaching and learning resources. In another study, Fang [25] employed a BERTopic model to analyse an MOOC in China and identified course features important to students, including content quality, teaching style, subject knowledge, course design, the need for case studies, and the quality of audio and video content. Dillan and Fudholi [26] analysed tweets collected from Twitter about MOOCs. They used LDA topic modelling techniques to identify key global topics and highlight the role of MOOCs for modern learning experience. Additionally, they also conducted an N-gram analysis to determine frequently occurring words related to learners’ sentiments. Interestingly, this study highlights the limitation of current sentiment analysis models by revealing that tweets with negative sentiment labels could contain positive phrases. Parker et al. [27] used GPT-4 to perform text classification, labelling, and thematic analysis of student feedback. In thematic analysis, they not only found the common themes but also identified the suggestions for improvements made by the students. In a recent study [28], authors evaluated the performance of traditional topic modelling techniques and transformer-based approaches to extract the distinct themes from student feedback. They found transformer-based models superior in terms of topic coherence and interpretability by generating more meaningful and distinct themes from student feedback. In contrast, traditional approaches like LDA generated broad distinct themes. To analyse student feedback from the UK National Student Survey, Nawaz et al. [29] applied a combination of supervised and unsupervised ML algorithms to extract actionable insights to enhance teaching and learning quality. They employed supervised algorithms such as Naïve Bayes and Random Forest to classify the textual feedback into predefined categories (themes). Through this approach, they were able to identify areas for improvement including clarity in assessment and communication. Additionally, the framework identified the areas students suggested for improvements that include, efficacy of teaching methods, availability of the learning materials and the quality of response from the student support services. Onah and Pang [30] utilised LDA model and PyLDAvis to identify key motivation factors for the participants joining a particular online course and their engagement. They explored forum data to identify the main themes about learners’ participation and revealed that the main motivation factors to join the course were to gain the foundational knowledge, the course structure that supports self-directed learning and the opportunity to interact and collaborate with peers. Riaz et al. [31] explored various techniques for topic modelling including LDA, BERTopic, XLNet and hybrid models. They highlighted that the transformer-based model generated more coherent topics while suggesting the use of a hybrid model for optimised performance in terms of both coherence and diversity.
Although traditional topic modelling techniques have been widely used to analyse open-ended responses, recent advances such as BERTopic provide better contextual understanding and more coherent topics generation. In our work, we employ benchmark Bi-term Topic Modeling (BTM), LDA and BERTopic for the analysis open-ended student responses gathered from the StudentSurvey.ie dataset to generate key thematic insight. It is important to note that the dataset used in this study is not publicly available. We received access to an anonymized version after being awarded a research grant from StudentSurvey.ie, under strict data protection guidelines. However, the next section outlines our methodology in detail to support transparency and reproducibility.

3. Methodology

In this section, we provide a technical overview of the NLP and Machine Learning techniques employed in this study.

3.1. Topic Modelling

In topic modelling, a selected set of words, known as topics, are chosen from a collection of documents that are best suited to describe the information in the collection, and they can be distilled to help the task of determining insightful descriptions for the underlying topic. Formally, topics are the group of words which occur together in the same context and are retrieved from the documents [22]. Through this method, it is possible to model documents as latent topics or latent themes that reflect the meaning of a collection of documents.
In topic modelling, a collection of documents is first pre-processed to remove noise and ensure the data is clean and ready for analysis. This cleaned data is then fed into a topic model, which identifies and generates the key themes hidden within the documents. Finally, each document in the corpus is assigned to the most relevant theme, resulting in clear clusters that capture the main ideas across the dataset. Figure 1 presents a visualisation of the topic modelling process.
It is crucial to extract meaningful information from the open-ended student responses. Topic modelling provides an efficient tool to discover relevant hidden structures from a collection of documents. It is an effective technique because it accomplishes beyond what classification and clustering algorithms do. Therefore, experiments with topic modelling are conducted to summarize, interpret, and visualize large quantities of student feedback in the StudentSurvey.ie dataset.
Topic modelling techniques can be classified into classical and deep learning-based approaches. Among classical topic modelling approaches are Latent Semantic Analysis (LSA), Probabilistic Latent Semantic Analysis (PLSA), Latent Dirichlet Allocation (LDA), and Correlated Topic Model [32]. Deep learning-based techniques include Lda2vec and BERTopic [33]. In our experiments, we employed both classical and deep learning-based approaches to conduct a comprehensive performance comparison.

3.1.1. Latent Dirichlet Allocation (LDA)

The literature suggests that Latent Dirichlet Analysis is a particularly effective approach to topic modelling [34]. It is a probabilistic generative model for the extraction of semantic themes from textual data and models documents as a mixture of latent topics where each topic is characterized by a probability distribution over words. When applied to student satisfaction responses, each sample is treated as a document within the corpus. LDA identifies underlying topics from this corpus, enabling subsequent analysis and visualisation. Therefore, LDA is used in our topic modelling experiments, and its performance on the dataset is evaluated.
Although LDA models identify topics by leveraging probability distributions over words, their effectiveness is limited when applied to short texts [35]. The restricted context and sparse word co-occurrence present significant challenges, often resulting in suboptimal topic extraction even with optimised hyperparameters. Moreover, LDA model treats documents as probabilistic mixtures of latent topics, where each topic has a probability distribution over numbers of words, and each document is represented as a bag-of-words (BOW). In this approach, topic models can identify hidden themes but cannot explore a document’s deep semantic meaning. Therefore, we employ other techniques to mitigate these challenges as well as to compare the performance of the models for the student feedback analysis.

3.1.2. Bi-Term Topic Modelling

Bi-term Topic Modeling (BTM) is a topic modeling technique specifically designed for short text analysis. It extracts biterms (unordered word pairs) from a corpus to infer underlying topics [36]. Similar to LDA, BTM is a generative probabilistic model. However, BTM differs by directly modeling word co-occurrence patterns (biterms) within a corpus to infer topics, rather than modelling word occurrences within documents. This corpus-level modeling addresses the sparsity issue prevalent in short texts. Consequently, BTM assigns documents to topics based on these inferred topic distributions.

3.1.3. BERTopic

Deep learning-based pre-trained models such as BERT contain accurate representation of words and sentences and have shown superior results in various NLP tasks. BERTopic [33] is a topic modelling technique that leverages pre-trained transformer-based language models, clustering techniques, and a class-based variation of TF-IDF to generate coherent topic representations. It utilised word embeddings to take into account the semantic meaning of the text and generate meaningful topics that correlate semantically with the content.
The initial step in BERTopic involves converting each document within the corpus into its corresponding embedding representation by utilizing a pre-trained BERT language model. Subsequently, the dimensionality of these embeddings is reduced prior to clustering in order to optimize the clustering process. The final stage entails generating topic representations from the clusters of documents through a customized class-based variation of the TF-IDF algorithm. This process retains important words within the topic description. Each topic is then characterized by its most representative documents, referred to as the “exemplars”. BERTopic demonstrates competitive performance across various benchmarks, encompassing both classical models and those that adopt the more recent clustering approach in topic modelling. One advantage of employing BERTopic, as opposed to LDA, is its capability to capture the contextual meaning of words within the corpus, thereby leading to more accurate and interpretable topics. Moreover, BERT also possesses the ability to handle out-of-vocabulary words, enabling it to handle rare or novel words that may not be present in the pre-trained BERT vocabulary.

3.2. Name Entity Recognition (NER)

Named Entity Recognition (NER) is a subtask in NLP that involves identifying and classifying named entities within text. Named entities, such as persons, organisations, locations, and other real-world entities, often convey crucial information and serve as key targets for various NLP applications. For instance, in the sentence “Professor John Smith from Harvard University won the Nobel Prize”, the entities “Professor”, “John Smith”, “Harvard University” and “Nobel Prize” constitute essential information. NER is considered as one of the useful tools for various NLP tasks such as information extraction. Therefore, NER is utilised in our experiments to retrieve specific information, such as rare entities, that are not readily attainable through topic modelling.

3.3. N-Gram Analysis

In a text document, N-grams are continuous sequences of N words. For example, this sentence “Text analysis techniques help in extracting key topics from documents” includes unigrams (1-g): “text”, “analysis”, “techniques”, “helps”, “in”, “extracting”, “key”, “topics”, “from”, “documents”. Bi-grams (2-g) are: “text analysis”, “analysis techniques”, “techniques help”, while tri-grams (3-g) are: “text analysis techniques”, “topics from documents”. N-gram analysis helps in retrieving information from a corpus by identifying key topics based on word sequence frequencies [37]. In addition, it provides insight into word relationships, which can be visualised through n-gram networks [38].

4. Experiments

4.1. Dataset

The student survey dataset was collected over a seven-year window from 2016 to 2022, including data from 21 Irish Higher Education Institutions. This dataset contains 64 MCQs as well as four open-ended questions. There is a total of 275,302 student responses in the CSV file that contains the combined survey data from all years. The survey respondents are students from diverse backgrounds and age groups enrolled in Higher Education Institutions in Ireland. Table 1 presents the percentage breakdown of participants by demographic characteristics over the years, including gender, age group, mode of study, and study level, i.e., Postgraduate students (PGT), First Year undergraduate students (Y1), and Final year Undergraduate students (YF). To identify potential bias factors, it is observed that female respondents outnumber male respondents in the corpus, while the dominant age group is aged 23 and under. Moreover, participation was higher among first-year and final-year undergraduates compared to postgraduates. Additionally, full-time students were more actively represented than part-time students.
In this study, our focus is on two specific open-ended questions that have been included in the survey since its inception. The first question, “What does your institution do best to engage students in learning?” is represented by the column labelled “best_aspects”. The second question, “What could your institution do to improve students’ engagement in learning?” is represented by the column labelled “improve_how”. A breakdown of the number of responses received for each question per year is presented in Table 2.
Meanwhile, it is also noted that some students chose not to answer open-ended questions. As shown in Table 3, the number of responses varied each year, with more students answering Q2 than Q1.

4.2. Data Cleaning and Pre-Processing

Pre-processing is a crucial step in preparation of the input data for training and testing the models. Textual data often contains undesired elements such as URLs, stopwords, and special characters. Therefore, it is essential to eliminate any noise from the text data, ensuring the generation of a clean dataset for subsequent stages. It should be noted, however, that the pre-processing steps may vary across different models.
The following steps were applied to clean and pre-process the data to ensure efficient model performance:
  • Elimination of Missing Values: A thorough dataset analysis revealed a significant number of missing values (unanswered entries) in both MCQs and open-ended questions. Therefore, these missing values were removed first.
  • Filtering out Non-English Answers: Survey respondents were asked to answer in either English or Irish. Since the number of Irish responses was minimal (1229 out of 145,970 total answers), only English answers were retained, and Irish responses were excluded for the purposes of this study.
  • Text Pre-Processing: Student responses varied in writing style, including case differences, use of non-ASCII characters, punctuation, alphanumeric words, and whitespace. The following steps were taken to normalise these style variations:
    • Case Normalisation
    • Removal of non-ASCII characters
    • Punctuation Removal
    • Removal of Alphanumeric Words
    • Extra Whitespace Removal
    • Lemmatisation
  • Misspelling Correction: To efficiently identify topic themes, it is essential to correct misspelt words in the dataset in advance of any analysis. Therefore, we used the PySpellChecker https://pypi.org/project/pyspellchecker/ package in Python to identify and correct potentially misspelt words. Certain terms, such as “Sulis”, “Kahoot”, “Brightspace”, (VLE names) and abbreviations like “PSU” (Postgraduate Students’ Union) may be incorrectly flagged as misspellings, necessitating further manual intervention. Additionally, some terms, like “e-tivities,” which should be a single word, may be split. Since most of these terms are institution-specific and may not be recognised by the pre-trained models, manual correction is performed using a Python dictionary that maps each misspelt word to its correct spelling.
  • Abbreviation Expansion: Upon further analysis of the dataset, it was found that for terms like “Postgraduate Student Union” and “Multiple Choice Questions,” some students used abbreviations, while others wrote out the full forms. To ensure consistency and clarity, a dictionary similar to the one used for spelling correction that automatically replaces abbreviations with their full forms in the text was used. However, certain institution-specific abbreviations posed challenges for correction, as their accurate full forms were unknown.
  • Removal of irrelevant/unusable text: Generally, unusable or irrelevant text refers to the responses that are either shorter than three characters or too vague to understand such as “yes,” “fdgdg,” and “yeahh.” It is important to remove this type of text from the dataset to maintain its quality.

4.3. Experiments for Q1: “What Does Your Institution Do Best to Engage Students in Learning?”

4.3.1. Topic Modelling

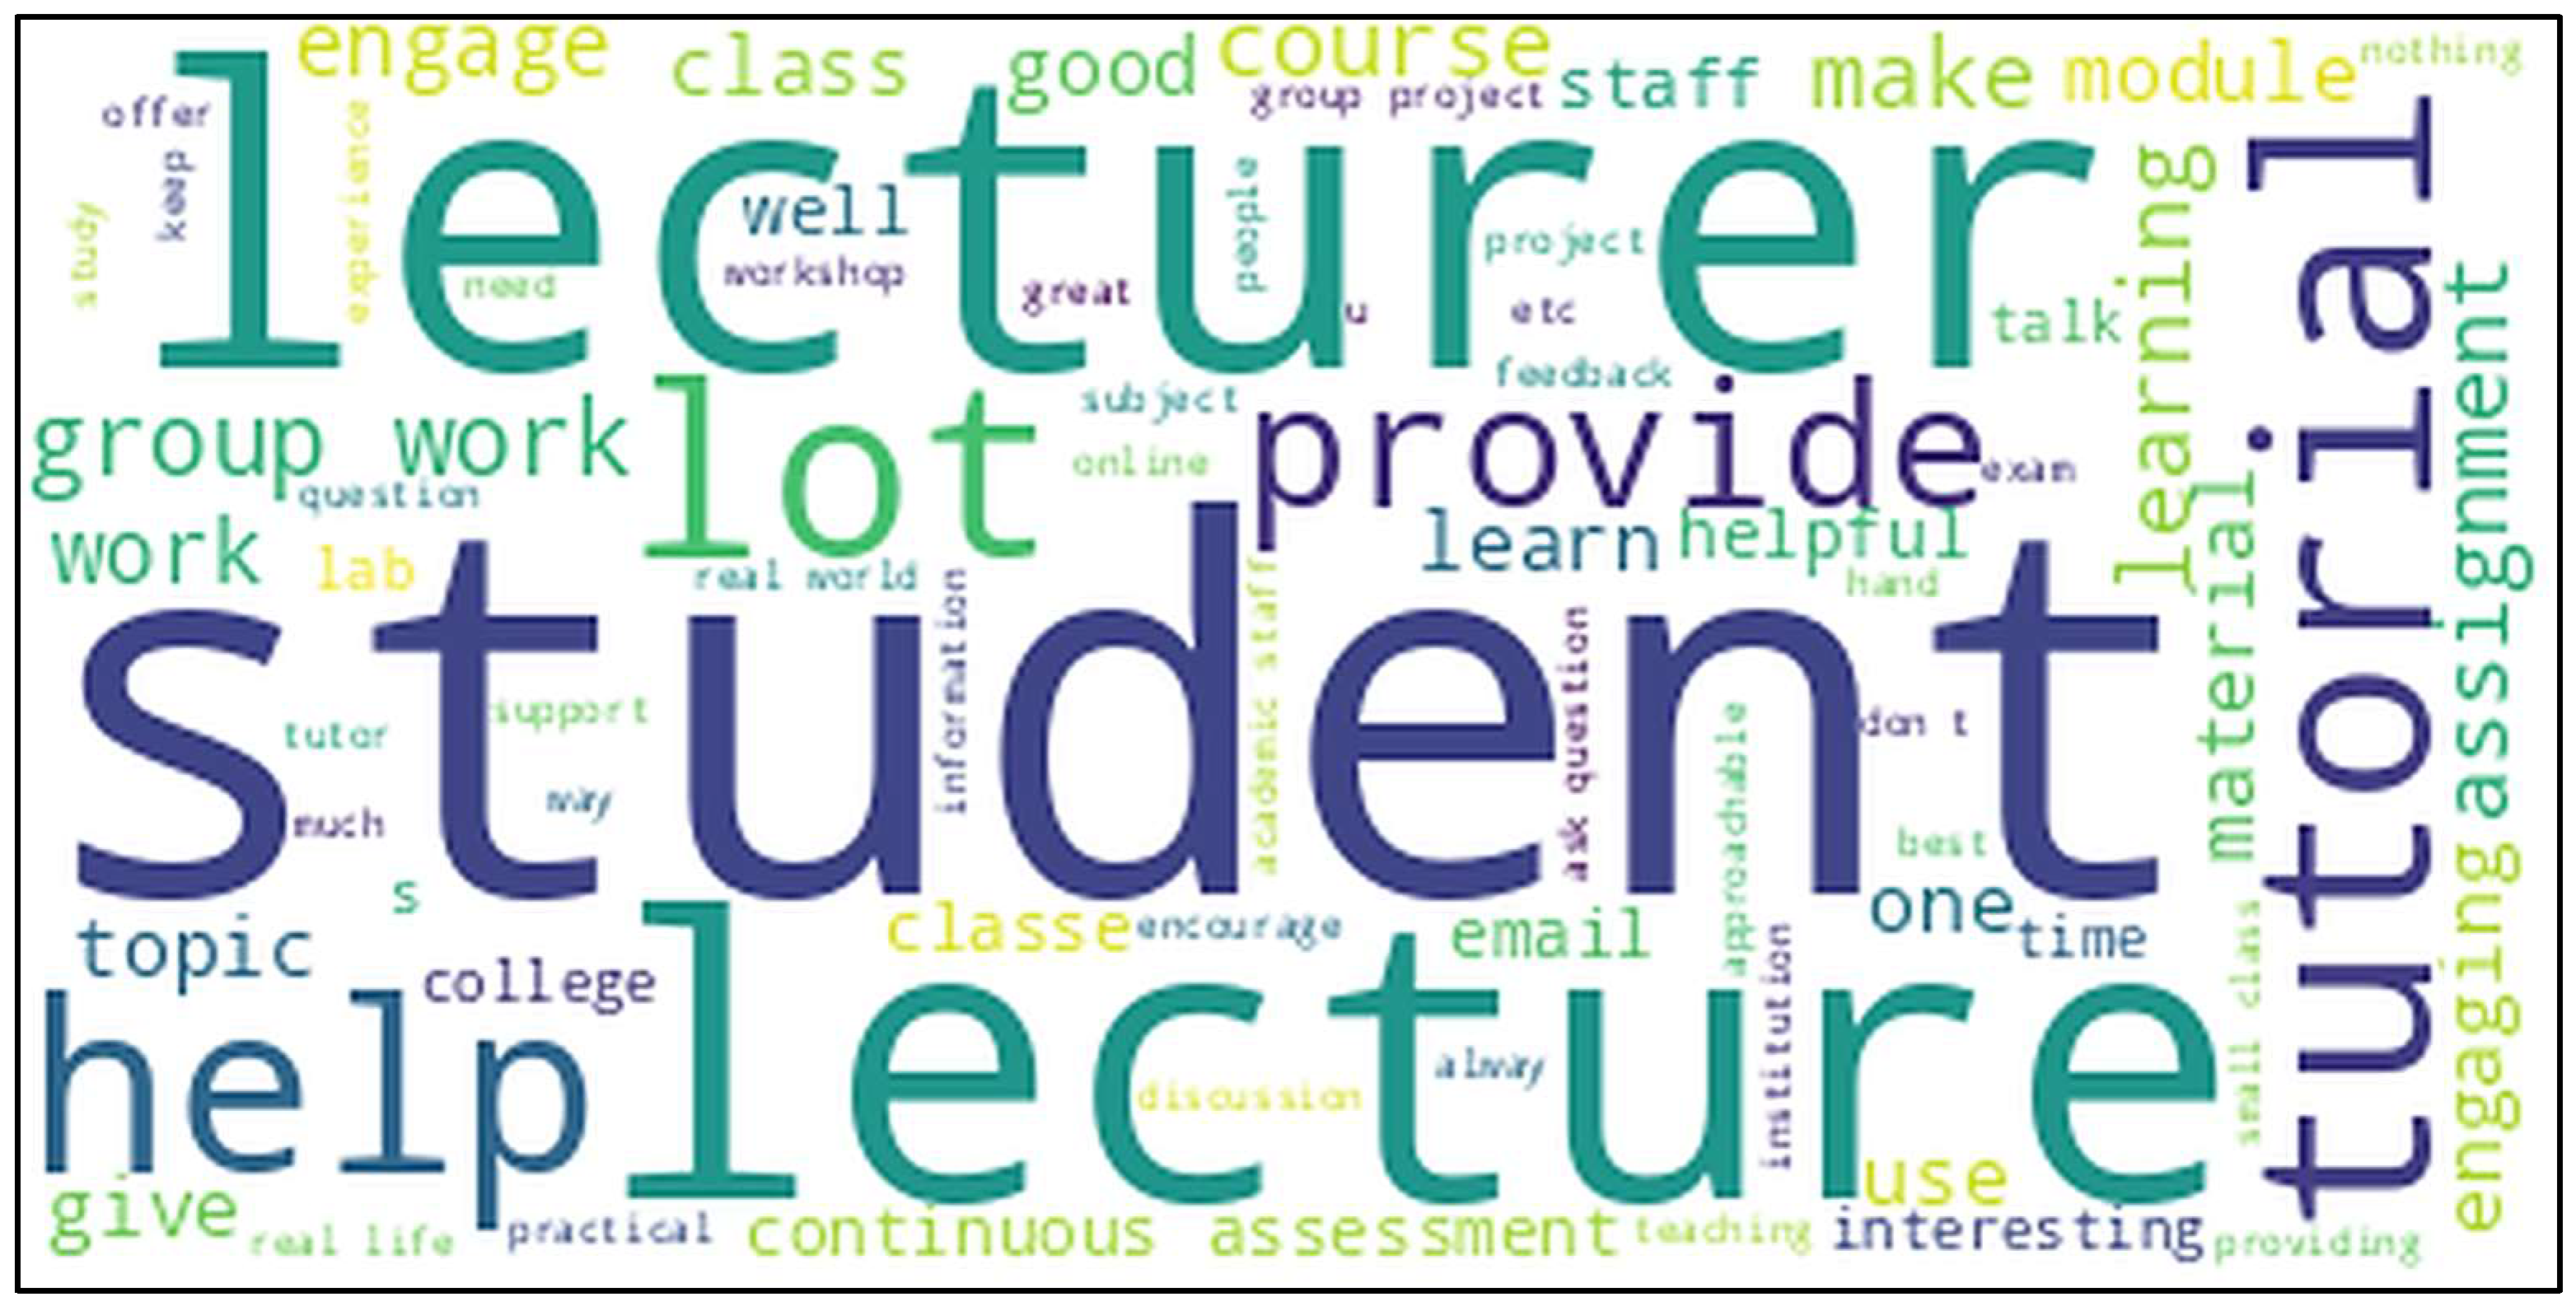
After data cleaning and pre-processing, we analysed the most frequent words in the corpus using a word cloud as shown in Figure 2. Upon preliminary visual inspection, broader themes are identified, such as teaching, student support, and student engagement, through the prominent keywords such as “students”, “lecturer”, “lecture”, “help”, “tutorial”, etc. However, it is still difficult to determine deeper underlying themes without further context or analysis of the relationships between these terms. Therefore, to gain deeper insights from the student responses, we have applied topic modelling techniques to determine thematic trends as well as to group similar responses under the relevant topic.
Model 1. Latent Dirichlet Allocation (LDA)
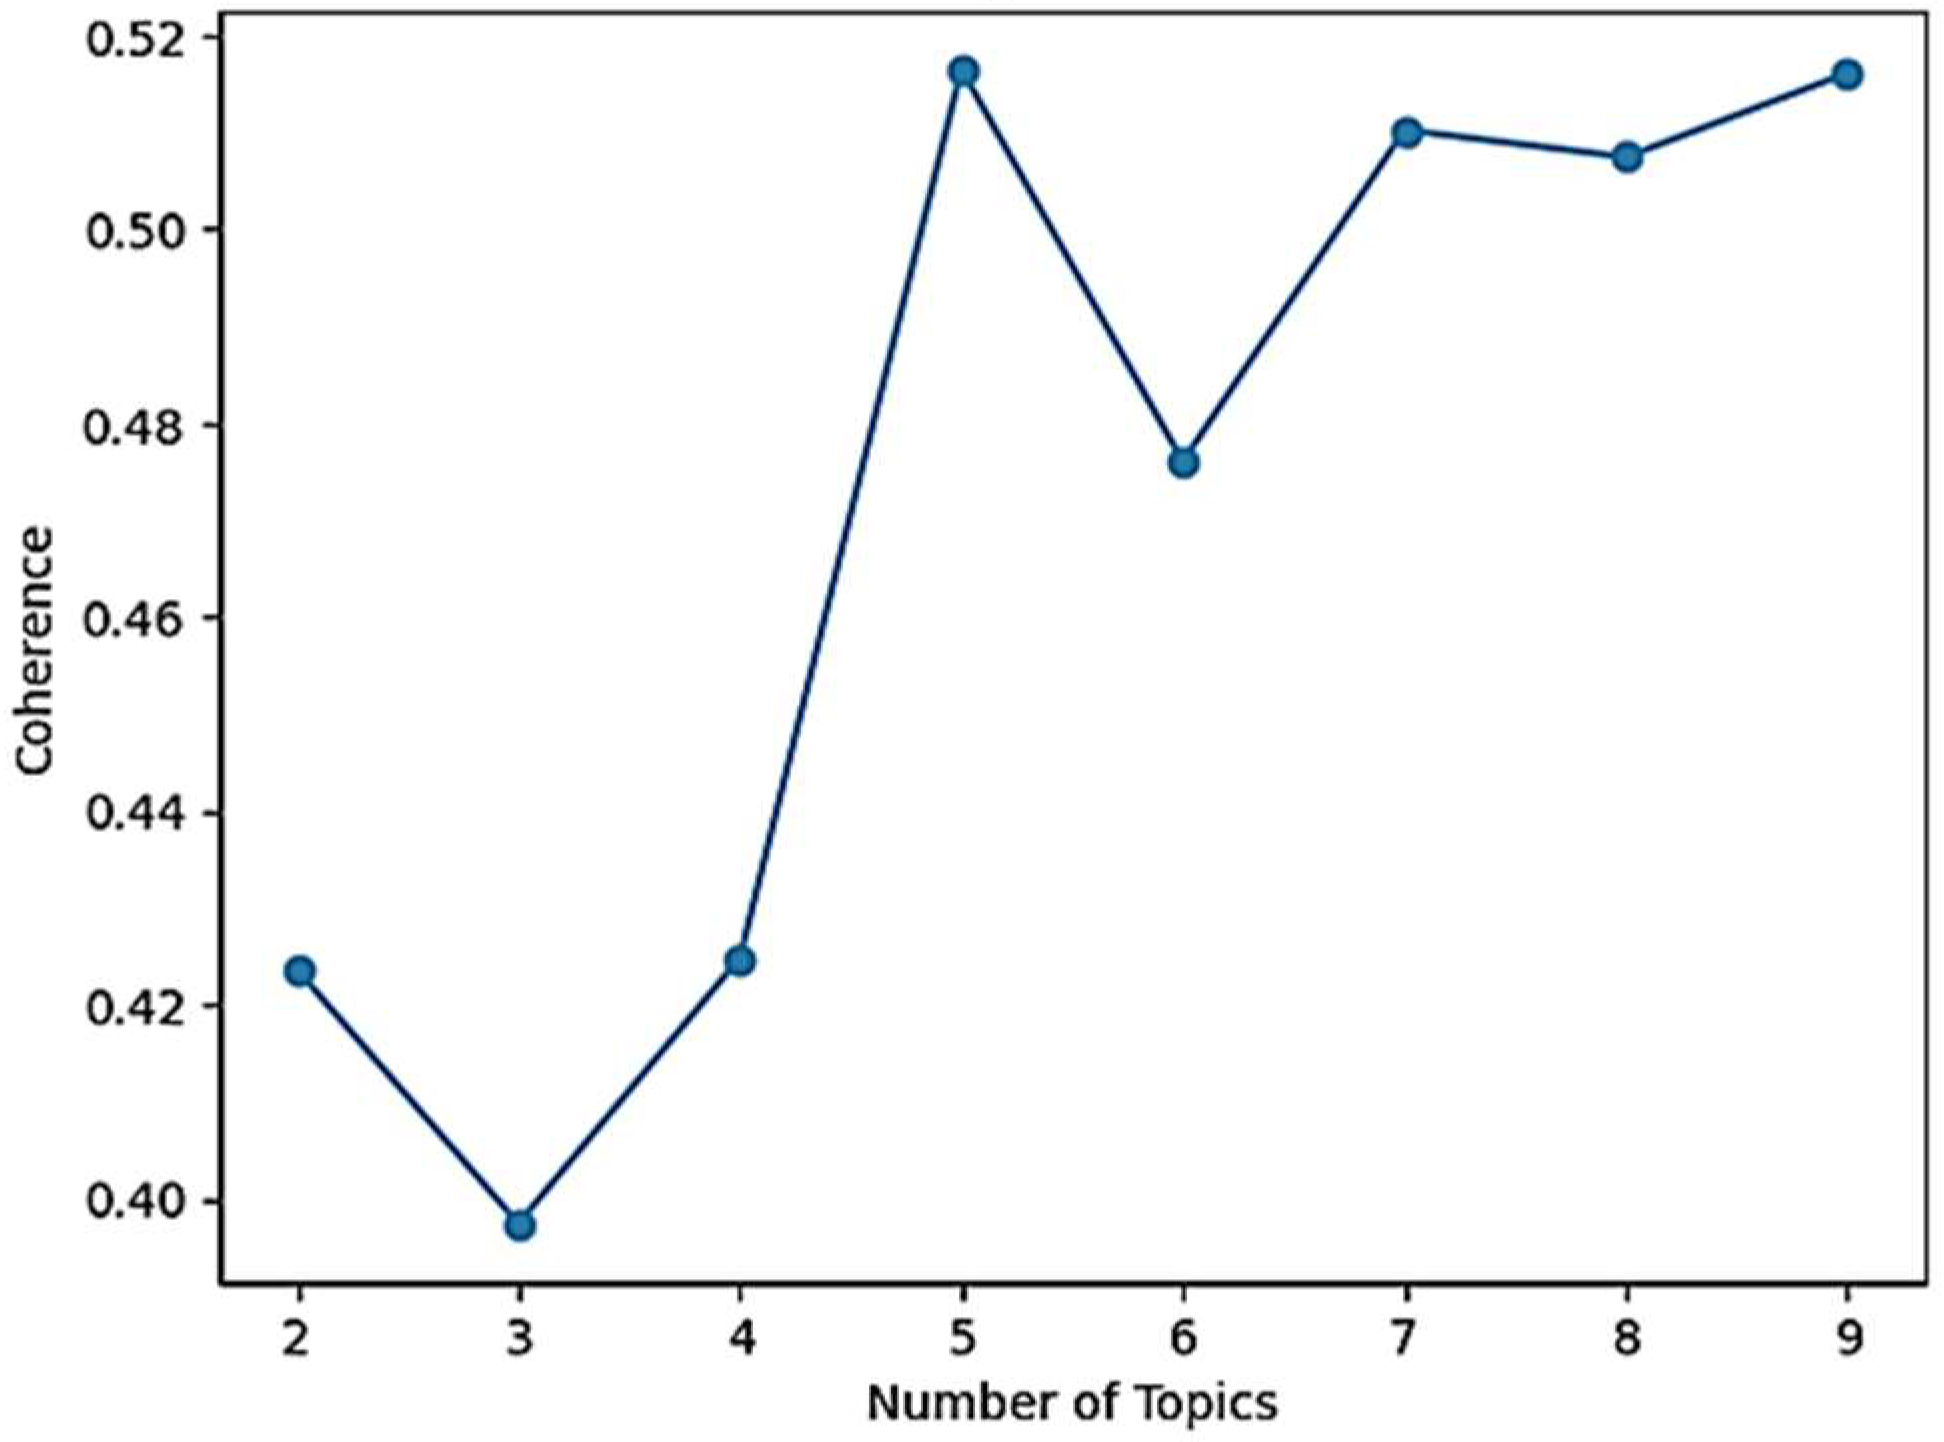
In our experiments, we implemented the LDA model using the genism https://pypi.org/project/gensim/ Python package. To determine the optimal parameters, including the number of topics (K), alpha (topic diversity), and beta (number of words per topic), we varied one parameter at a time while keeping the others fixed. The optimal number of topics was determined by calculating the coherence score and selecting the K with the highest score, as shown in Figure 3.
The coherence score, which measures the quality of the extracted topics, is calculated for 9 topics. To enhance the interpretation of the extracted topics from the fitted LDA model, pyLDAvis https://pypi.org/project/pyLDAvis/ was used to generate an inter-topic distance map. To determine the optimal number of topics, coherence scores were utilised, and the two models with the highest scores were selected for lemmatised answers.
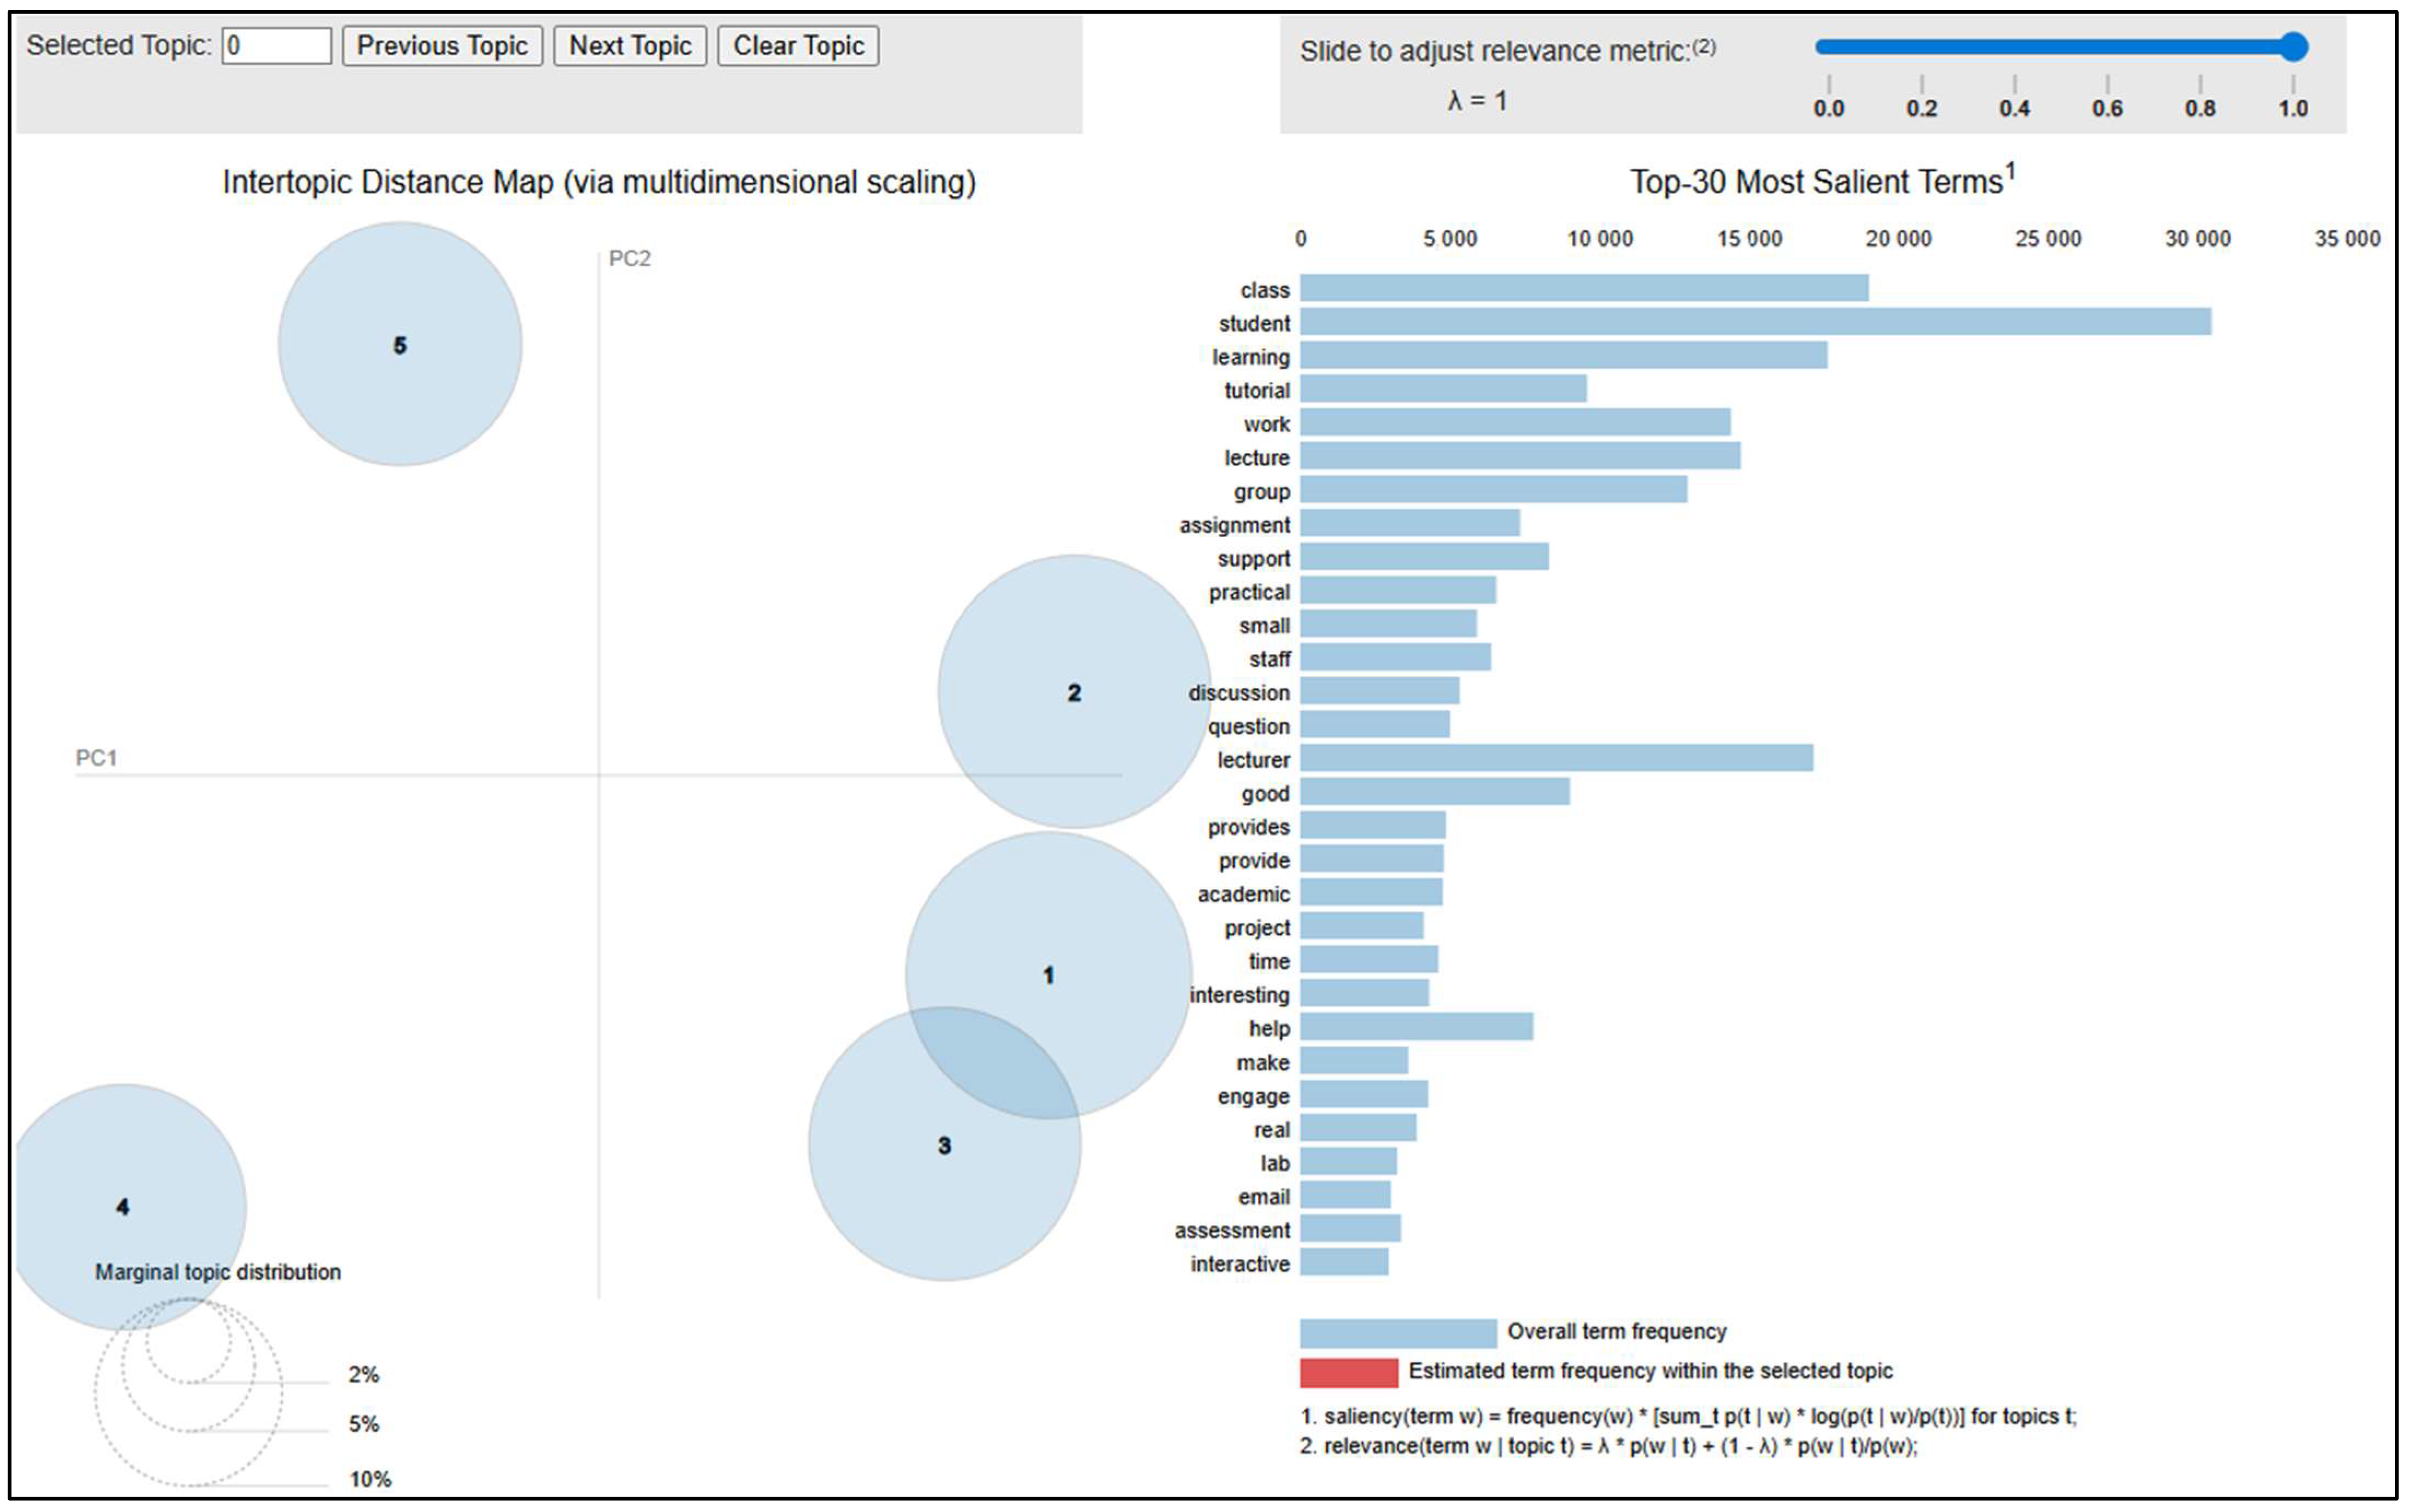
Consequently, 5 and 9 topics were used to extract topics using the LDA model. After evaluating the results of both models, the 5-topic model was identified as the optimal choice due to its ability to generate clearly distinct topics. The results of this model can be seen in Figure 4. In the plot, the left panel displays the intertopic distance map for the five identified topics. Each topic is represented by a circle, and the size of the circle reflects the distribution of topics by the number of associated documents, i.e., student responses in the dataset. It is noteworthy that Topics 1, 2, and 3 are positioned closely, while Topics 1 and 3 show an overlap, indicating the shared vocabulary between these topics. In contrast, Topics 4 and 5 are located far apart, signifying the distinct themes. The right panel of the plot displays the top 30 most frequent words in the corpus. If a topic is selected on the plot, it highlights the key terms in red defining the overall topic theme. Table 4 presents the top five extracted keywords for each topic, reflecting underlying themes in the documents, while the complete list of 20 keywords per topic is available in Appendix A (Table A1). A detailed analysis of the results is provided in Section 5.1.
Model 2. Bi-Term Topic Model (BTM)
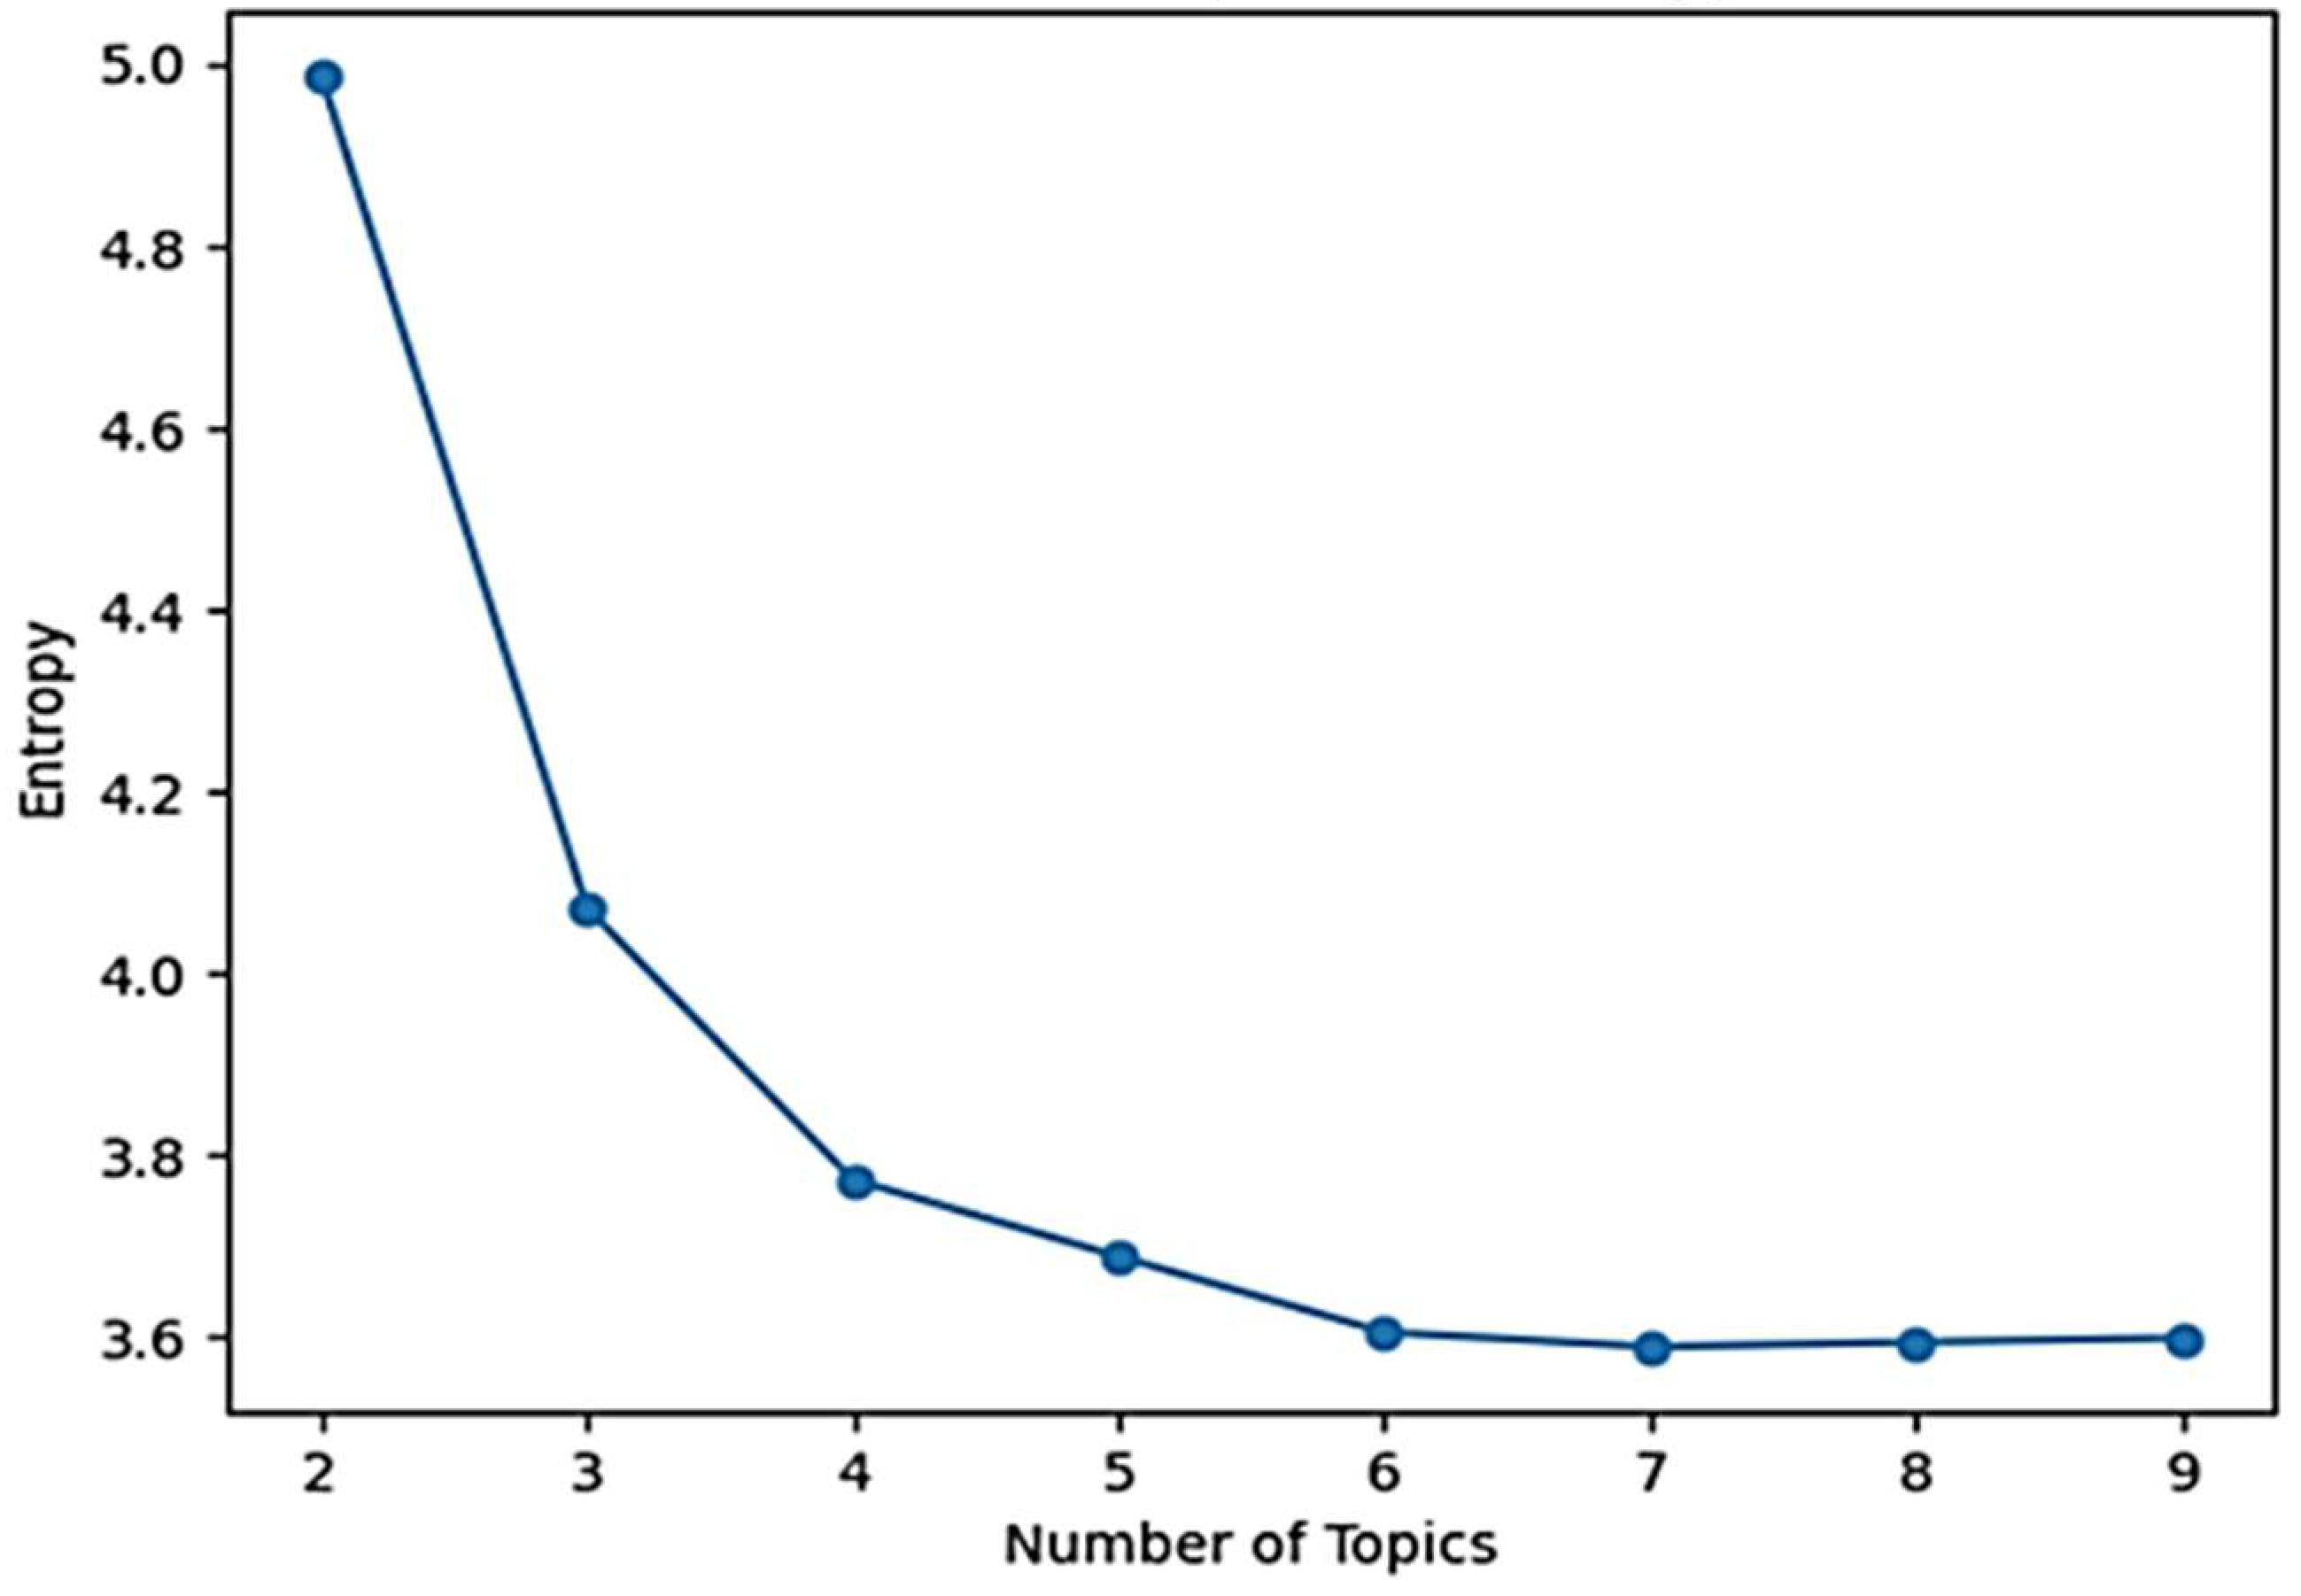
Similar to the LDA model, the BTM also requires specifying the number of topics before training. However, unlike LDA, the optimal number of topics for BTM is determined using the Rényi entropy measure [39]. The number of topics with the lowest entropy value is considered the optimal choice for BTM. Figure 5 illustrates significant variations in entropy, highlighting the optimal topics, i.e., 7 and 8 topics, with the lowest entropy value. Based on further experimental results, between these two numbers of topics, the optimal BTM model was identified as having eight topics.
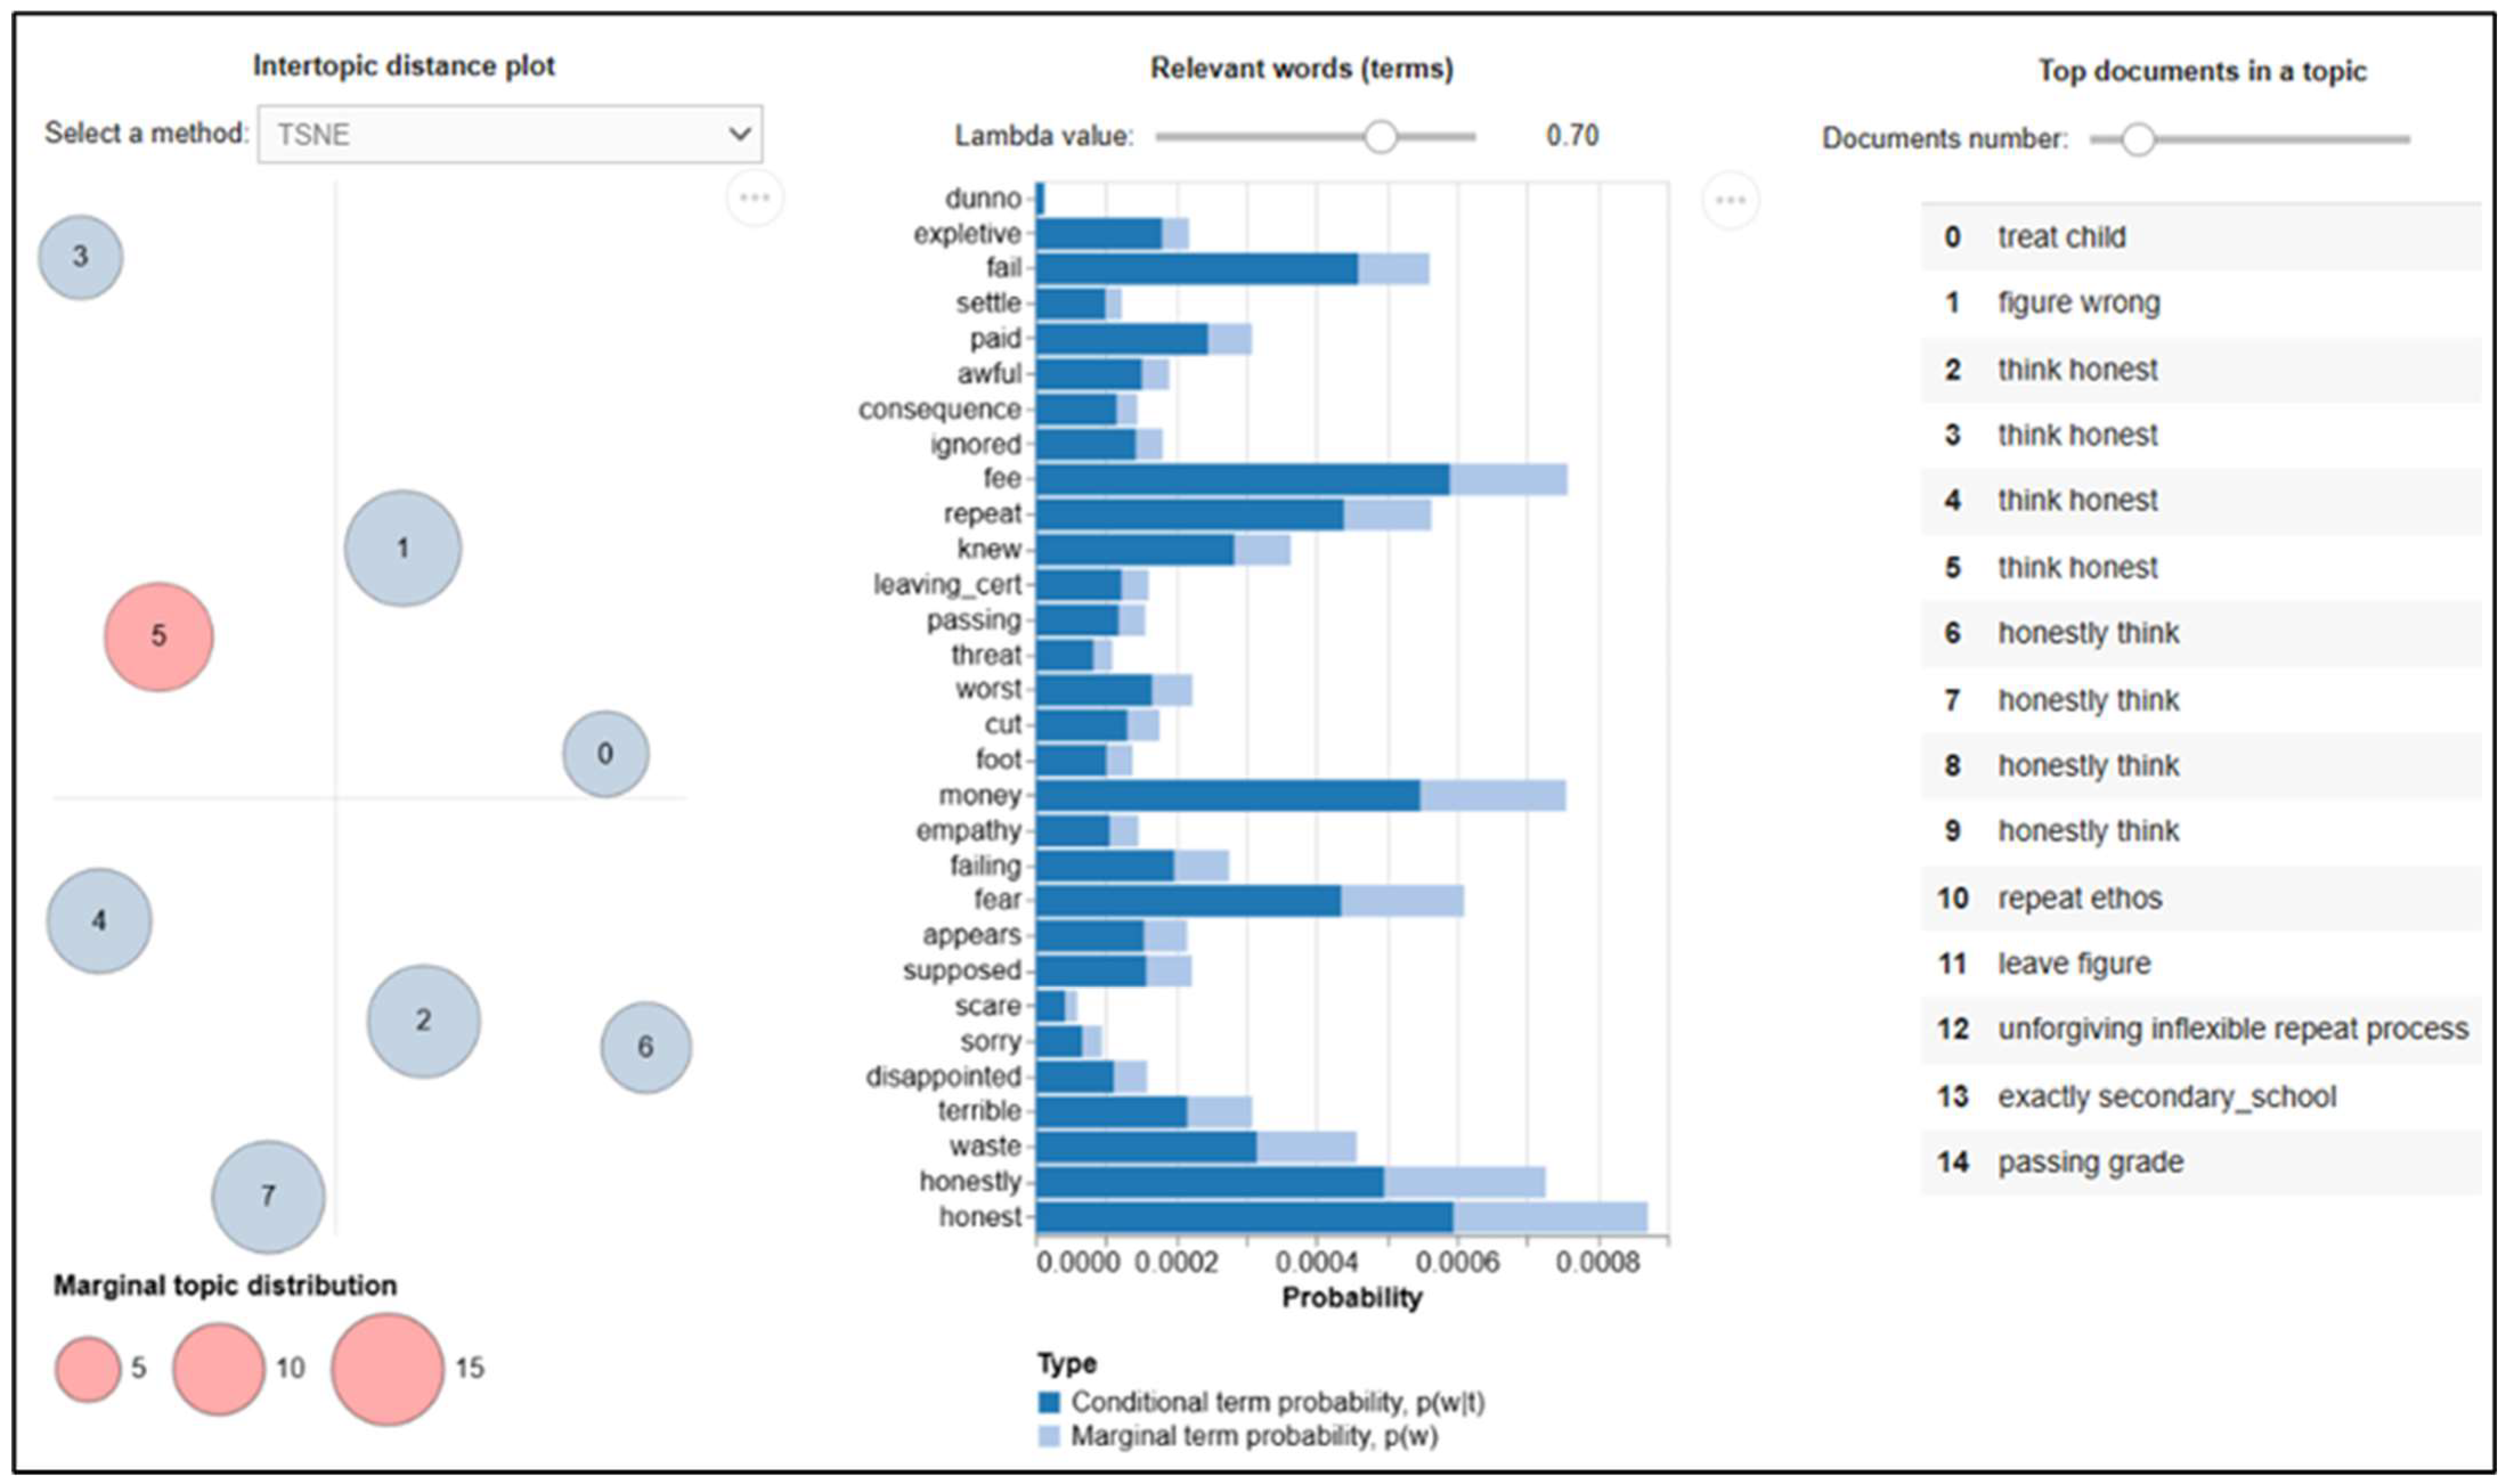
The optimal BTM model was deployed with the lemmatised student answers using the bitermplus https://pypi.org/project/bitermplus/ Python package and the extracted topics were visualised using the tmplot https://pypi.org/project/tmplot/ package in Python. The model was trained with eight topics, while keeping all other parameters at their default settings. Figure 6 presents the achieved results, where the left-hand side displays the intertopic distance map, the center shows the top 30 salient keywords for each topic, and right-hand side presents the top 15 documents associated with a selected topic. The relevance metric is used to identify and rank the most relevant keywords within each topic. To enhance interpretability, different relevance values were analysed, and 0.7 was selected as the optimal relevance value for extracting more meaningful top 5 keywords presented in Table 5. A detailed table of top 20 keywords extracted by the BTM model is presented in Appendix A (Table A2).
Model 3. BERTopic
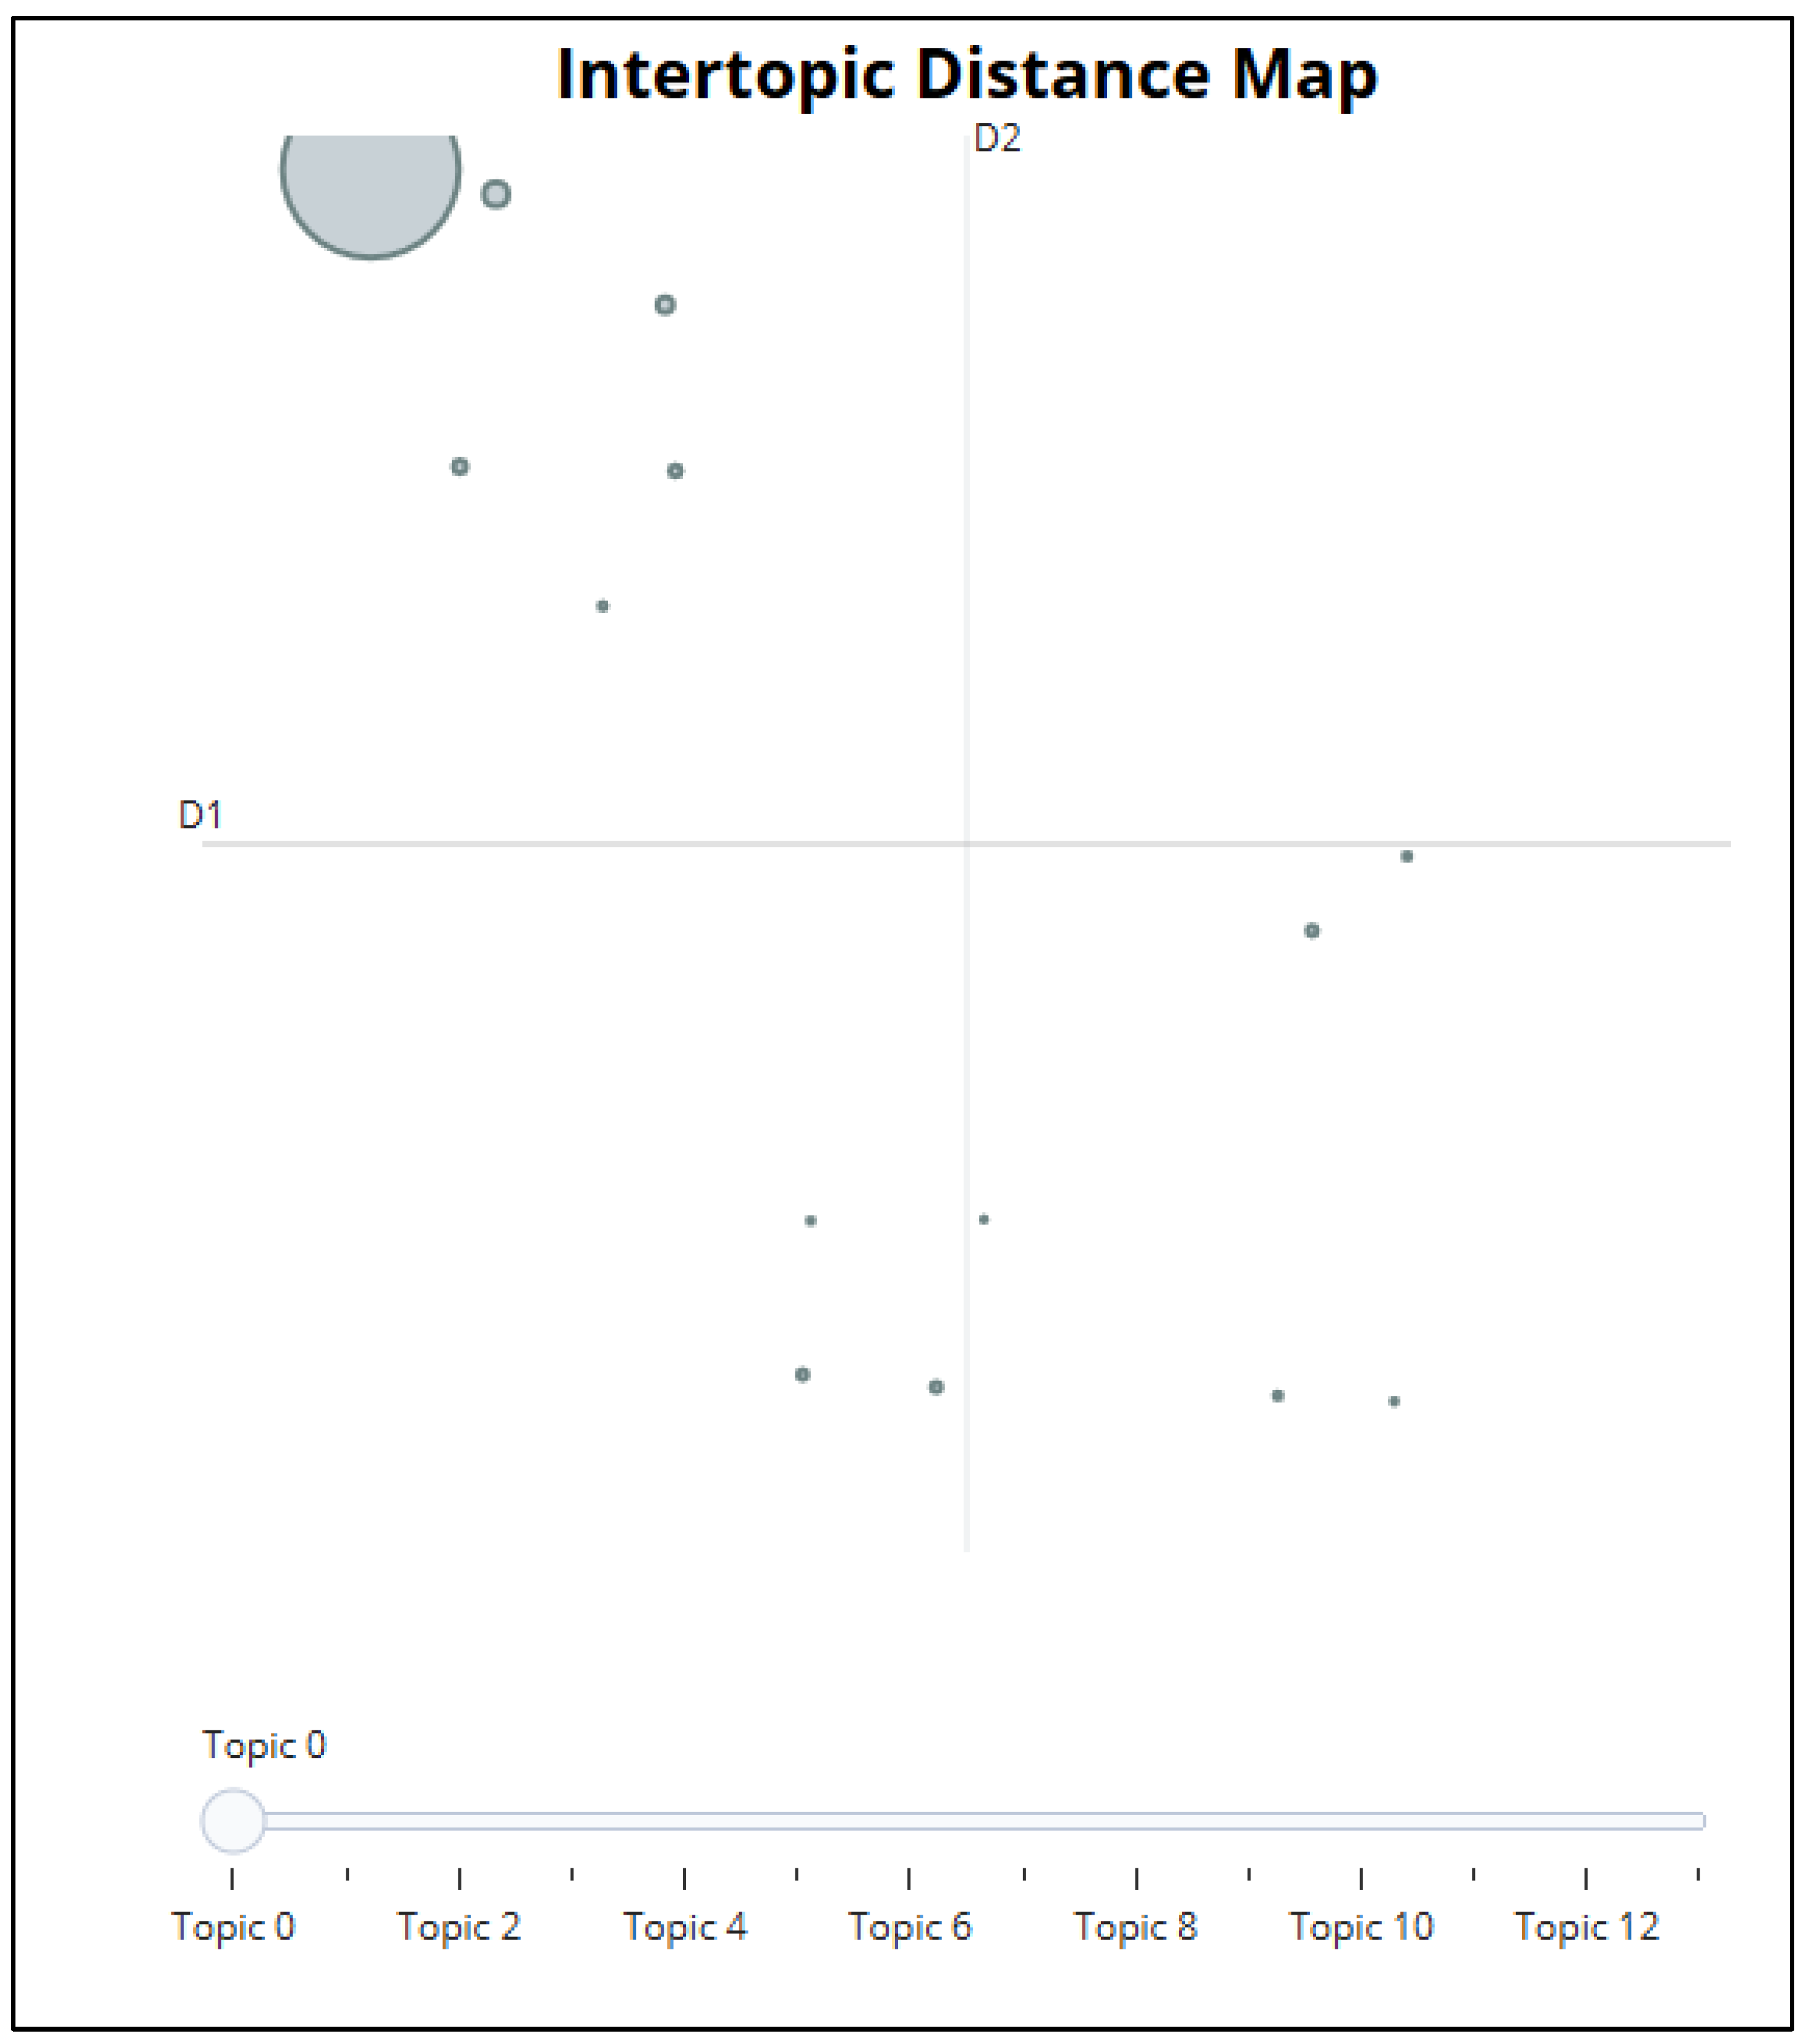
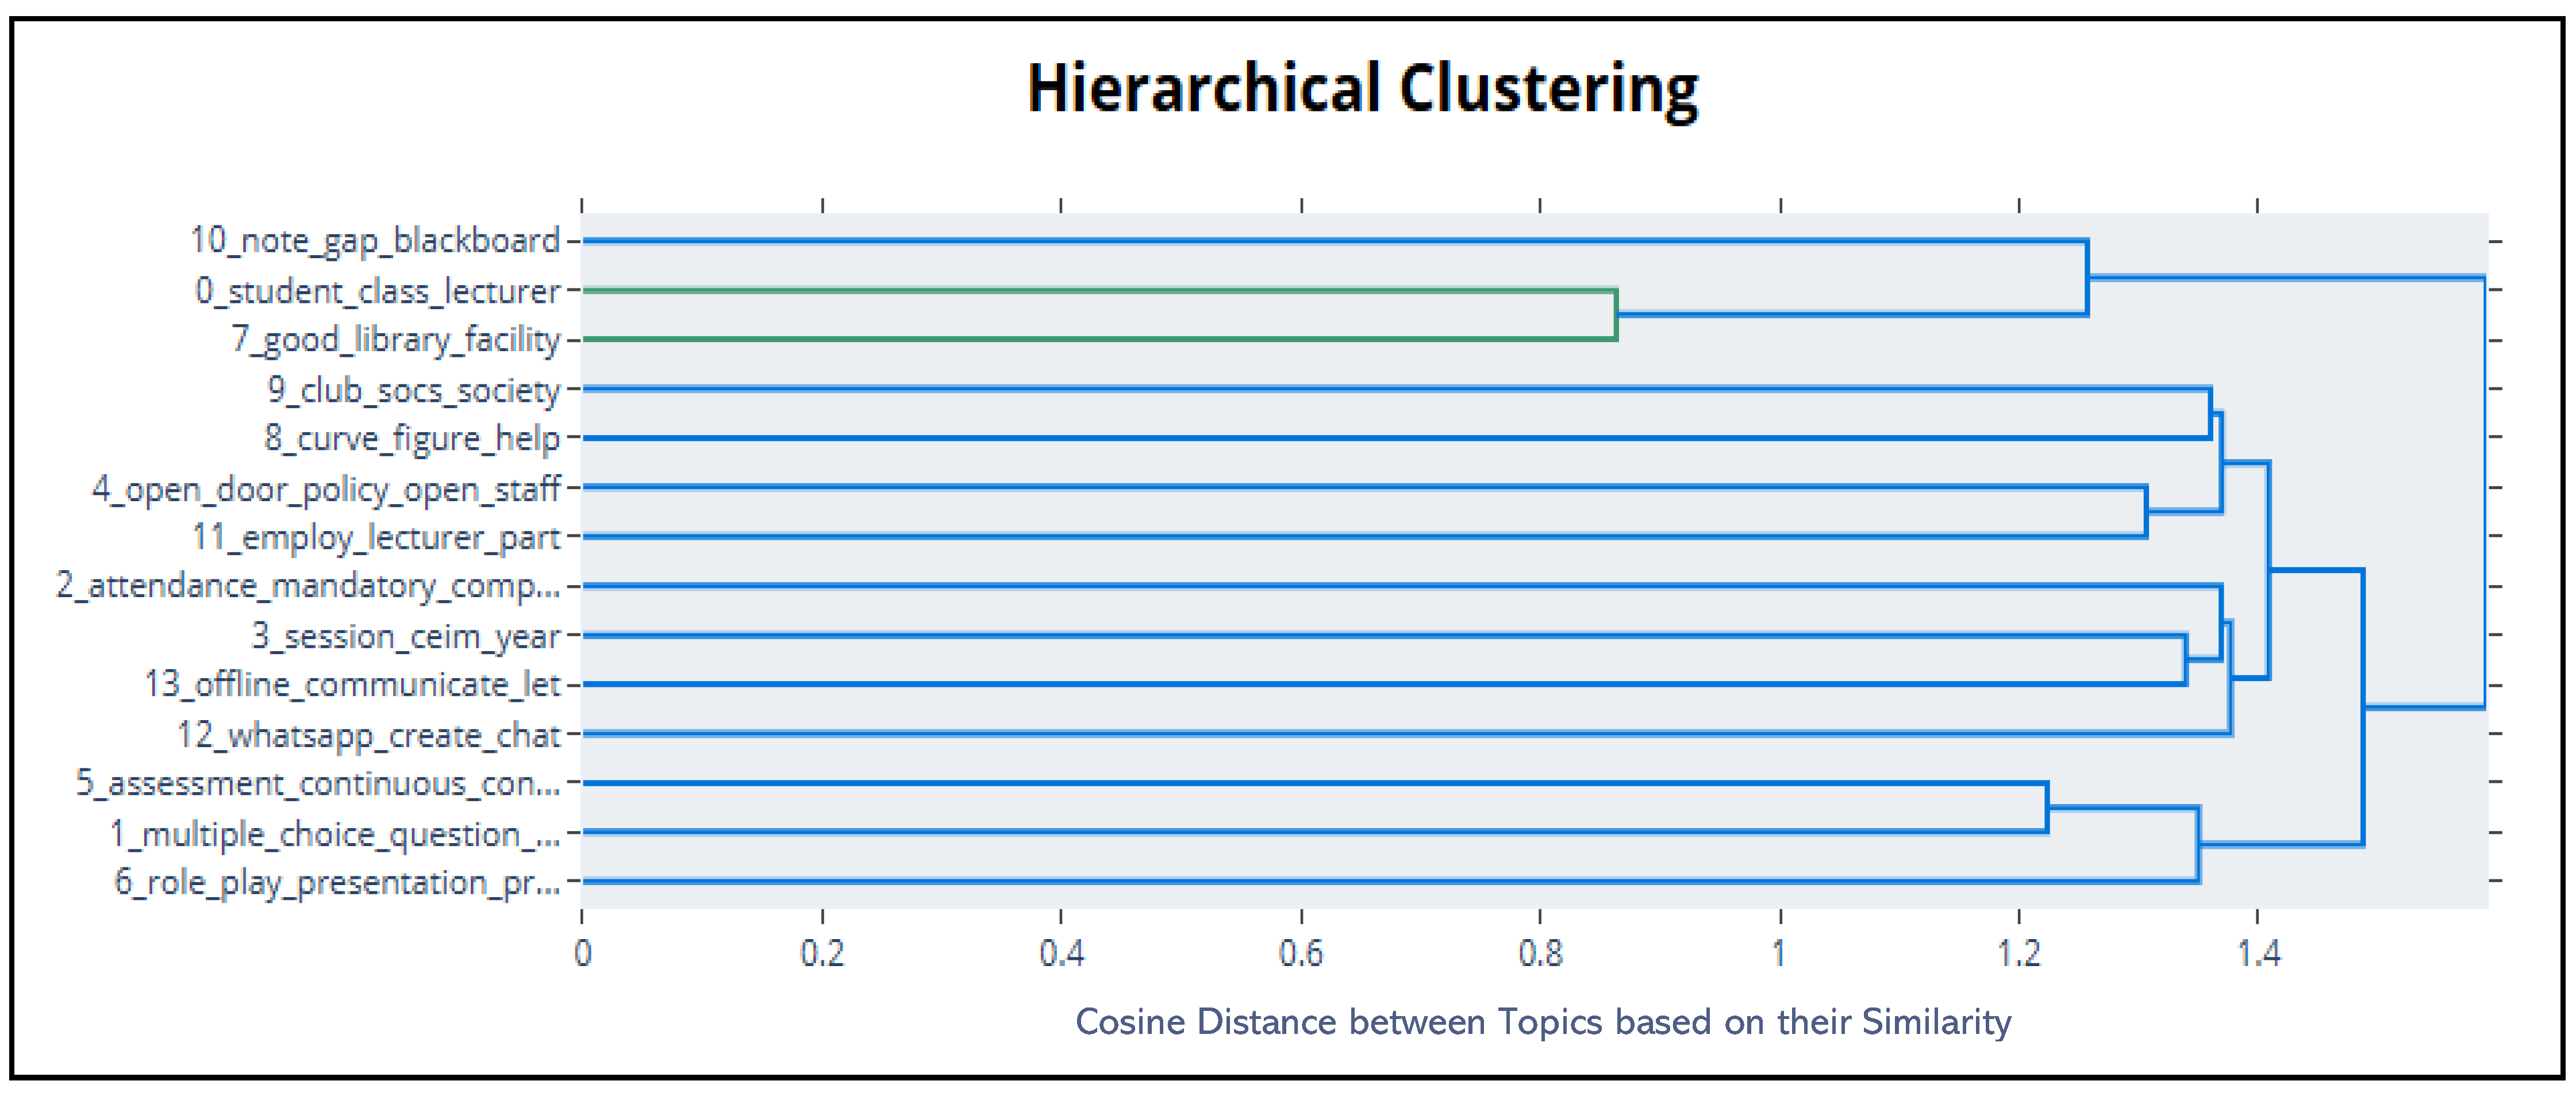
The third model used in our study, BERTopic, utilises BERT embeddings and a class-based TF-IDF approach, creating clusters of recursive topics that are easy to interpret, while retaining important words. The experiment is performed using the BERTopic https://pypi.org/project/bertopic/ (accessed on 3 April 2023) Python library, which uses a sentence transformer model to generate document embeddings. In order to reduce the dimensionality of the vectors represented by the transformed documents, a standard order reduction algorithm is used. Considering the importance of preserving the textual structure at both a global and local level, UMAP https://pair-code.github.io/understanding-umap/ (accessed on 3 April 2023) [9] has been chosen as being most suitable algorithm for the task at hand due to the ease with which the default parameter settings can be selected and tuned; however, it is clear that other dimensionality reduction algorithms may also be applied. Next, a cluster of embedded documents is generated using the HDBSCAN https://maartengr.github.io/BERTopic/getting_started/clustering/clustering.html (accessed on 3 April 2023) algorithm, which determines the number of clusters without requiring manual configuration. Thus, documents are prevented from being grouped into unrelated clusters. The final step involves determining the topic representations using a class-based TF-IDF (c-TF-IDF) https://maartengr.github.io/BERTopic/api/ctfidf.html (accessed on 3 April 2023). Each topic is characterised by the most salient terms, identified by their highest c-TF-IDF scores. To prepare our data for the pre-trained model, we applied stopword removal and cleaned the text by eliminating irrelevant words that do not contribute to the overall meaning. Like other models, BERTopic requires specifying the number of topics. In contrast to the other two models, BERTopic has no evaluation metric to determine the optimal number of topics [31]. However, a coherence score can be computed individually for each BERTopic model fitted with varying number of topics. To identify the optimal topic model, we explored various topic counts, including an “auto” setting where the model determined the number of topics. Additional topic counts of 10, 15, 20, and 30 were also evaluated. A model configured to generate 15 topics was ultimately selected as superior due to its capacity to produce clearly distinguishable topics. The results from this chosen model are presented in Table 6. The first topic (Topic −1) represents outliers, comprising documents that do not fall within any of the identified topic clusters. Due to its minimal size, this outlier topic was excluded from further analysis. Moreover, the keywords within Topics 12 and 13 revealed a significant overlap. Consequently, these two topics were merged to provide a more cohesive and insightful analysis. The inter-topic distance map shown in Figure 7 illustrates the semantic similarity scores determined between identified topics. Additionally, to further analyse the relationships between topics, Figure 8 provides a hierarchical clustering visualisation. This aids in identifying closely related topics, which could potentially be merged to reduce redundancy and enhance the interpretability of topics.
Figure 8 illustrates the hierarchical clustering of topics generated by the BERTopic model, based on cosine distance between their embeddings. The y-axis lists the topics identified by the model, showing both the topic number and representative keywords, while the x-axis represents cosine distance, which indicates the degree of relatedness between topics. Topics that merge toward the left side of the dendrogram have lower distance values and are therefore more semantically similar, whereas those merging toward the right are more distinct. For instance, Topic 0 and Topic 7 merge at a cosine distance of approximately 0.9, reflecting moderate similarity, while other topics remain separate until higher distance values, highlighting their dissimilarity. This hierarchical arrangement helps to systematically organize individual topics into broader themes.

4.3.2. Name Entity Recognition (NER) Analysis

In our study, we employed NER primarily to extract unique entities from student responses not identified through topic modelling. This approach specifically focuses on applying NER to responses within the best_aspects category, intending to identify and extract distinct entities in the text to enable deeper analysis and generate further insights. For the NER experiments, we employed a pre-trained NER model from SpaCy and a custom NER model to extract various entities, including persons, organisations, events, and other important entities relevant to academics.
The pre-trained SpaCy model did not perform well in extracting the entities relevant to the defined categories. Therefore, we implemented a custom NER model, which showed improved performance in identifying relevant entities. For this purpose, a subset of 3000 random rows was selected from the original dataset for training, and 1000 random rows for testing. However, to identify the optimal training set size for best performance, we experimented with three different volumes for training, resulting in training of three NER models. Their performance was evaluated using precision, recall, and F-score metrics, as presented in Table 7. The “best_aspects” column from both training and testing subsets was saved as text files and annotated using the NER Text Annotator. Custom entity tags were created within the SpaCy Text Annotator, including “ORG” (organisations), “UNI_PERSON” (e.g., teachers, tutors), “ACTIVITY” (e.g., academic talks, workshops), “LEARNING_RESOURCES” (e.g., notes), “SUPPORT&FACILITY” (e.g, library, student help desk), and “ONLINE_TOOLS” (e.g., Zoom, Sulis). These tags facilitated precise annotation and extraction of relevant entities from the responses.
Unsurprisingly, as shown in Table 7, NER model performance improves with an increase in the size of the training dataset, but the modest improvement when moving from 1000 to 3000 samples is also noteworthy. Notwithstanding this observation, a training dataset of 3000 samples was selected for experimentation. After manual annotation, a distribution analysis of entities in each category was conducted (presented in Table 8) on both the training and testing datasets to better understand the frequency and representation of each entity type. A detailed analysis of the results is presented in Section 5.

4.4. Experiments for Q2: “What Could Your Institution Do to Improve Students’ Engagement in Learning?”

The main purpose of this question is to gather students’ perspectives on how educational institutions can better support motivation, engagement and interest in learning. It further helps to uncover actionable suggestions to enhance the teaching and learning experience. Therefore, there is great utility in assessing the impact of automated tools in the analysis of student responses that provide insights on such questions. The following techniques were employed to analyse student responses to the question “improve_how”.

N-Gram Analysis

As mentioned earlier, n-gram analysis may reveal the relationship between words; it is helpful for frequency visualisation to examine the relationship between words in student responses. In this study, we examined unigrams, bigrams and trigrams from preprocessed student responses. To determine the frequencies of the n-grams, the “CountVectorizer” tool is used from the “scikit-learn” Python library. During exploratory data analysis, it was observed that student responses included different collocations. Therefore, it is important to concatenate these phrases to ensure consistency and avoid discrepancies in the model’s performance. During pre-processing and preparing the data for further analysis, we applied N-gram analysis, the workflow is presented in Figure 9 below.
We further filtered and identified bigrams and trigrams using common n-gram patterns like “noun/adjective + noun” and “noun/adjective + any + noun/adjective”. PMI thresholds were optimised through experimentation, with cut-offs set at 4 for bigrams and 4.5 for trigrams. After generating n-gram lists from lemmatised responses, irrelevant entries (e.g., “tu Dublin”,” expletive removed”) were removed. Examples of bigrams and trigrams are presented in Table 9. Finally, n-grams were concatenated with underscores to improve recognition and analysis.
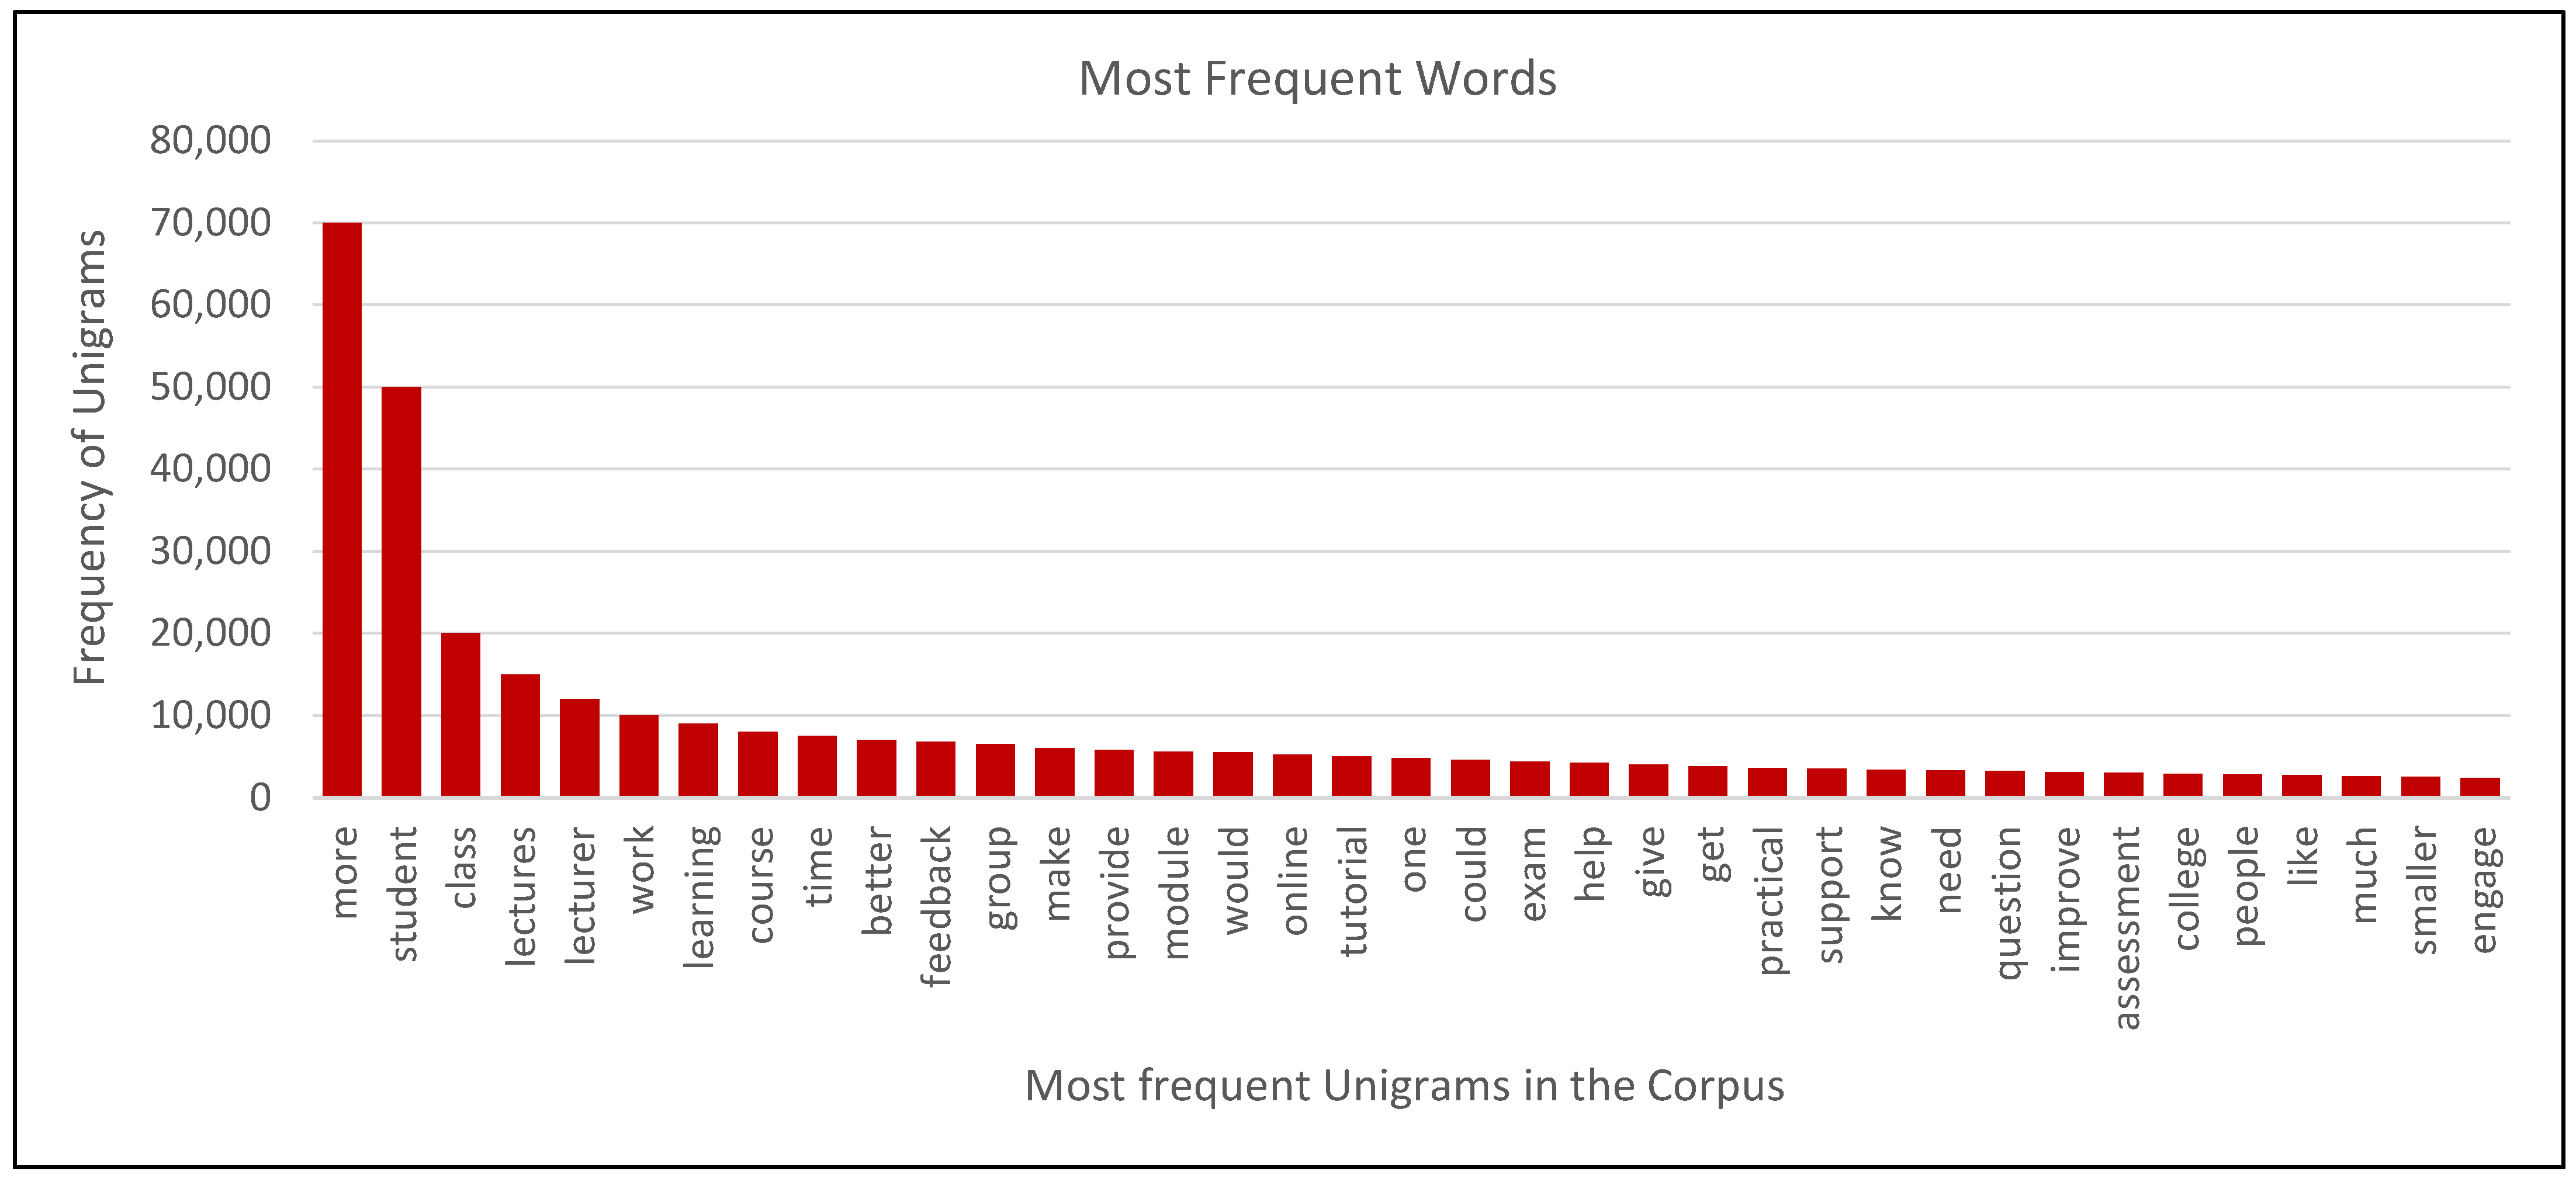
Unigram analysis helped to identify the most frequent words in the corpus, as presented in Figure 10. The plot displays words sorted in order of frequency. The figure shows that many comparative indicators, such as “better”, “more”, “smaller”, along with quantifiers like “much” and “more”, are successfully identified. Additionally, other action-related indicators like give, need and provide are also identified. While unigram analysis offers a useful overview of the frequent terms, these indicators alone lack contextual meaning and provide little information. This highlights the importance of analysing them in conjunction with their associated words to accurately interpret the responses through the analysis of bigrams and trigrams.
Since unigrams provide only limited information by representing individual words without context, bigrams and trigrams were subsequently generated to capture more meaningful relationships between words. This approach helps to extract richer features, particularly by expanding on the indicators initially identified through the unigram analysis, allowing for a deeper understanding of the underlying information in the text.
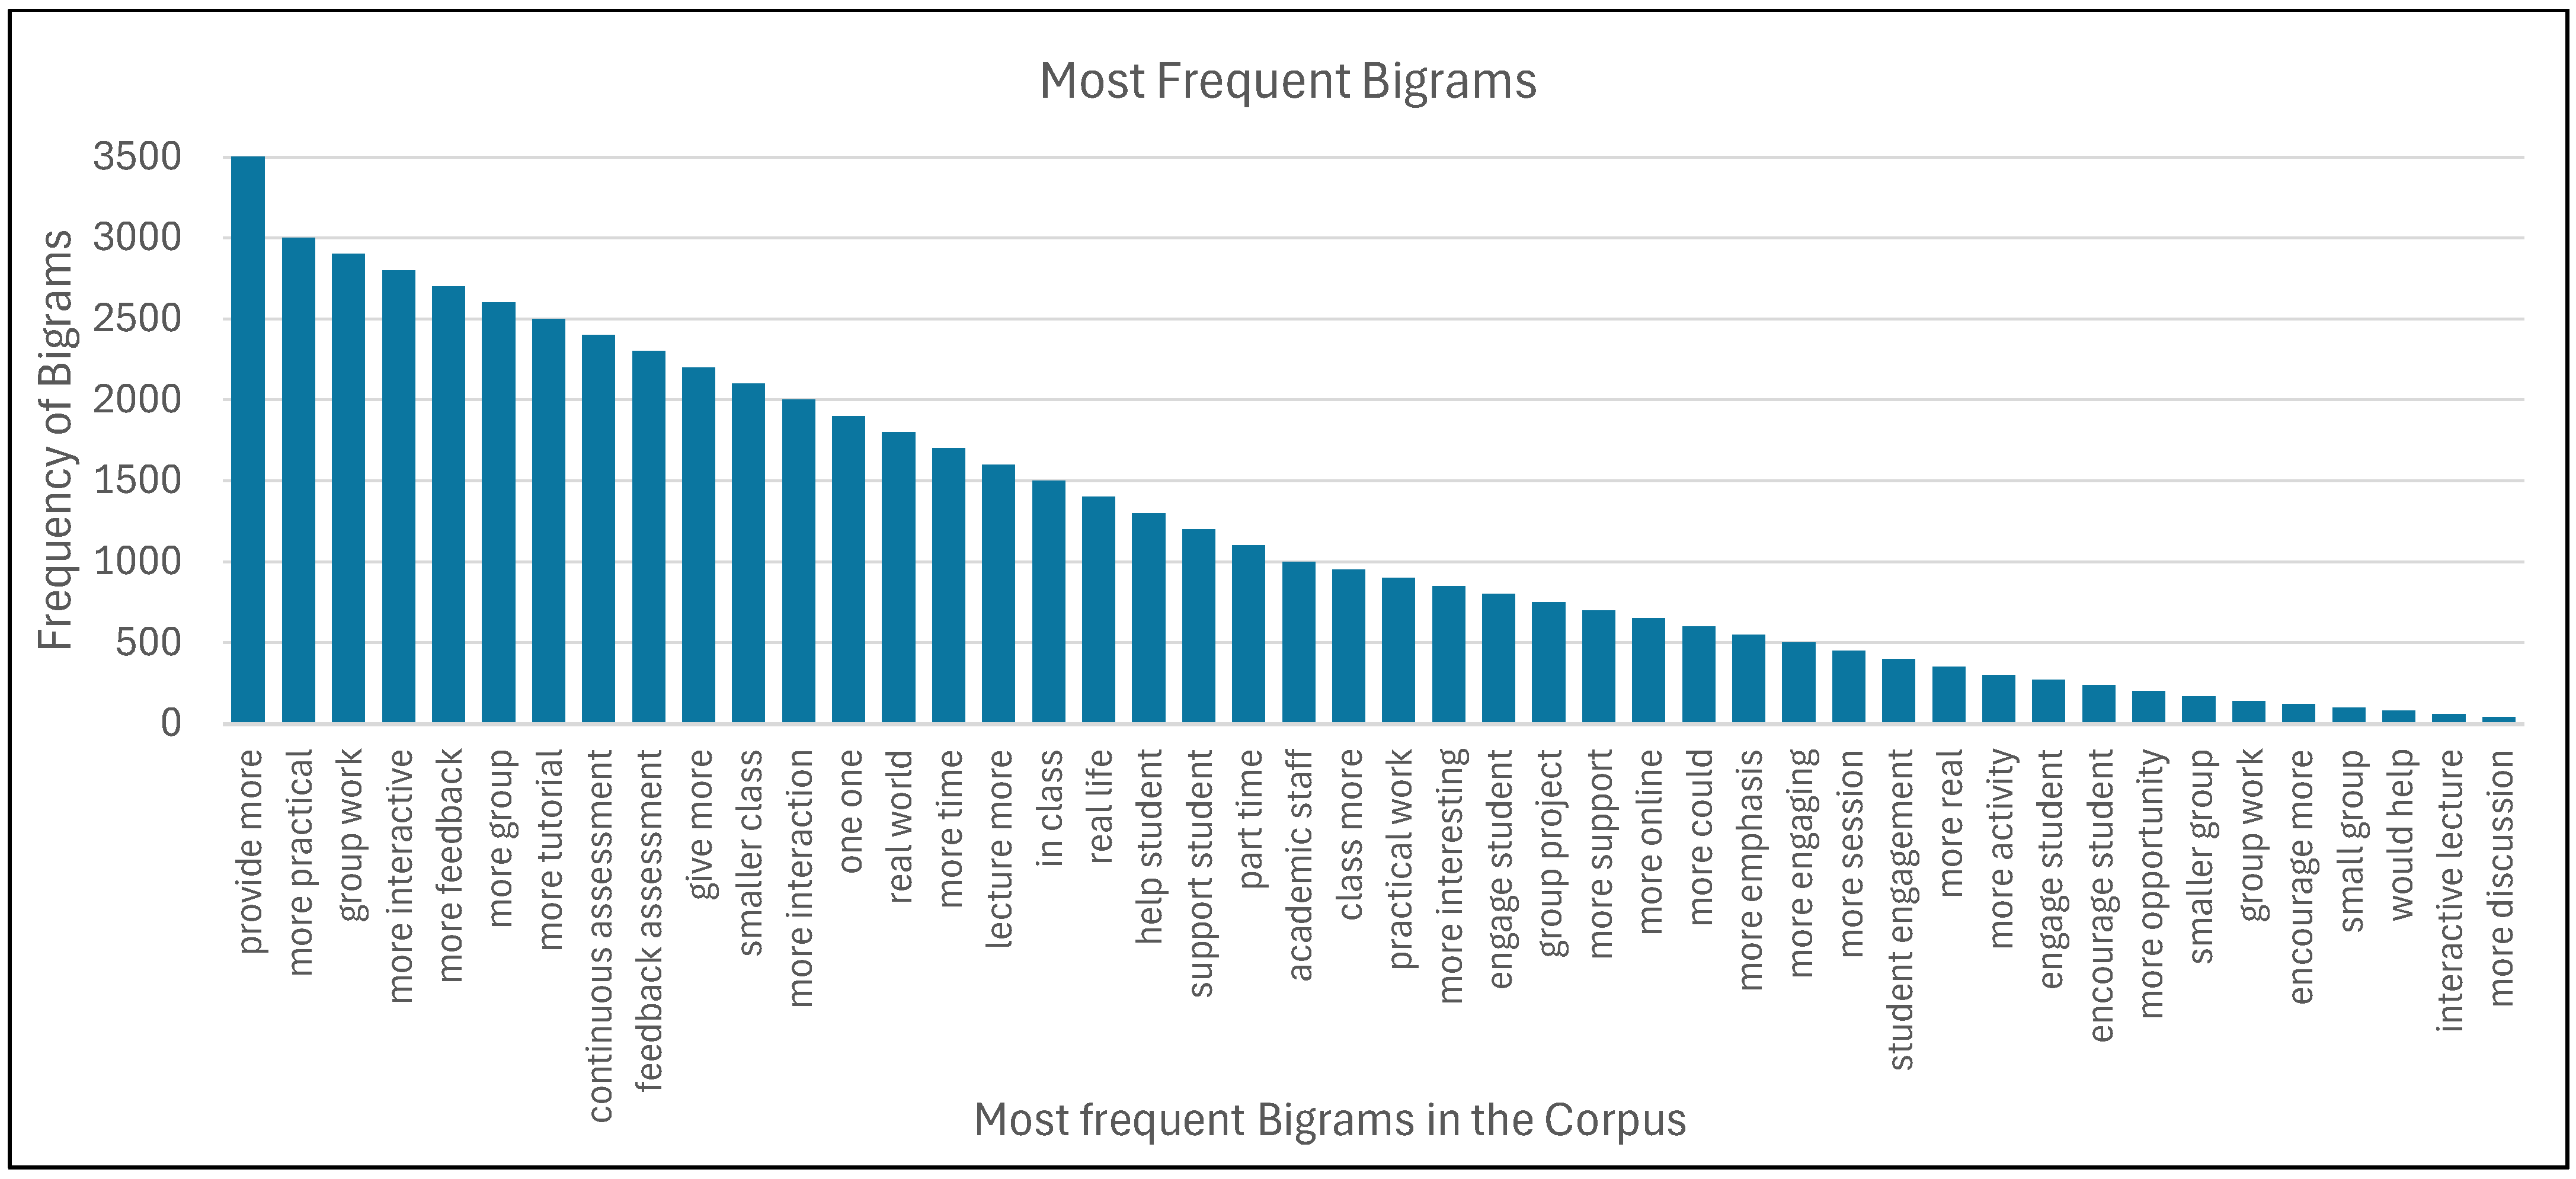
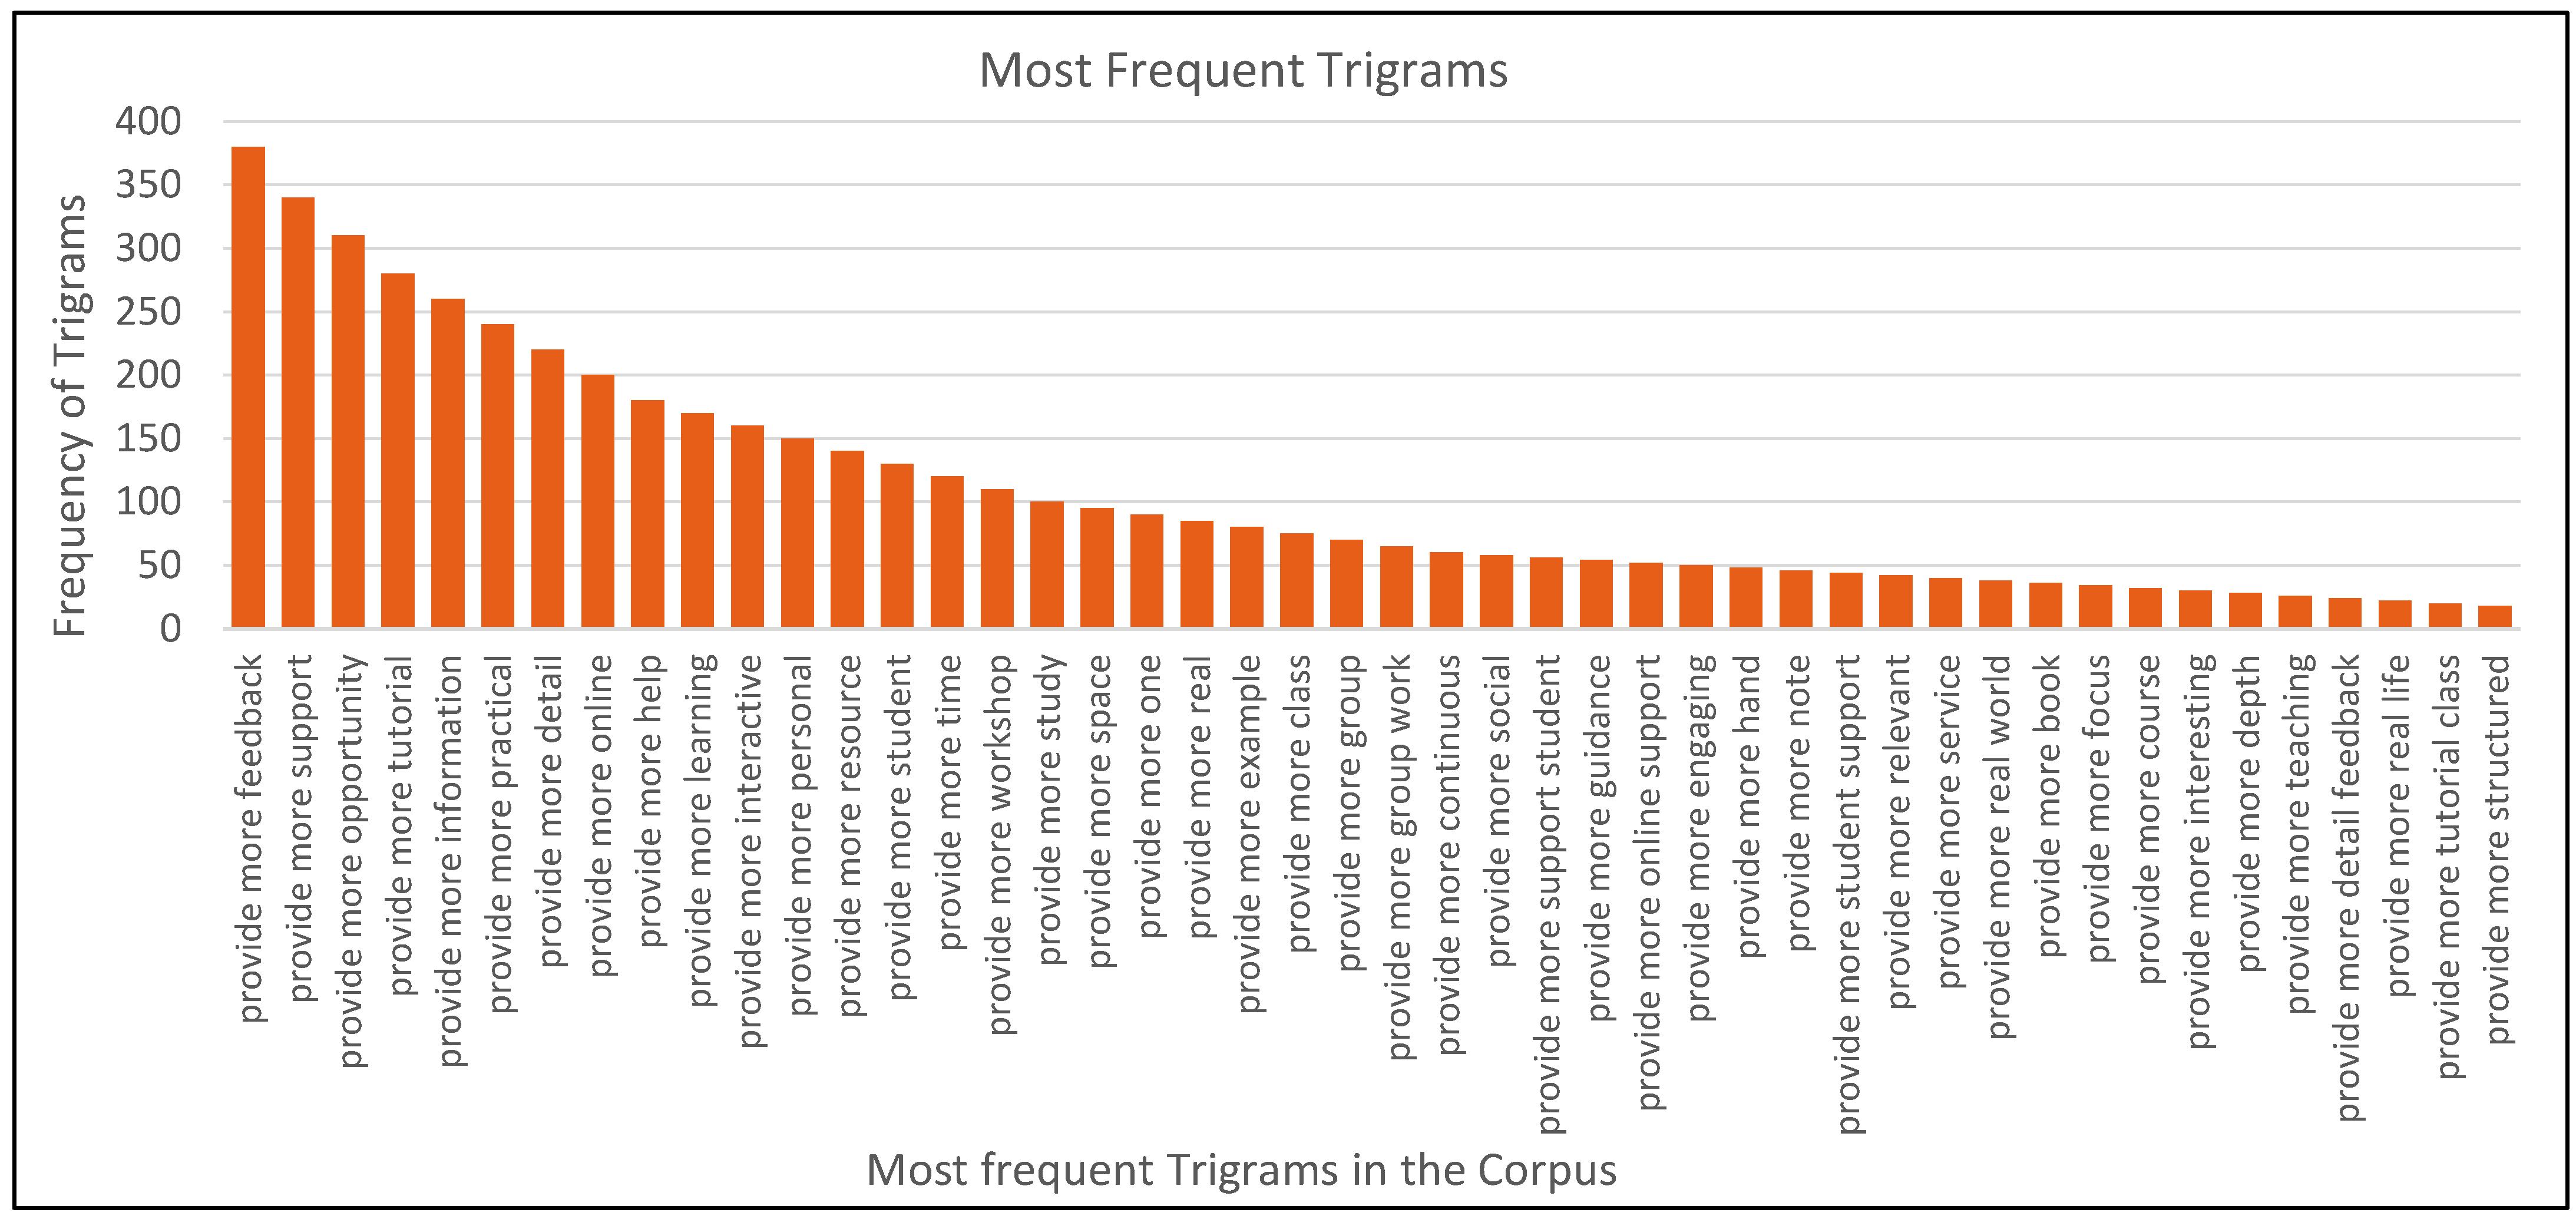
Figure 11 presents the most frequent bigrams in the student responses. Some of the bigrams, such as “more practical”, “more discussion”, “more feedback” highlights the key actionable areas where students have suggested that improvement is necessary. There are some bigrams which require more context to accurately interpret them, such as “group work”, “real world”, “could more”, and “would help”. For example, in the above diagram, the most common phrase is “provide more” appearing with the highest frequency, indicating that students are asking for more of something in their educational experience. Such a result is a typical example of a bigram providing results with low utility. Such a phrase signals that improvement is necessary but lacks clear actionable meaning. Therefore, more context is required to understand it accurately. This is where trigrams are needed to provide better interpretation while reducing the ambiguity and making the extraction of the insights easier. Figure 12 shows the most frequent trigrams in the corpus of student responses.
Figure 12 illustrates that student responses place great emphasis on the value of personalised feedback. The desire of students to receive personalised and individual feedback as constructive input during their academic journey is a core output from the analysis. Clearly, this is an unsurprising result, but the AI tools allow the result to be determined in a fraction of the time taken by humans to analyse the raw data and liberate more time for a deeper dive into the data. Additionally, a strong desire to get academic or non-academic support is also evident. However, some trigrams, such as “provide more class” and “provide more students”, are not easily interpretable and still lack in specificity when it comes to identifying particular student concerns. Alternatively, trigrams with comparative indicators such as “more help”, “more guidance”, and “more workshop” are more informative. Such phrases clearly specify the areas students suggested to improve for their educational experience. A detailed analysis of bigrams versus trigrams based on the comparative indicators is given in the next section.

5. Results and Discussion

This section provides a comprehensive overview of the results obtained from the experiments for both open-ended questions.

5.1. Evaluation of Topic Modelling Techniques

Table 10 provides a comparative overview of the identified topics, along with the top 10 keywords extracted from each model. As outlined in Section 4, the LDA model was configured to identify five topics, the BTM model extracted eight topics, and the BERTopic model generated 12 distinct topics. Each topic was assigned a customised name based on the collective set of associated keywords. It is important to note that some topics were commonly identified by all the models; however, some clear differences between the three models can also be noted in terms of specificity and thematic clarity. An analysis of the responses to the ‘best_aspects’ question shows that students focus primarily on areas related to teaching and learning, the quality of academic staff, as well as the educational and personal supports they receive. To accurately capture these priorities, the extracted topics can be aligned with these themes by incorporating relevant keywords. Such an approach ensures that responses with similar attributes are effectively grouped for clearer insight to be extracted at a later stage and is a key assistant feature of the analysis tools.
A comparative analysis of the extracted topics showed that BERTopic provides a detailed representation of the underlying themes. The extracted topics demonstrate a strong alignment with the key aspects of student learning. They not only capture a broad range of themes but also highlight those that were difficult/time consuming to identify through manual analysis. In contrast, the other two models were less effective at distinguishing keywords within topics. For instance, the topic “student engagement” extracted by the LDA model included unrelated words such as email, feedback, and exam, whereas BERTopic was able to generate distinct topics for these keywords and their related terms. This makes it noteworthy that all the extracted topics generated by BERTopic were supported by highly relatable keywords.
The BTM model captured eight distinct topics, but some key themes, such as academic evaluations, were not highlighted. Meanwhile, the LDA model generated relatively generalised topics for a high-level overview. However, a lack of semantic understanding within the model makes it less effective in uncovering the nuanced topics such as interactive digital education, online communication channels, institutional obligations, and academic evaluations. Overall, BERTopic proved to be a more efficient model for in-depth analysis of the student responses.
From Table 10, it is evident that all three models identify Teaching and Learning as one of the most prevalent topics discussed in student responses across all study groups. Keywords such as “lecturer”, “lecture”, “teaching”, “ learning”, “course”, etc., highlight the importance of teaching quality, course content, and effective learning of the students. Additionally, another highlighted aspect in the student responses is student support and resources, which plays a crucial role in helping them thrive academically and gain confidence ultimately contributing to the enhanced learning experience. Moreover, in-class activities, such as group discussions, alongside extracurricular activities, are also highlighted in the student responses. These activities not only enhance engagement but also develop critical thinking, communication, and teamwork skills by provide opportunities for personal growth and social interaction. These factors contribute to the career readiness by helping students build professional skills, gain practical experience and expand their networks for professional success.
With these experiments, we have not only evaluated model performance but have also successfully extracted the best aspects highlighted by the students regarding their educational experience. This analysis therefore successfully identified the core elements that were appreciated by students. Institutions that score well for teaching quality, educational support, academic and non-academic facilities, competence of academic staff, availability of resources, and overall educational environment are successfully identified using this approach. Further, less obvious characteristics like extracurricular activities are successfully identified as contributing to the overall educational experience. Overall, actionable factors have been successfully identified with a reduction in person hours necessary to manually process the data.

Qualitative Validation of BERTopic Classification

To further validate the BERTopic superiority and robustness, we carried out a small qualitative analysis. For this, we used a small sampled dataset consisting of the random student responses classified by BERTopic using the generated keywords. A sample dataset is provided in Table 11, and a complete set of sample responses along with the experts’ annotations are provided in Appendix A (Table A3). This sample is then forwarded to a human expert with domain knowledge in educational research and qualitative analysis. The expert is then asked to review the keywords demonstrating key topics, for each student response and validate either the generated keywords are suitable for that particular response or highlight the most relevant keyword. Additionally, expert is also asked to suggest broad themes or alternative keywords.
After expert evaluation, it was observed that while BERTopic generated the most frequent keywords in the student responses, the human expert selected only a few keywords considered most relevant to the student response. Additionally, the expert suggested broad themes to align with the intent of the comment. In some cases, where the comments are around “assessments” and “exams”, model and expert’s judgement aligned more closely. Similarly, BERTopic generated most frequently found keywords for the comments related to lectures, subjects, teaching etc., whereas for the same comments, expert refined it to more contextually relevant keyword such as “lecturer”. Furthermore, a disagreement between expert and BERTopic generated keyword can also be observed, where expert only suggested broad themes.
Since the BERTopic model was configured to generate 15 topics, comments are therefore categorised into these topics based on the relevant keywords. For example, in the fourth comment in the table above, the focus is on Canvas, a Virtual Learning Environment (VLE). However, since the dataset also includes discussions about other VLEs such as blackboard, the generated keywords reflect the most frequent terms across the broader category. This explains the reason why some BERTopic generated keywords appear more general compared to the expert-selected and more focused keywords.
After comparing the expert suggested themes with those presented in Table 10 based on the model generated keywords, it is evident that the expert’s suggested themes are comment-focused and related to the specific context of each response, providing more rich contextual insights. However, for a large dataset this approach is challenging as assigning specific theme to every response is time consuming as well as impractical. Therefore, it is important to cluster the responses under broad but more contextual categories. Whereas the interpreted themes in Table 10 are broader, generalised and based on the keywords generated by the model such as “Teaching and Learning”, “Educational Resources”, “Accessible Support”, and “Academic Evaluations”.
Overall, while BERTopic provides a more general overview of the themes, the importance of experts’ judgement cannot be denied to further refine the keywords as well as to extract high-level themes reflecting the nuanced meaning of student responses. Additionally, incorporating expert judgment into the student survey analysis pipeline provides several advantages to improve quality, consistency and applicability of the employed models. The review of models generated keywords by human experts can ensure that they accurately captured the nuances and actual intents of the comments, that will ultimately help to refine the process to interpret the meaningful themes. Figure 13 gives a human-in-the-loop incorporated pipeline for student survey analysis.
These expert insights further optimise the process of more comment-focused and contextually related theme generation, making the whole analysis process more effective and creating a scalable and reliable workflow.

5.2. Evaluation of Name Entity Recognition

In the second experiment on the “best_aspects” data, we experimented with the Named Entity Recognition (NER) models. As discussed in Section 4, our custom NER model demonstrated superior performance compared to the pretrained SpaCy model. Table 12 presents a summary of the performance metrics for each entity type extracted by the model.
An analysis of the custom NER model reveals that while it performs reasonably well overall, relatively low performance of NER model in terms of Precision, Recall and F1 score for certain entities can be attributed to a few factors. One possible reason could be the imbalanced entity representation in the training data. To train the custom NER model, we used a small number of random responses as a training set from our original dataset, where some entities did not frequently appear, making it difficult for the model to learn those rare entities efficiently, as shown previously in Table 8, Section 4.3.2.
Using the custom NER, entities for each category were extracted based on the cohort, i.e., First year Undergraduate students (Y1), Final Year Undergraduate students (Y4) and Postgraduate students (PGT). A list of the top 15 extracted entities is provided in Table 13 for each category.
While comparing the extracted entities across first year, final year undergraduate and postgraduate study groups, a clear difference between the focused aspects has been observed. Y1 students place greater emphasis on basic learning tools and easy access to academic and non-academic staff to receive immediate support during their early learning stages and academic adjustment. They also focus more on general academic activities and available learning resources, reflecting their need for early-stage settlement, familiarization, and their limited academic exposure. In contrast, Y4 students demonstrate a more mature focus on collaborative platforms and professional development opportunities, indicating preparation for careers and advanced academic work. PGT students prioritize advanced tools, specialized experts, professional organizations, and activities linked to professional development, suggesting a strong emphasis on research, industry relevance, skill advancement, and long-term career goals.
Overall, a number of notable insights were gained by examining the extracted entities within each predefined category. Students emphasising the critical role of online LMS tools such as Blackboard, Brightspace, Kahoot, and Panopto in promoting engagement through centralised learning, collaboration, and interactive experiences were successfully identified. University personnel were highlighted for their contributions to mentorship, subject expertise, and creating supportive learning environments, and the anonymisation of such insights is a straightforward feature of the methodology. Learning resources, including lecture content and materials, were valued for enhancing understanding, catering to diverse learning styles, and supporting flexible, active learning. Activities, such as competitions, workshops, and field trips, were recognised for connecting theory to practice, building critical skills, and fostering a sense of community. Support services and facilities, including libraries, counselling centres, career services, and fitness facilities, played a vital role in providing holistic support for students’ academic, personal, and career development. Lastly, within the organization category, students acknowledged their institutions’ academic excellence, research opportunities, diversity, reputation, and vibrant campus life as key contributors to a positive and enriching educational experience. Overall, these findings highlight an analysis framework that can successfully capture a comprehensive ecosystem where academic, personal, and professional support systems can all be identified to provide actionable feedback that can enhance student engagement and success.

5.3. Evaluation of N-Gram Analysis

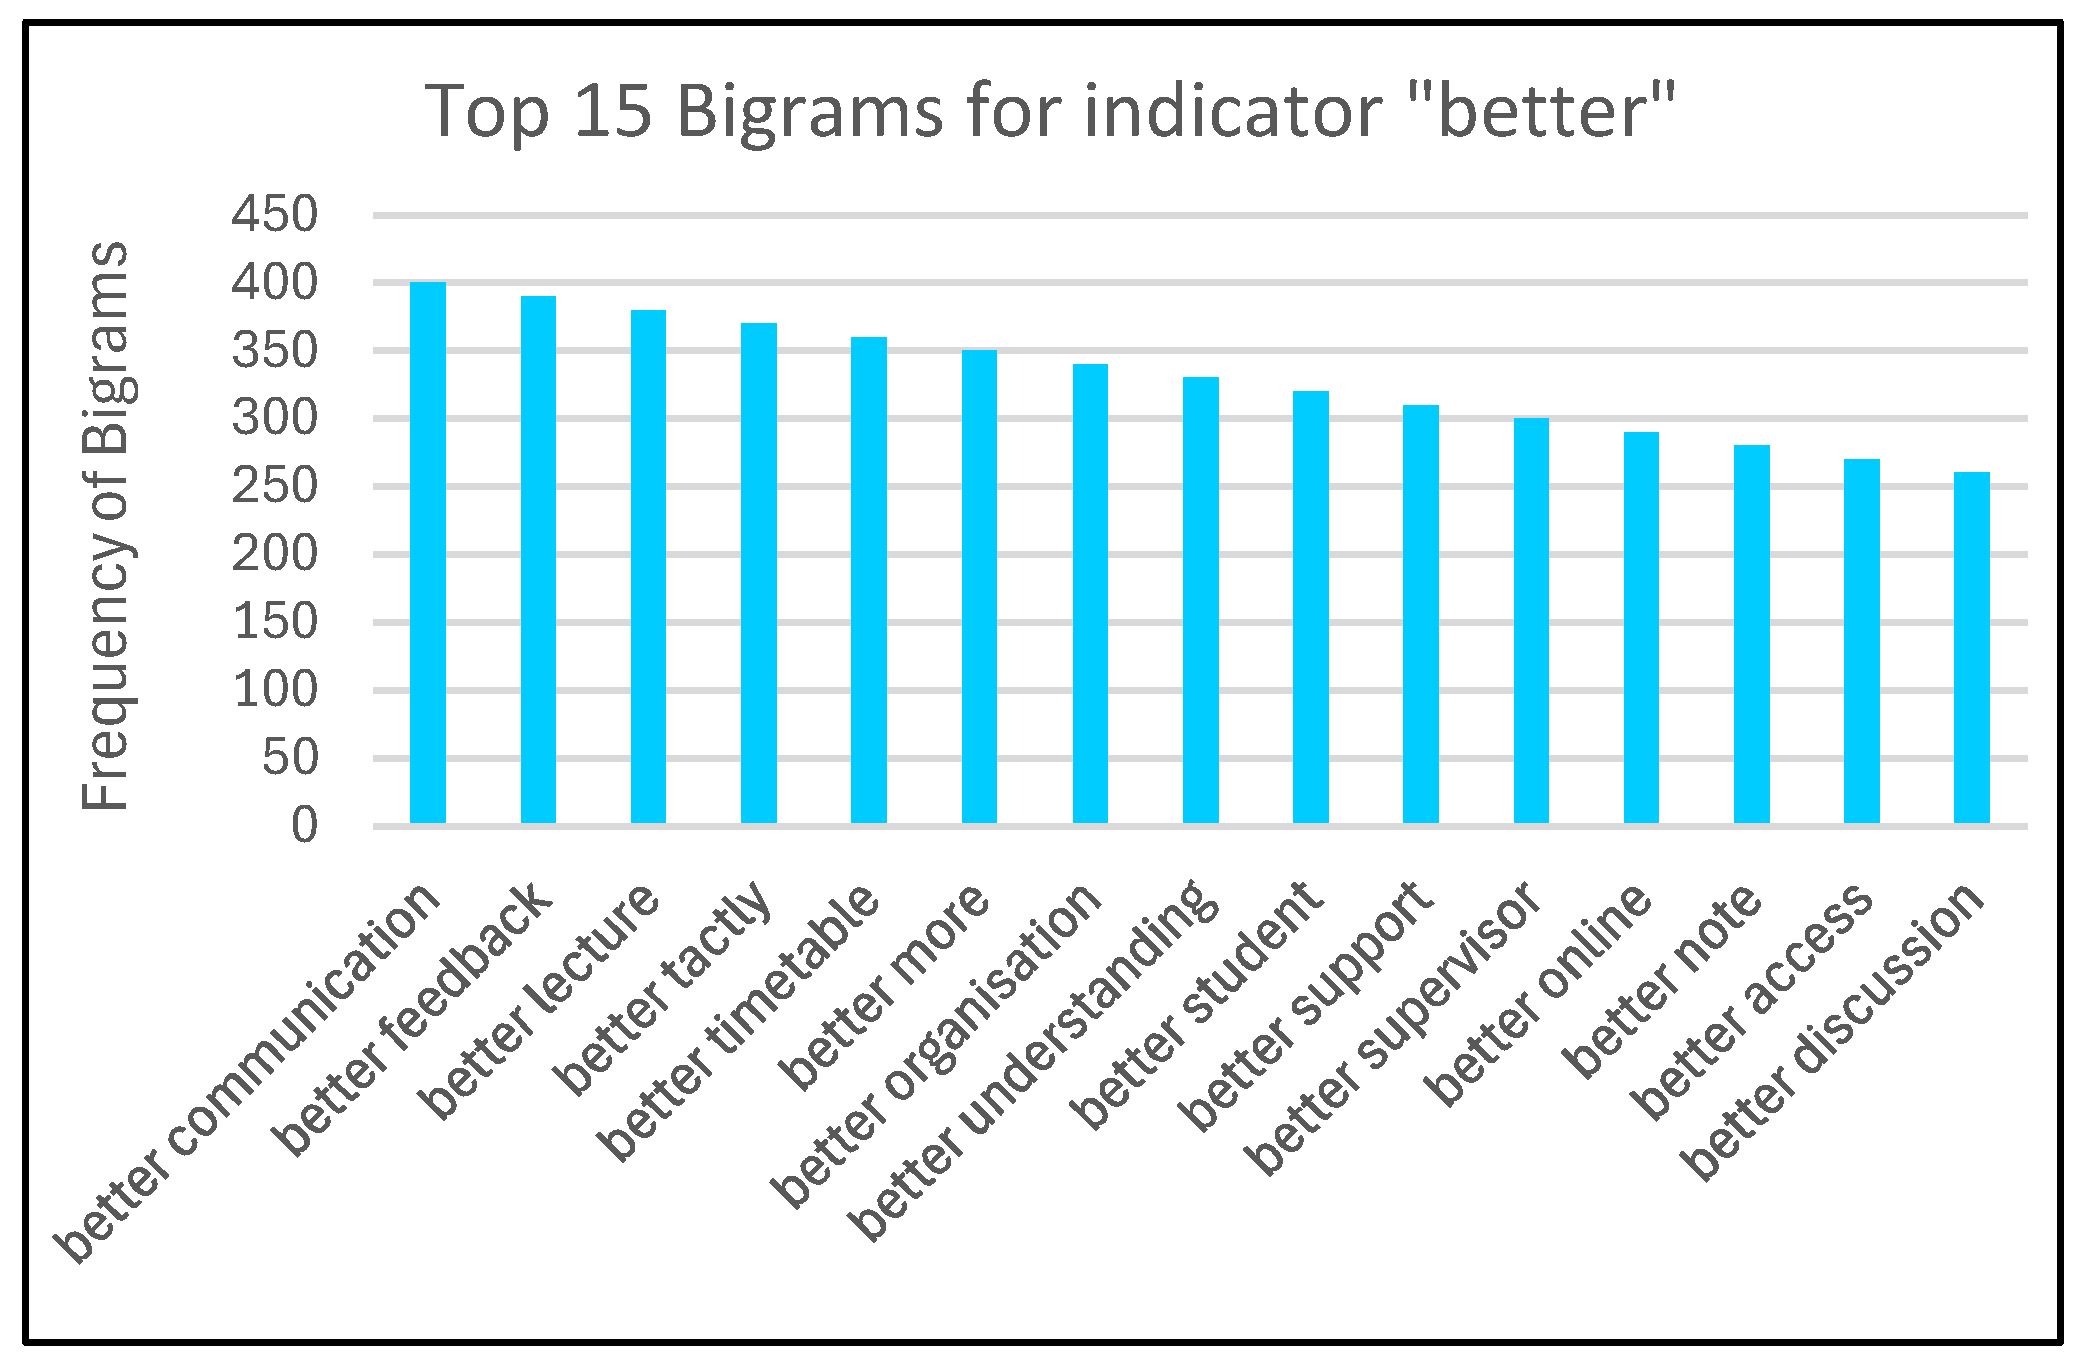
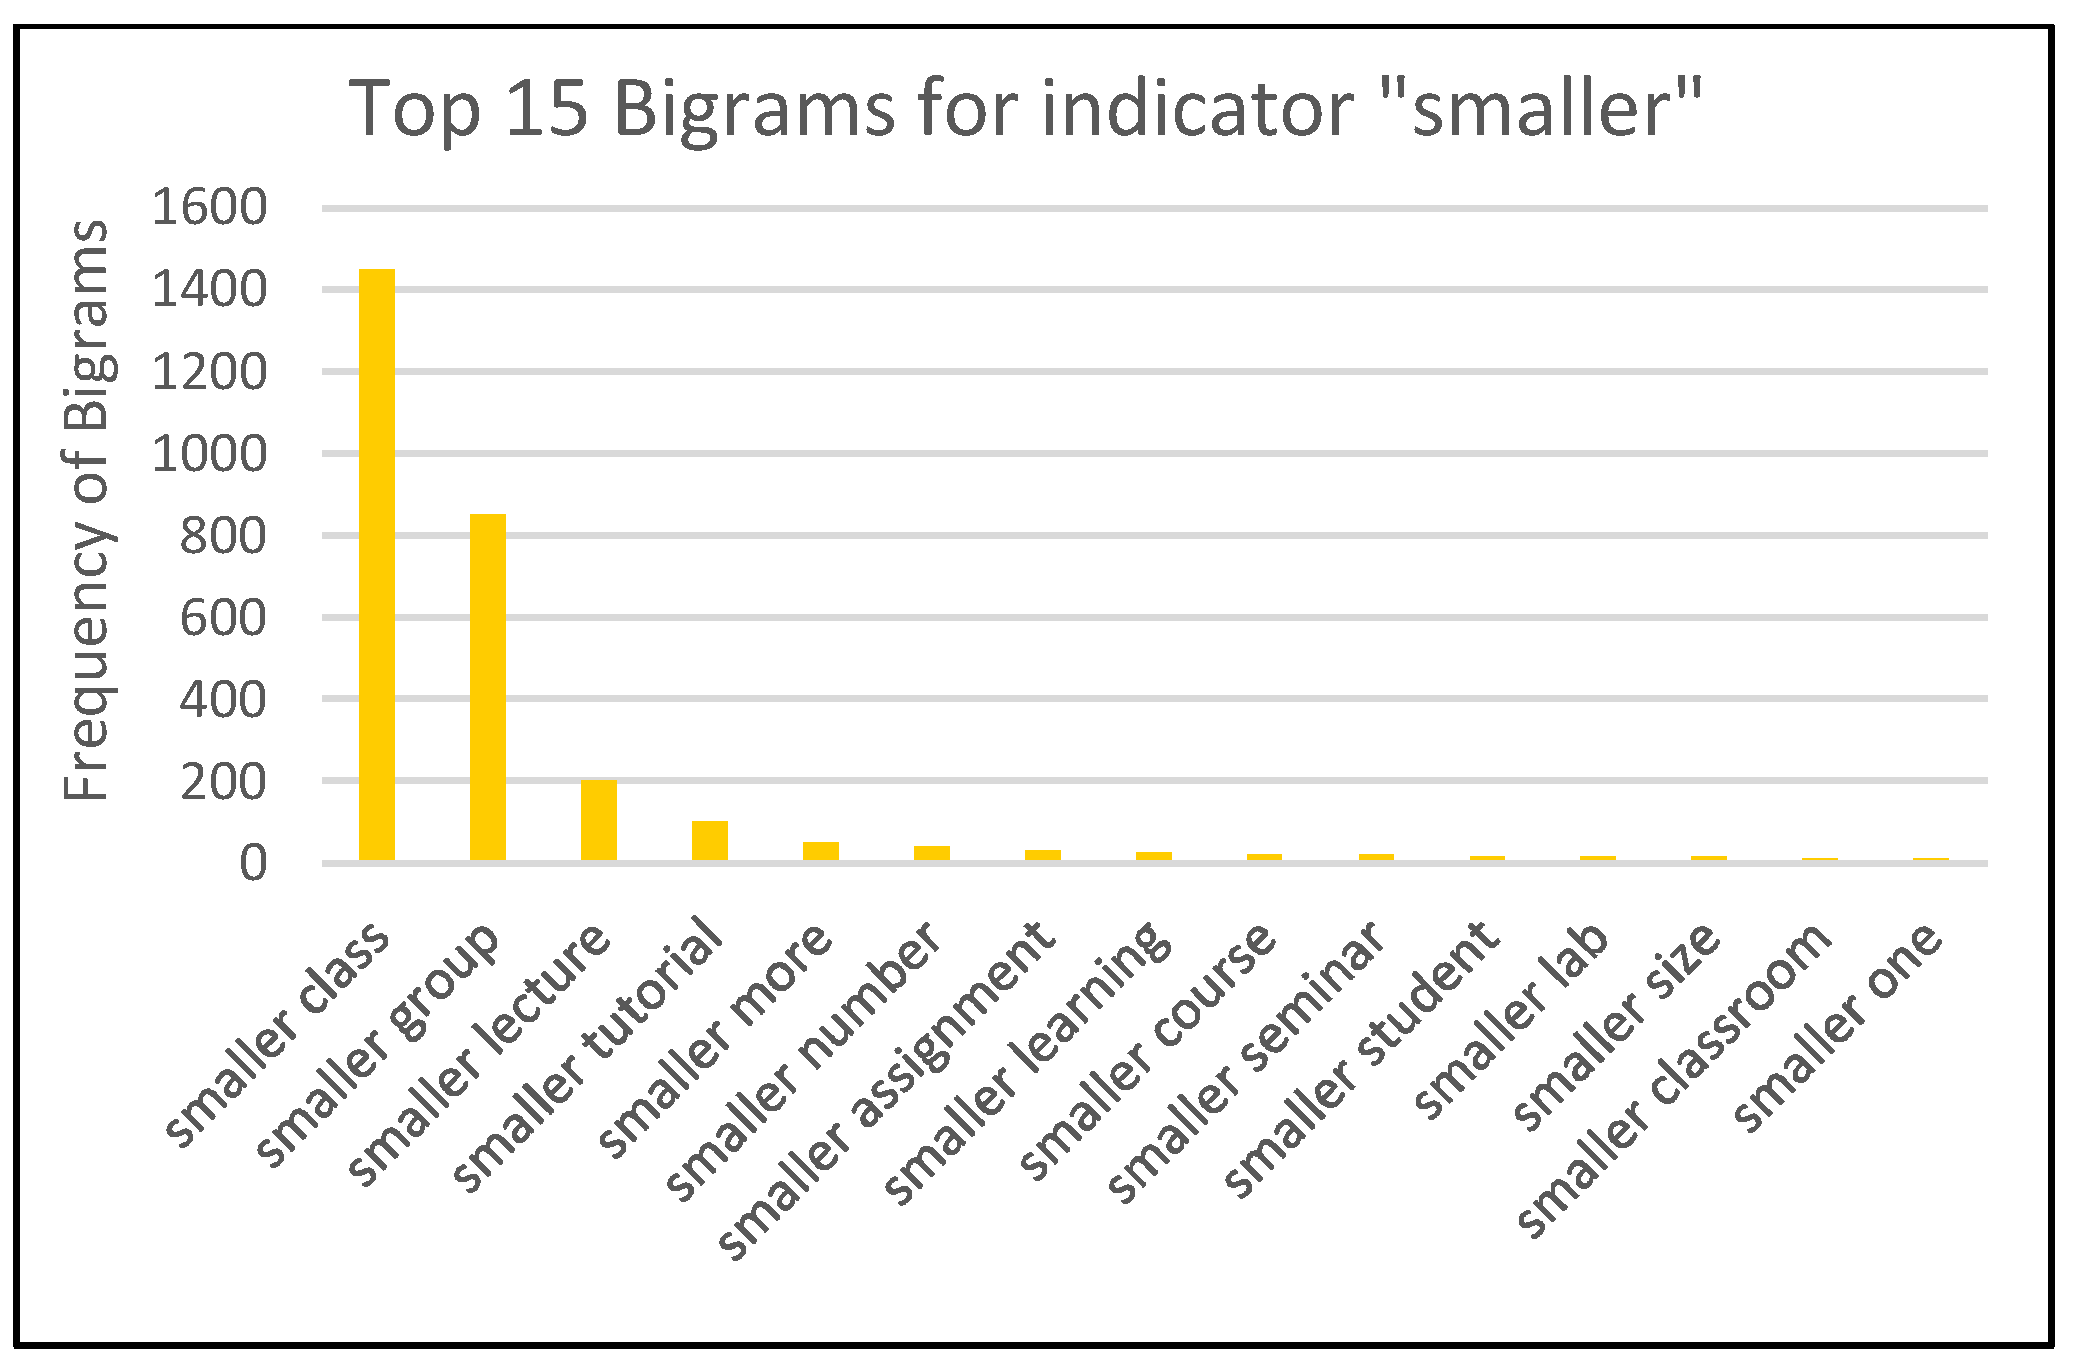
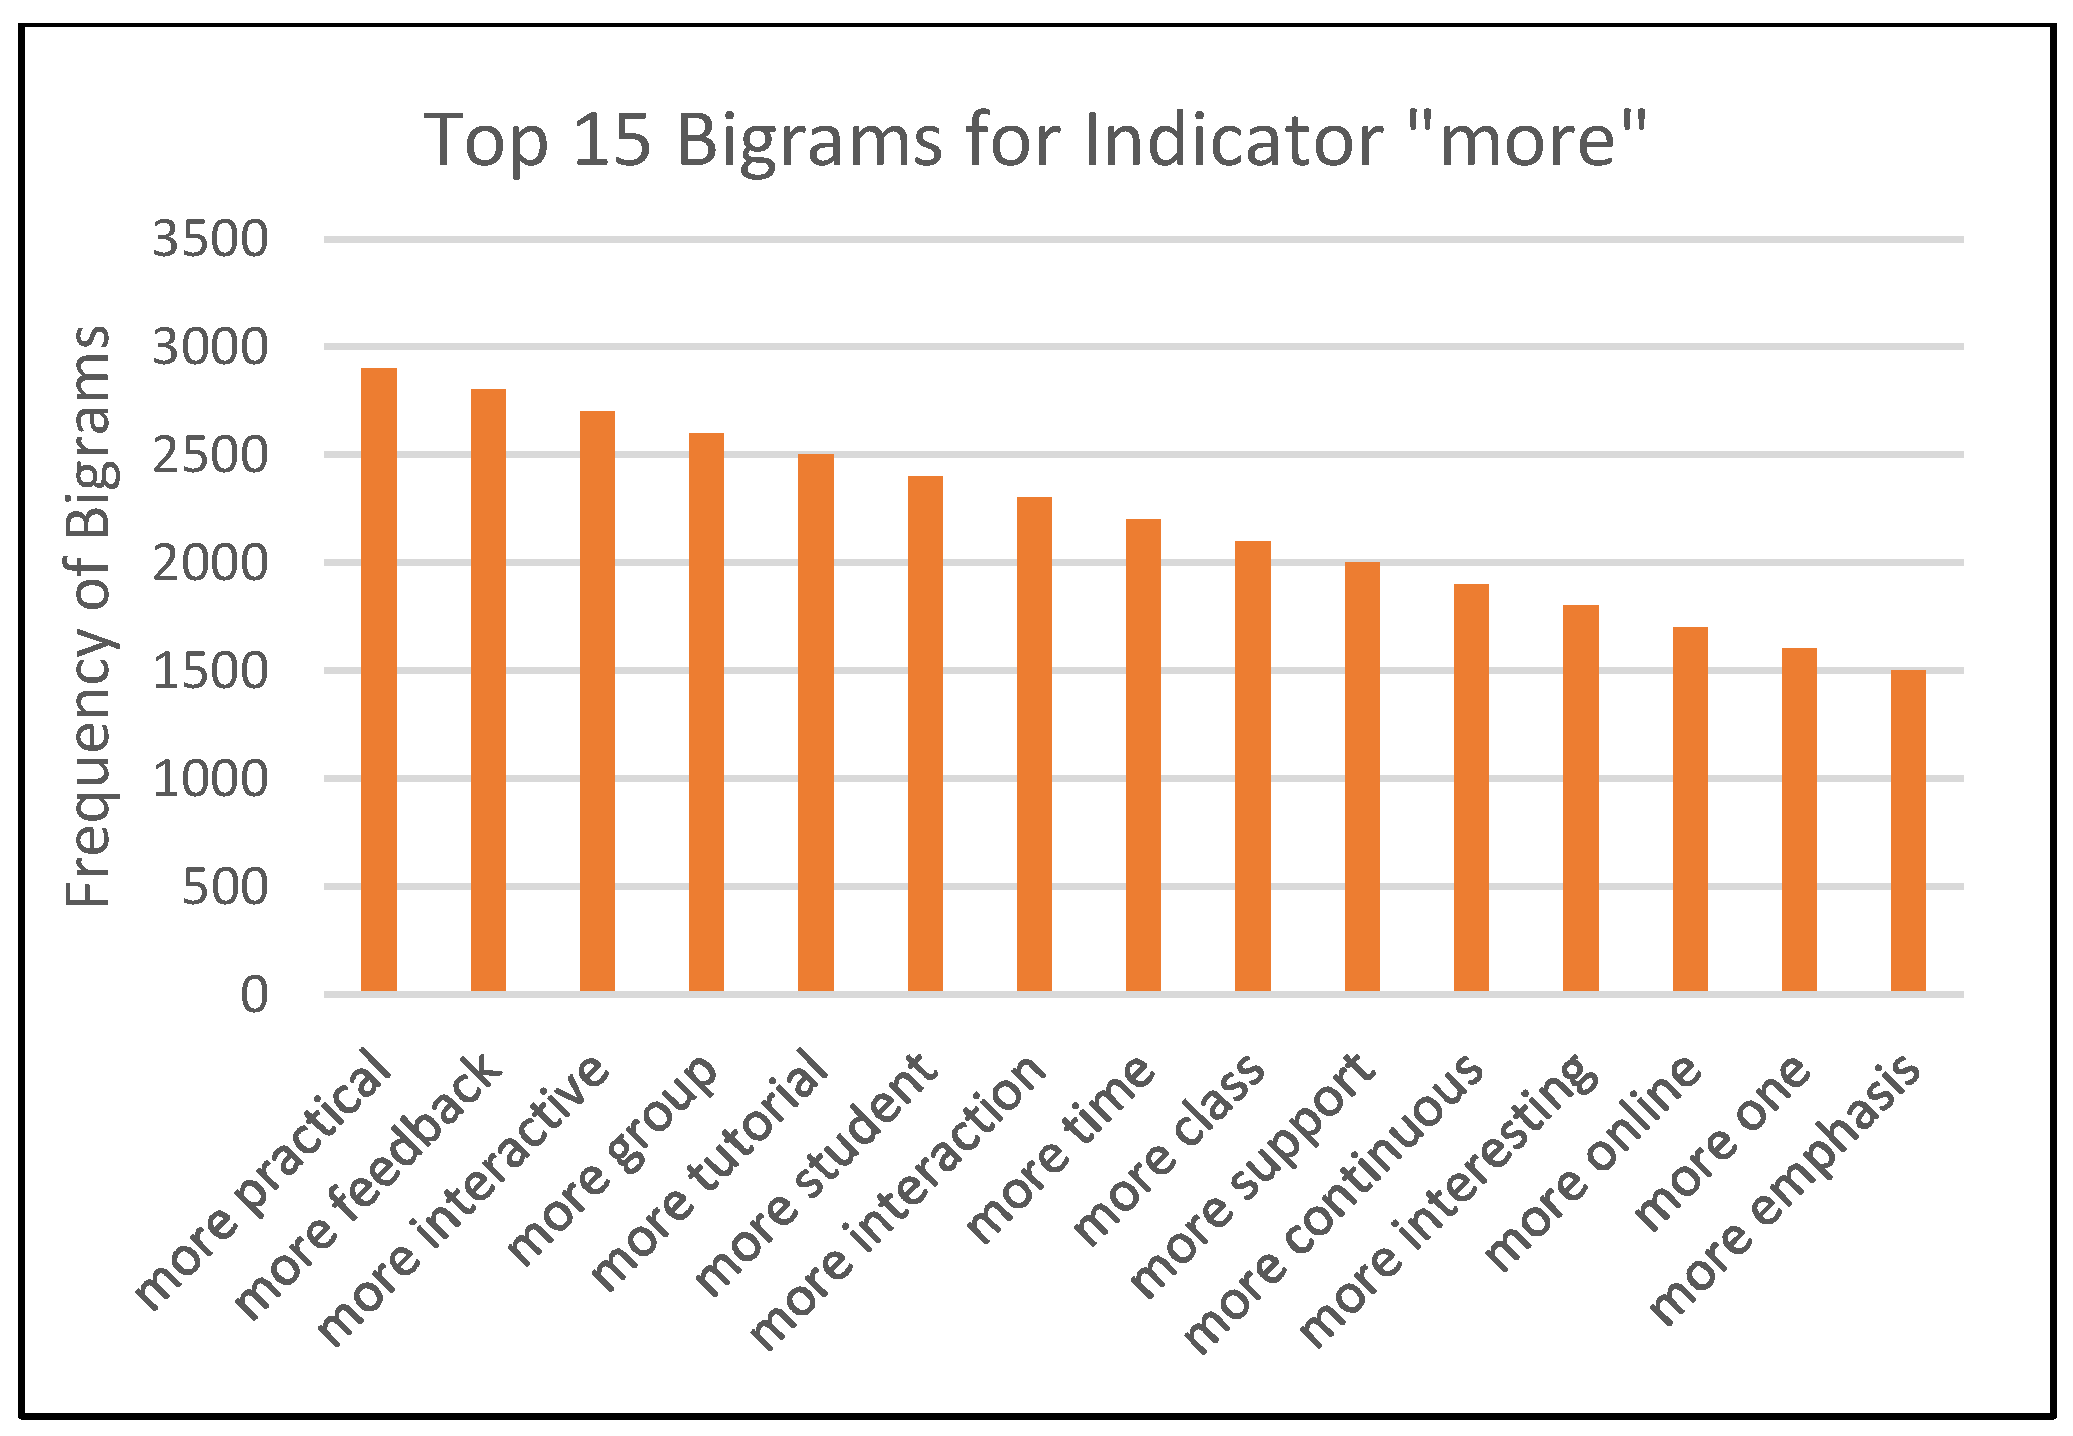
Responses to question 2, “improve_how”, were examined using n-gram analysis, as described in Section 4. Bigrams and trigrams revealed broad qualitative indicators such as “better”, “more”, and “smaller”. To accurately interpret these responses, we further analysed these indicators alongside their context words by generating targeted bigrams, enabling a clearer understanding of the specific improvements suggested by students. Figure 14, Figure 15 and Figure 16 show the top 15 bigrams for the “better”, “smaller”, and “more” indicators, respectively.
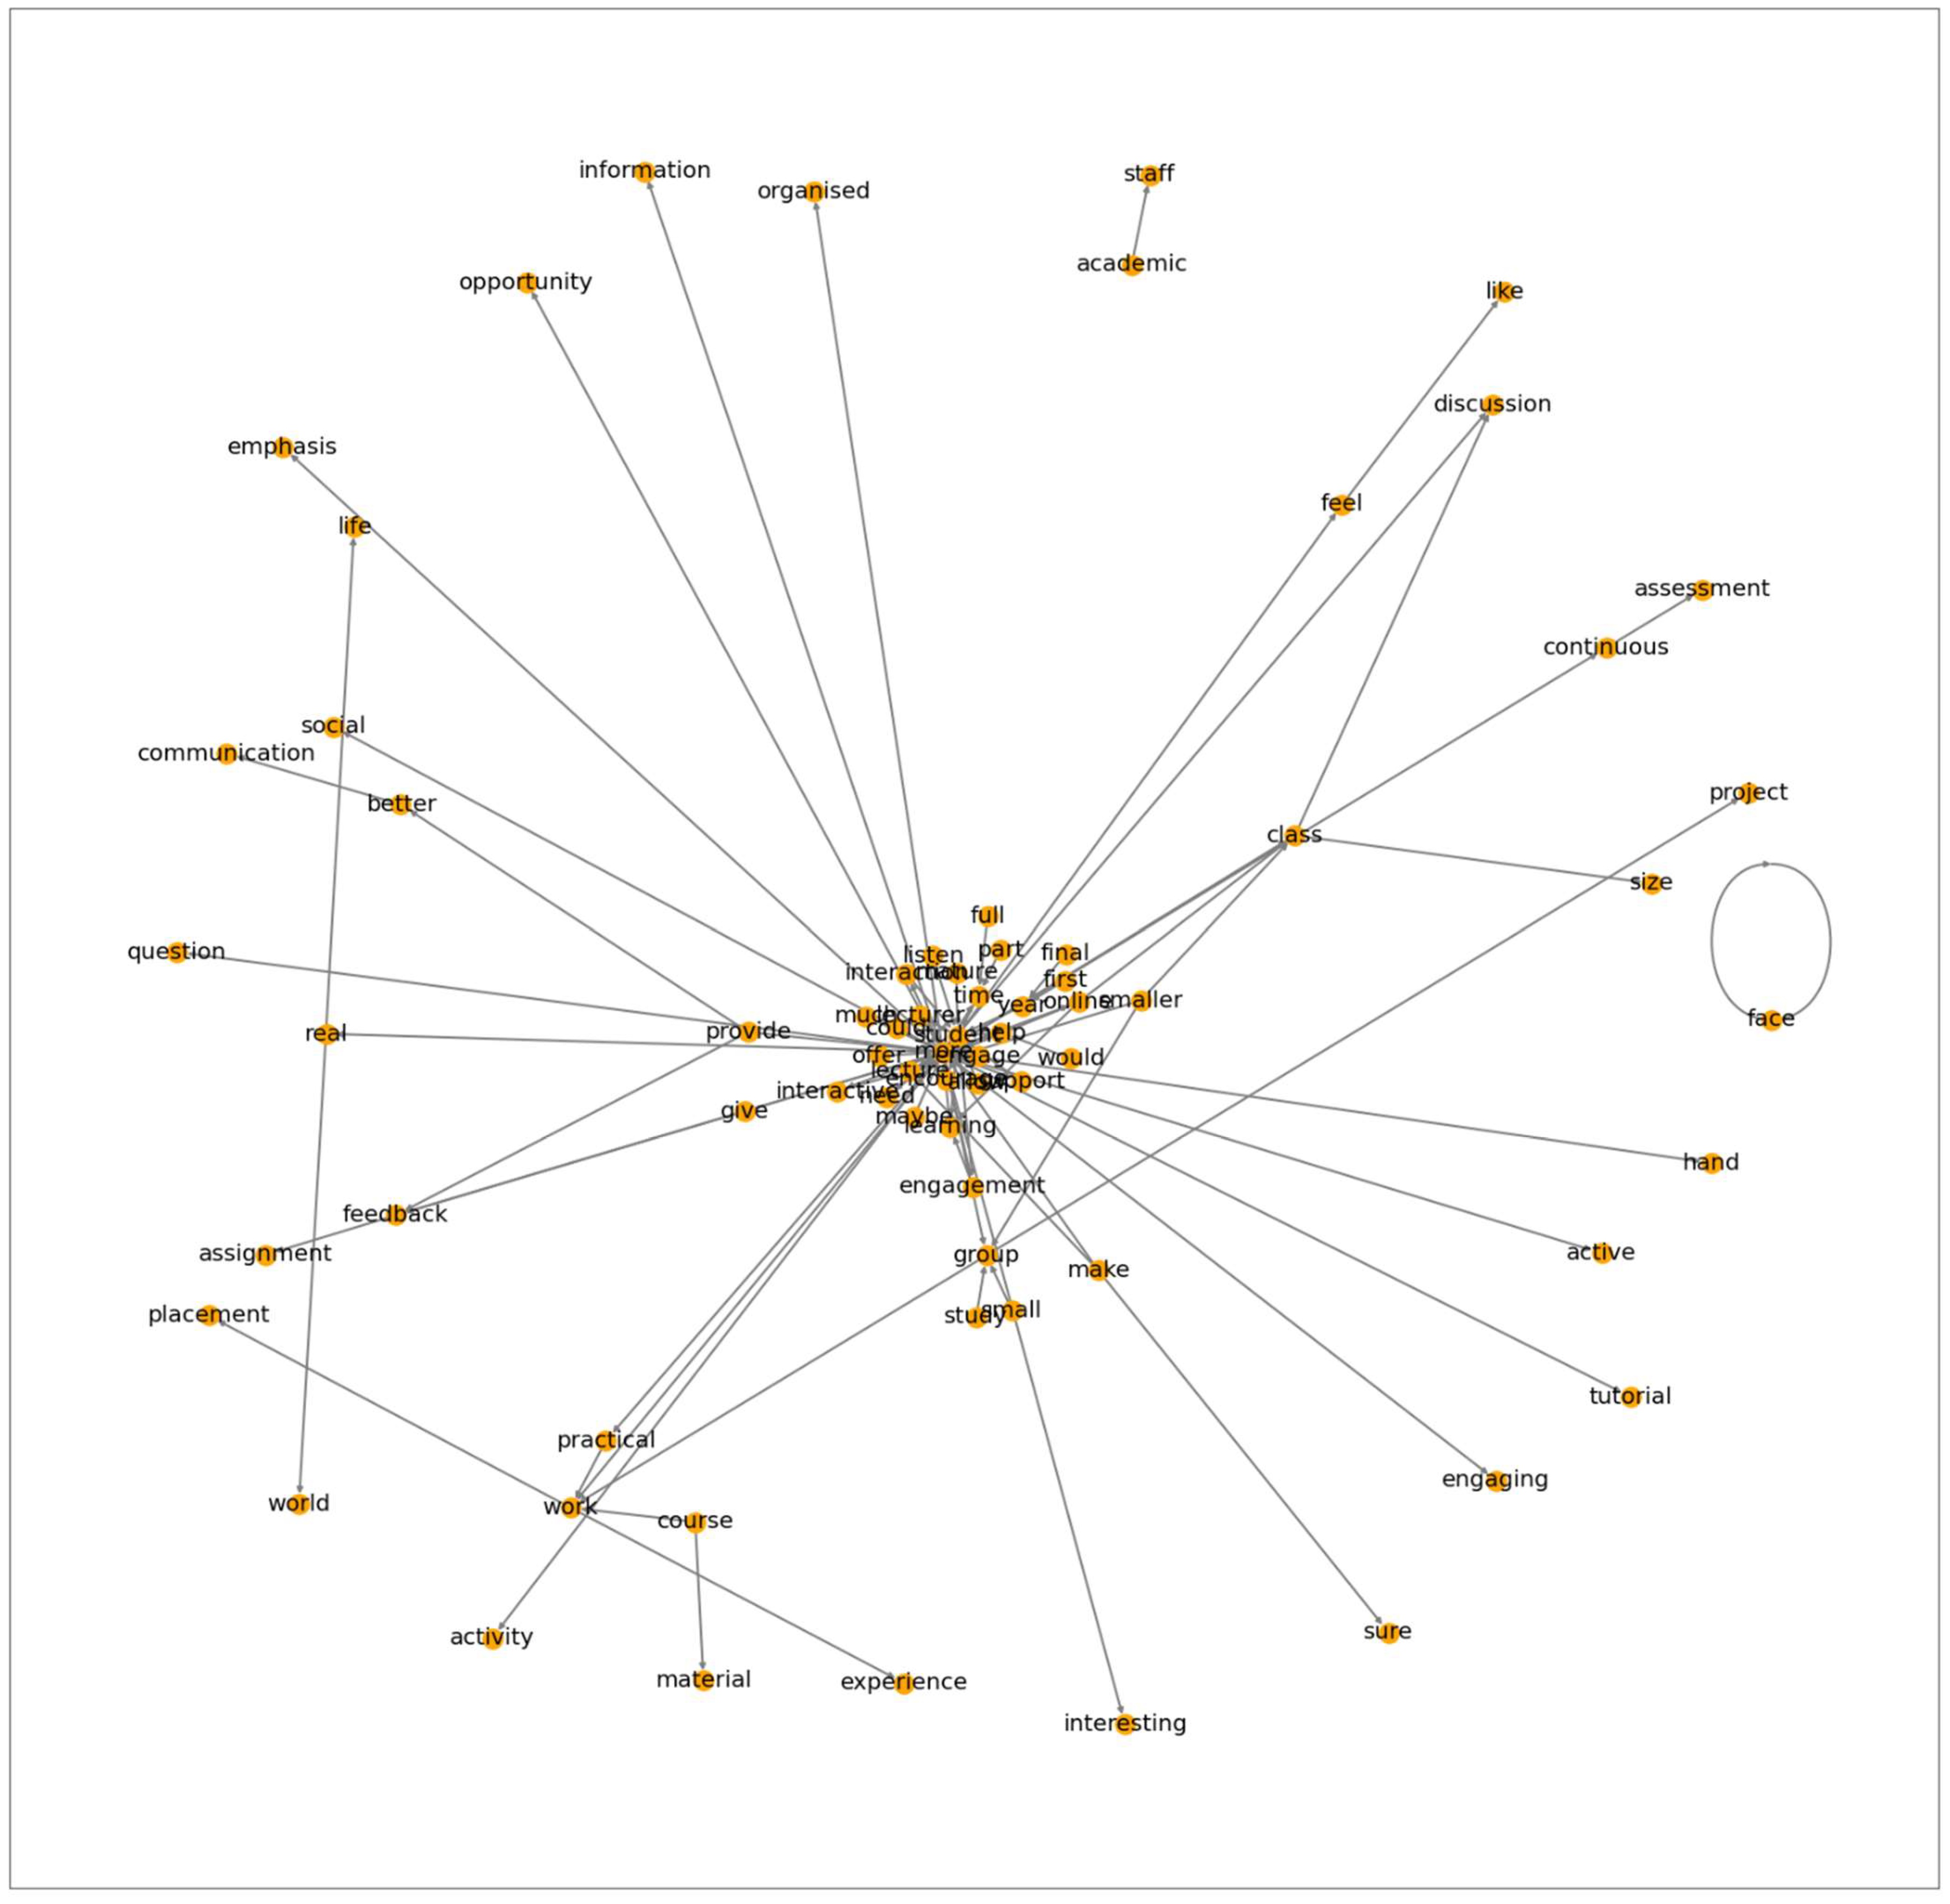
Figure 14 presents results regarding the descriptive bigrams associated with the indicator “better”, including phrases like “better communication”, “better teaching”, “better lecturer”, and “better engagement”. Such an identification stage can suggest where improvements in these areas are necessary to enhance student learning and engagement. Similarly, Figure 15 indicates accurately captures the student responses pertaining to smaller class sizes, groups, tutorials, assignments, quizzes, and tests. Thus, the analysis accurately captures the instances where students’ responses have indicated that further support would lead to a more positive engagement. The analysis framework is therefore capable of being used as an ‘early warning’ system when problems of this nature surface in the data. However, it should be noted that some bigrams such as “smaller more”, “smaller number”, and “smaller one” that lack context are also identified. Additionally, as shown in Figure 16, bigrams like “more interactive”, “more group”, “more tutorial” and “more discussion” reflect students’ emphasis on active learning, whereas terms like “more online”, “more interesting”, “more emphasis” and “more organised” are less specific and offer limited actionable insight. To help clarify these bigrams, we employed bigram networks, which provide a clear understanding of associated words and context. Figure 17 shows the bigram network diagram for all the responses.
Figure 17 highlights the 100 most common word pairs in student responses when asked to suggest improvements in their learning experience. As discussed above, the term “more” is frequently used and stands out as a central node pairing with various keywords. This association suggests that many students began their responses with “more” followed by specific suggestions. Common bigrams such as “more lectures”, “more assessment”, “more feedback”, “more tutorials”, and “more opportunities” indicate a strong desire among students for increased academic support and engagement. These responses reflect that students, unsurprisingly, respond in an ‘all of the above’ fashion when surveyed about how the learning experience might be improved. The model accurately captures greater interaction with instructors, more timely feedback, and other additional academic activities all enhance the learning experience. Moreover, the model successfully captured when students pointed out the need for practical content such as group work, case studies, and hands-on tasks to emphasise real-world applications. Additionally, the importance of digital resources such as videos, quizzes, and tutorials to support asynchronous learning beyond the classroom were also successfully captured.

5.4. Limitations and Future Work

In this study, we employed three topic modelling techniques, namely BERTopic, LDA and BTM, to identify the key themes in student responses regarding the best institutional aspects. Although BERTopic outperformed the other two models and generated more coherent and meaningful themes, it has certain limitations. It can be computationally expensive for larger datasets. Additionally, it can generate more general topics based on the most frequent words found in the dataset, which may require human interpretation and validation in order to produce more contextually relevant topics. Furthermore, selection of optimal number of topics is challenging; unlike the other two models, it requires generating topics first, often by selecting an arbitrary number of topics. Then a coherence metric can be used to further evaluate the model, making it a trial-and-error process rather than providing a predefined optimal topic number.
For NER, we employed both a custom NER and pre-trained models. While our custom model generally outperformed the pre-trained model, its performance was limited by the small size of the training dataset, leading to missed entities. Additionally, the limited dataset size restricted the model to capture less frequent entities, which could affect the further analyses.
For identifying entities in student suggestions related to academic aspects, we performed n-gram analysis. While effective in capturing frequently co-occurring terms, this approach may miss context-specific relationships between entities
  • Future Work:
Based on the findings of this study, we suggest several future directions that include incorporating expert judgment on an optimal sized dataset to optimize the topic modelling process. Expanding the training dataset for custom NER model and ensuring a more balanced distribution of entities will allow for more robust training of the custom NER model. Moreover, the retraining of the custom model may be needed for a different dataset with a relevant training dataset. These steps will enhance both the interpretability and practical utility of automated analyses of student feedback. In addition to the above, for effective collaboration, human experts can explore this automated analysis pipeline through a user friendly interface such as GUI (Graphical User Interface), that will effectively help optimising the results.

6. Conclusions

This study aimed to analyse and visualise student responses to two open-ended questions from StudentSurvey.ie (2016–2022):
  • Q1: What does your institution do best to engage students in learning?
  • Q2: What could your institution do to improve students’ engagement in learning?
Q1 prompts students to highlight existing institutional practices or resources that positively impact their learning experience. In contrast, Q2 encourages students to suggest improvements by reflecting critically on their educational experiences and proposing actionable changes. The questions are intentionally structured to elicit distinct types of responses. Q1 seeks detailed accounts of beneficial practices, while Q2 invites evaluative responses using comparative modifiers (e.g., “more”, “better”), facilitating structured comparison. Due to these differing response formats, separate analytical frameworks were developed to suit the specific characteristics of each question, ensuring rigorous and context-appropriate analysis.
This study employed both classical and deep learning techniques to analyse open-text responses to Q1 and Q2 of the StudentSurvey.ie dataset (2016–2022). For Q1, two sub-experiments were conducted: topic modelling and named entity recognition (NER). Prior to modelling, an extensive statistical and pre-processing pipeline was implemented, including text normalisation, lemmatization, stopword removal, and abbreviation handling. Despite challenges with institution-specific abbreviations, the processed corpus enabled more consistent and interpretable results.
Three topic modelling approaches were tested: LDA, BTM, and BERTopic. Among the classical methods, BTM with 8 topics yielded the most meaningful and coherent results, outperforming LDA due to its suitability for short text analysis. Key topics identified included “Extra-curricular Activities”, “Applied and Experiential Learning” and “Student Support” among others. BERTopic, trained with 15 topics, provided even richer semantic insights, identifying themes not captured by classical models. Leveraging transformer-based embeddings, this study has shown that a more coherent clustering of responses can be supported using digital tools and offered advanced visualizations for topic interpretation. The combined use of BTM and BERTopic highlighted the complementary strengths of probabilistic and semantic approaches in short-text analysis.
A custom NER model was also developed to extract entities such as “UNI_PERSON”, “ONLINE_TOOLS”, and “LEARNING_RESOURCES”. Performance improved with training data size, with the best model (trained on 3000 annotated responses) achieving a precision of 0.71, recall of 0.51, and F1-score of 0.60. However, imbalanced entity distribution impacted performance on underrepresented classes like “ACTIVITY” and “ORG”.
For Q2, after similar pre-processing, an n-gram analysis and bigram network approach were applied to capture common modifiers and their targets (e.g., “more support”, “better teaching”). This analysis enables comparative insights across student cohorts and reveals prevalent improvement areas. The tools have satisfied the requirement for a useful AI assistant that can help liberate time for more high-level analysis of this large data set.
The major contribution of this work is the development of a fully automated pipeline that can successfully capture, distil and analyse open-ended student feedback without recourse to standard sentiment analysis tools. The integration of Topic Modelling, NER, and n-gram analysis provides a scalable, interpretable, and accessible framework for researchers and institutions that liberates them from basic data analysis questions and allows them to delve deeper into a more subtle and nuanced analysis of the data. The visualisations have saved time, generated actionable insights, and enabled humans to facilitate better data-driven decision-making that can enhance the student learning experience through a more efficient use of human effort.

Author Contributions

Conceptualization, A.A. and A.J.; methodology, A.A.; software, A.A.; validation, A.A. and A.J.; formal analysis, A.A.; investigation, A.A.; data curation, studentsurvey.ie.; writing—original draft preparation, A.A.; writing—review and editing, A.A., A.J. and M.J.H.; visualization, A.A.; supervision, A.J. and M.J.H.; project administration, A.J.; funding acquisition, A.J. All authors have read and agreed to the published version of the manuscript.

Funding

This work was funded by StudentSurvey.ie which is funded by public Higher Education Institutions in Ireland.

Data Availability Statement

The data used in this study is not publicly available. We received access to an anonymised version after being awarded a research grant from StudentSurvey.ie under strict data protection guidelines.

Conflicts of Interest

The authors declare no conflicts of interest. The funders had no role in the design of the study, analyses, or interpretation of data; in the writing of the manuscript; or in the decision to publish the results.

Appendix A

Table A1 and Table A2 present top 20 keywords per topic extracted using LDA and BTM models, respectively. These keywords capture the underlying themes within the corpus and are categorized into distinct topics for clear and enhanced interpretation.
Table A1. Top 20 Keywords per topic extracted using LDA Model.
IndexTopic 1Topic 2Topic 3Topic 4Topic 5
0studentsupportlecturerclasslearning
1timestaffinterestingtutorialassignment
2engageprovidesrealworkproject
3collegeprovidelecturepracticalmake
4learnacademiccoursegroupemail
5getlearningassessmentsmallwork
6eventgoodengaginglecturegroup
7yearhelpmaterialdiscussionexam
8muchlibrarylifequestionfeedback
9talkapproachableexamplelabmethod
10institutionresourcecontinuousinteractivepresentation
11helpavailablereallyaskapproach
12beststudentteachingsizeregular
13partservicenoteseminarproblem
14lectureronlinegoodsmallerteam
15alsoexcellenttopicinteractionbased
16speakerfriendlyrelevanthandroom
17involvedlecturerwellansweractive
18coursecenterworldsessiongive
19attendanceoffersubjectactivitydifferent
Table A2. Top 20 Keywords per topic extracted using BTM Model.
IndexTopic 0Topic 1Topic 2Topic 3Topic 4Topic 5Topic 6Topic 7
0informationalmicroteachinglearnonlinefascinatinghireddunnomathcalling
1instagramfieldworkuploadinganecdotecontactableexpletivecentresmaller
2eventrole_playgappedillustrateintelligentfailcenterbreakout
3campaignexperientialuploadrelatableempatheticsettlesumsize
4socsincorporatesbright_spacegraphcompetentpaidloansmall
5invitationimplementationabsentrealtalentedawfulwritingnervous
6newsletterprojectrecordedrelatepleasantconsequencesuiteintimate
7socialcombiningpanoptoillustrationcaringignoredgrindsized
8awarenessclinicalcalendarstoryknowledgeablefeedatabaseask
9clubportfoliopostedhumoremployrepeatalcasking
10societycarryinguploadedworldhireknewlibrarymicrophone
11sendsproductrecordingexampleexceptionleaving_certopeningcamera
12conferenceplacementmid_termpracticalityqualifiedpassingcomputerquestion
13sportingbasedcramminggraphiccalmthreatranshy
14mediumculinarysummaryimageapproachabilityworstprintingintimidating
15extracurricularpracticalslackdiagramexceptionalcutsupportbrainstorming
16tourparticipatoryrecordrelatesskilledfootlibraryuncomfortable
17exhibitionreflectionmissedsocietalwarmmoneyadvisoryanonymous
18informpracticallayoutclipenthusiasticempathylaptopconcentrated
19informingclienttoememorizefriendlyfailingservicelarger
Table A3. Top 20 Keywords per topic extracted using BTM Model.
Sample ResponsesKeywords Generated by BERTopicExpert-Selected KeywordsSuggested Themes
Most of our lecturers were superb and really knew their subjectsstudent, class, lecturer, learninglecturerknowledgeable
Approachable lecturers, encouraged to engage, small class sizestudent, class, lecturer, learninglecturerclass-size,
engagement
mixture of practical and theory classesstudent, class, lecturer, learning-structure
Canvas can host a range of materials including extra supporting materials.note, gap, blackboard, lecture-VLE, content
Social media updateswhatsapp, create, chat,
emailing
-socials, communication
Gets student involved in the learning, discussions, group work, role play etc.role, play, presentation, practice, theorypracticeengagement, learning
Interactive learning is very prominent in my institution which is a great way to get students engaged in learningstudent, class, lecturer, learninglearningengagement
Students studying a part time MBA want to be succeed, and therefore will engage as they are in the workplace and have something to contribute. Also the lecturers promote engagement and inclusion of all students in the classesstudent, class, lecturer, learningStudent, lecturerengagement,
inclusion
Practical assignments without the focus of essay writing followed by more essay writing, this university I found, provided many different ways of examining a student.assessment, continuous, examAssessment, examstructure
Variety of assessment types-more focus on continuous assessment rather than final exams.assessment, continuous, examAssessment, examstructure
Bring guest lecturers from different walks of life, giving us practical experiencerole, play, presentation,
practice, theory
practiceengagement,
learning, lecturer,
knowledgeable
holds seminars with people already in the workforcerole, play, presentation, practice, theorypracticestructure
There are many cafes with low prices on campus so it feels like they’re trying to encourage students to get a coffee and stay a while to work on assignments, readings, etc.club, socs, society, sport-engagement
The staff are very approachable and make a point if letting you know they are there to help and guide you if you need it.open, door, policy, staff, door-support,
communication,
approachability,
knowledgeable
Patient-centred care labs are an engaging way to learn as they mimic real-world scenarios and help students to become more comfortable speaking with patients about their medicines and health concerns.good, library, facility, access-engagement,
practice,
communication
Some tutors great on line and real enjoyed their interactions and break out rooms.offline, communicate, let,
online
-engagement, practice, knowledgeable
Group team list and provide us the platforms for communicationoffline, communicate, let,
online
-communication,
collaboration
They organize small group chats where by they check on our progress and provide advicewhatsapp, create, chat, emailing-support, advice,
engagement,
collaboration
Carrying out continuous assessments with students to get them actively engaging in modules rather than one big exam at the end of termassessment, continuous, examAssessment, examengagement

References

  1. Gaftandzhieva, S.; Doneva, R.; Zhekova, M.; Pashev, G. Towards Automated Evaluation of the Quality of Educational Services in HEIs. Int. J. Adv. Comput. Sci. Appl. 2023, 14. [Google Scholar] [CrossRef]
  2. Mandia, S.; Mitharwal, R.; Singh, K. Automatic student engagement measurement using machine learning techniques: A literature study of data and methods. Multimed. Tools Appl. 2024, 83, 49641–49672. [Google Scholar] [CrossRef]
  3. Fredricks, J.A.; Blumenfeld, P.C.; Paris, A.H. School engagement: Potential of the concept, state of the evidence. Rev. Educ. Res. 2004, 74, 59–109. [Google Scholar] [CrossRef]
  4. Misuraca, M.; Scepi, G.; Spano, M. Using Opinion Mining as an educational analytic: An integrated strategy for the analysis of students’ feedback. Stud. Educ. Eval. 2021, 68, 100979. [Google Scholar] [CrossRef]
  5. Maeda, Y.; Wang, X.; Zhang, Y.; Banks, J.B.; Kenney, R.H. Balancing Human and Machine Coding: Evaluating the Credibility and Potential of Topic Modeling for Open-Ended Survey Responses. Comput. Hum. Behav. 2025, 172, 108703. [Google Scholar] [CrossRef]
  6. Shamshiri, A.; Ryu, K.R.; Park, J.Y. Text mining and natural language processing in construction. Autom. Constr. 2024, 158, 105200. [Google Scholar] [CrossRef]
  7. Diaz, N.P.; Walker, J.P.; Rocconi, L.M.; Morrow, J.A.; Skolits, G.J.; Osborne, J.D.; Parlier, T.R. Faculty Use of End-of-Course Evaluations. Int. J. Teach. Learn. High. Educ. 2022, 33, 285–297. [Google Scholar]
  8. Okoye, K.; Arrona-Palacios, A.; Camacho-Zuñiga, C.; Achem, J.A.G.; Escamilla, J.; Hosseini, S. Towards teaching analytics: A contextual model for analysis of students’ evaluation of teaching through text mining and machine learning classification. Educ. Inf. Technol. 2022, 27, 3891–3933. [Google Scholar] [CrossRef]
  9. Kuzehgar, M.; Sorourkhah, A. Factors affecting student satisfaction and dissatisfaction in a higher education institute. Syst. Anal. 2024, 2, 1–13. [Google Scholar] [CrossRef]
  10. Tan, K.H.; Chan, P.P.; Mohd Said, N.-E. Higher education students’ online instruction perceptions: A quality virtual learning environment. Sustainability 2021, 13, 10840. [Google Scholar] [CrossRef]
  11. Liu, B. Sentiment Analysis and Opinion Mining; Springer Nature: Berlin/Heidelberg, Germany, 2022. [Google Scholar]
  12. Kastrati, Z.; Dalipi, F.; Imran, A.S.; Pireva Nuci, K.; Wani, M.A. Sentiment analysis of students’ feedback with NLP and deep learning: A systematic mapping study. Appl. Sci. 2021, 11, 3986. [Google Scholar] [CrossRef]
  13. Onan, A. Sentiment analysis on massive open online course evaluations: A text mining and deep learning approach. Comput. Appl. Eng. Educ. 2021, 29, 572–589. [Google Scholar] [CrossRef]
  14. Schurig, T.; Zambach, S.; Mukkamala, R.R.; Petry, M. Aspect-based Sentiment Analysis for University Teaching Analytics. In Proceedings of the Thirtieth European Conference on Information Systems (ECIS 2022), Timișoara, Romania, 18–24 June 2022. [Google Scholar]
  15. Ren, P.; Yang, L.; Luo, F. Automatic scoring of student feedback for teaching evaluation based on aspect-level sentiment analysis. Educ. Inf. Technol. 2023, 28, 797–814. [Google Scholar] [CrossRef]
  16. Bhowmik, A.; Noor, N.M.; Mazid-Ul-Haque, M.; Miah, M.S.U.; Karmaker, D. Evaluating teachers’ performance through aspect-based sentiment analysis. In Proceedings of the 2024 IEEE 9th International Conference for Convergence in Technology (I2CT), Pune, India, 5–7 August 2024; IEEE: New York, NY, USA, 2024. [Google Scholar]
  17. Zhang, T.; Moody, M.; Nelon, J.P.; Boyer, D.M.; Smith, D.H.; Visser, R.D. Using Natural Language Processing to Accelerate Deep Analysis of Open-Ended Survey Data. In Proceedings of the 2019 SoutheastCon, Huntsville, AL, USA, 11–14 April 2019; IEEE: New York, NY, USA, 2019. [Google Scholar]
  18. Jayasudha, J.; Thilagu, M. A survey on sentimental analysis of student reviews using natural language processing (NLP) and Text Mining. In Proceedings of the International Conference on Innovations in Intelligent Computing and Communications, Bhubaneswar, India, 16–17 December 2022; Springer: Berlin/Heidelberg, Germany, 2022. [Google Scholar]
  19. Shaik, T.; Tao, X.; Dann, C.; Xie, H.; Li, Y.; Galligan, L. Sentiment analysis and opinion mining on educational data: A survey. Nat. Lang. Process. J. 2023, 2, 100003. [Google Scholar] [CrossRef]
  20. Kiely, E.; Quigley, C.; Ishmael, O.; Ogbuchi, I. Application of Natural Language Processing (NLP) for Sentiment Analysis and Topic Modelling of Postgraduate Student Engagement Data; PGR StudentSurvey.ie Qualitative Data Analysis Report; Atlantic Technological University: Dublin, Ireland, 2023. [Google Scholar]
  21. Erskine, S.; David, H. Report on the Analysis of Qualitative Data from StudentSurvey.ie (the Irish Survey of Student Engagement) 2022 Using Power BI; Reports Studentsurvey.ie; Studentsurvey.ie: Dublin, Ireland, 2023. [Google Scholar]
  22. Churchill, R.; Singh, L. The evolution of topic modeling. ACM Comput. Surv. 2022, 54, 1–35. [Google Scholar] [CrossRef]
  23. Sun, J.; Yan, L. Using topic modeling to understand comments in student evaluations of teaching. Discov. Educ. 2023, 2, 25. [Google Scholar] [CrossRef]
  24. Nanda, G.; Douglas, K.A.; Waller, D.R.; Merzdorf, H.E.; Goldwasser, D. Analyzing large collections of open-ended feedback from MOOC learners using LDA topic modeling and qualitative analysis. IEEE Trans. Learn. Technol. 2021, 14, 146–160. [Google Scholar] [CrossRef]
  25. Fang, Q. Research on Topic Mining of MOOC Course Reviews Based on the BERTopic Model. In Proceedings of the 2024 14th International Conference on Information Technology in Medicine and Education (ITME), Nanping, China, 13–15 September 2024; IEEE: New York, NY, USA, 2024. [Google Scholar]
  26. Dillan, T.; Fudholi, D.H. What can we learn from MOOC: A sentiment analysis, n-gram, and topic modeling approach. In Proceedings of the 2022 IEEE 7th international conference on information technology and digital applications (ICITDA), Yogyakarta, Indonesia, 4–5 November 2022; IEEE: New York, NY, USA, 2022. [Google Scholar]
  27. Parker, M.J.; Anderson, C.; Stone, C.; Oh, Y. A large language model approach to educational survey feedback analysis. Int. J. Artif. Intell. Educ. 2024, 35, 444–481. [Google Scholar] [CrossRef]
  28. Sheils, J.C.; Dampier, D.A.; Malik, H. A Comparative Study of Topic Models for Student Evaluations. In Proceedings of the 2024 ASEE North Central Section Conference, Kalamazoo, MI, USA, 22–23 March 2024. [Google Scholar]
  29. Nawaz, R.; Sun, Q.; Shardlow, M.; Kontonatsios, G.; Aljohani, N.R.; Visvizi, A.; Hassan, S.-U. Leveraging AI and machine learning for national student survey: Actionable insights from textual feedback to enhance quality of teaching and learning in UK’s higher education. Appl. Sci. 2022, 12, 514. [Google Scholar] [CrossRef]
  30. Onah, D.F.; Pang, E.L. MOOC design principles: Topic modelling-PyLDavis visualization & summarisation of learners’ engagement. In Proceedings of the 13th International Conference on Education and New Learning Technologies Online Conference, Online, 5–6 July 2021. [Google Scholar]
  31. Riaz, A.; Abdulkader, O.; Ikram, M.J.; Jan, S. Exploring topic modelling: A comparative analysis of traditional and transformer-based approaches with emphasis on coherence and diversity. Int. J. Electr. Comput. Eng. 2025, 15, 1933–1948. [Google Scholar] [CrossRef]
  32. Albanese, N.C. Topic Modeling with LSA, pLSA, LDA, NMF, BERTopic, Top2Vec: A Comparison. Towards Data Sci. 2022, 19. [Google Scholar]
  33. Grootendorst, M. BERTopic: Neural topic modeling with a class-based TF-IDF procedure. arXiv 2022, arXiv:2203.05794. [Google Scholar]
  34. Hayat, F.I.; Shatnawi, S.; Haig, E. Comparative analysis of topic modelling approaches on student feedback. In Proceedings of the 16th International Joint Conference on Knowledge Discovery, Knowledge Engineering and Knowledge Management, Porto, Portugal, 17–19 November 2024; SciTePress: Setúbal, Portugal, 2024. [Google Scholar]
  35. Murshed, B.A.H.; Mallappa, S.; Abawajy, J.; Saif, M.A.N.; Al-Ariki, H.D.E.; Abdulwahab, H.M. Short text topic modelling approaches in the context of big data: Taxonomy, survey, and analysis. Artif. Intell. Rev. 2023, 56, 5133–5260. [Google Scholar] [CrossRef] [PubMed]
  36. Albalawi, R.; Yeap, T.H.; Benyoucef, M. Using topic modeling methods for short-text data: A comparative analysis. Front. Artif. Intell. 2020, 3, 42. [Google Scholar] [CrossRef] [PubMed]
  37. Sood, M.; Kaur, H.; Gera, J. Information retrieval using n-grams. In Artificial Intelligence and Technologies: Select Proceedings of ICRTAC-AIT 2020; Springer: Berlin/Heidelberg, Germany, 2021; pp. 335–342. [Google Scholar]
  38. Şen, T.Ü.; Yakit, M.C.; Gümüş, M.S.; Abar, O.; Bakal, G. Combining N-grams and graph convolution for text classification. Appl. Soft Comput. 2025, 175, 113092. [Google Scholar] [CrossRef]
  39. Mageed, I.A. On the Rényi Entropy functional, Tsallis distributions and Lévy stable distributions with entropic applications to machine learning. Soft Comput. Fusion Appl. 2024, 1, 91–102. [Google Scholar]
Figure 1. Topic Modelling Process Flow.
Futureinternet 17 00453 g001
Figure 2. WordCloud for most frequently used Words in Responses for “Best_Aspects” Question.
Futureinternet 17 00453 g002
Figure 3. Coherence Scores for LDA Model Fitted with Various Number of Topics.
Futureinternet 17 00453 g003
Figure 4. Visualization of the LDA model fitted with 5 topics. Left: Intertopic distance map showing relationships among topics and their marginal distributions. Right: Top 30 most salient terms and their frequencies.
Futureinternet 17 00453 g004
Figure 5. Entropy vs. Number of Topics for BTM.
Futureinternet 17 00453 g005
Figure 6. Visualization of the BTM model fitted with 8 topics. Left: Intertopic distance map. Center: Relevant terms and their probabilities for Topic 5. Right: Top documents associated with Topic 5.
Futureinternet 17 00453 g006
Figure 7. Results of BERTopic with 15 Topics.
Futureinternet 17 00453 g007
Figure 8. Hierarchical representation of semantically related Topics.
Futureinternet 17 00453 g008
Figure 9. Pipeline for N-gram Analysis.
Futureinternet 17 00453 g009
Figure 10. Frequent Words in “improve_how”.
Futureinternet 17 00453 g010
Figure 11. Frequent Bigrams in “improve_how”.
Futureinternet 17 00453 g011
Figure 12. Frequent Trigrams in “improve_how”.
Futureinternet 17 00453 g012
Figure 13. Student Survey Analysis Pipeline for BERTopic Modelling with Expert Validation.
Futureinternet 17 00453 g013
Figure 14. Bigrams for the indicator “better”.
Futureinternet 17 00453 g014
Figure 15. Bigrams for the indicator “smaller”.
Futureinternet 17 00453 g015
Figure 16. Bigrams for the indicator “more”.
Futureinternet 17 00453 g016
Figure 17. Bigram Network for All Student Responses.
Futureinternet 17 00453 g017
Table 1. An Overview of Participant Distribution by Demographic Characteristics.
YearGenderAge Group (Yrs.)Study GroupMode of Study
FemaleMale≤23≥24PGTY1YFFull-TimePart-Time
201659%41%63.24%36.62%15.24%48.25%36.51%88.82%11.18%
201758.1%41.9%65.42%34.58%15.05%49.94%35.02%89.33%10.67%
201859.3%40.7%65.22%34.78%17.03%48.35%34.62%87.96%12.04%
201958.8%41.2%65.85%34.15%17.38%48.22%34.40%88.49%11.51%
202058.9%41.0%66.47%33.53%19.47%48.93%31.61%88.29%11.71%
202160.5%39.3%63.14%36.86%20.65%48.17%31.18%85.74%14.26%
202260.8%38.7%62.17%38.22%23.81%45.57%30.63%85.77%14.23%
Table 2. Student Responses Per Year.
YearBest_AspectsImprove_How
201614,97214,194
201718,34817,320
201819,01017,968
201920,36719,239
202025,92824,174
202124,16322,944
202222,37321,060
Table 3. Distribution Of Answered Responses.
YearBest_AspectsImprove_How
AnsweredAnswered
201659%63.24%
201758.1%65.42%
201859.3%65.22%
201958.8%65.85%
202058.9%66.47%
202160.5%63.14%
202260.8%62.17%
Table 4. Top 5 Keywords per Topic Extracted Using LDA.
IndexTopic 1Topic 2Topic 3Topic 4Topic 5
0studentsupportlecturerclasslearning
1timestaffinterestingtutorialassignment
2engageprovidesrealworkproject
3collegeprovidelecturepracticalmake
4learnacademiccoursegroupemail
5getlearningassessmentsmallwork
Table 5. Top 5 Keywords per Topic Extracted Using BTM.
IndexTopic 0Topic 1Topic 2Topic 3Topic 4Topic 5Topic 6Topic 7
0informationalmicroteachinglearnonlinefascinatinghireddunnomathcalling
1instagramfieldworkuploadinganecdotecontactableexpletivecentresmaller
2eventrole_playgappedillustrateintelligentfailcenterbreakout
3campaignexperientialuploadrelatableempatheticsettlesumsize
4socsincorporatesbright_spacegraphcompetentpaidloansmall
5invitationimplementationabsentrealtalentedawfulwritingnervous
Table 6. Generated Topic Clusters from BERTopic.
TopicCountName
−16−1_eispearas_chuireann_initative_goodstart
0121,2290_student_class_lecturer_learning
14341_multiple_choice_question_test_weekly_quiz
26052_attendance_mandatory_compulsory_make
33713_session_ceim_year_first
41614_open_door_policy_open_staff_door
58815_assessment_continuous_continous_exam
61646_role_play_presentation_practice_theory
722347_good_library_facility_access
8848_curve_figure_help_difficulty
91529_club_socs_society_sport
1032110_note_gap_blackboard_lecture
1135811_employ_lecturer_part_hire
129312_whatsapp_create_chat_emailing
135813_offline_communicate_let_online
Table 7. Assessment Of Custom NER Model Performance for Different Training Data Sizes.
Size of Training DatasetPrecisionRecallF-Score
10000.660.500.57
20000.710.490.58
30000.710.510.60
Table 8. Distribution Of Entities in Each Category.
Tag or LabelExplanationCount of Entities in Training DatasetCount of Entities in Test Dataset
UNI_PERSONUniversity Personal521201
ORGOrganisations3712
LEARNING_RESOURCESTeaching and Learning Material1339607
ACTIVITYActivities and Events322198
SUPPORT&FACILITYSupport Services and Facilities482292
ONLINE_TOOLSOnline Teaching, Learning and Communicating Tools16354
Table 9. Examples of Extracted Bigrams and Trigrams.
BigramsTrigrams
ice breakermultiple choice question
marking schemeextracurricular activity
white boardthird level education
mental healthmental health service
comfort zonepower point presentation
old fashionedself directed learning
mobile phonemental health issue
curriculum vitaepower point slide
guest speakerreal world scenario
Table 10. Comparison of Identified Topics by the Models.
No.BERTopicBTMLDA
Theme/TopicKeywordsTheme/TopicKeywordsTheme/TopicKeywords
1Teaching And LearningStudent, class, lecturer, learning, lecture, work, group, tutorial, help, courseIllustrative LearningFascinating, Anecdote, Illustrate, Relatable, Graph, Story, Humor, Graphic, Image, DiagramTeaching And LearningLecturer, Real, Lecture, Course, Assessment, Engaging, Material, Example, Teaching, Topic
2Educational AmenitiesGood, library, facility, access, resource, computer, lecturer, study, online, learningDedicated Student SupportCentre, Loan, Writing, Grind, Database, Library, Printing, Support, Advisory, ServiceStudent SupportSupport, Staff, Provide, Academic, Learning, Help, Library, Approachable, Resource, Available
3Teaching and Academic StaffEmploy, lecturer, part, hire, talented, good, excellent, passionate, teaching, staffTeaching and Academic StaffContactable, Intelligent, Empathetic, Competent, Talented, Pleasant, Caring, Knowledgeable, Qualified, SkilledStudents Learning ExperienceStudent, Time, Engage, College, Learn, Event, Talk, Institution, Help, Lecturer
4Extra-Curricular ActivitiesClub, socs, society, sport, social, student, join, journal, promote, activityExtra-Curricular ActivitiesEvent, Campaign, Social, Club, Society, Conference,
Sporting,
Extracurricular,
Tour, Exhibition
In-class Activitiesclass, tutorial, work, practical, group, lecture, discussion, lab, interactive, seminar
5Applied and Experiential LearningRole_play, presentation, practice, theory, placement, discussion, powerpoint, groupwork, bring, groupApplied and Experiential LearningMicroteaching, Fieldwork, Role_Play, Experiential, Practical, Implementation, Project, Paticipatory, Clinical, PortfolioStudent Engagementlearning, assignment, project, email, exam, feedback, presentation, approach, team, active
6Student’s Individual ExperienceCurve, figure, help, difficulty, student, learning, bit, difficult, support, experiencingStudent’s Individual ExperienceExpletive, Fail, Settle, Paid, Awful, Consequence, Ignored, Fee, Repeat, Leaving_Cert
7Online Communication ChannelsWhatsapp, create, chat, emailing, idea, mentor, set, group, start, doneInteractive Digital EducationLearningonline, Uploading, Upload, Bright_Space, Recorded, Panopto, Posted, Uploaded, Recording, Slack
8Institutional ObligationsAttendance, mandatory, compulsory, make, lecture, mark, tutorial, class, lab, policyIn-Class Learning AspectsCalling, Size, Nervous, Intimate, Asking, Microphone, Camera, Question, Shy, Brainstorming
9Academic AssistanceSession, ceim, year, first, tutorial, learning, peer, leaving-cert, engineering
10Educational ResourcesNote, gap, blackboard, lecture, slide, online, class, gapped, lecturer, powerpoint
11Accessible SupportOpen_door_policy, open, staff, door, honestly, drop, student, tutor, lecturer, approachable
12Academic EvaluationsAssessment, continuous, multiple_choice_question, test, weekly, exam, continuous, assignment, quiz, regular
Table 11. Qualitative Evaluation of BERTopic Classification by Human Expert.
Sample Responses Keywords Generated by BERTopicExpert-Selected KeywordsSuggested Themes
Most of our lecturers were superb and really knew their subjectsstudent, class, lecturer, learninglecturerknowledgeable
Approachable lecturers, encouraged to engage, small class sizestudent, class, lecturer, learninglecturerclass-size, engagement
Variety of assessment types-more focus on continuous assessment rather than final exams.assessment, continuous, examAssessment, examstructure
Canvas can host a range of materials including extra supporting materials.note, gap, blackboard, lecture-VLE, content
Social media updateswhatsapp, create, chat,
emailing
-socials,
communication
Gets student involved in the learning, discussions, group work, role play etc.role, play, presentation,
practice, theory
practiceengagement, learning
Table 12. Performance of Custom NER Model.
EntitiesPrecisionRecallF1-Score
ONLINE_TOOLS0.890.770.83
UNI_PERSON0.800.810.81
ACTIVITY0.720.320.44
LEARNING_RESOURCES0.690.510.59
ORG0.670.330.44
SUPPORT&FACILITY0.620.400.49
Table 13. Extracted Entities from Each Study Group.
No.CategoryKeywords
Y1Y4PGT
1ONLINE_TOOLSBlackboard, Brightspace, Canvas, Clickers, Facebook, Interactive Polls, Kahoot, Learnsmart, Loop, MCQ Polls, Menti.Com, Moodle, Online Platforms, PanoptoLoop, Moodle, UCD Connect, Zoom, Blackboard, Brightspace, Canvas, Clicker, Facebook, Instagram, Kahoot, Online Polls, Panopto, Social Media, SulisPolls, Aws, Adobe, Blackboard, Brightspace, Canvas, Colab, Connect, Facebook, Instagram, Kahoot, Loop, Moodle, Springboard, Sulis
2UNI_PERSONLecturers, Academic Adviser(s), Academic Advisor(s), Academic Staff, Academic Tutor(s), Admin, Admin Staff, Administrative Staff, Advisory Staff, Co-Ordinators, Colleagues, Course Administrator, Course Director, Course Leaders, DemonstratorsAcademic Staff, Academic Mentors, Academic Supervisors, Co-Ordinator, Course Staff, Experts, Faculty, Head, It Staff, Lecturers, Law Lecturers, Mentors, Moderators, Professor(s)Academic Advisor(s), Academic Staff, Academic Supervisor(s), Athlone Developers, Lecturer(s), Coordinator, Course Directors, Demonstrators,
Experts, Facilitators, Faculty Staff, IT Staff, Professor(s), Tutor(s), Administrative Staff
3ACTIVITYCurricular Activities, Academic Activities, Academic Competitions, Academic Events, Academic Talks, Academic Workshops, Art Competitions, Ball Bashes, Campus Activities, Campus Events, Campus Trips, Class Debates, Class Discussion, Class Parties, Class TripsGroup Activities, Class Discussions, CV Workshops, Campus Events, Class Trips, Clinical Activities, Clubs/Events, Collaborative Projects, Critical Debates, Extra-Curricular Activities, Field Trips, Group Projects, Group Discussions, Guest Lecturers, Guest SpeakersACM Competitions, Campus Events, Class Debates, Discussion Activities, External Talks, Field Trip, GUEST SPEAKERS, Group Workshops, Industry Talks, Networking, Online Activities, Online Events, Online Webinars, Opening Days, Role Plays.
4LEARNING_RESOURCESGroupwork Assignments, Online Recordings, Group Presentations,
Problem Based Learning Worksheets, Lab Tutorials, Problem-Based Learning, Projects, In-Class Exams, Recorded Video, Notes from Lectures, Tutorial Classes, Teaching Material, Clinical Cases, Reading Tasks, Online Homework Assignments
Lectures, Practical Courses, Group Assignments, Reading Material, Notes, Revision Sheets, Virtual Learning, Online Labs, Interactive Classes, Labs, Supporting Material, Videos, Hands-On Activities, Online SessionsLecture Content, Online Study Materials, Case Study Examples, Experiential Classes, Labs And Presentations, Blended Lectures, Tutorial Classes, Practical Courses, Articles, Videos, Lecture Notes, Video Lectures, Slides, Online Books, Online Workbooks
5ORGStudent Union, Clubs, Societies
ACL, ACM, AIT, CIT, DCU, DIT, IT Carlow, IT Sligo, LIT, Maynooth, NCI, NED, NUI Galway, TCDACM, AIT, CIT, DCU, Dublin Science Gallery, IT Carlow, LIT, LYIT, NUI Galway, Sligo IT, TCD, TU Dublin, UCC, UCD
6SUPPORT&FACILITYWriting Support, Help Desk, Curve, Ceim Mentoring, Student Services, Teaching Centres, Math Centres, Career Support, Computer Facilities, Academic Writing, Support Centres, IT Classes, Breakout Rooms, Workshops, Academic ServicesAcademic Writing Centres, Academic Learning Centre, Placement Opportunities, Student Services, IT Learning Centre, Placement Career Talks, Help Centres, Tutorial Rooms, Disability Office, Counselling Support, Seminars, Space To Study, Electronic Workshops, Placements/Internship, Peer Support Learning CentreSkill Centre, Free Clubs, Computer Courses, Campus Facilities, Library Room, Drop-in Study Centre, Online Masters, Academic Writing Centres, Medical Centre, Gym, Job Fairs, FITNESS CAMPS, Library, Clubs/Societies, Academic Support Services
Disclaimer/Publisher’s Note: The statements, opinions and data contained in all publications are solely those of the individual author(s) and contributor(s) and not of MDPI and/or the editor(s). MDPI and/or the editor(s) disclaim responsibility for any injury to people or property resulting from any ideas, methods, instructions or products referred to in the content.