Abstract
The proliferation of IoT services has spurred a surge in network attacks, heightening cybersecurity concerns. Essential to network defense, intrusion detection and prevention systems (IDPSs) identify malicious activities, including denial of service (DoS), distributed denial of service (DDoS), botnet, brute force, infiltration, and Heartbleed. This study focuses on leveraging unsupervised learning for training detection models to counter these threats effectively. The proposed method utilizes basic autoencoders (bAEs) for dimensionality reduction and encompasses a three-stage detection model: one-class support vector machine (OCSVM) and deep autoencoder (dAE) attack detection, complemented by density-based spatial clustering of applications with noise (DBSCAN) for attack clustering. Accurately delineated clusters aid in mapping attack tactics. The MITRE ATT&CK framework establishes a “Cyber Threat Repository”, cataloging attacks and tactics, enabling immediate response based on priority. Leveraging preprocessed and unlabeled normal network traffic data, this approach enables the identification of novel attacks while mitigating the impact of imbalanced training data on model performance. The autoencoder method utilizes reconstruction error, OCSVM employs a kernel function to establish a hyperplane for anomaly detection, while DBSCAN employs a density-based approach to identify clusters, manage noise, accommodate diverse shapes, automatically determining cluster count, ensuring scalability, and minimizing false positives and false negatives. Evaluated on standard datasets such as CIC-IDS2017 and CSECIC-IDS2018, the proposed model outperforms existing state of art methods. Our approach achieves accuracies exceeding 98% for the two datasets, thus confirming its efficacy and effectiveness for application in efficient intrusion detection systems.
1. Introduction
The continuous growth of the Internet has led to numerous cybersecurity challenges, necessitating robust solutions to protect digital infrastructures. Intrusion detection systems (IDSs) play a crucial role by meticulously analyzing data streams such as network packets for signs of threats [1]. Positioned as the second line of defense after firewalls, as illustrated in Figure 1, IDSs utilize advanced algorithms to identify anomalies, facilitating prompt response from administrators. Beyond threat detection, Figure 2 illustrates that IDSs offer real-time monitoring, detailed analysis, instant alerts, and administrative controls, enabling organizations to stay vigilant against evolving cyber threats. In essence, an IDS is an essential component of modern cybersecurity, fortifying networks against relentless attacks in an era of escalating digital risks [2]. The proposed system architecture showcases collaborative efforts enhancing cybersecurity, with machine learning (ML) and deep learning (DL) pivotal in anomaly detection.
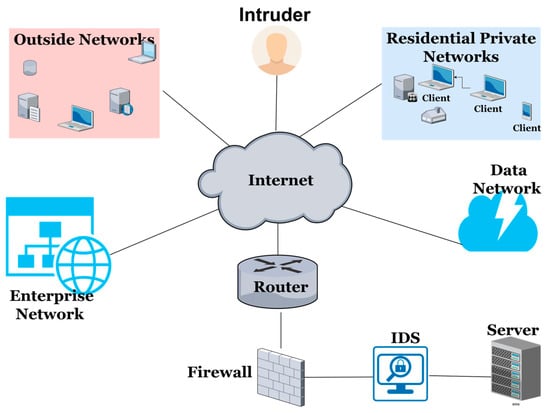
Figure 1.
Operating principles of Intrusion Detection System.
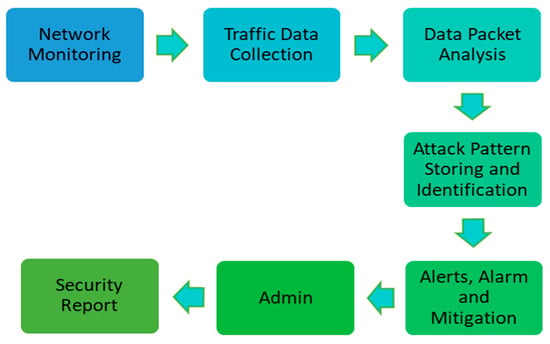
Figure 2.
Elements of intrusion detection and prevention system.
1.1. Motivation
In 2023, Douglas AutoTech Corp, Hopkinsville, KY, USA, a prominent automotive manufacturer, upgraded its entire production line to utilize IoT technology in a smart factory setup. This transformation was intended to boost efficiency and lower expenses by linking machinery, sensors, and production systems into a centralized IoT network. While the transition yielded substantial operational improvements, it also introduced several cybersecurity vulnerabilities. AutoTech Corp soon found that its IoT network had become a prime target for malicious actors using increasingly sophisticated tactics, prompting the need for strong cybersecurity measures to protect its operations.
The Bitdefender 2023 IoT Security Landscape Report underscores a significant event in 2023: a large-scale DDoS attack targeting a smart home network. The attack took advantage of weaknesses in different IoT devices, including security cameras, smart thermostats, and connected appliances. This attack interrupted the regular functioning of these devices, causing considerable inconvenience and posing a potential security threat to users. The attackers employed a botnet made up of compromised IoT devices to initiate the surge of malicious traffic. The report provides details on multiple attack vectors such as brute force, spoofing, and web-based attacks. These tactics are becoming increasingly common as the number of connected devices continues to rise. These incidents highlight the urgent requirement for strong security measures and ongoing monitoring in IoT environments to protect against emerging cyber threats.
1.2. Problem Statement
Supervised models are proficient at identifying known attacks; however, they depend significantly on the attack patterns learned during their training phase. Consequently, they find it challenging to detect unknown or emerging attacks when such threats manifest in network traffic. Special attention is devoted to novel attacks commonly known as zero-day attacks and false negatives, which can lead to undetected security breaches, heightened vulnerability, and damage to reputation [3,4]. To overcome this limitation, we have implemented an unsupervised learning approach that can detect unknown, emerging, or zero-day attack vectors. This approach, which is trained on imbalanced and unlabeled data, is capable of identifying abnormal behavior in network traffic without the need for pre-labeled attack patterns. Unsupervised learning models provide significant benefits for IDSs, especially in situations where labeled data are limited or unavailable. Unlike supervised learning, which relies on labeled datasets for training, unsupervised learning can function effectively using unlabeled data. This is particularly advantageous in the context of IDS, where acquiring a complete and precisely labeled dataset encompassing all possible attack types can be difficult and expensive.
Leveraging these techniques strengthens cybersecurity, enabling real-time risk detection and mitigation. The quality of training data profoundly affects unsupervised anomaly detection’s efficacy, emphasizing the need for diverse datasets to address traffic feature variations [5,6,7,8]. Neglecting complex data patterns can impair detection. Addressing these challenges enhances system robustness, aiding proactive cybersecurity measures against emerging threats in the digital realm.
1.3. Expected Outcomes
The proposed method initiates by employing dimensionality reduction through a basic autoencoder (bAE). This technique aims to extract encoded features from individual data categories, enhancing the efficiency of subsequent processing and analysis [9]. In its role as a stage 1 detector, the one-class support vector machine (OCSVM) utilizes the hyperparameter ν to regulate the trade-off, acting as an upper limit on the proportion of anomalies included in model training from normal network traffic.
The kernel function is designed to establish a hyperplane that effectively segregates data from the origin [10,11]. Anomalies are identified when new samples deviate to the opposite side of the hyperplane, thereby yielding a negative value in the decision function for these outlier points [12].
The OCSVM accurately classifies normal traffic, supplying essential data for the dAE neural network, forming the foundation of a stage 2 detector for effective anomaly detection. The dAE captures essential features for model training from normal network traffic. By computing the disparity between input and output, a detection threshold is set, ensuring precise discrimination between normal and abnormal traffic [13].
After passing through the OCSVM and dAE, abnormal traffic undergoes processing with DBSCAN, which serves as a stage 3 detector, forming clusters based on feature density. DBSCAN’s key parameters, such as epsilon (ε) and MinPts, influence cluster shape and density, providing the ability to identify dense clusters, handle noise, adapt to various shapes, automatically determine cluster count, scale effectively, and reduce false negatives and false positives [14]. These accurately delineated clusters can help in mapping attack tactics for intrusion prevention. Using the MITRE ATT&CK framework [15], we establish the “Cyber Threat Repository” to catalog attacks, tactics, and mitigation strategies. Detected attacks trigger immediate responses based on priority levels.
The proposed methodology focuses on employing OCSVM + dAE + DBSCAN for outlier detection. It entails analyzing the disparity between the input and output of the detection model and assessing density within the clustering model. Our novel approach involves reducing dimensions, training models, detecting anomalies, clustering them, and ultimately preventing any identified anomalies.
During dimensionality reduction, the basic autoencoder (bAE) extracts features and captures normal traffic data without supervision, resulting in unique patterns within the latent space features. In one-class SVMs, the hyperparameter “nu” (ν) governs the balance between capturing normal instances and minimizing margin violations or support vectors [10]. In anomaly detection, when test data are input, samples that fall on the wrong side of the hyperplane are identified as anomaly points. Anomalous points are determined by a decision function that yields a negative value [16]. The dAE neural network proceeds to reconstruct the input data via encoding–decoding, generating an average reconstruction error employed as the detection threshold [17]. The output of normal traffic from the OCSVM serves as input, and the mean squared error (MSE) is calculated to determine the reconstruction error. If this error surpasses the established threshold, the traffic is flagged as abnormal; otherwise, it is classified as normal [18]. Following this, abnormal traffic from both OCSVM and dAE is subjected to DBSCAN processing, which identifies clusters based on packet feature density. The critical parameters of DBSCAN, epsilon (ε) and MinPts, affect both the shape and density of the clusters [14]. Upon detection of an attack by the intrusion detection module, the intrusion prevention module is triggered to mitigate the intrusion and take necessary actions. Integrated with the MITRE ATT&CK threat intelligence framework [19], the prevention module implements resolution based on priority if the attack is already in the cyber threat repository database. However, for new attacks not in the database, cybersecurity personnel address the issue accordingly.
1.4. Key Contributions
- We introduce a novel hybrid algorithm rooted in deep learning principles. It initiates with raw traffic data, utilizing autoencoder for dimensionality reduction.
- Our hybrid algorithm employs a one-class SVM and a deep autoencoder neural network to distinguish between non-attack and attack data. Identified attacks undergo processing using DBSCAN to form precise attack clusters.
- Upon detection of attacks, the MITRE ATT&CK-based prevention system is activated to respond accordingly.
- Validation entails assessing enhanced metrics such as accuracy, precision, specificity, recall, F-measure, false negative rate (FNR), prevention rate, priority-based blocking rate, and success rate on two datasets, namely, CSECIC-IDS2018 and CIC-IDS2017.
This research article unfolds as follows: Section 1 covers intrusion detection basics and prerequisites. Section 2 explores the current literature. Section 3 describes the datasets utilized, Section 4 details our novel method, while Section 5 scrutinizes the results as well as the comparative analysis with state-of-art methods. Finally, Section 6 concludes our paper, offering insights and suggesting future research directions.
2. Related Works
Intrusion detection systems (IDSs) are classified into host-based (HIDS) and network-based (NIDS) types. An HIDS analyzes host data like operating system logs, while an NIDS monitors network traffic for detecting malicious activities [20]. This study focuses on NIDSs, due to their crucial role in network security. Supervised IDS methods, necessitating labeled datasets, face challenges with deep learning’s data hunger, especially in imbalanced data scenarios. A solution is the semi-supervised anomaly-based NIDS, trained solely on normal data [1,21]. This method quantifies abnormality levels, thus identifying potential anomalies by elevated anomaly scores, enhancing adaptability and effectiveness in threat mitigation.
Supervised learning in abnormal traffic detection deploys machine learning algorithms to classify data, identifying and flagging unusual patterns in the dataset [22,23]. Several researchers [24] have developed NIDSs based on machine learning and deep learning, owing to their impressive performance.
Fan et al. in [25] presented the RF-SVM-IL framework for detecting DDoS attacks, utilizing random forest (RF) and support vector machine (SVM) for classifying dual traffic data. They incorporated an incremental learning (IL) algorithm to sift through extra input samples, thereby lessening computational burden and improving the model’s capacity to precisely categorize traffic, especially under high attack volumes. However, the article notes that while SVMs can manage high-dimensional data, their training space and computational complexity increase significantly with larger datasets. This results in limited processing capacity for handling large-scale data.
Yaras S et al. [26] introduces a hybrid deep learning algorithm that integrates convolutional neural network (CNN) and long short-term memory (LSTM) models for detecting DDoS attacks. The methodology includes preprocessing and feature selection on the CICIoT2023 and TON_IOT datasets, followed by testing the algorithm in both binary and multiclass scenarios. The dataset comprises diverse IoT attacks collected from real-world environments. The algorithm achieved impressive accuracy rates: 99.995% for detecting attacks and 99.96% for identifying attack types with CICIoT2023, and 98.75% with TON_IOT. This approach offers advantages by harnessing the capabilities of both CNNs and LSTM, resulting in superior detection accuracy and a minimal false positive rate. However, employing extensive datasets amplifies both training and testing durations. Future avenues include refining algorithm parameters through metaheuristic techniques and streamlining training processes to build efficient, cost-effective intrusion detection systems. The study makes a substantial contribution to the literature by establishing a benchmark for future research in the field.
Harahsheh K et al. [27] presents a hybrid feature selection approach tailored for IoT environments, utilizing the InSDN dataset. The approach includes multiple stages: preprocessing the data, reducing dimensions, selecting features, evaluating models, and incorporating a caching mechanism to improve efficiency. Random forest is utilized for both ranking features and detecting anomalies. The study bases its analysis on the InSDN dataset, which comprises 343,889 records of normal and various attack traffic. The method achieves exceptionally high accuracy (99.99%) at a minimal computational cost (0.8599 s) and effectively reduces the feature set from 84 to 11, making it well suited for IoT environments with limited resources. However, the method’s dependence on stable feature counts for caching could be problematic if column content changes while the feature count remains constant. Future research will aim to investigate the data within columns to overcome this limitation and further enhance feature selection methods for improved accuracy and efficiency.
Javed A et al. [28] introduces a holistic approach to enhance intrusion detection systems (IDSs) in IoT environments. The authors employed the TON_IoT dataset, which consists of 461,043 instances and encompasses various attack categories, simulating behaviors at the edge, fog, and cloud levels. The methods included feature scaling, label encoding, chi-square for feature selection, and principal component analysis (PCA) for feature extraction. The random forest algorithm was selected for its robustness in handling continuous and categorical data, its capability to manage missing values effectively, and its ability to parallelize computations. The proposed model attained a 99.99% accuracy with a computational cost of 0.8599 s, utilizing only 11 features. Benefits include achieving high accuracy and efficiency in environments with limited resources. However, the approach’s applicability to diverse environmental conditions is restricted. Future research aims to enhance the methodology by delving into column-specific data analysis, broadening the range of attack types, and extracting additional network parameters from IoT devices.
Liao et al. in [29] devised an ensemble framework incorporating various autoencoders (AEs) and generative adversarial networks (GANs). The framework integrates traditional AE (tAE), variational AE (vAE), convolutional AE (cAE), convolutional variational AE (cvAE), and a GAN. A weighted average ensemble aggregates anomaly scores derived from multiple models’ reconstruction errors post-training. By comparing scores to a predefined threshold, samples are classified. Experimental results showcase superior performance of the ensemble model over single models, prompting the collaborative use of multiple detectors for anomaly identification. However, handling the complexity and computational resources needed for ensemble methods can pose challenges.
Almaraz-Rivera J.G. et al. [30] introduces a network-based intrusion detection system (IDS) designed to safeguard IoT networks against distributed denial-of-service (DDoS) attacks. The methodology includes generating synthetic images using flow-level traffic data from the LATAM-DDoS-IoT and Bot-IoT datasets and exploring both supervised and self-supervised learning approaches. The findings reveal that in specific tests, self-supervised learning outperforms supervised learning, demonstrating a 4.83% improvement in F1-measure and a 14.61% increase in accuracy for multiclass protocol classification. The article emphasizes the benefits of self-supervised learning, including its ability to eliminate the requirement for extensive labeled data and its capacity for robust generalization. However, it also acknowledges the challenges in generalizing, particularly in dynamic threat landscapes with emerging attack types. Future research directions aim to refine training frameworks for contrastive learning experiments and to delve deeper into visual representations within cybersecurity domains.
Ansam Khraisat et al. [31] introduce a novel hybrid intrusion detection system that integrates the C5.0 decision tree classifier and the one-class support vector machine (OC-SVM) to improve detection accuracy and minimize false alarms. This hybrid approach harnesses the advantages of both anomaly-based and signature-based detection methods. The techniques utilized include the stacking ensemble technique, which combines multiple machine learning approaches to improve the effectiveness of intrusion detection systems. The evaluation utilizes the Network Security Laboratory-Knowledge Discovery in Databases (NSL-KDD) and Australian Defense Force Academy (ADFA) datasets, recognized as benchmark datasets for intrusion detection. The proposed HIDS offers advantages such as high detection accuracy and low false alarm rates, effective for detecting both well-known intrusions and zero-day attacks. The system surpasses traditional IDS models by leveraging the combined strengths of SIDSs (signature-based intrusion detection systems) and AIDSs (anomaly-based intrusion detection systems). However, a notable drawback is the risk of high false alarm rates, particularly in dynamic and evolving cyber-attack environments. The authors propose future research directions that include refining the feature selection process and integrating advanced attack detection techniques to further enhance detection accuracy.
Shafin S.S. et al. [32] presents a deep learning-based detection system designed to identify obfuscated memory malware (OMM), specifically tailored for resource-constrained environments such as IoT devices. The system utilizes a hybrid architecture that integrates convolutional neural networks (CNNs) and bidirectional long short-term memory (Bi-LSTM) networks to manage the detection and classification of various types of obfuscated memory malware (OMM). The study developed two models, CompactCBL and RobustCBL, incorporating a structure consisting of a two-layer CNN followed by a two-layer Bi-LSTM block. A thorough tuning of model parameters was carried out to optimize performance while considering resource constraints. The models underwent evaluation using the CIC-Malmem-2022 dataset, which encompasses diverse malware types such as ransomware, spyware, and trojans. The proposed models demonstrate superior performance in terms of detection accuracy and efficiency compared to existing methods. They are lightweight and ideal for deployment on IoT devices, with the CompactCBL model especially notable for its compact size of 577 kB. The study highlights challenges in attaining high accuracy for detecting specific attack types within the OMM category. Future work will aim to improve detection accuracy for specific attack types and unknown (zero-day) attacks by employing semi-supervised and unsupervised learning models.
Ravi and Shalinie in [33] introduce an innovative security framework for intrusion detection and mitigation in IoT networks, utilizing a semi-supervised learning approach. This approach integrates labeled and unlabeled data to improve detection accuracy and enhance model robustness. The framework uses feature selection techniques that combine Pearson correlation, rank-based chi-square, and score correlation to identify relevant features. It then applies an extreme gradient ensemble boosting method to categorize attack types. The framework underwent evaluation using the USNW-NB15, NSL-KDD, and CCIDS2017 datasets, recognized as standard benchmarks in intrusion detection systems. The proposed method achieved high accuracy rates: 99.96% for USNW-NB15, 97.48% for NSL-KDD, and 99.93% for CCIDS2017. Its minimal computational complexity and high detection rate make it well suited for real-time IoT security applications. Yet, challenges arise from the potential misclassification stemming from the varied and dynamic nature of IoT network traffic, compounded by the model’s dependence on the quality and representativeness of labeled data. Future avenues for research encompass refining feature selection methodologies, incorporating advanced machine learning algorithms, and investigating blockchain applications for decentralized security enhancements within IoT networks.
Li, Meng, and Au, in [34], present an approach to enhance collaborative intrusion detection systems (CIDSs) in IoT environments through the application of semi-supervised learning. The study aims to overcome the issue of insufficient labeled data by harnessing unlabeled data. The DAS-CIDS system employs a semi-supervised learning algorithm based on disagreements. This method enables the system to leverage large quantities of unlabeled data to improve detection performance, minimizing the need for extensive human intervention in the labeling process. The authors assessed the effectiveness of DAS-CIDS through evaluations using simulated datasets and real-world IoT network environments, focusing on intrusion detection efficacy and false alarm reduction. The key benefit of DAS-CIDS lies in its automatic utilization of unlabeled data, thereby reducing the dependence on expensive and labor-intensive labeled data acquisition. As a result, it achieves enhanced detection performance and significantly lowers false alarm rates compared to conventional supervised classifiers. The study highlights concern regarding the algorithm’s applicability across various IoT environments and underscores the necessity for additional testing to ensure its scalability and robustness. The authors propose investigating advanced semi-supervised learning methods and improving the system’s ability to adapt to diverse IoT environments. Furthermore, future research should consider integrating alternative machine learning algorithms and enhancing the system’s scalability.
In the work [35], Kwon et al. present a framework named Cyber Threat Dictionary (CTD), which maps attacks to defense mechanisms, aligning the MITRE ATT&CK matrix with the NIST framework. The CTD comprises a search engine offering attack details and solutions, along with a suggestion component for providing appropriate countermeasures.
The current studies offer promising approaches to IoT intrusion detection; however, they also demonstrate significant shortcomings. Yaras et al. [26] achieve high accuracy using CNN and LSTM models but encounter extended training durations attributed to large datasets. Harahsheh et al. [27] illustrate vulnerabilities in feature caching stability, affecting consistency when there are changes in dataset content. Javed et al. [28] demonstrate significant accuracy using random forest, yet their approach is constrained in its adaptability to various IoT environments. Liao et al. [29] exhibit superior performance through their ensemble framework, yet they face difficulties in handling the complexity and computational resources necessary for effectively implementing ensemble methods. Almaraz-Rivera et al. [30] face difficulties in achieving generalized self-supervised learning across new attack types. Ansam Khraisat et al. [31] achieve high accuracy but still experience significant false alarms in dynamic cyber-attack scenarios. Shafin S.S. et al. [32] encounter challenges in achieving consistent accuracy in detecting OMM and zero-day attacks.
Considering earlier investigations, crafting an efficient intrusion detection and prevention system (IDPS) requires tackling feature engineering for high-dimensional data and choosing potent detectors. In this study, we present a pioneering method employing autoencoders (AEs) and three distinct anomaly detectors, enhancing IDPS efficacy in identifying and mitigating potential security threats to network integrity.
3. Dataset
3.1. CSECIC-IDS2018
In 2018, the Canadian Institute of Cybersecurity (CIC) collaborated with the Communications Security Establishment (CSE) to develop the CSECIC-IDS2018 dataset [36]. Initially intended for evaluating intrusion detection research, it has evolved into a crucial benchmark for assessing IDSs. This carefully curated dataset mirrors real-world cyber threats and attacks, offering a range of scenarios for thorough analysis. Its importance stems from its ability to simulate intricate network environments, enabling both academics and practitioners to effectively assess and enhance intrusion detection systems. The dataset was gathered over a span of ten days, encompassing 80 columns, seven attack families, and fifteen distinct attack types. As shown in Table 1, it meets critical criteria such as overall traffic volume, a variety of attack types, and thorough labeling. The simulated attacks targeted an infrastructure consisting of 50 machines within an organization composed of five departments, 420 machines, and 30 servers. The dataset contains detailed records of network traffic and system logs for individual machines, utilizing CICFlowMeter-V3 to extract 80 attributes. The CSECIC-IDS2018 dataset comprises ten CSV files, encompassing 16,232,943 instances and 80 features. The distribution of attacks is shown in Figure 3.

Table 1.
CSECIC-IDS2018 dataset network traffic.
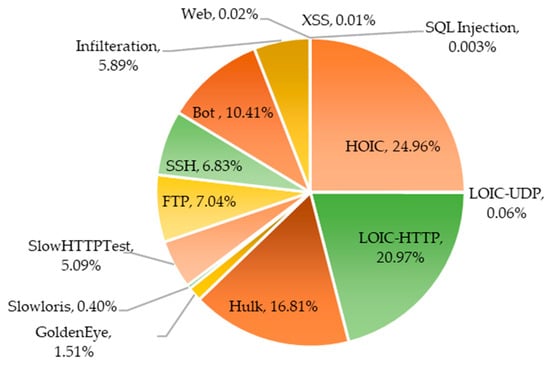
Figure 3.
Distribution of attacks in CSECIC-IDS2018 dataset.
3.2. CIC-IDS2017
The CIC-IDS2017 dataset, created by the Canadian Institute of Cyber Security (CIC) [36], profiles intrusion traffic using a simulated attack scenario involving seven attack families. The testbed infrastructure was partitioned into an attack network and a victim network, each equipped with standard devices such as firewalls, routers, switches, and a variety of operating systems (including Linux, Windows, and Macintosh). The dataset emphasizes a wide range of attacks, anonymity, inclusion of protocols, comprehensive traffic capture, network configuration details, metadata, labeled data samples, and diverse feature characteristics. In contrast to the restricted attack categories found in KDDCUP99 and NSL-KDD, the CIC-IDS2017 dataset encompasses a wider spectrum of attacks, including DDoS, DoS, brute force, XSS, SQL injection, botnet activities, web attacks, and infiltration attempts, as shown in Table 2. The dataset consists of 2,830,540 labeled flows, each containing 83 features categorized using the CICFlowMeter V4.0 tool, resulting in a dataset that is high-dimensional, multiclass, and imbalanced.

Table 2.
CIC-IDS2017 dataset network traffic.
4. Proposed Method for Intrusion Detection and Prevention
The proposed model for intrusion detection and prevention (IDP), which integrates bAE + OCSVM + dAE + DBSCAN + ATT&CK, referred to as hybrid IDPS, has been meticulously designed with a comprehensive structure encompassing key phases in the realm of cybersecurity. The model’s framework includes traffic data preprocessing, feature extraction, training the detection model, conducting anomaly detection, and clustering and preventing attacks. This model adopts a hybrid approach, integrating a deep learning algorithm that incorporates various techniques for enhanced cybersecurity measures.
In the dimensionality reduction phase, the basic autoencoder (bAE) is employed to effectively reduce the number of dimensions. A one-class Support vector machine (OCSVM) is utilized for detecting anomalies, providing a robust mechanism during the training phase of the model. Additionally, the deep autoencoder (dAE) is employed for identifying abnormal behavior, with a specific focus on minimizing false negatives. The root mean square propagation (RMSP) algorithm serves as the optimization technique, contributing to the efficiency of the overall model.
The model’s capacity for handling anomaly attacks is strengthened through the application of the DBSCAN algorithm during the clustering phase. Moreover, prevention strategies are integrated into the model, drawing on the insights and methodologies provided by the MITRE ATT&CK framework.
The architectural diagram of the proposed model, in Figure 4 further illustrates the intricate structure that integrates various techniques for a robust cybersecurity solution.
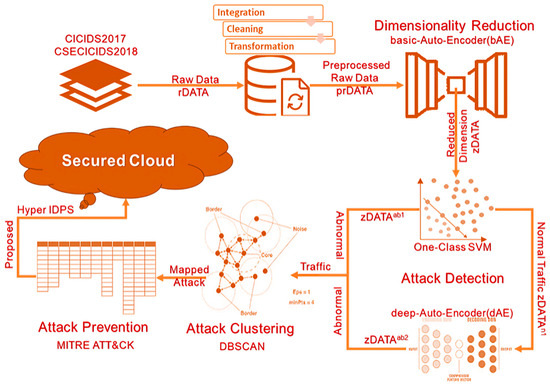
Figure 4.
Architecture of the proposed model.
4.1. Data Preparation
The data preparation module has concentrated on three key segments:
- Collecting data;
- Preprocessing data;
- Reducing dimensionality.
4.1.1. Data Collection
Data collection for intrusion detection systems (IDSs) involves consolidating raw data from diverse sources, including network traffic and system logs. Integration of incident information and external threat feeds enhances IDS capabilities. Despite challenges in real-world adoption, systematic dataset generation addresses testing limitations. Datasets like DARPA, KDD Cup 1999, NSL-KDD, ISCX IDS 2012, UNSW-NB15, CIC-IDS2017, and CSECIC-IDS2018 support research, facilitating intrusion detection system evaluation. In this research, raw data “rDATA” is derived from the CIC-IDS2017 and CSECIC-IDS2018 datasets, chosen for their contemporaneity and representation of real-world data.
4.1.2. Data Preprocessing
Data preprocessing is crucial post-collection, especially in machine learning. ISCX offers datasets like CIC-IDS2017 and CSECIC-IDS2018 in CSV format, containing benign and attack traffic. Normalization is vital due to undistributed histogram data, ensuring uniform scale via Z-score standardization. Each data point’s Z-score (Zi) is calculated using the mean (μ) and standard deviation (σ) of the dataset as expressed by the formula in Equation (1):
4.1.3. Dimensionality Reduction
The preprocessed data, labeled as “prDATA” and comprising seventy-six features, undergoes dimensionality reduction through the basic autoencoder (bAE) as depicted in Figure 5. As a feature extraction technique, bAE systematically reduces dimensionality while considering all features’ influence on the outcome. This process involves three internal submodules: the encoder, decoder, and loss function. Together, they contribute to extracting essential features, resulting in a condensed feature representation.
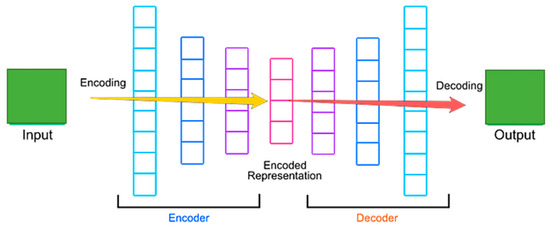
Figure 5.
The architecture of the proposed autoencoder.
The encoder transforms “prDATA” into a lower-dimensional “zDATA” using weights W and biases b with an activation function f. Among activation functions, the rectified linear unit (ReLU) is represented as max(0, prDATA), while the sigmoid activation function is defined as in Equation (2):
ReLU and sigmoid introduce non-linearity into the model’s output. The decoder aims to reconstruct the original input data “rcDATA” from “zDATA” using weights W and biases b with another activation function “g”. The loss function, typically the mean squared error (MSE), quantifies the disparity between “prDATA” and “rcDATA”. The reconstruction formula is defined in Equation (3) as follows:
After dimensionality reduction, the features, now in “zDATA”, are ready for further processing. These reduced-dimensional data points, derived from the latent space, are crucial for subsequent analytical and modeling tasks.
4.2. Detection Stage 1: OCSVM
One-class support vector machine (OCSVM) is a distinctive method in one-class classification, focusing solely on a singular data class, unlike binary or multiclass methods [12]. After training, the model assesses whether a new sample belongs to the designated target class. OCSVM operates in a high-dimensional kernel space F by transforming samples from “zDATA” using a mapping function ϕ. The inner product within F is computed using a kernel function k aiming to find a hyperplane that maximizes the separation between data and the origin. OCSVM addresses a quadratic problem, formulating a hyperplane with a weight vector w and margin ρ, allowing for soft margins via non-negative slack variables ε. The hyperparameter ν controls the trade-off, acting as an upper limit on the proportion of anomalies. In the OCSVM framework, w signifies the weight vector of the hyperplane, and ρ represents the margin. The inclusion of non-negative slack variables ε introduces flexibility by permitting some samples to extend beyond the hyperplane, softening the margin. The hyperparameter ν, constrained within (0, 1), plays a crucial role in balancing the trade-off and acts as an upper limit on the proportion of anomalies, affecting the model’s sensitivity to outliers. The Gaussian kernel function, as employed in Equation (4), effectively represents data in the kernel space, with the hyperparameter γ controlling the shape of the decision boundary in the feature space. Following problem resolution, the decision function f(x) is calculated for a given testing sample as in Equation (5):
Anomalies are identified, as illustrated in Figure 6, when new samples fall on the incorrect side of the hyperplane, resulting in negative values in the decision function for anomalous points, denoted as “zDATAab1”. Conversely, normal samples positioned correctly on the hyperplane yield positive values in the decision function, denoted as “zDATAn1”.
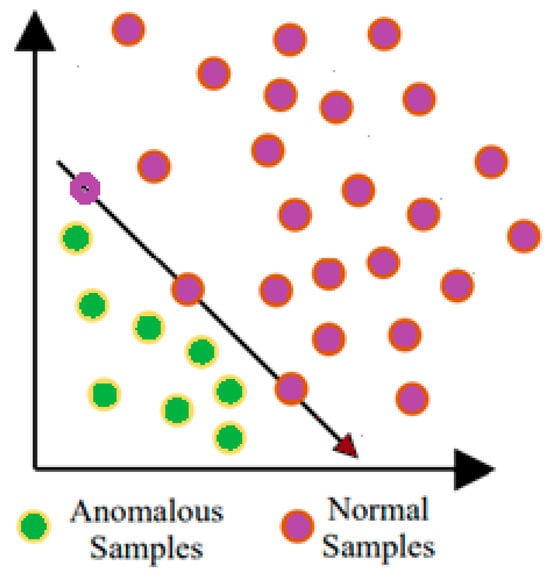
Figure 6.
One-class support vector machine illustration.
4.3. Detection Stage 2: OCSVM + Deep Autoencoder (dAE)
The deep autoencoder (dAE) is pivotal in the second stage of our detection process. Its design focuses on operating as a deep learning classifier, adept at handling lower-dimensional data, especially in clustered data scenarios. This section outlines how the dAE leverages its capabilities to effectively differentiate between normal and anomalous traffic.
4.3.1. Input Data and Classification
In the context of normal traffic, represented by zDATAn1, the output from the OCSVM classifies normal traffic, supplying essential data for the dAE neural network, and the dAE emerges as a deep learning classifier. The dAE is trained primarily on non-attack packet data, improving its capacity to identify normal patterns and behaviors effectively.
4.3.2. Deep Learning Classifier
It thrives on processing lower-dimensional data, which showcases optimal performance, especially in clustered data scenarios. Its prowess lies in capturing meaningful patterns and behaviors, making it adept at discerning normal observations. Focused solely on non-attack packet data, the dAE stands out in this domain by effectively classifying attacks through its learned knowledge from the training dataset.
4.3.3. Training Process
Operating through the iterative process of backpropagation, the deep autoencoder leverages training data results to learn, involving both decoder and forward propagation phases. These phases constitute stages of the encoder, visually depicted in Figure 5. With a Z-dimensional vector, the encoder function (e) is defined in Equation (6). Encoded data undergo processing, reverse-propagating for decoding using the original data. The decoder function (d) is parameterized as shown in Equation (7), enabling multiple encode and decode processes on hidden layers. During training, the objective is to minimize the mean squared error between the input data and the reconstructed output. This ensures that the model effectively captures the key features and patterns of normal traffic. This reconstruction error indicates the model’s ability to accurately reconstruct normal data.
4.3.4. Backpropagation and Cost Minimization
Backpropagation on encoded data occurs using a mean squared error cost minimizer. This process is utilized on test data as well. The goal is to reduce the reconstruction error, thus enhancing the model’s accuracy. The comprehensive procedure can be outlined by integrating both the encoder and decoder functions, as depicted in Equation (8):
4.3.5. Establishing the Threshold
After completing the training process, the distribution of reconstruction errors pertaining to the normal data is analyzed. Typically, this distribution reveals a clustering of low reconstruction errors, demonstrating the model’s effectiveness in reconstructing normal traffic. To determine the anomaly detection threshold, the standard deviation method is used on the reconstruction errors.
4.3.6. Output and Classification
During the detection phase, the dAE handles new incoming data, which could comprise both normal and anomalous samples. When a new instance is input to the dAE, it undergoes encoding followed by decoding using the learned functions e and d. If the instance is normal, the reconstruction error will be minimal, reflecting the model’s familiarity with normal data pattern. In contrast, anomalous data points will not align well with the learned patterns of the dAE. When an anomalous sample undergoes encoding and decoding, the reconstruction error will be notably higher due to the model’s lack of training on these patterns. The elevated reconstruction error serves as a signal or indicator of an anomaly occurring. The data points characterized by high reconstruction errors are identified as abnormal and categorized under “zDATAab2”.
The output “zDATAab2” from the dAE algorithm represents the classified attack data. The algorithm efficiently reduces the mean squared error, thereby improving its capability to accurately classify normal and anomalous traffic.
4.4. Detection Stage 3: OCSVM + dAE + DBSCAN Clustering
In this research, DBSCAN is utilized due to its robustness in handling noise and its capability to identify clusters of arbitrary shapes without needing a predefined number of clusters. Moreover, its flexibility in parameter tuning and scalability are essential for enhancing the effectiveness of intrusion detection. This section explains how DBSCAN applies these capabilities to effectively cluster both normal traffic and various attack anomalies.
The outputs “zDATAab1” from OCSVM and “zDATAab2” from stage 2 dAE, respectively, contain information about attack patterns, representing points within the output space. DBSCAN operates on these data using the ε (epsilon) and MinPts parameters, initiating its clustering process from an unvisited point. The ε parameter defines the maximum distance for considering neighborhood points, essentially setting a radius for each point. DBSCAN identifies clusters by retrieving ε-neighborhoods, forming clusters if they are sufficiently populated, otherwise classifying as noise. MinPts signifies the minimum number of samples required for a point to be considered a core point, which serves as the central element within dense regions. The fit method assigns clusters based on density, expanding to densely populated ε-neighborhoods. This iterative process continues until the entire density-connected cluster is identified. New unvisited points are sequentially processed, potentially revealing additional clusters or noise. DBSCAN optimizes clustering by minimizing the number of clusters from all possible clustering within the dataset. It ensures that each pair of points within a cluster is density-reachable, maintaining the original properties of clusters in terms of “maximality” and “connectivity”.
4.5. Prevention: MITRE ATT&CK
Utilizing the MITRE ATT&CK framework, we establish a comprehensive database, referred to as the “Cyber Threat Repository”, cataloging various attacks alongside associated tactics, assigned priorities, and corresponding mitigation strategies. As shown in Figure 7, upon detecting a potential attack, if it matches an entry within the repository, its priority level is promptly identified for subsequent actions. Attacks deemed high-priority trigger an immediate response, where the identified data traffic is swiftly intercepted and blocked by the “Security Enforcement Gateway”, while simultaneous notifications are dispatched to relevant stakeholders. Conversely, low-priority incidents prompt the redirection of associated data traffic to a designated repository known as the “Incident Log Database”, facilitating subsequent analysis and prompting alerts to cybersecurity personnel for targeted mitigation measures in accordance with the repository’s guidance.
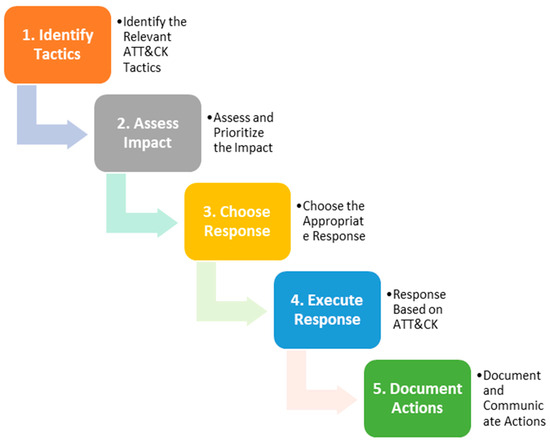
Figure 7.
MITRE ATT&CK response process.
The suggested model can be implemented by placing it between the firewall and the network router. This allows for it to predict potential attacks within the network after being trained on actual data sourced from the network. The data are collected, prepared, and utilized for training the model. The trained model has the capability to analyze the data flowing through the network in real time.
5. Results
The suggested approach undergoes evaluation on the seven attacks within each dataset as shown in Table 3, utilizing the CSECIC-IDS2018 and CIC-IDS2017 [36] intrusion detection datasets. The evaluation entails contrasting the proposed model with standard clustering techniques (OPTICS [37], fuzzy C-means [38], K-means [39], and hierarchical [40]) using un-clustered data, followed by a performance assessment.

Table 3.
Experimental samples.
5.1. Experimental Dataset Usage
Table 3 displays the dataset utilized and the components of selected samples for this study, while Table 4 shows the configuration of hyperparameters. Performance metrics are evaluated to gauge the effectiveness of the intrusion detection model, utilizing a confusion matrix. This assessment includes accuracy, precision, recall, specificity, false negative rate, and F-score.

Table 4.
Hyperparameter configuration.
Precision, as defined in Equation (9), measures the accuracy of optimistic predictions. Recall, represented by Equation (10), captures the ability of the model to correctly classify positive instances. Specificity, outlined in Equation (11), provides valuable insights into the model’s effectiveness in identifying instances of the negative class accurately. The F-score, presented in Equation (12), offers a comprehensive evaluation metric that balances precision and recall. Accuracy, as indicated in Equation (13), quantifies the proportion of correct classifications made by the model. The false negative rate (FNR), or miss rate, quantifies the percentage of actual positive instances incorrectly identified as negatives by the model, as defined in Equation (14).
In evaluating the efficacy of the prevention model, key performance indicators including prevention rate, priority-based blocking rate, and success rate are employed. The prevention rate, as depicted in Equation (15), signifies the proportion of thwarted threats. The priority-based blocking rate, illustrated in Equation (16), focuses on intercepting high-priority threats. Equation (17) measures the overall effectiveness of the model. These metrics offer valuable insights into the model’s ability to mitigate threats and prioritize actions, crucial for effective cybersecurity management and risk mitigation strategies:
The effective performance of the model hinges on critical elements like the suitable architecture and hyperparameter configurations of the detection model. A series of comprehensive experiments were carried out to identify the most effective hyperparameter configurations. The bAE in the proposed method is composed of a solitary input layer and a sole output layer. The OCSVM model is designed with a single class, while the dAE consists of three latent space. These layers are structured with unit sizes tailored to align with the loss function, ensuring an optimal fit with the varying dimensions of features present within the training data.
5.2. Training and Testing of Detection Model
In this methodology, the dataset is split into training (70%) and testing (30%) subsets. The model training includes the utilization of a Gaussian kernel function to ensure effective representation of data in the kernel space for OCSVM. The initial value of the “nu” parameter (v) is set to 0.5 and adjusted through cross-validation, resulting in “nu” being set to 0.95. Early stopping criteria are implemented in dAE to determine the optimal epoch count. Additionally, ReLU serves as the activation function, while Adam optimization with a learning rate of 0.001 aids in model optimization during training.
5.3. Evaluation on Stage 1: OCSVM
Based on the results of detection stage 1 using OCSVM, we analyze the metrics depicted in confusion matrix Figure 8 for CSECIC-IDS2018 and Figure 9 for CIC-IDS2017. The model calculates the performance metrics as illustrated in Figure 10. The significant count of true negatives (2,316,485) demonstrates the model’s effectiveness in identifying normal traffic accurately as non-attacks, highlighting its strong capability in distinguishing non-malicious activities. The false negatives (12,624) indicate cases where the model failed to detect actual attacks. While relatively low compared to true positives and true negatives, this number remains critical as missed detections could lead to undetected attacks.
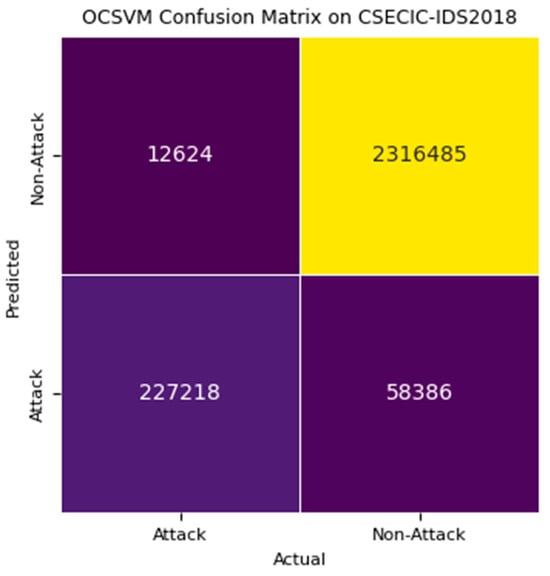
Figure 8.
Confusion matrix of detection stage 1 OCSVM on CSECIC-IDS2018.
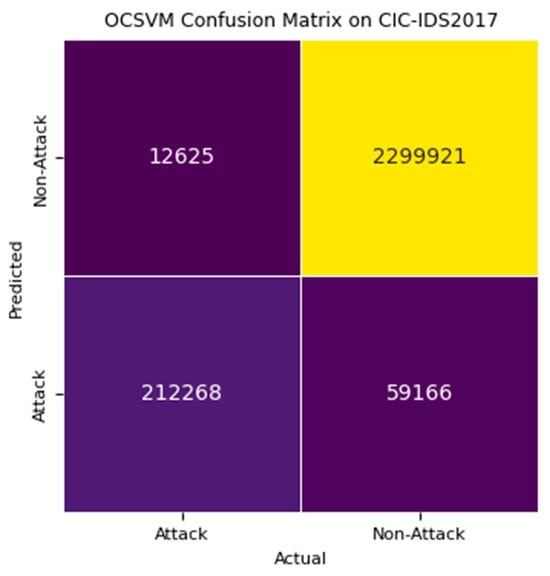
Figure 9.
Confusion matrix of detection stage 1 OCSVM on CIC-IDS2017.
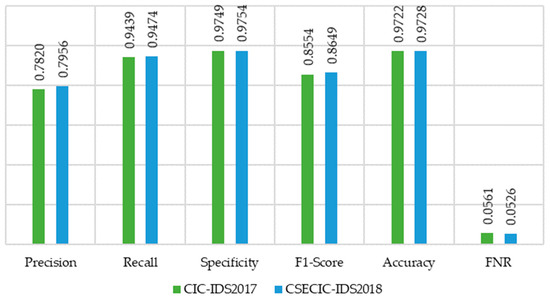
Figure 10.
Performance measures of stage 1 detection OCSVM.
The model’s high number of true positives (212,268) demonstrates its capability to accurately identify a substantial portion of attacks. This positive aspect highlights the model’s reliability in identifying malicious activities, thereby contributing significantly to its high recall rate. The false positives (59,166) represent cases where normal traffic was mistakenly classified as an attack. This is problematic because false positives can result in unnecessary alerts, leading to potential alarm fatigue and challenges in resource allocation.
The higher incidence of false positives suggests that although the model is adept at detecting attacks, it tends to be overly cautious, labeling benign traffic as malicious. The assessment of detection accuracy in OCSVM relies on the “nu” parameter, which regulates the balance between model complexity (flexibility) and the acceptance of margin violations. The current “nu” parameter (set to 0.95) in the OCSVM model creates a decision boundary that is overly stringent, leading normal traffic patterns to be misclassified as attack patterns. To optimize performance, we adjusted the “nu” parameter to 0.1, thereby relaxing the model’s strictness and enhancing precision and specificity. Although the precision is moderately high, there is still room for improvement to meet elevated standards. However, this adjustment does affect other metrics. To mitigate false negatives overlooked by the OCSVM model and decrease the false positive rate, we implemented a hybrid approach incorporating a deep autoencoder (dAE) in the subsequent detection stage. The dAE model effectively identifies normal patterns, thereby enhancing overall accuracy, recall, and specificity.
5.4. Evaluation on Stage 2: OCSVM + Deep Autoencoder (dAE)
The deep autoencoder (dAE) model operates as the second stage in the intrusion detection system, handling data flagged as negative by the stage 1 one-class SVM (OCSVM). The evaluation of detection stage 2, dAE, utilizes mean squared error (MSE) as the loss function, with a threshold value established at 0.0219. Figure 11 illustrates the stage 2 dAE detection model’s loss function, where this research utilized a three-latent-space dAE, 40 epochs, 32 batches, and the Adam optimizer with a learning rate of 0.001 and patience of 8. The stage 2 dAE model’s confusion matrix is shown in Figure 12 and Figure 13 and its performance is depicted in Figure 14 across the CIC-IDS2017 and CSECIC-IDS2018 datasets, showcasing the effectiveness of the model. The detection model, constructed using both “Normal” and “Attack” data from these datasets, demonstrates significant performance across both datasets. The experimental results highlight its notable performance, which is comparatively higher than that of the stage 1 OCSVM.
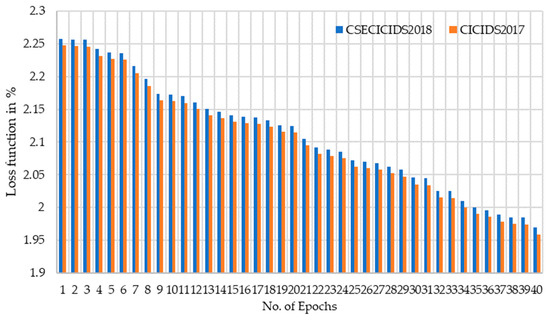
Figure 11.
Detection stage 2 OCSVM + dAE model loss function.
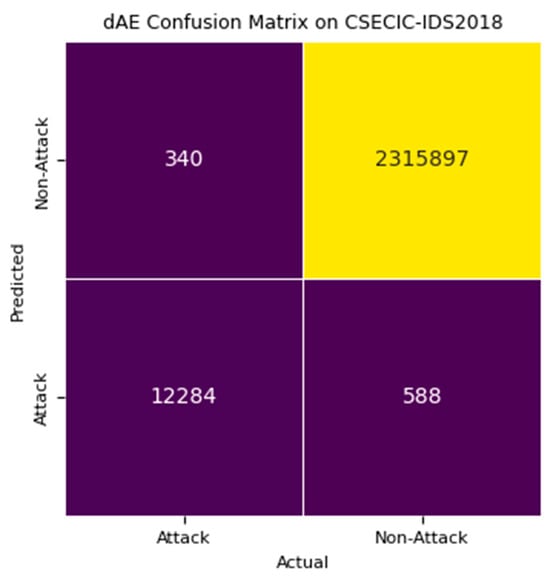
Figure 12.
Confusion matrix of detection stage 2 OCSVM + dAE on CSECIC-IDS2018.
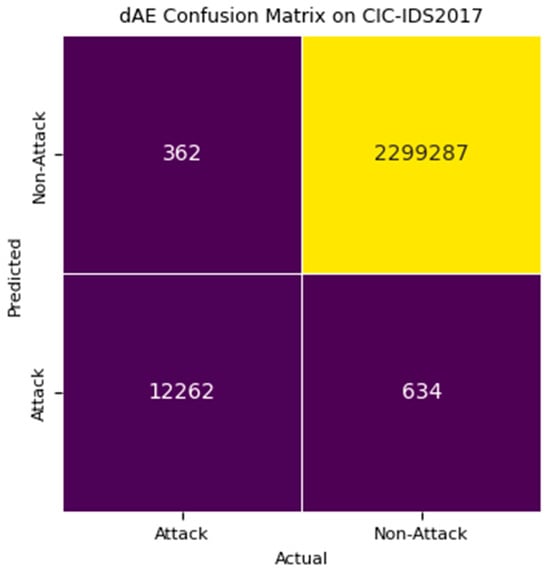
Figure 13.
Confusion matrix of detection stage 2 OCSVM + dAE on CIC-IDS2017.
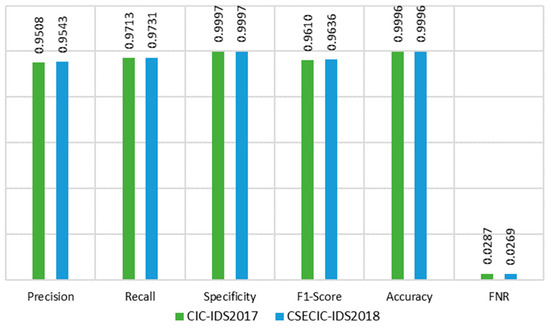
Figure 14.
Performance measures of stage 2 detection OCSVM + dAE.
The dAE demonstrates improved performance metrics across precision, recall, specificity, F1-score, and accuracy for both the CIC-IDS2017 and CSECIC-IDS2018 datasets, as depicted in Figure 14. Moreover, it notably reduces false positives, enhancing its ability to differentiate between normal and attack traffic beyond the initial screening by OCSVM. With a reduced false negative rate, the dAE enhances overall detection capabilities, highlighting its role in improving the reliability and efficiency of intrusion detection systems.
5.5. Evaluation on Stage 3: OCSVM + dAE + DBSCAN
The DBSCAN model operates as the third stage in the intrusion detection system, handling data flagged as positive by the stage 1 one-class SVM (OCSVM) and stage 2 dAE. The evaluation of the stage 3 DBSCAN uses an epsilon value of 0.2 and a minimum of 800 points for clustering. The clustering model is assessed against commonly used clustering algorithms including K-means [39], fuzzy C-means (FC-Means) [38], hierarchical clustering [40] (specifically divisive hierarchical clustering—DHC), and OPTICS [37], utilizing network traffic datasets for evaluation. The scatter plots in Figure 15 and Figure 16 display the experimental results for CSECIC-IDS2018 and CIC-IDS2017, respectively. The experimental results show that the proposed clustering method effectively separates instances into eight groups, including benign ones, for both CSECIC-IDS2018 and CIC-IDS2017 datasets. It demonstrates high accuracy in identifying positive and negative instances while maintaining a balanced performance in classification.
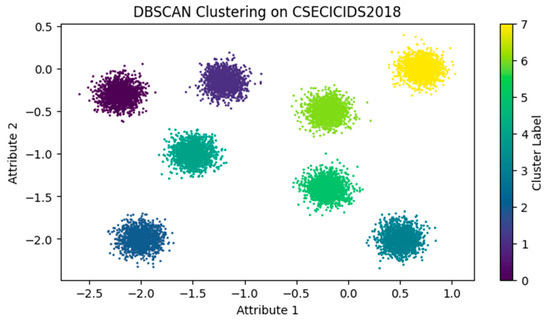
Figure 15.
DBSCAN clustering on CSECIC-IDS2018.
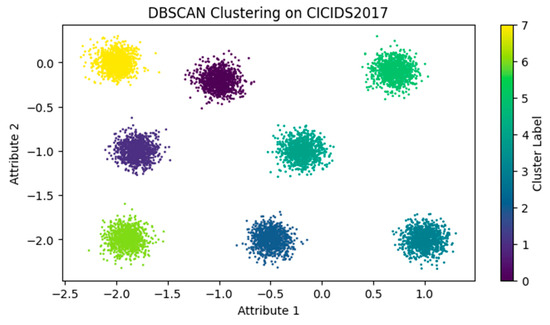
Figure 16.
DBSCAN clustering on CIC-IDS2017.
Table 5 illustrates how the proposed method consistently outperforms alternative clustering algorithms across a range of metrics, highlighting its effectiveness in clustering tasks in the CIC-IDS2017 dataset. The proposed method attains the highest recall score (0.9907), indicating its robust capability to identify positive instances effectively, also suggesting a minimal false negative rate.

Table 5.
Performance comparison of stage-3 clustering OCSVM + dAE + DBSCAN on CIC-IDS2017.
Figure 17 illustrates that the proposed method outperforms others in the CSECIC-IDS2018 dataset, showcasing higher F1-score, recall, precision, FNR, and accuracy. The proposed approach achieves the highest overall correctness of clustering at 0.9881. The proposed approach achieves the highest F1-measure at 0.993, signifying a well-balanced performance between precision and recall.
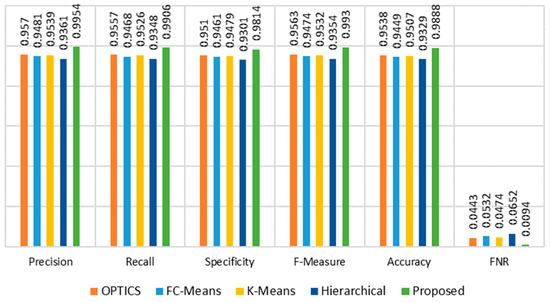
Figure 17.
Performance comparison of stage 3 clustering OCSVM + dAE + DBSCAN on CSECIC-IDS2018.
5.6. Performance Analysis of Proposed Method
5.6.1. Analysis on CSECIC-IDS2018 Dataset
The CSECIC-IDS2018 and CIC-IDS 2017 datasets were assessed using various anomaly detection methods. Key metrics such as precision, recall, specificity, accuracy, F-measure, and false negative rate (FNR) were used in the evaluation. Table 6 presents the analysis of these metrics for different methods applied to the CSECIC-IDS2018 dataset. This is followed by a detailed explanation of our proposed intrusion detection approach, which involves OCSVM + dAE + DBSCAN.

Table 6.
Performance analysis of proposed IDS on CSECIC-IDS2018 dataset.
Stage 1 Methods
OCSVM demonstrates high recall and specificity, leading to a low false negative rate (FNR), indicating slightly superior performance compared to dAE and DBSCAN. The dAE method achieves good recall and specificity, albeit with a slightly higher false negative rate (FNR). In contrast, DBSCAN exhibits lower recall and specificity than OCSVM and dAE, resulting in a higher false negative rate (FNR). Among the three methods, OCSVM performs exceptionally well, particularly in recall and achieving a low false negative rate, demonstrating strong capability in detecting actual anomalies. It is thus considered a recommended method for stage 1 detection.
Stage 2 Combined Methods
The rationale for implementing a two-stage anomaly detection approach with OCSVM and dAE is to leverage the respective strengths of each technique, aiming for improved detection performance. OCSVM and dAE exhibit complementary performance both individually and together.
OCSVM correctly identified 227,218 as true positive samples, while dAE detected 226,719, indicating that OCSVM found an additional 499 samples missed by dAE. On the other hand, dAE identified 226,719 samples correctly, while OCSVM detected 227,218, showing that dAE missed 499 samples that OCSVM detected. The combined use of OCSVM and dAE effectively reduces false negatives and false positives to just 340 and 588, respectively. This underscores the method’s effectiveness in minimizing detection errors.
The pairing of OCSVM and DBSCAN achieves high precision and recall but shows decreased specificity, characterized by a lower false negative rate (FNR). The combination of dAE and DBSCAN shows comparable performance, marked by notable enhancements in precision and recall. The combination of dAE and OCSVM achieves high recall but at the cost of relatively lower precision. The combined method of OCSVM and dAE shows substantial improvements in precision, recall, and exceptional specificity, resulting in a notably low false negative rate (FNR). This OCSVM + dAE approach is proposed for stage 2 consideration.
The two-stage approach improves anomaly detection by leveraging the strengths of both OCSVM and dAE, resulting in a more robust and accurate detection mechanism. The combined method significantly decreases false negatives and false positives compared to using each method individually, providing a strong rationale for adopting a two-stage anomaly detection strategy.
Stage 3 Proposed Method
The combination of dAE, OCSVM, and DBSCAN demonstrates strong overall performance with high precision and recall, albeit with reduced specificity. The proposed method, integrating OCSVM, dAE, and DBSCAN, shows superior performance across all metrics—precision, recall, specificity, accuracy, and notably low false negative rate (FNR), as shown in Table 6.
5.6.2. Analysis on CIC-IDS2017 Dataset
The CIC-IDS2017 dataset underwent evaluation using three distinct anomaly detection methods: OCSVM, dAE, and DBSCAN. The performance metrics assessed include precision, recall, specificity, F1-score, accuracy, and false negative rate (FNR).
Stage 1 Method
As shown Figure 18, among the three methods, DBSCAN exhibits the lowest precision and recall, suggesting a higher number of false positives and missed anomalies. Its specificity is marginally lower compared to OCSVM and dAE, and its F1-score indicates the least balance between precision and recall. DBSCAN also demonstrates the lowest accuracy and the highest false negative rate. The dAE method shows marginally superior precision and recall compared to the other methods. Despite its slightly lower recall, it maintains a competitive false negative rate, demonstrating its effectiveness in distinguishing between anomalies and normal instances.
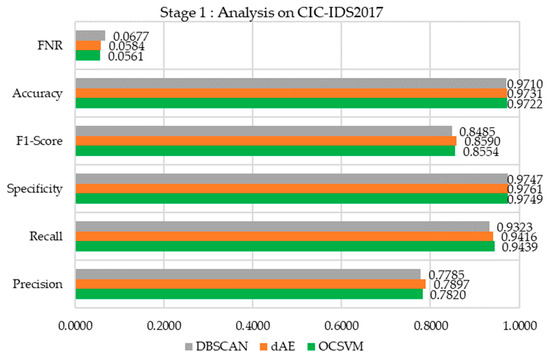
Figure 18.
Performance analysis of stage 1 OCSVM on CIC-IDS2017.
This proposed OCSVM demonstrates a precision of 0.7820, indicating that 78.2% of its positive predictions were correct, and a recall of 0.9439, successfully identifying 94.39% of the actual anomalies. Its specificity is 0.9749, showing that it correctly identified 97.49% of normal instances, and it achieves an F1-score of 0.8554, demonstrating a balanced trade-off between precision and recall. OCSVM demonstrates an accuracy rate of 97.22%, indicating that nearly 97.22% of predictions were correct. It also exhibits a false negative rate (FNR) of 0.0561, implying that approximately 5.61% of true anomalies were not detected. Among the three methods, OCSVM stands out with notably better recall and a lower false negative rate compared to the others. This highlights its strong capability in effectively identifying true anomalies.
Stage 2 Method
As shown in Figure 19, the combination of OCSVM + DBSCAN demonstrates high precision and recall, effectively identifying true positives while minimizing false positives. Its lower specificity suggests some difficulties in accurately identifying normal instances. The F1-score demonstrates a well-balanced performance between precision and recall, achieving solid accuracy alongside a low false negative rate (FNR).
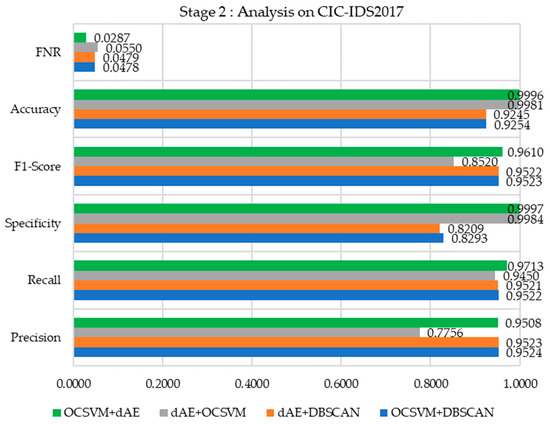
Figure 19.
Performance analysis of stage 2 OCSVM + dAE on CIC-IDS2017.
Like OCSVM + DBSCAN, the method dAE + DBSCAN exhibits high precision and recall. However, its slightly lower specificity suggests some challenges in accurately identifying normal instances. The dAE + OCSVM combination demonstrates strong performance in achieving high recall and excellent specificity, effectively identifying anomalies and normal instances. However, its precision is comparatively lower, leading to a higher incidence of false positives.
The OCSVM + dAE combination proposed here demonstrates superior performance across most metrics, characterized by high precision, recall, and nearly flawless specificity. The F1-score and accuracy excel, accompanied by the lowest false negative rate (FNR) among the methods, underscore its exceptional ability to detect anomalies while minimizing both false positives and false negatives.
Stage 3 Method
As shown in Figure 20, the dAE + OCSVM + DBSCAN combination demonstrates high precision and recall, effectively identifying true positives with minimal false positives. However, its specificity is diminished, indicating difficulties in accurately identifying normal instances. The F1-score demonstrates robust performance, indicating a well-balanced trade-off between precision and recall. The accuracy is reliable, coupled with a consistently low false negative rate (FNR), highlighting its overall effectiveness.
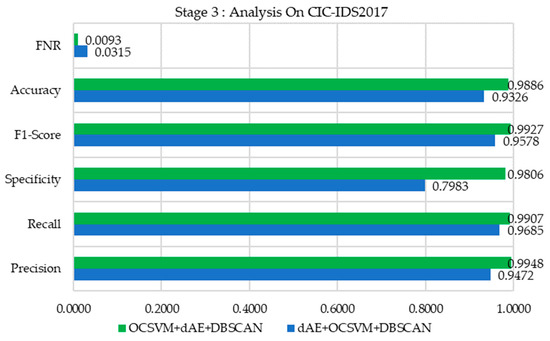
Figure 20.
Performance analysis of stage 3 OCSVM + dAE + DBSCAN on CIC-IDS2017.
The proposed approach, combining OCSVM + dAE + DBSCAN, shows superior performance across all metrics. It demonstrates outstanding precision, recall, and specificity, highlighting its robust ability to accurately detect anomalies as well as normal instances. The F1-score and accuracy excel, with the lowest FNR, showcasing its remarkable effectiveness in reducing both false positives and false negatives, establishing it as the top-performing method in this assessment.
Hence, the proposed detection model successfully identified and classified seven distinct cyber-attacks. Subsequently, the prevention model effectively mitigated four of these detected attacks by promptly blocking them and routing the associated data traffic to the security enforcement gateway, due to their high-priority designation within the Cyber Threat Repository. Concurrently, the remaining three attacks, deemed as lower priority, were redirected to the Incident Log Database for further analysis and subsequent mitigation efforts. These findings highlight the effectiveness of the prevention model, as it successfully mitigated all detected attacks. The priority-based blocking strategy is highly effective, successfully blocking all high-priority attacks, as shown in Table 7. Furthermore, Figure 21 demonstrates an impressive success rate in preventing all detected attacks, emphasizing the resilience of the prevention model. These findings confirm the model’s ability to uphold security without any compromises.

Table 7.
Performance of MITRE ATT&CK-based prevention model.
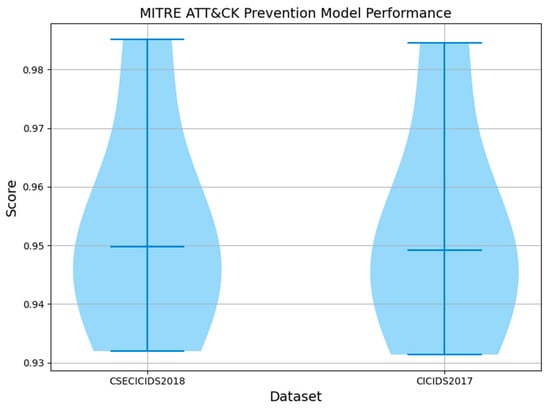
Figure 21.
Success rate of MITRE ATT&CK-based prevention model.
The evaluation and results of the proposed cybersecurity solution reveal key insights into its effectiveness and robustness. The assessment of OCSVM underscores the critical influence of the “nu” parameter on detection accuracy, essential for optimizing performance. Similarly, evaluation of the deep autoencoder (dAE) demonstrates its effectiveness in anomaly detection, utilizing MSE across datasets. The detection model’s overall performance across both “Normal” and “Attack” data in CIC-IDS2017 and CSECIC-IDS2018 datasets shows significant efficacy, consistently delivering notable results. Moreover, the proposed approach outperforms alternatives in clustering tasks, exhibiting superior precision, recall, and overall accuracy. Comparative analysis across datasets highlights its superiority, with high correctness of clustering, F1-measure, and recall scores. Successful identification and classification of cyber-attacks, coupled with the prevention model’s remarkable success rate in mitigating them, underline the solution’s robustness in enhancing cybersecurity resilience. Implementation insights elucidate practical deployment strategies, leveraging various techniques like autoencoders, OCSVM, DBSCAN, and the MITRE ATT&CK framework. Overall, these evaluations collectively demonstrate the comprehensive efficacy of the proposed cybersecurity solution in detection, prevention, and overall resilience enhancement, promising in tackling contemporary cybersecurity challenges.
5.7. Limitations and Future Work
Although the proposed method, integrating OCSVM, dAE, and DBSCAN, demonstrates superior performance across most metrics, it does have inherent limitations and shortcomings. The method’s efficacy is validated on the CSECIC-IDS2018 and CICIDS2017 datasets. However, its performance may vary on other datasets or in different domains, underscoring the need for additional validation across diverse datasets to ensure broad applicability. Moreover, the effectiveness of the proposed method hinges significantly on meticulously tuning parameters for each algorithm, a task that can consume considerable time. This research focuses on detecting emerging zero-day attacks, utilizing a binary classification algorithm. Future research can expand on this work by exploring multiclass classification techniques. It should prioritize optimizing the method to minimize computational complexities, validating it across diverse datasets, simplifying parameter tuning, improving scalability, and ensuring reliable performance in varied and dynamic environments.
6. Conclusions
This study presented a novel comprehensive approach to address the escalating cybersecurity concerns associated with the proliferation of Internet services and the corresponding surge in network attacks. By leveraging unsupervised learning techniques, the proposed method offers a robust framework for training detection models to effectively counter a wide range of threats, including denial of service (DoS), distributed denial of service (DDoS), botnet, brute force, infiltration, and Heartbleed. The significance of this work lies in its multi-stage detection model, which combines basic autoencoders (bAEs), a one-class support vector machine (OCSVM), and deep autoencoder (dAE) attack detection, supplemented by density-based spatial clustering of applications with noise (DBSCAN) for attack clustering. This integrated approach enables the accurate delineation of attack clusters, aiding in the mapping of attack tactics and facilitating timely response strategies. Furthermore, by leveraging preprocessed and unlabeled normal network traffic data, this methodology allows for the identification of novel attacks while mitigating the impact of imbalanced training data on model performance. The use of reconstruction error in the autoencoder method, kernel functions in OCSVM, and density-based clustering in DBSCAN ensures robust anomaly detection, noise management, and scalability, resulting in highly accurate intrusion detection. The evaluation of the proposed model on standard datasets such as CIC-IDS2017 and CSECIC-IDS2018 demonstrates its efficacy, with accuracies exceeding 98% in both cases. These results underscore the potential of this approach to significantly enhance network security and protect against evolving cyber threats. This research contributes to the advancement of intrusion detection systems and underscores the importance of leveraging innovative techniques to safeguard critical networks against cyber threats. By combining machine learning algorithms with robust clustering methods, this approach offers a promising solution for efficient and effective intrusion detection in the ever-changing cybersecurity landscape.
Looking ahead, the findings of this study suggest various avenues for application and extension. The developed framework can be further refined and customized to address specific network environments and threat landscapes. Additionally, the integration of frameworks like the MITRE ATT&CK provides a structured approach to cataloging attacks and tactics, enabling proactive defense strategies based on threat prioritization.
Author Contributions
Conceptualization, P.K., S.P., M.T., B.B. and F.B.; methodology, P.K., S.P. and M.T.; software, P.K., S.P. and M.T.; validation, P.K., S.P., M.T., B.B. and F.B.; formal analysis, P.K., S.P. and M.T.; investigation, P.K., S.P., M.T., B.B. and F.B.; resources, P.K., S.P. and M.T.; data curation, P.K., S.P. and M.T.; writing—original draft preparation, P.K., S.P. and M.T.; writing—review and editing, P.K., S.P., M.T., B.B. and F.B.; visualization, B.B. and F.B.; supervision, B.B. and F.B.; project administration, B.B. and F.B. All authors have read and agreed to the published version of the manuscript.
Funding
This research received no external funding.
Data Availability Statement
The dataset used for this article is available online at https://www.unb.ca/cic/datasets/ids-2018.html and https://www.unb.ca/cic/datasets/ids-2017.html for CSECIC-IDS2018 and CIC-IDS2017 respectively, date accessed 11 July 2024.
Conflicts of Interest
The authors declare no conflicts of interest.
References
- Jiang, K.; Wang, W.; Wang, A.; Wu, H. Network Intrusion Detection Combined Hybrid Sampling with Deep Hierarchical Network. IEEE Access 2020, 8, 32464–32476. [Google Scholar] [CrossRef]
- Gandi, V.P.; Jatla, N.S.L.; Sadhineni, G.; Geddamuri, S.; Chaitanya, G.K.; Velmurugan, A.K. A Comparative Study of AI Algorithms for Anomaly-based Intrusion Detection. In Proceedings of the 7th International Conference on Computing Methodologies and Communication, ICCMC 2023, Erode, India, 23–25 February 2023; Institute of Electrical and Electronics Engineers Inc.: Piscataway, NJ, USA, 2023; pp. 530–534. [Google Scholar] [CrossRef]
- Ali, T.A.J.; Jawhar, M.M.T. Detecting network attacks model based on a convolutional neural network. Int. J. Electr. Comput. Eng. 2023, 13, 3072–3078. [Google Scholar] [CrossRef]
- Lv, Z.; Chen, D.; Cao, B.; Song, H.; Lv, H. Secure Deep Learning in Defense in Deep-Learning-as-a-Service Computing Systems in Digital Twins. IEEE Trans. Comput. 2024, 73, 656–668. [Google Scholar] [CrossRef]
- Sun, N.; Ding, M.; Jiang, J.; Xu, W.; Mo, X.; Tai, Y.; Zhang, J. Cyber Threat Intelligence Mining for Proactive Cybersecurity Defense: A Survey and New Perspectives. IEEE Commun. Surv. Tutor. 2023, 25, 1748–1774. [Google Scholar] [CrossRef]
- Pitafi, S.; Anwar, T.; Widia, I.D.M.; Yimwadsana, B.; Pitafi, S. Revolutionizing Perimeter Intrusion Detection: A Machine Learning-Driven Approach with Curated Dataset Generation for Enhanced Security. IEEE Access 2023, 11, 106954–106966. [Google Scholar] [CrossRef]
- Zheng, J.; Zhang, Z.; Ma, Q.; Gao, X.; Tian, C.; Chen, G. Multi-Resource VNF Deployment in a Heterogeneous Cloud. IEEE Trans. Comput. 2022, 71, 81–91. [Google Scholar] [CrossRef]
- Mao, Y.; Shang, X.; Liu, Y.; Yang, Y. Joint Virtual Network Function Placement and Flow Routing in Edge-Cloud Continuum. IEEE Trans. Comput. 2024, 73, 872–886. [Google Scholar] [CrossRef]
- Figueiredo, J.; Serrão, C.; de Almeida, A.M. Deep Learning Model Transposition for Network Intrusion Detection Systems. Electronics 2023, 12, 293. [Google Scholar] [CrossRef]
- Sarhan, M.; Kulatilleke, G.; Lo, W.W.; Layeghy, S.; Portmann, M. DOC-NAD: A Hybrid Deep One-class Classifier for Network Anomaly Detection. arXiv 2022, arXiv:2212.07558. [Google Scholar]
- Devarakonda, A.; Sharma, N.; Saha, P.; Ramya, S. Network intrusion detection: A comparative study of four classifiers using the NSL-KDD and KDD’99 datasets. J. Phys. Conf. Ser. 2022, 2161, 12043. [Google Scholar] [CrossRef]
- Wang, C.; Sun, Y.; Lv, S.; Wang, C.; Liu, H.; Wang, B. Intrusion Detection System Based on One-Class Support Vector Machine and Gaussian Mixture Model. Electronics 2023, 12, 930. [Google Scholar] [CrossRef]
- Ren, Y.; Feng, K.; Hu, F.; Chen, L.; Chen, Y. A Lightweight Unsupervised Intrusion Detection Model Based on Variational Auto-Encoder. Sensors 2023, 23, 8407. [Google Scholar] [CrossRef] [PubMed]
- Jain, P.; Bajpai, M.S.; Pamula, R. A Modified DBSCAN Algorithm for Anomaly Detection in Time-series Data with Seasonality. Int. Arab. J. Inf. Technol. 2022, 19, 23–28. [Google Scholar] [CrossRef] [PubMed]
- Xiong, W.; Legrand, E.; Åberg, O.; Lagerström, R. Cyber security threat modeling based on the MITRE Enterprise ATT&CK Matrix. Softw. Syst. Model. 2022, 21, 157–177. [Google Scholar] [CrossRef]
- Sokkalingam, S.; Ramakrishnan, R. An intelligent intrusion detection system for distributed denial of service attacks: A support vector machine with hybrid optimization algorithm based approach. Concurr. Comput. 2022, 34, e7334. [Google Scholar] [CrossRef]
- Duhayyim, M.A.; Alissa, K.A.; Alrayes, F.S.; Alotaibi, S.S.; Tag El Din, E.M.; Abdelmageed, A.A.; Yaseen, I.; Motwakel, A. Evolutionary-Based Deep Stacked Autoencoder for Intrusion Detection in a Cloud-Based Cyber-Physical System. Appl. Sci. 2022, 12, 6875. [Google Scholar] [CrossRef]
- Mousa, A.K.; Abdullah, M.N. An Improved Deep Learning Model for DDoS Detection Based on Hybrid Stacked Autoencoder and Checkpoint Network. Future Internet 2023, 15, 278. [Google Scholar] [CrossRef]
- Shin, C.; Lee, I.; Choi, C. Exploiting TTP Co-Occurrence via GloVe-Based Embedding with MITRE ATT&CK Framework. IEEE Access 2023, 11, 100823–100831. [Google Scholar] [CrossRef]
- Liu, H.; Lang, B. Machine learning and deep learning methods for intrusion detection systems: A survey. Appl. Sci. 2019, 9, 4396. [Google Scholar] [CrossRef]
- Thirimanne, S.P.; Jayawardana, L.; Yasakethu, L.; Liyanaarachchi, P.; Hewage, C. Deep Neural Network Based Real-Time Intrusion Detection System. SN Comput. Sci. 2022, 3, 145. [Google Scholar] [CrossRef]
- Guarino, S.; Vitale, F.; Flammini, F.; Faramondi, L.; Mazzocca, N.; Setola, R. A Two-Level Fusion Framework for Cyber-Physical Anomaly Detection. IEEE Trans. Ind. Cyber-Phys. Syst. 2024, 2, 1–13. [Google Scholar] [CrossRef]
- Ramasamy, M.; Eric, P.V. A novel classification and clustering algorithms for intrusion detection system on convolutional neural network. Bull. Electr. Eng. Inform. 2022, 11, 2845–2855. [Google Scholar] [CrossRef]
- Ahmad, Z.; Khan, A.S.; Shiang, C.W.; Abdullah, J.; Ahmad, F. Network intrusion detection system: A systematic study of machine learning and deep learning approaches. Trans. Emerg. Telecommun. Technol. 2021, 32, e4150. [Google Scholar] [CrossRef]
- Fan, J.F.J.; Fan, G.Y.J.; Yang, J.G.G. DDoS Attack Detection System Based on RF-SVM-IL Model Under SDN. J. Comput. Sci. 2021, 32, 031–043. [Google Scholar] [CrossRef]
- Yaras, S.; Dener, M. IoT-Based Intrusion Detection System Using New Hybrid Deep Learning Algorithm. Electronics 2024, 13, 1053. [Google Scholar] [CrossRef]
- Harahsheh, K.; Al-Naimat, R.; Chen, C.H. Using Feature Selection Enhancement to Evaluate Attack Detection in the Internet of Things Environment. Electronics 2024, 13, 1678. [Google Scholar] [CrossRef]
- Javed, A.; Ehtsham, A.; Jawad, M.; Awais, M.N.; Qureshi, A.-H.; Larijani, H. Implementation of Lightweight Machine Learning-Based Intrusion Detection System on IoT Devices of Smart Homes. Future Internet 2024, 16, 200. [Google Scholar] [CrossRef]
- Liao, J.; Teo, S.G.; Kundu, P.P.; Truong-Huu, T. ENAD: An ensemble framework for unsupervised network anomaly detection. In Proceedings of the 2021 IEEE International Conference on Cyber Security and Resilience, CSR 2021, Rhodes, Greece, 26–28 July 2021; Institute of Electrical and Electronics Engineers Inc.: Piscataway, NJ, USA, 2021; pp. 81–88. [Google Scholar] [CrossRef]
- Almaraz-Rivera, J.G.; Cantoral-Ceballos, J.A.; Botero, J.F. Enhancing IoT Network Security: Unveiling the Power of Self-Supervised Learning against DDoS Attacks. Sensors 2023, 23, 8701. [Google Scholar] [CrossRef]
- Khraisat, A.; Gondal, I.; Vamplew, P.; Kamruzzaman, J.; Alazab, A. Hybrid intrusion detection system based on the stacking ensemble of C5 decision tree classifier and one class support vector machine. Electronics 2020, 9, 173. [Google Scholar] [CrossRef]
- Shafin, S.S.; Karmakar, G.; Mareels, I. Obfuscated Memory Malware Detection in Resource-Constrained IoT Devices for Smart City Applications. Sensors 2023, 23, 5348. [Google Scholar] [CrossRef]
- Ravi, N.; Shalinie, S.M. Semisupervised-Learning-Based Security to Detect and Mitigate Intrusions in IoT Network. IEEE Internet Things J. 2020, 7, 11041–11052. [Google Scholar] [CrossRef]
- Li, W.; Meng, W.; Au, M.H. Enhancing collaborative intrusion detection via disagreement-based semi-supervised learning in IoT environments. J. Netw. Comput. Appl. 2020, 161, 102631. [Google Scholar] [CrossRef]
- Kwon, R.; Ashley, T.D.; Castleberry, J.E.; McKenzie, P.L.; Gourisetti, S.N.G. Cyber Threat Dictionary Using MITRE ATT&CK Matrix and NIST Cybersecurity Framework Mapping. United States 2020. Available online: https://www.osti.gov/biblio/1734565 (accessed on 17 July 2024).
- Sharafaldin, I.; Lashkari, A.H.; Ghorbani, A.A. Toward generating a new intrusion detection dataset and intrusion traffic characterization. In Proceedings of the ICISSP 2018—The 4th International Conference on Information Systems Security and Privacy, Madeira, Portugal, 22–24 January 2018; SciTePress: Setúbal, Portugal, 2018; pp. 108–116. [Google Scholar] [CrossRef]
- Mustafa, D.H.; Husien, I.M. Adaptive DBSCAN with Grey Wolf Optimizer for Botnet Detection. Int. J. Intell. Eng. Syst. 2023, 16, 409–421. [Google Scholar] [CrossRef]
- Nguyen, T.L.; Kao, H.; Nguyen, T.T.; Horng, M.F.; Shieh, C.S. Unknown DDoS Attack Detection with Fuzzy C-Means Clustering and Spatial Location Constraint Prototype Loss. Comput. Mater. Contin. 2024, 78, 2181–2205. [Google Scholar] [CrossRef]
- Dwivedi, D.; Bhushan, A.; Singh, A.K.; Snehlata. Leveraging K-means clustering for enhanced detection of network traffic attacks. In Proceedings of the 2024 3rd International conference on Power Electronics and IoT Applications in Renewable Energy and its Control (PARC), Mathura, India, 23–24 February 2024; pp. 72–76. [Google Scholar] [CrossRef]
- An, H.; Ma, R.; Yan, Y.; Chen, T.; Zhao, Y.; Li, P.; Li, J.; Wang, X.; Fan, D.; Lv, C. Finsformer: A Novel Approach to Detecting Financial Attacks Using Transformer and Cluster-Attention. Appl. Sci. 2024, 14, 460. [Google Scholar] [CrossRef]
Disclaimer/Publisher’s Note: The statements, opinions and data contained in all publications are solely those of the individual author(s) and contributor(s) and not of MDPI and/or the editor(s). MDPI and/or the editor(s) disclaim responsibility for any injury to people or property resulting from any ideas, methods, instructions or products referred to in the content. |
© 2024 by the authors. Licensee MDPI, Basel, Switzerland. This article is an open access article distributed under the terms and conditions of the Creative Commons Attribution (CC BY) license (https://creativecommons.org/licenses/by/4.0/).