1. Introduction
In the recent past, Internet architecture was primarily composed of multiple networking devices that served a large number of user terminals for running diverse applications. However, with the widespread adoption of cloud computing [
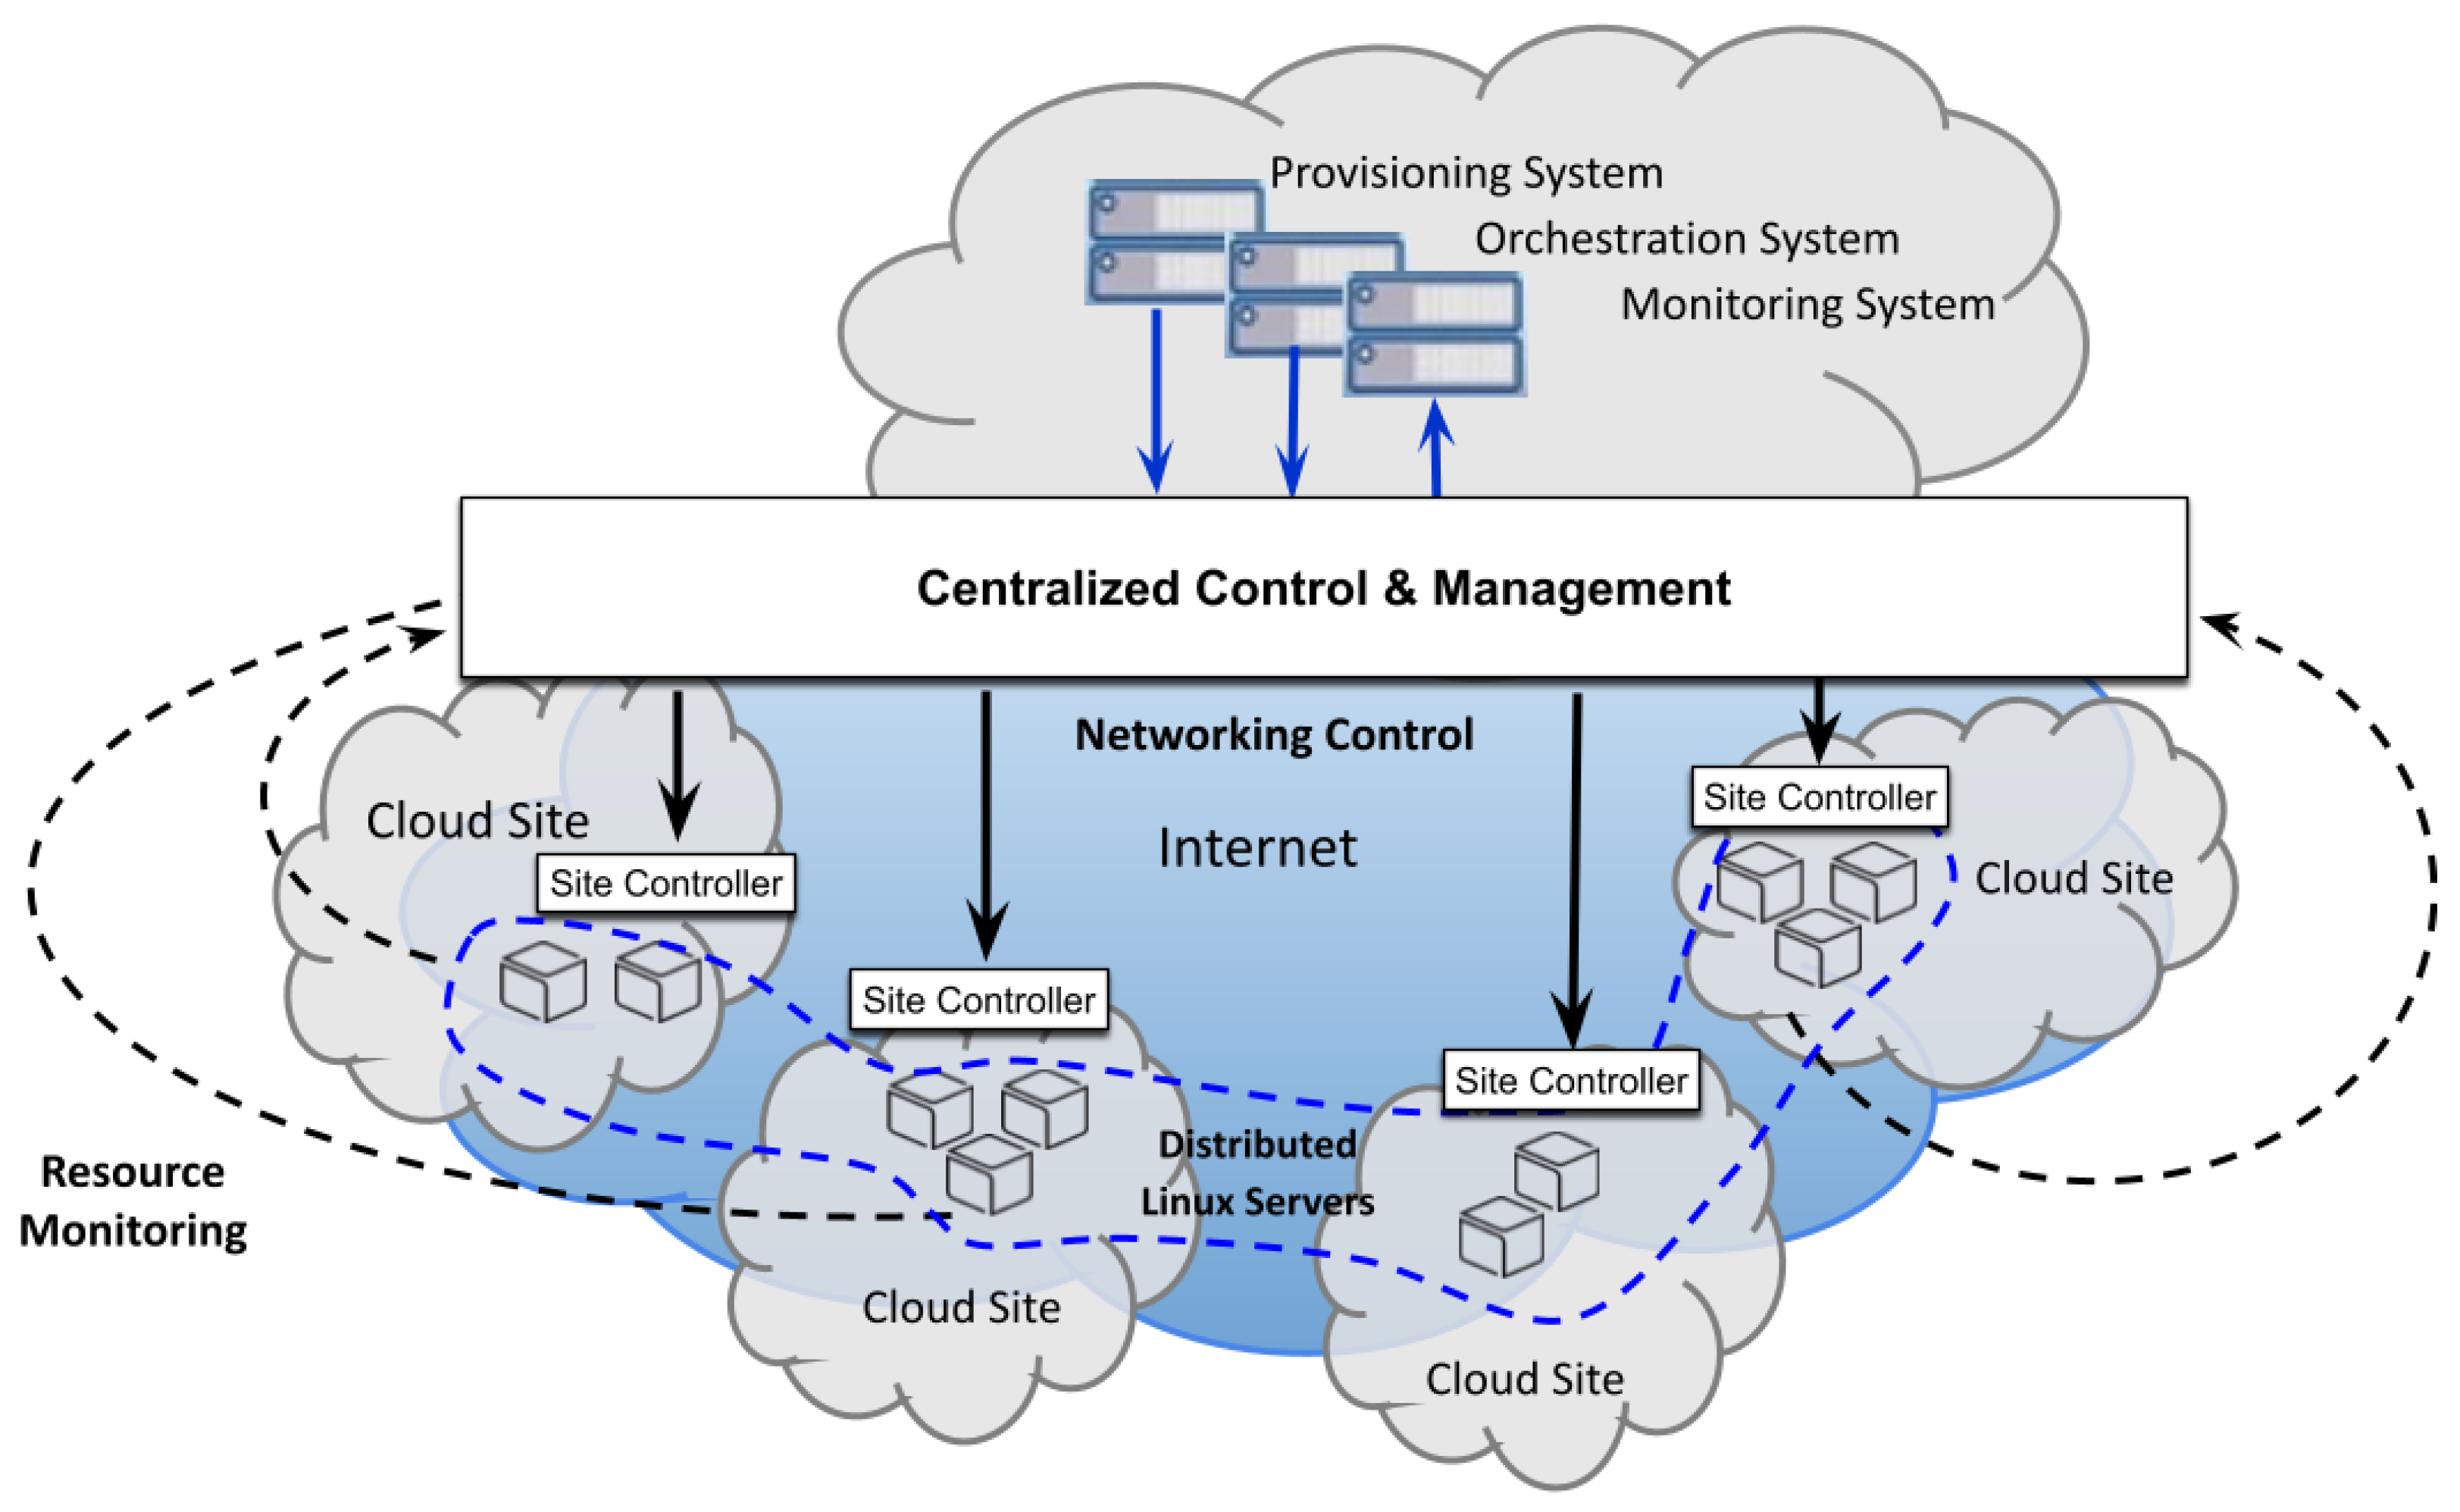
1], the landscape has evolved towards a multi-site cloud infrastructure. These multi-site clouds are spread over heterogeneous underlying network infrastructures across different geographical locations, as depicted in
Figure 1. Each cloud site hosts a large number of servers, often based on the Linux operating system (OS), offering a myriad of resources (i.e., computing, networking, and storage). These cloud sites are interconnected using a border gateway protocol (BGP)-based layer-3 (L3) IP network.
The operation of such a multi-site cloud infrastructure poses two substantial challenges. Firstly, we face a visibility challenge, which involves efficient measurement and analysis of network packet flows from multiple servers and physical locations. This timely visibility is crucial to ensure the smooth and secure operation of the multi-site cloud environment. Secondly, we encounter a networking control challenge in the multi-site cloud environment with multiple cloud providers and control domains. In such an environment, intent-based networking control [
2] is necessary to accommodate multiple policies and heterogeneous network device configurations. Thus, the most critical question is how to address both challenges simultaneously for providing networking control in BGP-based IP interconnections, leveraging flow information.
Previous studies have focused on diverse topics relevant to network management and security. These include establishing initial flow-level visibility for an OF@TEIN testbed [
3], traffic flow monitoring and analysis for security incidents [
4,
5,
6], flexible samples for monitoring and security application in OpenFlow [
7], traffic engineering (measurement and management) in SDN [
8,
9], and intent-driven security in software-defined networks [
10]. Unfortunately, the majority of these proposals attempt to solve individual problems without considering an end-to-end closed-loop monitoring and control solution. For instance, some works focus solely on flow-level visibility (e.g., counting or sampling), providing statistical data without outlining how these data can be utilized effectively for traffic control. Traffic engineering works, on the other hand, concentrate solely on traffic control with limited statistical data from the network. Hence, it is critical to propose a solution that simultaneously addresses these monitoring and control problems and provides an integrated solution.
To address the challenge of efficiently measuring and collecting flow-level information, we utilize IO Visor-based (
https://github.com/iovisor, accessed on 22 June 2024) tracing to efficiently capture network packets for flow-level visibility analysis. This collected visibility information is then analyzed to generate an IP prefix-based recommendation policy, building on our previous work [
3] to assist networking control. Finally, we employ the ONOS SDN controller to apply the recommended policy as an action through the ONOS intent framework, which translates this action into flow rules. Proposed solution working is verified in a distributed testbed and results demonstrate that proposed flow-level visibility effectively utilizes traced network packets for generating redirect action for unknown flows originating from an IP prefix exceeding the permissible threshold. In summary, the key contributions of this work are listed below:
We propose a network packet-precise flow visibility approach to measure and analyze incoming and outgoing traffic from the Linux servers.
We propose a networking control solution for a complex multi-domain environment with hybrid SDN-IP interconnection that is assisted by flow-level visibility.
We verify the end-to-end integration of proposed solutions and evaluate their performance efficiency when processing the traced data from a distributed testbed (i.e., OF@TEIN playground).
The rest of this paper is structured as follows.
Section 2 discusses and compares the proposed work with closely related studies in the literature.
Section 3 presents the proposed solution, followed by insights into the implementation details in
Section 4. Experimental evaluation results are provided in
Section 5.
Section 6 discusses the potential use case scenarios and future directions. Finally,
Section 7 concludes the paper.
2. Related Work
To address distributed multi-site cloud monitoring and control challenges, several works have been proposed to improve operational efficiency. Usman et al. [
3] present the SmartX multiview visibility framework (MVF), which aims to integrate different layers of visibility (i.e., physical resources, virtual resources, and flow layers). This framework is also exploited for realizing flow-centric visibility, which is extended to assist networking control. Authors in [
11] introduced a flow monitoring framework called cReFeR that aims to balance accuracy and efficiency in SDNs. This framework utilizes a three-step approach of first report, feedback, and second report to reduce the amount of flow statistics collected. Sahu. et al. [
12] used SDN for traffic monitoring in data center networks to efficiently manage high-volume flows, particularly elephant flows. Also, this study proposes a new method for detecting such elephant flows that is based on continuous polling of all switches. Authors in [
13] address the problem of high-cost and inefficient traffic monitoring in network applications by proposing new monitoring mechanisms. These mechanisms aim to minimize monitoring costs while adhering to reporting delay constraints by carefully selecting switches to report flow statistics.
Risdianto et al. [
14], including one of the current paper’s authors, proposed a limited networking control for multiple SDN controllers in the multi-domain infrastructure. This study utilizes the SDN controllers and applications for controlling interconnected SDN sites according to BGP routing information [
15]. In [
16], IntStream, a network telemetry framework, is proposed to address challenges in measuring and managing complex networks. The authors highlight three key challenges in developing an intent-based telemetry solution: the diversity of data sources, the complexity of measurement tasks, and the requirement for low overhead. IntStream tackles these challenges by enabling passive stream processing and active probing, effectively analyzing networks while minimizing transmission overhead. Yang et al. introduce the concept of intent-driven networks (IDNs), which aims to allow for fully automated network management without human involvement [
17]. They emphasize reducing network management complexity by enabling automation to achieve measurable and comprehensive life cycle management. The authors demonstrate the intent system interface using an OpenStack-based intent platform.
In
Table 1, we position our work with other related works using various factors. These factors include whether the solution has a general or specific purpose, a conceptual idea only or includes implementation, the scope of the implementation (i.e., flow collection, flow analysis, or network control), the mode of execution (online or offline), and the evaluation environment where the proposed solution is verified or data are obtained. As shown in the table, compared with other works, our proposal is a general-purpose solution with networking control as one example use case scenario. Also, unlike some other solutions that are purely conceptual ideas, our proposal includes partial component implementation (i.e., building on our previous works). Although our proposed solution is not yet in real-time operation, it is still verified in online mode in a small testbed-scale operation environment.
3. Proposed Solution
Our proposal, depicted in
Figure 2, consists of three main solutions:
Lightweight IO Visor-based packet tracing for security-enhanced visibility: our security-enhanced visibility measurement solution employs IO Visor tracing tools. These traced data are fed into a flow-centric visibility solution to analyze network packet flows, including IP prefix-based inspection. This tool is deployed and executed from Linux-based servers, which are provisioned in distributed cloud sites.
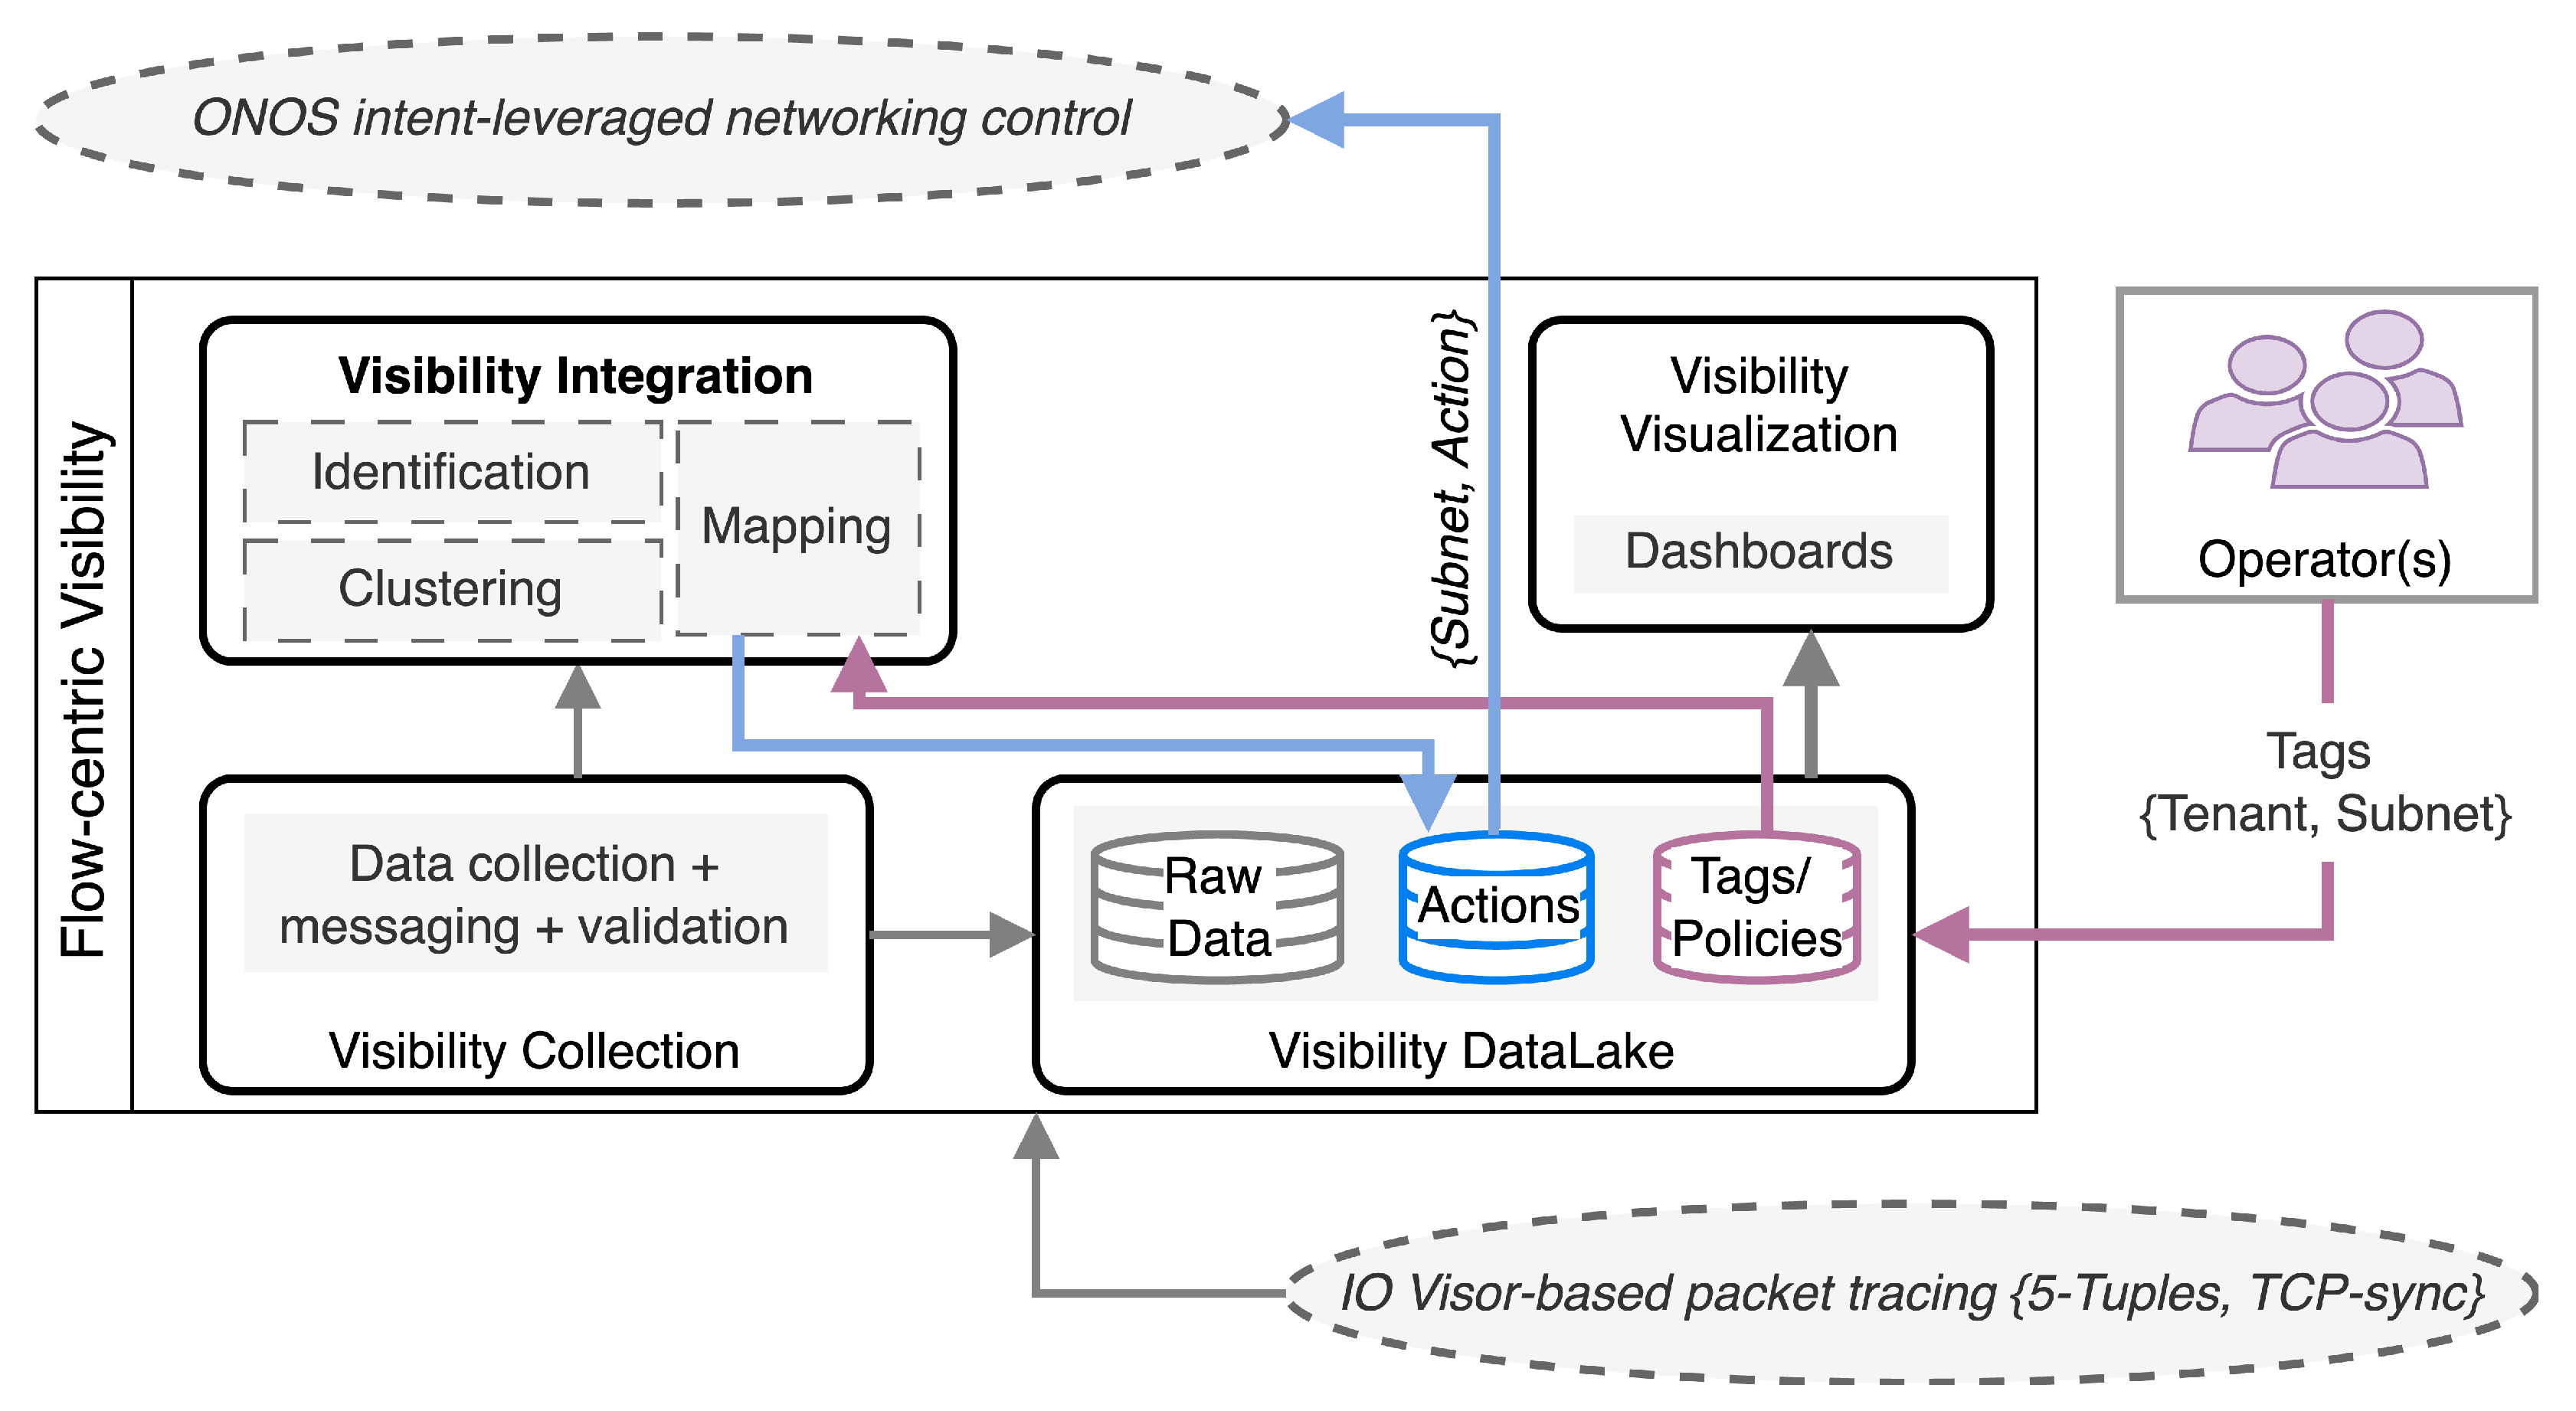
Flow-centric visibility to assist networking control: our flow-centric visibility solution analyzes the collected flows to generate a specific recommendation policy for a specific type and source of the flow [
19]. These policies are subsequently used to apply networking control amongst distributed cloud sites. This solution is executed in a
visibility center, which is centrally located inside
operations center.
ONOS intent-leveraged networking control: our ONOS intent-leveraged application translates a recommended policy based on the IP prefix into an intent specification compatible with the ONOS intent framework [
20]. This application executes from the
provisioning center inside the operations center with API-based access to the ONOS controller or inside the
security checkpoint (i.e., a place where the first level of policy checking and enforcement can be applied for a specific location) in each site as an ONOS controller application.
We describe each solution in more detail below.
3.1. Lightweight IO Visor-Based Packet Tracing for Security-Enhanced Visibility
IO Visor (
https://www.iovisor.org/technology/use-cases, accessed on 22 June 2024) is an open-source project built based on the extended Berkeley Packet Filter (eBPF) [
21]. The original BPF is designed to analyze and filter packets for network monitoring, while eBPF is designed to enable any in-kernel I/O modules, so it can help IO Visor to accelerate the innovation, development, and sharing of virtualized kernel I/O services. While eBPF need a C program to be translated into instructions, and loaded and executed into the kernel, IO Visor provides capability through the BPF compiler collection (BCC) tool to execute eBPF instructions from other high-level languages such as Python. As a result, IO Visor is able to trace different information such as network packets, kernel processes, and user applications.
By developing IO Visor-based packet tracing, we can trace the entire payload of the packet or only specific information in the packet header. Also, IO Visor-based tools can call other eBPF programs (i.e., chaining) and pass traced information between them. For example, a packet-tracing program can be hooked and call a kernel-tracing program to collect specific kernel-related information (e.g., application name and process identifier) of respective traced packet data.
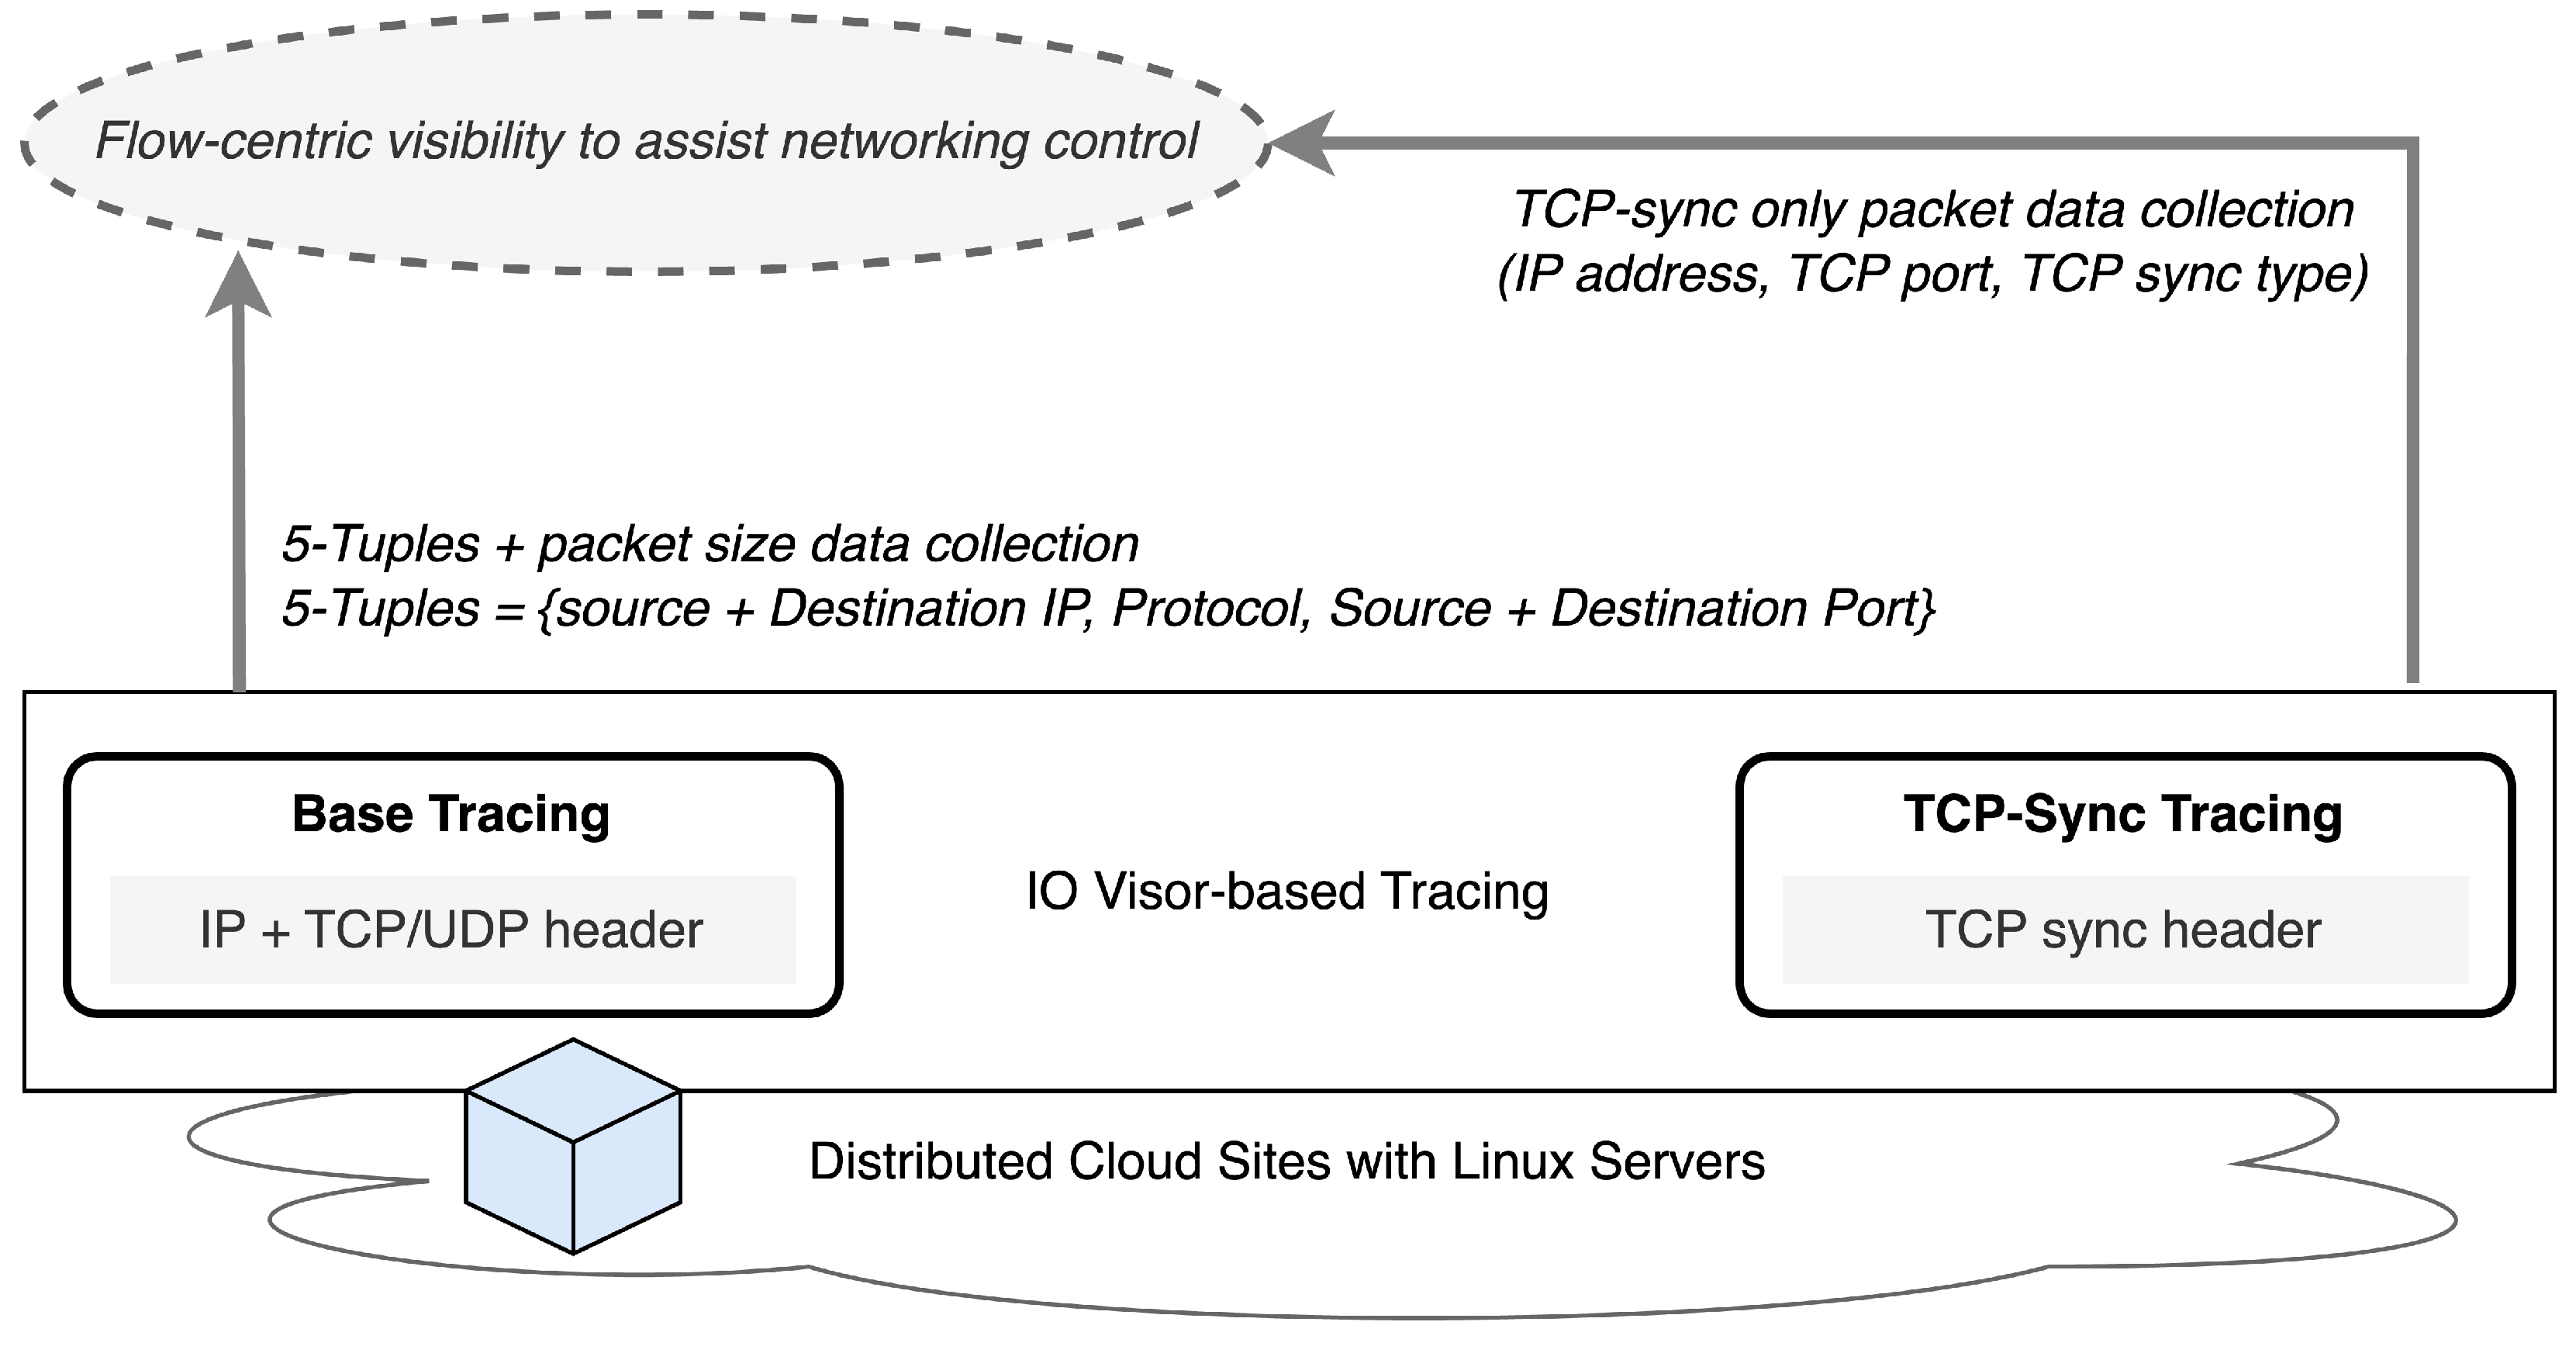
To enable flow-centric visibility for assisting networking control, we designed IO Visor-based packet tracing tailored for two different collections, each capable of collecting security-related information. First, base collection collects 5-tuples packet header information for grouping and in addition extracts an associated number of bytes for packet-based statistics. Second, TCP-sync collection for security detection, which collects a TCP header with a SYNC connection type. These 5-tuples encompass IP source, IP destination, protocol, TCP or UDP source port, and TCP or UDP destination port. The collection process commences with the specification of these 5-tuples within the user-space program as tracing criteria. Next, this user-space program is converted to eBPF bytecode and hooked to the Linux networking socket. Consequently, only packets containing those 5-tuples are send to the user space for packet statistics measurement. TCP-sync collection is designed to leverage the TCP socket as the hook point and only takes a packet with TCP-sync in the header as its tracing criteria. It sends the packet information, such as TCP-sync sender IP address and TCP port number, to its associated application running in the user space. The overall design of the base collection and TCP-sync collection is depicted in
Figure 3.
3.2. Flow-Centric Visibility to Assist Networking Control
Flow-centric visibility plays a crucial role in verifying packets flowing through the distributed sites and virtualized overlay networks, and checking the payload associated with specific workloads, such as tenant applications. While there are various flow-based visibility solutions available with distinct approaches for collecting and processing network packets, the majority of these are commercial solutions that require exclusive hardware and licensed software. Thus, we design a customized flow-centric visibility solution according to the distributed multi-site cloud monitor and control requirements. Our design employs a combination of methods and open-source tools, building upon the SmartX MVF [
3], and consists of four key stages:
Visibility collection, messaging, and validation involves collecting visibility metrics from the distributed Linux servers and validating them before forwarding to the visibility center. The collected data include packet attributes such as IP addresses, packet sizes, and types, which are essential for subsequent analysis.
Visibility integration performs flow clustering and identification based on collected packet data. This stage involves grouping flows into multiple classes using flow attributes and behaviors, and mapping them to predefined policies. The classes include:
Clustered flows: flows with similar packet attributes, such as source/destination subnets, packet size, and TCP header type.
Identified flows: flows generated by specific applications and tenants, identified using operator-provided tags.
Known flows: flows that belong to a known tenant but lack application info.
Unknown flows: flows with unknown IP addresses and random port numbers, which remain unclassified after analysis.
Attack flows: flows from sources known to be responsible for attacking other hosts and engaging in malicious behavior.
Operator-provided tags, offered by cloud operators and automation tools, are fundamental in this stage to assist in flow clustering and identification, especially since SmartX MVF does not support application-level visibility natively.
Visibility DataLake stores numerous types and volumes of raw, integrated, and staged visibility data in different formats. This DataLake acts as a central repository, supporting convenient data retrieval and analysis.
Visibility visualization facilitates access to the analyzed data and transforms them into graphical outputs for easy interpretation. This stage includes dashboards and reports that provide insights into network performance and security status.
The visibility integration stage is pivotal because it generates actionable insights by classifying flows into the aforementioned categories. For instance, flows are clustered based on the source/destination subnets, determined by analyzing IP addresses and subnet masks. These clusters undergo statistical analysis to identify suspicious patterns, which may indicate security issues. Identified flows are associated with known applications and tenants, leveraging tags for accuracy. Unknown flows, not matching any known application patterns, are categorized separately for further investigation. Periodic analysis of flows can mark some flows as suspicious due to behaviors or statistics of the bytes number, packet type, and sending patterns, which may lead to a security incident. However, it is important to remember that, even after flow-centric visibility analysis, some flows may remain as unknown flows (i.e., unknown IP address and random port number).
This multi-class flow information approach effectively reduces the volume of visibility data that need to be analyzed for networking control. For instance, we cluster flows based on source/destination subnets, which are determined based on the IP source/destination, with additional subnet mask information provided by tagging. Similarly, we identify flows by comparing application id in collected flows from TCP-sync collection with a list of known applications from legitimate users, which is pre-defined as an input part of tagging.
To facilitate networking control, our flow-centric visibility solution includes a mapping function that recommends control actions for each flow type. Clustered and identified flows are typically allowed through the network, while attacked flows are recommended for dropping. A small number of unknown flows are redirected to temporary storage for inspection in near real time by a network intrusion detection system (IDS) or other similar tools. Following the processing of each stage of flow-centric visibility, produced data and recommended actions are stored in the respective DataStores of the DataLake, ensuring traceability and compliance. The overall design of flow-centric visibility to assist networking is illustrated in
Figure 4.
3.3. ONOS Intent-Leveraged Networking Control
The intent framework of ONOS is a subsystem that allows applications to specify their networking control requirements based on policy-based directives, called intents [
2]. Intent-based networking (IBN) is defined as a flexible, agile, and simplified network configuration with minimal external intervention. Similarly, ONOS core accepts and translates the intent specifications into installable intents, which are allowed to be added to ONOS dynamically at run-time. ONOS intent is an immutable model object that describes an application’s request to control the network’s behavior. These intents typically encompass:
Network resource: links and ports;
Constraints: bandwidth, optical frequency, and link type;
Criteria: packet header fields/patterns that are implemented as TrafficSelector;
Instructions: header field modifications or specific output ports that are implemented as TrafficTreatment.
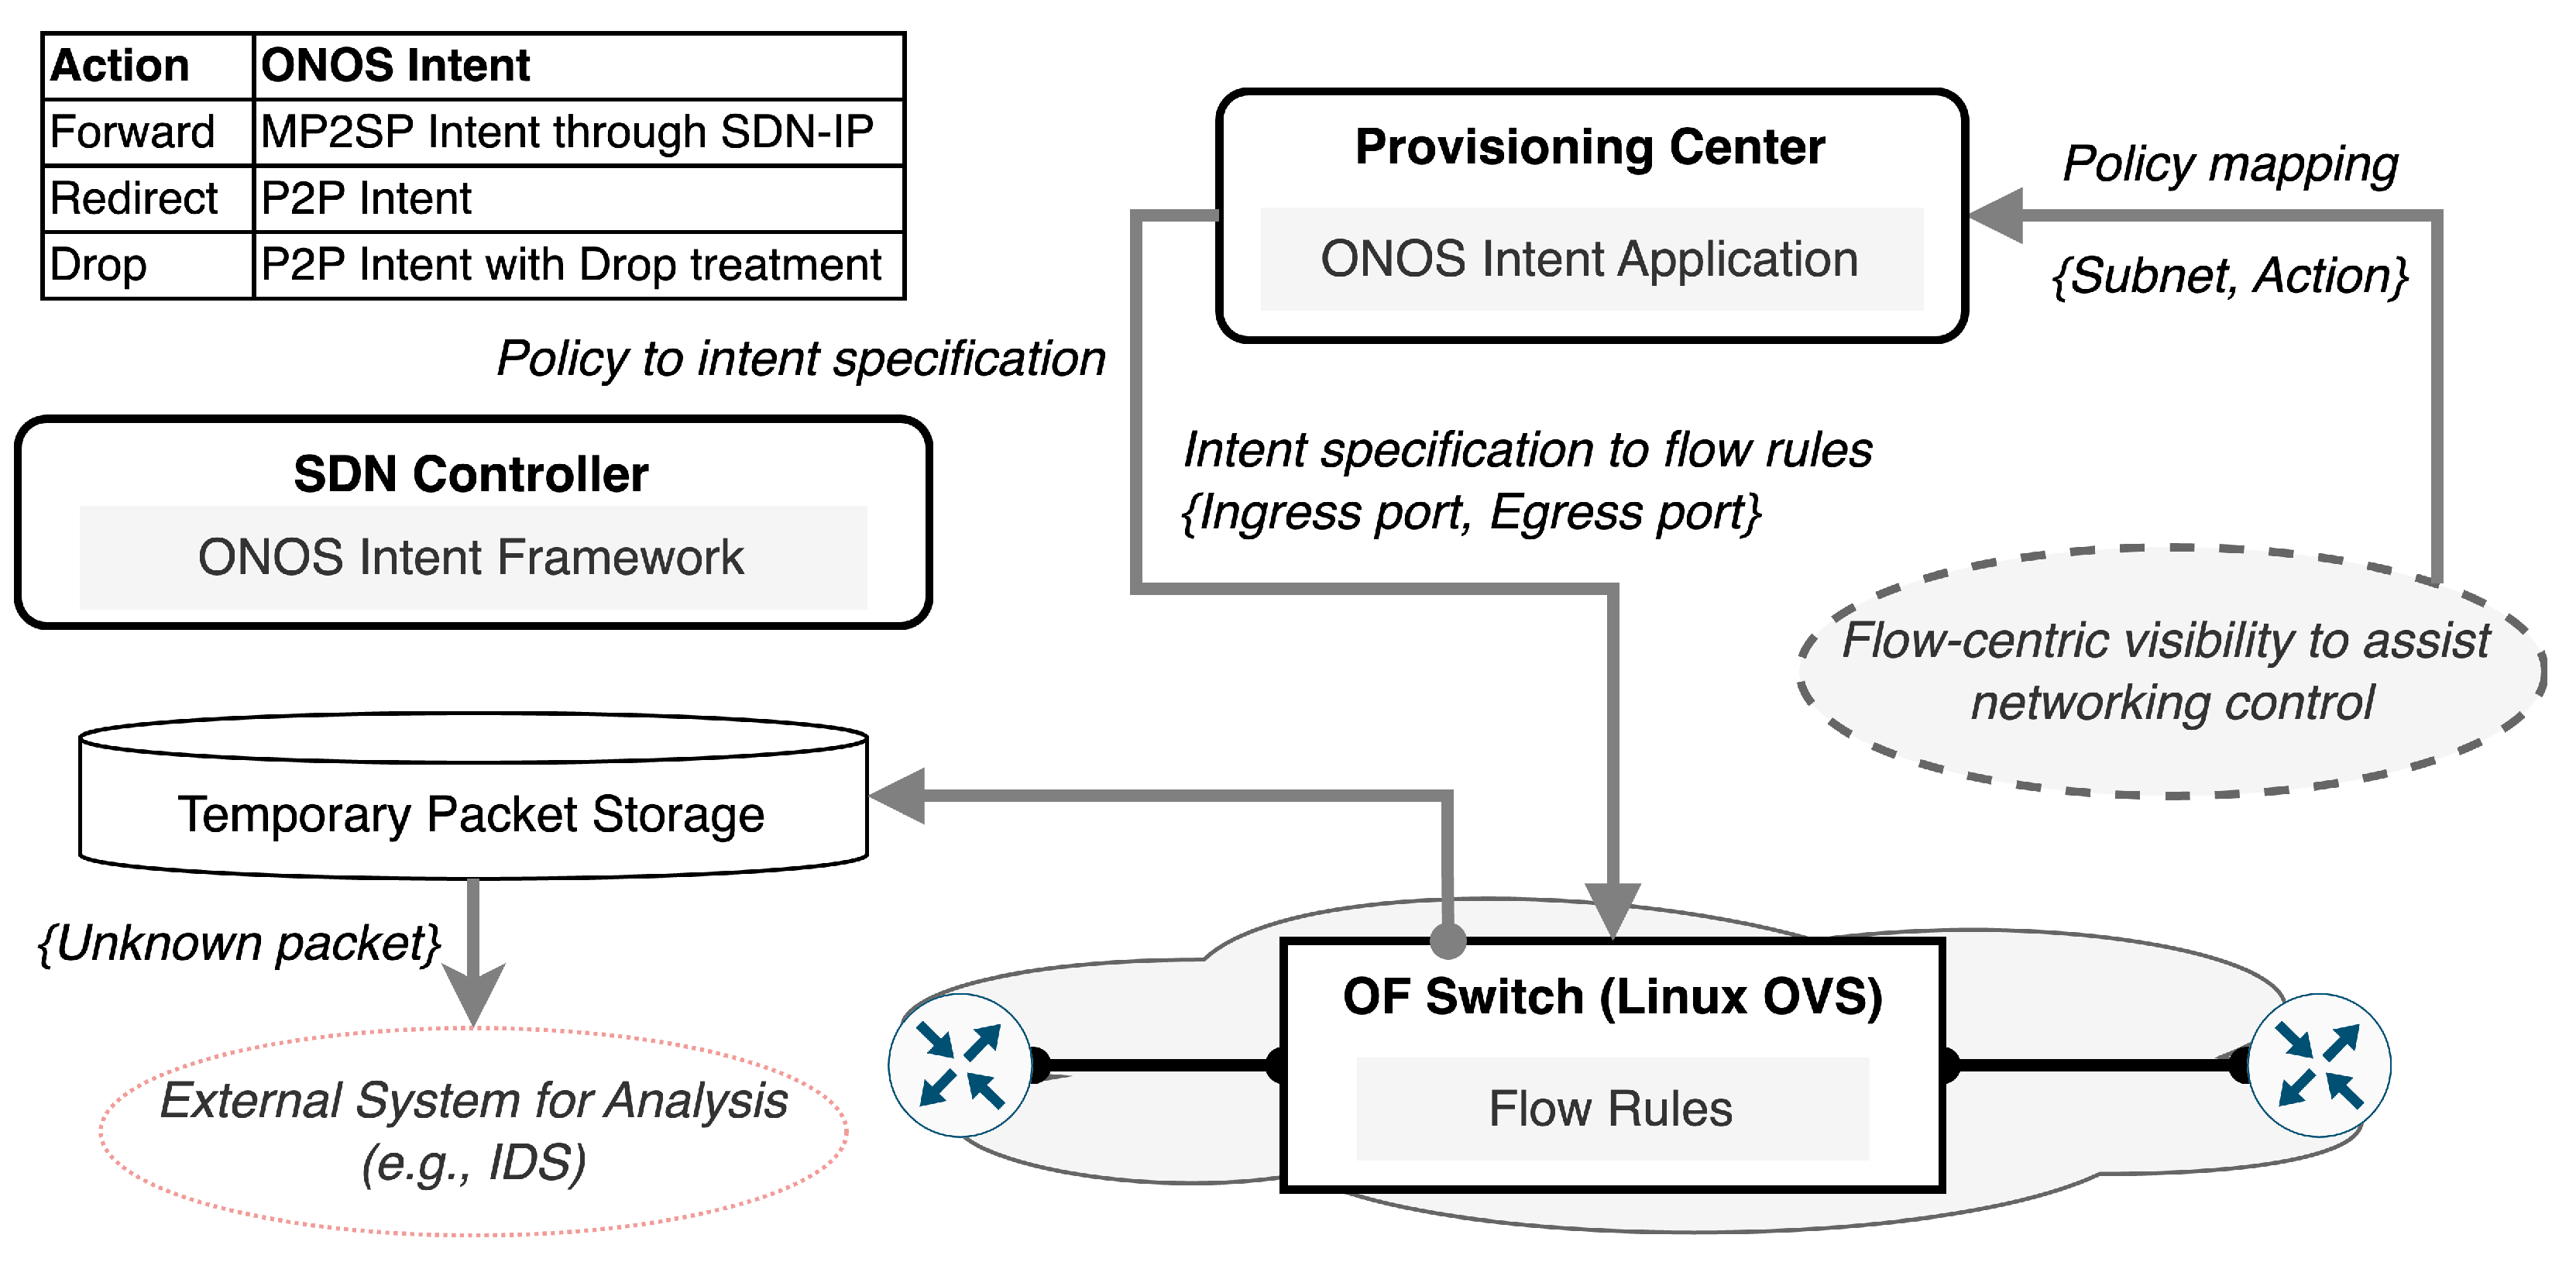
We design an ONOS intent-leveraged networking control application for applying a recommended policy for a specific type of flow received from the flow-centric visibility through ONOS intent specification, as depicted in
Figure 5. For a flow with forward policy, it keeps a related intent configuration with the proper device and ingress/egress port number where the flow is received/sent. A redirect policy is applied to point-to-point intent with a specific ingress port where small number of flows are coming from, and an egress port to send flows for further inspection by network IDS to detect attacks based on the signatures, or temporary storage for a short time period. Then, a blocking policy is applied to point-to-point intent with specialized instructions in the intent’s TrafficTreatment as a drop action.
A critical part of our design is an intent-leveraged application that needs to be implemented as part of the ONOS SDN controller. This application operates with the flow-centric visibility solution, interacting with it to receive queries and input. Specifically, it interfaces with flow-centric visibility to access information regarding specific source subnet addresses and their corresponding recommended policies. This interaction enables the intent-leveraged application to effectively translate these recommendations into actionable intents within the SDN controller environment. Through this seamless integration, the ONOS controller dynamically adjusts network configurations and policies based on the insights provided by the flow-centric visibility, thereby enhancing overall network management and control.
4. Implementation
In this section, we provide the implementation details of our proposed solutions. We outline the steps taken to realize each solution, including the deployment of necessary tools and technologies, configuration settings, and integration processes. Specifically, we elaborate on the implementation of IO Visor-based packet tracing for security-enhanced visibility, flow-centric visibility to assist networking control, ONOS intent-leveraged networking control, and any additional supporting frameworks.
4.1. Lightweight IO Visor-Based Packet Tracing for Security-Enhanced Visibility
Before enabling IO Visor-based packet tracing and collection, it is essential to verify that the target server’s Linux kernel supports eBPF, which is the case for any kernel version beginning with version 4.4.10, and that BCC tools/libraries are installed. This setup allows any Linux socket to be attached using user-defined tracing criteria. Such criteria are defined using the user-space program, through high-level programming such as Python. It is easier to write a BPF program with additional kernel instrumentation in C.
Our implementation of IO Visor-based packet tracing collects data from the network interfaces of Linux servers by attaching our user-space program to a Linux networking socket. Once attached, it starts tracing packet data based on the specified criteria within our program. Kernel networking I/O processes only incoming or outgoing packets that match with the criteria, and sends the traced data in raw bytes to the user-space program. Additionally, we also attach our program into the TCP kernel function to further trace data that contain specific TCP header information. This provides more kernel-specific details related to the TCP packet.
The first implementation of our IO Visor-based packet tracing is BPF code definition. For base collection, we define specific tracing criteria for collecting raw bytes from the 5-tuples of the IP-only packet. It traces all raw bytes of packet headers (i.e., Ethernet, IP, and TCP) and payloads, and only processes raw bytes that match with the criteria (i.e., 0x0800 is IP packet, 0x06 is TCP packet, and other criterion). It ensures that required fields are available before it sends the whole packet information into the user-space program. For TCP-sync collection, we define criteria to trace only the SYN-type of TCP connection from the packet header. It sends only traced packets to the user-space program for further processing and delivery. The detailed algorithms that logically implement our BPF programs are shown as Algorithms 1 and 2 for base collection and for TCP-sync collection.
| Algorithm 1 Packet tracing for Base Collection |
- 1:
Input: p ▹p = packet buffer - 2:
procedure BaseTracing(p) - 3:
if then - 4:
Drop the packet p - 5:
else - 6:
if then - 7:
Drop the packet p - 8:
else - 9:
Send the packet p to user-space - 10:
end if - 11:
end if - 12:
end procedure - 13:
Output: ▹ 5-tuples containing packet
|
| Algorithm 2 Packet tracing for TCP Sync-only Collection |
- 1:
Input: p ▹p = packet buffer - 2:
procedure TCPSyncTracing(p) - 3:
if then - 4:
Drop the packet p - 5:
else - 6:
if then - 7:
if then - 8:
- 9:
- 10:
- 11:
else - 12:
Drop the packet p - 13:
end if - 14:
else - 15:
Drop the packet p - 16:
end if - 17:
end if - 18:
end procedure - 19:
Output: ▹ TCP Sync packet fields
|
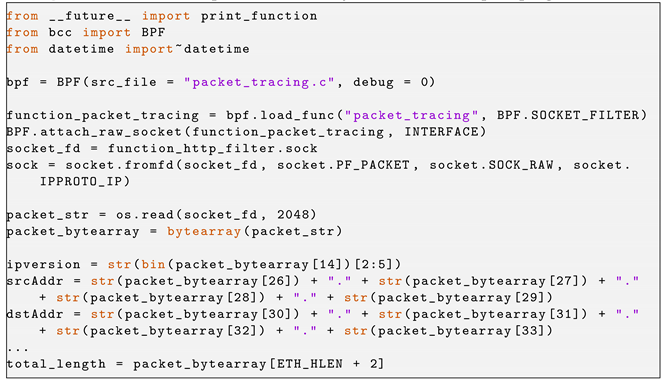
The second implementation is a Python-based program that runs in the user space. This program calls or loads the BPF programs by compiling them with LLVM, attaching to kernel space with the help of the BCC library, and hooking them as interpreted bytecode into the kernel hook point. For base collection, the Python program uses socket programming to hook the BPF programs into the Linux networking socket. All raw bytes of packet data received from that socket are translated into byte arrays. The same program extracts 5-tuples information from the packet by scanning and locating a specific range of arrays from the whole byte arrays, as shown in Listing 1. Similarly, for TCP-sync collection, a Python program is also hooked into the Linux networking socket, but it only extracts three pieces of information from a specific range of byte arrays to detect different TCP SYN messages communication in the Linux server.
| Listing 1. Base collection implementation in Python-based user-space program. |
![Futureinternet 16 00223 i001]() |
4.2. Flow-Centric Visibility to Assist Networking Control
Our flow-centric visibility solution is self-developed by leveraging various open-source software and programming languages. By leveraging these technologies and programming languages, we have developed a robust flow-centric visibility solution. Each component plays a vital role in this solution, contributing to the efficient collection, integration, storage, and visualization of network packet flow data. Here is an overview of the implementation details for each component:
The development of the visibility integration is one of the critical aspects of our solution, as it deals with diverse types of data and configuration inputs. Listing 3 provides an overview of the visibility integration process, illustrating how packets are aggregated and then clustered into classes such as identified, unknown, or suspicious.
| Listing 2. Submitting flow-centric application to Spark cluster. |
![Futureinternet 16 00223 i002]() |
| Listing 3. Visibility integration implementation. |
![Futureinternet 16 00223 i003]() |
The generated data are stored in the Elasticsearch database with a specific index named flow-control-policy. This database stores the clustered flow data, allowing for efficient querying and retrieval of flow control policies by the ONOS intent-leveraged networking control application. For instance, as illustrated in Listing 4, a specific subnet IP address is clustered as an identified flow and mapped with a forward policy recommendation from our flow-centric visibility solution. This mapping enables the ONOS intent-leveraged networking control application to query the data associated with the subnet IP address and apply the respective policy for each received route and intent.
| Listing 4. Flow to control policy mapping. |
![Futureinternet 16 00223 i004]() |
4.3. ONOS Intent-Leveraged Networking Control
Our implementation includes building an intent-leveraged application atop the ONOS SDN controller. This application relies on the ONOS intent framework to check and modify intent specifications. Currently, it is integrated with the ONOS SDN IP application that is used to establish inter-connection between the distributed cloud sites.
We implemented this application in Java because the ONOS intent framework only provides Java API for the ONOS application. This application requires two mandatory parameters as the inputs (i.e., subnet address and recommended policy). It can query and partially modify/override the SDN IP intent specification for a specific given subnet address, which is important to identify the originating site (e.g., AS - autonomous system) and respective controller for that subnet. It checks the originating AS number through BGP route information and also finds the authorized controller for that AS number from the ONOS network configuration.
Before defining a new intent specification for a subnet, it checks for any installed intent for that subnet in the local or remote controllers. Depending on the recommended policy from the flow-centric visibility, this application submits an intent specification into the ONOS intent framework for compilation. Currently, we only implement redirect and drop policies, while the forward policy follows the default of SDN IP application intent.
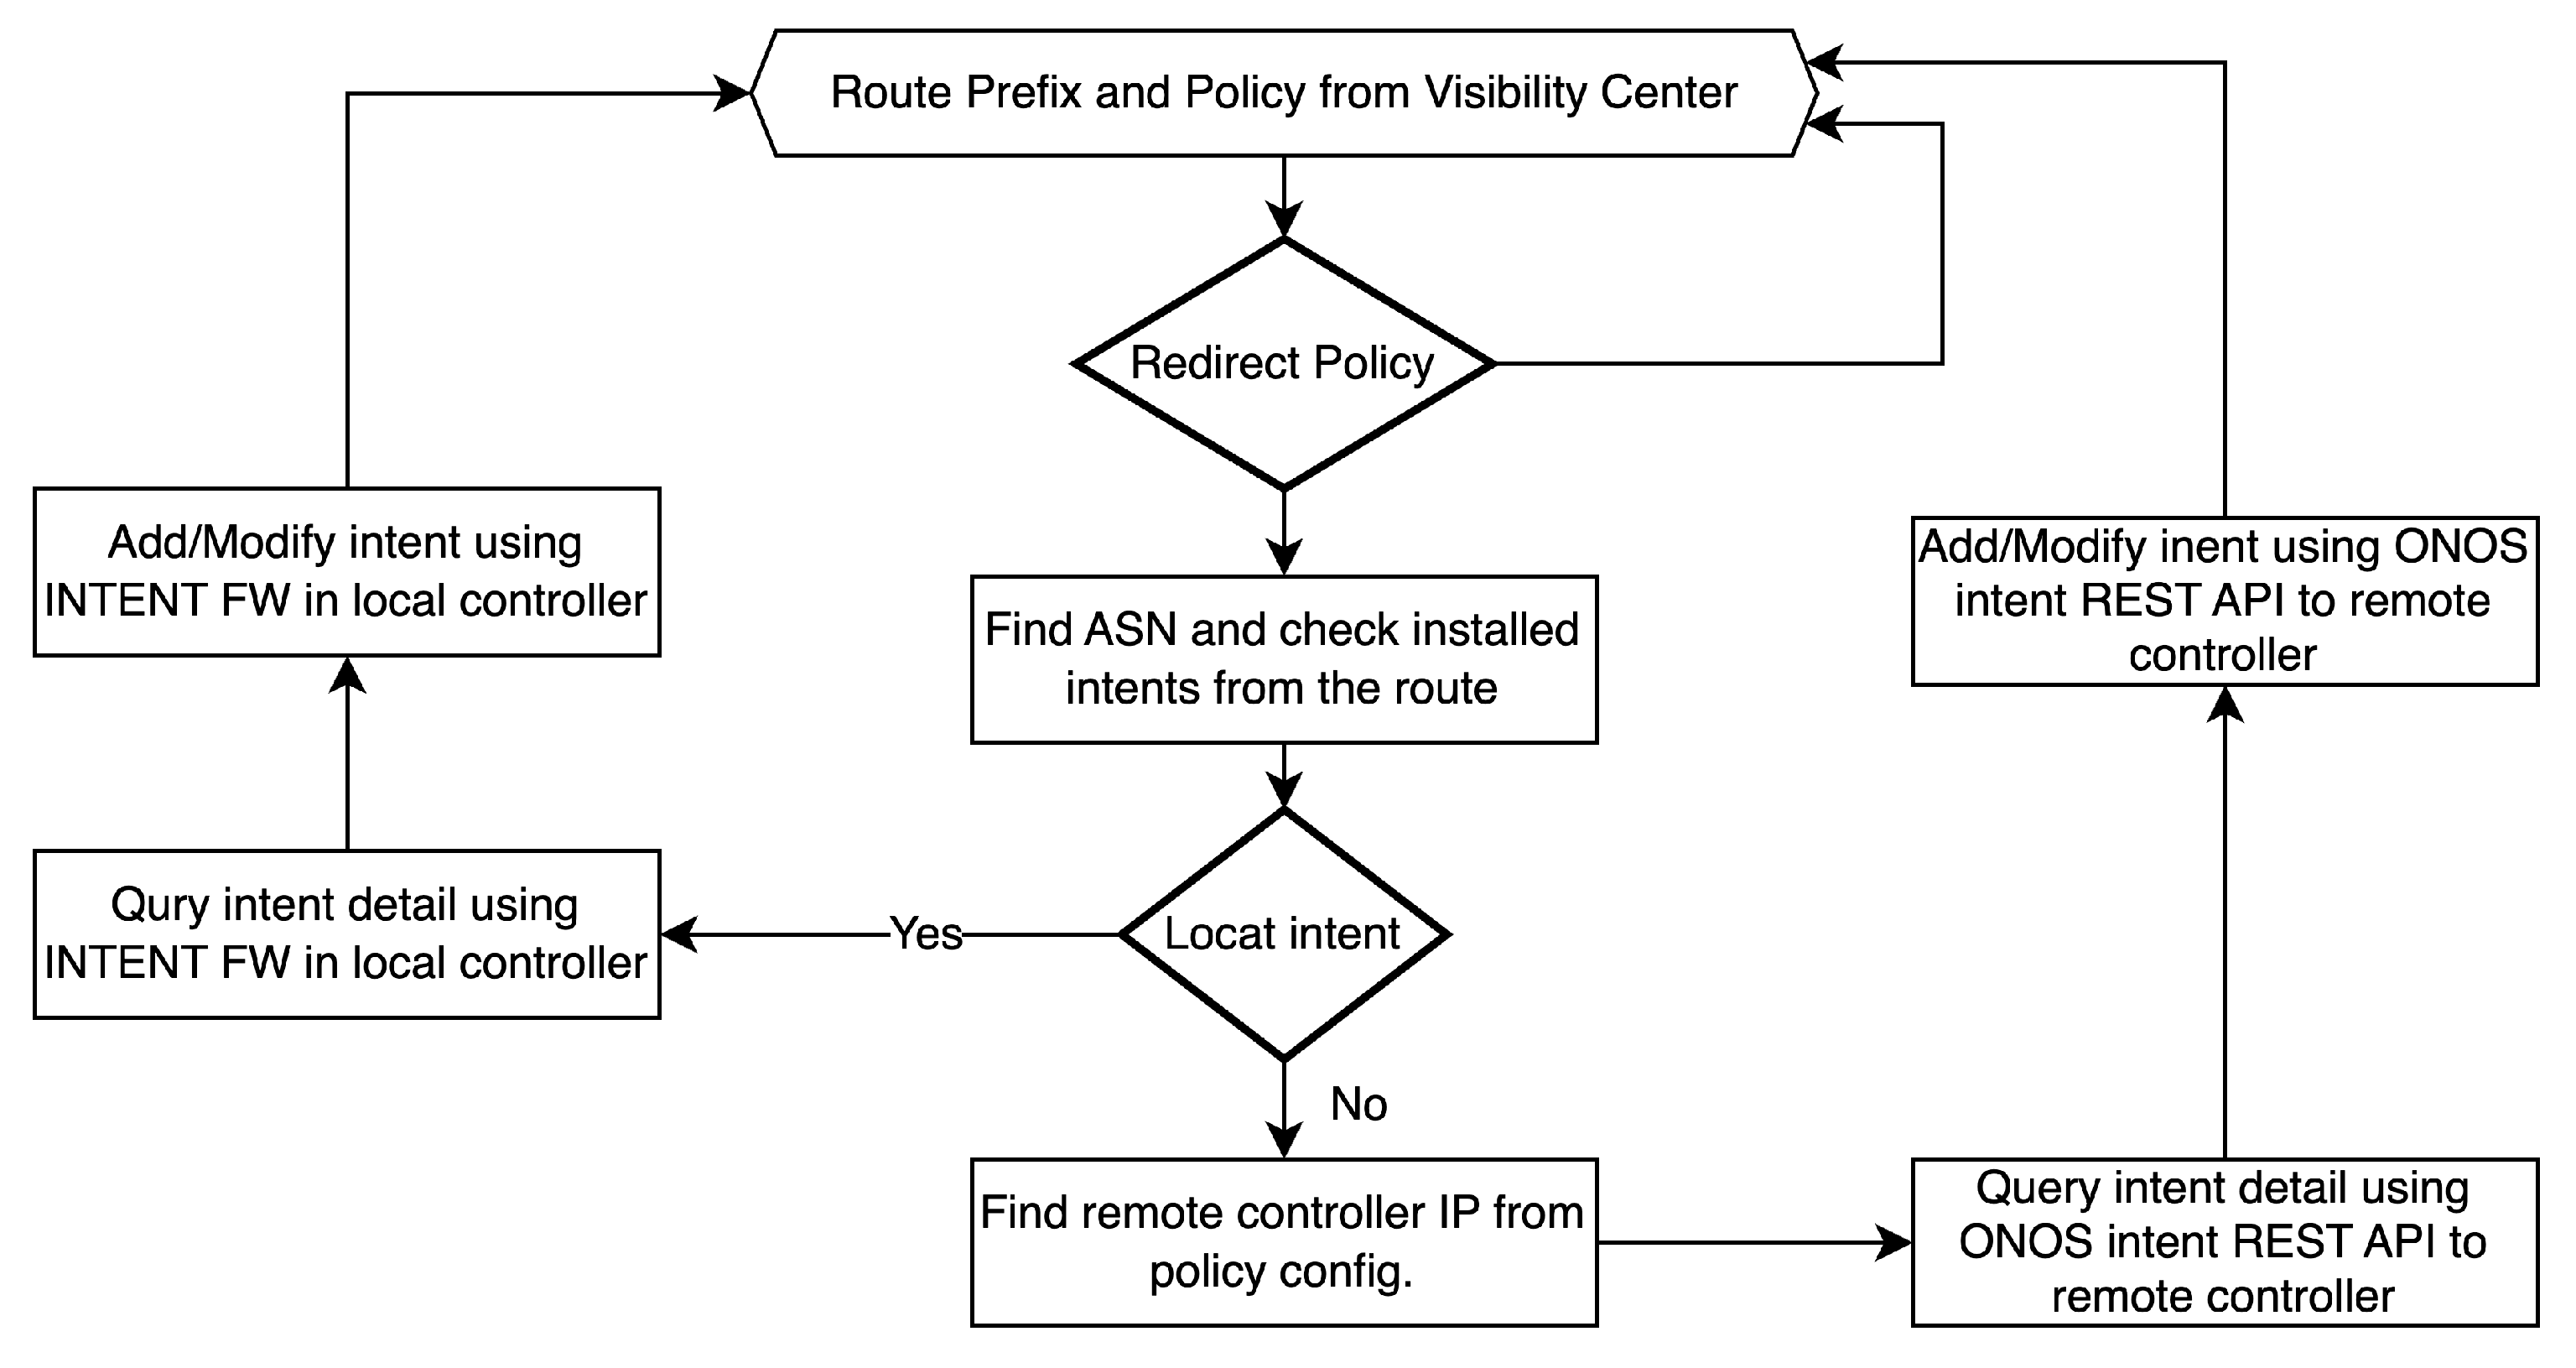
The application creates a point-to-point intent specification with different TrafficTreatment. The redirect policy needs to set the inspection port as the egress port without changing the TrafficTreatment, while the drop policy ignores the egress port but adding drop as TrafficTreatment. The detailed logic of this application is shown in
Figure 6.
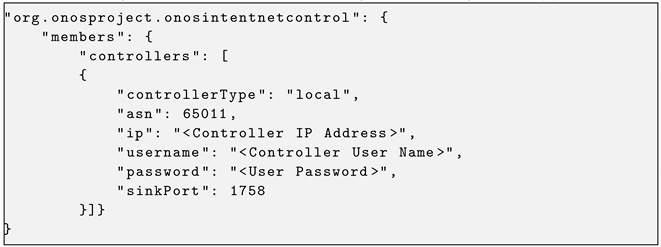
To limit the authority of the application in querying and configuring the ONOS intent in a multi-controller environment, basic authentication is also defined as part of the ONOS network configuration. This includes specifying the local or remote site, controller IP address, account (username and password) information, managed AS number, and redirection or inspection port (i.e., sinkPort), as shown in Listing 5. If multiple controllers are working together, then each controller needs to be added manually in the controller configuration. This addition requires careful management of the configurations, as they contain sensitive credential information for all controllers. Additionally, communication based on Elasticsearch APIs is developed to retrieve recommended action policies for specific subnets from received route information. This integration streamlines the retrieval of visibility data and their utilization in determining appropriate networking policies.
| Listing 5. Configuration for ONOS intent-leveraged networking control application. |
![Futureinternet 16 00223 i005]() |
5. Experimental Results
We conducted experimental evaluations over the OF@TEIN Playground [
26] where we verified the end-to-end integration of proposed solutions, demonstrating how packet tracing results were analyzed at the visibility center and translated into ONOS intents for networking control. Performance measurements presented in this section include assessing the efficiency of IO Visor-based packet tracing, the clustering efficiency of our flow-centric visibility solution, and the execution time of our ONOS intent-based networking application, showcasing the scalability and effectiveness of our proposals.
5.1. Experimental Environment
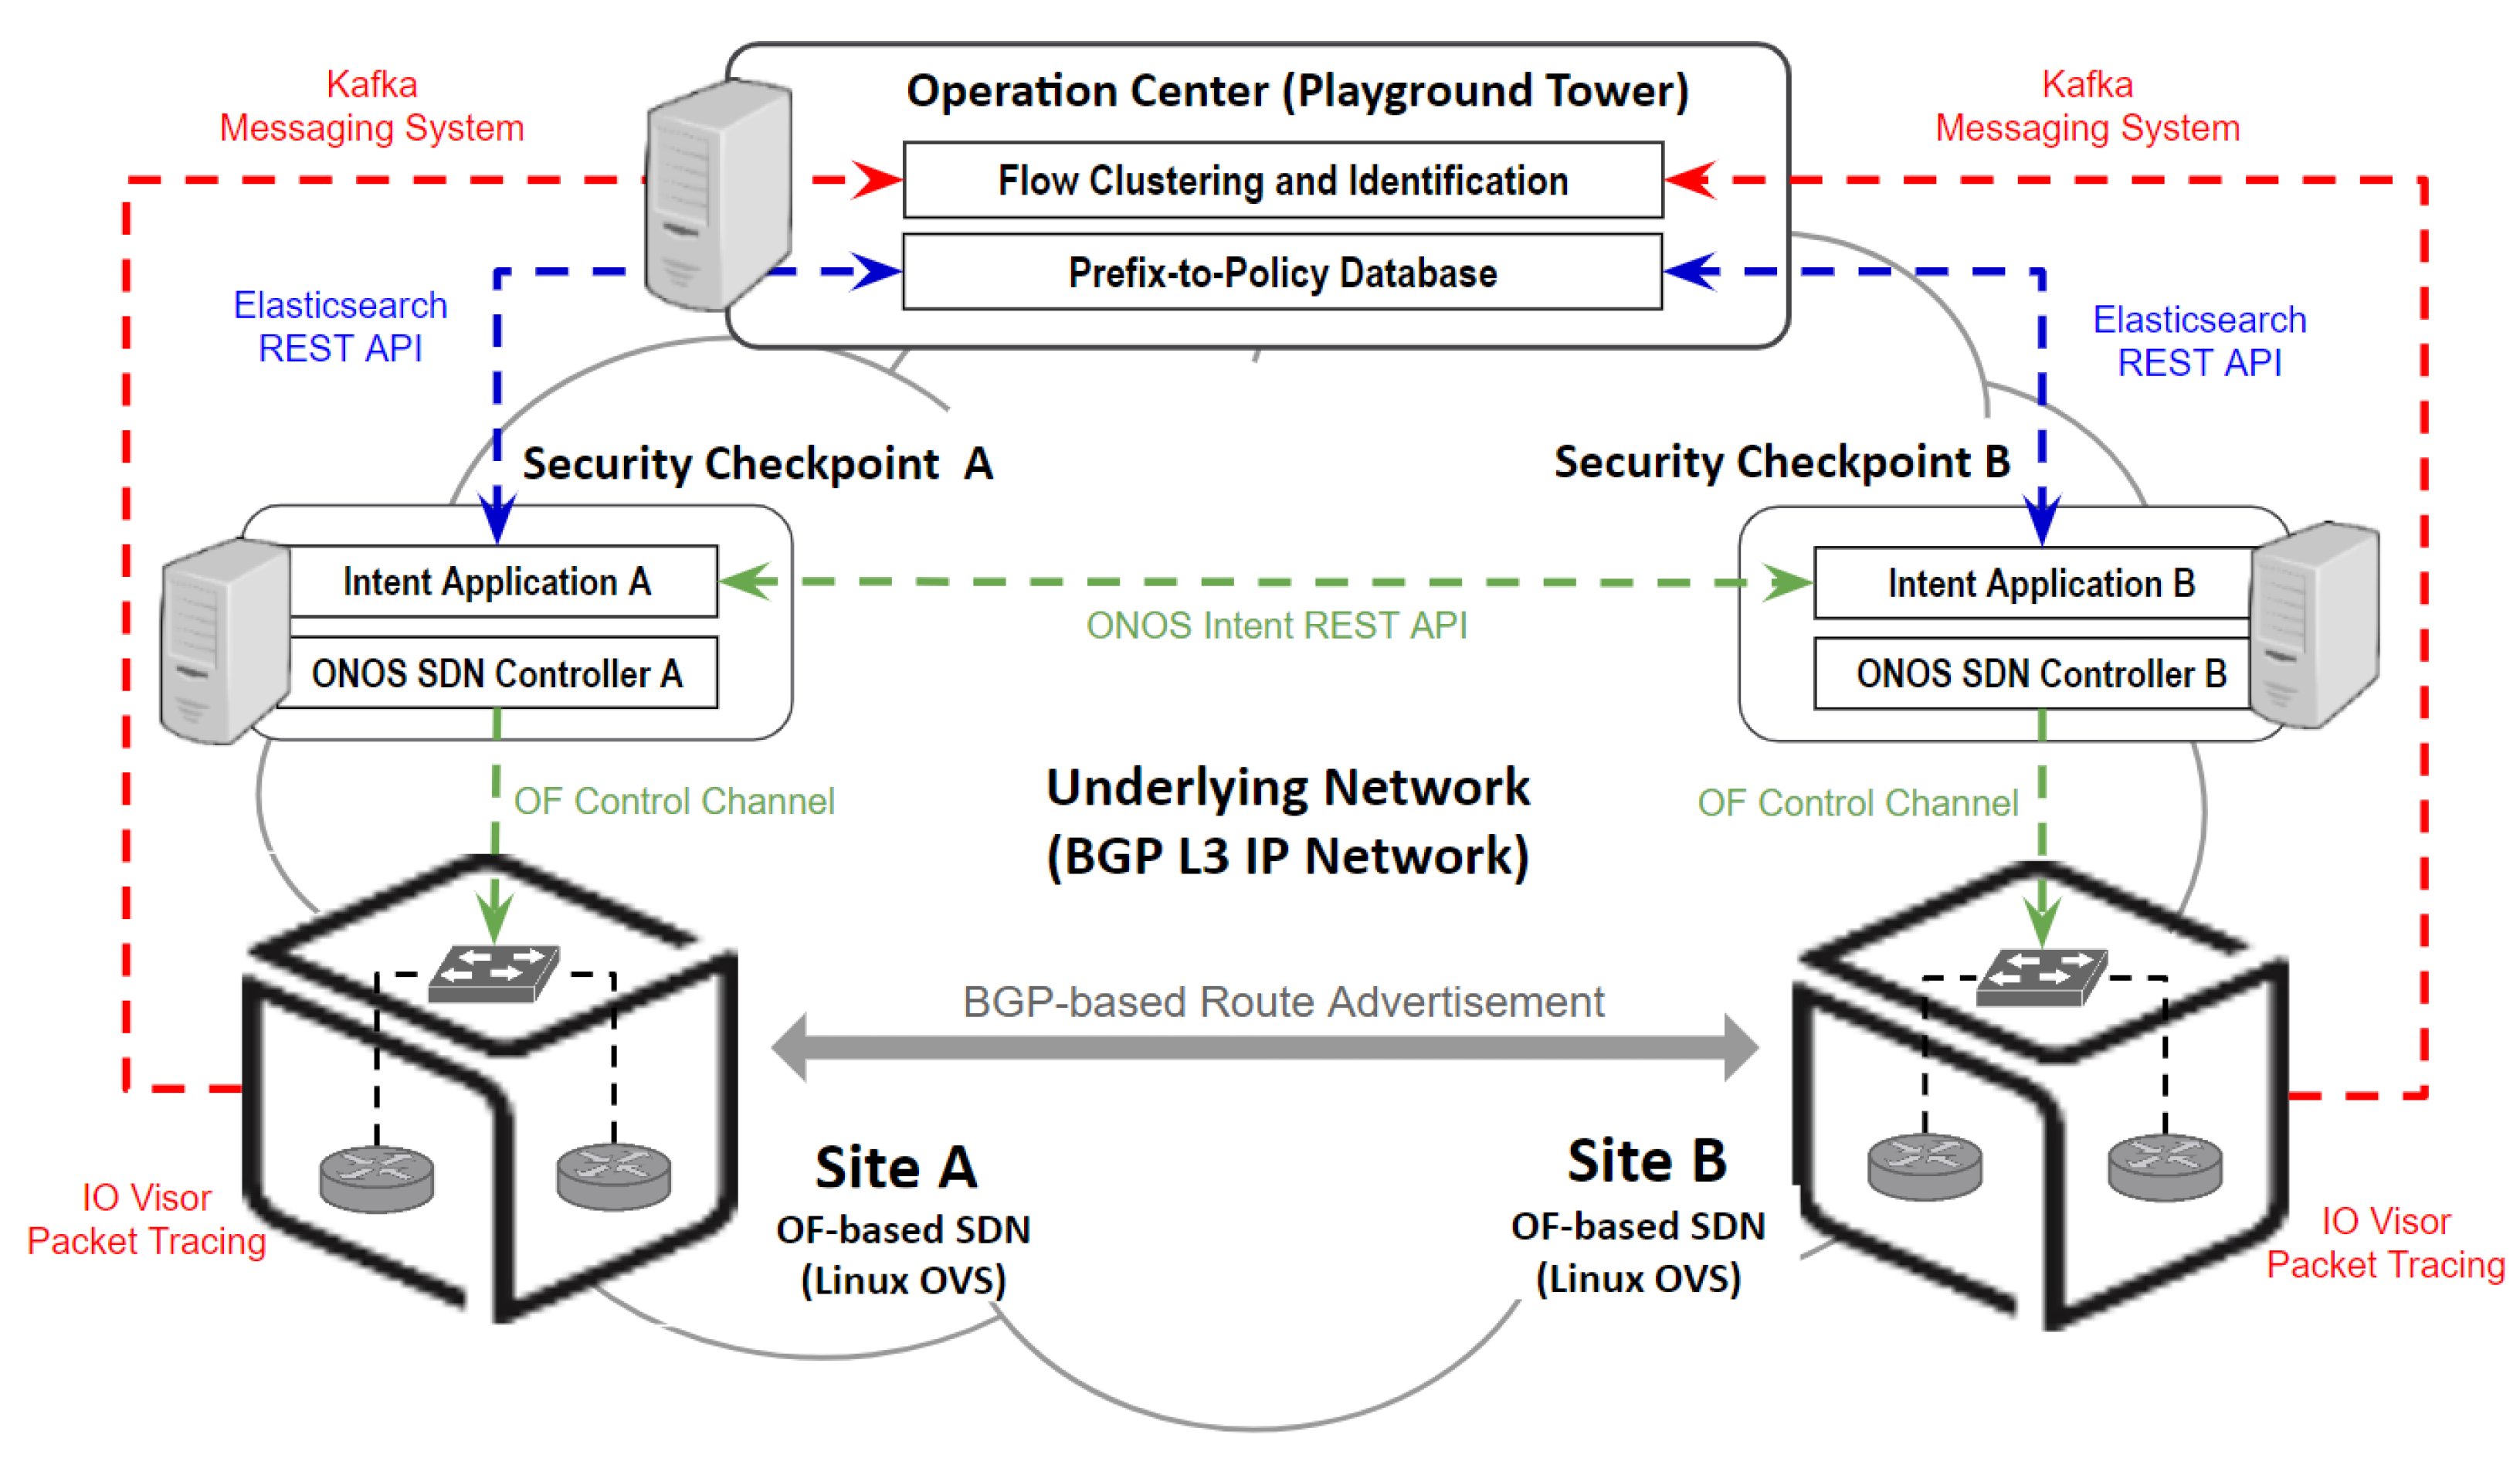
To verify proposed solutions for enhancing networking control through intent-driven mechanisms and flow-centric visibility, we conducted experimental simulations using the OF@TEIN Playground. OF@TEIN is a distributed multi-site cloud testbed enabled with SDN technology, linking 10 international sites across nine Asian countries. It dynamically allocates resources for a variety of experiments. The playground operates with Playground Tower overseeing its functions. The topology of our experimental environment is depicted in
Figure 7. During the experiment, we collected network traffic data from the playground sites, where Linux servers (referred to as SmartX boxes) are hosted. Subsequently, these traffic data were analyzed at the visibility center to formulate recommended policies for each identified flow class, as per our flow-centric visibility solution.
5.2. End-to-End Integration Verification
To verify the end-to-end integration of the three proposed solutions, we first ran packet tracing on specific physical network interfaces of the SmartX box, where all the packets are coming/going from/to the box/site.
Figure 8 shows the result of packet tracing, which contains traced network packet data and is sent to the visibility center for analysis. This figure also shows the analysis results of the collected data, organized based on IP prefix and their assigned recommended policies. Following the analysis, the ONOS application identified the authorized AS number and SDN controller information. Subsequently, it translated the recommended policies into ONOS intents, as depicted in the figure.
5.3. Performance Measurements
5.3.1. (Kernel/User)-Space Tracing Performance of IO Visor-Based Packet Tracing
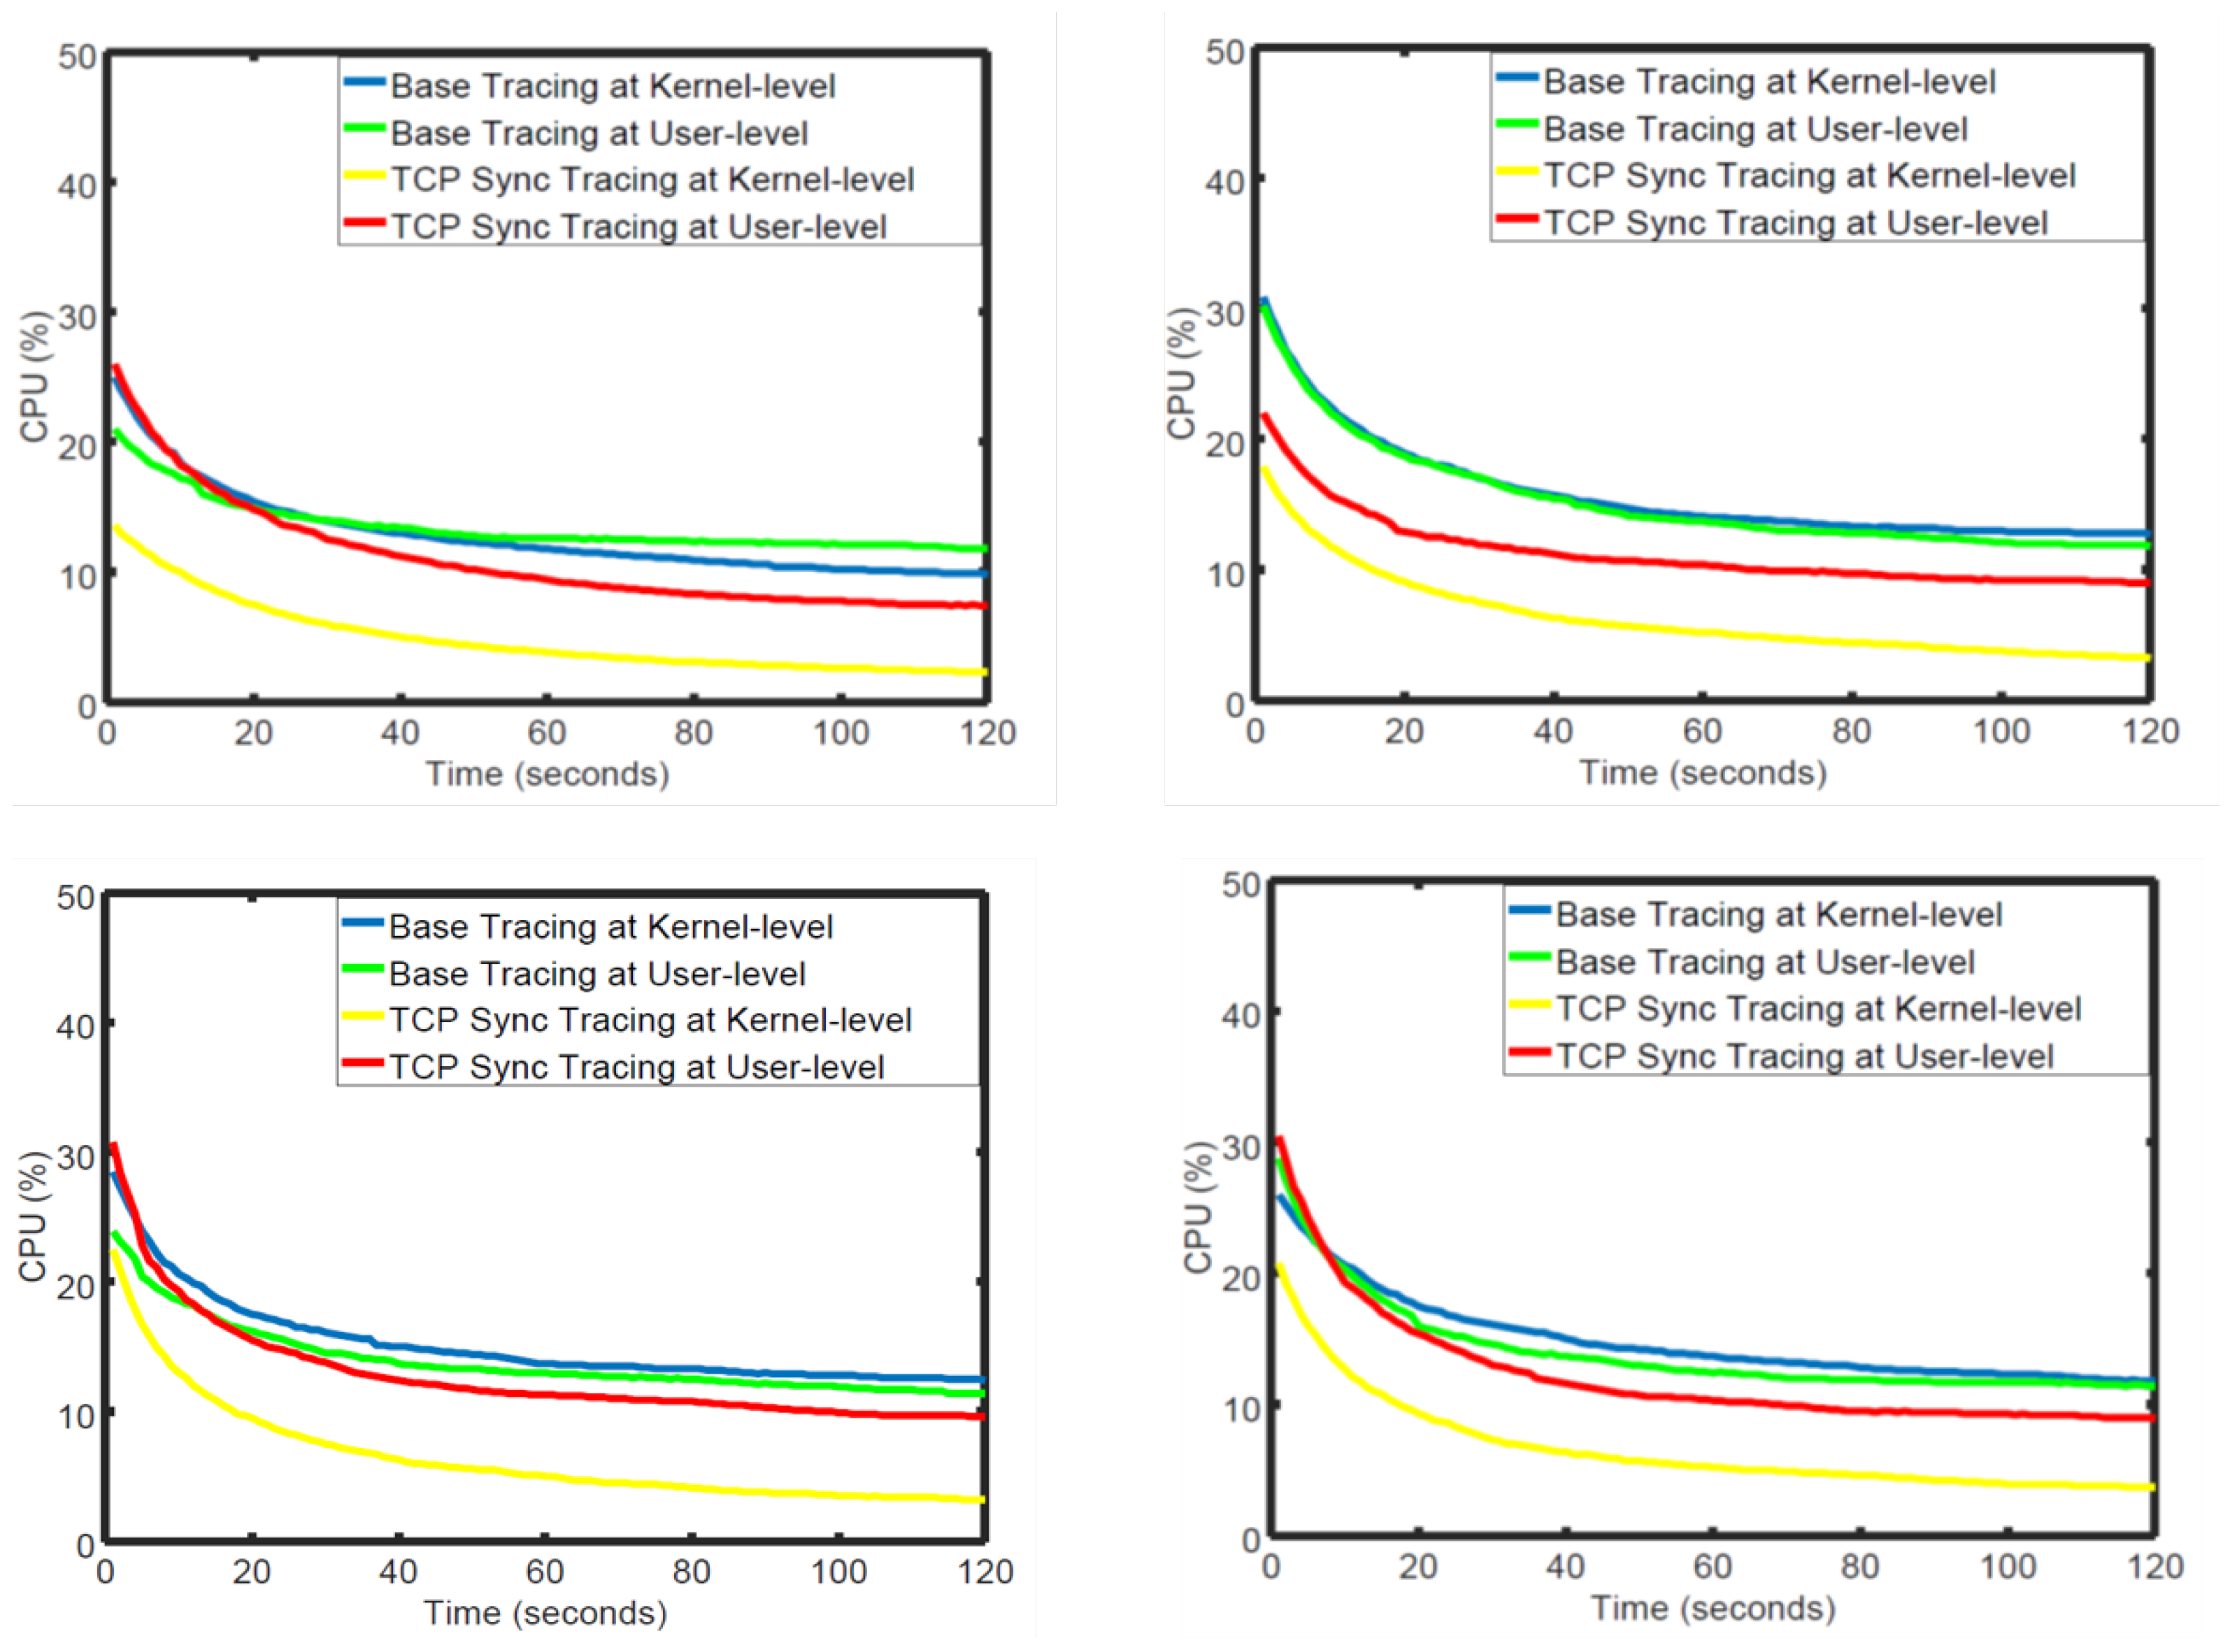
To show the efficiency of IO Visor-based packet tracing collection, we measured the Linux-based SmartX box performance during the data collection for both base collection and TCP-sync collection. We also performed measurements in two different spaces of the OS for tracing collection. First is in the kernel space using BPF bytecode. Second is in the user space (using the Python program with a BCC library) where a string is converted into byte arrays, which is very similar to existing packet-capturing tools.
We assessed the CPU utilization, memory usage, and amount of collected packet data under various traffic patterns, including background and attack traffic, generated within our testing environment. Iperf [
27] was utilized to generate background UDP traffic with a specific size (i.e., 10 MB). The Nmap scanning tool [
28] was used to randomly generate TCP-sync traffic at different rates, resulting in varying amounts of attack traffic (i.e., 1, 2, 5, and 10 MB).
Figure 9 shows the measurement results of the performed experiments. The CPU performance of base collection is almost similar for all traffic patterns, in either the user space or kernel space. However, the TCP-sync collection has significantly different values, which are around 10%. This indicates that implementing IO Visor-based packet tracing in the kernel space gives better performance than the tracing in the user space. Regarding memory usage, we observed similar values for both base collection and TCP-sync collection in both user-space and kernel-space tracing, thus detailed figures are not reported.
Figure 10 shows the significant differences in the amount of traced data between base collection and TCP-sync collection, in both kernel-space and user-space tracing. Notably, the lowest amount of traced data was observed for TCP-sync collection in the kernel space, indicating potential for detecting TCP-based SYN attacks with less than 1 MB of traced data over a two-minute measurement period, with an attack rate of 1 Mbps.
5.3.2. Processing Efficiency of Flow-Centric Visibility
The performance evaluation of our flow-centric visibility solution mainly focused on a detailed assessment of the visibility integration solution’s efficiency. We meticulously compared the number of collected data to the clustered, identified, and mapped policy data. As the volume of traced packet data increased, we measured the processing time of the Spark-based visibility integration to assess the overall performance of our solution.
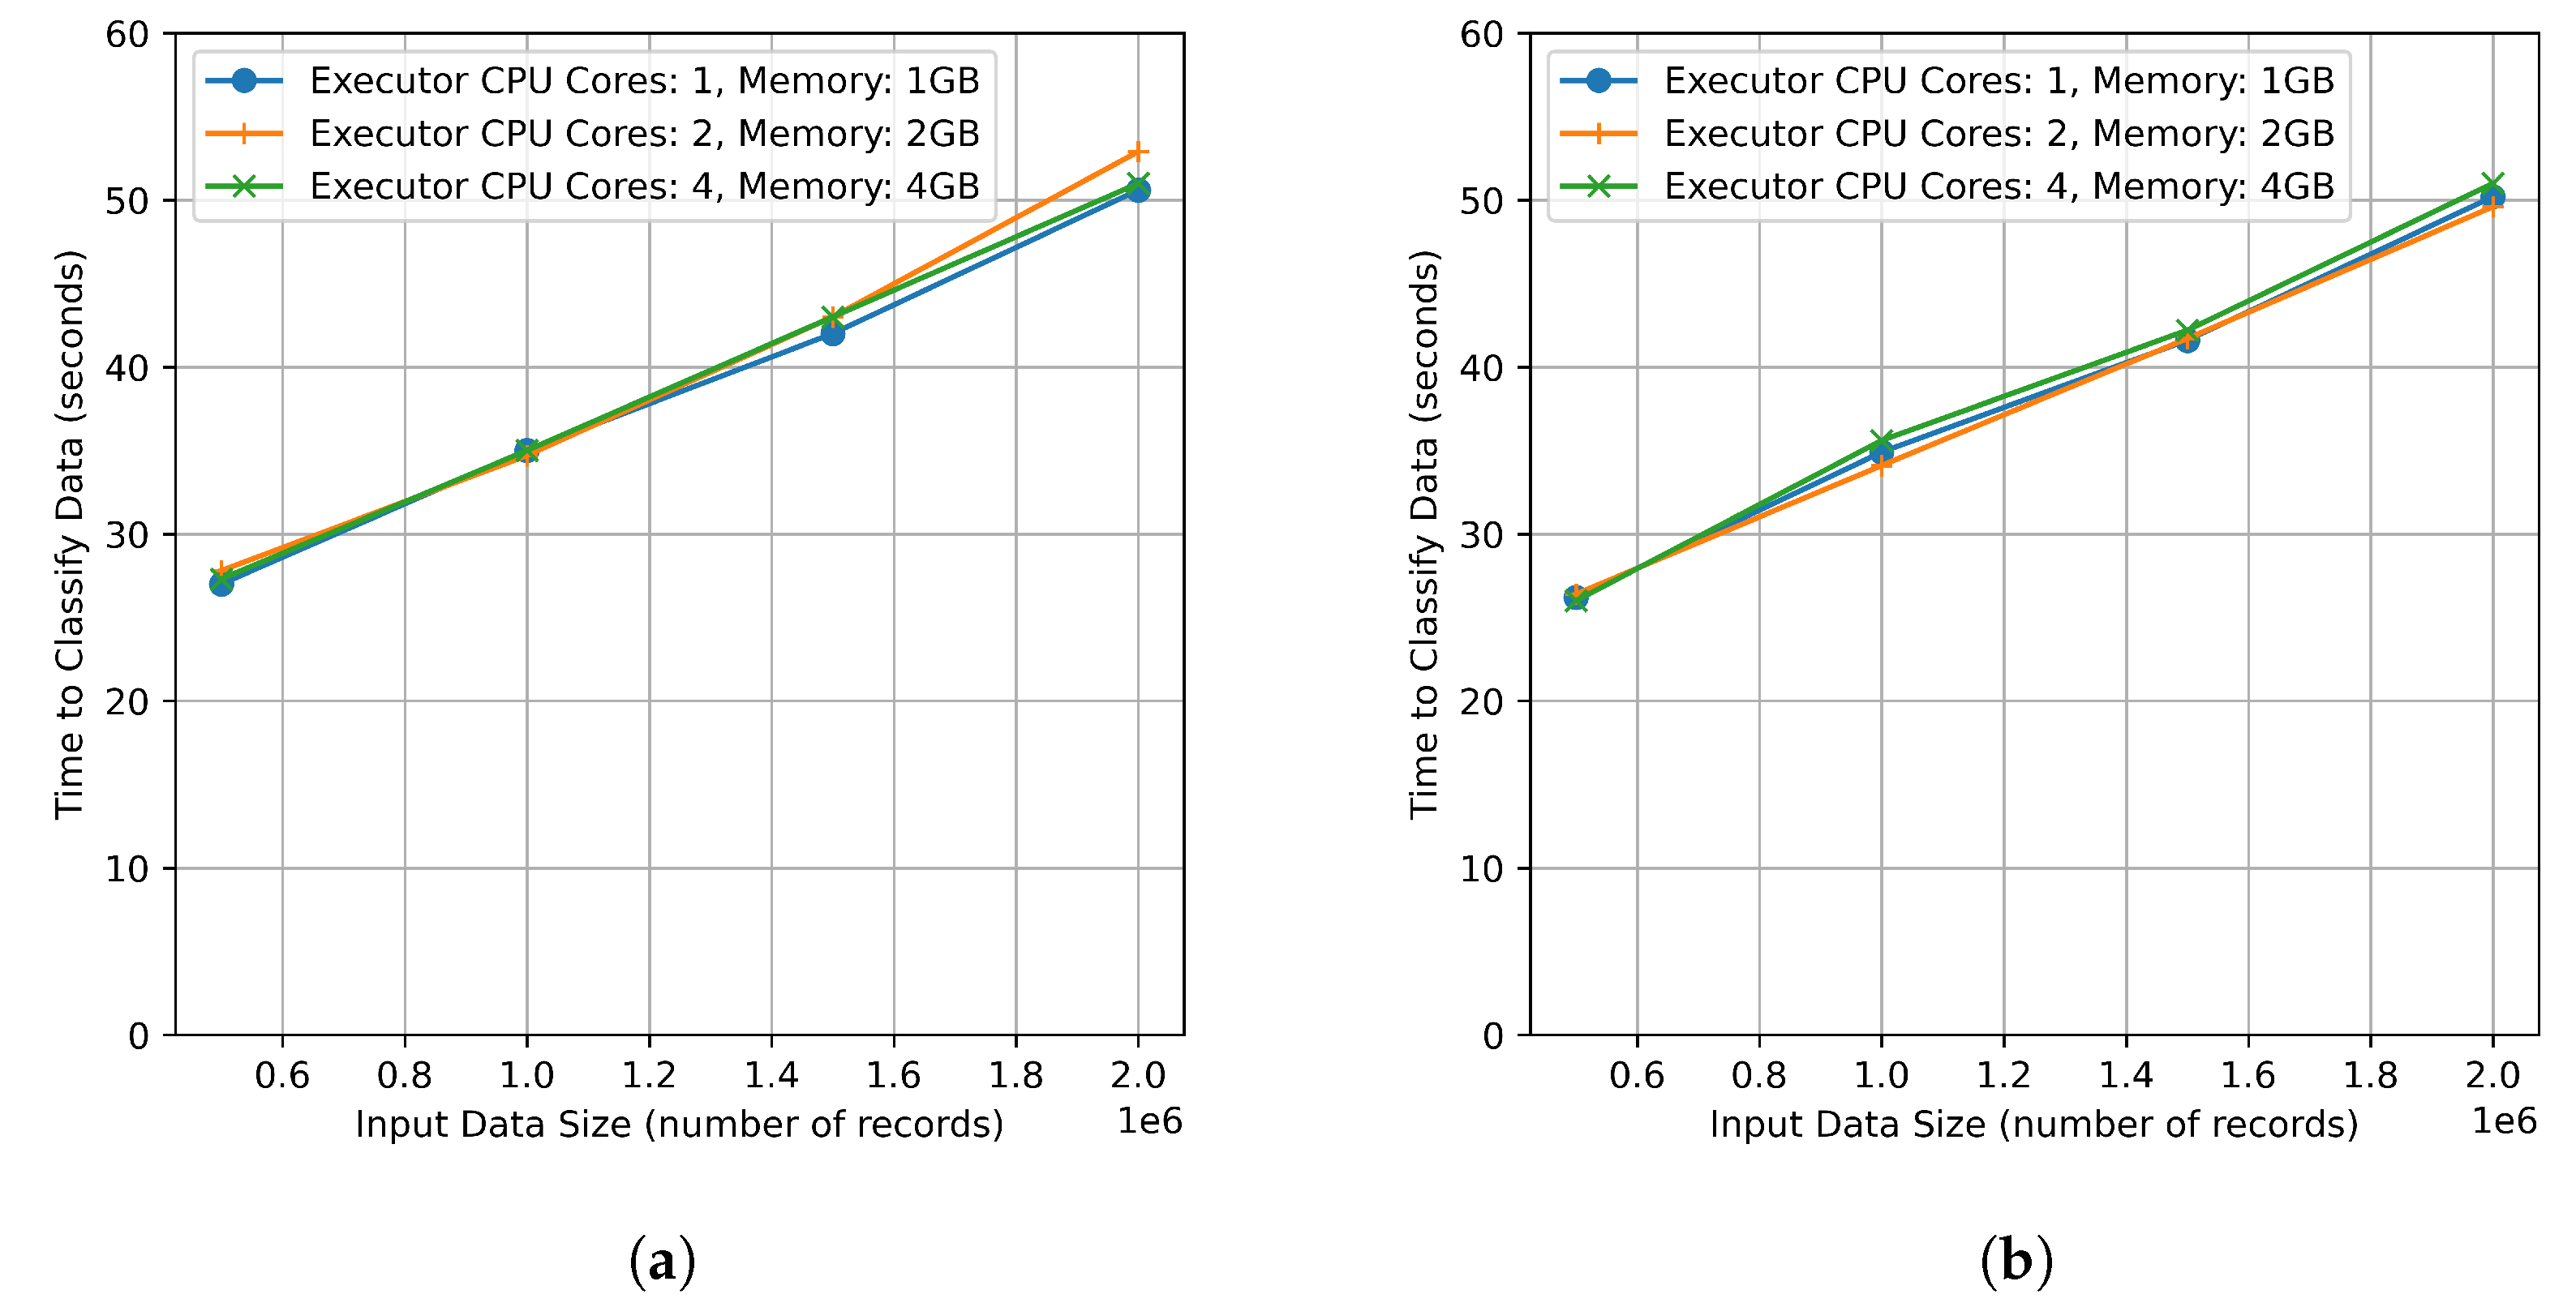
For the performance evaluation, we set up a two-node cluster using two physical machines, each with 8 CPU cores and 16 GB of memory. One machine served as the master, while the other functioned as the Spark worker, executing the flow-centric visibility application. The Spark analytics engine was configured to run in a standalone cluster mode. Our experiments involved different configurations of CPU cores and memory assignments for both Spark Driver and Spark Executor processes to evaluate performance under various network packet flow counts (i.e., ranging from approximately 0.5 to 2.0 million). In Scenario 1, we configured the Spark Driver with one CPU core and 2 GB of memory. In Scenario 2, we configured Spark Driver with 2 CPU cores and 4 GB of memory.
In Scenario 1, as shown in
Figure 11a, all three executor configurations display a positive linear trend, indicating that the time required (i.e., in seconds) to classify data increases proportionally with the input data size. This trend demonstrates the flow-centric visibility solution linear scalability concerning data size. Notably, the time differences between the various executor configurations are minimal, suggesting that the performance limitation probably arises from the single CPU core and 2 GB memory configuration of the Spark Driver rather than the executor configurations.
Like Scenario 1, as shown in
Figure 11b, all three executor configurations in Scenario 2 display a positive linear relationship between data size and classification time. However, overall time is slightly lower across all executor configurations than in Scenario 1. This performance improvement can be attributed to the enhanced resource allocation to the Spark Driver, which enabled better handling of larger network packet flows and more efficient management of distributed computing tasks.
Both graphs from our performance evaluation demonstrate scalability in terms of input data size, as indicated by the linear increase in processing time with increasing data volume. This linearity shows the flow-centric visibility solution’s ability to handle larger network packet flows effectively. However, the flattening of differences between executor configurations as data size increases may indicate that we are nearing a point where additional gains from additional executor resources are limited unless coupled with equivalent increases in driver capabilities or optimizations in data handling and task distribution strategies.
In summary, our analysis indicates that increasing the number of assigned resources to the Spark analytics engine improves the efficiency of the visibility integration solution, as evidenced by the linear increase in processing times with larger network packet flow data. Overall, this demonstrates the scalability and effectiveness of our flow-centric visibility solution in handling large volumes of network packet flow data while maintaining reasonable processing times, even with low resource allocations for the flow-centric visibility solution processing.
5.3.3. Execution Time of ONOS Intent-Based Networking Application
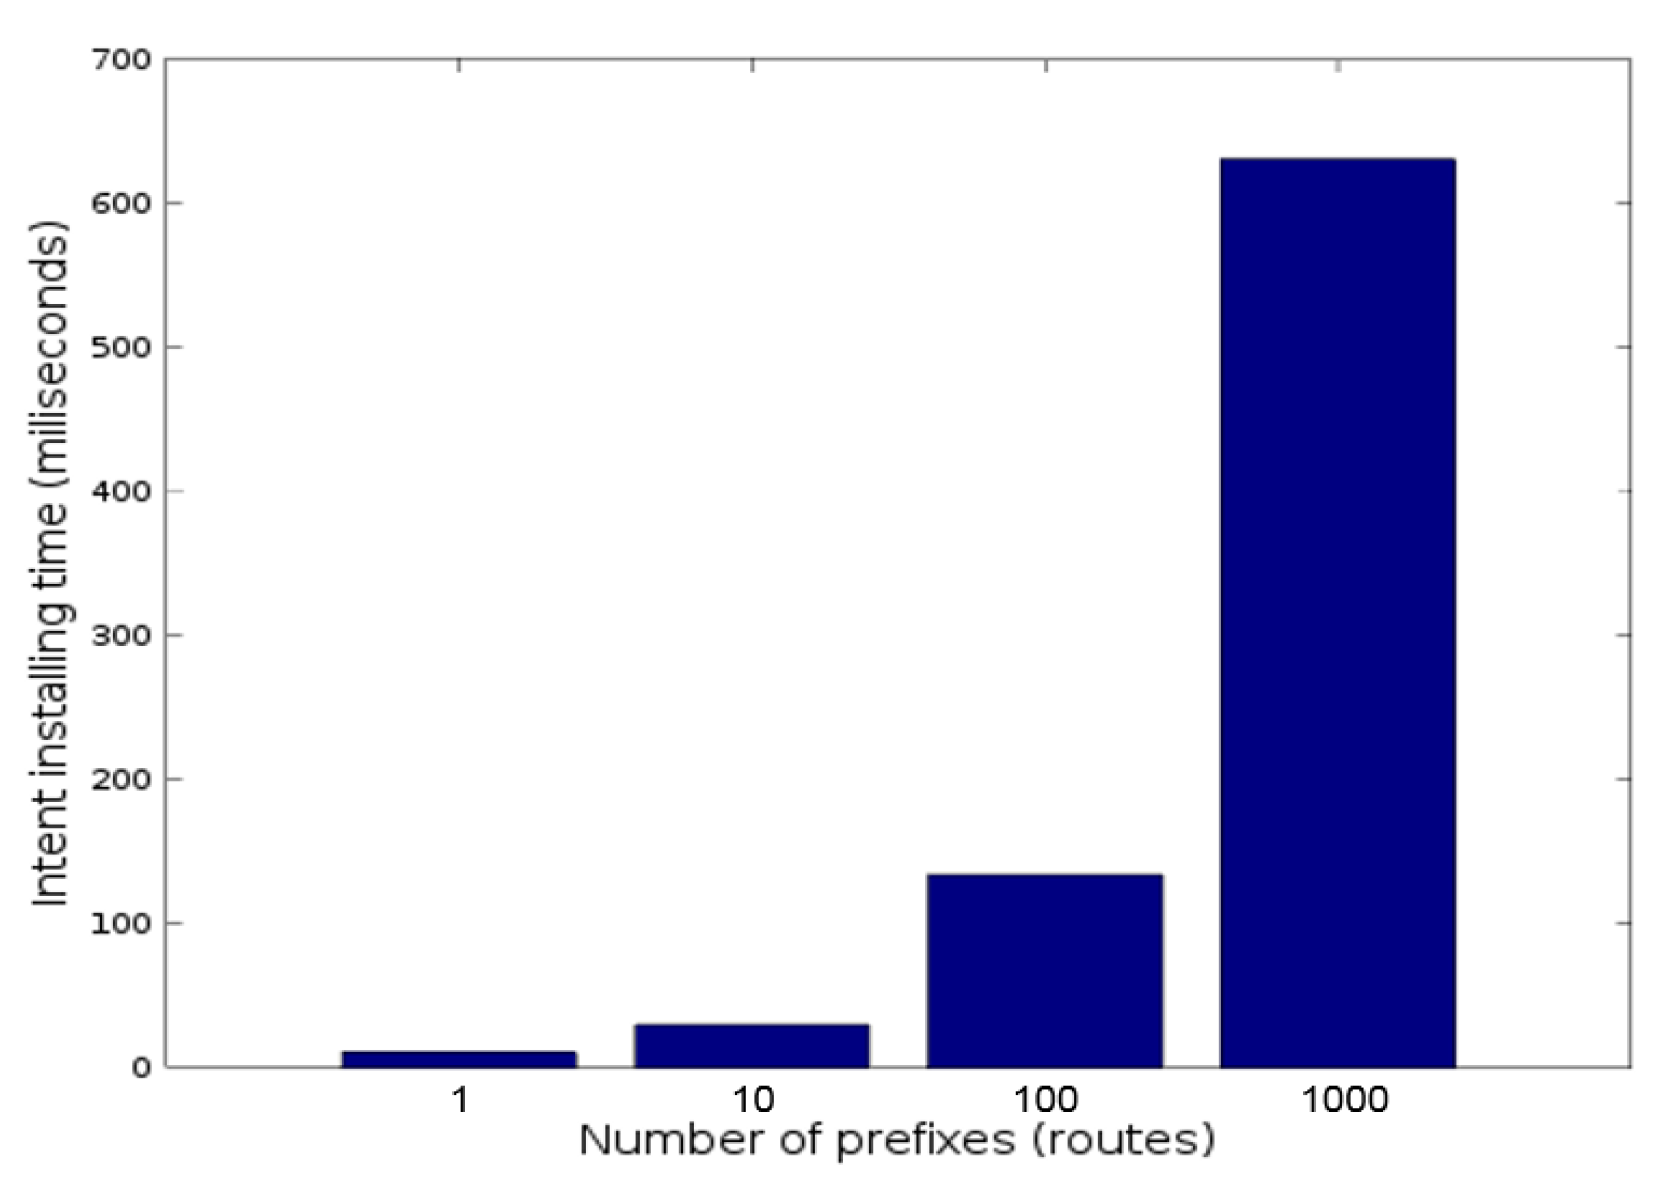
We measured the execution time of our intent-based application by determining the time taken to install the received recommended policies into the ONOS intent framework when there were existing intent entries based on IP route prefixes received from the BGP router. This measurement was performed with a varying number of intents based on the received route prefixes (i.e., 1, 10, 100, and 1000). To generate route prefixes for testing, we employed bgptools (
http://nms.lcs.mit.edu/software/bgp/bgptools/, accessed on 22 June 2024) , which injects route prefixes with a BGP dumped routing table obtained from RIPE NCC (
www.ripe.net, accessed on 22 June 2024). These route prefixes were then translated into ONOS intents. The objective was to analyze the efficiency and behavior of our application in controlling networking within the hybrid SDN-IP interconnection environment.
As shown in
Figure 12, we observed a linear increase in execution time with the increment of the number of BGP routes that needed to be installed by the ONOS intent framework. If we compare the measurement results with the BGP routing convergence time, as mentioned in [
14], the intent installation time is much faster than the BGP convergence time. For example, with 100 routes, the intent installation was completed in 134 milliseconds after the BGP routing converged in more than 10 s. Similarly, for 1000 routes, it required 631 milliseconds (less than one second) to install the intent, compared with 14 s for the BGP routes to converge. It shows that IBN control is more efficient than relying on the BGP routing protocol, especially during an immense DDoS attack. The attack from one AS may spread to many victim ASes before BGP manages to detect or respond to the attack.
6. Discussion and Future Directions
In this section, we discuss two important aspects of the proposed solution: its use case scenarios and future directions. While this work is still in the early stages of implementation and verification, it has been tested in a small yet real-world distributed testbed across different geographical locations within the OF@TEIN testbed. We believe the proposed solution could be beneficial for various use case scenarios, particularly in connecting distributed computing resources. Some of the key scenarios include:
Cloud networking: this involves connecting a distributed public cloud infrastructure spread across multiple regions via the Internet, providing inter-region visibility and control capabilities. Although the cloud is operated by a single provider, it is crucial to prevent any attacks or incidents in one region from spreading to other regions.
Multi-domain attack mitigation: this scenario involves multiple autonomous systems (ASes) on the Internet collaborating to detect and mitigate distributed denial of service (DDoS) attacks. An attack originating from one AS should not be allowed to affect other ASes. The victim AS can send API-based control commands to the attacker AS network based on their visibility data to limit the attack’s impact.
Policy enforcement in the Internet exchange point (IXP): Multiple providers peer and exchange traffic at IXPs. Some may send malicious or attack traffic, so the IXP provider should deploy visibility solutions at this point of contact and implement control mechanisms to block any attack traffic.
While this paper takes a significant step towards addressing the challenges of managing networking controls in multi-site cloud environments, there are a few areas we identified for further research and development to facilitate testing and deployment in production infrastructures. Key enhancements should focus on the scalability and performance aspects of this work, including:
Utilizing AI to speed up the decision-making process based on the vast amount of collected network packet flow data. More precisely, deploying specific models to detect attack traffic tailored to particular infrastructure targets is becoming increasingly feasible with current emerging algorithms and tools. For instance, using AI algorithms, one can more efficiently and precisely recognize and categorize traffic patterns, distinguishing between normal and suspicious flows.
Hardware acceleration to deploy policy in the networking hardware (i.e., networking chip). Deploying policies directly onto the hardware will enable the system to handle larger scales of network data/information, such as Internet routes with hundreds of thousands of prefixes.
Extending the applicability of our solution to support emerging technologies and architectures, such as 5G and edge computing, presents an exciting future research direction. These environments have unique requirements and characteristics that our solution could address with some adaptations and enhancements.
7. Conclusions
This paper presents an integrated solution for addressing the challenges posed by the changing landscape of multi-site cloud infrastructures interconnected via L3 IP networks. We have designed a comprehensive solution that combines IO Visor-enabled network packet tracing for efficient flow-level visibility, IP prefix-based flow analysis for intent-based networking control, and the utilization of the ONOS SDN controller for managing hybrid SDN-IP interconnections. Our approach enables the seamless integration of monitoring and control mechanisms, which improves the overall adaptability and security of interconnected cloud sites.
By leveraging flow-level visibility, our solution enables the timely measurement and analysis of network packet flows across multiple servers and physical locations. This capability is essential for ensuring the smooth operation and security of multi-site cloud environments. Additionally, our approach facilitates intent-based networking control, allowing for the implementation of diverse policies and configurations across heterogeneous network domains. In particular, it can improve the performance of hybrid SDN-IP interconnection in a multi-site SDN-enabled environment under different network administrators and control domains by reducing unnecessary flow across the interconnection.
We evaluated our solution in the OF@TEIN Playground, a distributed testbed environment that provides multi-site cloud infrastructures. Our experimental results showed the effectiveness of our solution, where we analyzed network traffic, classified flows, and dynamically managed network policies through the ONOS SDN controller. Overall, performance evaluations showed that IO Visor-based packet tracing in the kernel space outperforms user-space tracing in terms of CPU utilization. Additionally, our Spark-based visibility integration processed a large number of packet flows efficiently, with processing times scaling linearly with the data size. The intent-based application on the ONOS controller demonstrated rapid policy installation times, significantly faster than BGP routing convergence times, even with large numbers of intents.
Author Contributions
This work is conducted together by A.C.R., M.U. and M.A.R. A.C.R., M.U. and M.A.R. designed and developed the proposed system in this work. A.C.R. evaluated proposed system. A.C.R., M.U. and M.A.R. written the original draft. A.C.R. and M.U. reviewed and edited the paper. M.U. guided project as a corresponding author. All authors have read and agreed to the published version of the manuscript.
Funding
This research was partially funded by the Knowledge Foundation of Sweden (KKS).
Data Availability Statement
The data are not publicly available due to presence of sensitive information.
Conflicts of Interest
The authors declare no conflicts of interest.
Abbreviations
The following abbreviations are used in this manuscript:
| AI | Artificial intelligence |
| AS | Autonomous system |
| BCC | BPF Compiler Collection |
| BGP | Border Gateway Protocol |
| BPF | Berkeley Packet Filter |
| DDoS | Distributed denial of service |
| eBPF | Extended Berkeley Packet Filter |
| IBN | Intent-based networking |
| IDS | Intrusion detection system |
| IXP | Internet exchange point |
| IO | Input/output |
| LLVM | Low-level virtual machine |
| NCC | Network coordination centre |
| ONOS | Open network operating system |
| RIPE | Réseaux IP Européens |
| SDN | Software-defined networking |
| SYN | Synchronize |
| TCP | Transmission Control Protocol |
| UDP | User Datagram Protocol |
References
- Sunyaev, A.; Sunyaev, A. Cloud Computing. In Internet Computing: Principles of Distributed Systems and Emerging Internet-based Technologies; Springer: Berlin/Heidelberg, Germany, 2020; pp. 195–236. [Google Scholar] [CrossRef]
- Leivadeas, A.; Falkner, M. A Survey on Intent-Based Networking. IEEE Commun. Surv. Tutor. 2023, 25, 625–655. [Google Scholar] [CrossRef]
- Usman, M.; Kim, J. SmartX Multi-View Visibility Framework for unified monitoring of SDN-enabled multisite clouds. Trans. Emerg. Telecommun. Technol. 2022, 33, e3819. [Google Scholar] [CrossRef]
- Moosa, M.A.; Vangujar, A.K.; Mahajan, D.P. Detection and Analysis of DDoS Attack Using a Collaborative Network Monitoring Stack. In Proceedings of the 2023 16th International Conference on Security of Information and Networks (SIN), Jaipur, India, 20–21 November 2023; pp. 1–9. [Google Scholar] [CrossRef]
- Hamza, K.I.; Kilani, J.; Bensalah, F.; Baddi, Y. Evaluation and Analysis of Network Safety Mechanisms in SDN Infrastructure. In Proceedings of the 2023 IEEE 6th International Conference on Cloud Computing and Artificial Intelligence: Technologies and Applications (CloudTech), Marrakesh, Morocco, 21–23 November 2023; pp. 1–6. [Google Scholar] [CrossRef]
- Shukla, P.K.; Maheshwary, P.; Subramanian, E.K.; Shilpa, V.J.; Varma, P.R.K. Traffic Flow Monitoring in Software-defined Network Using Modified Recursive Learning. Phys. Commun. 2023, 57, 101997. [Google Scholar] [CrossRef]
- Shirali-Shahreza, S.; Ganjali, Y. FleXam: Flexible Sampling Extension for Monitoring and Security Applications in OpenFlow. In Proceedings of the Second ACM SIGCOMM Workshop on Hot Topics in Software Defined Networking, Hong Kong, China, 16 August 2013; pp. 167–168. [Google Scholar] [CrossRef]
- Shu, Z.; Wan, J.; Lin, J.; Wang, S.; Li, D.; Rho, S.; Yang, C. Traffic Engineering in Software-defined Networking: Measurement and Management. IEEE Access 2016, 4, 3246–3256. [Google Scholar] [CrossRef]
- Yan, C.; Sheng, S. SDN+K8s Routing Optimization Strategy in 5G Cloud Edge Collaboration Scenario. IEEE Access 2023, 11, 8397–8406. [Google Scholar] [CrossRef]
- Song, Y.; Feng, T.; Yang, C.; Mi, X.; Jiang, S.; Guizani, M. IS2N: Intent-Driven Security Software-Defined Network with Blockchain. IEEE Netw. 2023, 38, 118–127. [Google Scholar] [CrossRef]
- Cai, M.; Liu, Y.; Kong, L.; Chen, G.; Liu, L.; Qiu, M.; Mumtaz, S. Resource Critical Flow Monitoring in Software-Defined Networks. IEEE/ACM Trans. Netw. 2024, 32, 396–410. [Google Scholar] [CrossRef]
- Sahu, H.; Tiwari, R.; Kumar, S. SDN-Based Traffic Monitoring in Data Center Network Using Floodlight Controller. Int. J. Intell. Inf. Technol. (IJIIT) 2022, 18, 1–13. [Google Scholar] [CrossRef]
- Yahyaoui, H.; Zhani, M.F.; Bouachir, O.; Aloqaily, M. On Minimizing Flow Monitoring Costs in Large-scale Software-defined Network Networks. Int. J. Netw. Manag. 2023, 33, e2220. [Google Scholar] [CrossRef]
- Risdianto, A.C.; Tsai, P.W.; Ling, T.C.; Yang, C.S.; Kim, J. Enhanced ONOS SDN Controllers Deployment for Federated Multi-Domain SDN-Cloud with SD-Routing-Exchange. Malays. J. Comput. Sci. 2017, 30, 134–153. [Google Scholar] [CrossRef]
- Lin, P.; Hart, J.; Krishnaswamy, U.; Murakami, T.; Kobayashi, M.; Al-Shabibi, A.; Wang, K.C.; Bi, J. Seamless Interworking of SDN and IP. ACM Sigcomm Comput. Commun. Rev. 2013, 43, 475–476. [Google Scholar] [CrossRef]
- Cheng, X.; Wang, Z.; Zhang, S.; He, X.; Yang, J. IntStream: An Intent-driven Streaming Network Telemetry Framework. In Proceedings of the 17th International Conference on Network and Service Management (CNSM), Online, 25–29 October 2021; pp. 473–481. [Google Scholar] [CrossRef]
- Yang, C.; Mi, X.; Ouyang, Y.; Dong, R.; Guo, J.; Guizani, M. SMART Intent-Driven Network Management. IEEE Commun. Mag. 2023, 61, 106–112. [Google Scholar] [CrossRef]
- Zhang, Y. An Adaptive Flow Counting Method for Anomaly Detection in SDN. In Proceedings of the Ninth ACM Conference on Emerging Networking Experiments and Technologies, Santa Barbara, CA, USA, 9–12 December 2013; pp. 25–30. [Google Scholar] [CrossRef]
- Bernaille, L.; Teixeira, R.; Akodkenou, I.; Soule, A.; Salamatian, K. Traffic Classification on the Fly. ACM SIGCOMM Comput. Commun. Rev. 2006, 36, 23–26. [Google Scholar] [CrossRef]
- Pang, L.; Yang, C.; Chen, D.; Song, Y.; Guizani, M. A Survey on Intent-Driven Networks. IEEE Access 2020, 8, 22862–22873. [Google Scholar] [CrossRef]
- Abranches, M.; Michel, O.; Keller, E.; Schmid, S. Efficient Network Monitoring Applications in the Kernel with eBPF and XDP. In Proceedings of the 2021 IEEE Conference on Network Function Virtualization and Software Defined Networks (NFV-SDN), Virtual, 9–11 November 2021; pp. 28–34. [Google Scholar] [CrossRef]
- Raptis, T.P.; Passarella, A. A Survey on Networked Data Streaming with Apache Kafka. IEEE Access 2023, 11, 85333–85350. [Google Scholar] [CrossRef]
- Ibtisum, S.; Bazgir, E.; Rahman, S.A.; Hossain, S.S. A Comparative Analysis of Big Data Processing Paradigms: Mapreduce vs. Apache Spark. World J. Adv. Res. Rev. 2023, 20, 1089–1098. [Google Scholar] [CrossRef]
- Gohil, A.; Shroff, A.; Garg, A.; Kumar, S. A Compendious Research on Big Data File Formats. In Proceedings of the 6th International Conference on Intelligent Computing and Control Systems (ICICCS), Madurai, India, 25–27 May 2022; pp. 905–913. [Google Scholar] [CrossRef]
- Kathare, N.; Reddy, O.V.; Prabhu, V. A Comprehensive Study of Elasticsearch. Int. J. Sci. Res. (IJSR) 2020, 4. [Google Scholar] [CrossRef]
- Risdianto, A.C.; Usman, M.; Kim, J. SmartX Box: Virtualized Hyper-Converged Resources for Building an Affordable Playground. Electronics 2019, 8, 1242. [Google Scholar] [CrossRef]
- Olimov, O.; Artikova, G.; Xatamova, M. Iperf to Determine Network Speed and Functionality. Web Technol. Multidimens. Res. J. 2024, 2, 94–101. [Google Scholar]
- Liao, S.; Zhou, C.; Zhao, Y.; Zhang, Z.; Zhang, C.; Gao, Y.; Zhong, G. A Comprehensive Detection Approach of Nmap: Principles, Rules and Experiments. In Proceedings of the 2020 International Conference on Cyber-Enabled Distributed Computing and Knowledge Discovery (CyberC), Chongqing, China, 29–30 October 2020; pp. 64–71. [Google Scholar] [CrossRef]
| Disclaimer/Publisher’s Note: The statements, opinions and data contained in all publications are solely those of the individual author(s) and contributor(s) and not of MDPI and/or the editor(s). MDPI and/or the editor(s) disclaim responsibility for any injury to people or property resulting from any ideas, methods, instructions or products referred to in the content. |
© 2024 by the authors. Licensee MDPI, Basel, Switzerland. This article is an open access article distributed under the terms and conditions of the Creative Commons Attribution (CC BY) license (https://creativecommons.org/licenses/by/4.0/).
