
Detection of Forged Images Using a Combination of Passive Methods Based on Neural Networks

 ,
,  ,
,  ,
,  ,
,  and
and 
Abstract
1. Introduction
2. Related Works
- The presented detection method must follow the passive approach;
- The Detection method should primarily focus on verifying digital images’ authenticity; and
- Must be in the top five most relevant results of each base that follows the other criteria.
- Introduce a method of detecting general-purpose manipulated images in their text;
- The presented detection method must follow the passive approach;
- The presented method should not require file formats with data compression;
- The Detection method should primarily focus on verifying digital images’ authenticity;
- The paper was published in the last five years; and
- The paper must have the most relevant results of each base that follow the other criteria.
3. Materials and Methods
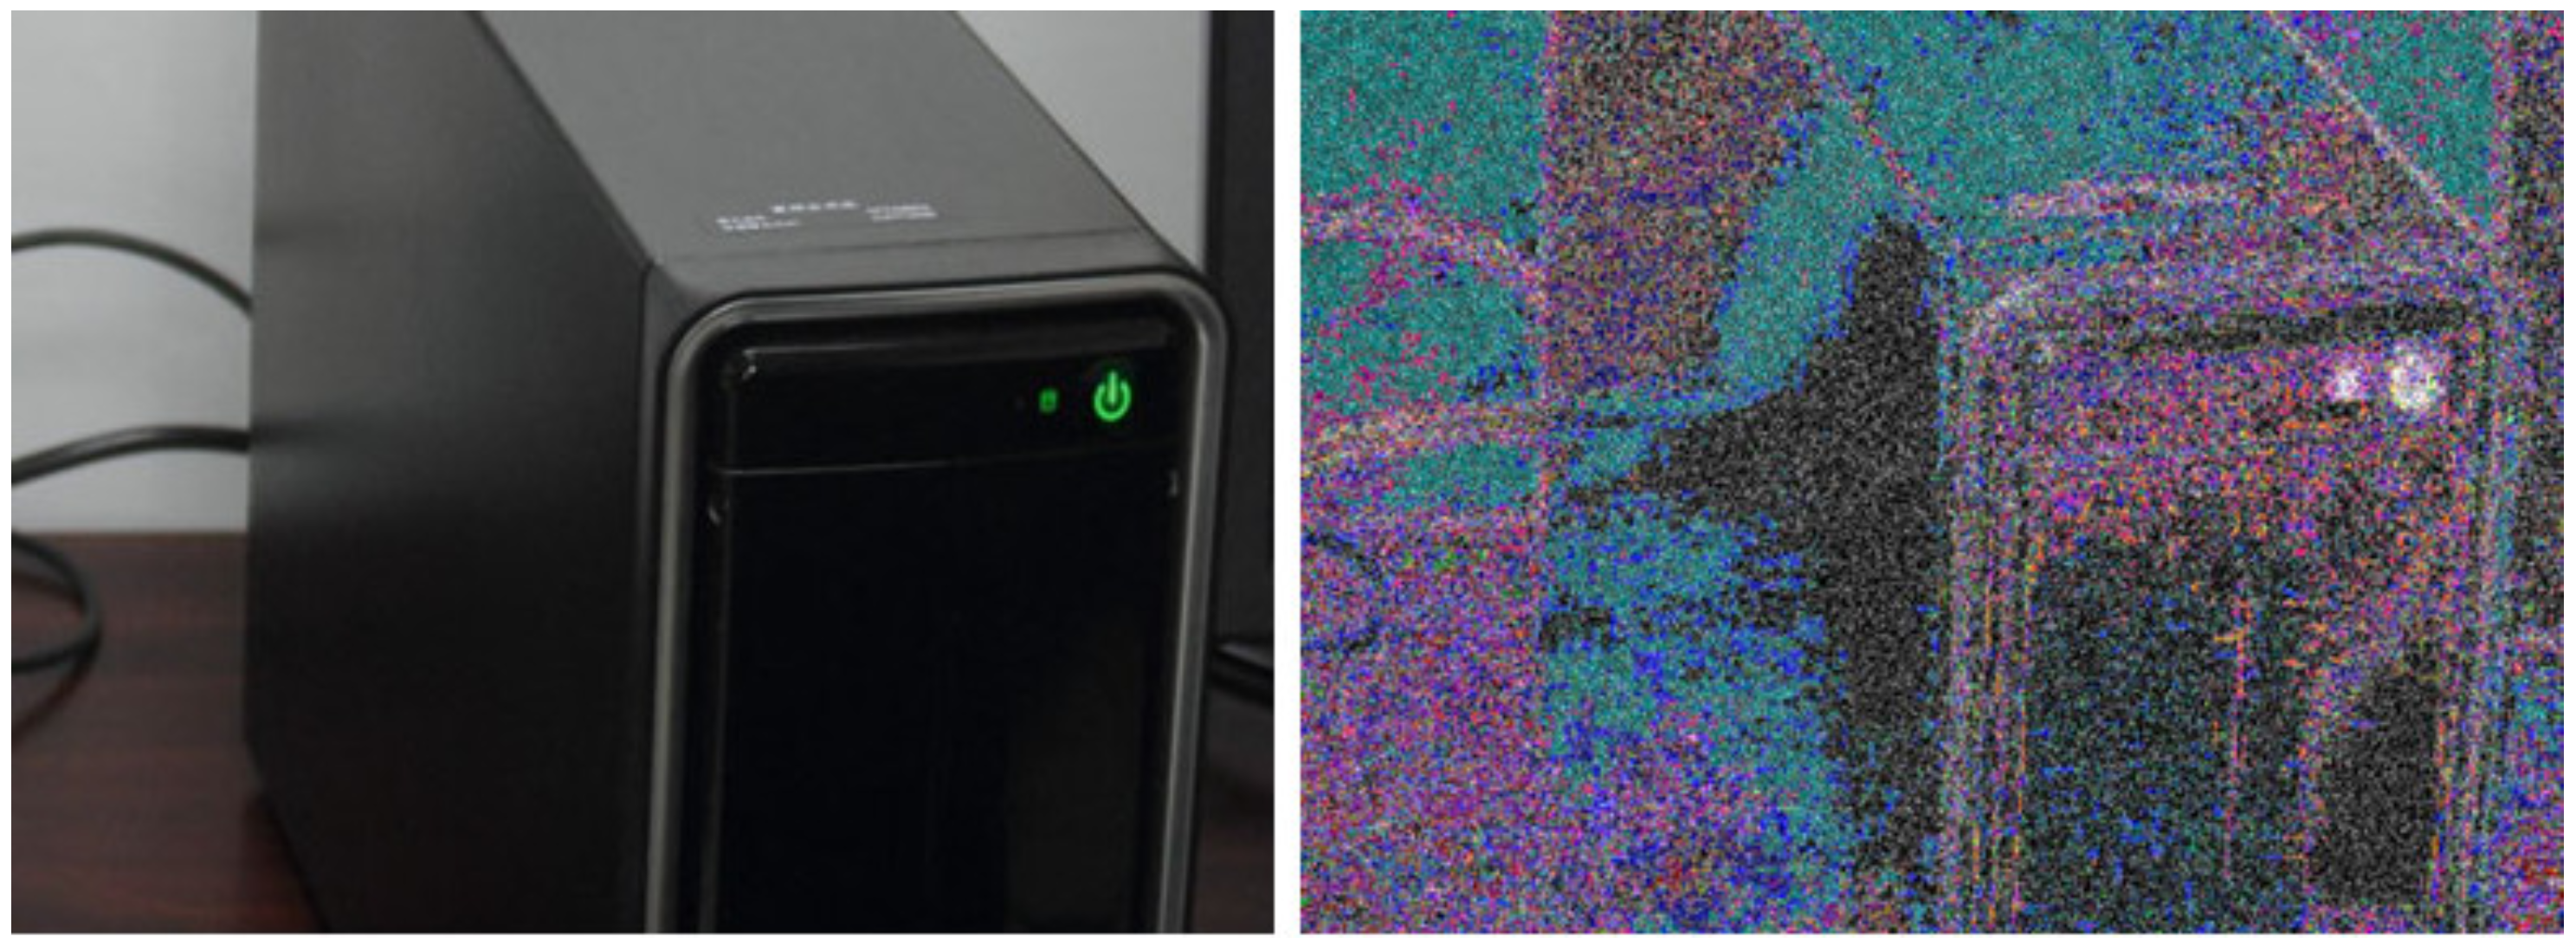
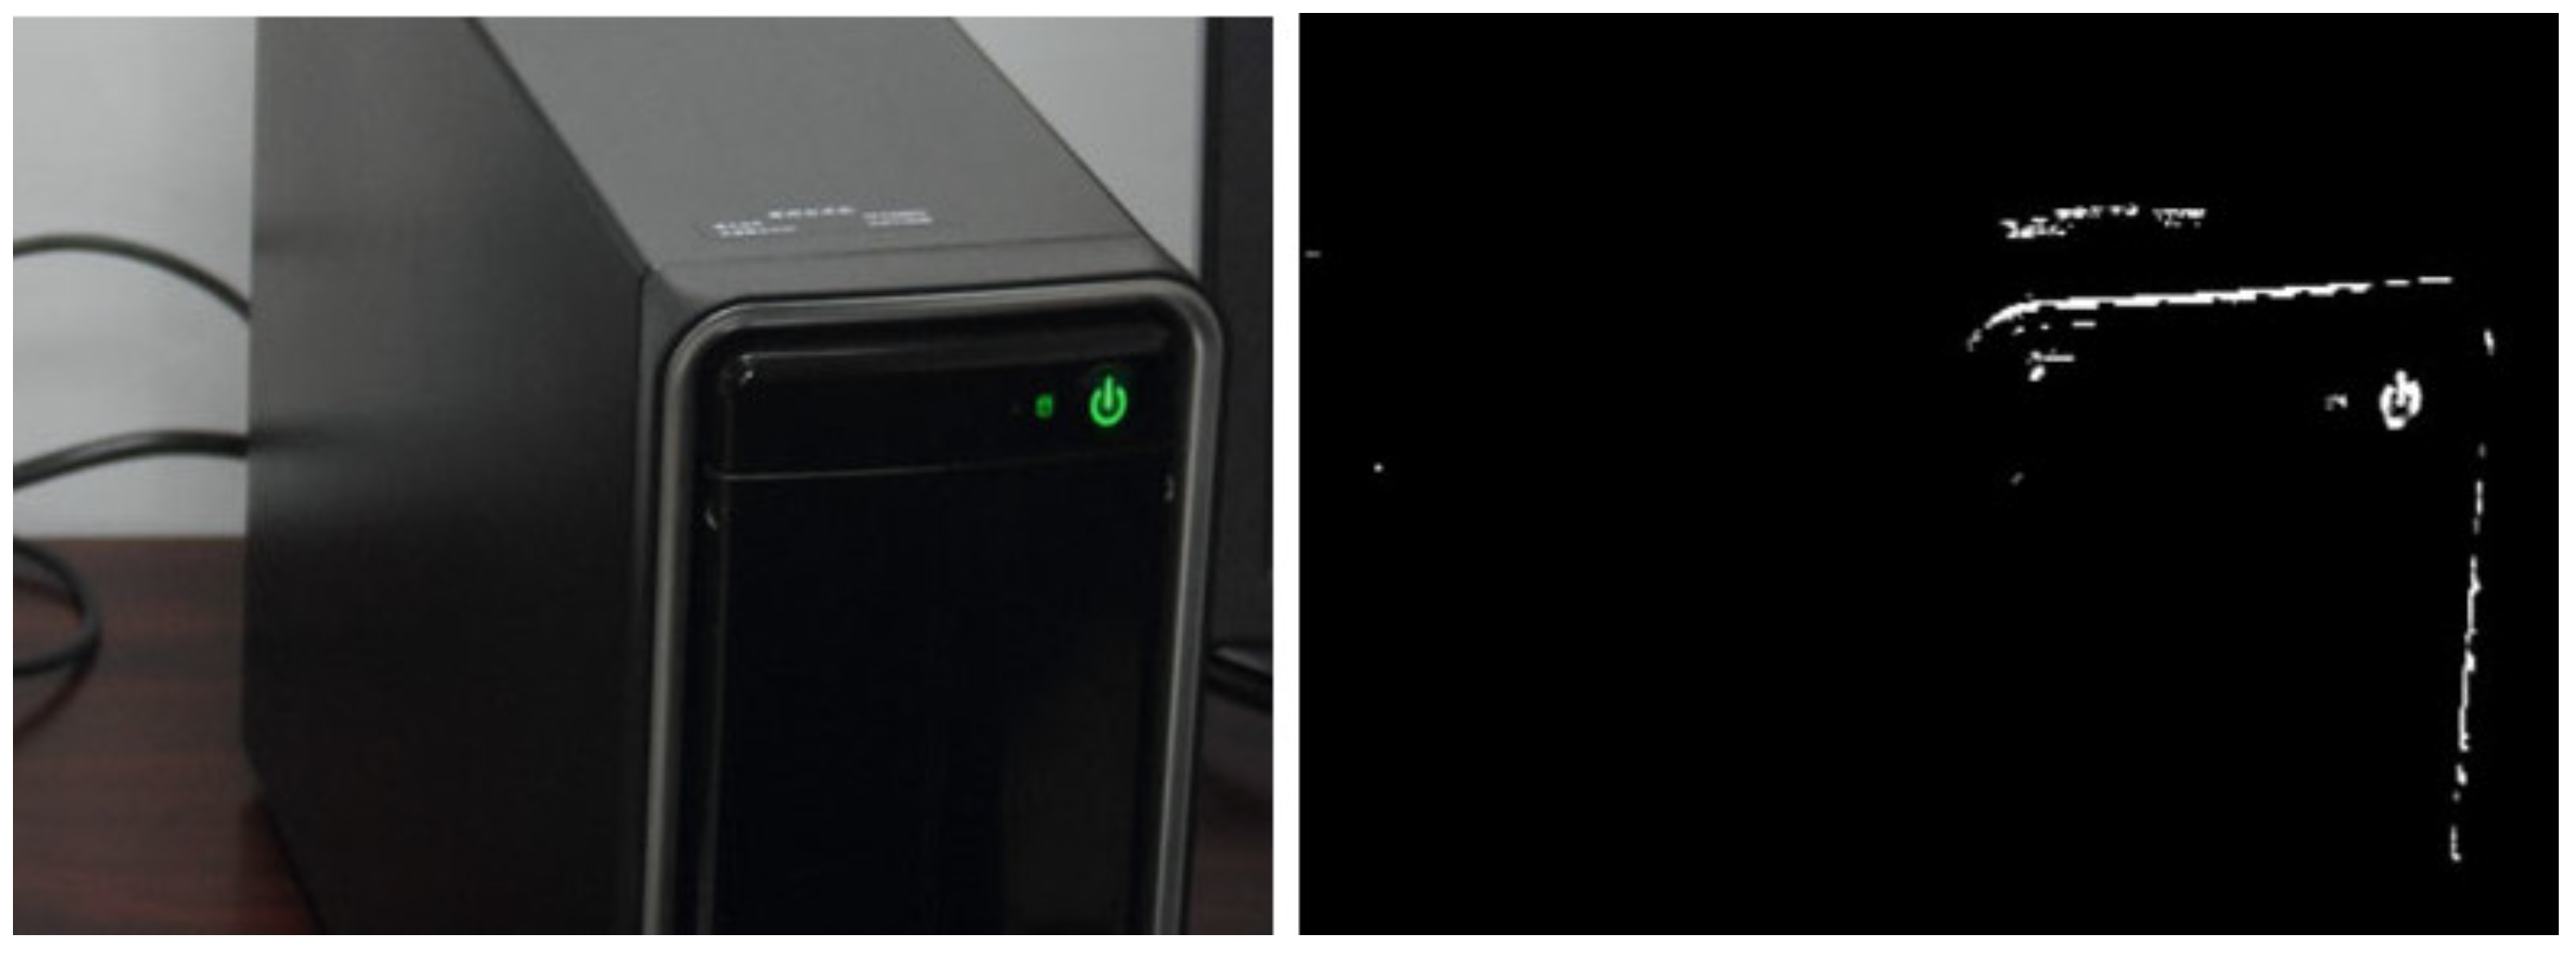
3.1. Error-Level Analysis
| Listing 1. Error-Level analysis implementation in pseudocode. |
# Static method that performs Error Level Analysis (ELA) on an image using JPEG compression.
# Returns a normalized difference image between the original image and a JPEG-compressed version of the image.
FUNCTION method_1_ela(image, quality)
    # Create another image with jpeg compression of the given quality
    save_image_as_jpeg(image, temp_image, quality)
    compressed_image = open_image(temp_image)
# Calculate the image difference between the original and the JPEG-compressed image
difference_image = image - compressed_image
    # Normalize the difference image for contrast by assigning a value of 255 to the brightest points, while proportionally adjusting the values of all other points based on their distance from the brightest point.
    normalized_difference  = difference_image.normalizeContrast()
    RETURN normalized_difference
END FUNCTION
|
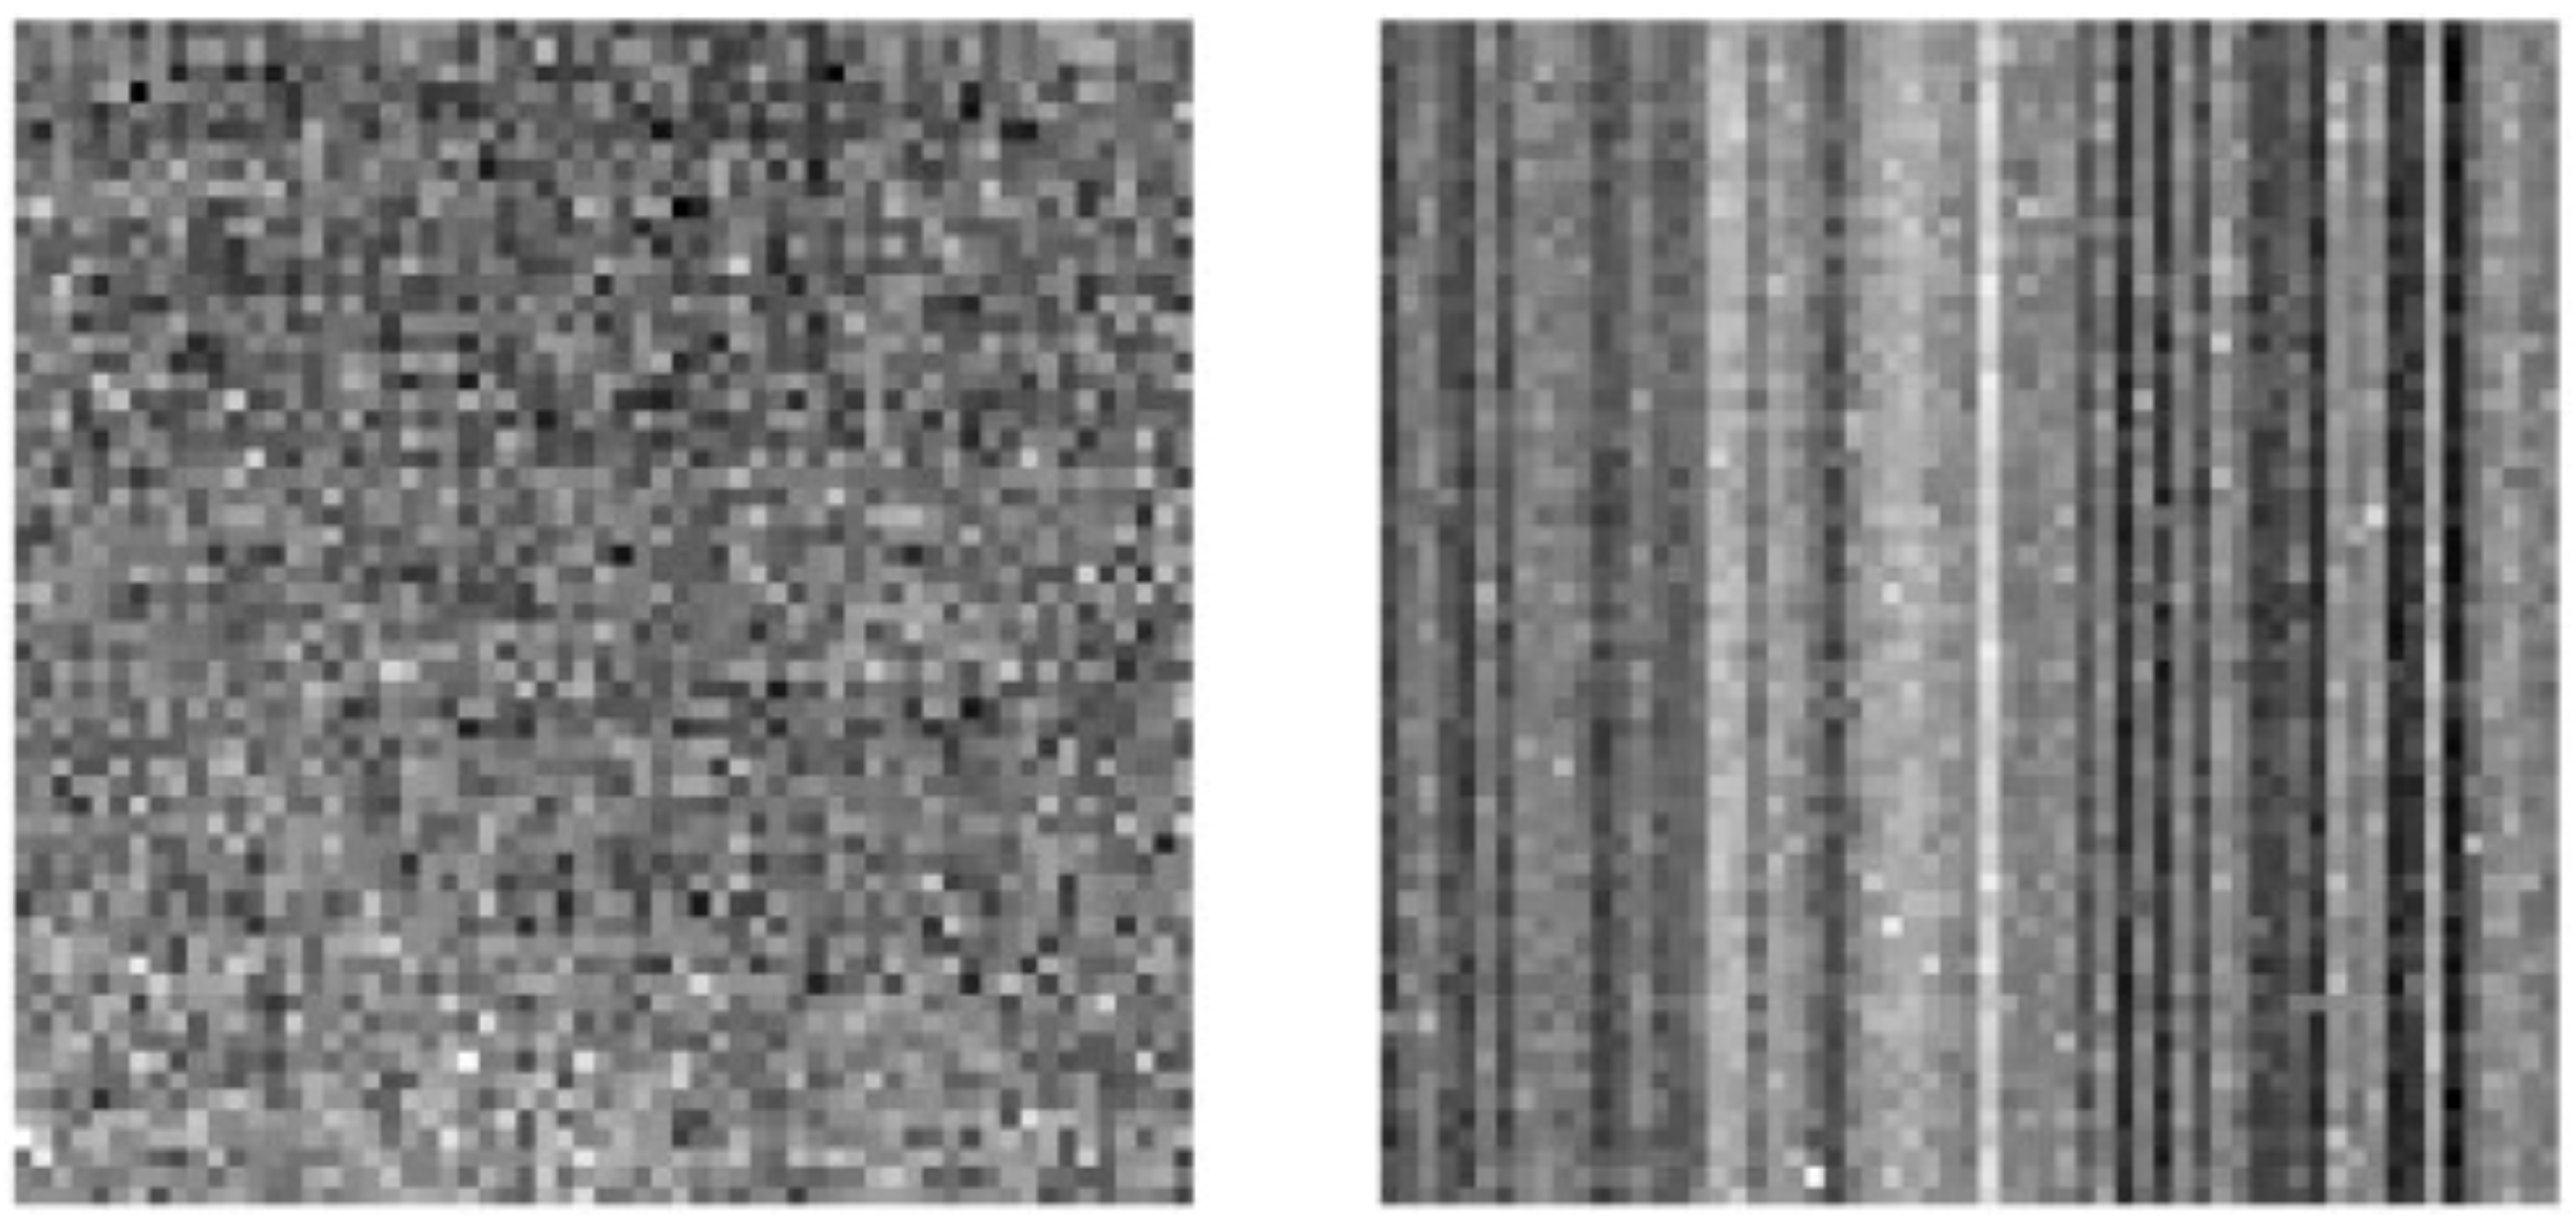
3.2. Discrete Wavelet Transform
| Listing 2. DWT based method implementation in pseudocode. |
FUNCTION method_2_dwt(image)
    # Convert image to grayscale and perform discrete wavelet transform
    gray_image = convertToGrayscale(image)
    coeffs = discreteWaveletTransform(gray_image)
    (LL, (LH, HL, HH)) = coeffs
    # Reconstruct the image using only the high-frequency components
    high_freq_components = (None, (LH, HL, HH))
    joinedLhHlHh = inverseDiscreteWaveletTransform(high_freq_components)
    # Apply bilateral filter to smooth the image while preserving edges
    blurred = bilateralFilter(joinedLhHlHh, 9, 75, 75)
    # Apply Laplacian edge detection to highlight edges
    kernel_size = 3
    imgLapacian = laplacianEdgeDetection(blurred, kernel_size)
    # Convert negative values to zero
    final_image = convertScaleToAbs(imgLapacian)
    RETURN final_image
END FUNCTION
|
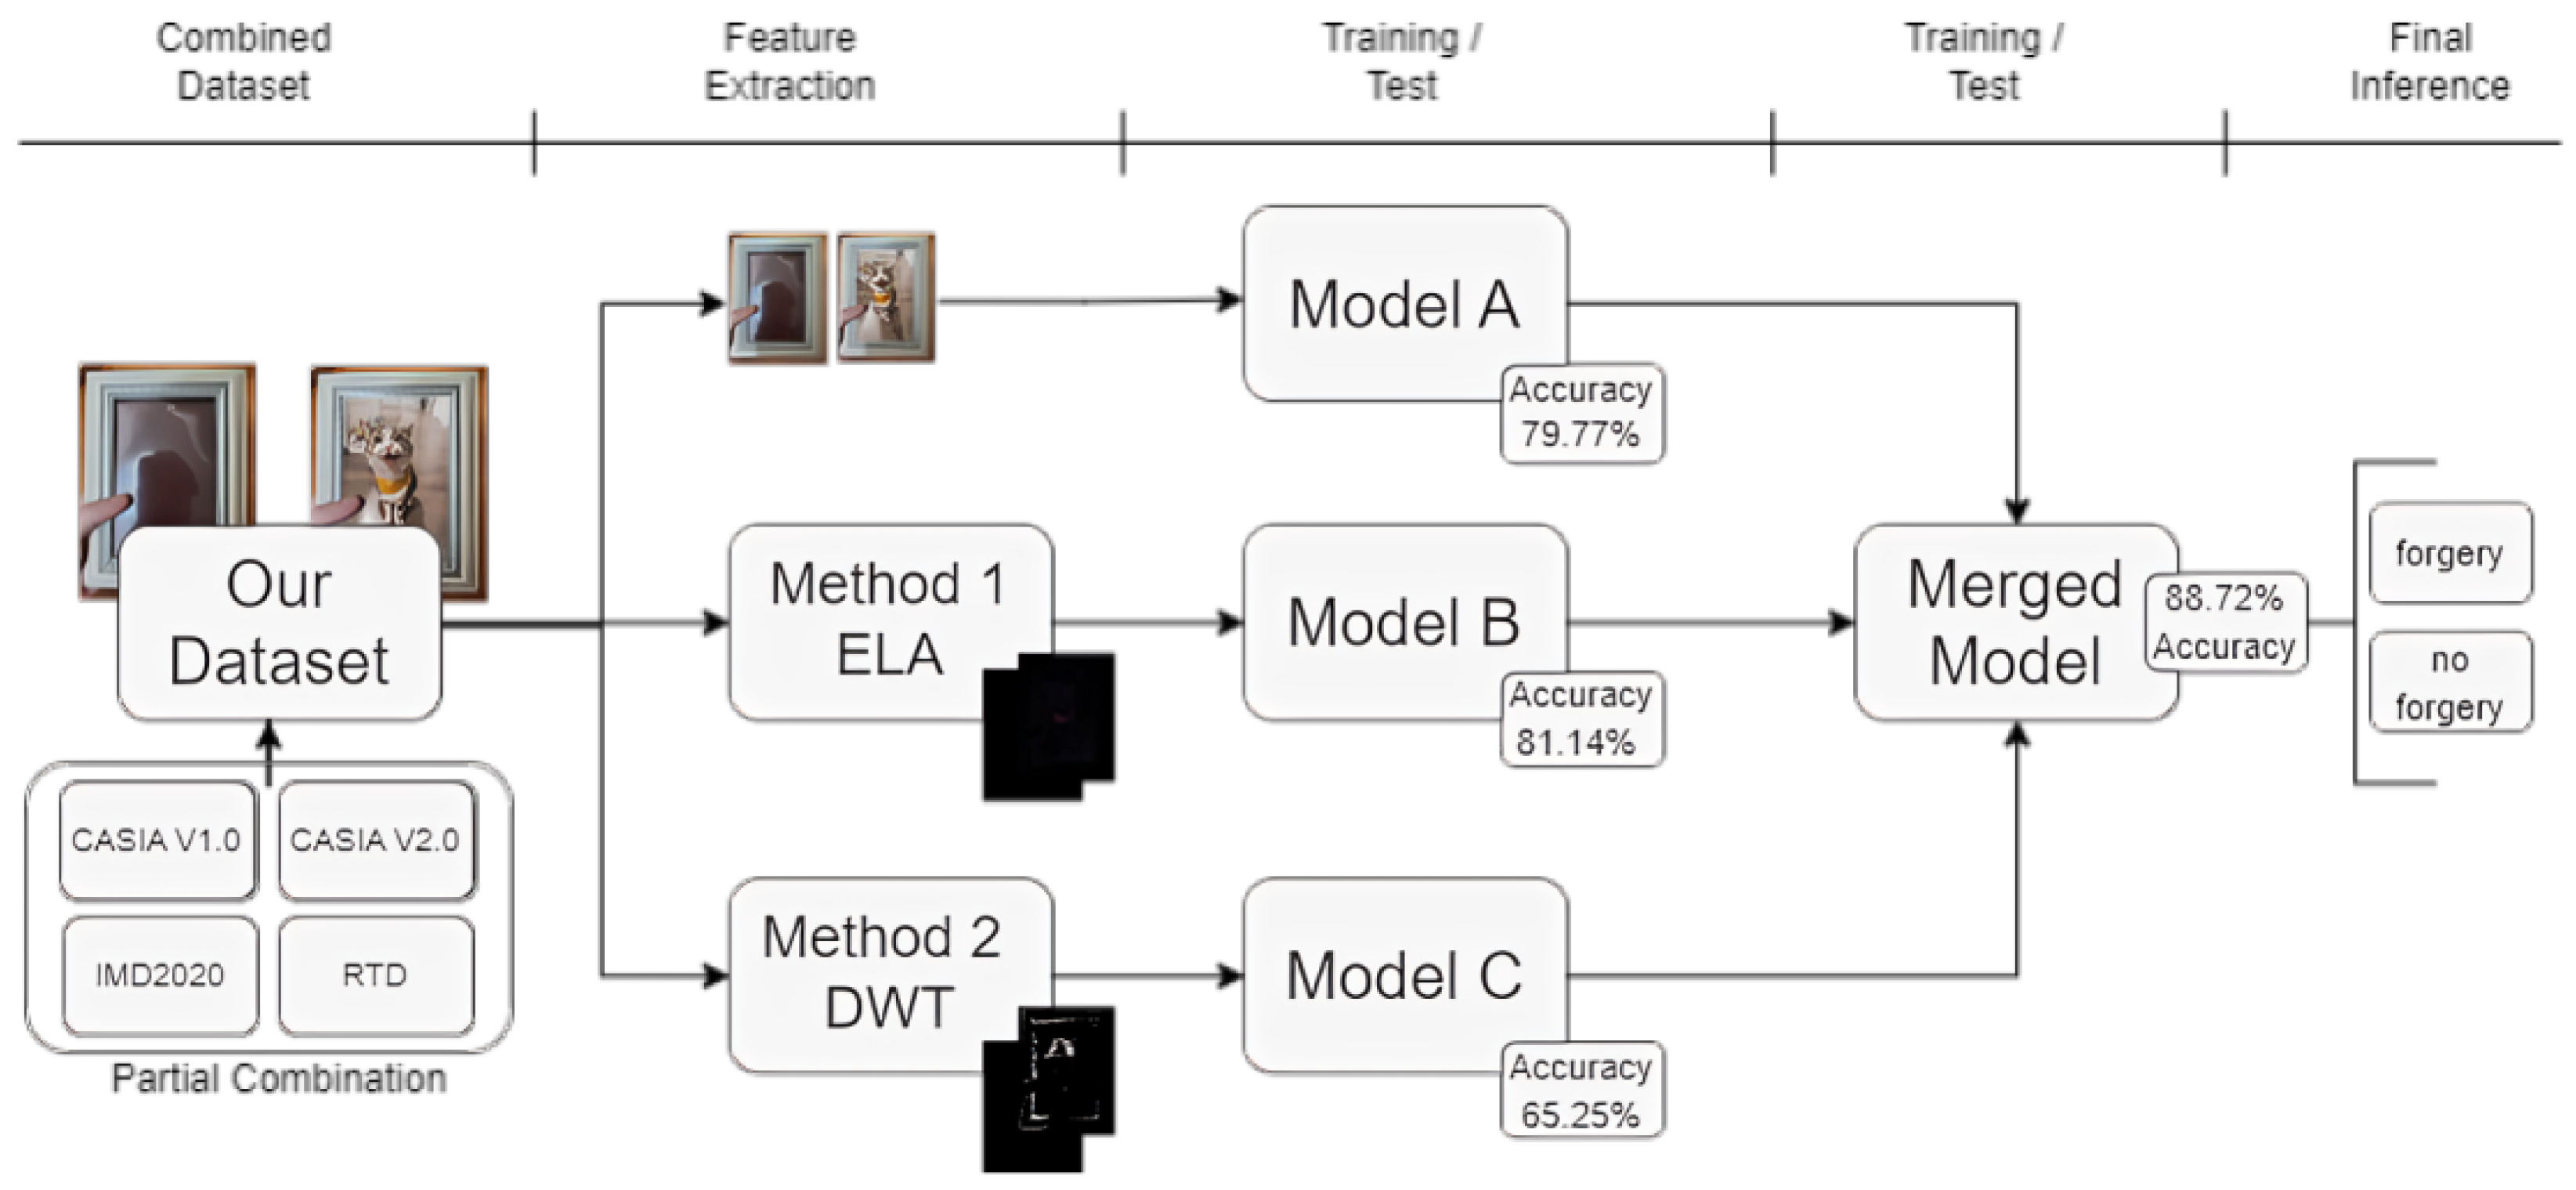
3.3. Proposed Method
3.4. Dataset Assembly
- CASIA V2.0: proposed in [54], contains 7491 authentic images and 5123 manipulated images containing Splicing and or Duplication operations with retouching operations applied on top to mask alterations;
- Realistic Tampering Dataset: Proposed by [55,56] containing 220 authentic and 220 Splicing and or Duplication manipulations made to the original images with the objective of being realistic. Retouching operations are sometimes applied to help hide Compositing and Duplication manipulations. In addition, this dataset provides masks of tampered areas and information about capture devices used;
- IMD2020: Proposed by [57], it consists of four parts, first a dataset containing 80 authentic images manipulated to generate 1930 images tampered realistically and using all types of manipulation, with their respective manipulation masks. Then the second part consists of 35,000 authentic images captured by 2322 different camera models, the images were collected online and reviewed manually by the authors. The third has 35,000 algorithmically generated images with retouching manipulations. Finally, the last part has 2759 authentic images acquired by the authors with 19 different camera models designed for sensor noise analysis;
- CASIA V1.0: Proposed in [54], Contains 800 authentic images, 459 Duplicate-type manipulation images, and 462 Splicing images. This dataset has no retouching operations applied.
4. Results and Discussion
5. Conclusions and Future Work
Author Contributions
Funding
Data Availability Statement
Conflicts of Interest
Abbreviations
| CID | Content identifier |
| CNN | Convolutional neural network |
| COV | Computer vision |
| DEL | Deep learning |
| DIF | Digital image forensics |
| DWT | Discrete Wavelet Transform |
| IMP | Image processing |
| FP | False positive |
| FN | False negative |
| HCI | Human-computer interaction |
| MLP | Multilayer perceptron |
| R-CNN | Region-based convolutional neural networks |
| RI | Region of interest |
| RPN | Region proposal network |
| TC | Totally connected |
| TF | True negative |
| TP | True positive |
References
- Lazer, D.M.J.; Baum, M.A.; Benkler, Y.; Berinsky, A.J.; Greenhill, K.M.; Menczer, F.; Metzger, M.J.; Nyhan, B.; Pennycook, G.; Rothschild, D.; et al. The science of fake news. Science 2018, 359, 1094–1096. [Google Scholar] [CrossRef]
- De Domenico, M.; Lima, A.; Mougel, P.; Musolesi, M. The Anatomy of a Scientific Rumor. Sci. Rep. 2013, 3, 2980. [Google Scholar] [CrossRef]
- Nash, R.A.; Wade, K.A.; Lindsay, D.S. Digitally manipulating memory: Effects of doctored videos and imagination in distorting beliefs and memories. Mem. Cogn. 2009, 37, 414–424. [Google Scholar] [CrossRef]
- López-Cantos, F. The Impact on Public Trust of Image Manipulation in Science. Informing Sci. Int. J. Emerg. Transdiscipl. 2019, 22, 45–53. [Google Scholar] [CrossRef] [PubMed]
- Vaishnavi, D.; Subashini, T. Application of local invariant symmetry features to detect and localize image copy move forgeries. J. Inf. Secur. Appl. 2019, 44, 23–31. [Google Scholar] [CrossRef]
- Lyu, Q.; Luo, J.; Liu, K.; Yin, X.; Liu, J.; Lu, W. Copy Move Forgery Detection based on double matching. J. Vis. Commun. Image Represent. 2021, 76, 103057. [Google Scholar] [CrossRef]
- Cho, S.H.; Agarwal, S.; Koh, S.J.; Jung, K.H. Image Forensics Using Non-Reducing Convolutional Neural Network for Consecutive Dual Operators. Appl. Sci. 2022, 12, 7152. [Google Scholar] [CrossRef]
- Liu, B.; Pun, C.M. Exposing splicing forgery in realistic scenes using deep fusion network. Inf. Sci. 2020, 526, 133–150. [Google Scholar] [CrossRef]
- Rocha, A.; Scheirer, W.; Boult, T.; Goldenstein, S. Vision of the unseen. ACM Comput. Surv. 2011, 43, 26. [Google Scholar] [CrossRef]
- Sharma, V.; Jha, S. Image Forgery and it’s Detection Technique: A Review. Int. Res. J. Eng. Technol. 2016, 3, 756–762. [Google Scholar]
- Qazi, T.; Hayat, K.; Khan, S.U.; Madani, S.A.; Khan, I.A.; Kołodziej, J.; Li, H.; Lin, W.; Yow, K.C.; Xu, C.Z. Survey on blind image forgery detection. IET Image Process. 2013, 7, 660–670. [Google Scholar] [CrossRef]
- Lubna, J.I.; Chowdhury, S.M.A.K. Detecting Fake Image: A Review for Stopping Image Manipulation. In Proceedings of the Advances in Computational Intelligence, Security and Internet of Things, Agartala, India, 13–14 December 2019; pp. 146–159. [Google Scholar] [CrossRef]
- Sharma, S.; Ghanekar, U. A hybrid technique to discriminate Natural Images, Computer Generated Graphics Images, Spliced, Copy Move tampered images and Authentic images by using features and ELM classifier. Optik 2018, 172, 470–483. [Google Scholar] [CrossRef]
- Agarwal, R.; Khudaniya, D.; Gupta, A.; Grover, K. Image Forgery Detection and Deep Learning Techniques: A Review. In Proceedings of the 2020 4th International Conference on Intelligent Computing and Control Systems (ICICCS), Madurai, India, 13–15 May 2020; pp. 1096–1100. [Google Scholar] [CrossRef]
- Soni, B.; Das, P.K.; Thounaojam, D.M. Blur Invariant Block based Copy-Move Forgery Detection Technique using FWHT Features. In Proceedings of the International Conference on Watermarking and Image Processing, Paris, France, 6–8 September 2017. [Google Scholar] [CrossRef]
- Li, C.; Ma, Q.; Xiao, L.; Ying, S. An Image Copy Move Forgery Detection Method Using QDCT. In Proceedings of the International Conference on Internet Multimedia Computing and Service, Xi’an, China, 19–21 August 2016. [Google Scholar] [CrossRef]
- Sanap, V.K.; Mane, V.M. Region duplication forgery detection in digital images using 2D-DWT and SVD. In Proceedings of the 2015 International Conference on Applied and Theoretical Computing and Communication Technology (iCATccT), Davangere, India, 29–31 October 2015; pp. 599–604. [Google Scholar] [CrossRef]
- Ravi, K.; Devraj, N.; Shylaja, S.S. A new approach to detect paste forgeries in an image. In Proceedings of the 2017 Fourth International Conference on Image Information Processing (ICIIP), Shimla, India, 21–23 December 2017; pp. 1–6. [Google Scholar] [CrossRef]
- Dua, S.; Singh, J.; Parthasarathy, H. Detection and localization of forgery using statistics of DCT and Fourier components. Signal Process. Image Commun. 2020, 82, 115778. [Google Scholar] [CrossRef]
- Mahmood, T.; Mehmood, Z.; Shah, M.; Saba, T. A robust technique for copy-move forgery detection and localization in digital images via stationary wavelet and discrete cosine transform. J. Vis. Commun. Image Represent. 2018, 53, 202–214. [Google Scholar] [CrossRef]
- Kasban, H.; Nassar, S. An efficient approach for forgery detection in digital images using Hilbert–Huang transform. Appl. Soft Comput. 2020, 97, 106728. [Google Scholar] [CrossRef]
- Hashmi, M.F.; Hambarde, A.R.; Keskar, A.G. Copy move forgery detection using DWT and SIFT features. In Proceedings of the 2013 13th International Conference on Intellient Systems Design and Applications, Bangi, Malaysia, 8–10 December 2013; pp. 188–193. [Google Scholar] [CrossRef]
- Malviya, A.V.; Ladhake, S.A. Region duplication detection using color histogram and moments in digital image. In Proceedings of the 2016 International Conference on Inventive Computation Technologies, Coimbatore, India, 26–27 August 2016; Volume 1, pp. 1–4. [Google Scholar] [CrossRef]
- Khan, S.; Kulkarni, A. Robust method for detection of copy-move forgery in digital images. In Proceedings of the 2010 International Conference on Signal and Image Processing, Chennai, India, 15–17 December 2010. [Google Scholar]
- Fahmy, M.F.; Fahmy, O.M. A natural preserving transform based forgery detection scheme. In Proceedings of the 2015 IEEE International Symposium on Signal Processing and Information Technology (ISSPIT), Abu Dhabi, United Arab Emirates, 7–10 December 2015; pp. 215–220. [Google Scholar] [CrossRef]
- Isaac, M.M.; Wilscy, M. Copy-Move forgery detection based on Harris Corner points and BRISK. In Proceedings of the Third International Symposium onWomen in Computing and Informatics, Kochi, India, 10–13 August 2015. [Google Scholar] [CrossRef]
- Liu, Q.; Li, X.; Cooper, P.A.; Hu, X. Shift recompression-based feature mining for detecting content-aware scaled forgery in JPEG images. In Proceedings of the Twelfth International Workshop on Multimedia Data Mining, Beijing, China, 12 August 2012. [Google Scholar] [CrossRef]
- Liu, Q.; Sung, A.H. A new approach for JPEG resize and image splicing detection. In Proceedings of the First ACM workshop on Multimedia in Forensics, Beijing, China, 23 October 2009. [Google Scholar] [CrossRef]
- Liu, Y.; Guan, Q.; Zhao, X.; Cao, Y. Image Forgery Localization Based on Multi-Scale Convolutional Neural Networks. arXiv 2017, arXiv:1706.07842. [Google Scholar] [CrossRef]
- Rao, Y.; Ni, J.; Xie, H. Multi-semantic CRF-based attention model for image forgery detection and localization. Signal Process. 2021, 183, 108051. [Google Scholar] [CrossRef]
- Lukáš, J.; Fridrich, J.; Goljan, M. Detecting digital image forgeries using sensor pattern noise. In Proceedings of the Electronic Imaging 2006, San Jose, CA, USA, 15–19 January 2006. [Google Scholar] [CrossRef]
- Lin, X.; Li, C.T. PRNU-Based Content Forgery Localization Augmented with Image Segmentation. IEEE Access 2020, 8, 222645–222659. [Google Scholar] [CrossRef]
- Mohammadnejad, S.; Roshani, S.; Sarvi, M. Fixed pattern noise reduction method in CCD sensors for LEO satellite applications. In Proceedings of the 11th International Conference on Telecommunications, Graz, Austria, 15–17 June 2011. [Google Scholar]
- Stefenon, S.F.; Corso, M.P.; Nied, A.; Perez, F.L.; Yow, K.C.; Gonzalez, G.V.; Leithardt, V.R.Q. Classification of insulators using neural network based on computer vision. IET Gener. Transm. Distrib. 2021, 16, 1096–1107. [Google Scholar] [CrossRef]
- Corso, M.P.; Stefenon, S.F.; Singh, G.; Matsuo, M.V.; Perez, F.L.; Leithardt, V.R.Q. Evaluation of visible contamination on power grid insulators using convolutional neural networks. Electr. Eng. 2023, 105, 3881–3894. [Google Scholar] [CrossRef]
- Dos Santos, G.H.; Seman, L.O.; Bezerra, E.A.; Leithardt, V.R.Q.; Mendes, A.S.; Stefenon, S.F. Static attitude determination using convolutional neural networks. Sensors 2021, 21, 6419. [Google Scholar] [CrossRef]
- Souza, B.J.; Stefenon, S.F.; Singh, G.; Freire, R.Z. Hybrid-YOLO for classification of insulators defects in transmission lines based on UAV. Int. J. Electr. Power Energy Syst. 2023, 148, 108982. [Google Scholar] [CrossRef]
- Stefenon, S.F.; Yow, K.C.; Nied, A.; Meyer, L.H. Classification of distribution power grid structures using inception v3 deep neural network. Electr. Eng. 2022, 104, 4557–4569. [Google Scholar] [CrossRef]
- Lu, J.; Tan, L.; Jiang, H. Review on convolutional neural network (CNN) applied to plant leaf disease classification. Agriculture 2021, 11, 707. [Google Scholar] [CrossRef]
- Yu, C.; Han, R.; Song, M.; Liu, C.; Chang, C.I. A simplified 2D-3D CNN architecture for hyperspectral image classification based on spatial-spectral fusion. IEEE J. Sel. Top. Appl. Earth Obs. Remote Sens. 2020, 13, 2485–2501. [Google Scholar] [CrossRef]
- Yamasaki, M.; Freire, R.Z.; Seman, L.O.; Stefenon, S.F.; Mariani, V.C.; dos Santos Coelho, L. Optimized hybrid ensemble learning approaches applied to very short-term load forecasting. Int. J. Electr. Power Energy Syst. 2024, 155, 109579. [Google Scholar] [CrossRef]
- Starke, L.; Hoppe, A.F.; Sartori, A.; Stefenon, S.F.; Santana, J.F.D.P.; Leithardt, V.R.Q. Interference recommendation for the pump sizing process in progressive cavity pumps using graph neural networks. Sci. Rep. 2023, 13, 16884. [Google Scholar] [CrossRef]
- Surek, G.A.S.; Seman, L.O.; Stefenon, S.F.; Mariani, V.C.; Coelho, L.S. Video-based human activity recognition using deep learning approaches. Sensors 2023, 23, 6384. [Google Scholar] [CrossRef]
- Glasenapp, L.A.; Hoppe, A.F.; Wisintainer, M.A.; Sartori, A.; Stefenon, S.F. OCR Applied for Identification of Vehicles with Irregular Documentation Using IoT. Electronics 2023, 12, 1083. [Google Scholar] [CrossRef]
- Vieira, J.C.; Sartori, A.; Stefenon, S.F.; Perez, F.L.; de Jesus, G.S.; Leithardt, V.R.Q. Low-Cost CNN for Automatic Violence Recognition on Embedded System. IEEE Access 2022, 10, 25190–25202. [Google Scholar] [CrossRef]
- Corso, M.P.; Perez, F.L.; Stefenon, S.F.; Yow, K.C.; Ovejero, R.G.; Leithardt, V.R.Q. Classification of Contaminated Insulators Using k-Nearest Neighbors Based on Computer Vision. Computers 2021, 10, 112. [Google Scholar] [CrossRef]
- Wilbert, H.J.; Hoppe, A.F.; Sartori, A.; Stefenon, S.F.; Silva, L.A. Recency, Frequency, Monetary Value, Clustering, and Internal and External Indices for Customer Segmentation from Retail Data. Algorithms 2023, 16, 396. [Google Scholar] [CrossRef]
- Gunawan, T.S.; Hanafiah, S.A.M.; Kartiwi, M.; Ismail, N.; Za’bah, N.F.; Nordin, A.N. Development of Photo Forensics Algorithm by Detecting Photoshop Manipulation using Error Level Analysis. Indones. J. Electr. Eng. Comput. Sci. 2017, 7, 131. [Google Scholar] [CrossRef]
- Stefenon, S.F.; Seman, L.O.; Aquino, L.S.; dos Santos Coelho, L. Wavelet-Seq2Seq-LSTM with attention for time series forecasting of level of dams in hydroelectric power plants. Energy 2023, 274, 127350. [Google Scholar] [CrossRef]
- Sopelsa Neto, N.F.; Stefenon, S.F.; Meyer, L.H.; Ovejero, R.G.; Leithardt, V.R.Q. Fault Prediction Based on Leakage Current in Contaminated Insulators Using Enhanced Time Series Forecasting Models. Sensors 2022, 22, 6121. [Google Scholar] [CrossRef]
- Branco, N.W.; Cavalca, M.S.M.; Stefenon, S.F.; Leithardt, V.R.Q. Wavelet LSTM for fault forecasting in electrical power grids. Sensors 2022, 22, 8323. [Google Scholar] [CrossRef]
- Klaar, A.C.R.; Stefenon, S.F.; Seman, L.O.; Mariani, V.C.; Coelho, L.d.S. Optimized EWT-Seq2Seq-LSTM with Attention Mechanism to Insulators Fault Prediction. Sensors 2023, 23, 3202. [Google Scholar] [CrossRef]
- Singh, G.; Stefenon, S.F.; Yow, K.C. Interpretable visual transmission lines inspections using pseudo-prototypical part network. Mach. Vis. Appl. 2023, 34, 41. [Google Scholar] [CrossRef]
- Dong, J.; Wang, W.; Tan, T. CASIA Image Tampering Detection Evaluation Database. In Proceedings of the 2013 IEEE China Summit and International Conference on Signal and Information Processing, Beijing, China, 6–10 July 2013; pp. 422–426. [Google Scholar] [CrossRef]
- Korus, P.; Huang, J. Multi-scale Analysis Strategies in PRNU-based Tampering Localization. IEEE Trans. Inf. Forensics Secur. 2017, 12, 809–824. [Google Scholar] [CrossRef]
- Korus, P.; Huang, J. Evaluation of Random Field Models in Multi-modal Unsupervised Tampering Localization. In Proceedings of the IEEE International Workshop on Information Forensics and Security, Abu Dhabi, United Arab Emirates, 4–7 December 2016. [Google Scholar]
- Novozámský, A.; Mahdian, B.; Saic, S. IMD2020: A Large-Scale Annotated Dataset Tailored for Detecting Manipulated Images. In Proceedings of the IEEE Winter Applications of Computer Vision Workshops, Snowmass, CO, USA, 1–5 March 2020; pp. 71–80. [Google Scholar] [CrossRef]


| ID | Det. Man. | Color Space | Feature Extraction | Detection | Dataset | References |
|---|---|---|---|---|---|---|
| 1 | D/S | YCbCr, Y values used | Blocks with DCT using doubly stochastic model | Classifiers of type: SVM and ELM | CASIA(V1,V2) | [19] |
| 2 | D | Grayscale | Keypoints by proposed method and local simetry plus LPT | Correlation of characteristics by: angle and distance | MICC-F220, MICC-F600, CMH | [5] |
| 3 | D | RGB | Blocks by LIOP and DT | Correlation of characteristics by: double g2NN | IMD, MICC-F600 | [6] |
| 4 | D | YCbCr, Y values used | Blocks by SWT and DCT | Correlation of characteristics by: distance and threshold value | CoMoFoD, UCID | [20] |
| 5 | D/S | YCbCr, Cr values used | Signal Decomposition by HHT | Classifiers of type: SVM, KNN and ANN | CASIA(V1,V2), MICC-F2000, MICC-F600, MICC-F220, CoMoFoD, Proprietary | [21] |
| 6 | D | Grayscale | Keypoints 2D DWT and SIFT | Correlation of characteristics by: proposed method | CoMoFoD, MICC-F | [22] |
| 7 | D | RGB | Blocks by histogram HSV and color moments | Correlation of characteristics by: threshold value | MICC-F220, MICC-F2000, MICC-F8multi | [23] |
| 8 | D | RGB | Blocks by 2D DWT and SIFT | Correlation of characteristics by: threshold value | Proprietary | [17] |
| 9 | D | Grayscale | Blocks by DWT | Correlation of characteristics by: threshold value | Proprietary | [24] |
| 10 | D/S | RGB | none | FPN analysis | IMD, Proprietary | [25] |
| 11 | D | Grayscale | Keypoints by Harris Corner Detector and BRISK | Correlation of characteristics by: Hamming Distance and Neared Neighbot Distance Ratio | CoMoFoD, MICC-F220 | [26] |
| 12 | S/R | RGB | Proposed by authors based on SRSC | Classifiers of type: FLD, LibSVM and ensemble classifier | Proprietary | [27] |
| 13 | D | RGB | Blocks by FWHT | Correlation of characteristics by: threshold value | CoMoFoD | [15] |
| 14 | D/S | Grayscale | Proposed by the authors | Classifiers of type: SVM with RBF kernels | Columbia | [28] |
| 15 | D | RGB | Blocks by QDCT | Classifiers of type: SVM with RBF kernels | Proprietary | [16] |
| 16 | D/S/R | RGB | Automatic | Machine learning on FPN data | IFS-TC, RTD | [29] |
| 17 | D/S/R | Grayscale | Bilateral Filters and DWT | Feature selection | Proprietary | [18] |
| 18 | D/S/R | RGB | Atrous spatial pyramid pooling | Machine learning on FPN data | CASIA(V1,V2), Nim.16, Korus, Coverage, DSO-1, IFC, FaceSwap, Nim.16, Nim.17dev2, MFC18dev1 | [30] |
| CASIA V1.0 | CASIA V2.0 | IMD2020 | RTD | Total | |
|---|---|---|---|---|---|
| Authentic | 0 | 7491 | 0 | 0 | 7491 |
| Tampered | 218 | 5123 | 1930 | 220 | 7491 |
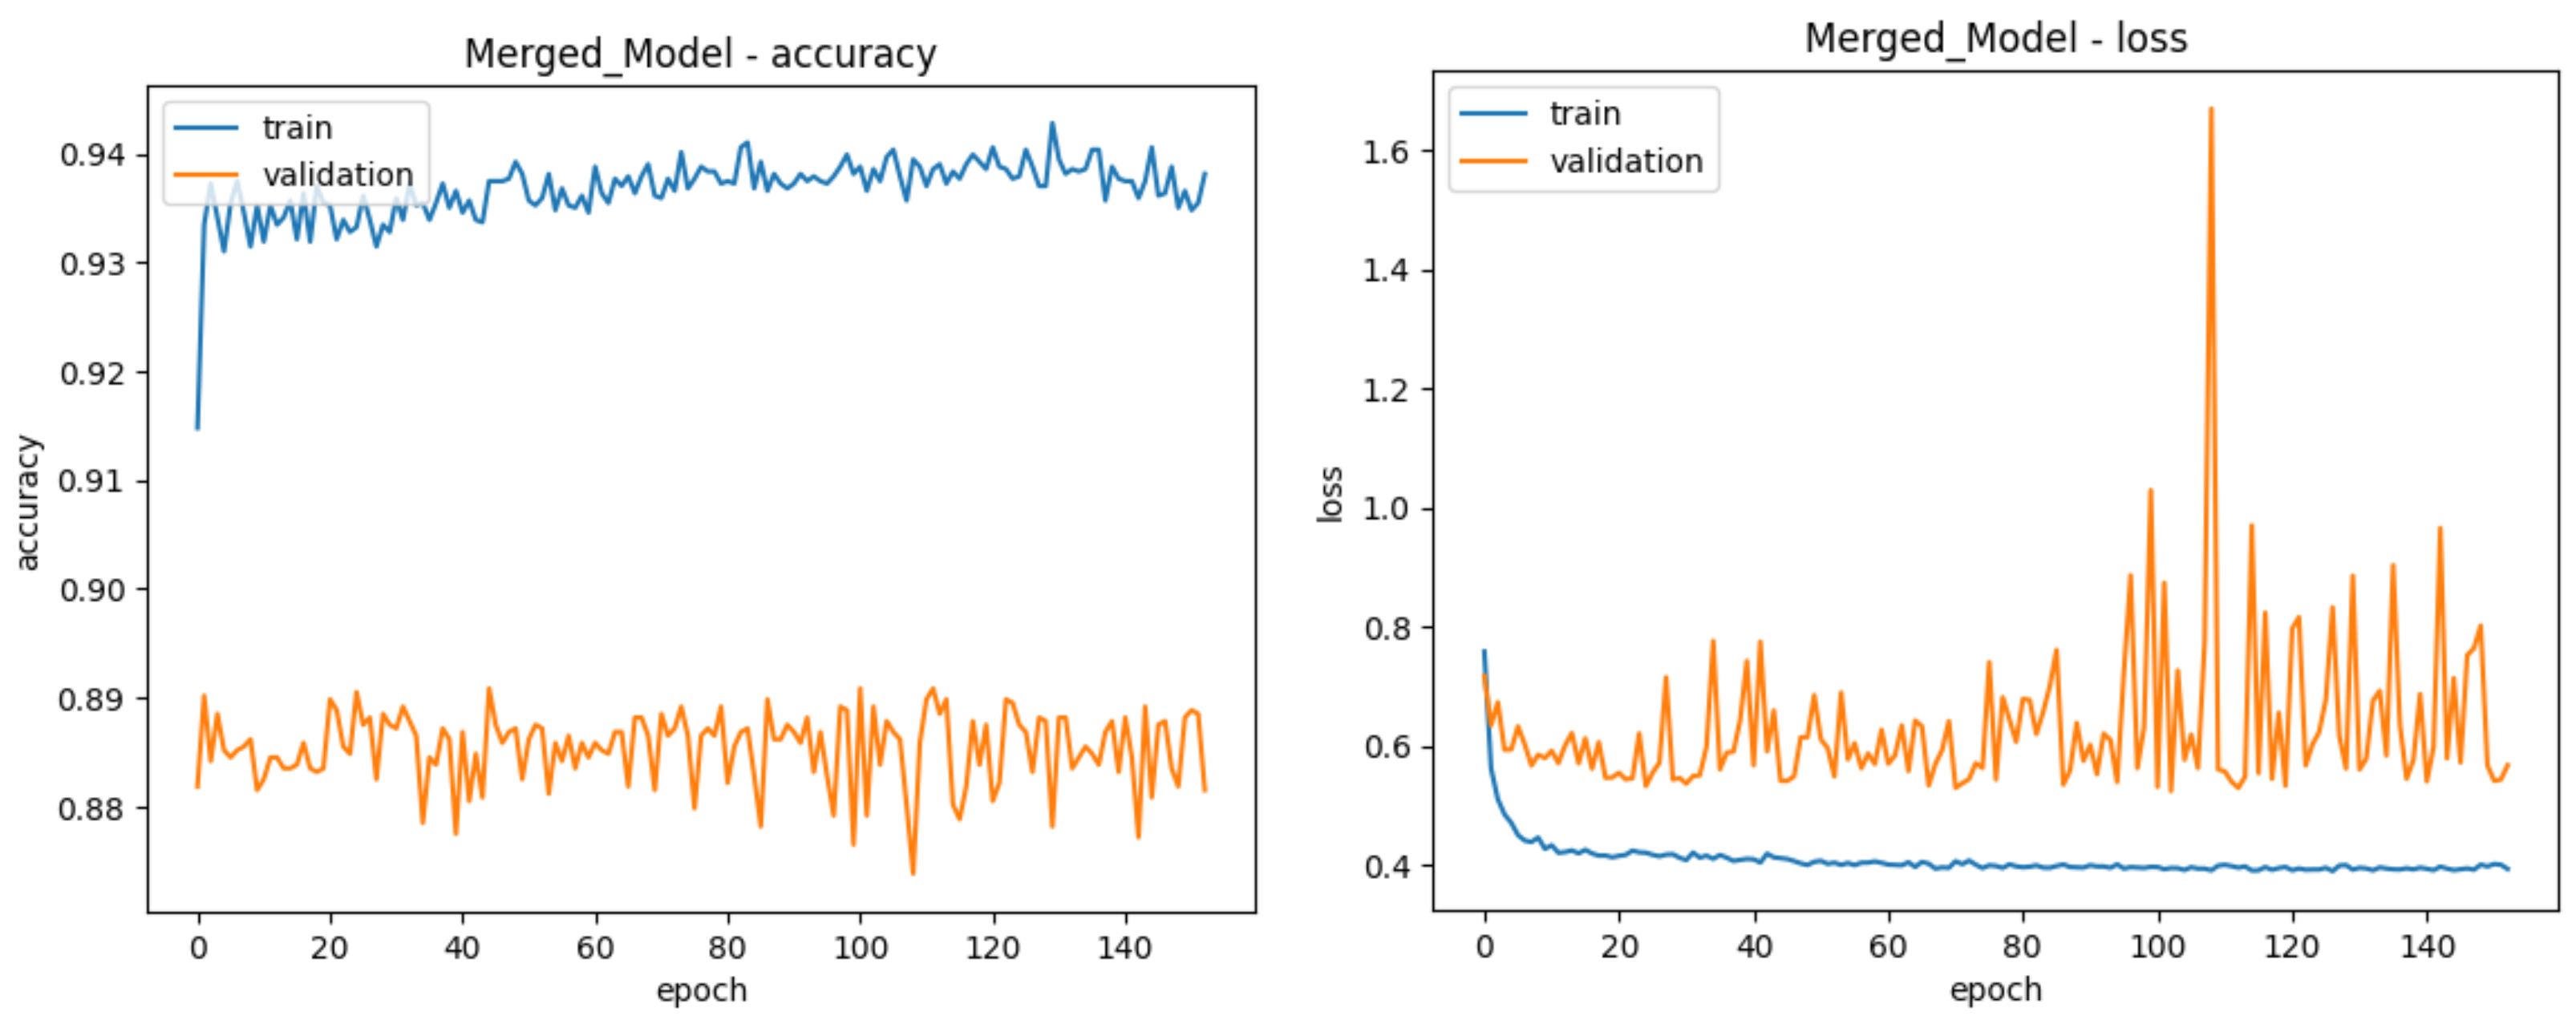
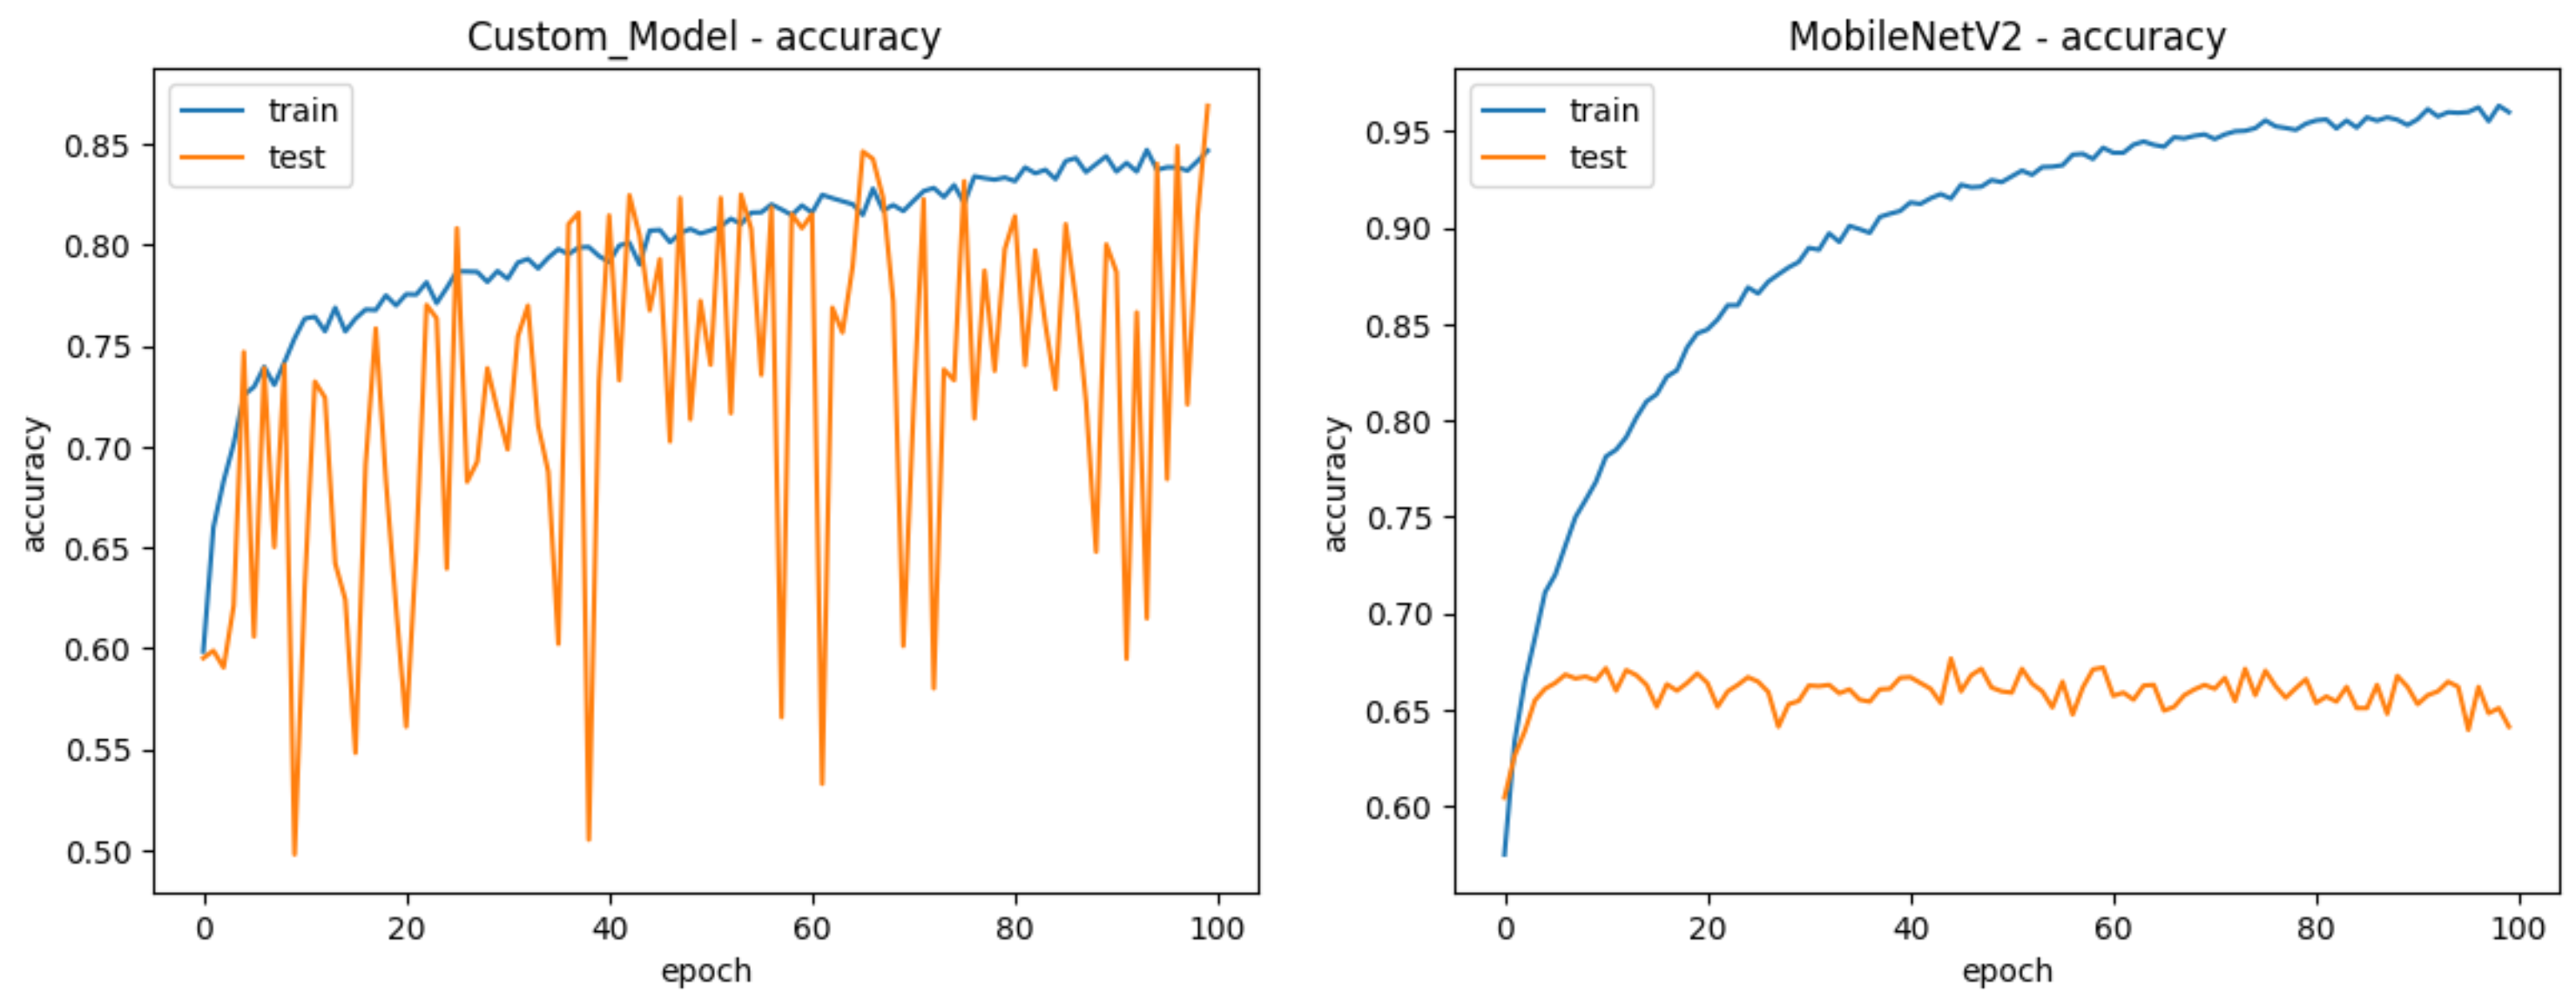
| Model A | Model B | Model C | Merged Model | |
|---|---|---|---|---|
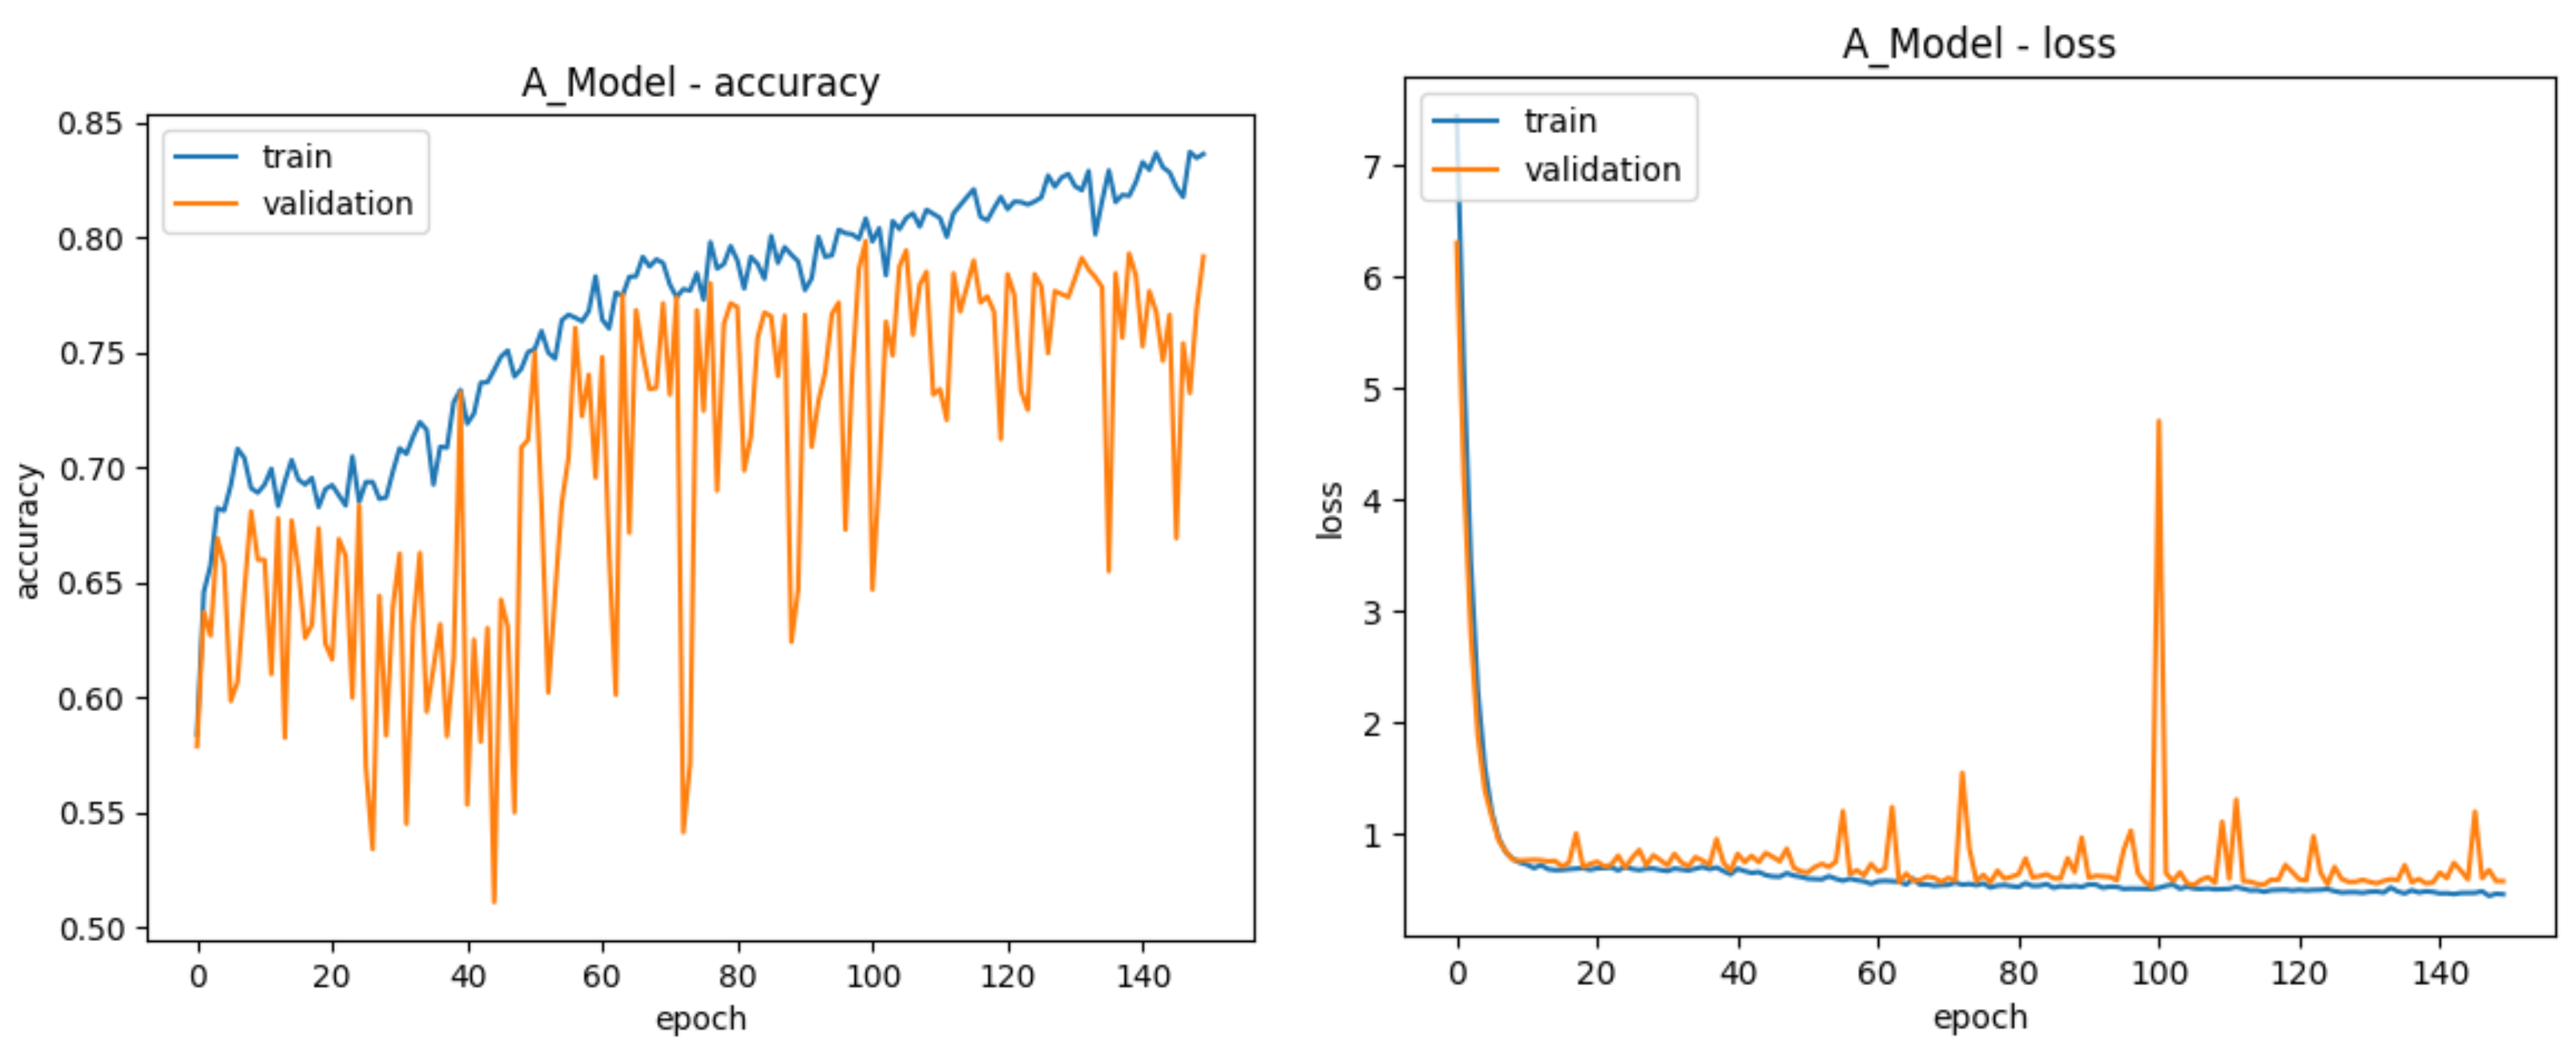
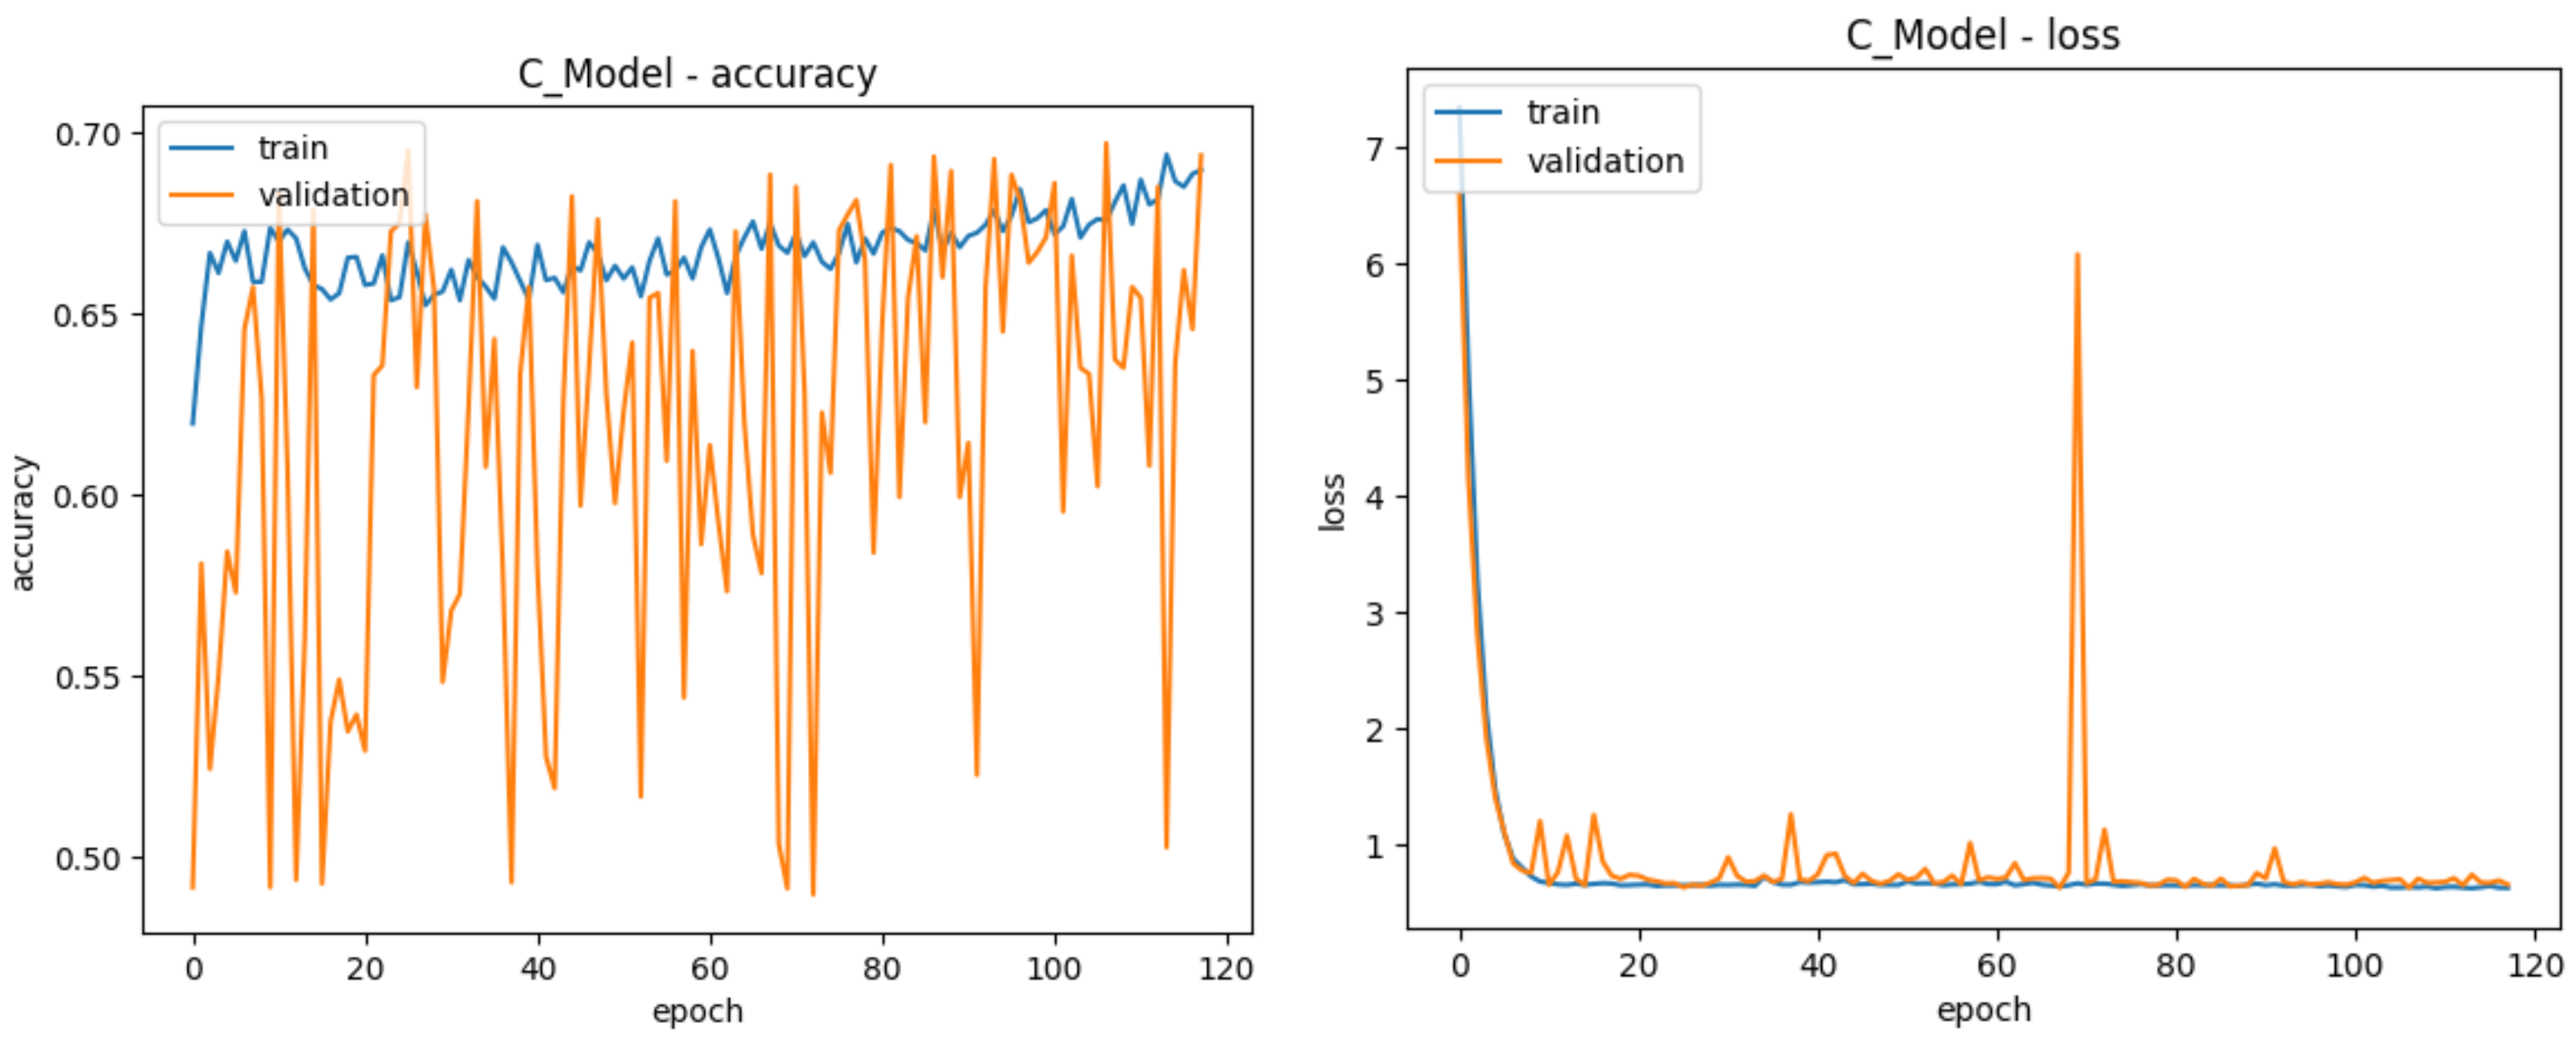
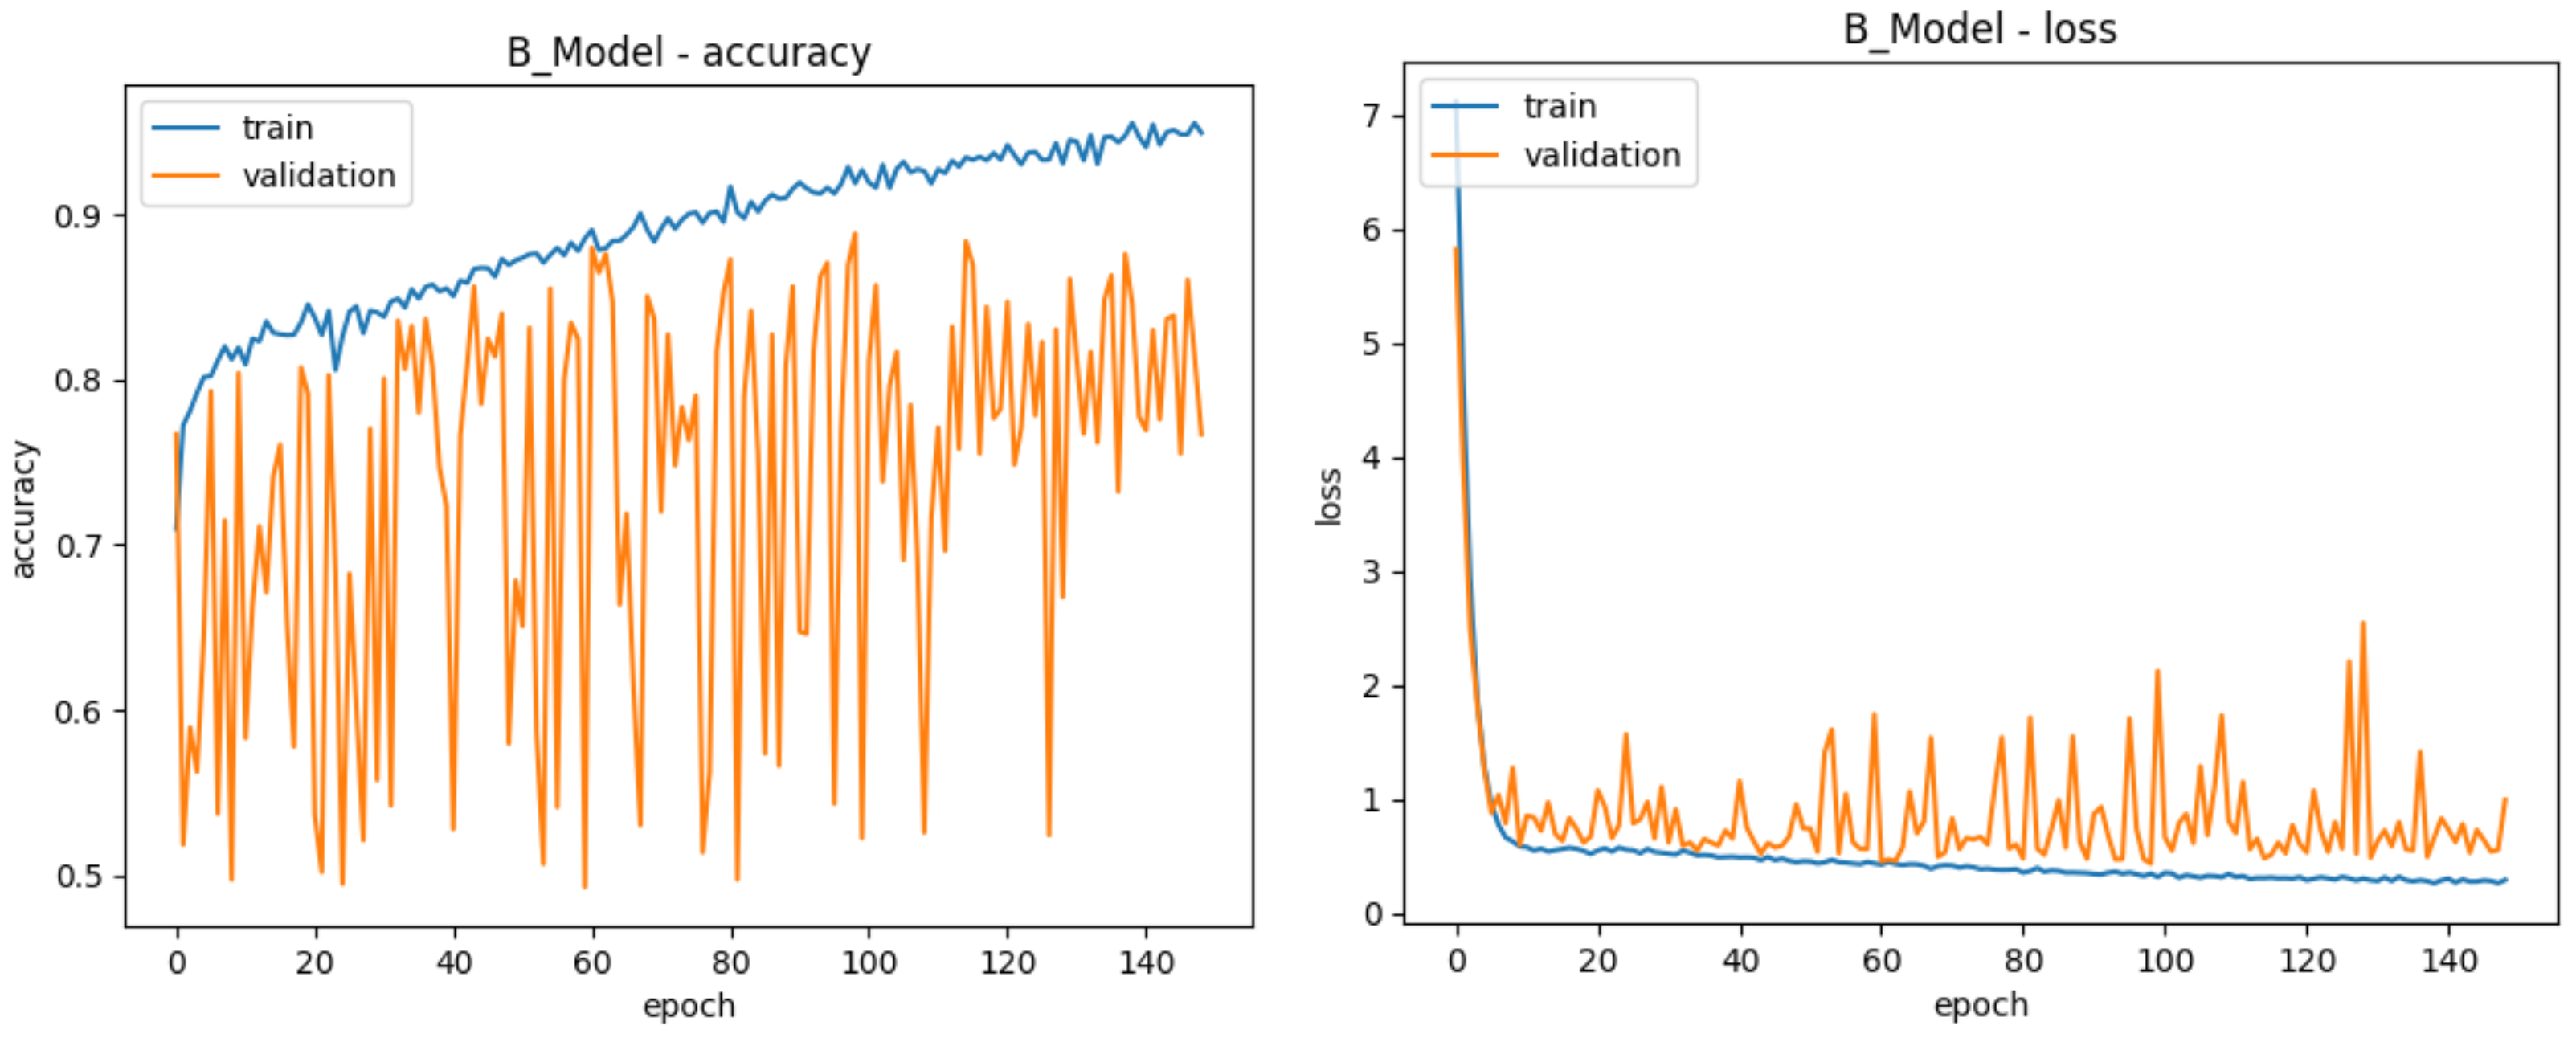
| Training Accuracy | 80.73% | 91.85% | 71.06% | 93.85% |
| Validation Accuracy | 78.43% | 88.81% | 68.85% | 88.91% |
| Test Accuracy | 78.64% | 68.02% | 50.70% | 89.59% |
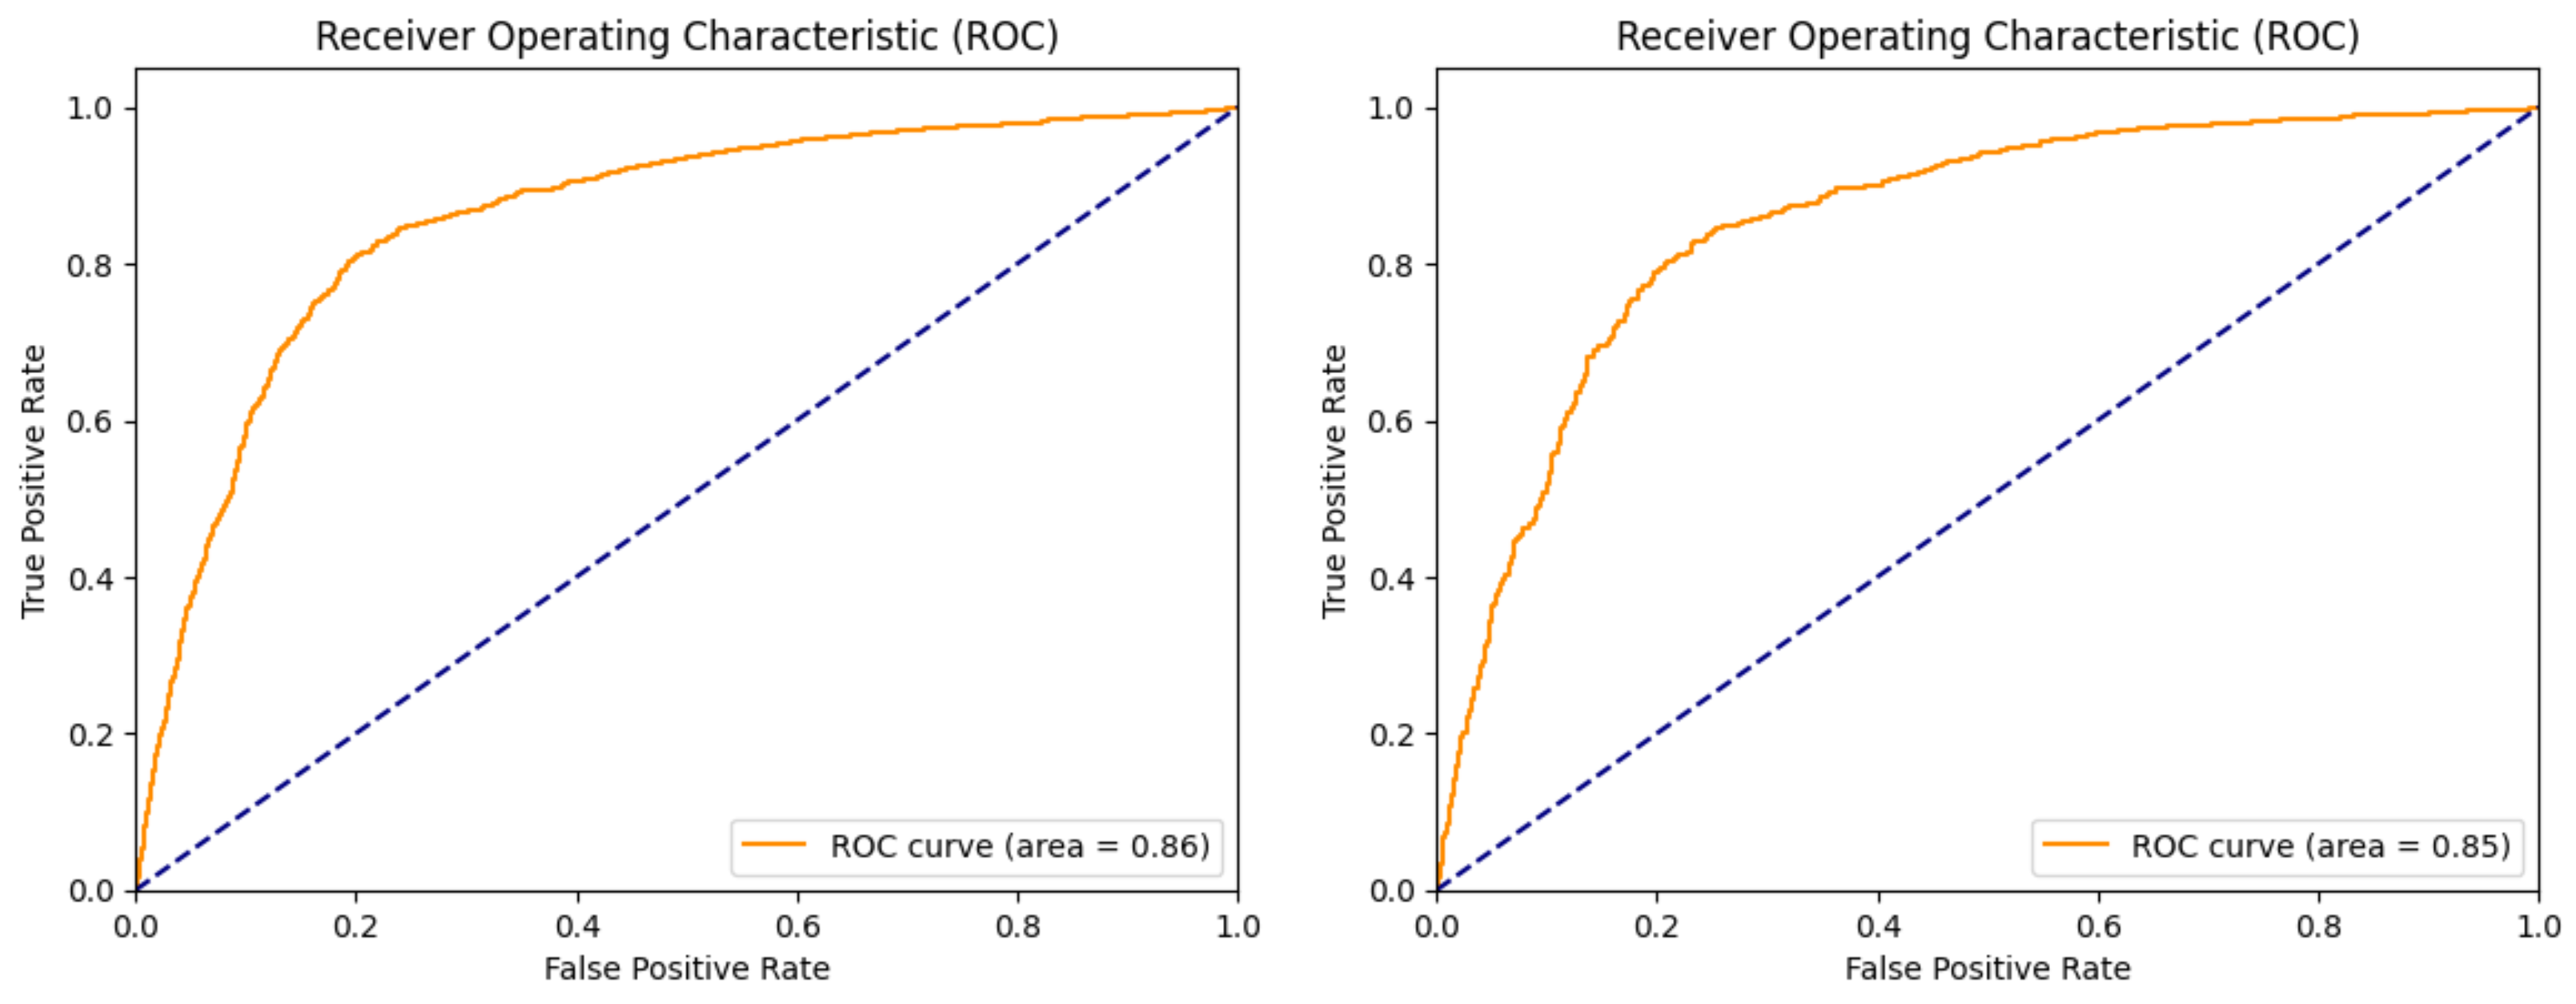
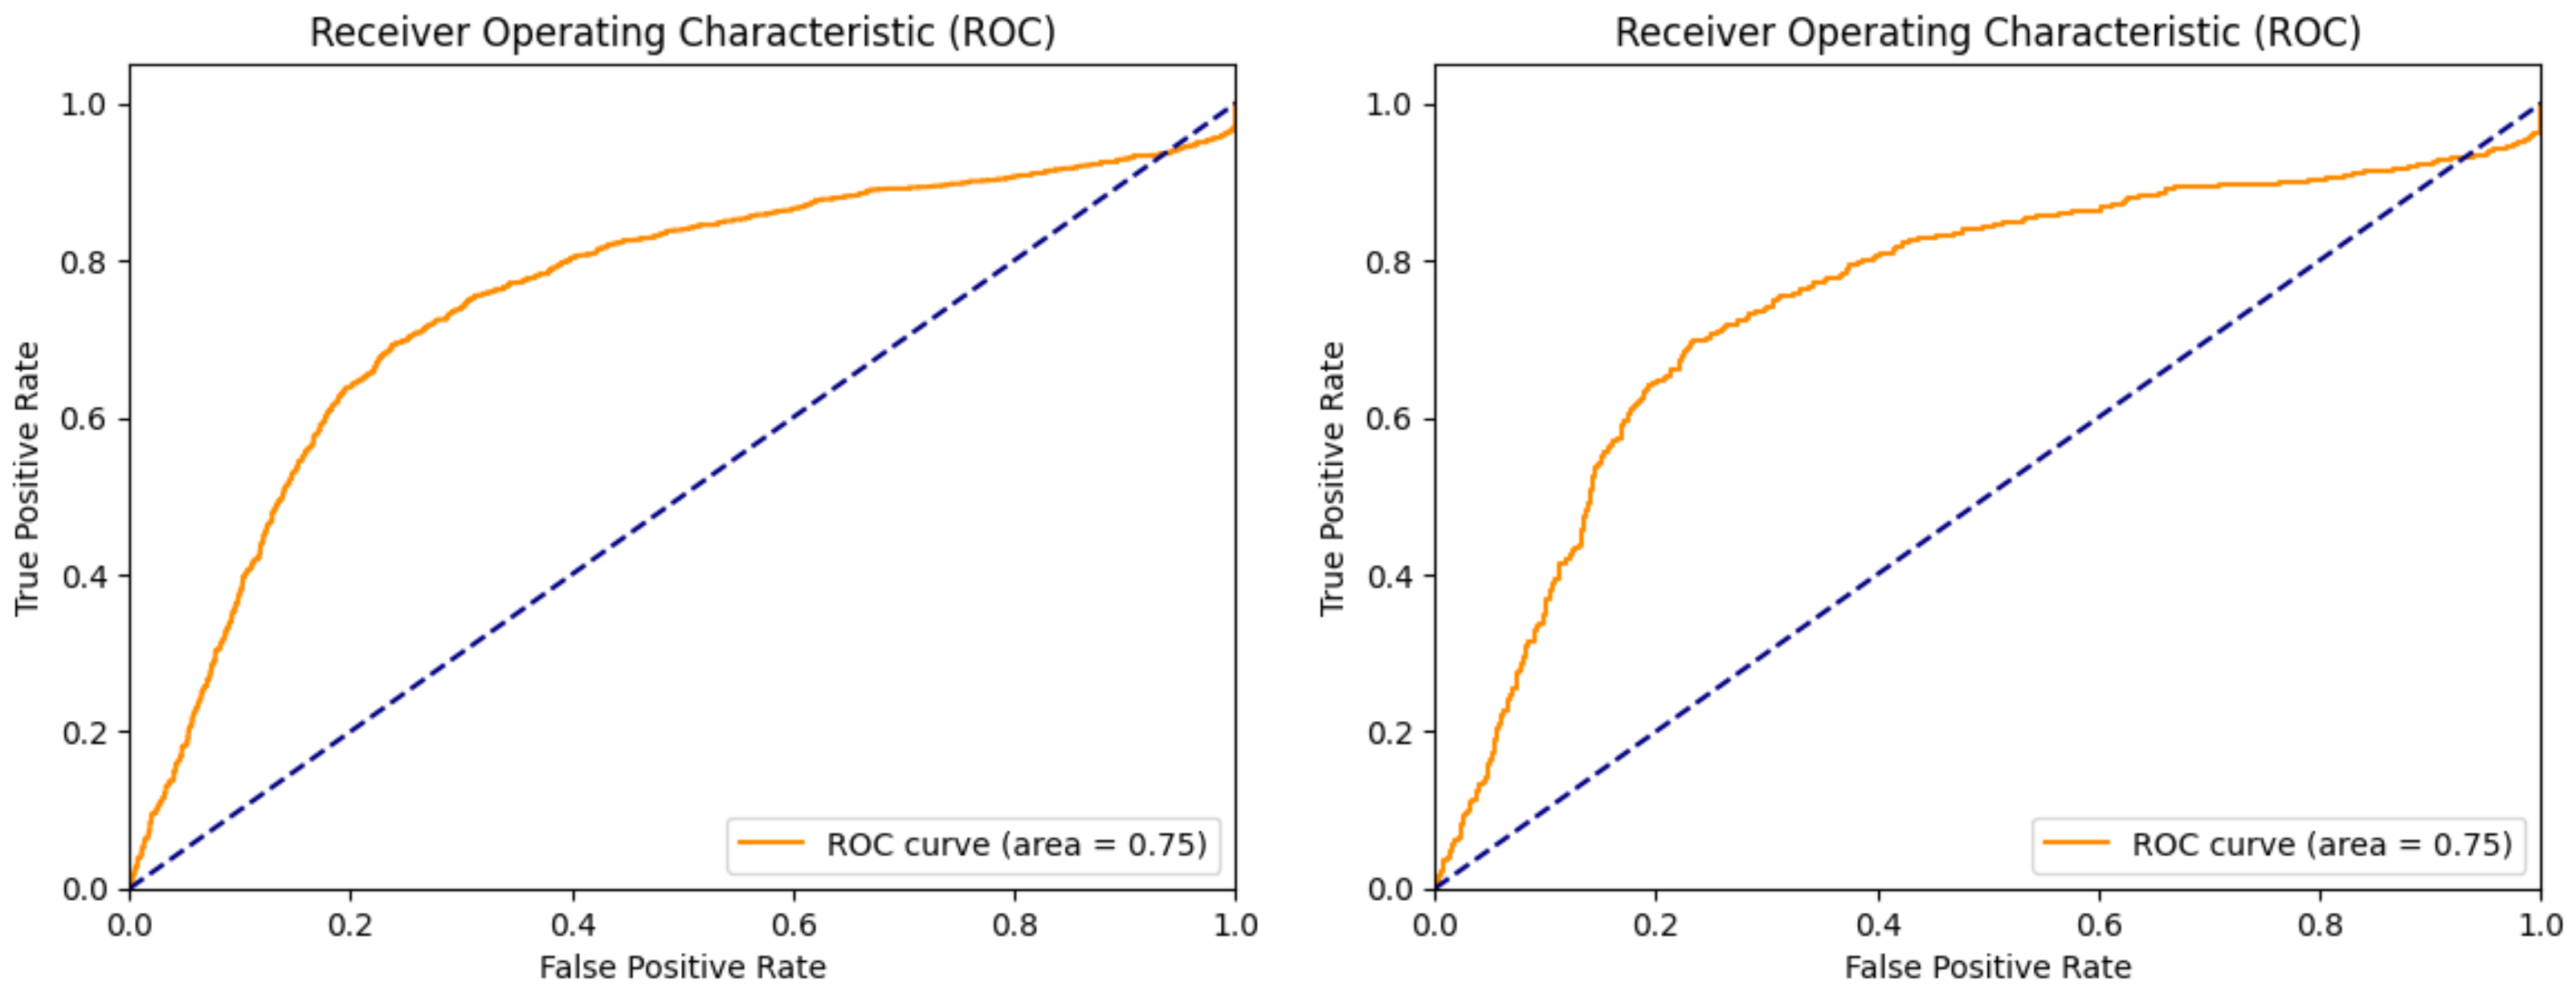
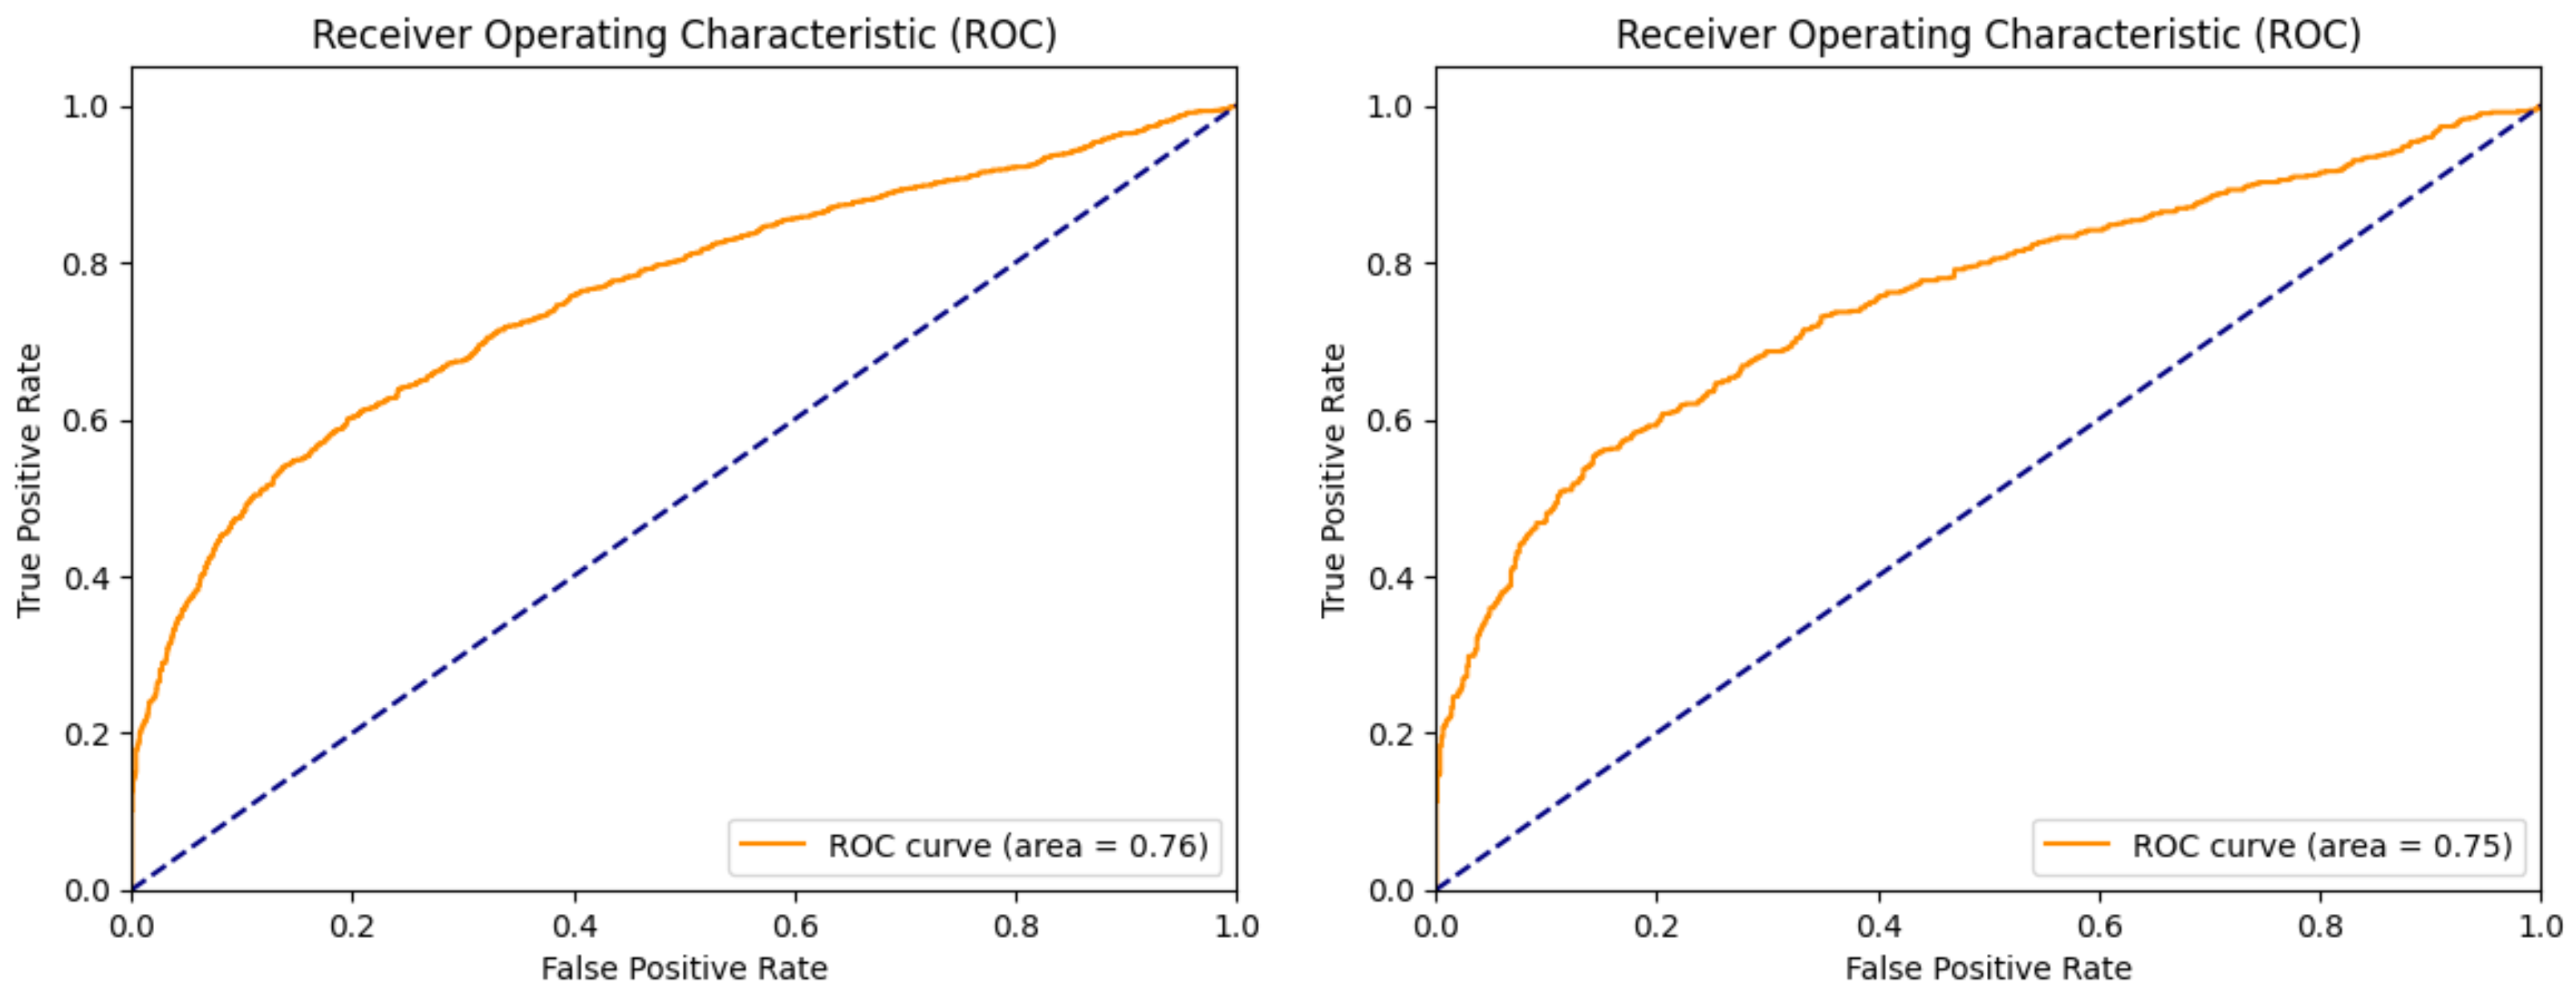
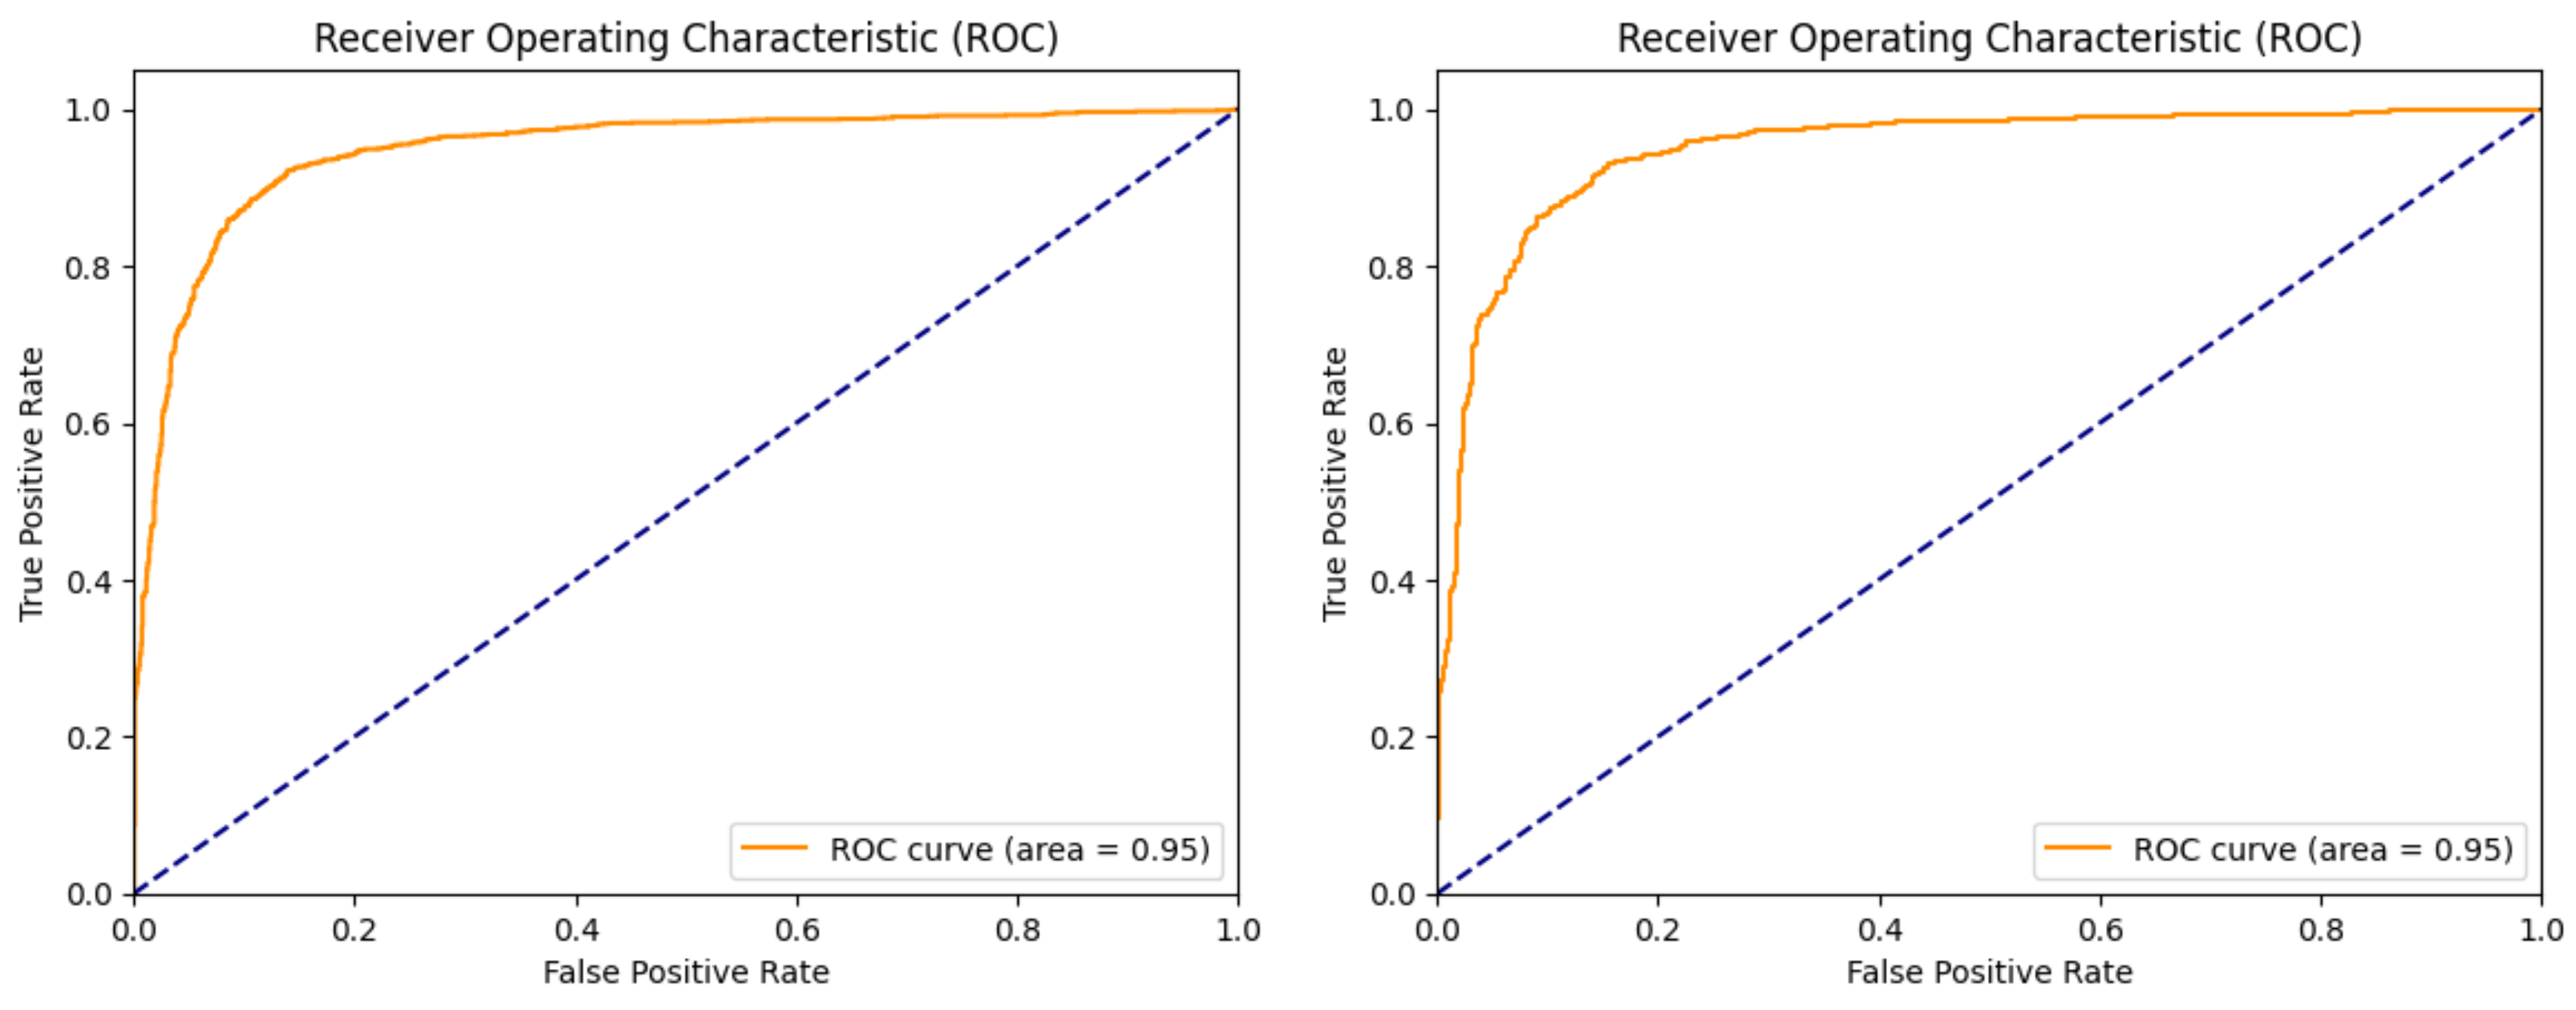
| Test ROC | 0.87 | 0.76 | 0.75 | 0.96 |
| Total Epochs | 125 | 148 | 117 | 152 |
| Best Epoch | 75 | 98 | 67 | 102 |
Disclaimer/Publisher’s Note: The statements, opinions and data contained in all publications are solely those of the individual author(s) and contributor(s) and not of MDPI and/or the editor(s). MDPI and/or the editor(s) disclaim responsibility for any injury to people or property resulting from any ideas, methods, instructions or products referred to in the content. |
© 2024 by the authors. Licensee MDPI, Basel, Switzerland. This article is an open access article distributed under the terms and conditions of the Creative Commons Attribution (CC BY) license (https://creativecommons.org/licenses/by/4.0/).
Share and Cite
Alencar, A.L.; Lopes, M.D.; Fernandes, A.M.d.R.; Anjos, J.C.S.d.; De Paz Santana, J.F.; Leithardt, V.R.Q. Detection of Forged Images Using a Combination of Passive Methods Based on Neural Networks. Future Internet 2024, 16, 97. https://doi.org/10.3390/fi16030097
Alencar AL, Lopes MD, Fernandes AMdR, Anjos JCSd, De Paz Santana JF, Leithardt VRQ. Detection of Forged Images Using a Combination of Passive Methods Based on Neural Networks. Future Internet. 2024; 16(3):97. https://doi.org/10.3390/fi16030097
Chicago/Turabian StyleAlencar, Ancilon Leuch, Marcelo Dornbusch Lopes, Anita Maria da Rocha Fernandes, Julio Cesar Santos dos Anjos, Juan Francisco De Paz Santana, and Valderi Reis Quietinho Leithardt. 2024. "Detection of Forged Images Using a Combination of Passive Methods Based on Neural Networks" Future Internet 16, no. 3: 97. https://doi.org/10.3390/fi16030097
APA StyleAlencar, A. L., Lopes, M. D., Fernandes, A. M. d. R., Anjos, J. C. S. d., De Paz Santana, J. F., & Leithardt, V. R. Q. (2024). Detection of Forged Images Using a Combination of Passive Methods Based on Neural Networks. Future Internet, 16(3), 97. https://doi.org/10.3390/fi16030097