1. Introduction
Federated learning solves the conflict between data privacy and model performance, allowing institutions to collaboratively enhance their models without sharing sensitive data [
1,
2]. However, maintaining robust local models across institutions is a challenge due to limited data. This paper explores data expansion techniques in federated learning, focusing on strategies to fortify local models using external datasets. We employ the Comprehensive Heart Disease Dataset and UCI Heart Disease Data to illustrate these techniques. The TabNet model integrates aspects of tree-based models and DNNs [
3]. Its architecture accommodates dynamic feature selection and computation, offering a promising solution for data expansion. In light of privacy concerns, we investigate the integration of differential privacy [
4] to bolster privacy safeguards in federated learning. Furthermore, we explore the potential of blockchain technology and smart contracts to enhance transparency and coordination in the federated learning process. Through a synergy of these elements, this paper aims to provide insights into effective data expansion strategies in federated learning while maintaining stringent data privacy standards.
The dawn of the digital age has brought immense potential for utilizing data to transform industries, solve complex challenges, and improve decision-making. Amid this, concerns regarding data privacy and security have become paramount. Institutions possess valuable data assets, but the fear of compromising sensitive information often hinders their willingness to collaborate. Federated learning emerges as a solution, allowing institutions to harness the power of data while preserving privacy collectively. In healthcare, where data privacy and patient confidentiality are non-negotiable, the potential for federated learning is even more evident. The ability to collaboratively build predictive models for heart disease, a major global health concern, holds immense promise. However, creating such models while upholding privacy standards presents a significant challenge. This paper is a testament to the marriage of technological innovation and ethical considerations. At its core, it aims to develop a complete system for heart disease prediction while ensuring privacy is not compromised. This paper showcases the technical prowess of building predictive models and underscores the ethical imperative of safeguarding sensitive information. By combining innovation with integrity, the system presented here strives to be a cornerstone in reshaping how data are harnessed for predictive analytics while respecting privacy concerns. The key contributions of this work can be outlined as follows:
Techniques are explored to expand the available data pool without centralizing sensitive information. By integrating external datasets into the federated learning paradigm, the robustness of local models is enhanced.
Differential privacy techniques are incorporated to strengthen data protection. This approach ensures that predictive insights do not compromise personal information, fostering participant confidence.
The potential of blockchain technology and smart contracts is investigated to enhance transparency and trust. Their integration fosters accountability and provides an immutable record of interactions, redefining the governance of federated learning.
A comprehensive system is presented by integrating data expansion techniques, advanced model architectures, privacy mechanisms, and blockchain technology, demonstrating the feasibility of predictive analytics in healthcare while upholding privacy principles.
The remainder of this paper is structured as follows:
Section 2 provides a literature review and a background on federated learning and blockchain technology.
Section 3 details the data expansion techniques employed and describes the TabNet model architecture and implementation.
Section 4 presents the results and analysis of the model’s performance. Finally,
Section 5 concludes the paper by discussing the findings and future research directions.
3. Model Construction and Training Setup
This section outlines the construction of the model architecture, the choice of hyperparameters, the training procedure, and the evaluation metrics used in our federated learning setup. The model’s construction involves selecting appropriate hyperparameters and configuring them to work within the federated learning setup. The key parameters introduced in this paper are further elaborated below to allow for accurate reconstruction and verification.
Learning Rate (): The learning rate used in our model is set to 1 × 10⁻³. This parameter controls how much the model needs to change in response to the error each time the weights are updated. It is crucial to balance convergence speed and stability, with values typically ranging between 1 × 10⁻⁴ and 1 × 10⁻¹ depending on the data.
Batch Size (M): The mini-batch size is set to 512, denoted as M. This setup allows each client to process the dataset in smaller batches for local training before sending updates to the server.
Client Selection Fraction (): The fraction of clients participating in each communication round is set to 1. This parameter, , controls the portion of clients that perform computation in each round, and a value of 1 represents full participation in the federated learning process.
Training Steps (S): Each client performs S training steps locally, where . This step controls how much computation each client performs before sending updates to the central server.
We utilize the TabNet architecture because it handles tabular data effectively while leveraging attention-based mechanisms for feature selection.
Table 1 overviews the key parameters used during training. The TabNet architecture was selected for its ability to balance interpretability and performance when dealing with tabular data. Its attention-based feature selection mechanism is particularly useful in distributed environments like federated learning, where transparency and efficiency are key. The TabNet model outputs a probability score between 0 and 1, representing the likelihood of heart disease. Scores ≥0.5 indicate a higher risk (positive), while those <0.5 indicate lower risk (negative). This probabilistic output offers more nuanced predictions compared to binary classification.
Hyperparameters: These settings control the learning process. In this case, we set the learning rate to 1 × 10⁻³, which balances efficient convergence with stability. A batch size of 512 ensures that a sufficiently large subset of data is used during each training iteration, enhancing the model’s ability to generalize while keeping memory requirements reasonable.
Loss Function: We used the Binary Cross Entropy (BCE) loss function, which is well suited for binary classification tasks, such as predicting whether a patient is at risk of heart disease. BCE calculates the difference between the predicted probabilities and the actual binary class labels (0 or 1), penalizing incorrect predictions more heavily the further they are from the true label. The formula for BCE is as follows:
where
is the true label,
is the predicted probability for each sample
i, and
N is the total number of samples.
Optimizer: The Adam optimizer was selected for its ability to adapt the learning rate during training, making it well-suited for large and noisy datasets. Adam combines the advantages of RMSprop and momentum-based methods, leading to faster convergence without requiring extensive hyperparameter tuning.
Training Procedure: Several strategies were employed to ensure robust training. Random shuffling of the training data helps prevent the model from learning patterns specific to the order of the data, enhancing generalization. Early stopping monitors the validation loss and halts training when no improvement is observed, preventing overfitting. Additionally, model checkpointing is employed to save the best-performing model during training, ensuring that the final model retains the best performance.
Accuracy: Accuracy measures the ratio of correctly predicted instances to the total number of predictions. It evaluates how well the model’s predictions match the actual outcomes. For heart disease prediction task, accuracy is defined as
This metric is particularly useful in binary classification tasks like heart disease prediction, where we assess the model’s ability to distinguish between positive (patients with heart disease) and negative (patients without heart disease) cases.
Training Loss: Training loss is calculated using the Binary Cross Entropy (BCE) loss function, which penalizes incorrect predictions. The BCE loss function is commonly used for binary classification problems. The formula for BCE loss is
where
is the true label (0 or 1),
is the predicted probability, and
N is the total number of samples. This loss function helps guide the optimization process during training, with the goal of minimizing the error between predicted and true values.
3.1. Data Expansion
Multiple institutions participate in federated learning, each maintaining its dataset to protect privacy and prevent the disclosure of confidential information. Additionally, the local models at these institutions must undergo frequent fine-tuning to maintain high performance and remain relevant to evolving data features. This process necessitates the availability of diverse datasets to support continuous adaptation and improvement.
The first dataset is the Comprehensive Heart Disease Dataset [
22], which combines five popular heart disease datasets and contains 1190 instances with 11 features. The second dataset is UCI Heart Disease Data [
23], a collection of various numerical variables used for multivariate numerical data analysis. It consists of 14 attributes: age, sex, chest pain type, resting blood pressure, serum cholesterol, fasting blood sugar, resting electrocardiographic results, maximum heart rate achieved, exercise-induced angina, oldpeak (ST depression induced by exercise relative to rest), the slope of the peak exercise ST segment, number of major vessels, and Thalassemia. These attributes provide information about different aspects related to cardiovascular health and can be used to analyze and understand patterns and relationships within the data. We use padding for the data because the second dataset contains two features not present in the first dataset: the number of major vessels and Thalassemia. As is the case with most methods used in deep learning, we set these two features to 0.
3.2. TabNet Model Architecture
For tasks using tabular data, tree-based models have better performance than other models, and Boosting tree-based models like XGBoost [
24] and LightGBM [
25] have become the standard in data mining competitions nowadays. In this project, we need to keep updating the local models by online learning. However, the tree-based model can only be retrained with the whole dataset because the decision tree structure will be destroyed and rebuilt in the training process. Consequently, we chose TabNet, a DNN model with a fixed model structure that also features tree-based models. It has the advantages of interpretability and sparse feature selection of tree-based models while retaining the end-to-end and representation learning features of DNNs.
(1) Building a decision tree using a DNN.
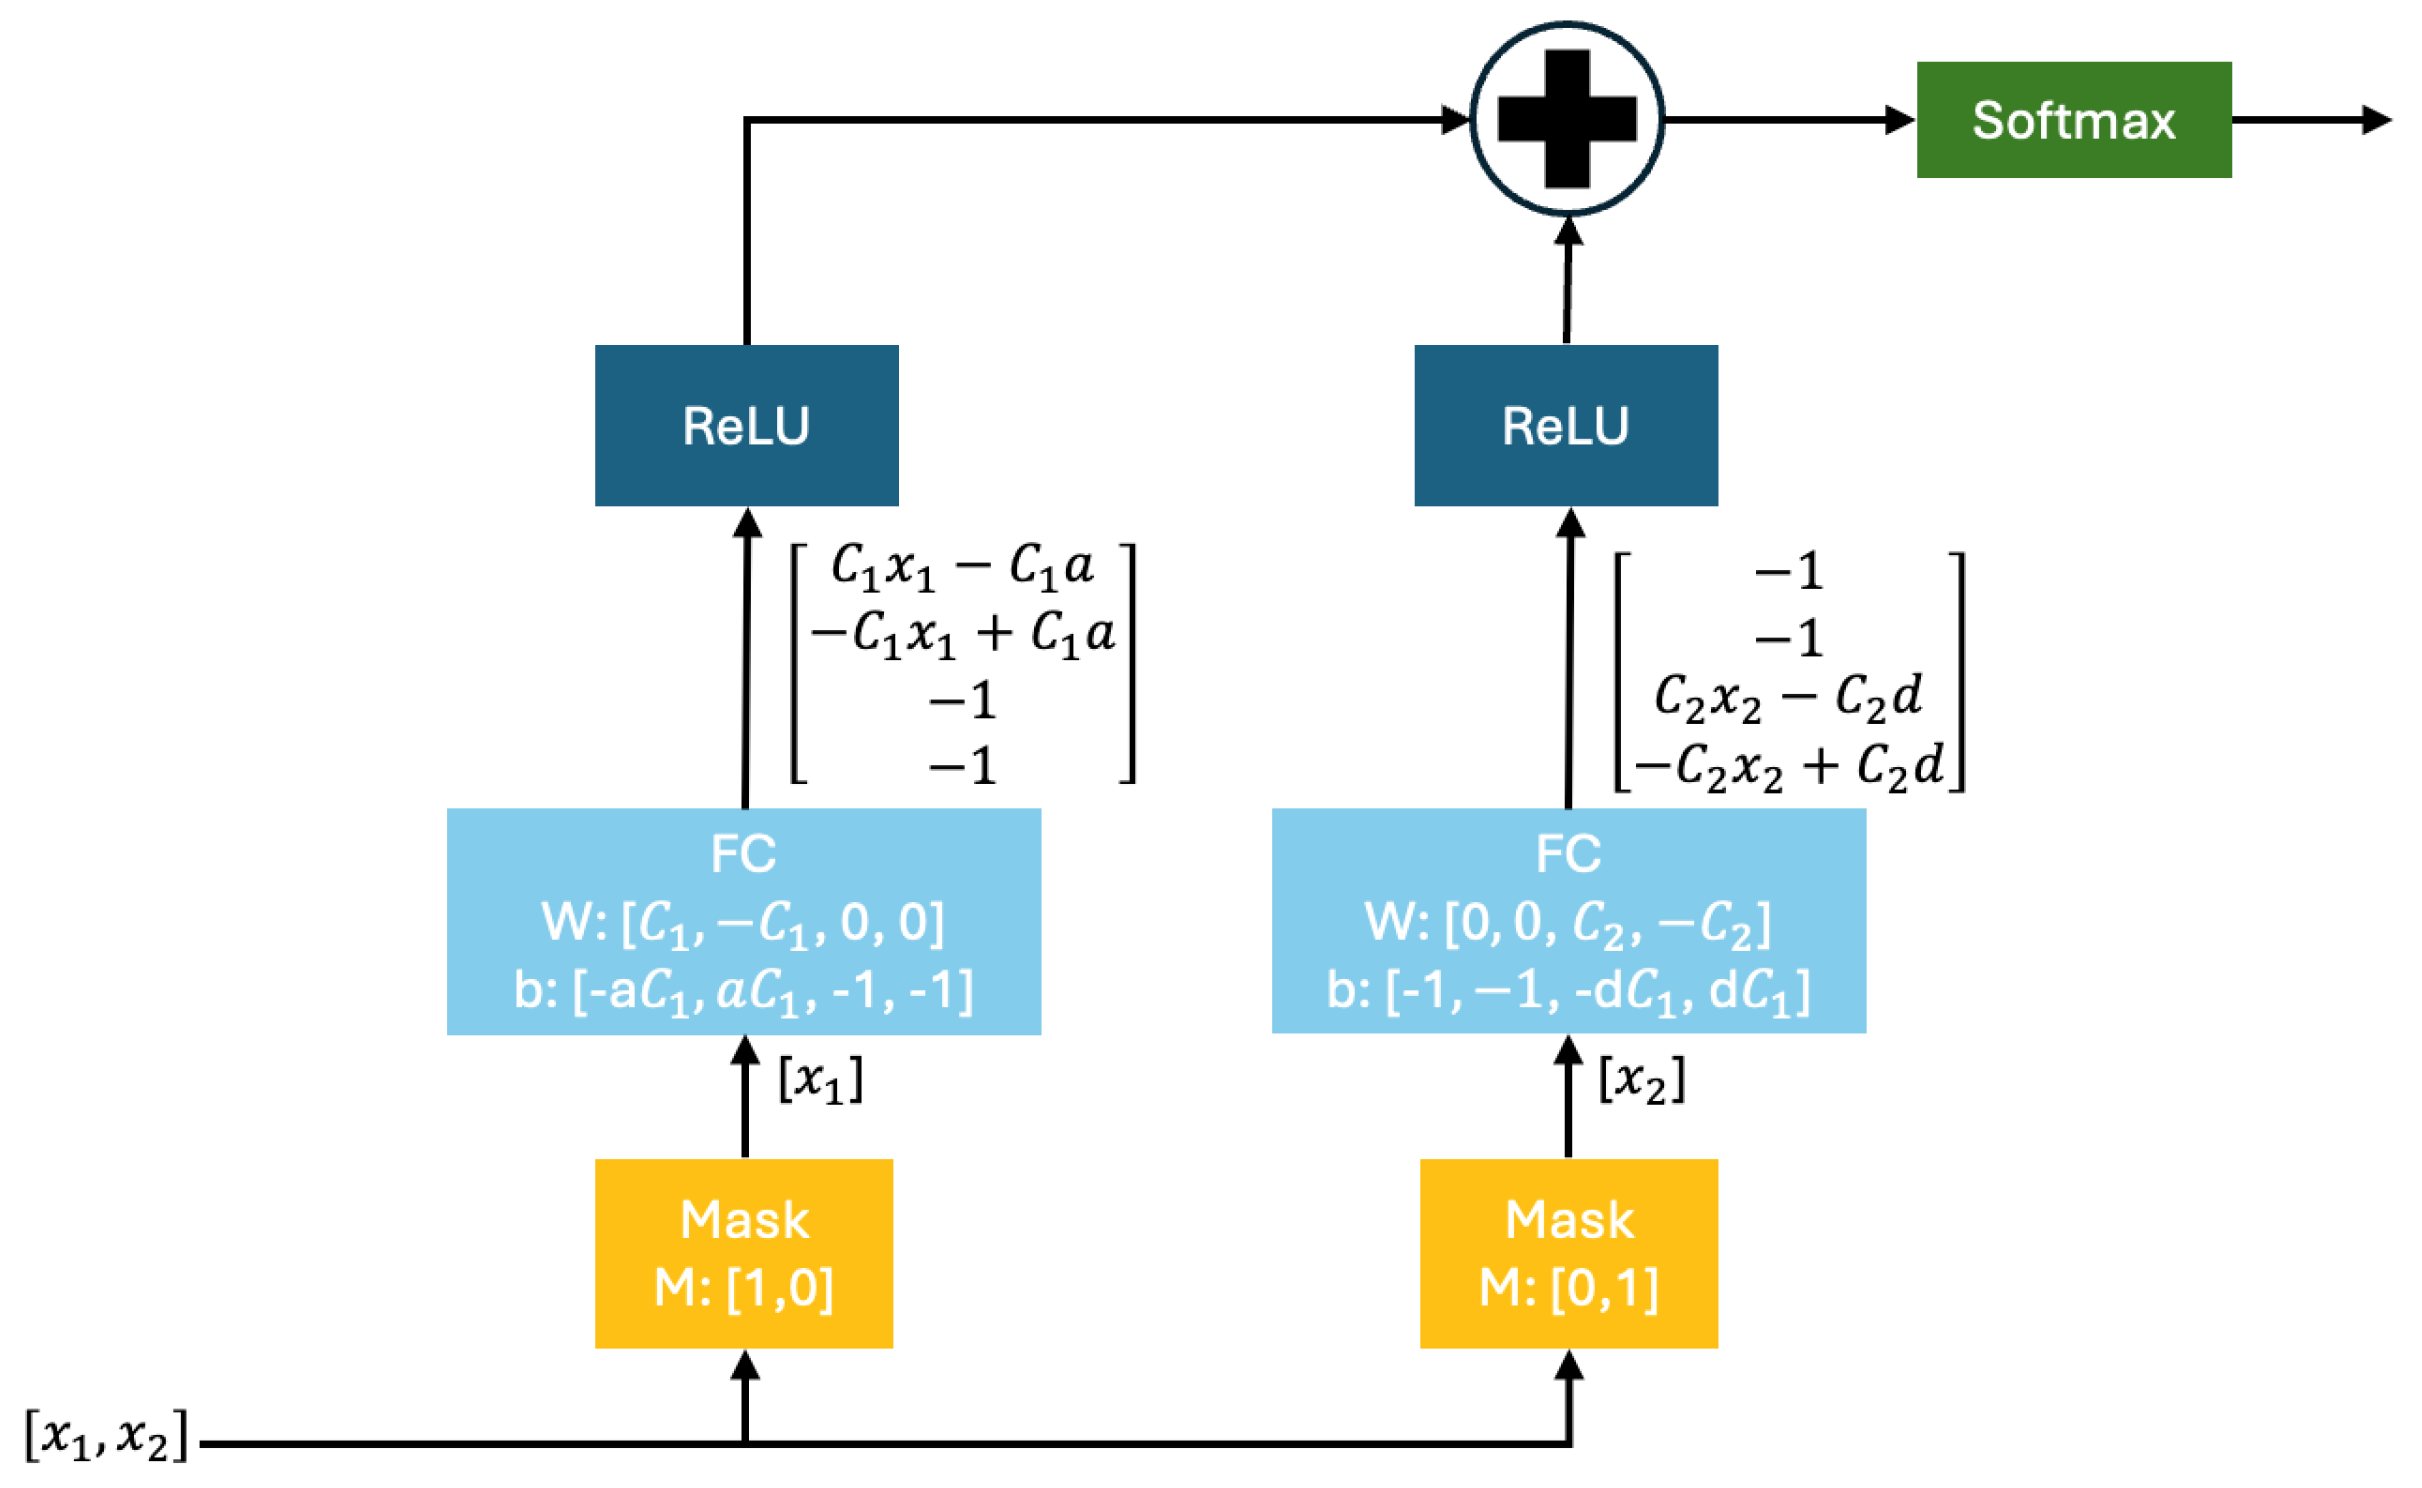
Figure 2 illustrates a DNN structured similarly to a decision tree. This architecture processes inputs through masked, fully connected (FC) layers that isolate specific features. Non-linearity and classification are achieved through ReLU and softmax layers, respectively. The diagram also details how weight (
W) and bias (
b) influence decision paths, where both
W and
b are represented as four-dimensional vectors, corresponding to different layers of the network. Initially, input features
and
are filtered by mask layers, then passed through fully connected layers with explicitly set weights and biases. Variables like
C and
D represent feature transformation and decision layers, while
a refers to the attention mechanism applied during feature selection.
Weights and biases are key to transforming and combining input features to make predictions. Weights, learned during training, adjust the strength of connections between neurons, while biases shift activation functions for better data fitting. In TabNet, the attention mechanism uses weights to emphasize essential features and suppress irrelevant ones, while biases further refine layer outputs, ensuring the model captures complex relationships. These parameters enable the TabNet model to process tabular data and make accurate predictions efficiently.
The ReLU activation function sums up the outputs of the two FC layers and passes through a softmax activation function as the final output.
Let us compare it with the decision tree process. We can find that each layer of this neural network corresponds to the corresponding step of the decision tree: The mask layer corresponds to feature selection in the decision tree, which is well understood; FC layer+ReLU corresponds to the threshold judgment. Take as an example:
After passing through the FC layer, followed by ReLU activation, the model ensures that only one element of the output vector remains positive (i.e., greater than zero). In contrast, the other elements are set to zero. This process mirrors the conditional decisions made in a decision tree, where a single decision path is chosen based on feature thresholds.
This corresponds to the conditional judgment of the decision tree; finally, the results of all the conditional judgments are added up, and the final output is obtained through a softmax layer.
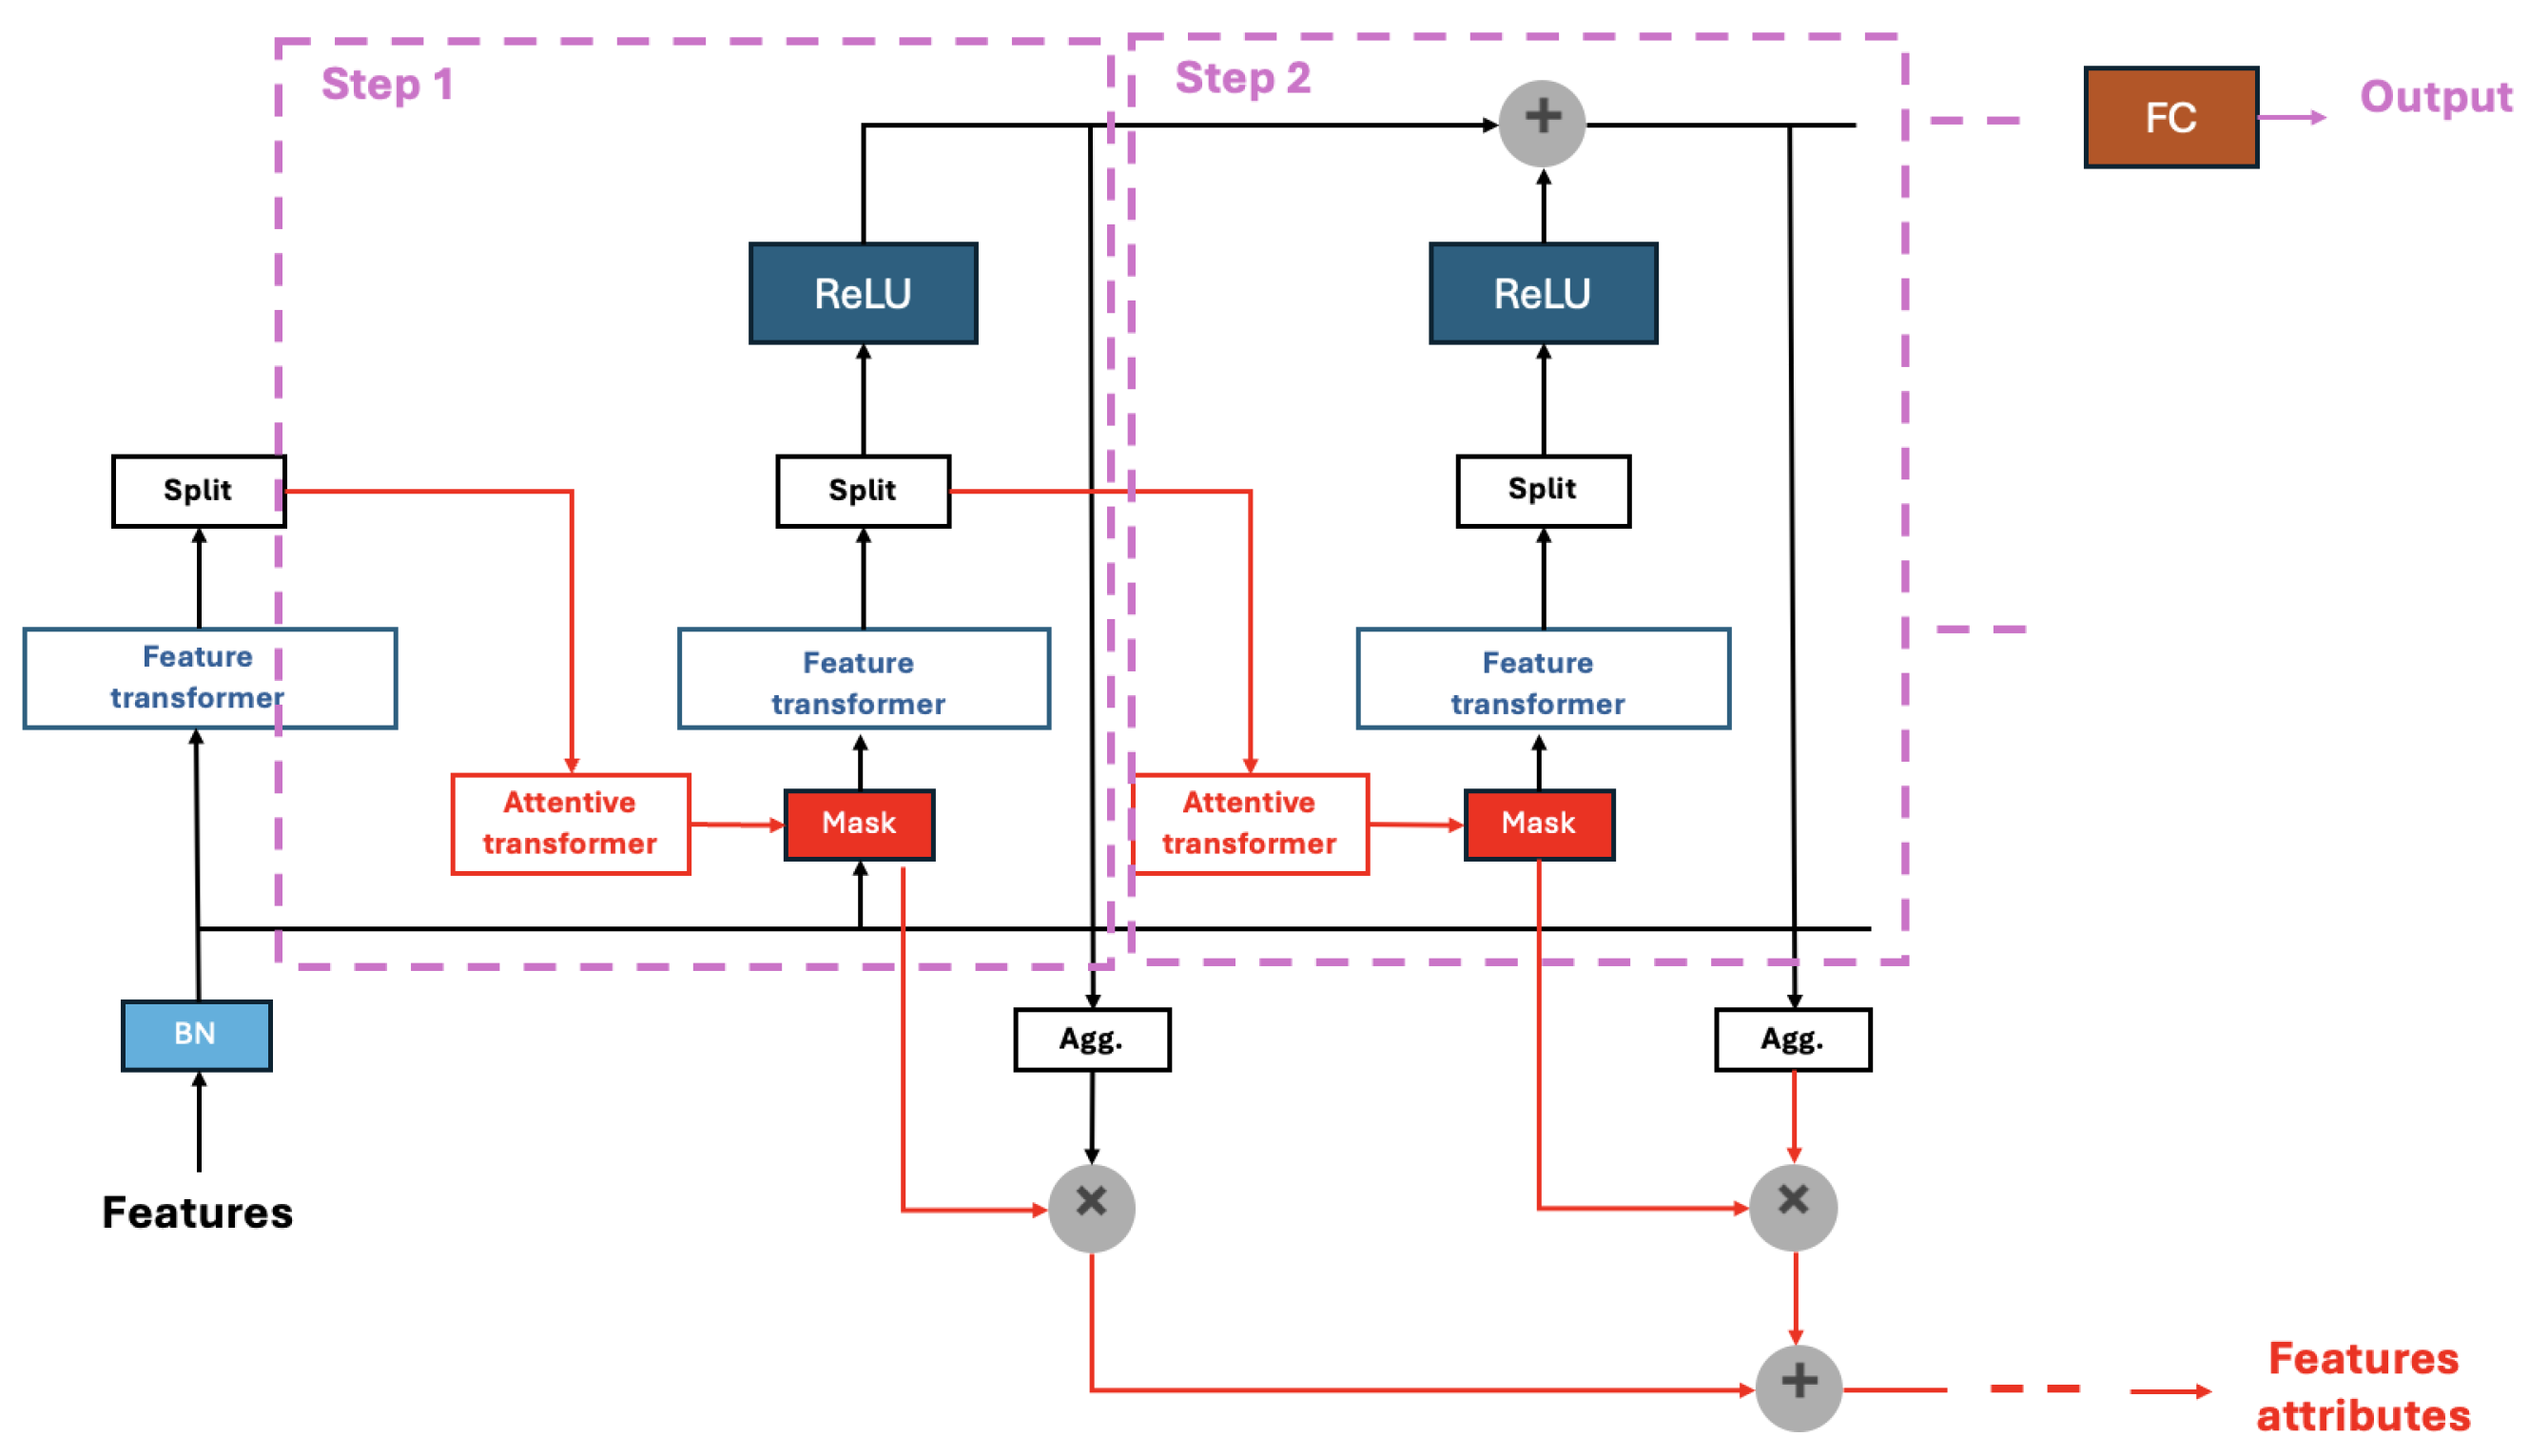
(2) The model structure of TabNet is illustrated in
Figure 3. This figure outlines the architecture of TabNet for tabular data processing, showcasing the sequence of operations, including batch normalization, feature transformation, attentive transformation, masking, and aggregation, which culminate in the output through ReLU activation and a fully connected layer. This model shares a framework similar to traditional neural networks, functioning as an additive model with multiple processing steps. The input to the model consists of features with dimensions
, where
B represents the batch size and
D denotes the dimension of the features. The output of the model is a vector representing the classification result.
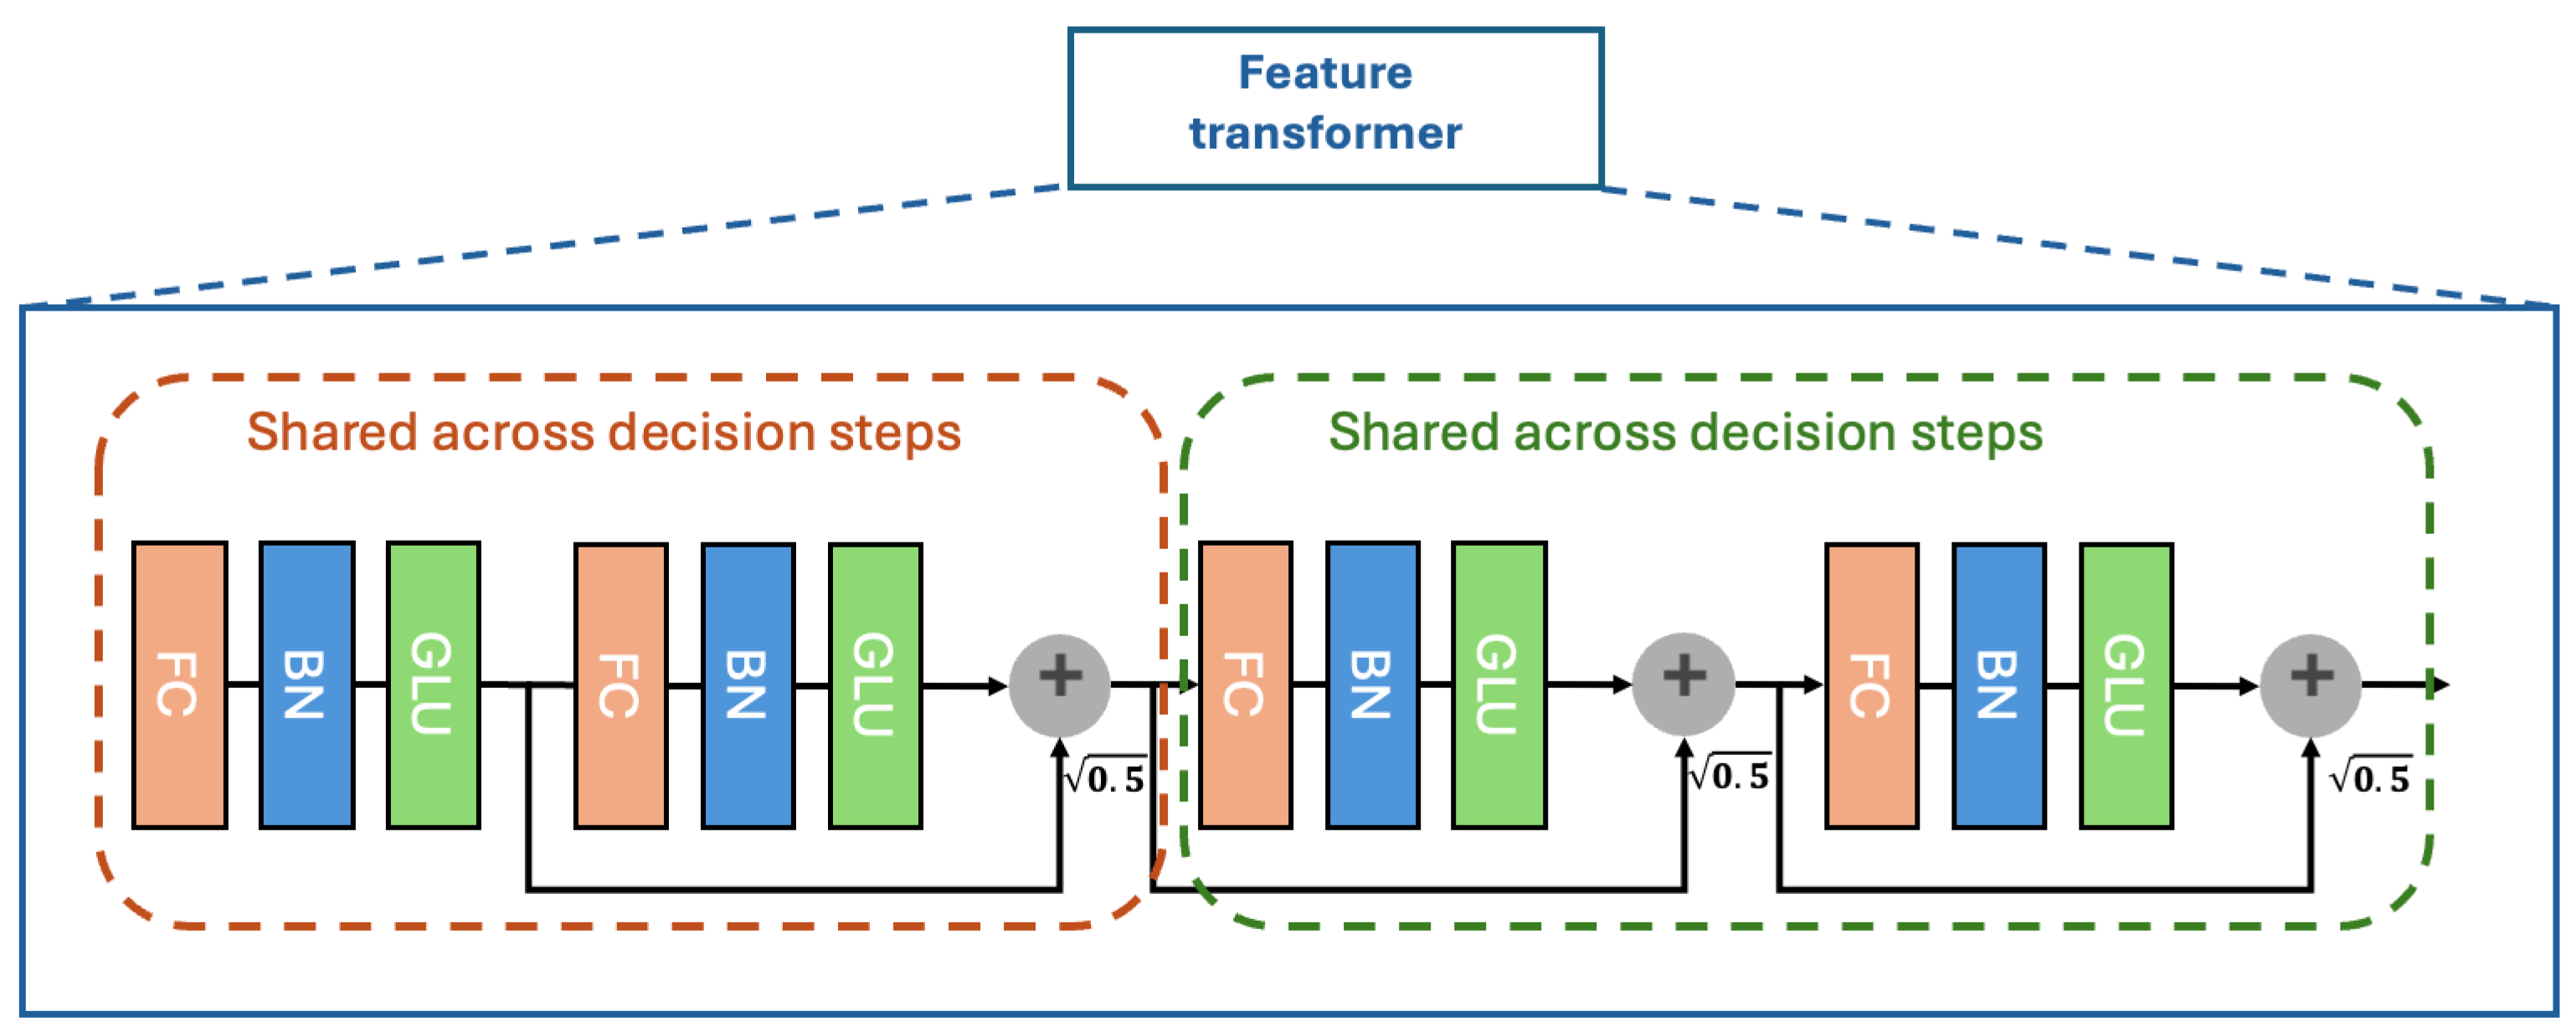
BN denotes the batch normalization layer. The Feature transformer layer is similar to the role of the previous FC layer, which related to feature calculation and is more complex. The structure is shown in
Figure 4. The Feature transformer layer consists of two parts. The parameters of the first half of the layer are shared; that is, they are trained together on all steps, while the second half is not shared and is trained separately on each step. This is carried out considering that for each step, the input is the same features (the mask layer only masks some features and does not change others), so we can use the same layers for the common part of feature computation first and then see to different parts using different layers later. In addition, we can see that the residual connection is used in the layer, multiplied by
to ensure the network’s stability.
The split layer cuts the vector output from the Feature transformer layer into two parts, one of which is used to compute the final output of the model, while the other is used to compute the mask layer for the next step. The attentive transformer layer computes the mask layer of the current step based on the result of the previous step, as
Figure 5 shows. The sparsemax layer can be understood as a sparse version of the softmax layer. The feature attribute output portrays the global importance of the feature. The model first sums the output vectors of a step of the model to obtain a scalar, reflecting this step’s importance for the final result. Then, it is multiplied by the mask matrix of this step to reflect the importance of each feature, and the global importance of the feature is obtained by adding up the results of all steps.
The federated averaging algorithm (FedAvg) enables decentralized training of the TabNet model across participants while preserving data privacy. Each participant trains a local TabNet model, computes updates, and sends them to a central server. The server aggregates these updates using a weighted average based on the dataset size, creating a global TabNet model, which is then shared back with participants. This cycle repeats until model convergence, combining TabNet’s strengths with privacy-preserving federated learning.
4. Results and Analysis
This section presents the findings from implementing the TabNet model on the Comprehensive Heart Disease Dataset and the UCI Heart Disease Data. We evaluate the model’s performance using various metrics and analyze the training and testing outcomes. Additionally, we compare the effectiveness of different training epochs to identify the setup that provides high accuracy and robustness in heart disease prediction.
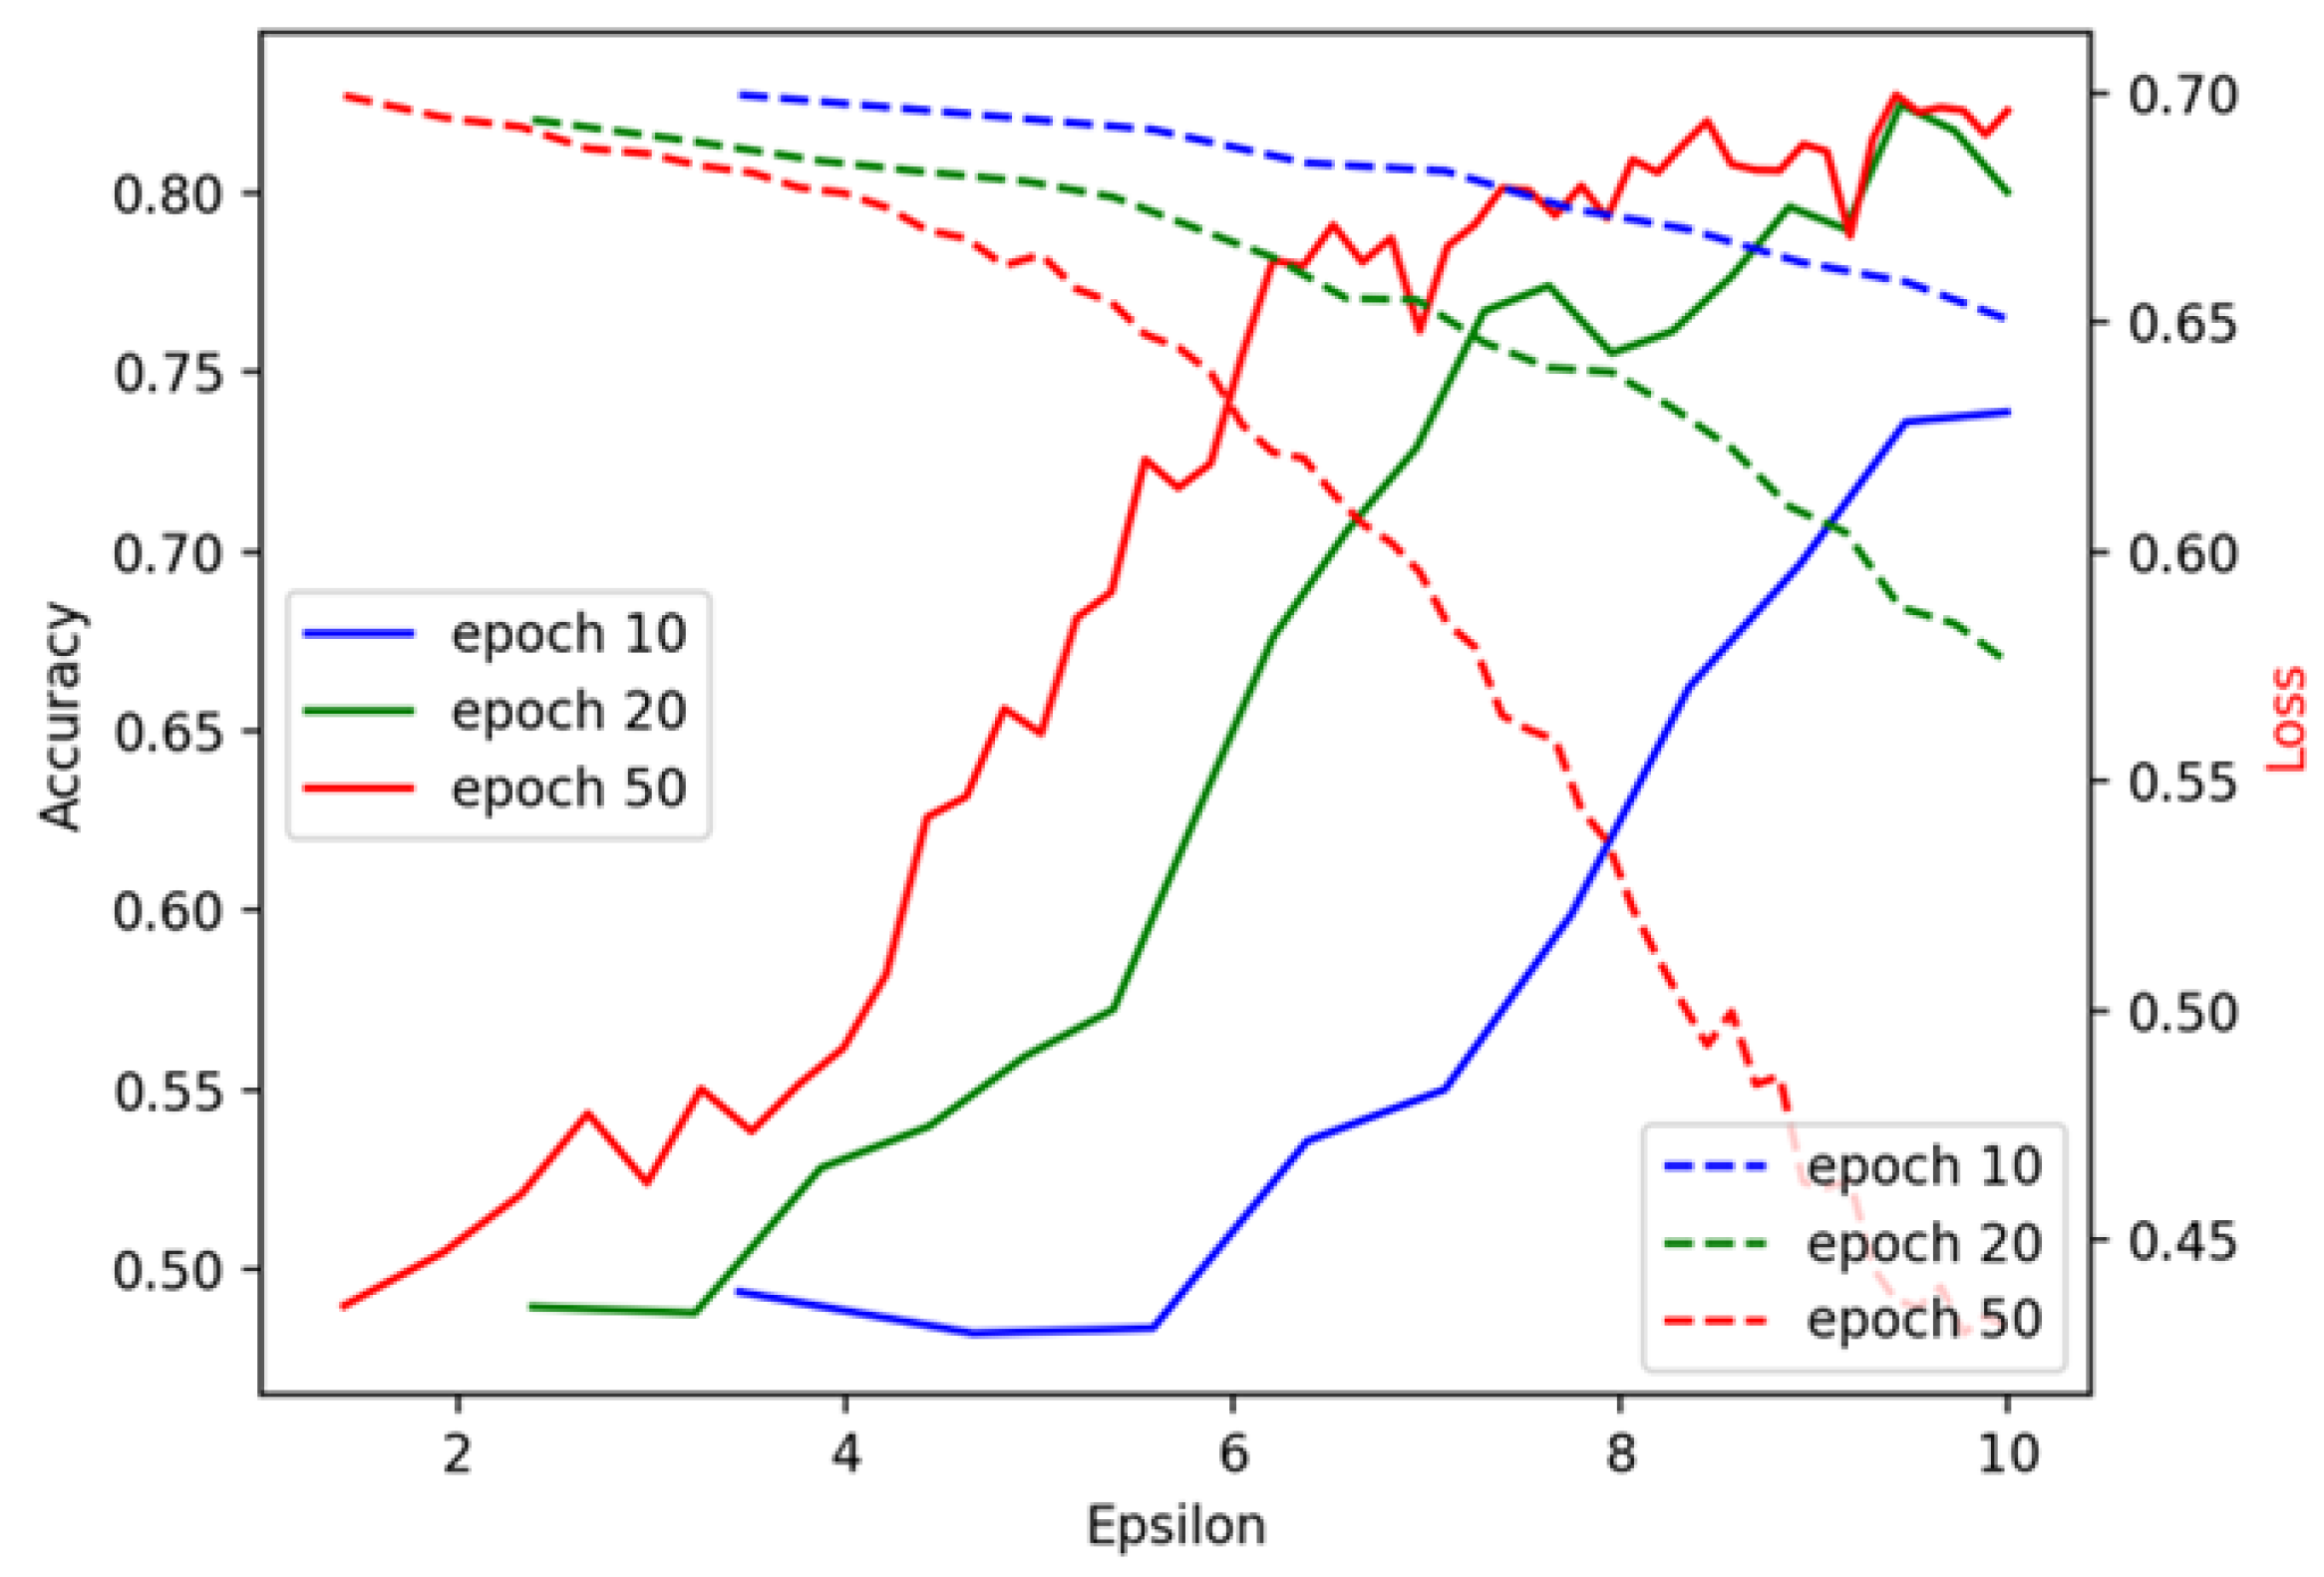
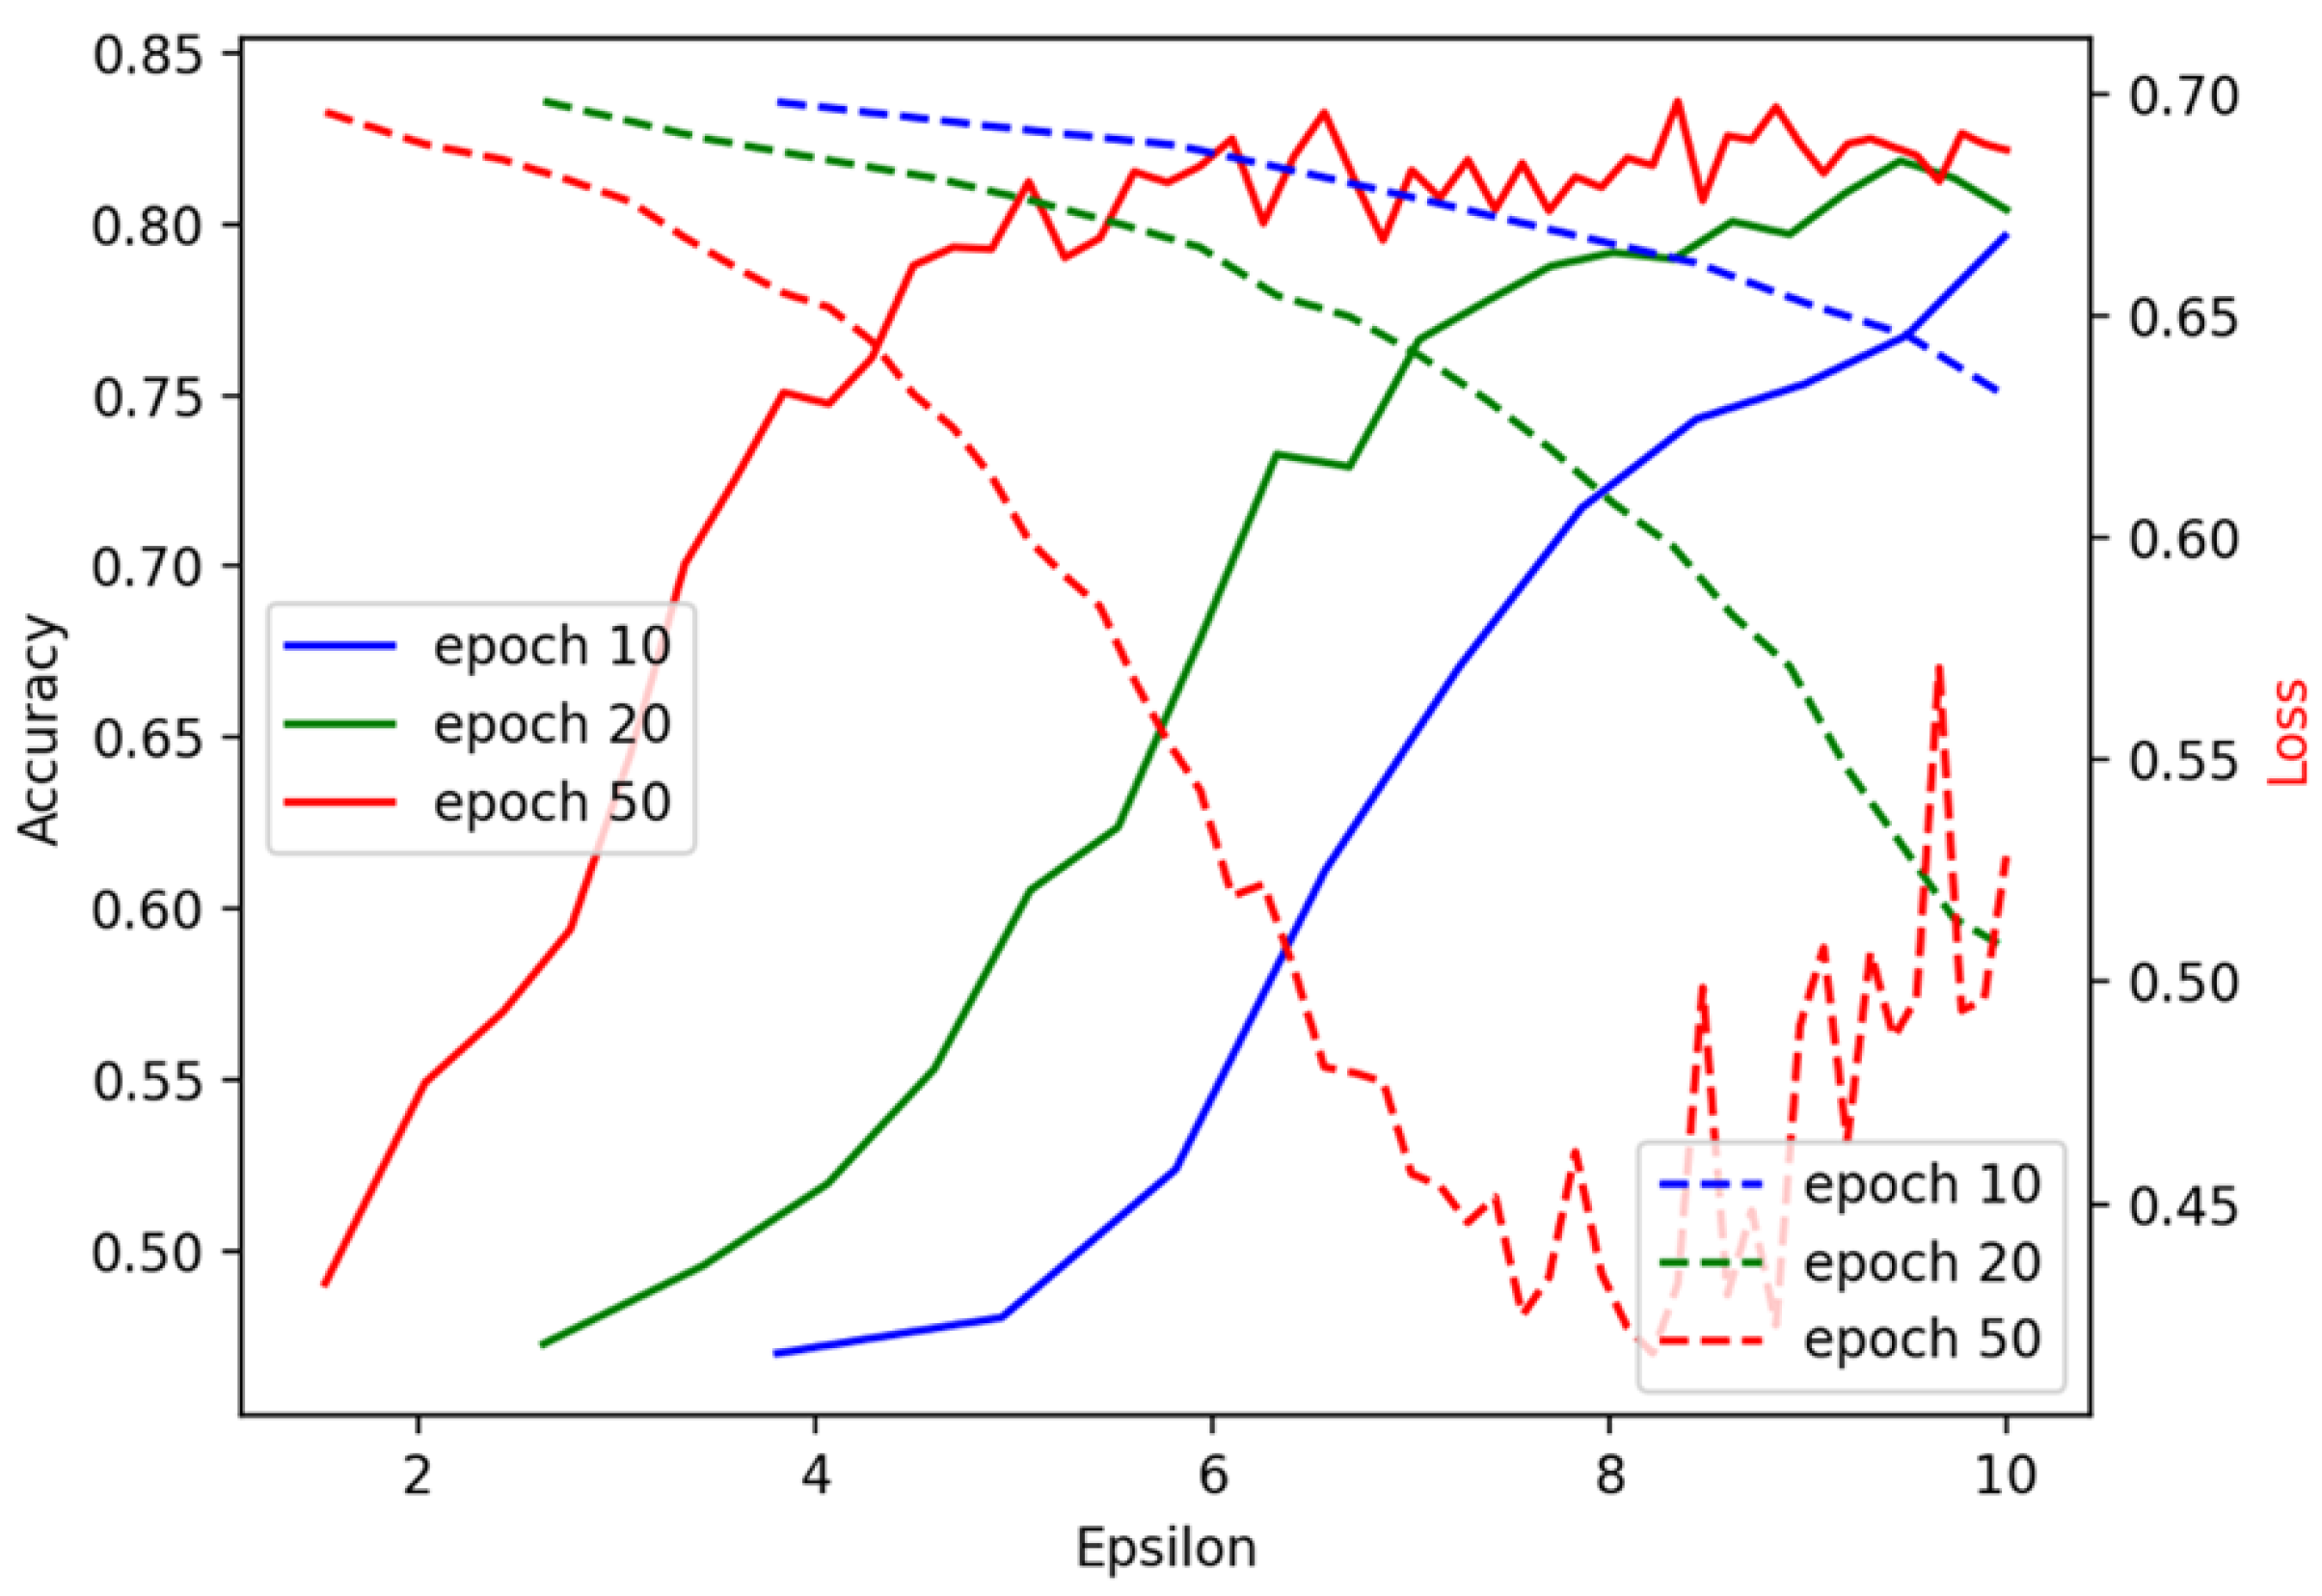
Figure 6 and
Figure 7 present the training results on the UCI and Cleveland datasets under the specified setup. Both figures suggest that 10 epochs are insufficient for the model to converge, as the accuracy and loss metrics improve significantly with additional iterations. Performance stabilizes between 20 and 50 epochs, with 20 epochs being sufficient for both datasets to achieve strong results. Since the UCI dataset is smaller than the Cleveland dataset, the latter achieves a higher training accuracy (0.825) than the former (0.534). In both cases, model accuracy rapidly increases during the first 10 epochs, stabilizing at around 20 epochs, indicating that further training yields diminishing returns. The consistent decrease in training loss across both datasets shows effective learning and model convergence. Additionally, the Cleveland dataset’s higher accuracy is likely due to its larger size and greater feature diversity, contributing to better model generalization. These findings demonstrate that the TabNet model performs well on the Cleveland dataset, achieving high accuracy and convergence, but shows limited effectiveness on the UCI dataset. While the model exhibits robust performance on the Cleveland dataset, the results from the UCI dataset suggest challenges in achieving similarly high accuracy, possibly due to the dataset’s smaller size and lower feature diversity. As such, the model balances accuracy and computational effort more effectively on the Cleveland dataset.
To prevent overfitting, early stopping can be utilized to determine the optimal number of epochs. By monitoring the validation loss during training, we can stop the process once the model begins to overfit, thereby preventing a decline in accuracy with increased epochs. This ensures that the model maintains generalization to new data. Future work could explore additional methods, such as cross-validation, to systematically evaluate performance and further refine the optimal number of training epochs.
Figure 8 illustrates the trends of accuracy and loss for both the Cleveland and aggregated datasets, where the model exhibits similar performance on both. After expanding the dataset, the model achieves high accuracy in 10 iterations. As epsilon (
) approaches 8, the training loss increases, suggesting that the model has reached a local minimum. Epsilon (
) serves as the privacy budget in the context of differential privacy, governing the trade-off between data privacy and model accuracy. A smaller epsilon value provides more robust privacy protection but can reduce model accuracy, whereas a larger epsilon enhances accuracy at the expense of privacy. In our federated learning framework, epsilon (
) controls the level of noise introduced into model updates during training. This noise prevents individual participants’ data from being reverse-engineered or extracted from the aggregated updates, ensuring privacy while facilitating effective collaborative learning across institutions. The figure demonstrates that, with the expanded dataset, the model reaches high accuracy after just 10 iterations. The increase in training loss, when epsilon reaches 8, indicates that the model has reached a local minimum, marking the point where further improvements in accuracy are balanced by increasing privacy trade-offs. Overall, this figure highlights the significance of using an aggregated dataset. Combining data from multiple sources improves the model’s generalization and robustness, which is essential for enhancing performance across different conditions.
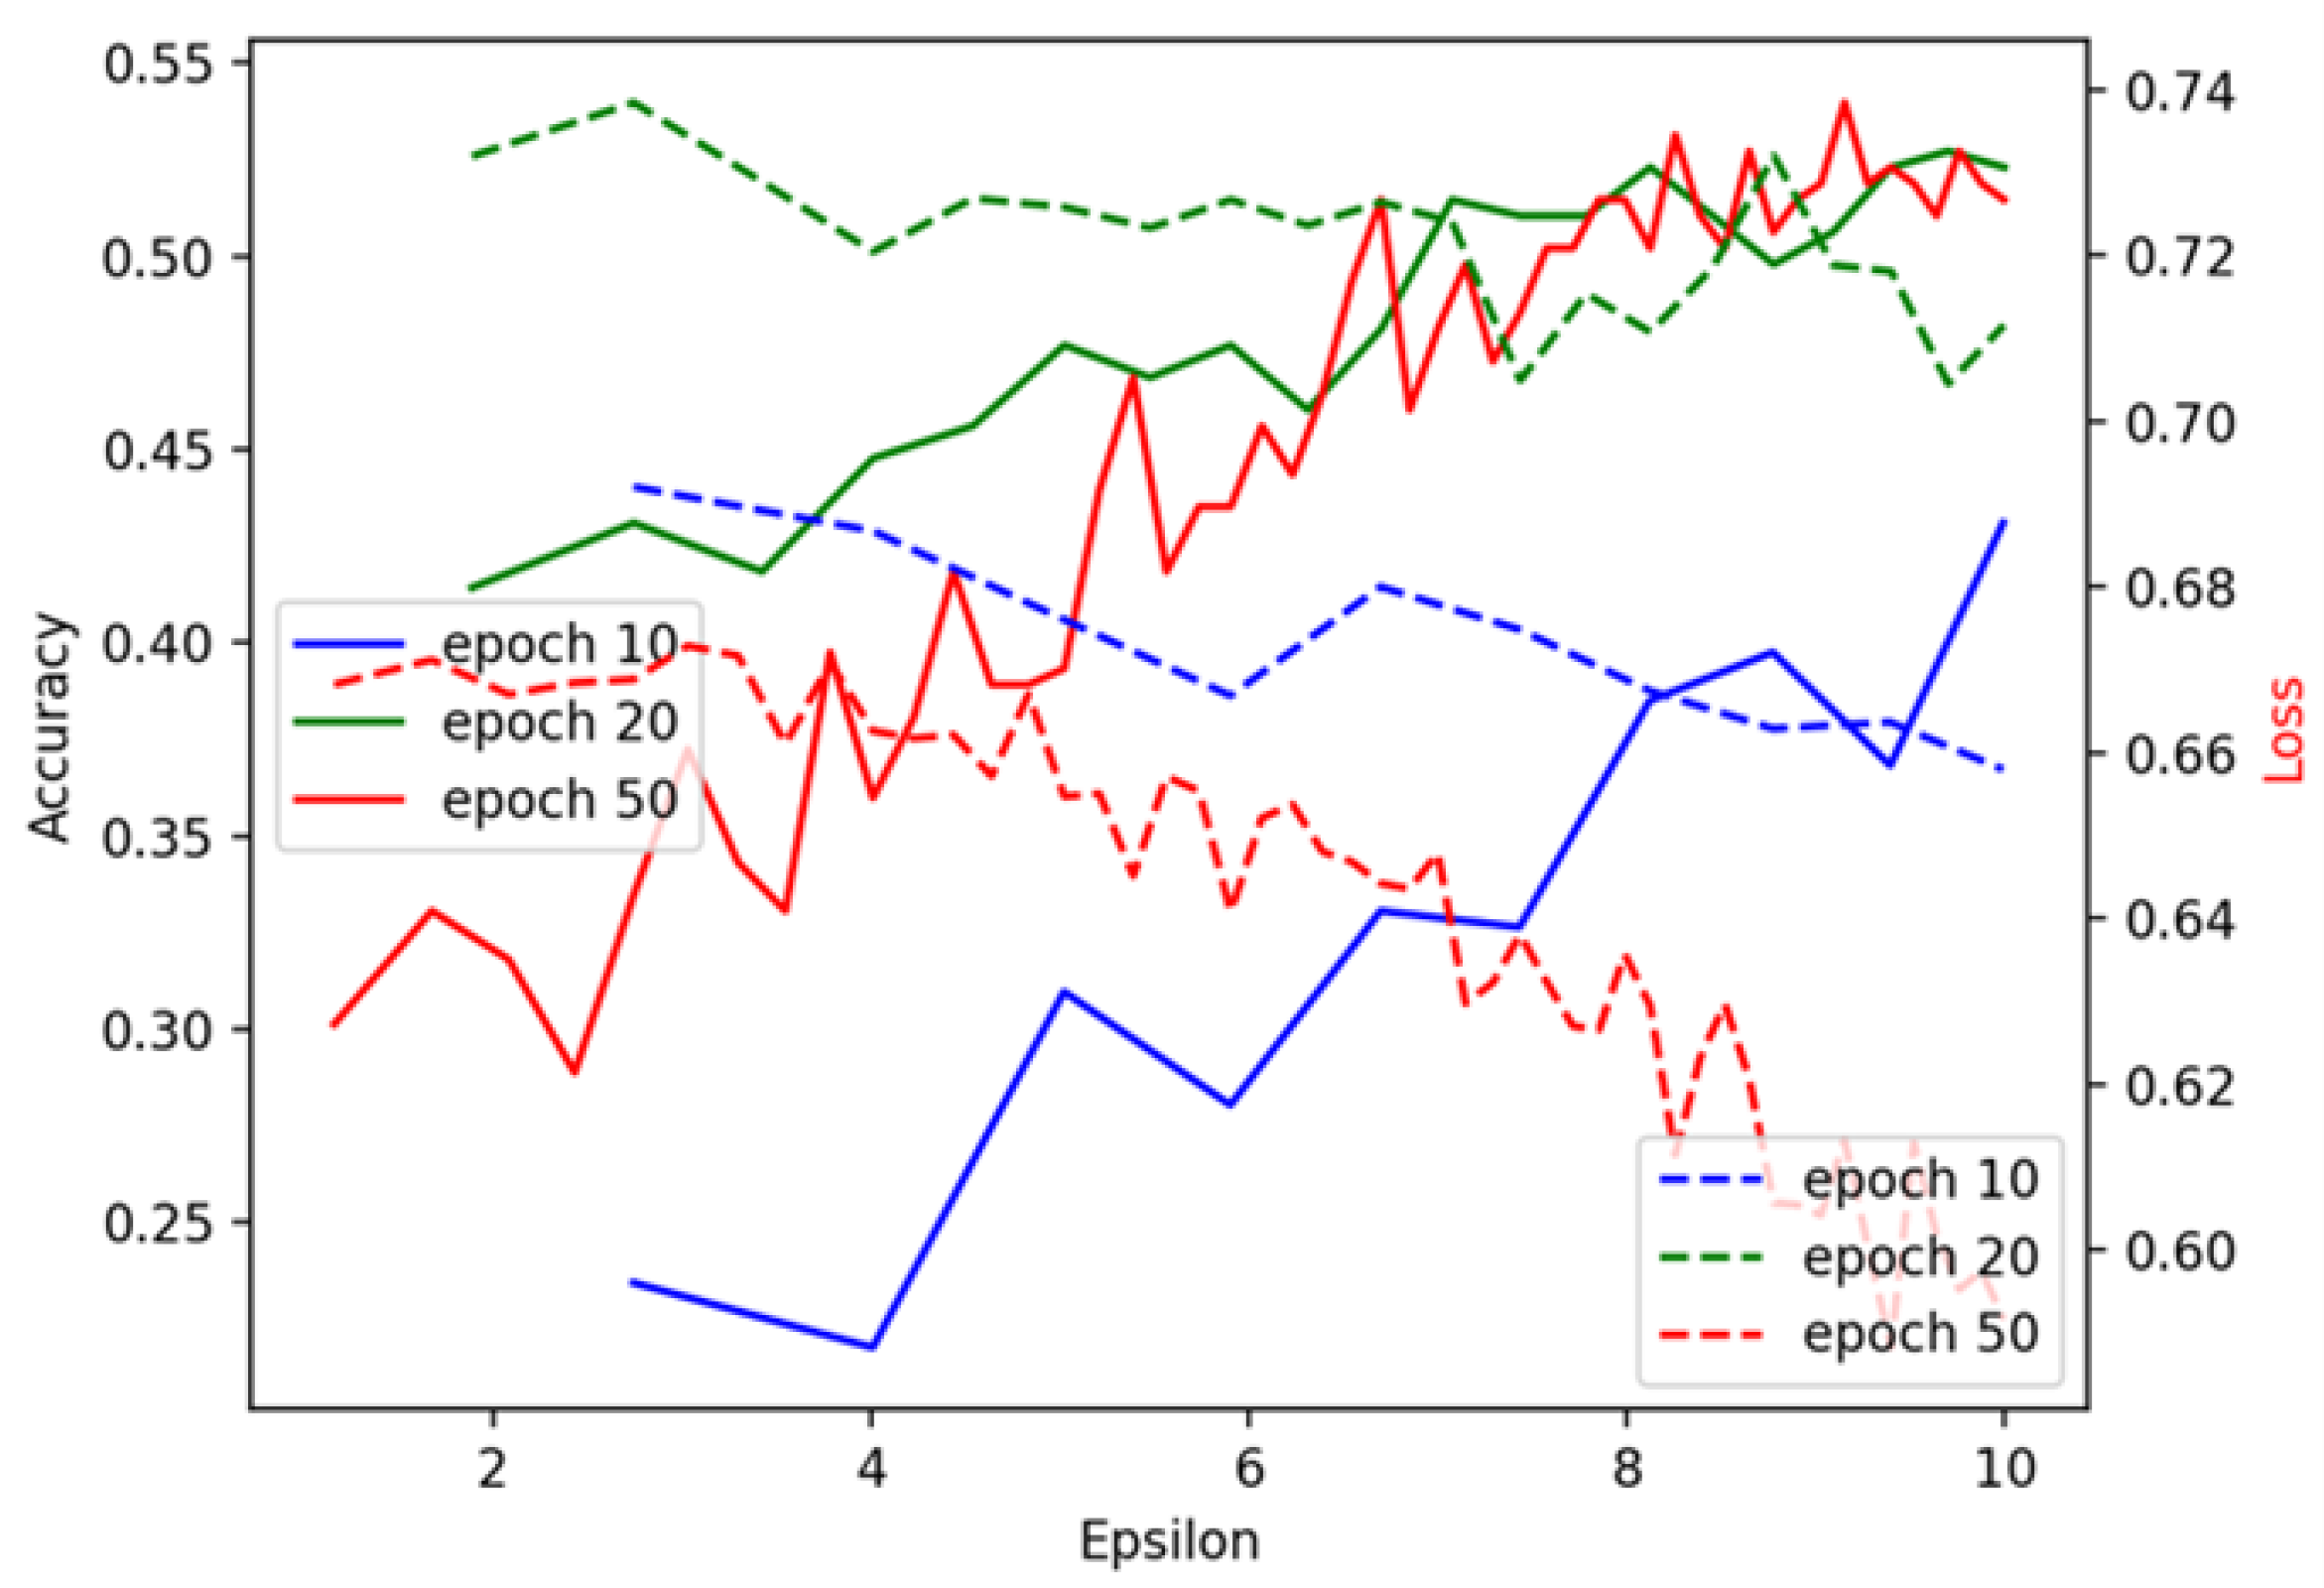
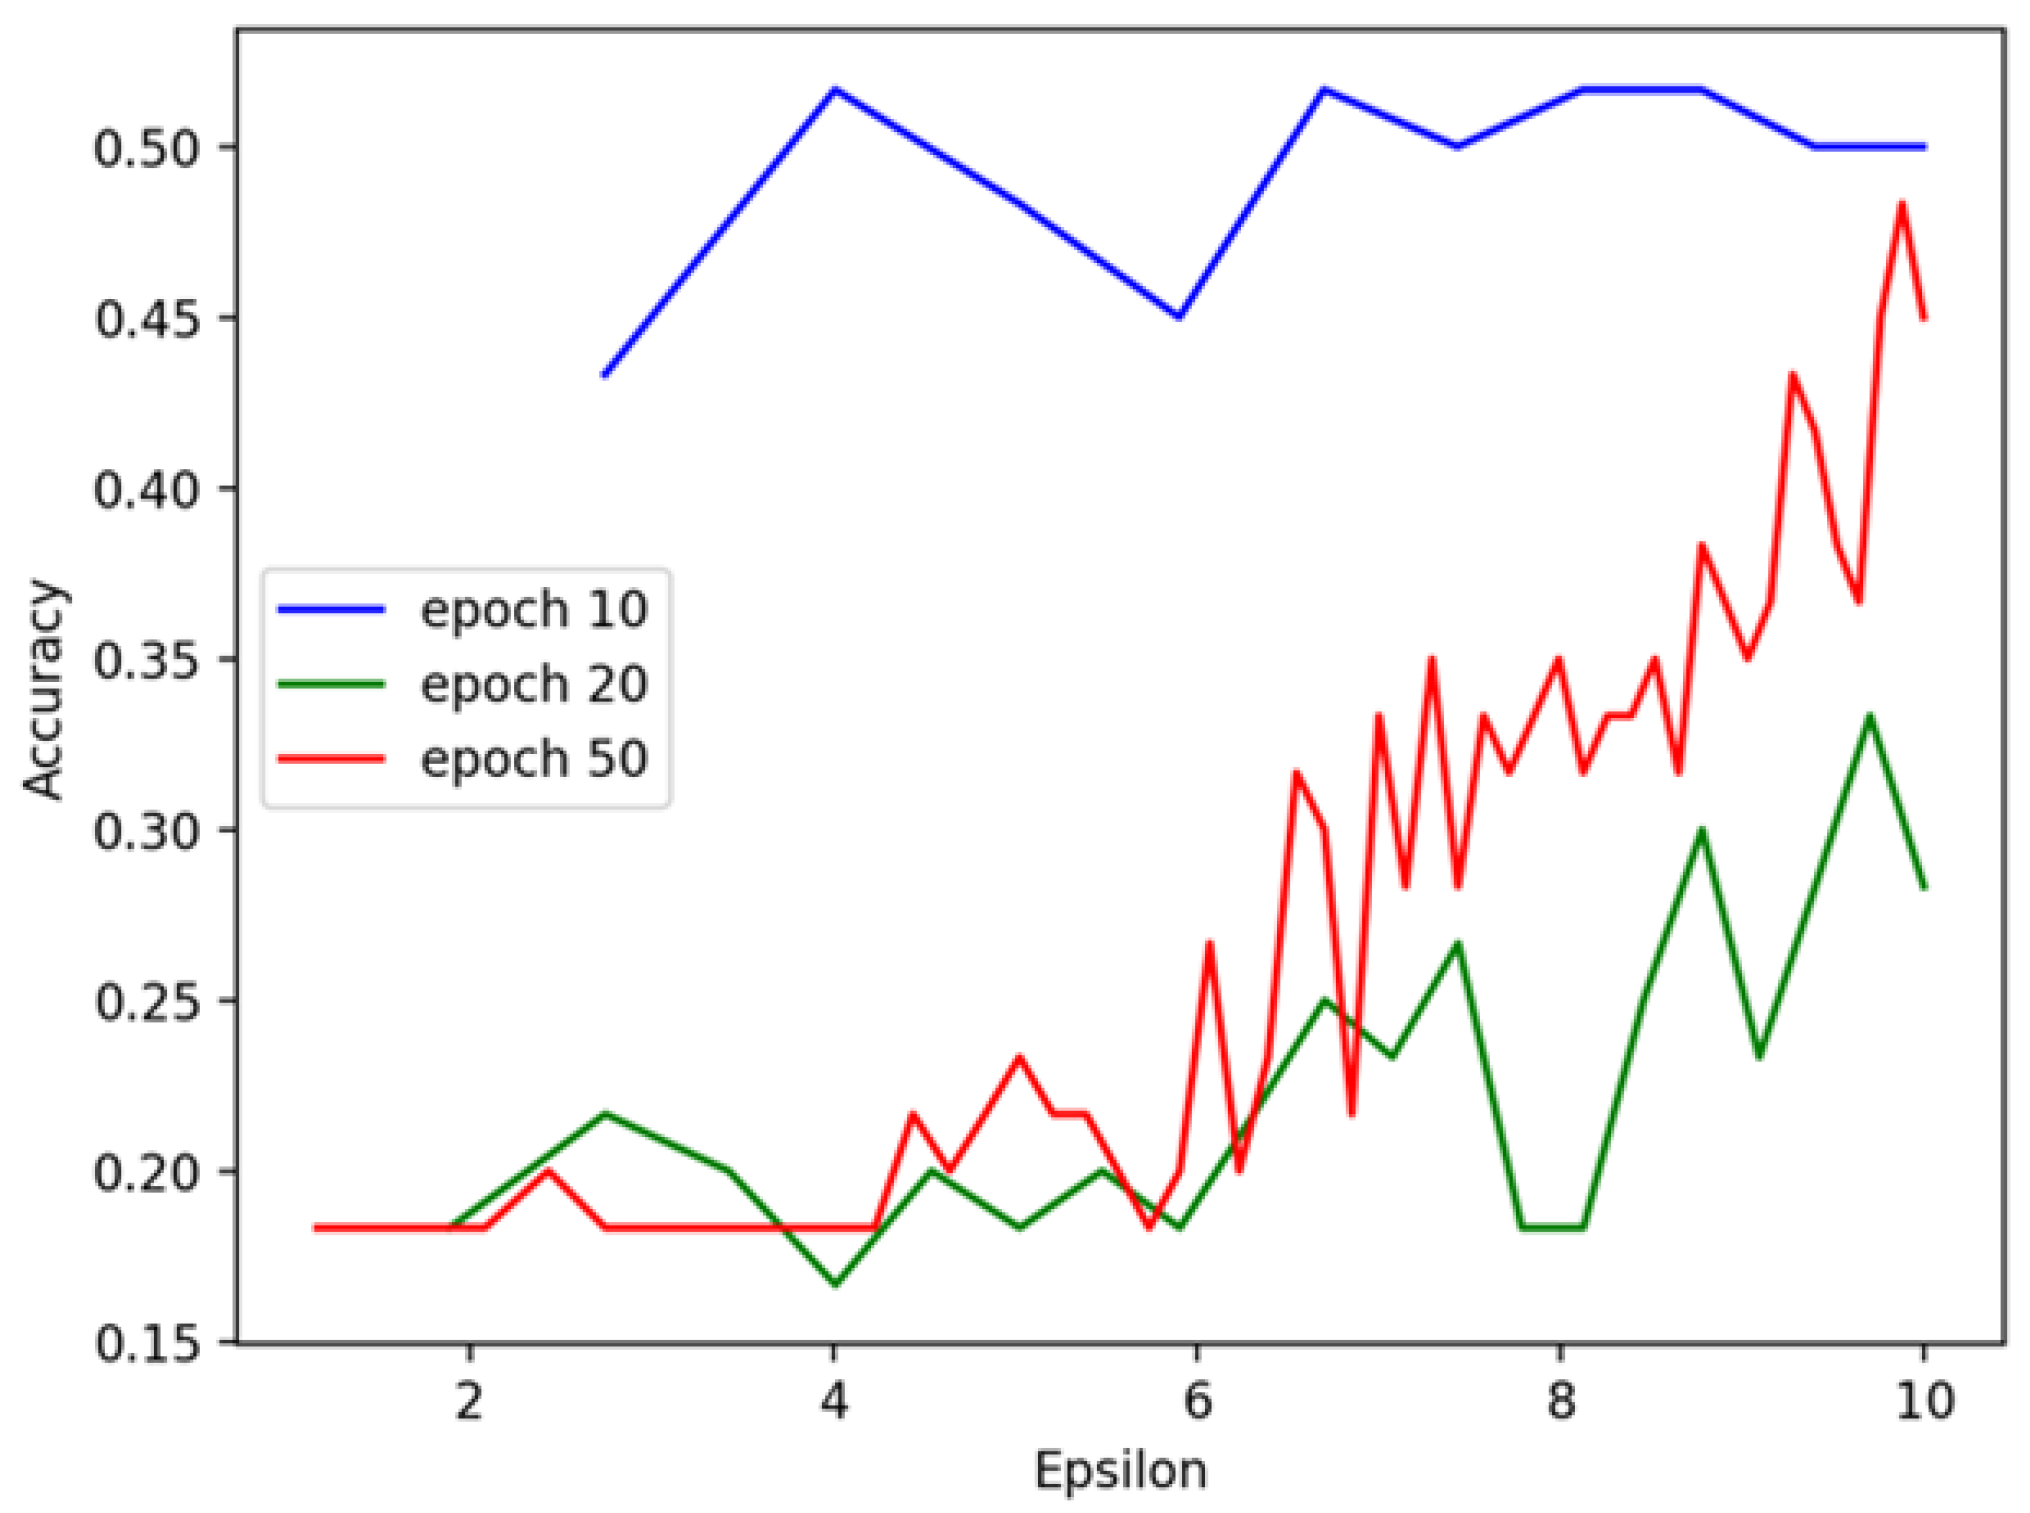
Figure 9 and
Figure 10 show testing results during the training process. From
Figure 10, we observe that the model trained with 50 epochs initially performs significantly better than those trained with 10 and 20 epochs. However, as epsilon (
) increases, the accuracy of all models begins to converge, and by the time epsilon reaches 10, their performance levels off. This indicates that the privacy budget (
) plays a critical role in controlling the performance gains and, when relaxed, models trained with fewer epochs can perform similarly to those trained with more epochs. This trend suggests that, under looser privacy constraints, additional training does not necessarily yield performance benefits. In contrast, the results using the UCI dataset, shown in
Figure 9, exhibit an unexpected pattern. The model trained with 10 iterations consistently outperforms those trained with 20 or 50 iterations, reaching the highest accuracy when epsilon (
) is less than 4. This abnormal result could be attributed to overfitting when more iterations are used, especially under stricter privacy constraints. The Cleveland dataset seems to benefit from early stopping, with fewer iterations preventing the model from overfitting, which may explain the better generalization performance with only 10 iterations. The differences observed in
Figure 9 and
Figure 10 provide valuable insights into how training duration and the privacy budget impact model performance. These figures underscore the importance of balancing privacy constraints with model accuracy and tailoring training configurations to the specific characteristics of the dataset.
The poorer performance of the TabNet model on the UCI Heart Disease dataset, with an R2 score of 0.4 (
Figure 6 and
Figure 9), can be attributed to several factors. The UCI dataset is smaller and less diverse than the Cleveland dataset, limiting the model’s ability to capture complex patterns. This, combined with fewer features, reduces its predictive power. The smaller sample size also makes the model prone to overfitting, especially with more epochs, resulting in high training accuracy but poor generalization on test data. Additionally, class imbalance and the model’s sensitivity to hyperparameter tuning further contribute to weaker performance. These factors reflect the dataset’s limitations rather than a fundamental flaw in the TabNet model. Future work could address these issues through data augmentation, class balancing, and hyperparameter optimization.
Figure 11 shows the model’s performance on the aggregated test data. The trend is similar to the Cleveland dataset, with the key difference being that the test accuracy increases gradually in the later stages of training. As epsilon (
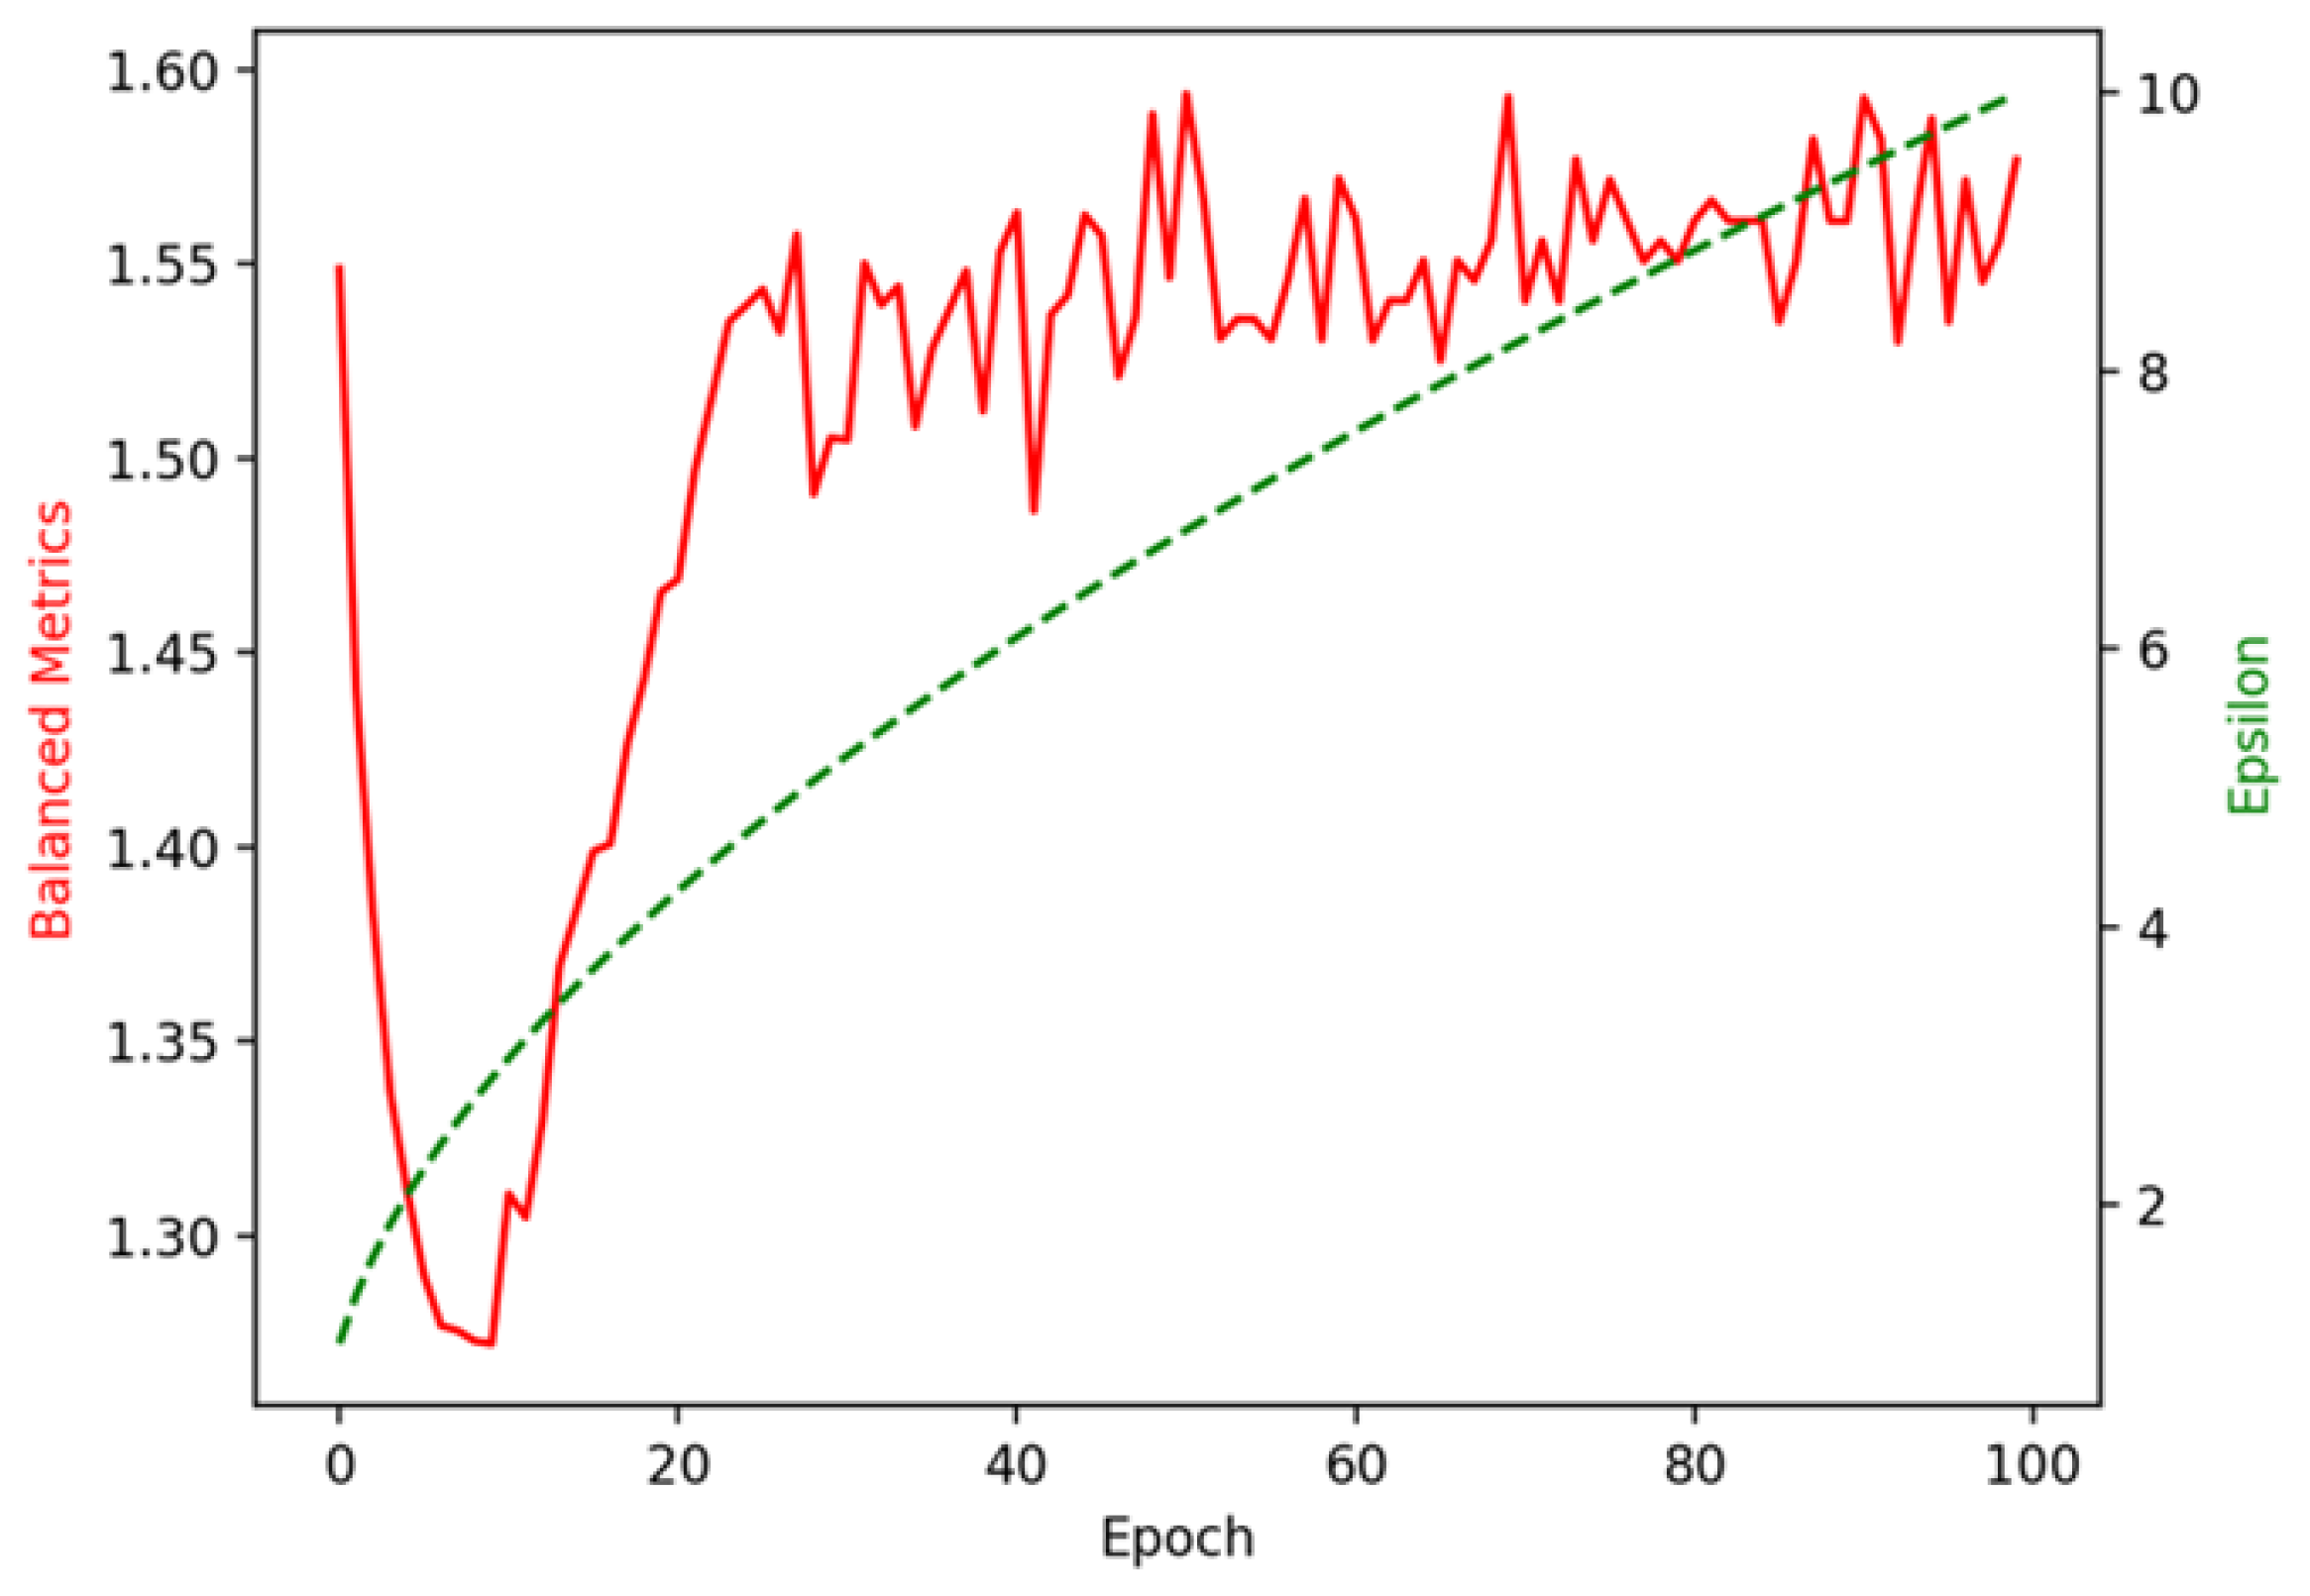
) increases, the model’s accuracy rises more smoothly on the aggregated data compared to the Cleveland data. This suggests a more consistent generalization performance when using aggregated datasets, likely due to the diversity of data sources. Given that accuracy ranges from 0 to 1 and epsilon ranges from 1 to 10, we designed a more balanced metric that considers the ratios of accuracy and epsilon and their respective magnitudes. Our approach utilizes a combination of exponential functions to evaluate performance under different privacy constraints. This figure supports the idea that combining data from multiple sources in an aggregated form enhances model stability and ensures better accuracy across varying epsilon values. The formula for the metric can be defined as follows:
will be larger as approaches 1 and approaches 1. When is close to 0, the contribution from the first term will be minimal, and when is close to 1, the contribution from the second term will be minimal. We chose and to give more weight to the contribution from , which presents more privacy than accuracy.
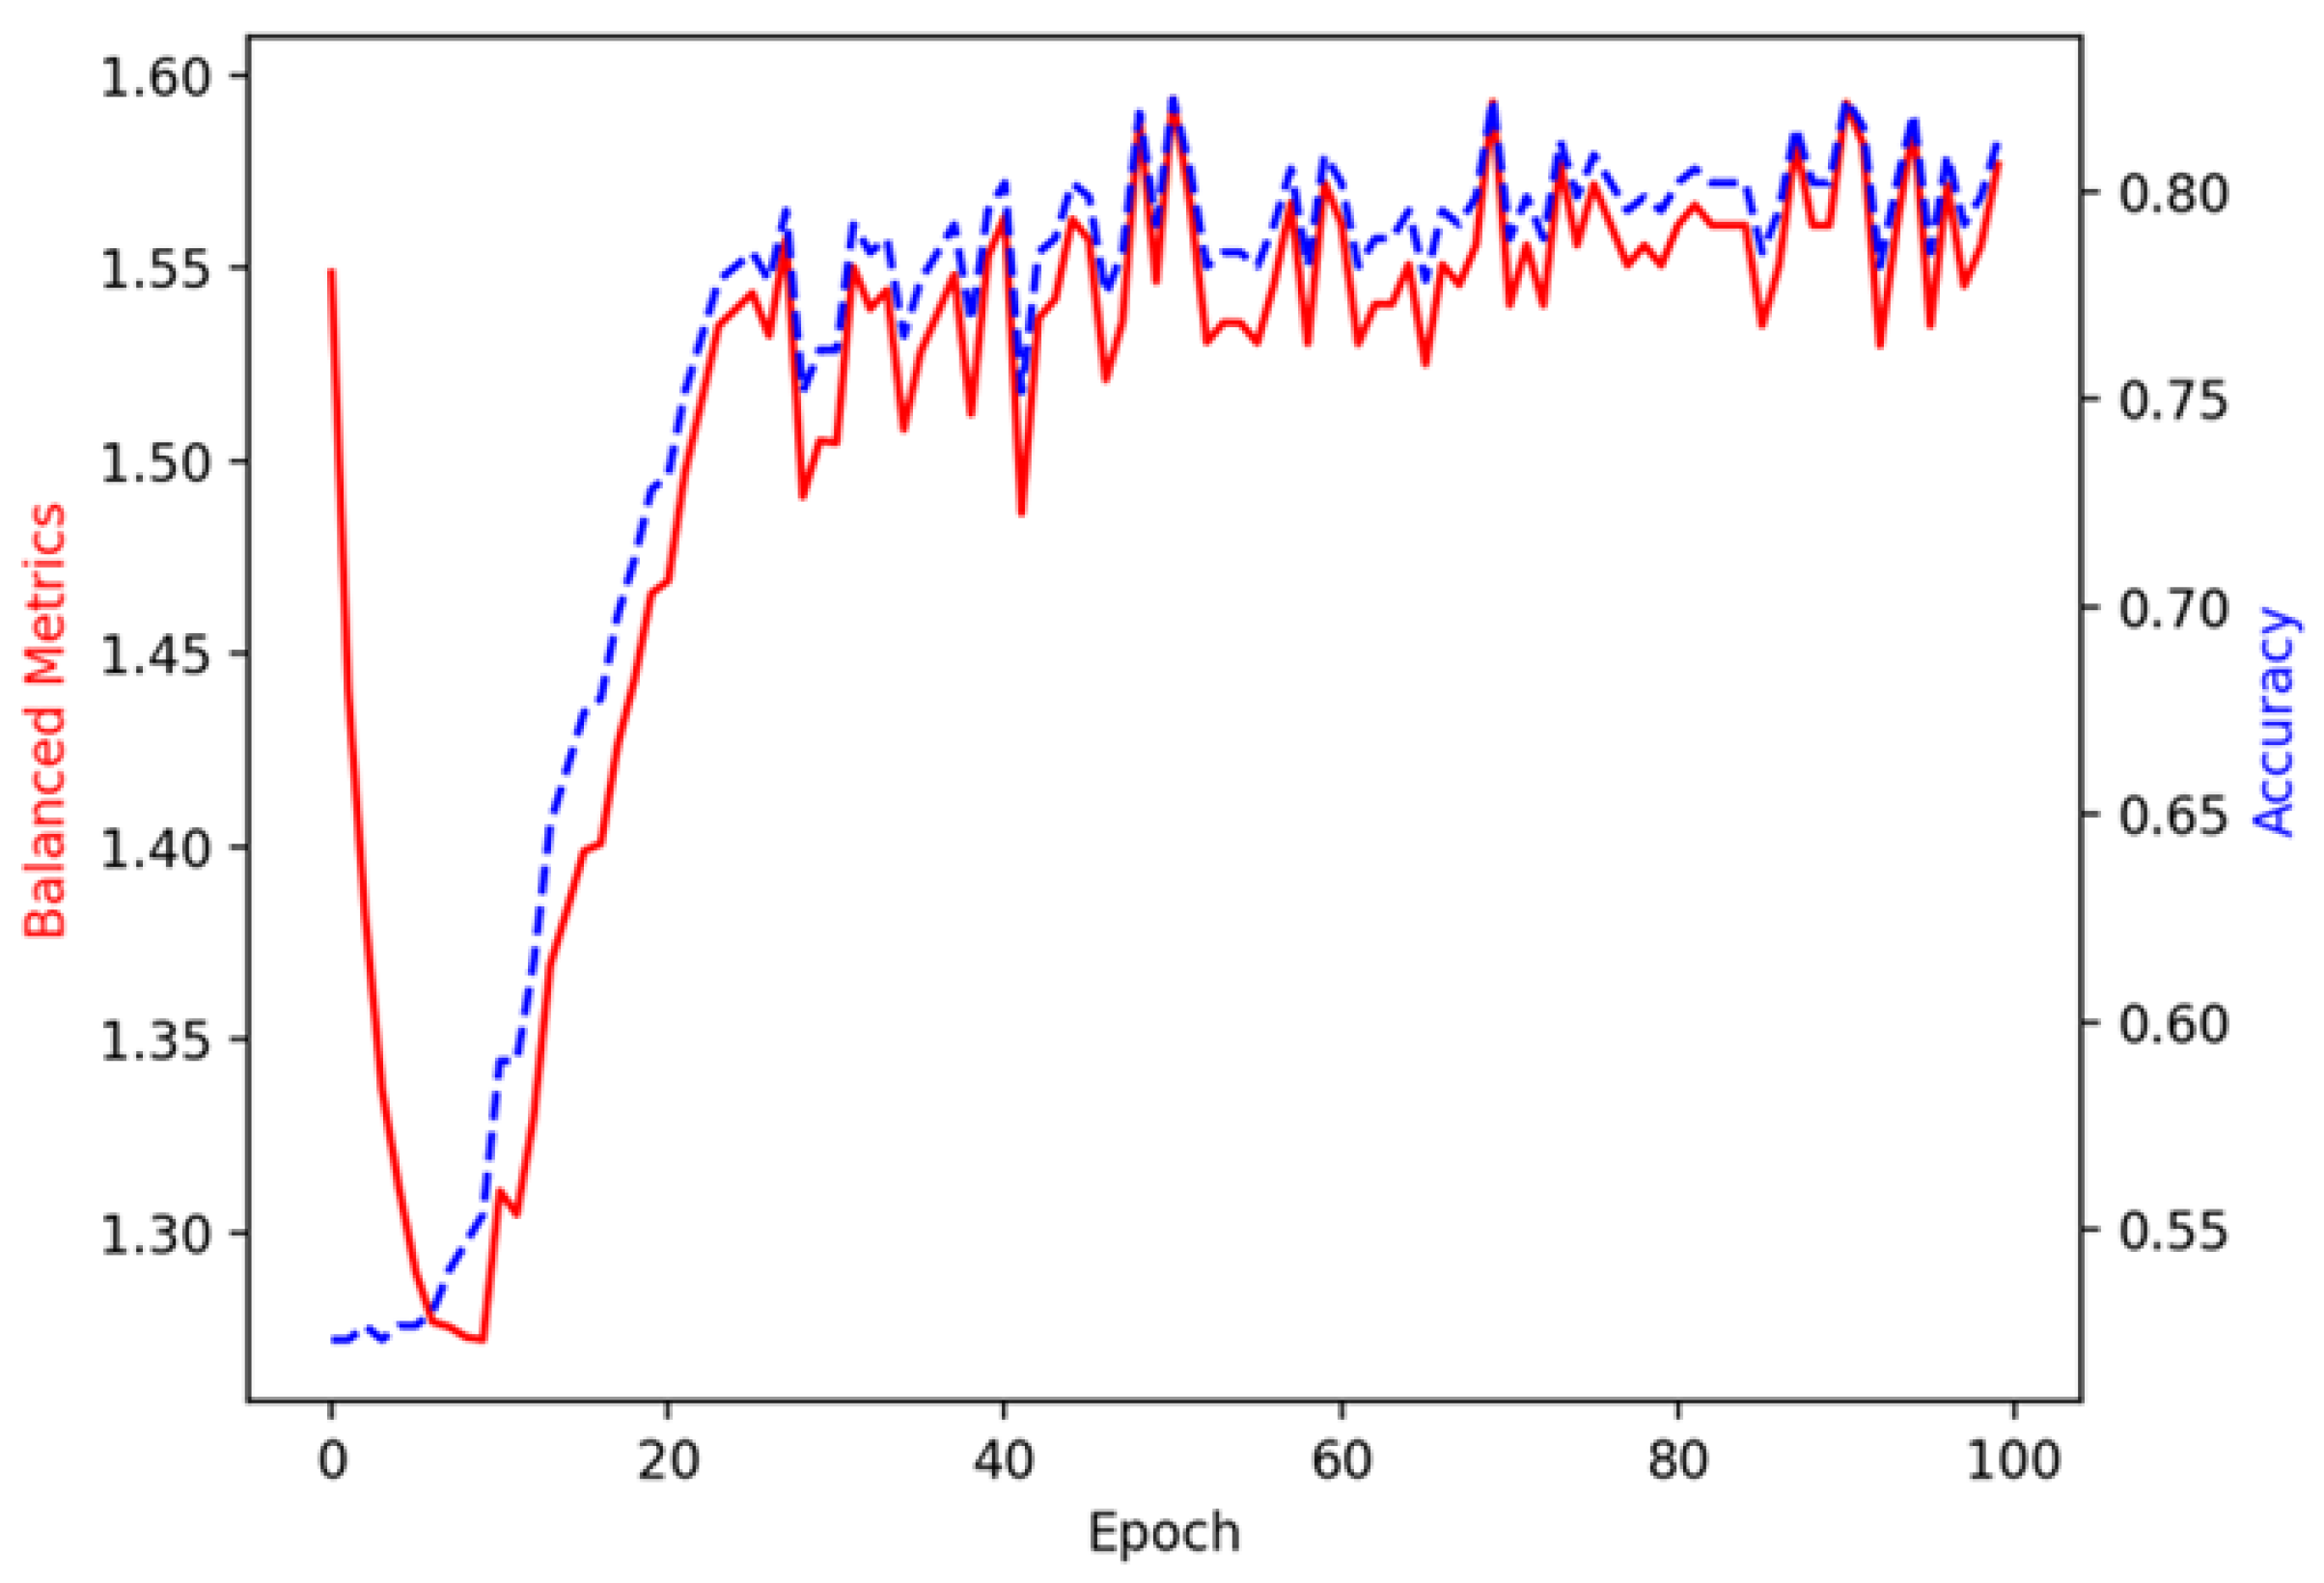
Figure 12 and
Figure 13 show the trend of
with epoch compared with the trend of accuracy or epsilon in 100 iterations. The value of
is high when
and
tend to zero. Then, as
and
rise in the training process,
first plummets and then grows significantly. After that, the trend of
with epoch coincides with the accuracy trend. This indicates that, initially, privacy is strongly preserved when accuracy and epsilon are both low, leading to a highly balanced metrics score. However, as the model improves its accuracy and epsilon increases (which reduces privacy), the balanced metrics decrease temporarily. This drop is likely due to the trade-off between privacy and accuracy, as the model focuses on improving performance. Interestingly, after this drop, the
grows again as accuracy improves, showing that the model achieves a better balance between privacy and accuracy after the initial trade-off. After a certain point in training, the trend of
coincides with the accuracy trend, suggesting that the model has stabilized its performance. The highest
(1.594) is obtained at 50 epochs, with an accuracy of 0.822 and an
of 6.855. This result suggests that at 50 epochs, the model strikes a favourable balance between privacy protection (controlled by
) and performance (measured by accuracy). The model demonstrates effective performance at this stage while maintaining reasonable privacy protection.
5. Conclusions
Integrating technology with privacy considerations is essential in the evolving landscape of data-driven advancements. This paper explores heart disease prediction through federated learning, emphasizing the balance between innovation and ethical responsibility. By developing a comprehensive system incorporating data expansion techniques, the TabNet model, differential privacy mechanisms, and blockchain technology, we have demonstrated the potential to create effective predictive models while maintaining data privacy collaboratively. This work underscores the transformative power of federated learning, allowing institutions to tackle complex challenges collectively while safeguarding sensitive information. This paper’s key contribution lies in integrating privacy-preserving techniques within predictive analytics. We successfully maintained high model performance without sacrificing privacy by applying the TabNet model and leveraging differential privacy. Blockchain technology enhanced transparency and accountability in the federated learning process, ensuring data integrity across institutions. The proposed approach was validated on real-world datasets (UCI Heart Disease and Cleveland datasets), where the model achieved high accuracy and balanced metrics under various privacy settings. Specifically, the best results were observed with 50 epochs and a privacy budget () of 6.855. This demonstrates that the method effectively balances privacy protection and predictive power.
This method can be applied in healthcare institutions, such as hospitals and medical research centers, where collaborative data modelling is critical and privacy must be preserved. Several future research directions arise from this study. First, further exploration of advanced privacy-preserving techniques, such as combining differential privacy with homomorphic encryption, could enhance data security without compromising performance. Second, a comparative analysis between federated learning and non-federated approaches could provide insights into trade-offs between security, performance, and resource efficiency. Additionally, while the TabNet model has demonstrated promise, further investigation into its limitations is needed. Future work could focus on improving interpretability in real-world healthcare settings by incorporating explainable AI techniques like Shapley values or LIME. Moreover, exploring the scalability of TabNet in large-scale applications and comparing it with models like XGBoost or LightGBM could lead to more optimized solutions for handling larger datasets. A hybrid approach, combining TabNet’s strengths with other models, could also enhance performance in large-scale deployments.

