1. Introduction
With the ever-evolving global attack surface, recent years have seen an explosion in the volume of cyberattacks. Reports show that 2020 saw a 358% increase in malware attacks compared to the previous year [
1]. From 2020, cyberattacks continued to increase globally well into 2021 and, in the first half of 2022 alone, approximately 236.1 million ransomware attacks occurred across the globe.
The World Economic Forum (WEF) estimates that if all cybercrime was amalgamated under the same flag, this country would rank as the world’s third-largest economy. Cybercrime caused damages totalling USD eight trillion in 2022 alone [
2]. There is no evidence that this acceleration in the growth of cyber-criminality will slow any time soon; in fact, the opposite is proving true.
As mentioned, approximately 236 million ransomware attacks occurred in the first half of 2022 alone. Ransomware [
3], a type of malware which encrypts a victim’s hard-drive and holds it for ‘ransom’ unless demands are met, is a seemingly new menace plaguing the headlines. However, ransomware has been a threat for quite a long time. In May 2017, the WannaCry [
4] ransomware first made international headlines. WannaCry was unique for its colossal impact. The WannaCry attack infected over 300,000 computers spanning 150 countries, with total damages estimated to be billions of USD [
5]. The most destructive threat that WannaCry ushered in was not the prospect of significant ransom demands but rather a new cyber-terrorism trend: to hold hospitals, schools and universities to ransom, with little care if the victims pay the ransom or not. The primary goal of this attack is to cause massive disruption to critical-infrastructure.
In fact, for the year 2023, the Cybersecurity and Infrastructure Security Agency (CISA) revealed that their priority sectors are “water, hospitals and K-12” (K-12 being kindergarten to 12th grade in the United States). These sectors are resource-poor with massive attack surfaces and are heavily targeted by ransomware [
6]. In 2022 Emsisoft, a cybersecurity vendor, recorded at least 25 ransomware attacks on “hospitals and multi-hospital health systems”, affecting approximately 290 hospitals across the US [
7]. In 2021, almost 1 million students countrywide were negatively affected by 67 ransomware attacks against K-12 schools. The estimated cost due to the downtime was USD 3.5 billion [
8].
However, this epidemic affecting the health and education sectors is not confined to the United States. Ireland has become a victim of large-scale attacks on these sectors recently. In May 2021, the Irish Health Service Executive (HSE) fell victim to a massive ransomware attack [
9]. This attack was the most significant cyber attack on an Irish state agency in history and caused mass disruption to the health service.
The education sector in Ireland has, like the US, seen many attacks in recent years. Third-level institutions, such as the National University of Ireland (NUI) Galway [
10], National College of Ireland (NCI) Dublin [
11], and Technological University Dublin (TU Dublin) [
12], have fallen victim to ransomware attacks which have greatly affected the availability of systems, leading to the temporary closure of education facilities. The most recent of these attacks was a ransomware attack, which led to the closure of Munster Technological University (MTU) for approximately one week [
13].
Ransomware is not the only concern in the security field currently. With the massive explosion in the installation of Internet-of-Things (IoT) devices worldwide, the global attack surface continues to grow significantly. This growth in popularity is thanks to the innate ability of this technology to enable communication between (smart) edge devices and the Internet, thus improving the quality of human life [
14] or optimising industrial processes. A forecast made by the International Data Corporation (IDC) projects that there will be 55.7 billion IoT devices by 2025 [
15]. With such a large deployment, attacks on the IoT have the potential to cause mass disruption, exposing every sector equally to ransomware. Growing concerns regarding IoT security may stop many from adopting this technology. These concerns mainly affect financial technology, healthcare, industry, transportation and education, which have already begun IoT adoption [
16].
In September 2017, one of the the largest ever recorded Distributed Denial of Service (DDOS) attacks was performed using the Mirai botnet [
17]. This malware is estimated to have infected over 380,000 IoT devices, such as home routers, to create a massive botnet. This botnet was used to target victims with unprecedented levels of traffic. Brian Krebs’ website, krebsonsecurity.com, was hit with traffic of 620 gigabits per second (Gbps), one of the largest on record. Later that month, the botnet was used to target the French web host OVH in an attack which shattered all previous records with an estimated 1.1–1.5 terabits per second (Tbps) of traffic [
17]. If only 380,000 devices can cause such disruption, with a max pool of possibly 55.7 billion by 2025, attacks like this will most likely become more prevalent in the future.
Another notable attack involving IoT devices was the attack on the Ukrainian power grid in 2015. While much of this attack targeted traditional computing, one central aspect of this coordinated attack was targeting breakers, Serial-to-Ethernet devices, and critical servers’ Uninterruptible Power Supplies (UPSs). These can all be considered attacks on IoT. This cyber attack on Ukraine was considered one of the first in history with a quantifiable loss of human life. Over 225,000 customers were left without power, including hospitals providing critical care [
18].
Aside from these massive national-infrastructure-level attacks, IoT devices have been the victim of other impactful attacks. In 2017, the US Food and Drug Administration (FDA) announced they had uncovered a massive vulnerability in pacemakers manufactured by St. Jude Medical. These pacemakers could communicate with external services after installation in the patient. Once the attackers could access this communications channel, they would have the ability to deplete the battery, change the functionality and reportedly have the potential to subject the patient to fatal shocks [
19].
In 2015, a team from IBM demonstrated a crucial vulnerability in the onboard software of the Jeep SUV. Once exploited, this vulnerability would allow attackers to gain control of the vehicle remotely, affecting the speed of the vehicle and even the steering, which could lead to the vehicle veering off the road [
19].
1.1. Contribution
While many parts make up the attack surface in the world today, the remainder of this study will focus on IoT devices. It is important to remember that while this study focuses on IoT devices, the attacks performed and the knowledge gained apply to all cybersecurity fields, from low-power IoT devices to High-powered Computing (HPC).
This work seeks to promote using non-intrusive side-channel power data in cybersecurity. Power data, a key fundamental piece of primary data which every device has, regardless of power level, can reflect all operations running on a device. We believe that by looking at cyberattacks from as many angles as possible, we can defend against them more effectively. We hope the implication of this study will be the broad adoption of side-channel data in security. By studying this type of power-data series, a much greater understanding of cyberattacks and how to defend against them will be gained. One fundamental drawback of many works is that they must analyse the side-channel power data they use. As such, the reader cannot learn anything about the attacks used in these works. To promote the further use of power data in security, in this study we:
Create two realistic IoT testbeds, each with a different core IoT device.
Study the normal side-channel behaviour of these testbeds before they are attacked, then subject these testbeds to common attacks in cybersecurity from the fields of reconnaissance, denial of service and brute force, analysing the side-channel signatures obtained.
Subject the testbeds to capture-the-flag scenarios combining most of the attacks studied into one continuous scenario and discuss automated detection methodologies based on the findings of the analysis of the side-channel power data.
1.2. Organisation
The remainder of this study is organised as follows.
Section 2 reviews current security methods for IoT devices and the use of power data in security.
Section 3 discusses the testbed setup and data-collection methodology for the replicability of this work.
Section 4 studies common attacks, applies them to the testbed and studies the resulting power behaviour.
Section 5 combines the previous section’s attacks into one attack scenario where the attacker attempts to obtain a secret file. In
Section 6, we discuss the intuitions gained from studying this data and what this means for security in the future. Finally, future work and conclusions of this study can be found in
Section 7.
2. Related Works
With the massive explosion in the deployment of IoT devices globally, the security of these devices has become a critical concern. IoT devices are resource-constrained by nature. This means conventional security practices tend to be impossible, or impractical, to implement on these devices.
The majority of the work focusing on IoT devices in security only considers the network traffic to and from the device. By inspecting this data, it is possible to infer if a device is under attack or has been attacked. Much research has been conducted in the field of Intrusion Detection Systems (IDS) for IoT devices. These IDS can either be network-based (NIDS), which are usually located on the IoT gateway, or host-based (HIDS), which are implemented on the device itself.
To combat the limited security most IoT devices offer, Passban was created [
20]. Passban is an intelligent IDS which can protect IoT devices to which it is directly connected. Passban is a lightweight solution which can be deployed on cheap, resource-constrained IoT gateways as a HIDS. Trained on the normal behaviour of a device, Passban can detect a wide range of malicious traffic such as brute-force, SYN flood and port-scanning attacks. Passban was designed with scalability in mind, meaning this framework can dynamically scale to new threat definitions without requiring hardware upgrades.
In [
21], a deep recurrent-neural-network-based IDS for fog security is developed. Fog computing extends cloud services nearer to IoT devices. It acts as a medium between traditional cloud computing and edge devices, such as the IoT. The proposed framework, implemented in the fog-computations layer, comprises a traffic processing engine and a classification engine consisting of a recurrent artificial neural network (ANN). The proposed framework is trained and evaluated using a balanced version of the NSL-KDD [
22] dataset and shows high accuracies of 98.27% against denial-of-service attacks, one of the more pervasive attacks against IoT devices.
In [
23], a convolutional-neural-network (CNN)-based anomaly-detection IDS framework for IoT is proposed. This framework takes advantage of the strengths of IoT devices and can examine traffic across the broad scope of the IoT. The proposed model can detect a wide range of intrusions and anomalous traffic behaviour and was trained on the Bot-IoT [
24] and NID [
25] datasets, achieving high accuracies of 92.85% and 99.51%, respectively. This work also presents a framework to incorporate IDS as a program within IoT networks and a strategy to preserve the integrity of IoT networks while seamlessly maintaining availability for legitimate users.
In our previous work, we introduced HH-NIDS [
26]—a Heterogeneous Hardware-Based Network IDS framework for IoT security. Using hardware accelerators, HH-NIDS implements anomaly-based IDS approaches for IoT devices. Supervised-learning methodologies on the IoT-23 [
27] and UNSW-NB15 [
28] datasets were trained to generate lightweight ANN models for anomaly detection, achieving high accuracies of 99.66% and 98.57% for these datasets, respectively. These models were evaluated from a performance and resource-usage perspective on the CPU, GPU and FPGA and implemented on the MAXIM 78000 microcontroller.
A common theme amongst these works is that they focus on the network traffic of the IoT device to detect malicious activity. One key security area that has been largely overlooked is the use of power data. The side-channel power data of a device is a fundamental primary source of data which every device, regardless of computing resources, has. The following works focus more on using power data in security. The volume of works such as these is insufficient, and we argue that much more research must be performed to integrate power data into security.
Earlier works proposed the use of side-channel power data as an attack on the device itself. Work by Kocher et al. [
29], presented in 1999, examines specific methods for analysing power consumption measurements to uncover secret keys from tamper-resistant devices. These methods, dubbed “Simple Power Analysis” and “Differential Power Analysis”, broke DES encryption, thereby allowing attackers to discern private keys. They also discuss approaches for building cryptosystems which securely operate in insecure hardware that leaks information.
Instead of using the side-channel power data as an attack, other works have been completed which monitor the device power data to detect intrusions. These works are very scarce, however. Some notable examples are listed below.
In our other previous work [
30], a lightweight convolutional neural network (CNN) Host-Based IDS (HIDS) for anomaly detection in the power data of an IoT device was created. This CNN framework was implemented on the MAX78000 microcontroller on the edge. The proposed framework is scalable and generic, making it relevant for any device. However, a fundamental limitation of that work was the absence of actual attack examples in the power data. As such, synthetic anomalies were relied on.
WattsUpDoc [
31] utilises the side-channel power consumption of medical devices to allow for run-time malware detection. During experimentation, WattsUpDoc performed with an accuracy of 94%, when presented with previously known malware examples, and 85% accuracy regarding unseen malware examples on multiple embedded devices. This framework’s non-intrusive methodology, which monitors the side-channel power data from the device, allows for the detection of malware with no software, hardware or network modification requirements of the existing system in place.
DeepPower [
32] is another approach which detects malware on IoT devices by analysing their non-intrusive side-channel power signals. This framework utilises deep learning to detect anomalies in the power data. DeepPower initially filters the raw side-channel power data to find suspect power traces. A fine-grained analysis is then performed on these traces to determine which activities they correspond to on the device. The DeepPower framework can detect malicious activity with high accuracy while maintaining a non-intrusive nature, meaning no modifications need to be made to the monitored devices.
In a departure from the theme of IoT devices, the work presented in “Catch Me if You Can” [
33] demonstrates how the side-channel power data obtained from High-Powered Computing Platforms (HPCs) can be used to determine what programs are running on a machine and, thus, if any un-authorised programs are running. Using a variety of scientific benchmarks, the proposed framework was tested on an HPC rack at Lawrence Berkeley National Laboratory. This framework can detect if specific programs are running with a recall of up to 95% and a precision of 97%. This work is essential, as it illustrates that using side-channel power data is not simply confined to the IoT field but applies to the entire security sector.
This study proposes a data acquisition framework for non-intrusive side-channel power data for IDS to detect attacks on edge devices. To this end, we create a testbed and subject it to common cyber attacks. The data is then collected and analysed. A unique capture-the-flag scenario is subsequently enacted, which combines the individually studied cyber attacks into a single scenario in which the testbeds are compromised, and a secret file is stolen. One fundamental area for improvement with all the side-channel power-related works presented here is that there needs to be an in-depth explanation of the power signatures they are studying. We seek to demonstrate that a broader understanding of common attack signatures in the power spectrum is crucial. The insight and intuitions gained from analysing the side-channel power data are valuable and should provide insight into how the IoT and other fields can implement more effective IDS frameworks. To the best of the authors’ knowledge, for most of the security sector, this study will be the first time they see these common cyber attacks represented in any form other than a packet capture.
3. Materials and Methods
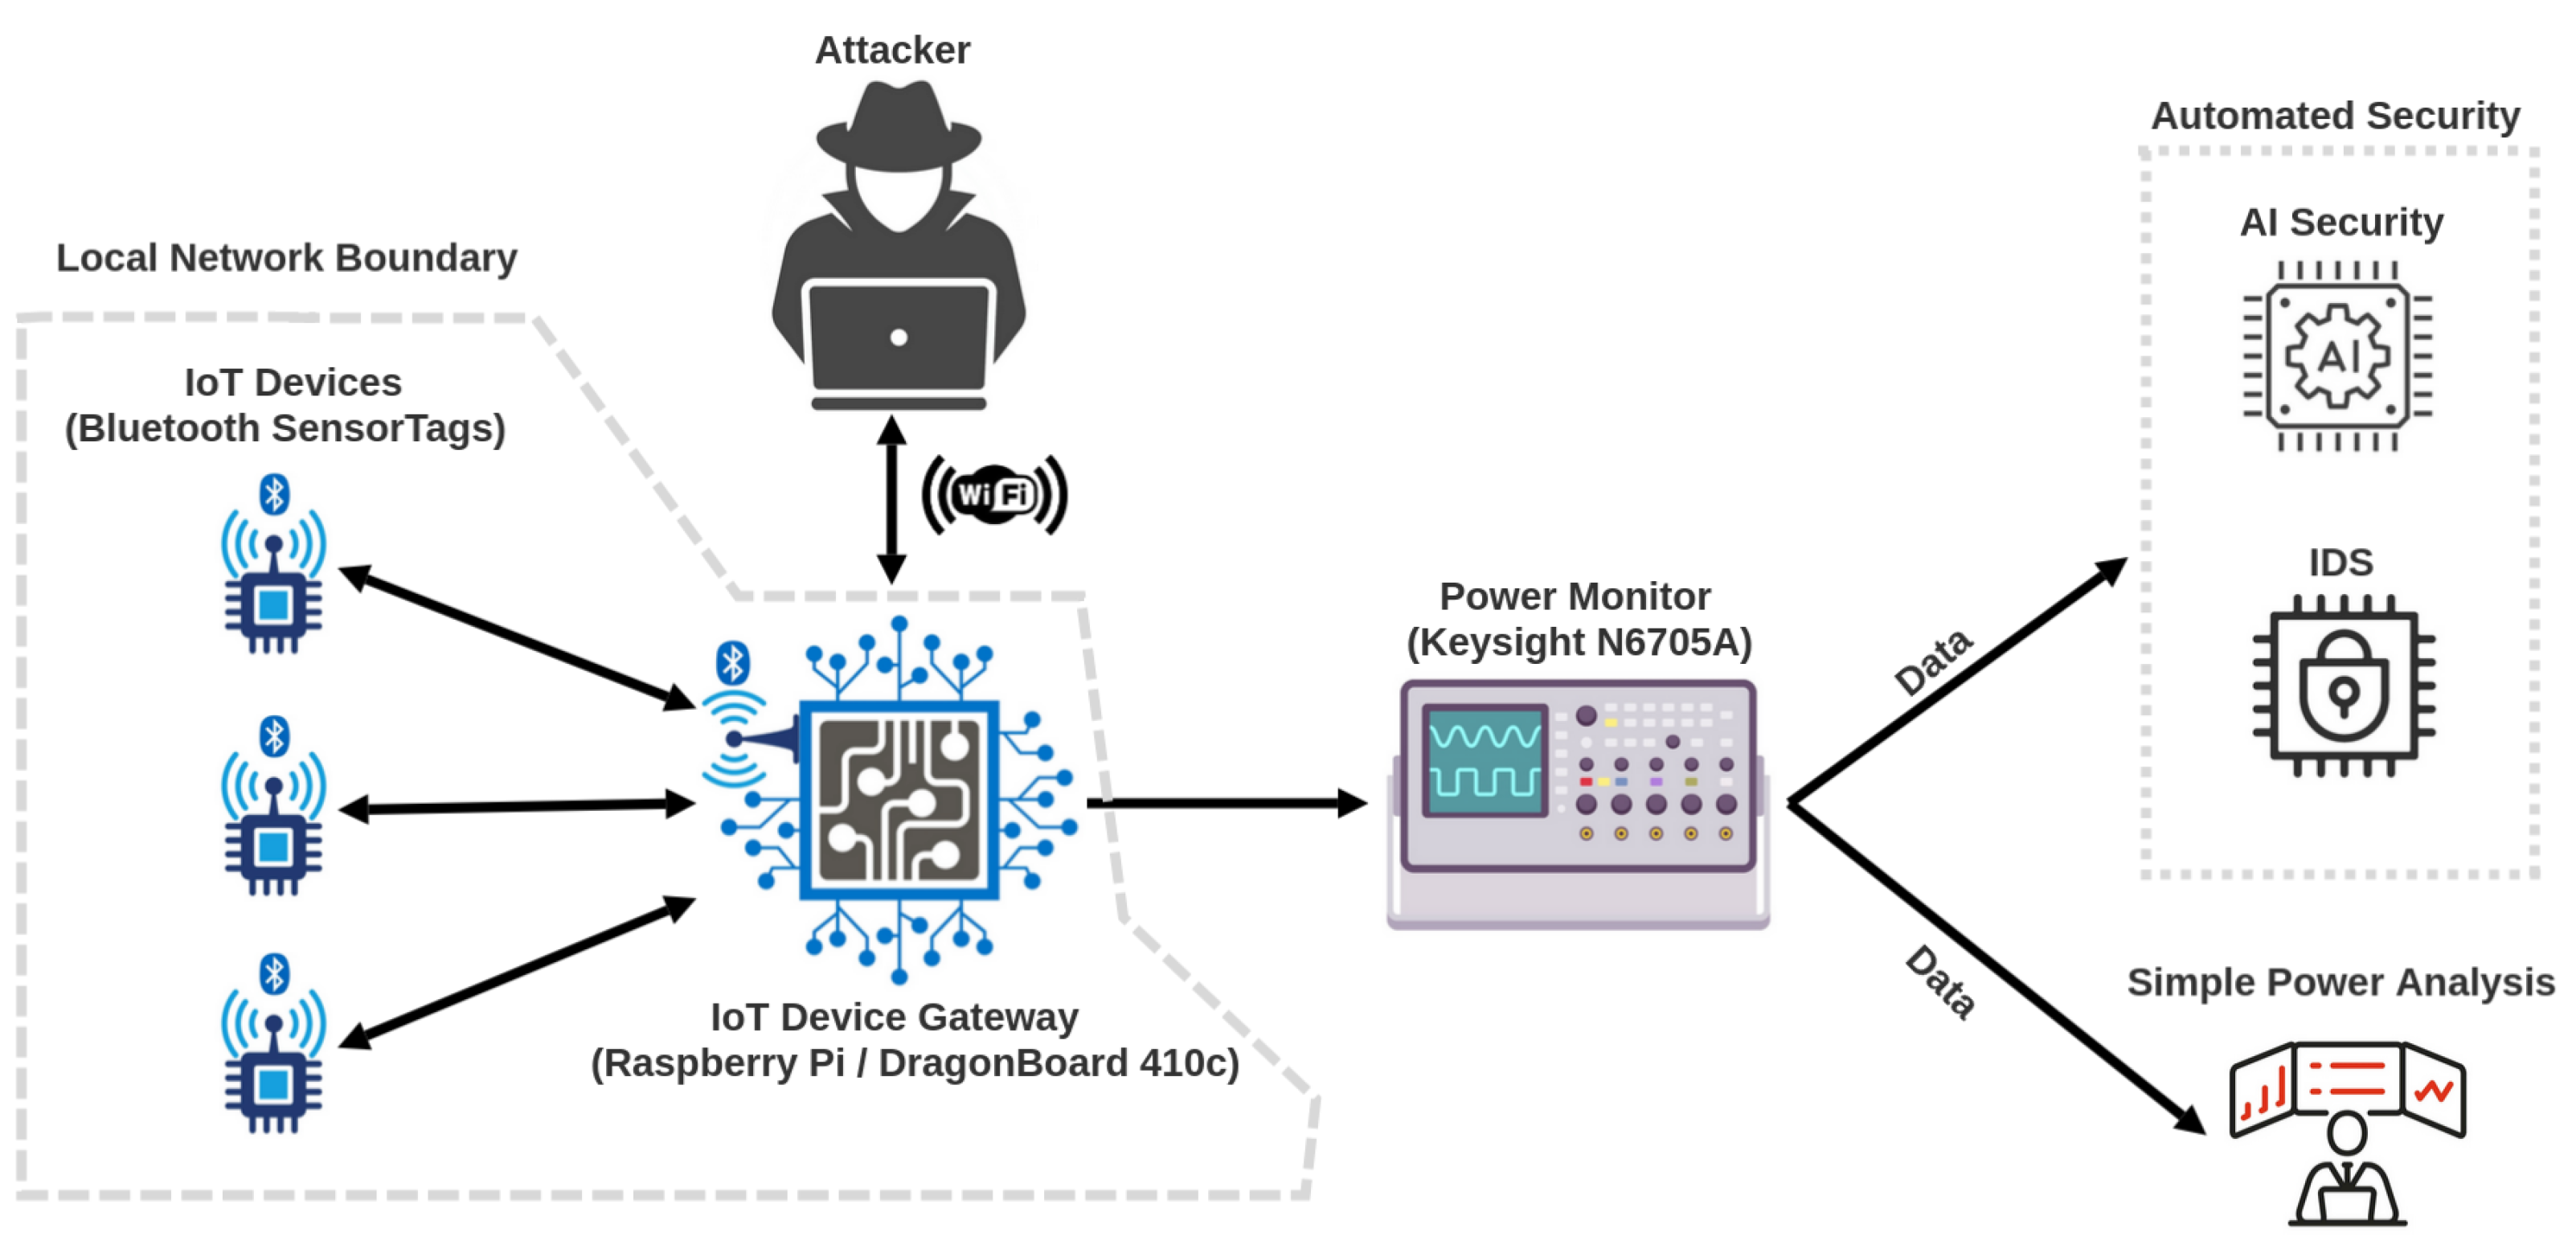
Two separate IoT devices were chosen for this testbed: a Raspberry Pi 3 Model B [
34] and a DragonBoard 410 [
35]. Based on the Qualcomm Snapdragon 410 processor [
36] and manufactured by Arrow Electronics, the DragonBoard 410c comes equipped with advanced processing power, Bluetooth and Wi-Fi. The Snapdragon 410 was an extremely popular processor of which Qualcomm shipped over 200 million units, with a large amount of integration with the mobile-phone market in the mid-2010s. With over 200 million units shipped [
37], any signatures obtained for the side-channel power data of this chip can be considered highly valuable. The Raspberry Pi 3 Model B was chosen for a similar reason to the Snapdragon-based system, its extreme popularity. The Raspberry Pi is one of the most popular single-board computers on the market today. Indeed, since the launch of its first version over ten years ago, the Raspberry Pi has sold over 40 million units [
38].
The DragonBoard and the Raspberry Pi feature Quad Core 1.2GHz 64-bit CPUs and 1.2GB of RAM. In the case of the DragonBoard, this quad-core CPU is integrated within the Snapdragon 410 along with other components, such as a Qualcomm APQ8016E application processor and a Qualcomm Adreno 306 graphics chip. Regardless of their different manufacturers, manufacturing periods and usual use cases, both systems have startlingly similar specifications. These choices in the device will give a broader understanding of what common attack signatures look like, when viewed in the device current across different devices. Part of this study investigates whether common attacks’ signatures are general. While an exact match in the signature cannot be expected due to the different hardware specifications, any generalisation in signatures could greatly assist in understanding and detecting these attacks against IoT devices and networks comprised of various devices. With approximately 245 million devices (combined, between the DragonBoard 410c and the Raspberry Pi), extensive coverage of devices can be assumed during this study. The testbed was kept as simple as possible to maximise explainability while maintaining realism.
Very little functionality was enabled on each board. The Raspberry Pi, running PI OS [
39], came with crucial features, such as Bluetooth, installed. These features needed to be installed on the DragonBoard, on which Linaro Debian [
40], a specifically designed Debian distribution for the Qualcomm Snapdragon 410, was installed.
Both boards were connected to the internet over Wi-Fi, and the SSH protocol was enabled to broaden the attack surface. SSH [
41] or “Secure Shell” is a network protocol allowing users to communicate between computers, share data and remotely log into other devices. SSH would regularly be enabled on IoT devices for maintenance purposes, and, in some cases, normal operating behaviour would require users to log in via SSH to view sensor data or interact with components. Recent research has revealed that 15% of IoT device owners do not change the default passwords. As a result, five passwords can give an attacker access to 10% of all IoT devices worldwide [
42]. With an estimated 55 billion IoT devices installed worldwide by 2025, this number of devices with default credentials will be over 5 billion [
15].
Bluetooth was enabled on each board to communicate with a TI CC2650STK Sensortag [
43]. These Sensortags come equipped with ten low-power MEMS sensors. A simple Python script [
44] running on the testbed requested the sensor data over Bluetooth and interpreted the packets received once every 5 s. The Dragonboard and the Raspberry Pi were connected to an Agilent technologies N6705A DC Power Analyser [
45]. This device supplied the power to the testbed while also collecting side-channel device current data. This method allows for the non-intrusive monitoring of the side-channel IoT power behaviour.
Figure 1 describes a proposal for a generic data acquisition framework for IoT.
3.1. Data Collection
Using the Agilent N6705A, the testbed power was supplied and monitored. Using the data-logging function of the DC power analyser, the current of the testbed was logged at a rate of approximately 50 ksps (one sample every 0.02048 ms). While the Agilent N6705A can sample at much higher rates, 50 ksps is the maximum value for the data-logging function, allowing for much longer data captures.
The data featured in this paper undergoes no pre-processing. While many different pre-processing methodologies were investigated as this work progressed, it was decided to present the raw data, as seen by the power analyser.
Many other power and current sampling options exist, and using an expensive piece of equipment such as that featured in this work is not a strict requirement. For example, the work in [
33] shows great success monitoring the power of their High-Powered-Computing (HPC) behaviour with an inexpensive and non-intrusive device which is inserted between the plug and the appliance.
3.2. Normal Power Behaviour
The components of the testbed have already been briefly described, but not how they are used in the regular operation of the device. IoT devices tend to have elementary operations: an automated task they perform many times, looping repeatedly. In the case of this testbed, the devices were each connected to a single Bluetooth SensorTag. Using a Python script, the sensor data was requested every five seconds over Bluetooth. The script then interpreted the incoming Bluetooth packets to display the sensor values. This behaviour is continuous and realistic, as simple functionality is prevalent for simple IoT sensor systems used commercially and in people’s homes.
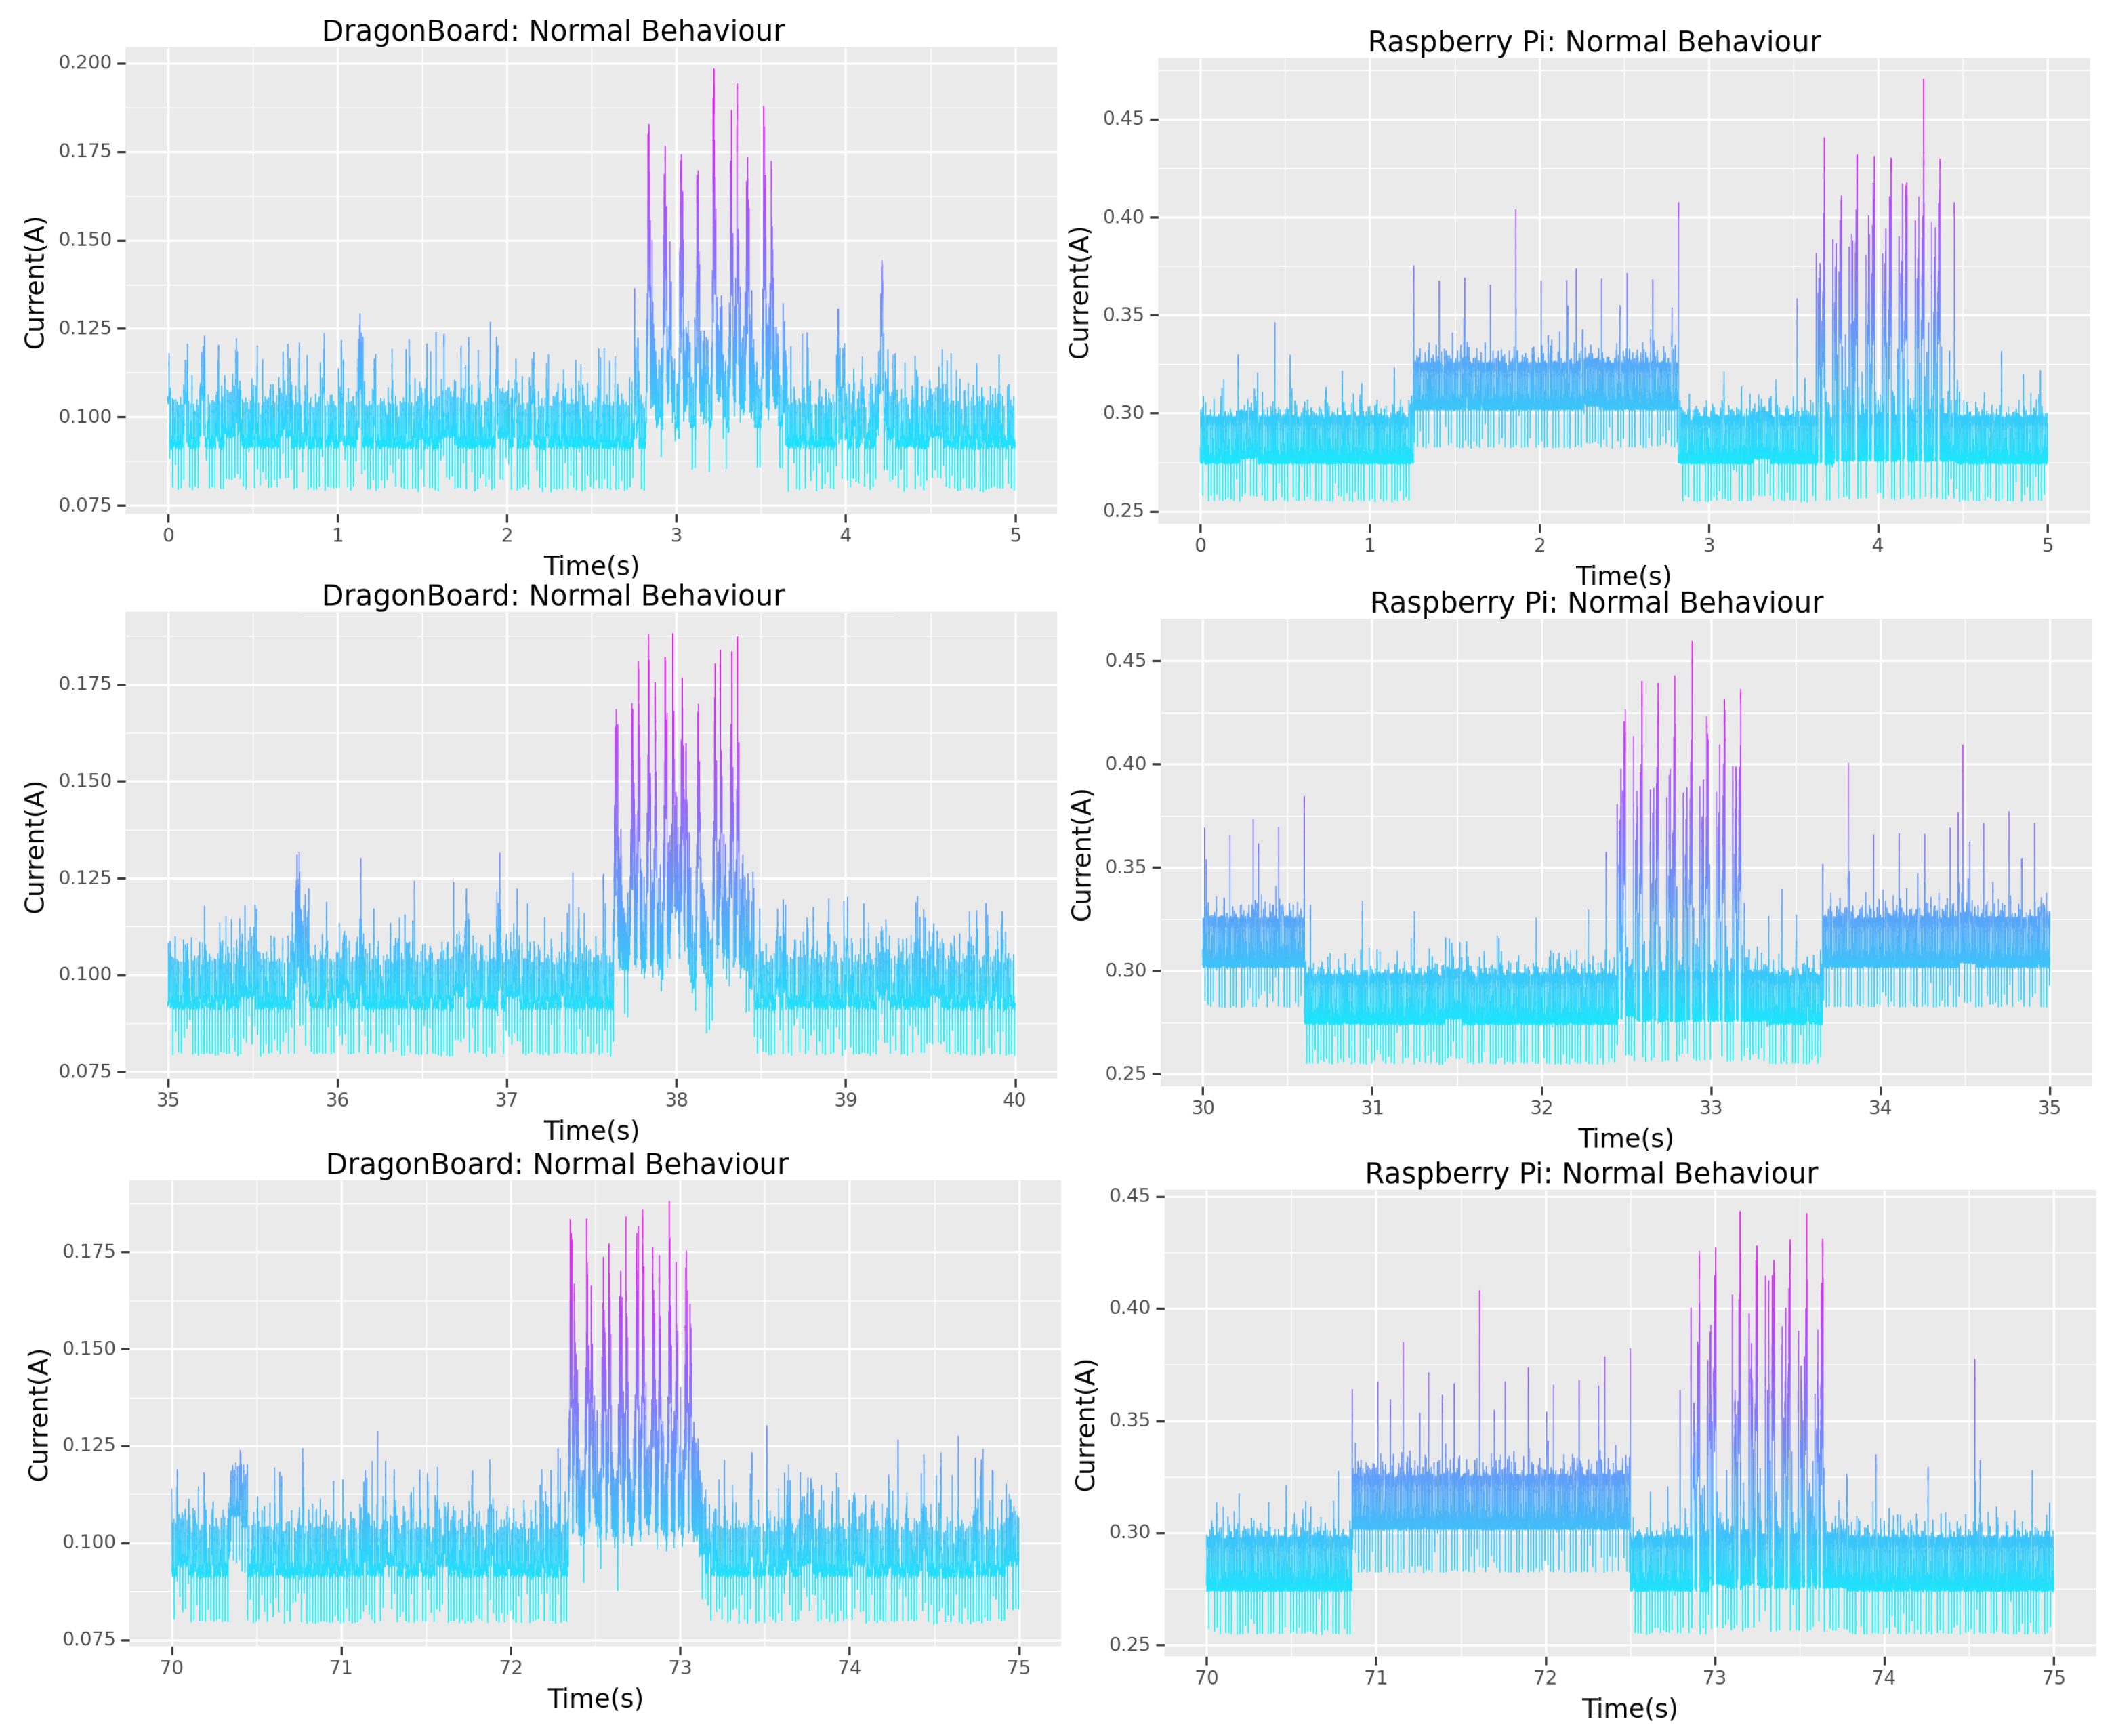
Figure 2 demonstrates three five-second segments of normal side-channel device current from each device. The time periods 0–5 s, 35–40 s and 70–75 s were chosen to represent part of the overall dataset. This normal behaviour is expected throughout the entirety of this work. Noticeable similarities can be seen in the normal-behaviour signature between both boards, even though the Raspberry Pi was drawing approximately double the current of the DragonBoard (0.4 A versus 0.2 A). A remarkably similar signature shape for each spike of Bluetooth communication behaviour can also be observed. Time-wise, both boards complete the Bluetooth communications within the same time frame.
The normal behaviour of the PI is not as smooth as the DragonBoard, with evident deviations in the background device current. These deviations will make some minor attack signatures harder to detect, as they can be masked by these slight device current fluctuations. This will be studied in more detail later in this work. In
Figure 2 as well as the remaining figures in this study, the side-channel power data is represented using colormaps of increasing intensity [
46]. This scale is based on the CISA National Cyber Incident Scoring System (NCISS) [
47] with blue colours representing baseline conditions and black colours representing an emergency.
5. Capture-the-Flag Scenario
To tie together all of the work on this testbed, a “capture-the-flag” scenario (CTF) was carried out against both devices. CTFs in cybersecurity are scenarios where a secret file or “flag” is hidden on a target system. The goal of this scenario is for attackers to hack into the system to obtain this hidden flag. This scenario is often the theme of large competitions where many teams of hackers compete against one another to obtain these hidden flags first. In the case of this work, a file was hidden on the testbed, and the testbed was compromised by combining most of the attacks featured in
Section 4, with the hidden flag subsequently being stolen by the attacker.
The entire process of the hacker’s first contact with the target to the exfiltration of the hidden flag is all carried out without interruption, in a realistic scenario. This scenario mimics how an attacker would hack a device with minimal security in the field. This scenario is a notable contribution to the field of cybersecurity, as the entire process of the compromised device can be easily represented visually using the side-channel power of the testbed. The CTF scenario is broken up into the key areas of reconnaissance, brute force, infiltration, exploration, exfiltration and withdrawal.
During the CTF scenario study, the data presented will be cross-referenced with the findings from
Section 4. Using this methodology, it will be possible to ascertain what occurred during the CTF without prior knowledge of the actual sequence of attacks used in the CTF. A forensics team could employ a methodology such as this after they have had a breach: with limited knowledge of the hackers’ actions (for example, they know the attacker infiltrated the system over SSH), apply some well-known attacks to their own devices, obtain the side-channel power data and, finally, compare the signatures obtained with those captured during the breach. Cross-referencing these signatures allows the team to establish a much clearer picture of what happened during the breach.
5.1. Reconnaissance
The CTF scenario begins with attacks on the confidentiality of the testbed. As mentioned in the reconnaissance-attack section, before an attacker begins any attack, they must gather information on their target. Information such as open ports, if the device accepts pings, or even the operating system running on the target can be key.
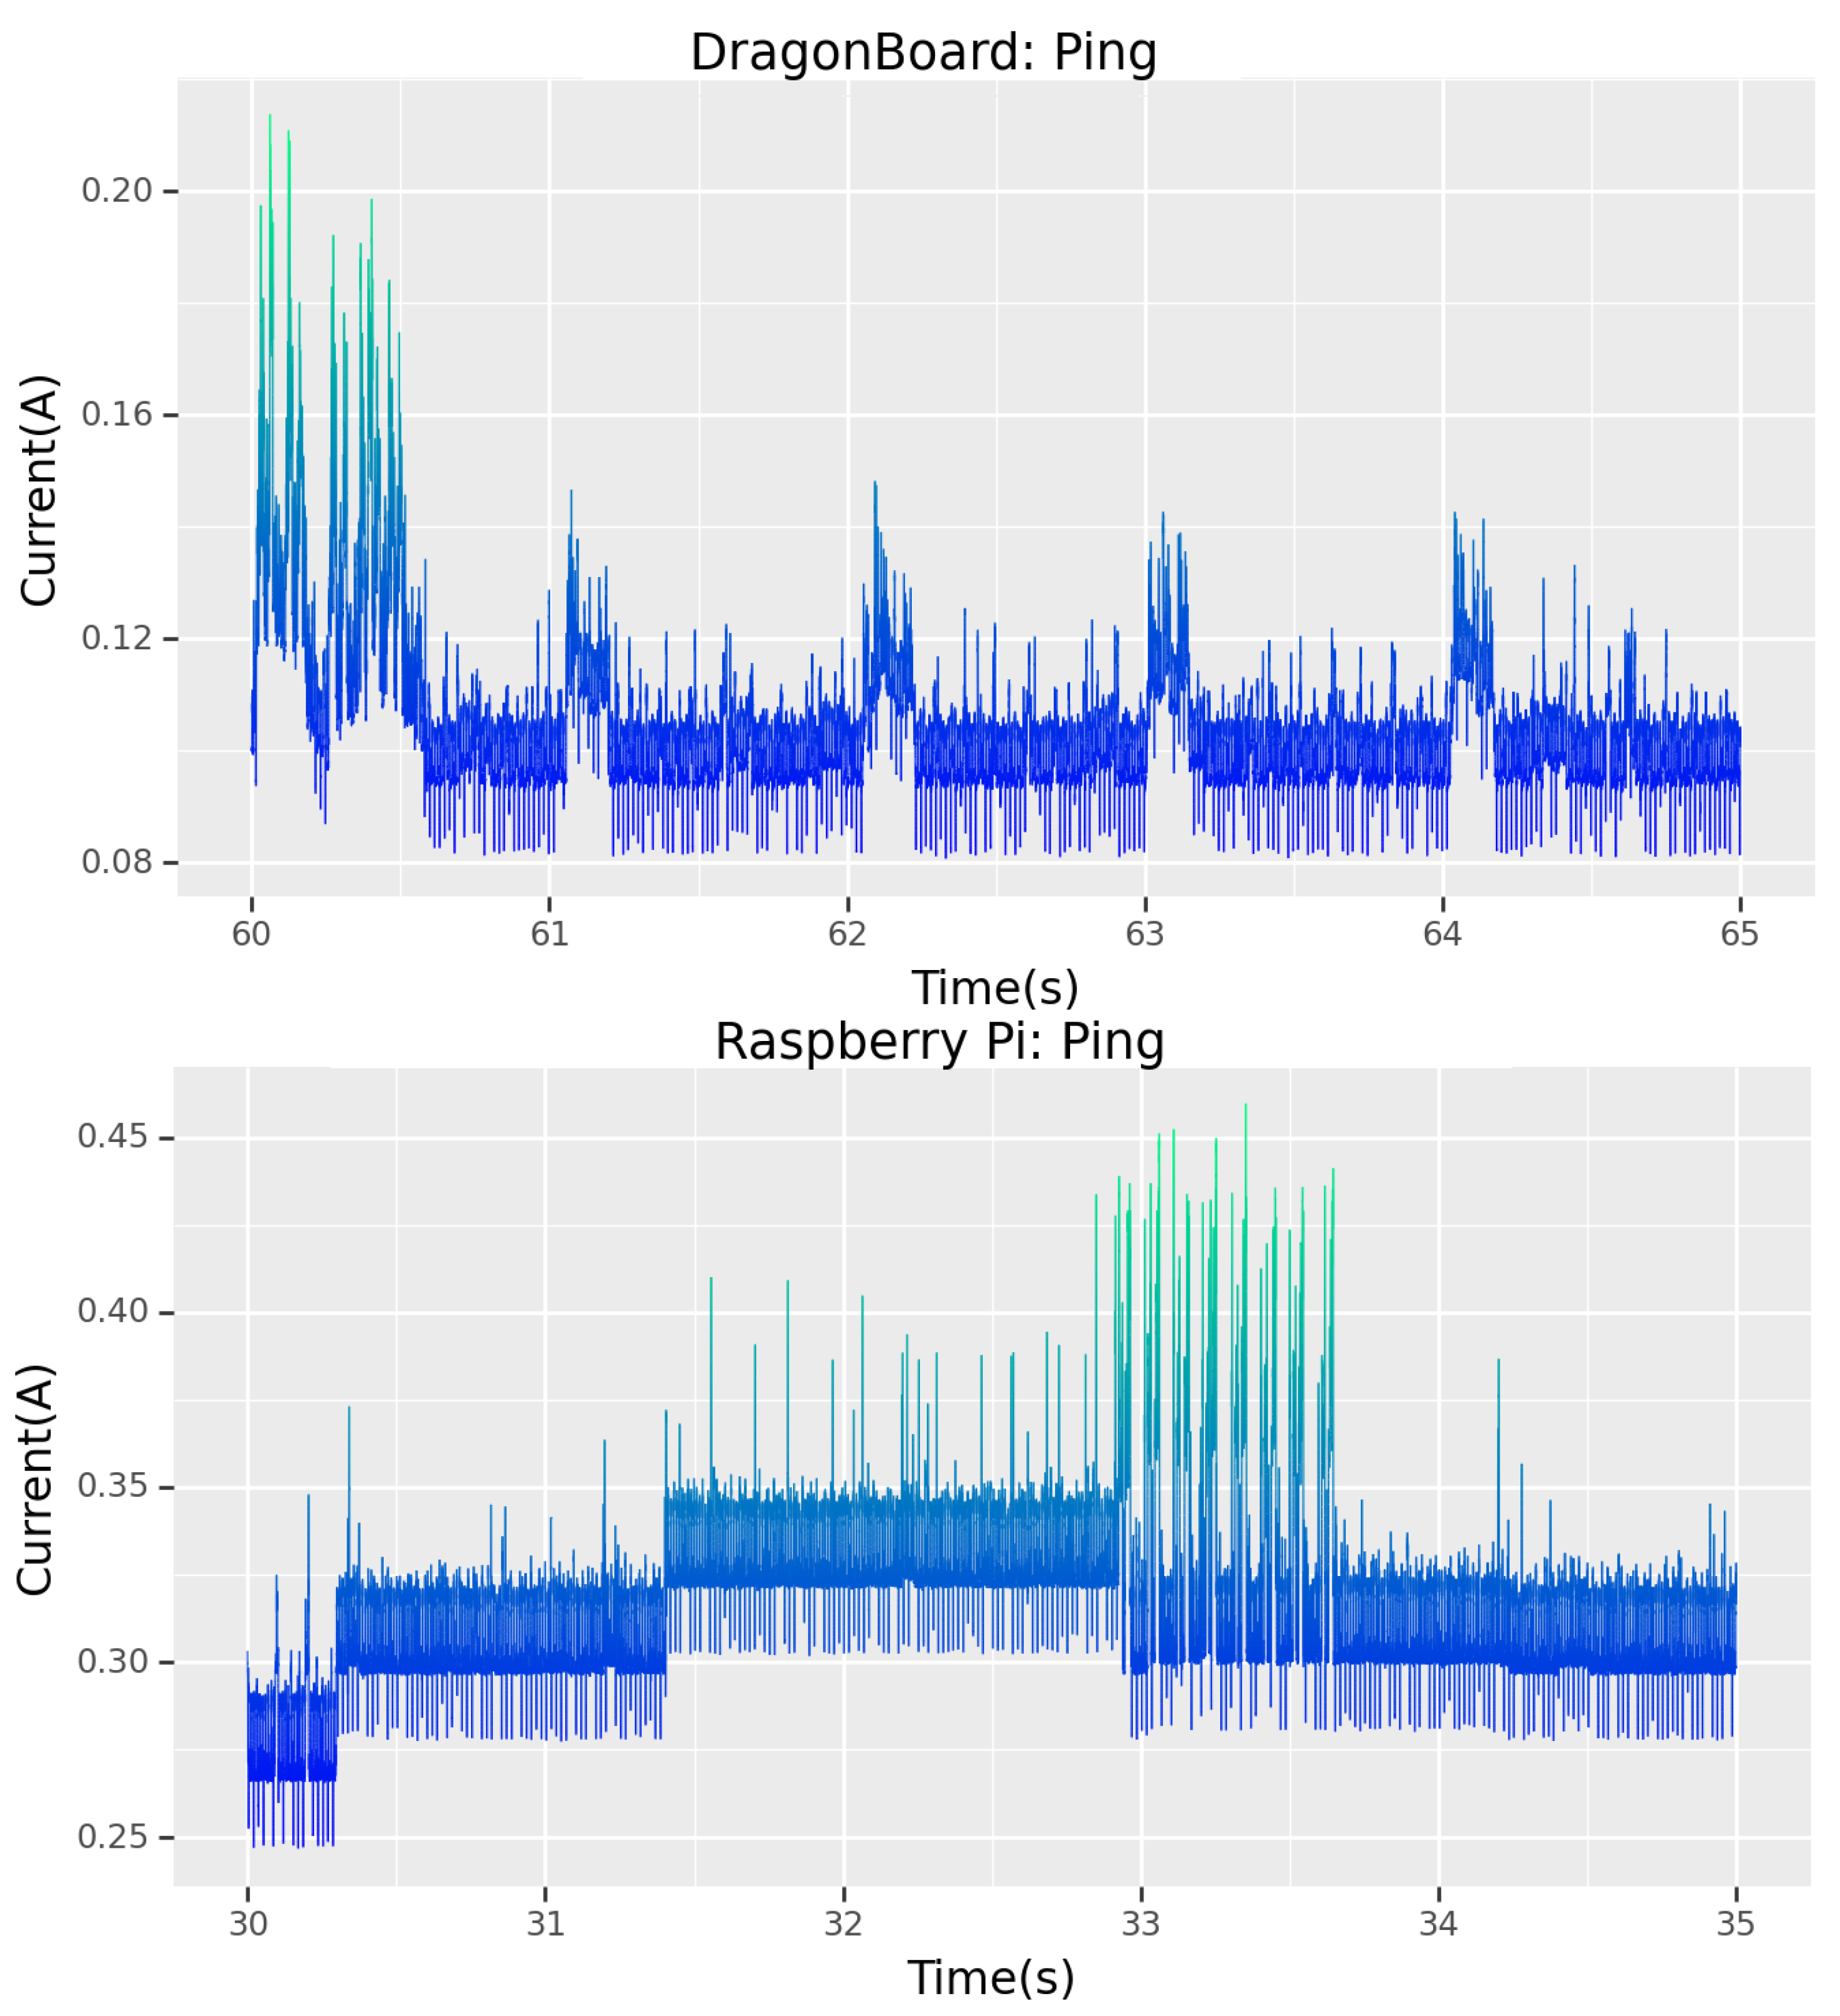
5.1.1. Ping
Before the attacker commences the port scan, it is prudent to “ping” the target to confirm if it is “live” and allowing ping requests. Ping (Packet Internet or Inter-Network Groper) [
55] is an extremely well-known program in computing and used for many purposes. These purposes include verifying if a destination IP exists and is accepting requests. The program works similarly to the concept of a radar ping, where a pulse is sent out, or packet in this case, and returns once it bounces off its destination or, in this case, is returned by the destination.
A “ping” is not actually an attack, but the presence of pings can indicate the initial contact between the attacker and the victim. In cases where a device should see no external communications at all but only a highly constrained range of normal behaviour, pinging could represent a much higher degree of danger. At the discretion of the security teams, specific security mechanisms could be put in place for their particular scenario.
Figure 7 shows the first five seconds of the targets being pinged in the CTF scenario. On the Dragonboard, small signatures belonging to the pings can be seen soon after the normal Bluetooth behaviour. These small pings will continue as long as the attacker pings the target. While the pings themselves may have a minimal signature on this testbed, their detectability only increases with an increase in the duration of the attack. These pings create quite the perturbation in normal behaviour, making this attack obvious even over this short period. For the Raspberry Pi, detecting the pings is slightly more complex.
Figure 7 shows no clear individual ping signatures can be distinguished. However, the entire current signature of the board increases from 0.25 A to 0.30 A. This increase continues for the duration of the ping attack. Using traditional power analysis methods, such as simply obtaining the average of the power in a segment, the pings should be detectable on the Raspberry Pi.
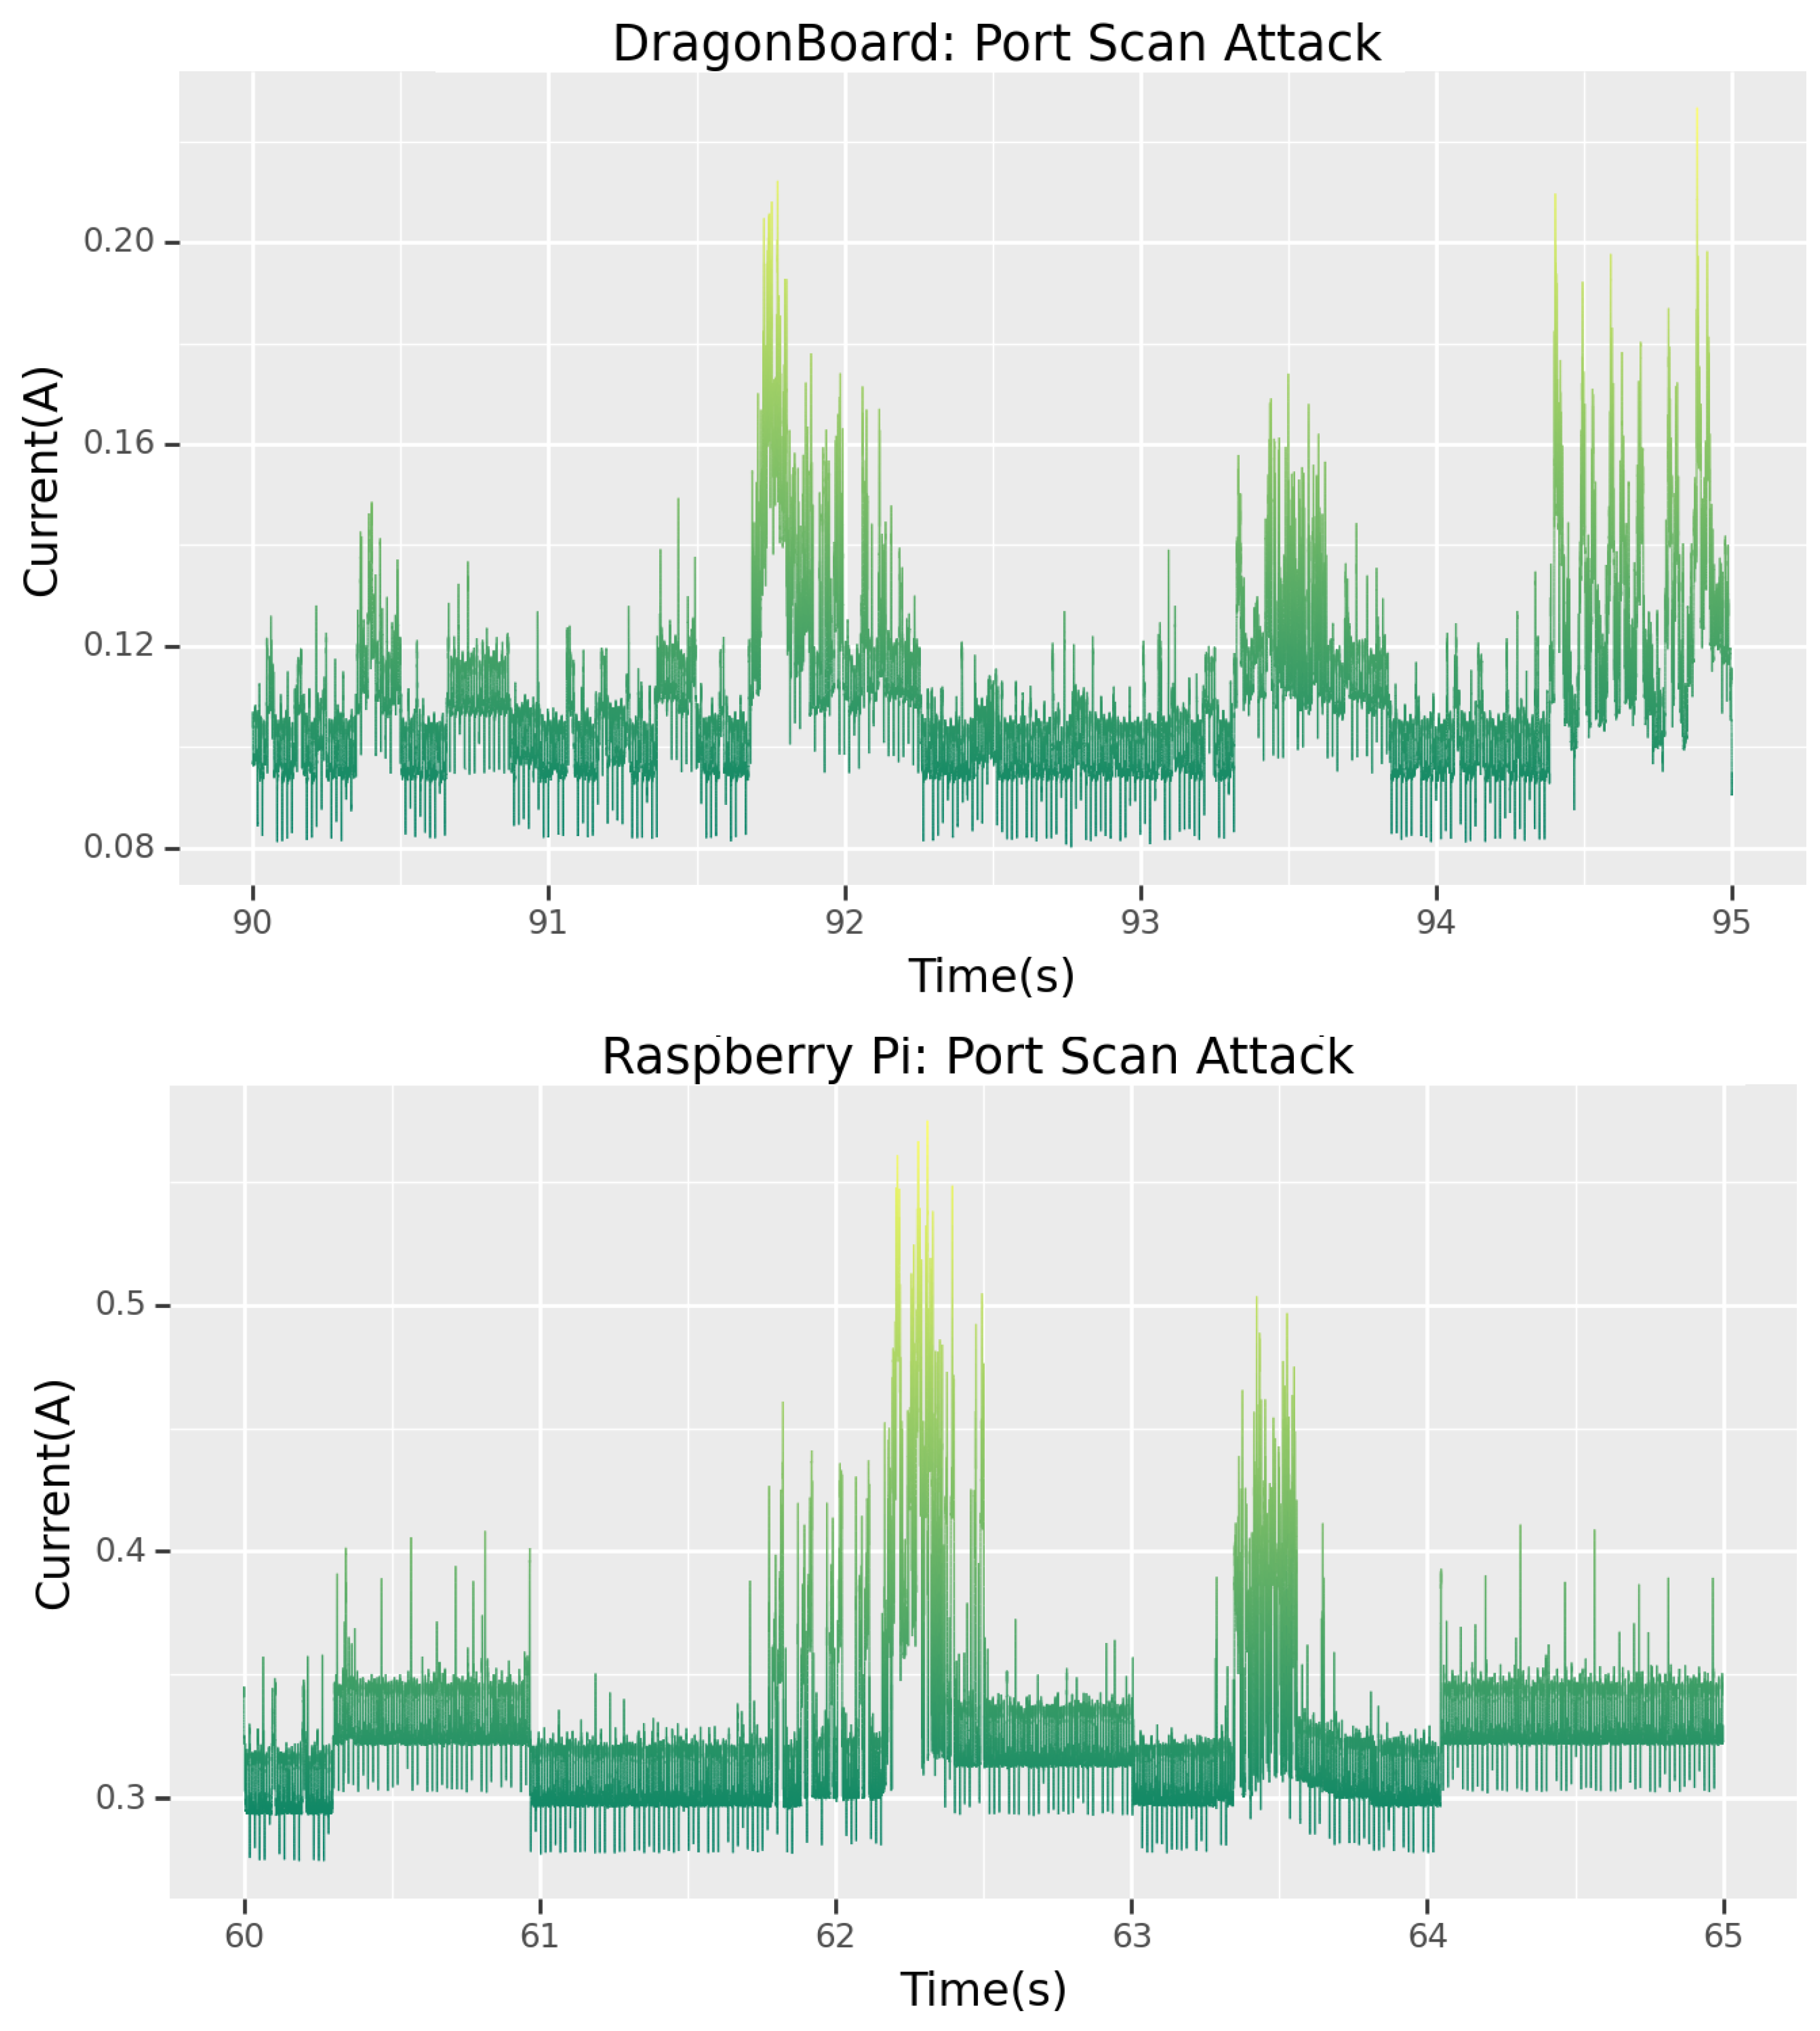
5.1.2. Port Scanning
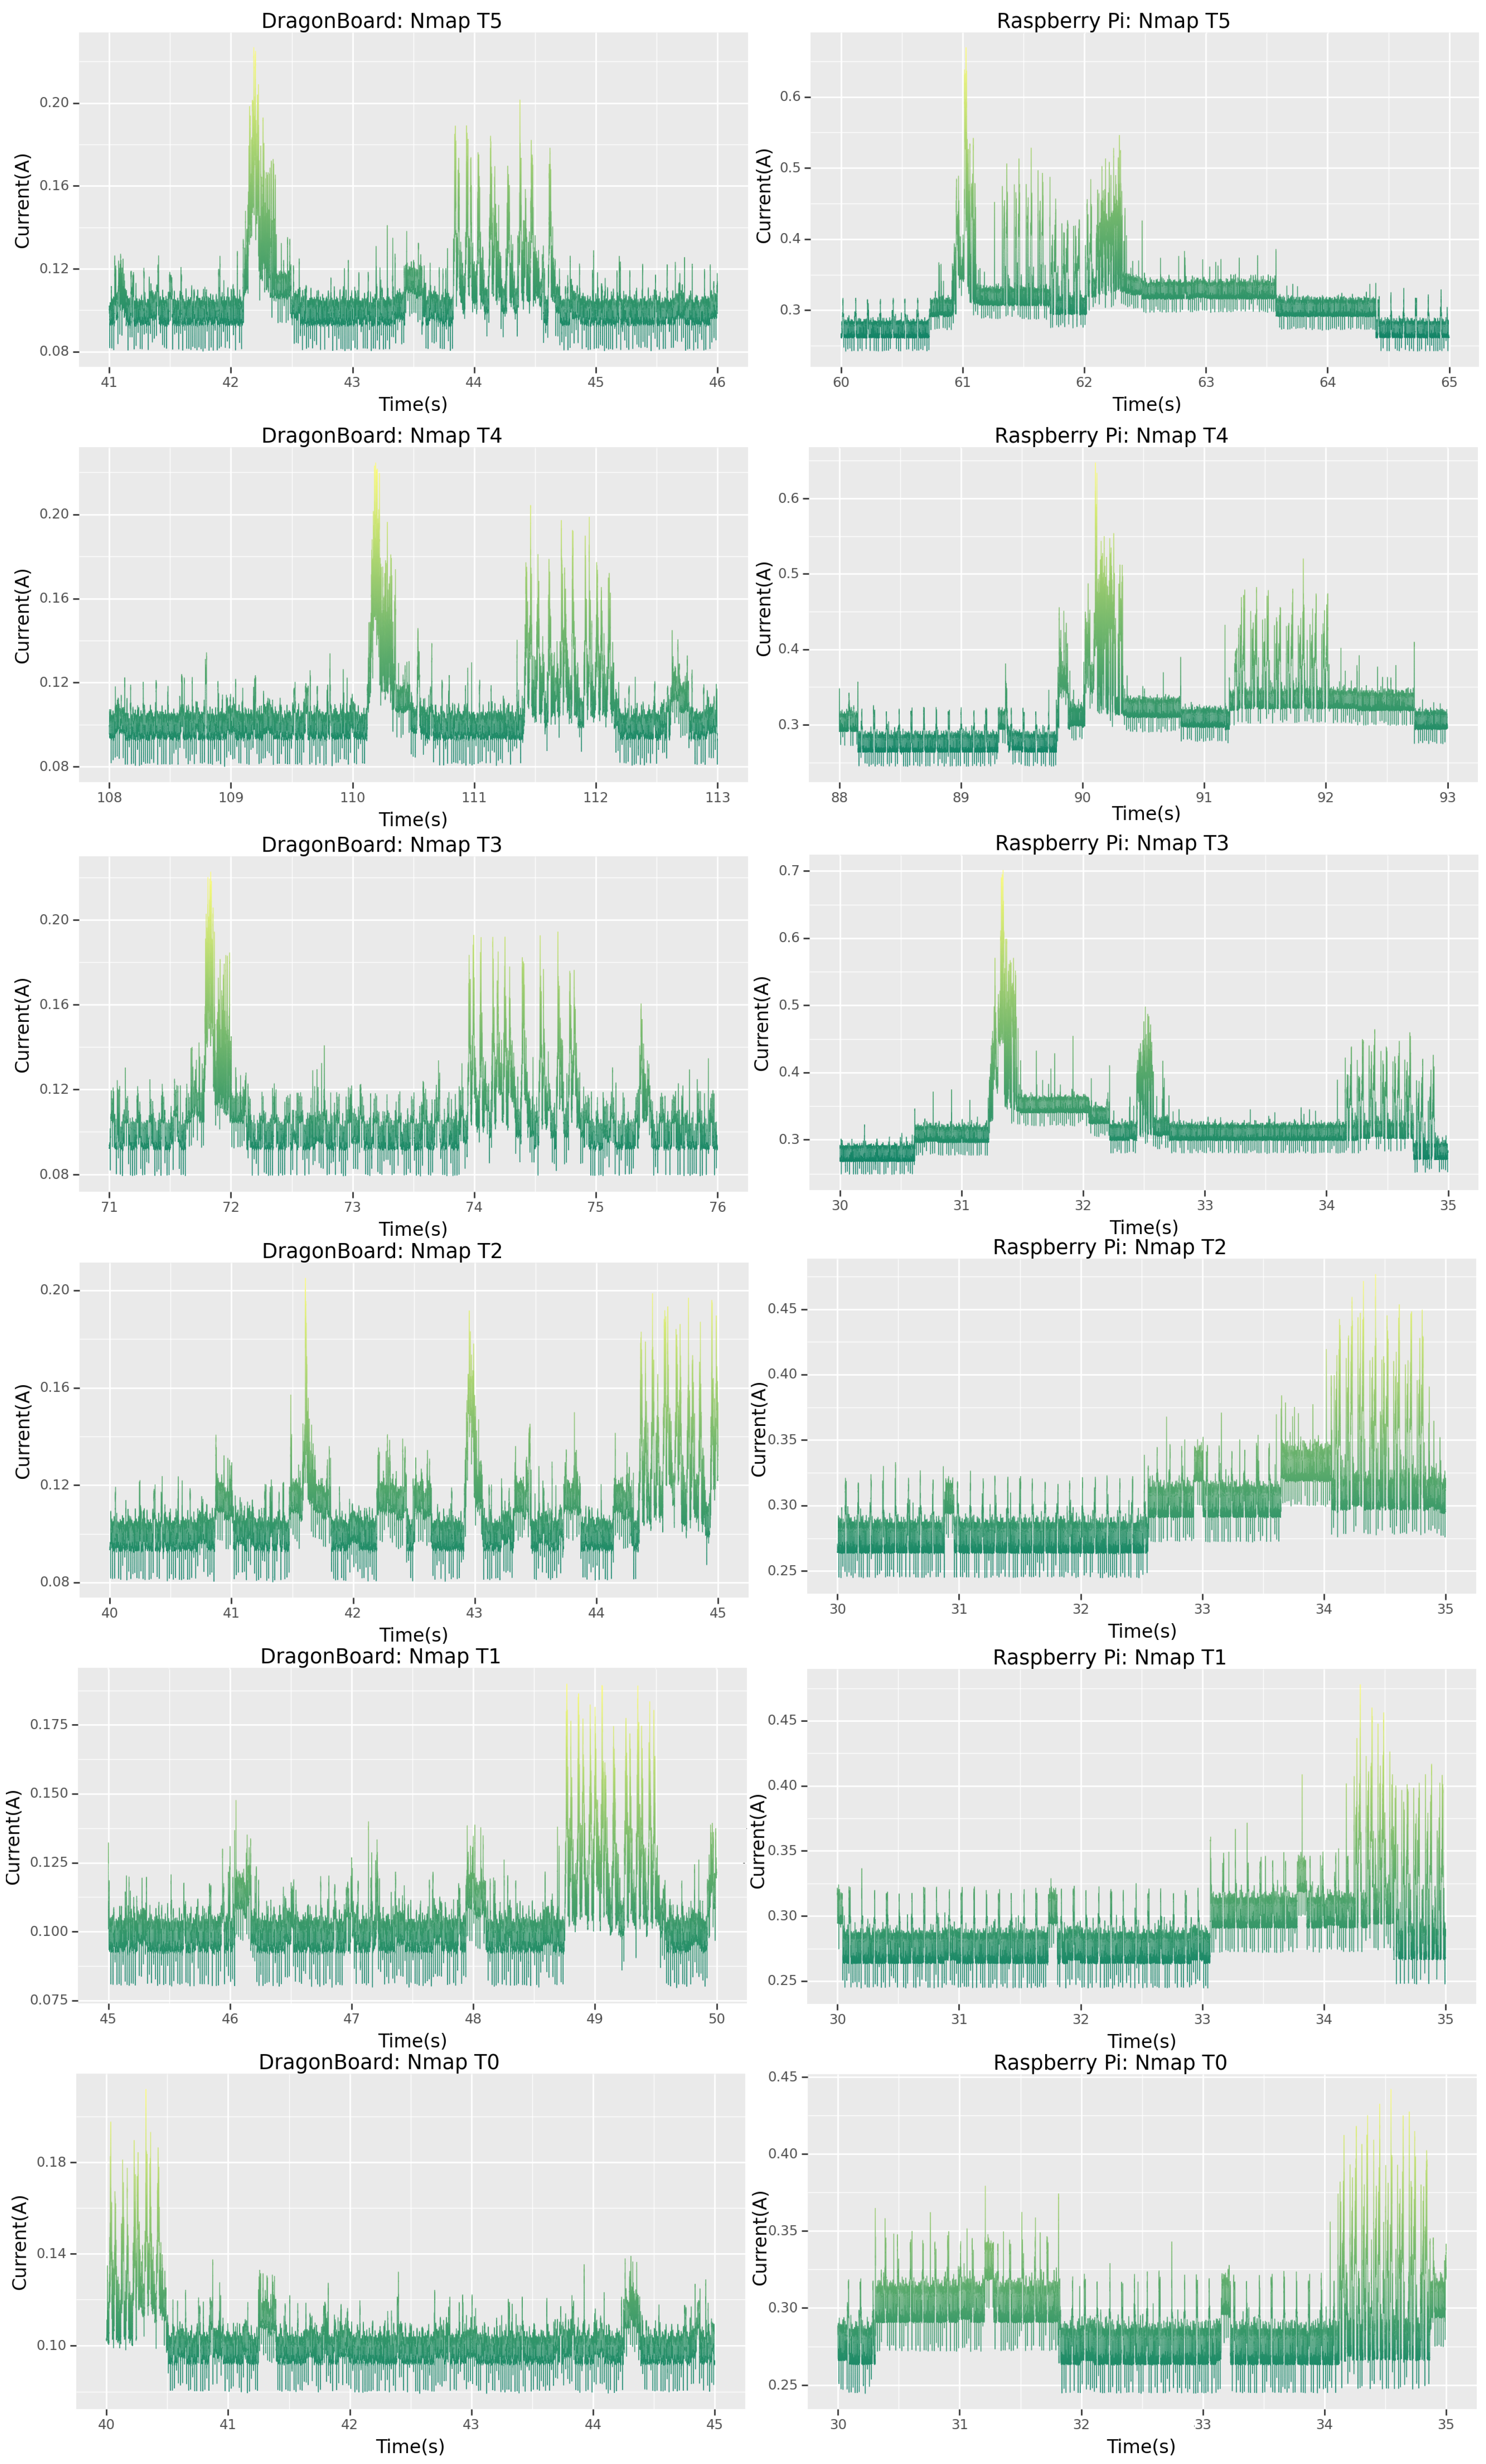
The Nmap tool was used to ascertain what processes were running on the target device; cross-referencing the signatures from
Section 4.1.1, one can study
Figure 8 and clearly see that this is indeed the signature for a port-scan attack. In fact, for both the Raspberry Pi and the Dragonboard, a clear similarity between
Figure 8 and settings “T3”–“T5” shown in
Figure 3 can be seen. In both cases, the signatures bear more similarities to the “T3” setting which was, in fact, the setting the devices were subjected to during the CTF.
This methodology of matching signatures can be very powerful for forensics teams after a breach. By subjecting their device to a range of attacks similar to what they think the attacker may have done, they can obtain a signature match which tells them precisely the operations the attacker went through when attacking their device.
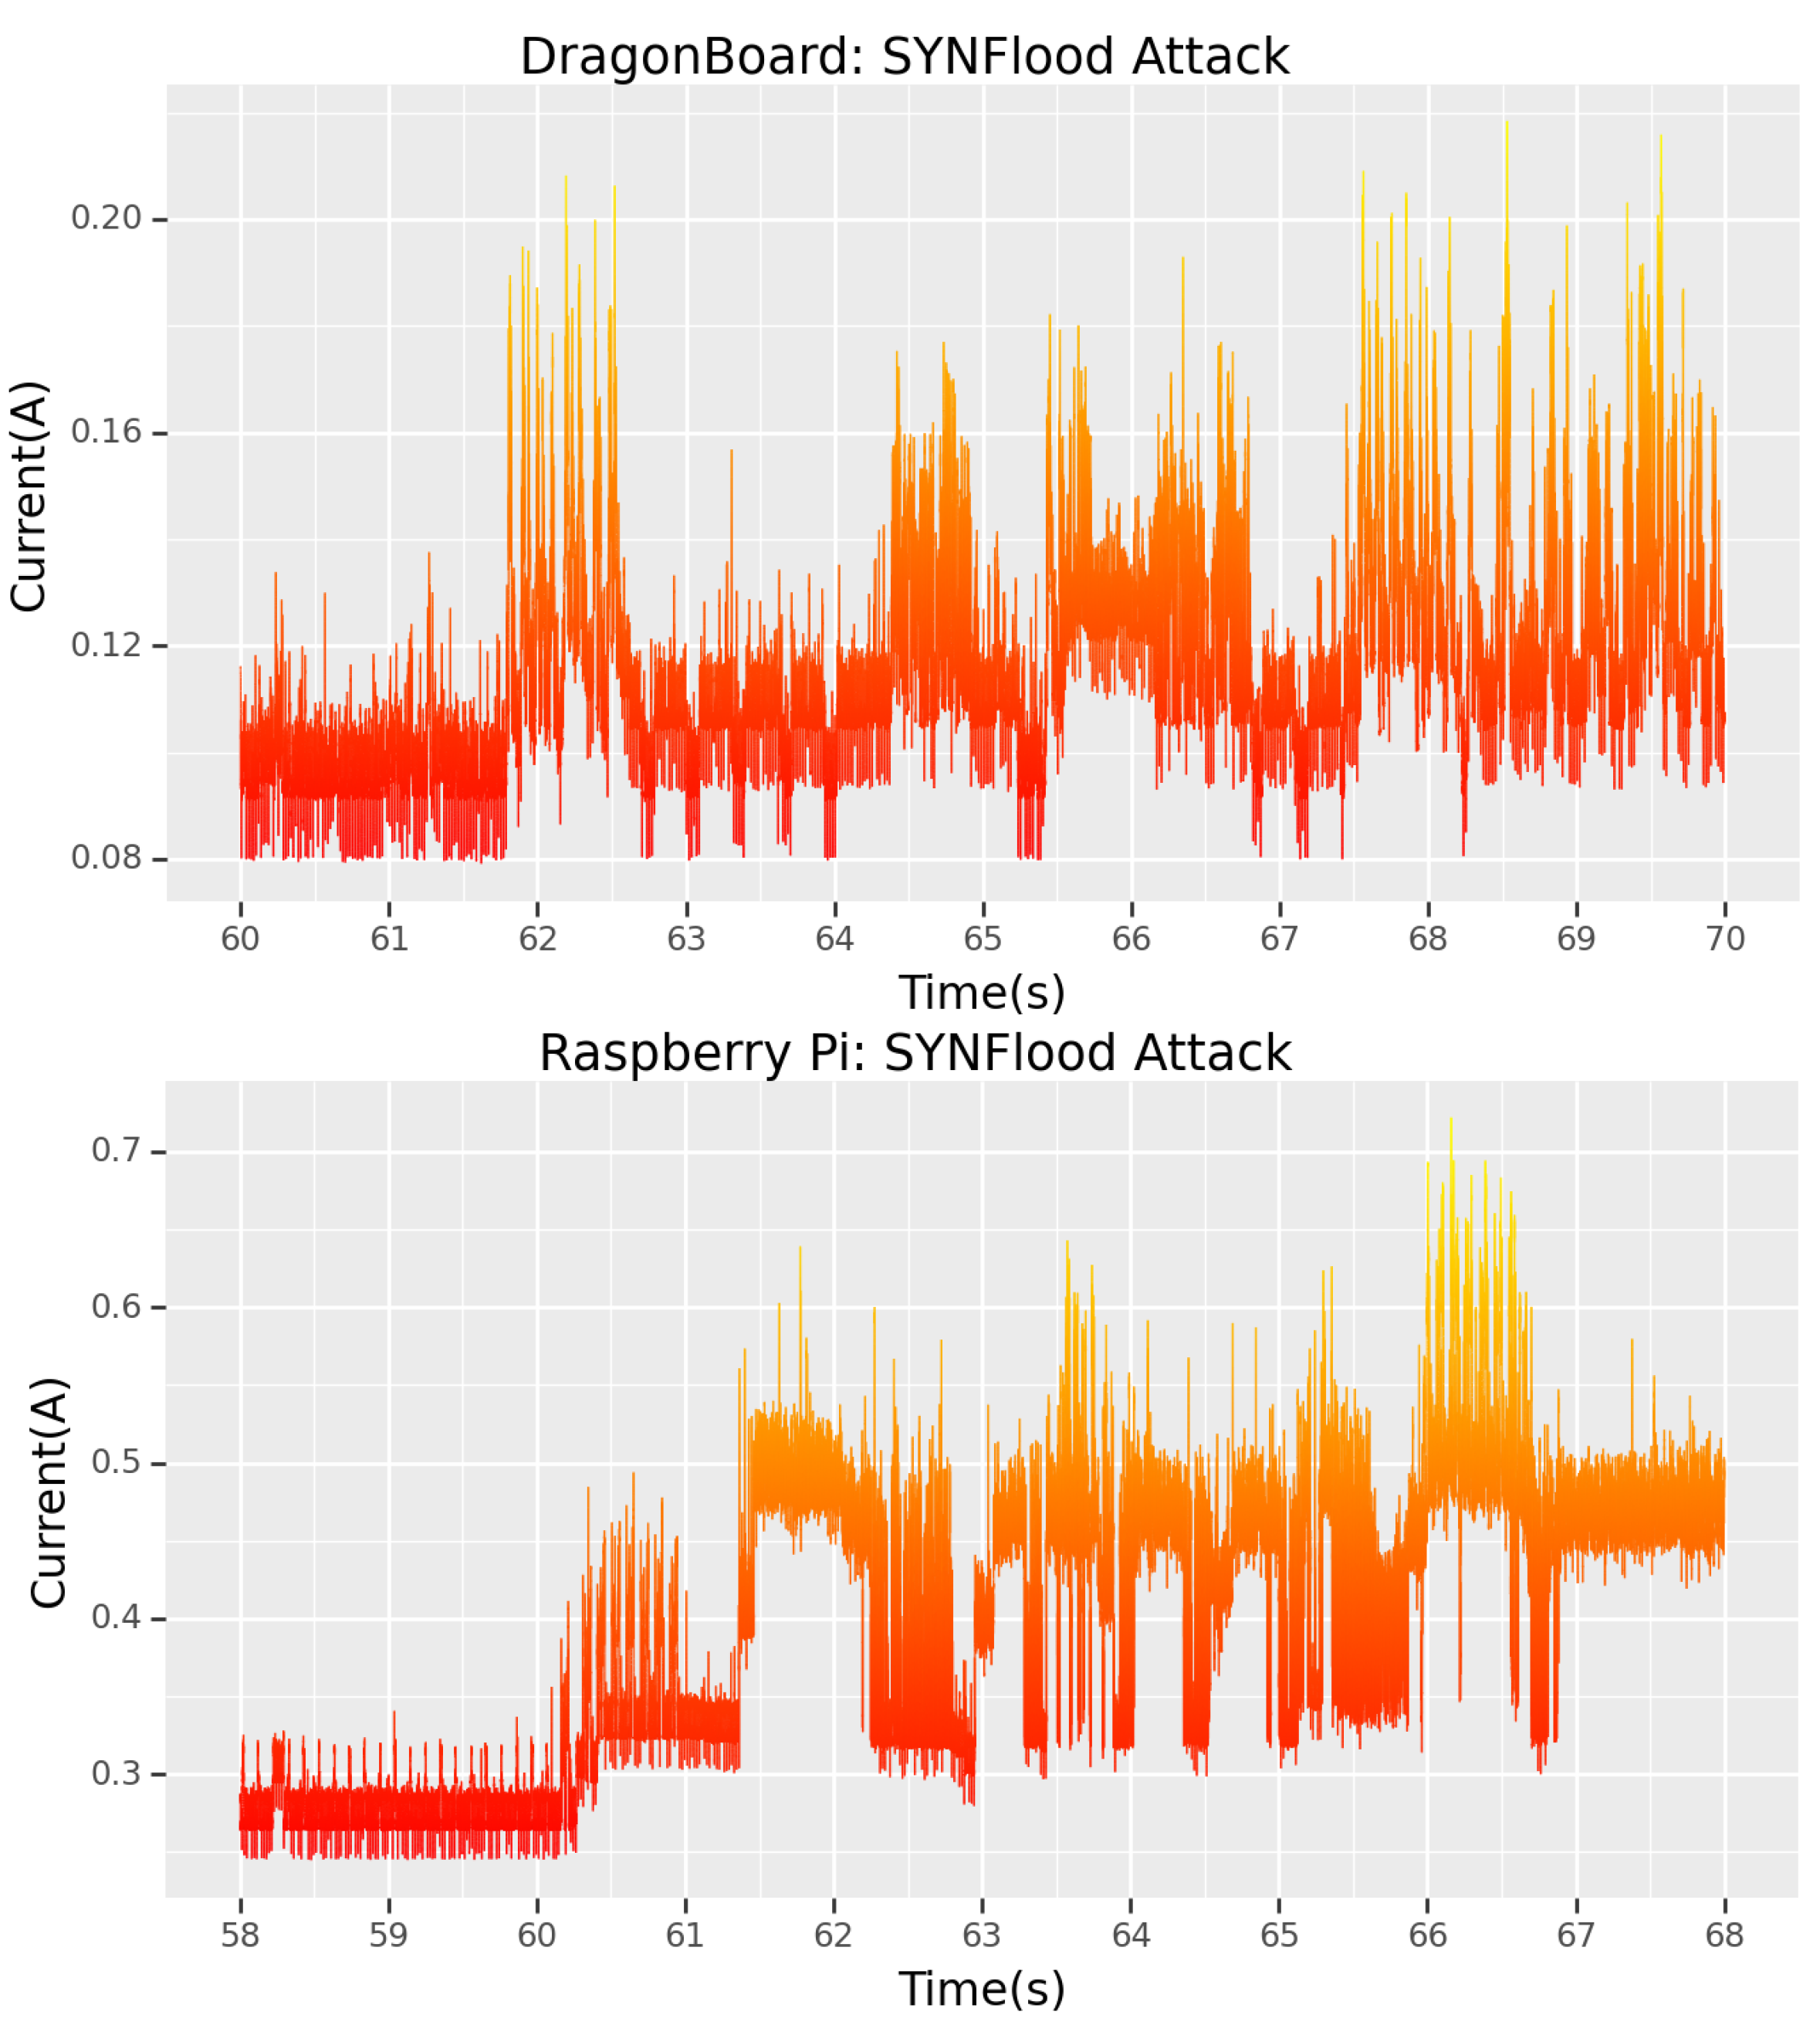
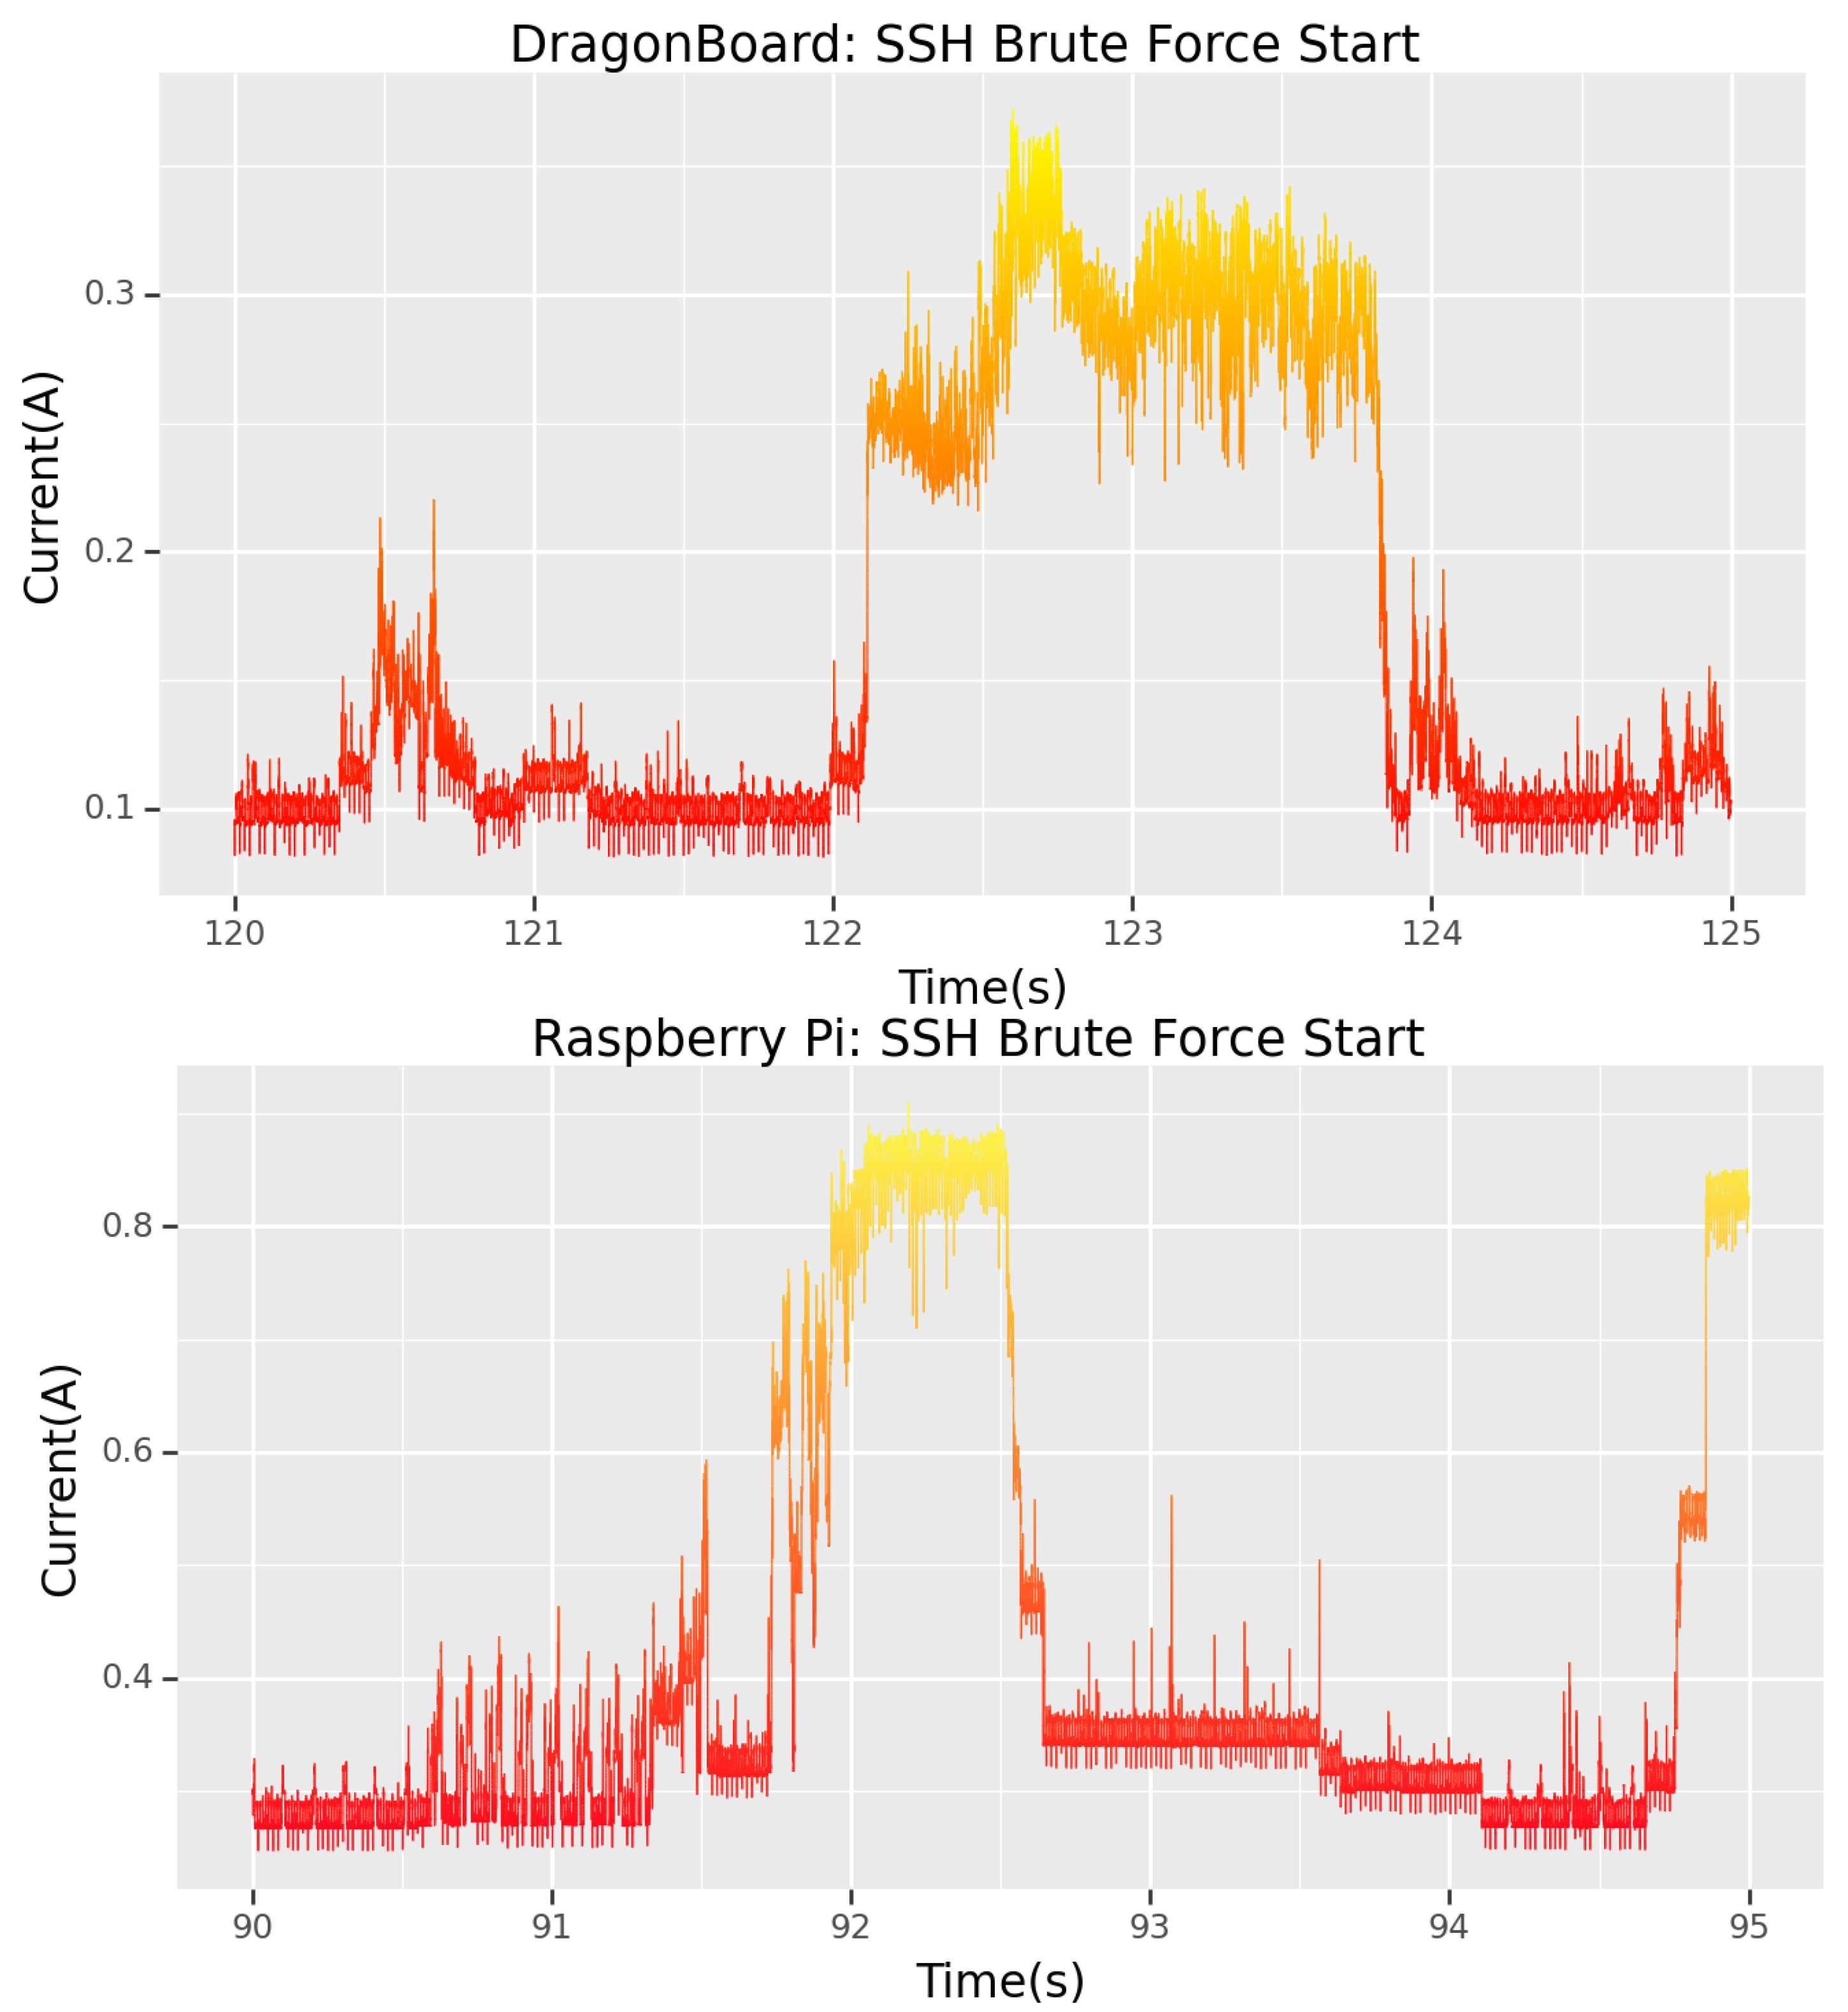
5.2. Brute Force
The port-scan attack revealed that the SSH service was running on the target; thus, port 22 was open for connection. This directs the attacker’s subsequent actions. As they wish to gain entry to the device to steal critical information, this attack vector will be exploited as an SSH brute force. The forensics team can confirm that an SSH brute-force attack has indeed occurred by cross-referencing the data obtained in the CTF with
Section 4.2, the matching power signatures.
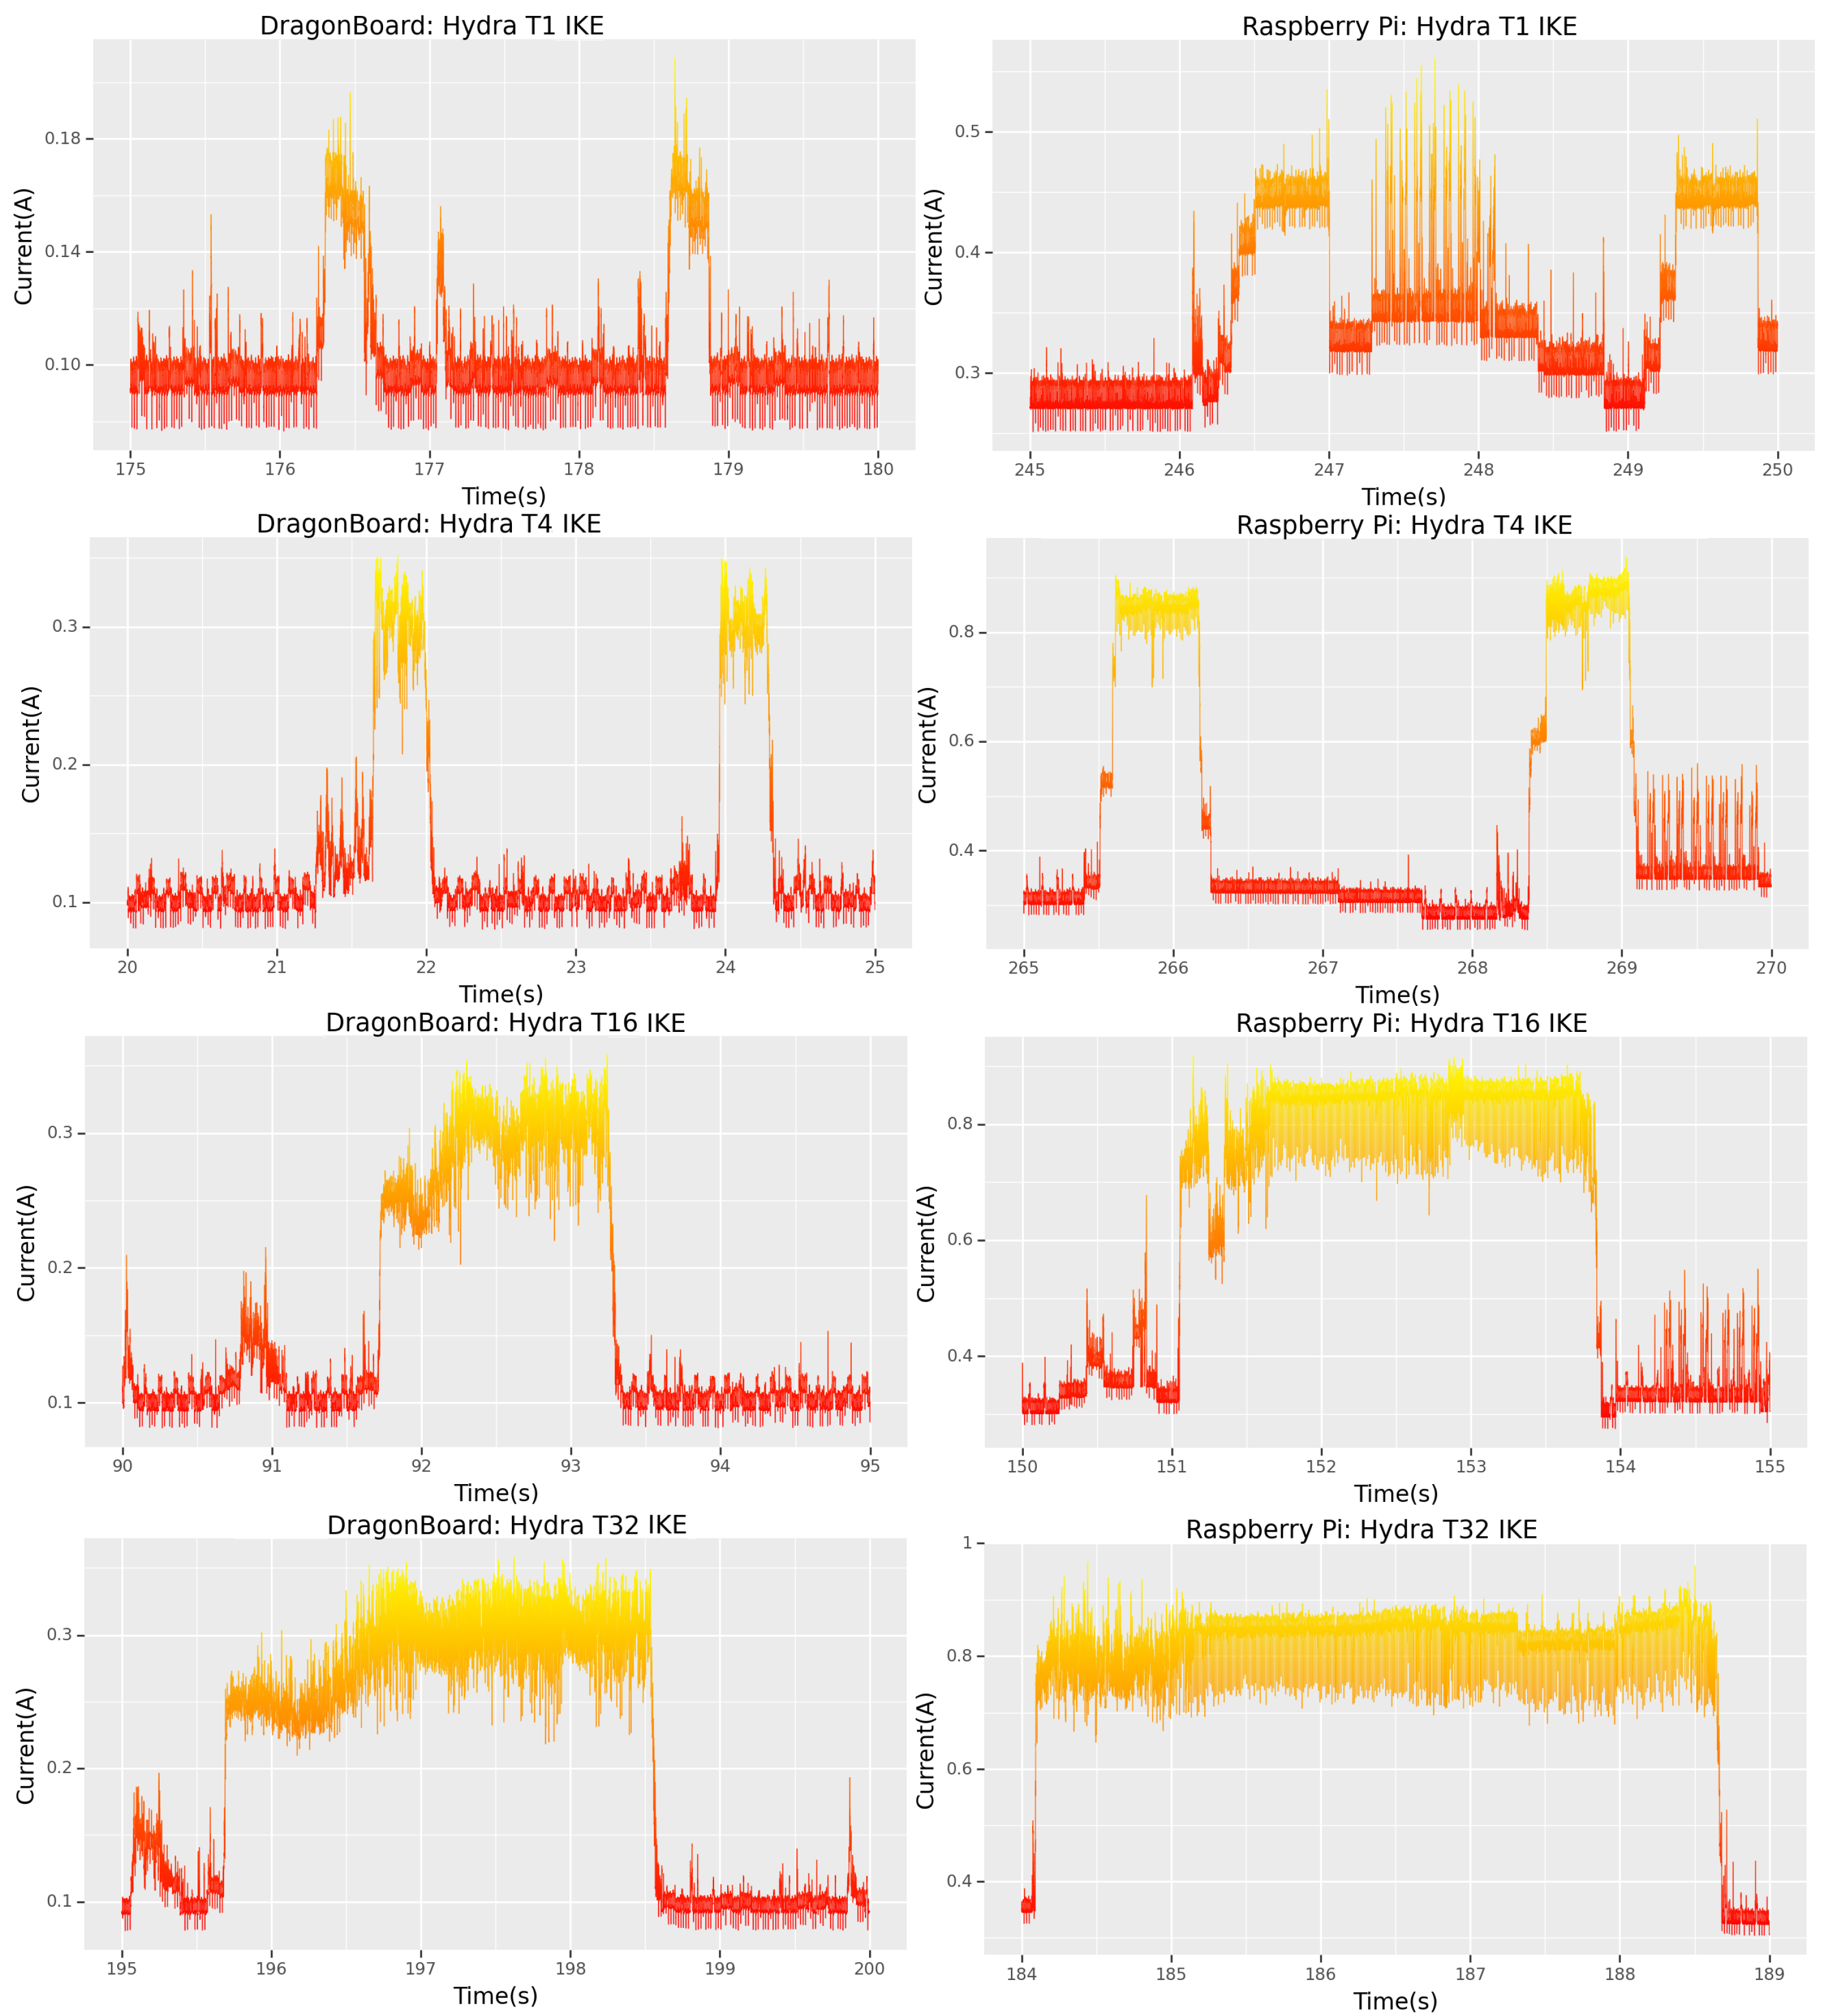
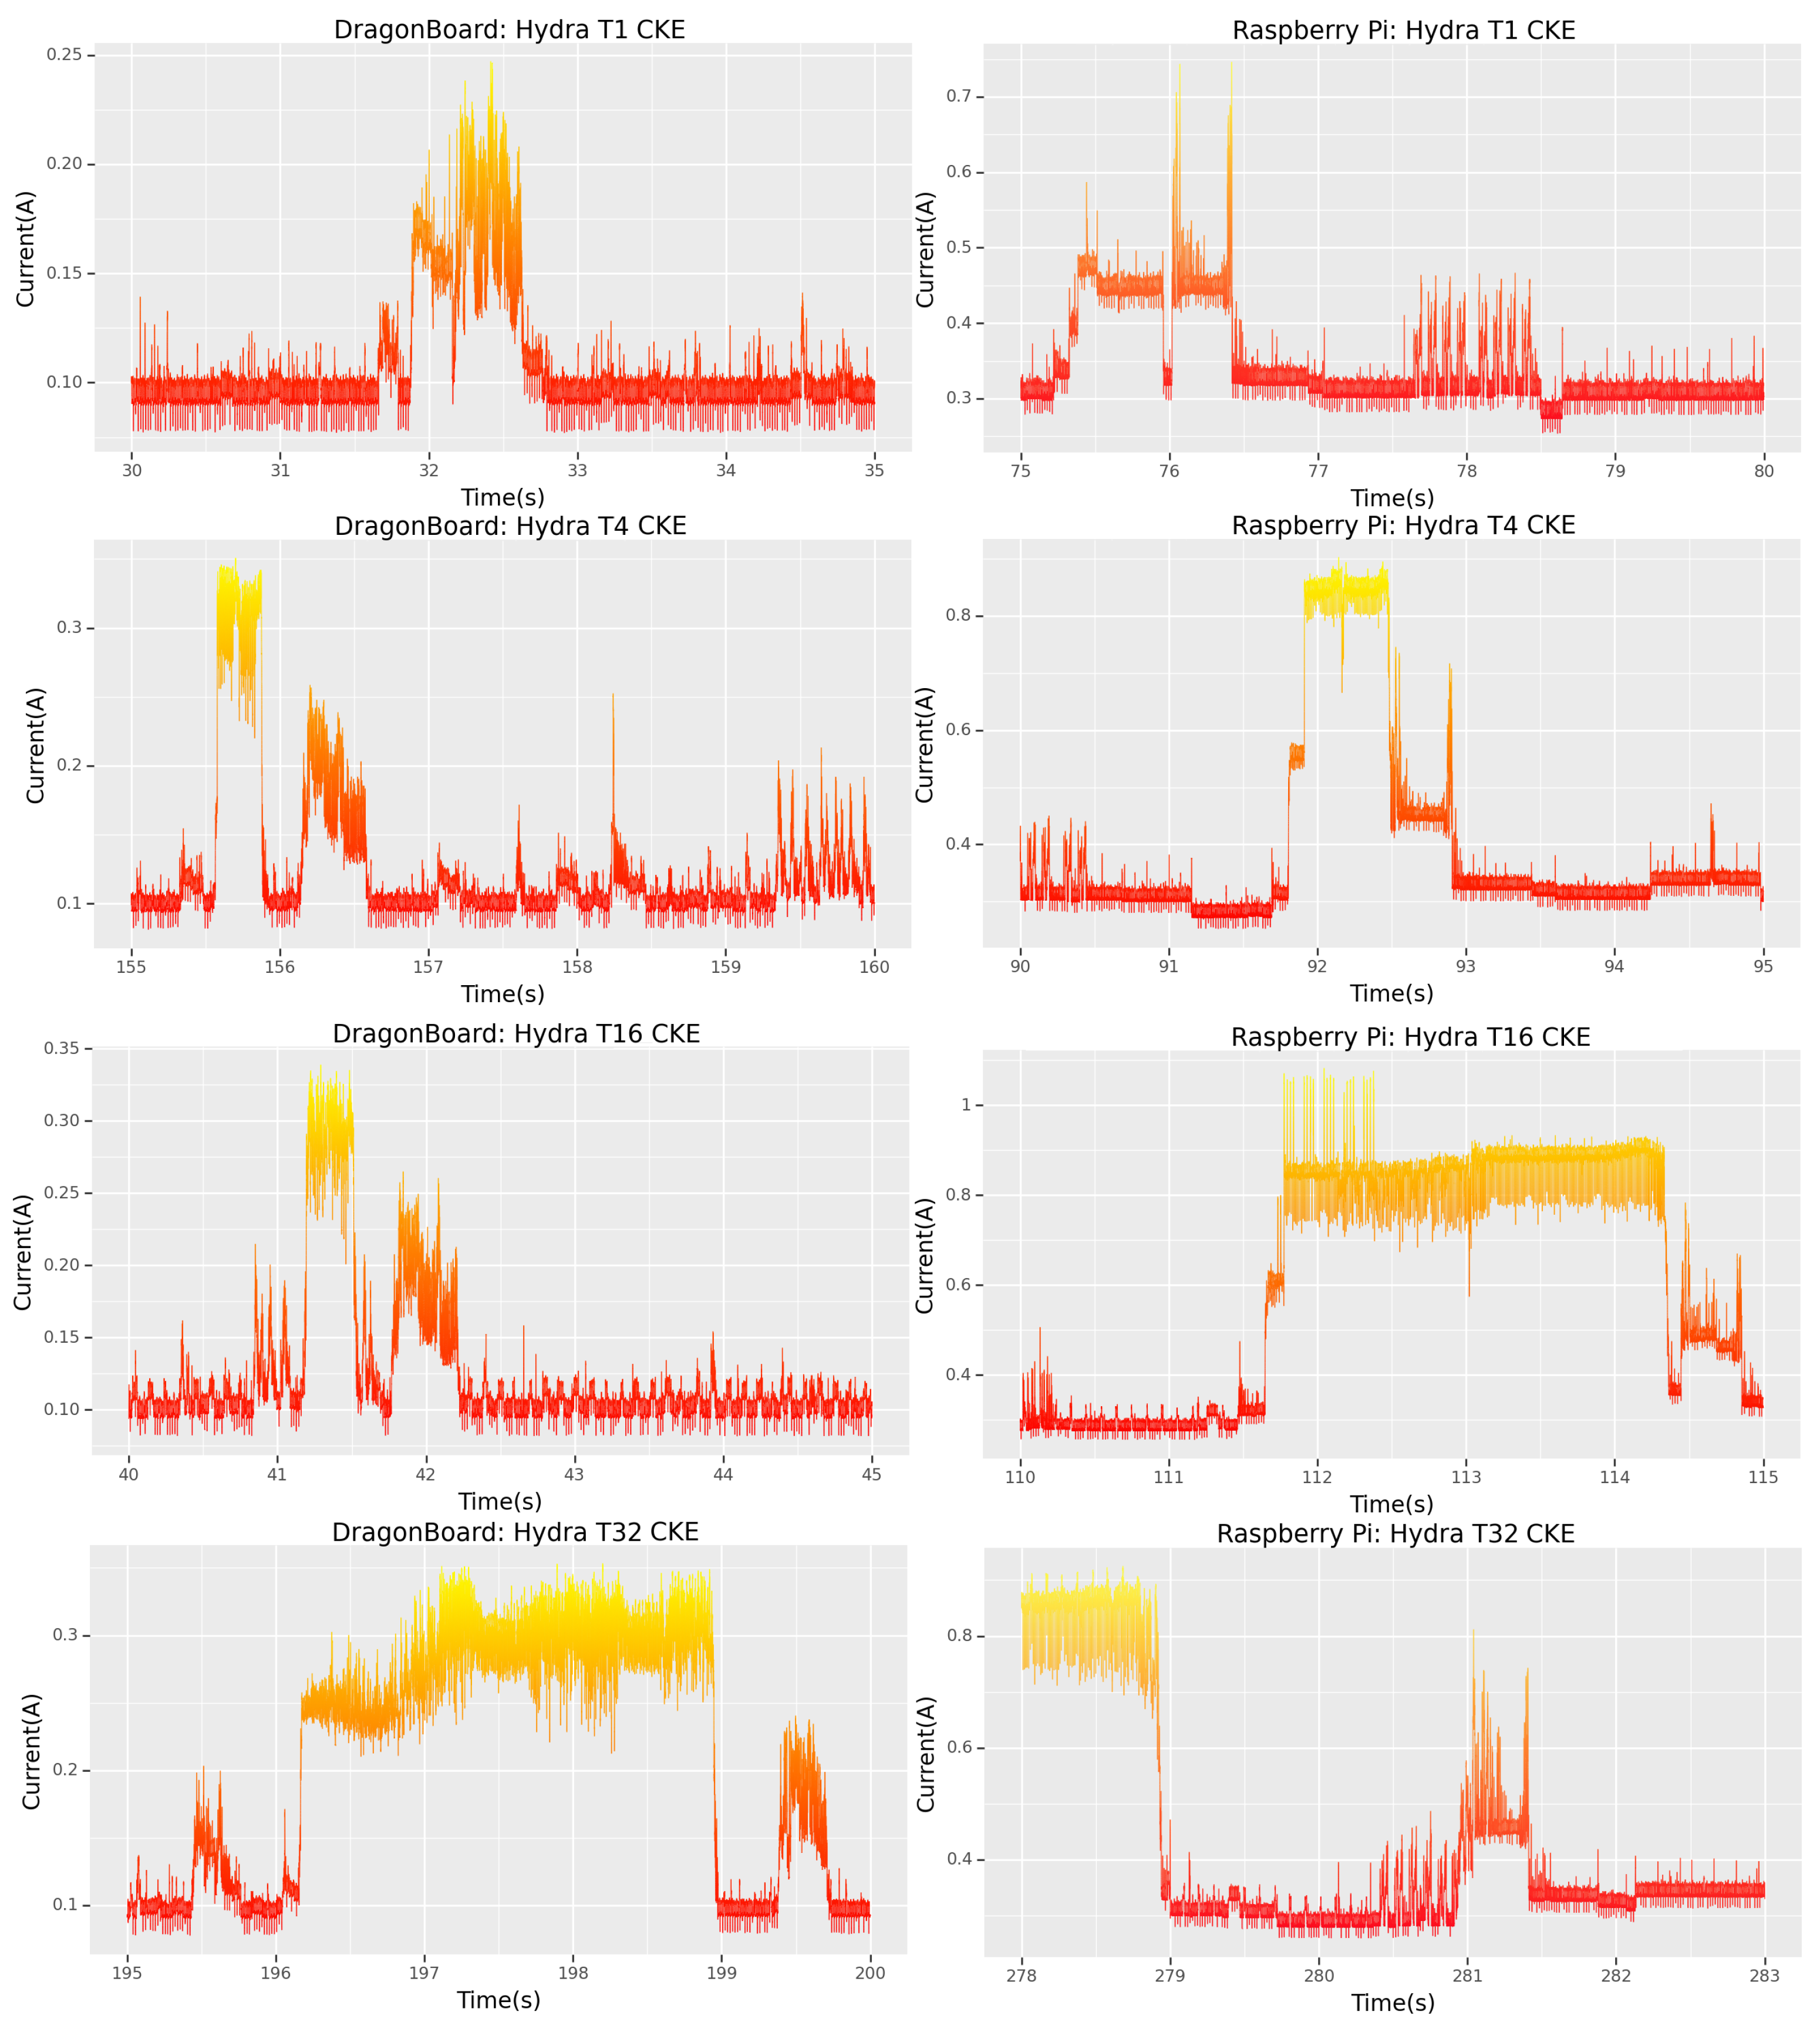
However, very different signatures are visible between the Dragonboard and the Raspberry Pi. Studying the start of each SSH attack (
Figure 9) gives a clearer picture of what occurs in each case. By cross-referencing
Figure 9 with
Figure 4, it is clear that the Dragonboard has been subjected to setting “t16” on Hydra, while the Raspberry Pi was attacked with only “t4”, hence the more significant initial signature for the DragonBoard.
By working backwards, in a method which is similar to reverse engineering, a forensics team can perform many iterations of the same attack type with different settings and, by matching the signatures they obtained with those from the attack, infer with a high degree of certainty not only the attack type but possibly even the settings of the tool the attacker used.
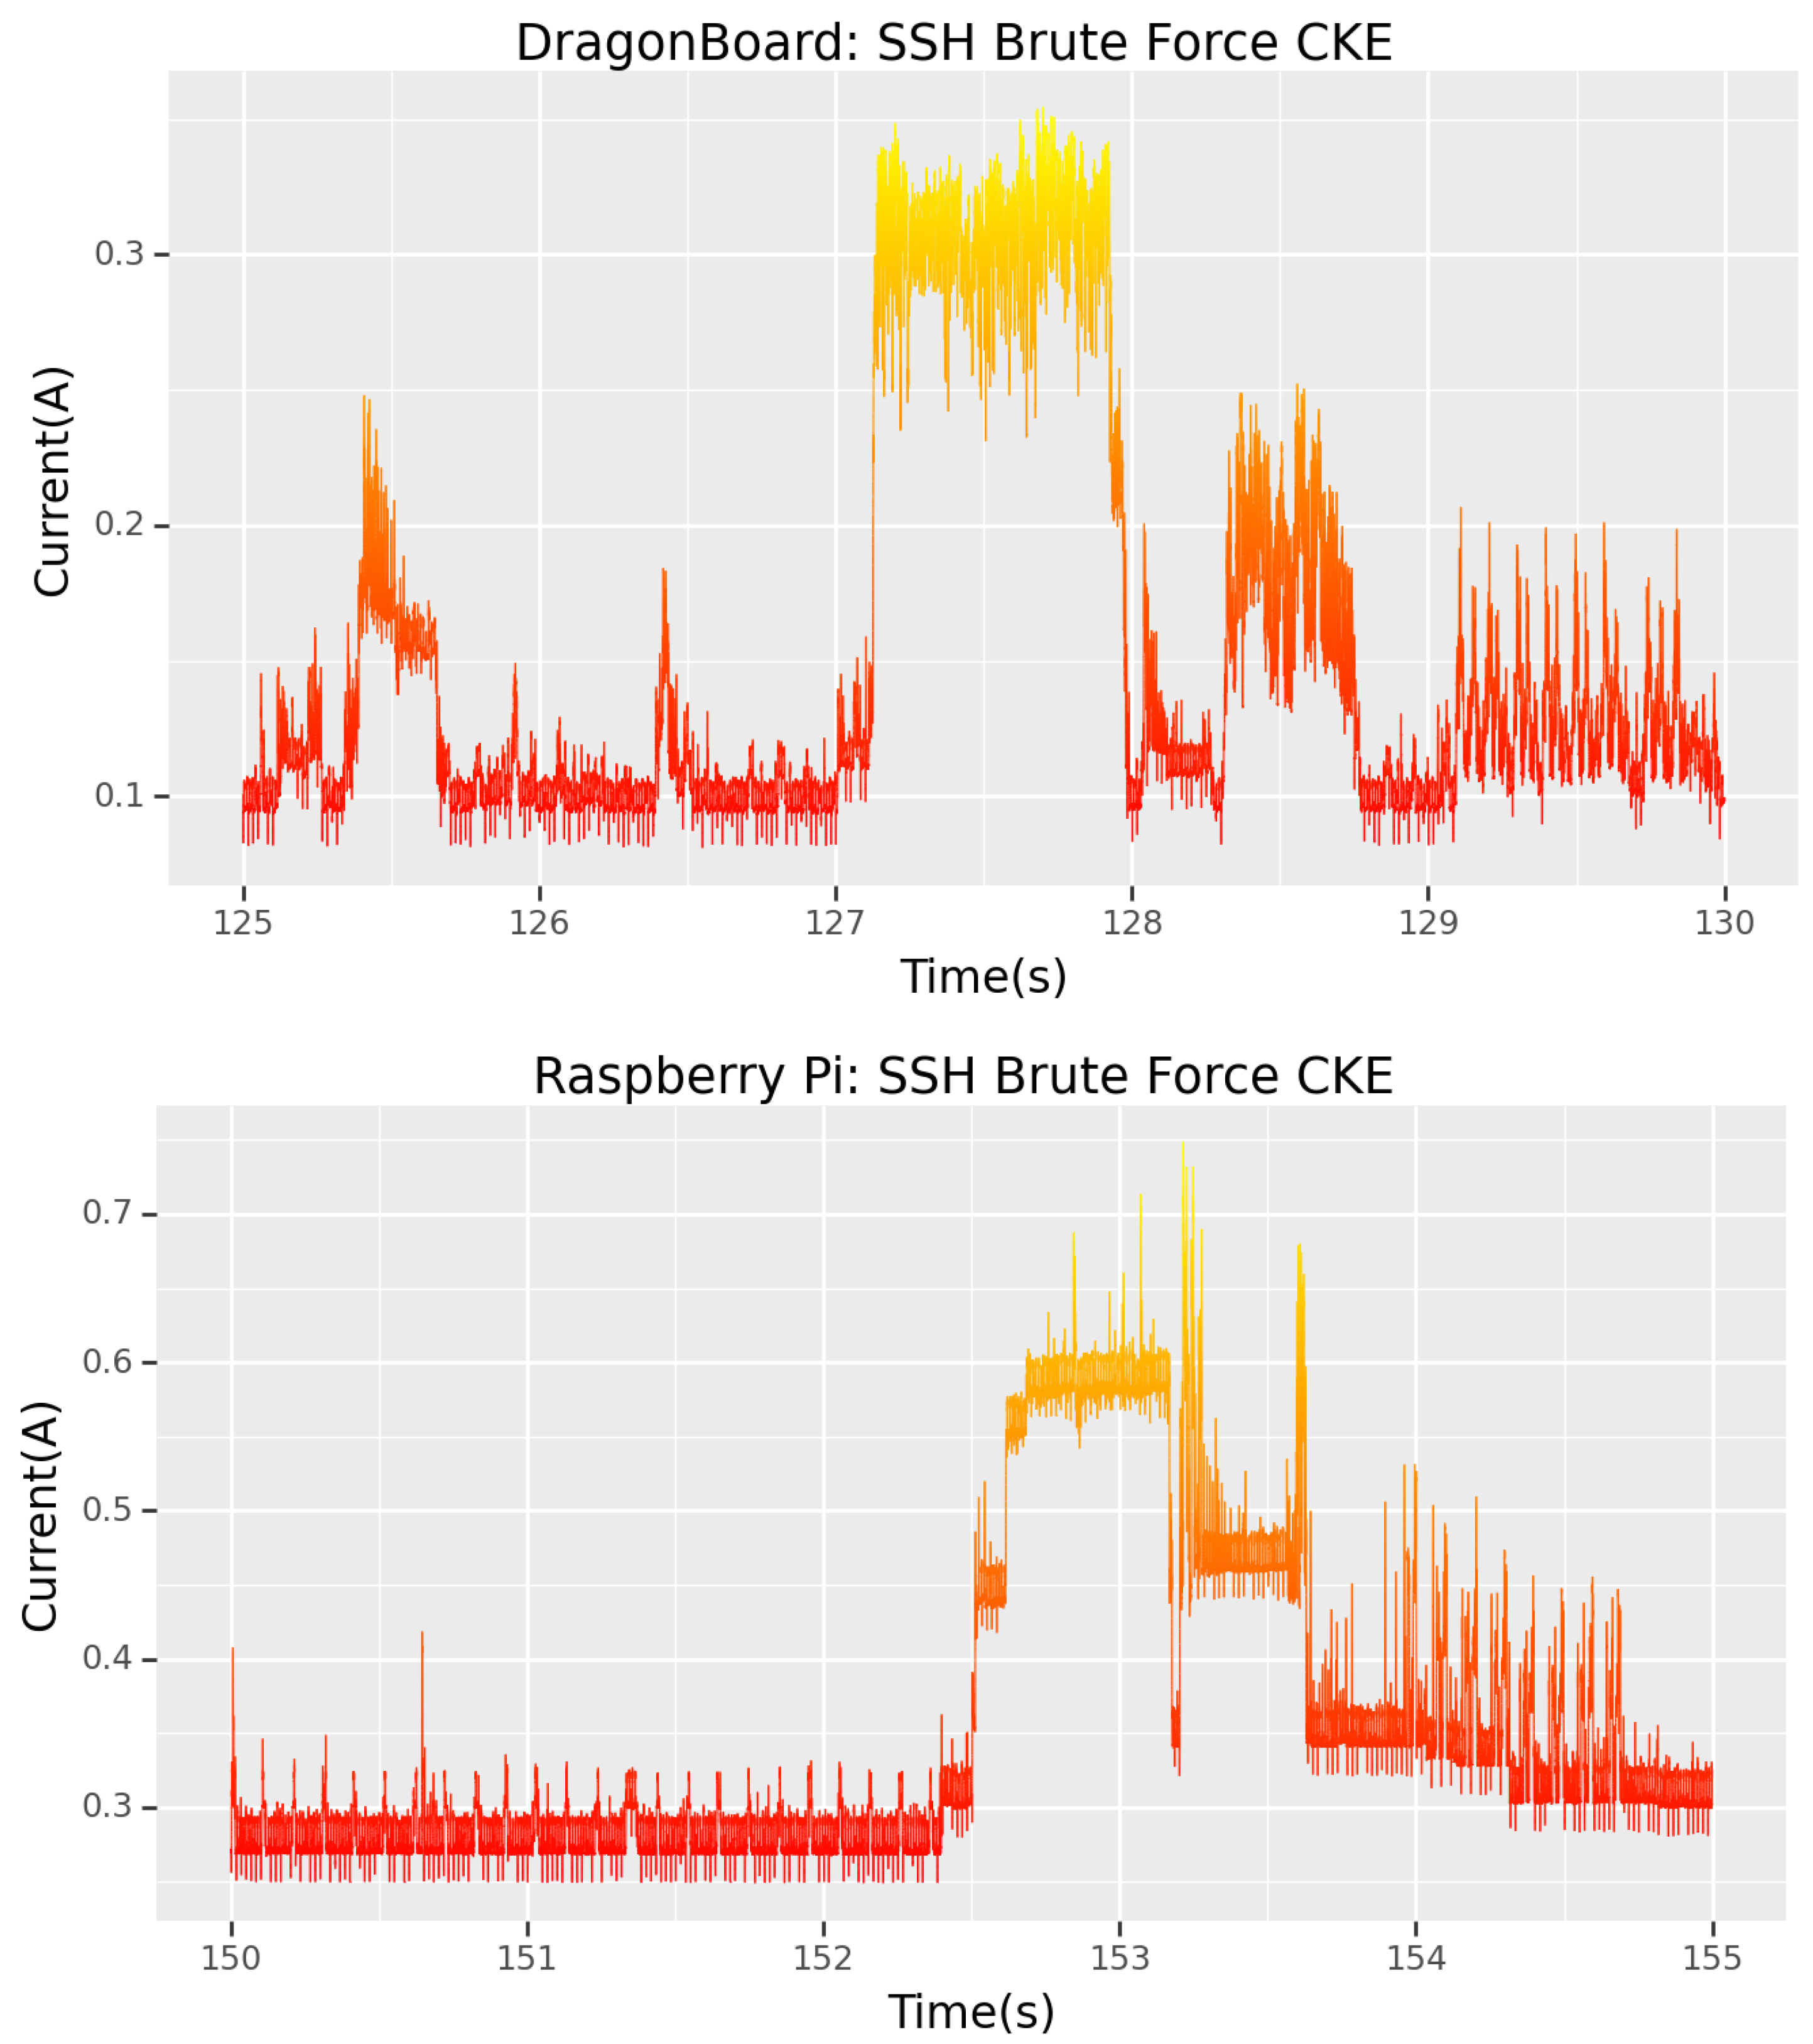
In both cases, the CKE is visible in
Figure 10 and matches all the expected signatures found in
Section 4.2. This is precious information, as now any forensics team dealing with a scenario such as this one can tell, with considerable accuracy, to the nearest millisecond, when the password for their device was cracked.
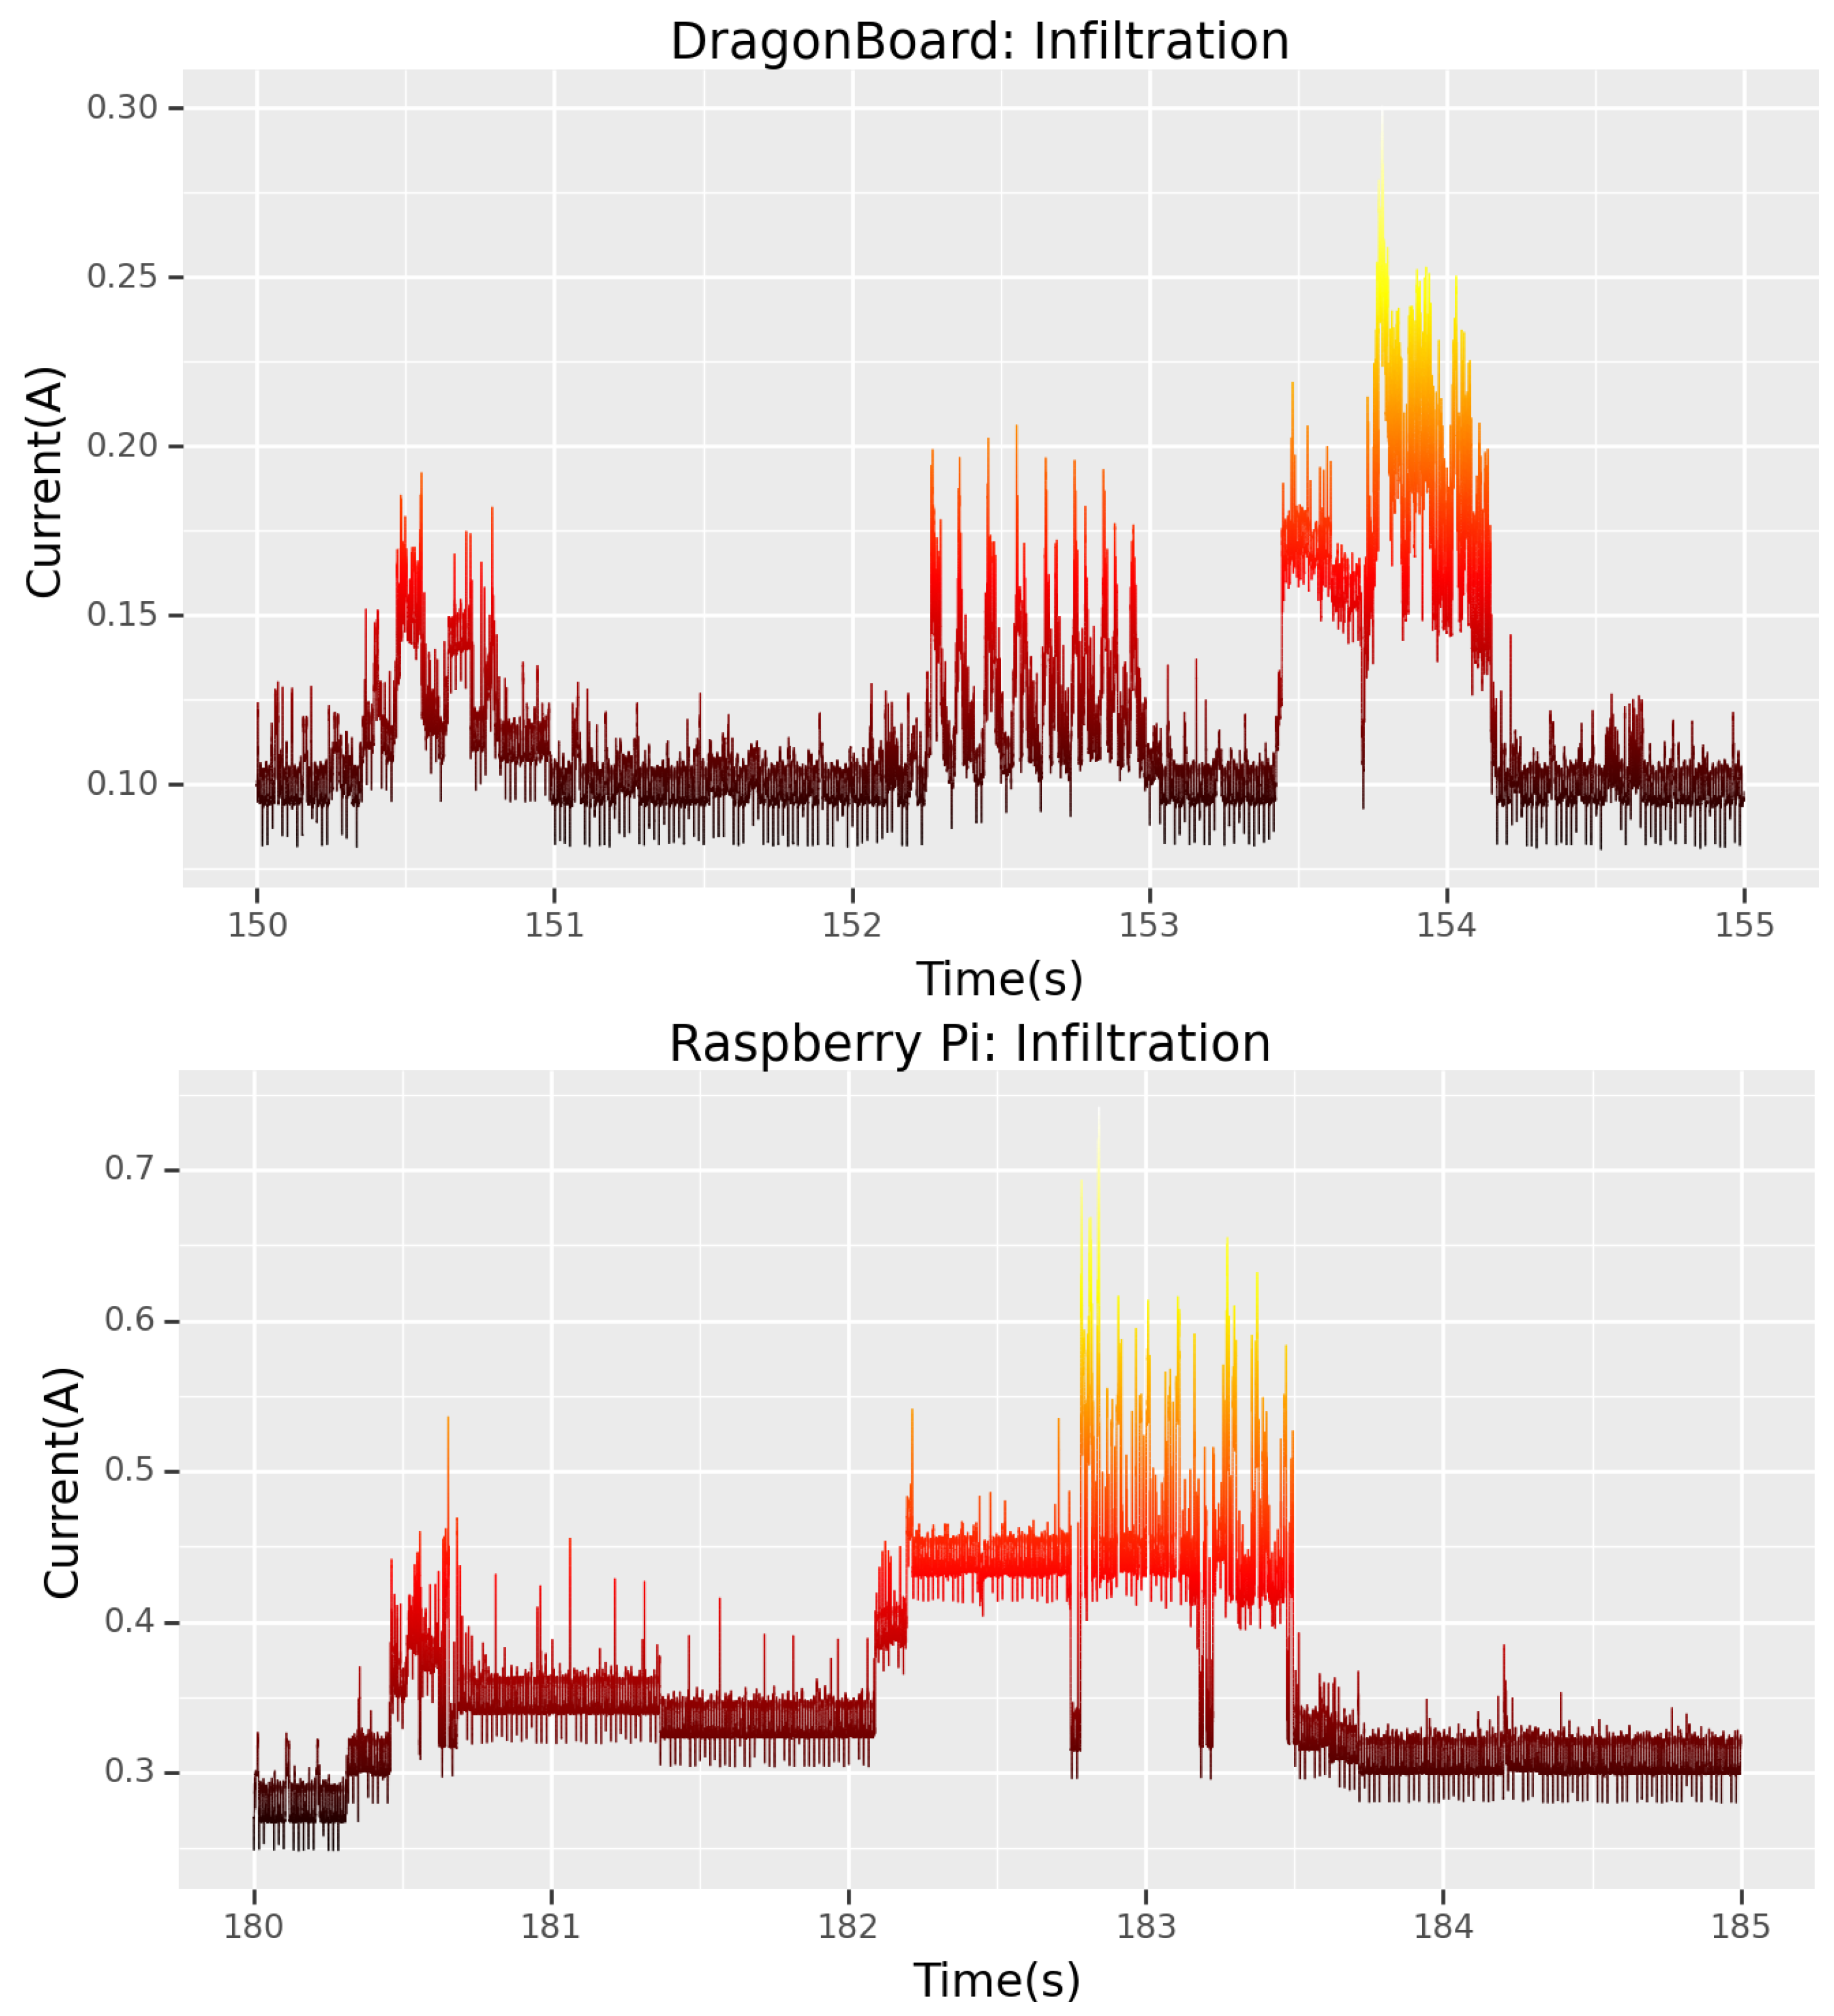
5.3. Infiltration
After the SSH password is cracked, the target is infiltrated over SSH. This is a notable escalation in danger within this scenario. Now that the attacker has gained entry, they can explore the device with whatever permissions the hacked account has. If the compromised account has admin or “sudo” permissions, this can lead to catastrophic consequences as the attacker will have unhindered access and ability. Even with a regular user account, the attacker can perform a “privilege-escalation attack” to temporarily, or permanently, gain admin permissions. This can lead to the total destruction of the confidentiality, integrity and availability of this device and, possibly, many or all devices on this network which share the same admin password. As the attacker has compromised the admin account in the case of this testbed, they will not need to perform a privilege-escalation attack.
Interestingly, the signature in
Figure 11 is an exact match for that of the SSH Brute force “t1” CKE of each board. The signature for “t1” in
Figure 5 shows one final password attempt and the response to it being the correct password, the CKE. This gives a much clearer insight into the operation of the password-cracking tool used against the device.
Of course, looking at the code for Hydra, the tool’s operation will be transparent; however, understanding this functionality without looking at the code but, rather, studying its side-channel power data is very valuable. By making such observations, forensics teams can ascertain the inner workings of the tools used to attack their device.
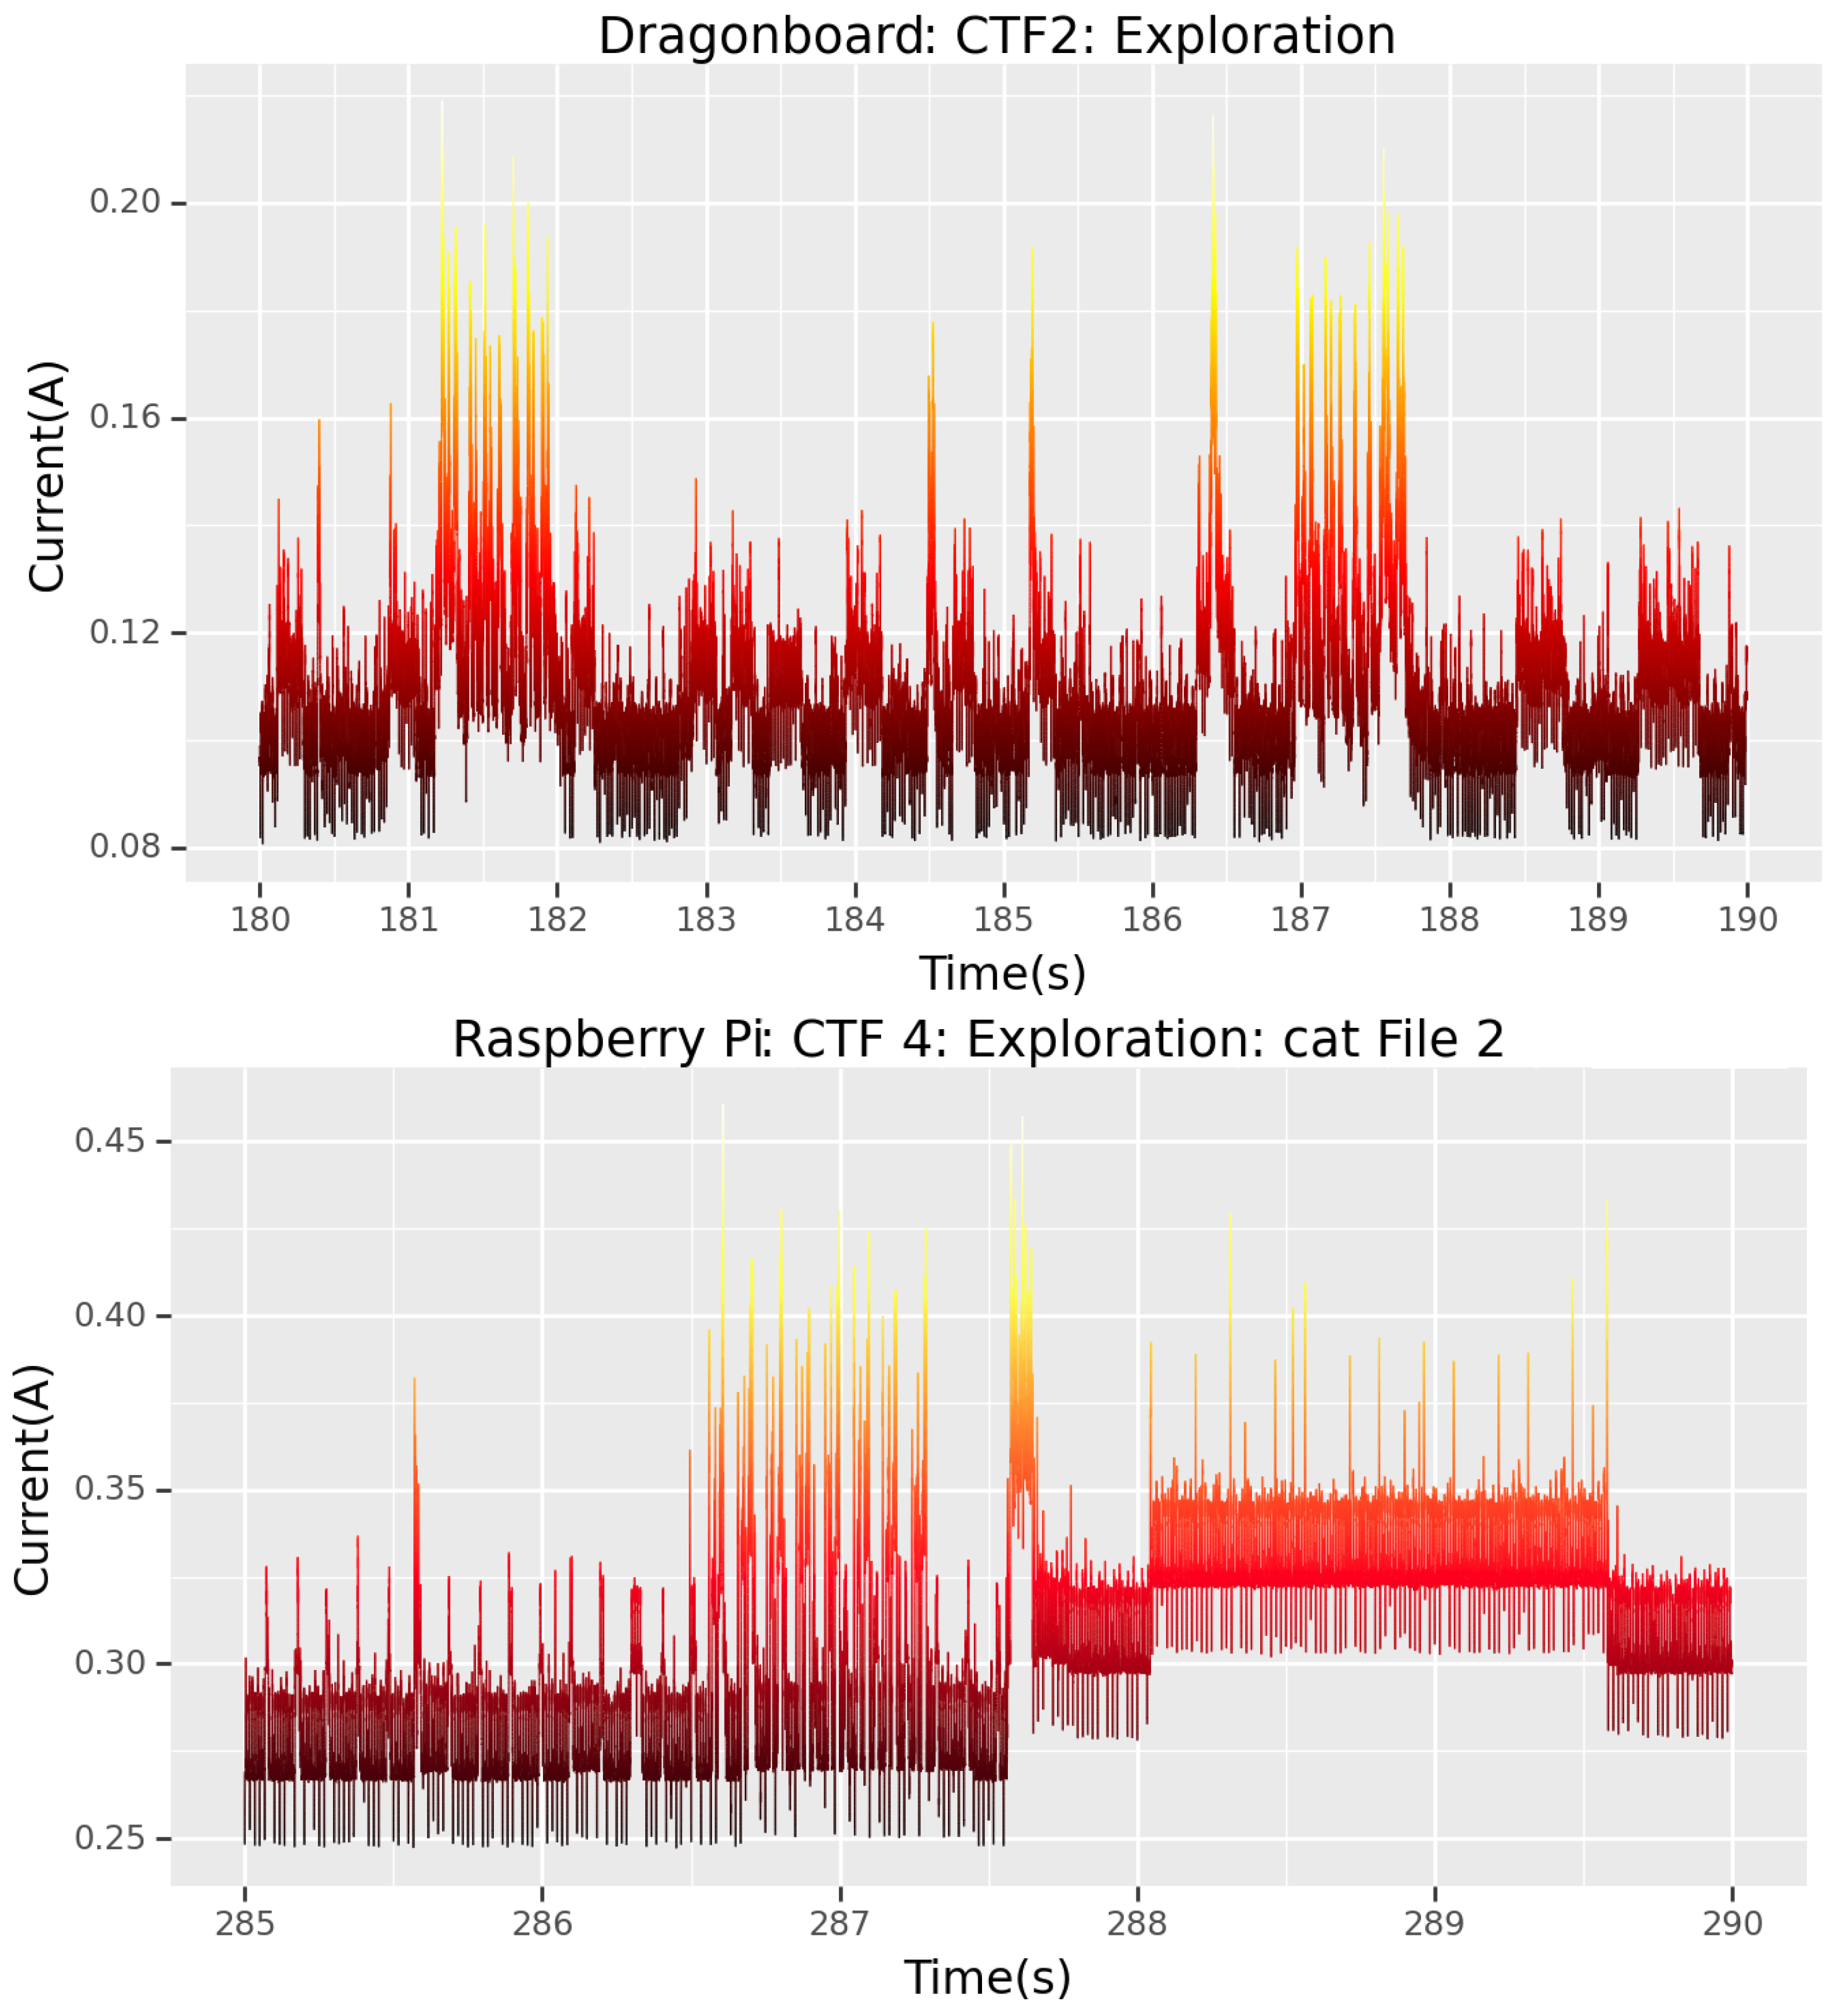
5.4. Exploration
After the target is infiltrated, it is explored so that the attacker can find directories and files of interest. An attacker will also check what permissions they and other users have on this device. If they do not have valid admin permissions, they will check for any out-of-date or unsafe software and services on the device. If found, they can then exploit these vulnerabilities in what is known as a “privilege-escalation” attack. This attack can take a standard user account with no permissions and temporarily or permanently give that account admin control. To this end, it is essential that only essential software is installed on IoT devices. In the case of this CTF scenario, the attacker has already obtained an admin account; thus, there is no need for a privilege-escalation attempt.
The exploration of the device causes a significant disruption to normal behaviour.
Figure 12 shows a massive perturbation of the normal behaviour for both boards. In the case of the Raspberry Pi, the attacker can be seen in
Figure 12 to use the “CAT” tool to open and read a file on the target system. For the Dragonboard, the attacker is simply exploring the directories of the target device in an attempt to find the secret file for which they are searching.
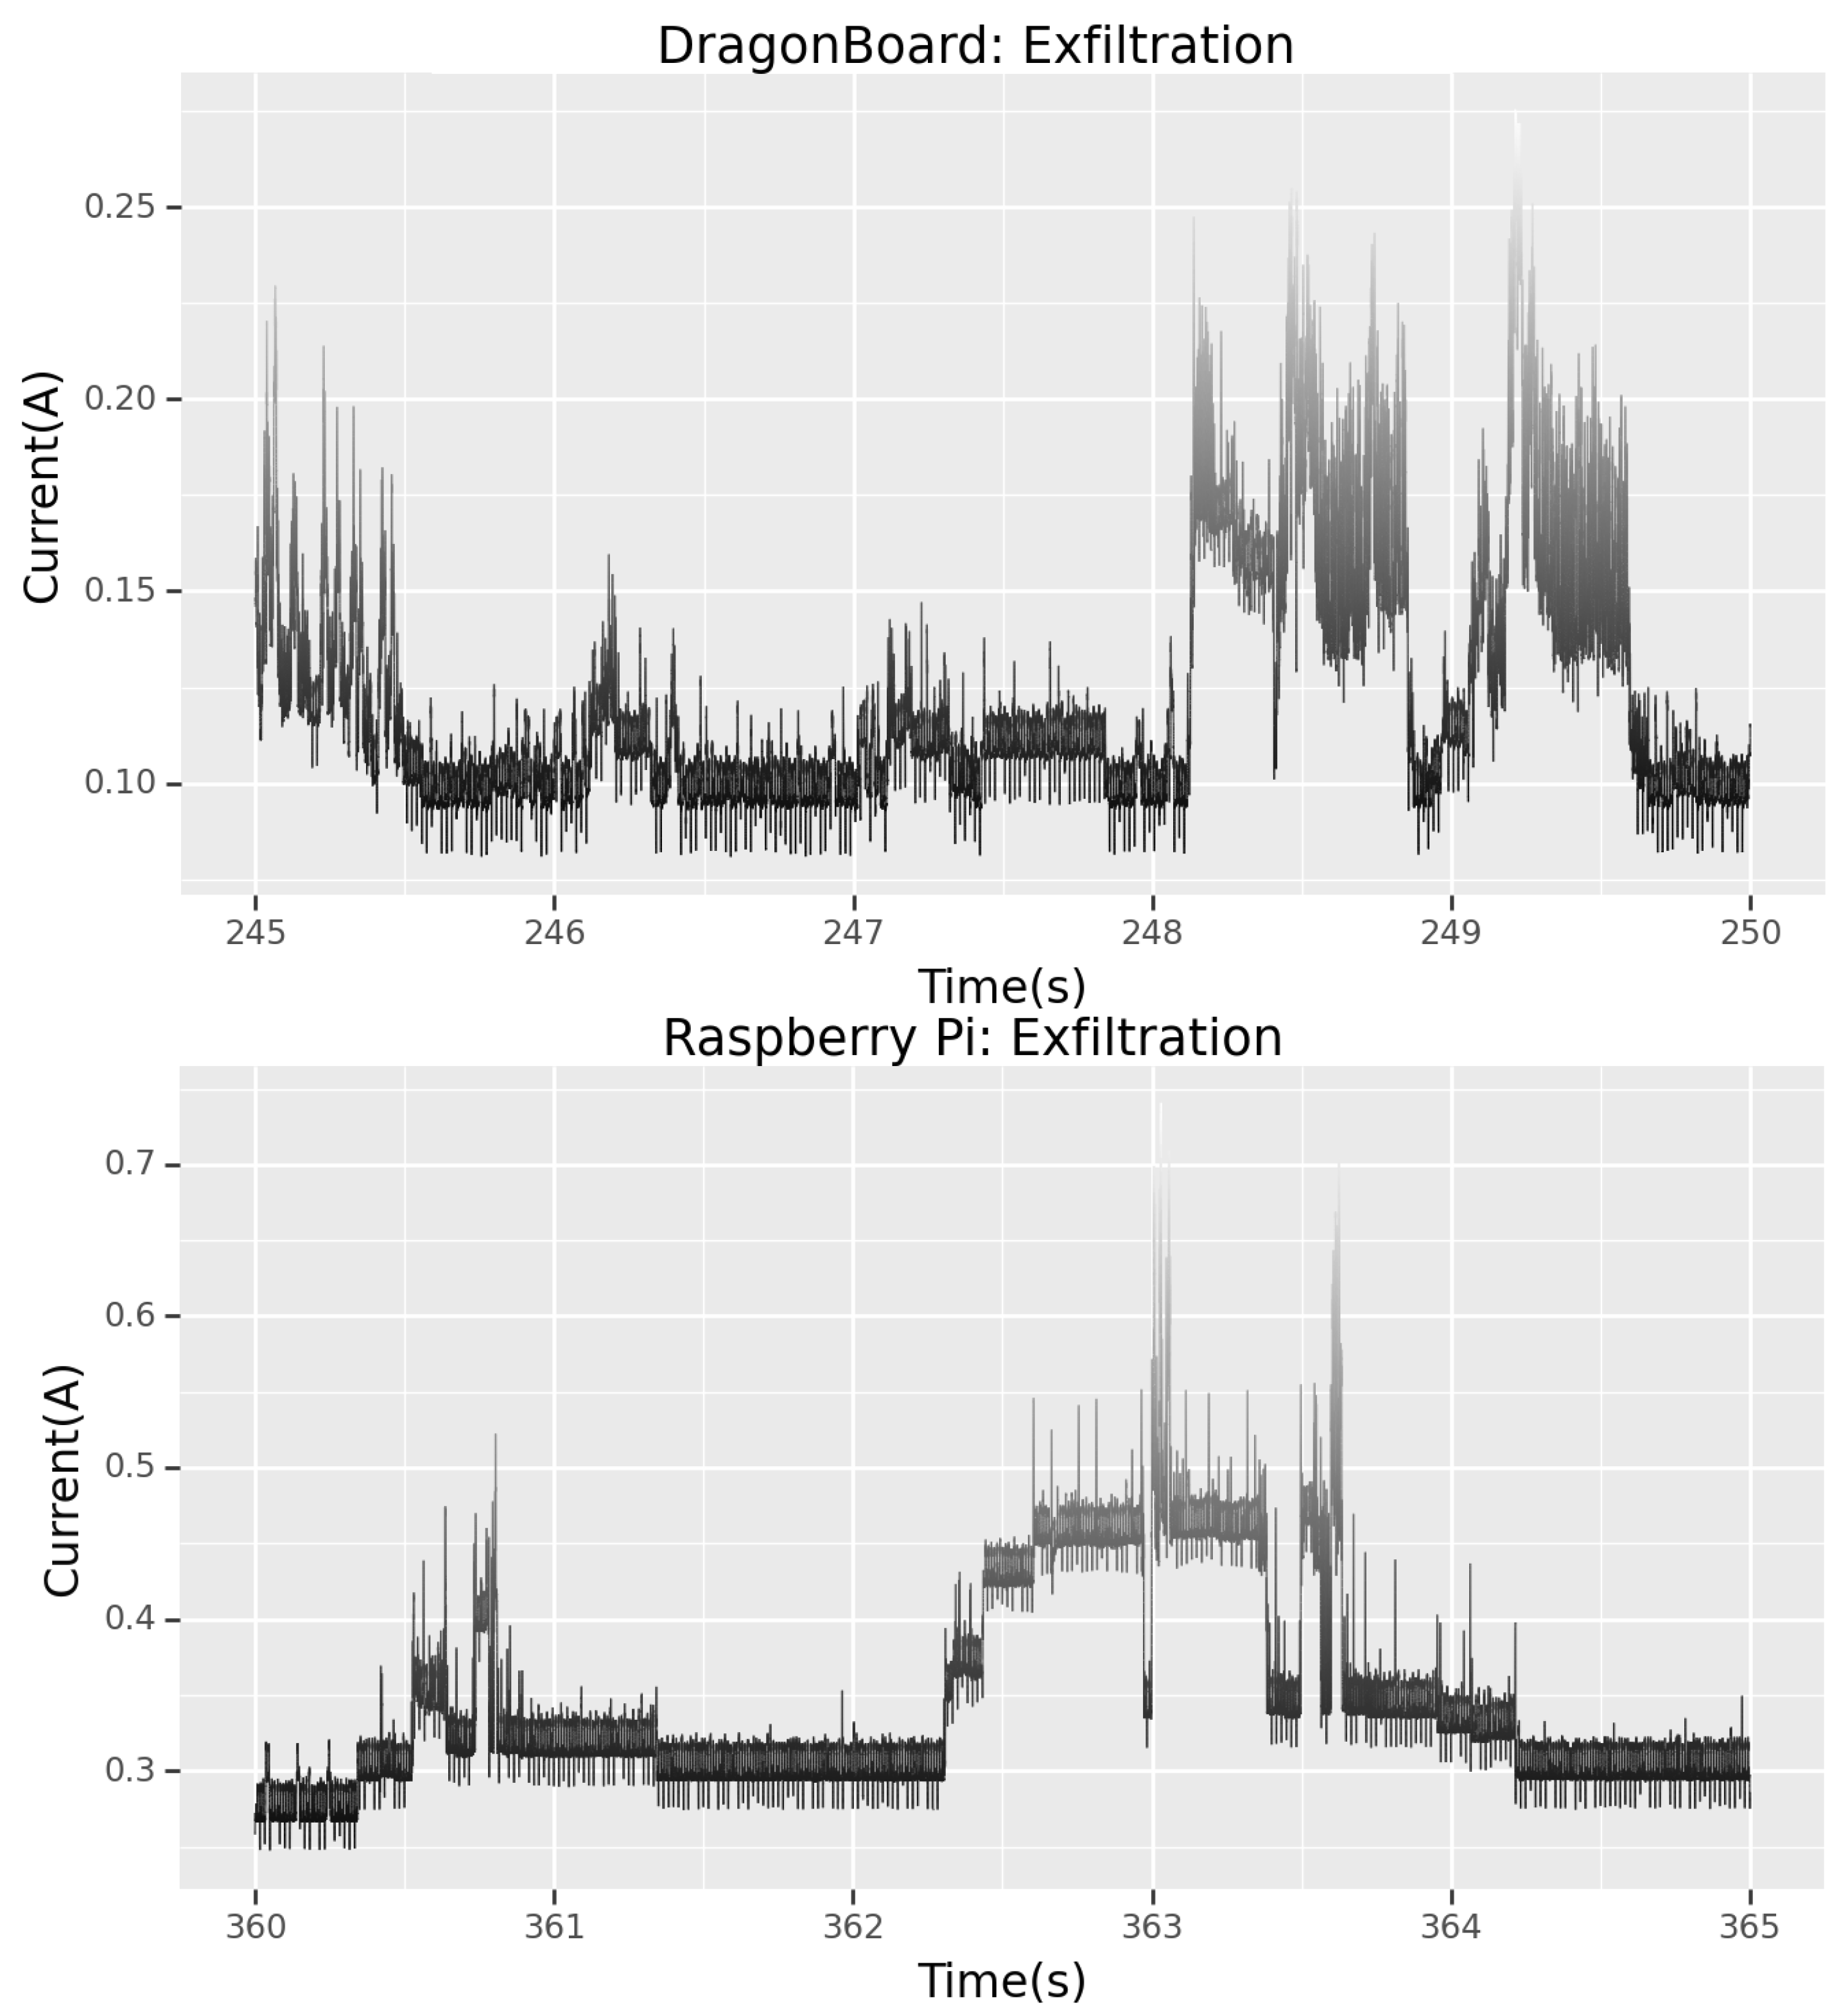
5.5. Exfiltration
The most critical part of this CTF scenario is the exfiltration of confidential data from the device. Exfiltration is the transfer of information from a system without authorisation. It is the complete destruction of the confidentially of the target device. This is the worst-case scenario in this testbed and was the original goal of the attacker—to steal that specific hidden file, the “flag”. This flag, in a real-world scenario, could be personally identifying information (PII) of the device owner, a username and password file—which the attacker can try to crack later, or information on the peers to which the device is connected. It should be recognised that regardless of the data exfiltrated, this event should be regarded as being of the highest degree of severity.
Studying
Figure 13, it is clear that the tool used to copy the file over SSH is comprised partially of the SSH login event and the SSH logout event (this will be studied in the next section). Knowing the signatures of both the login and logout events, the forensics team can ascertain that a file has been taken and its size. This is possible by studying the extra power signatures between the login and logout events, which correspond to the file itself being copied remotely. As well as this, by studying these signatures, the forensics team would be able to infer that the tool “SCP” [
56] or “secure copy”, which is used to copy files over SSH, was used.
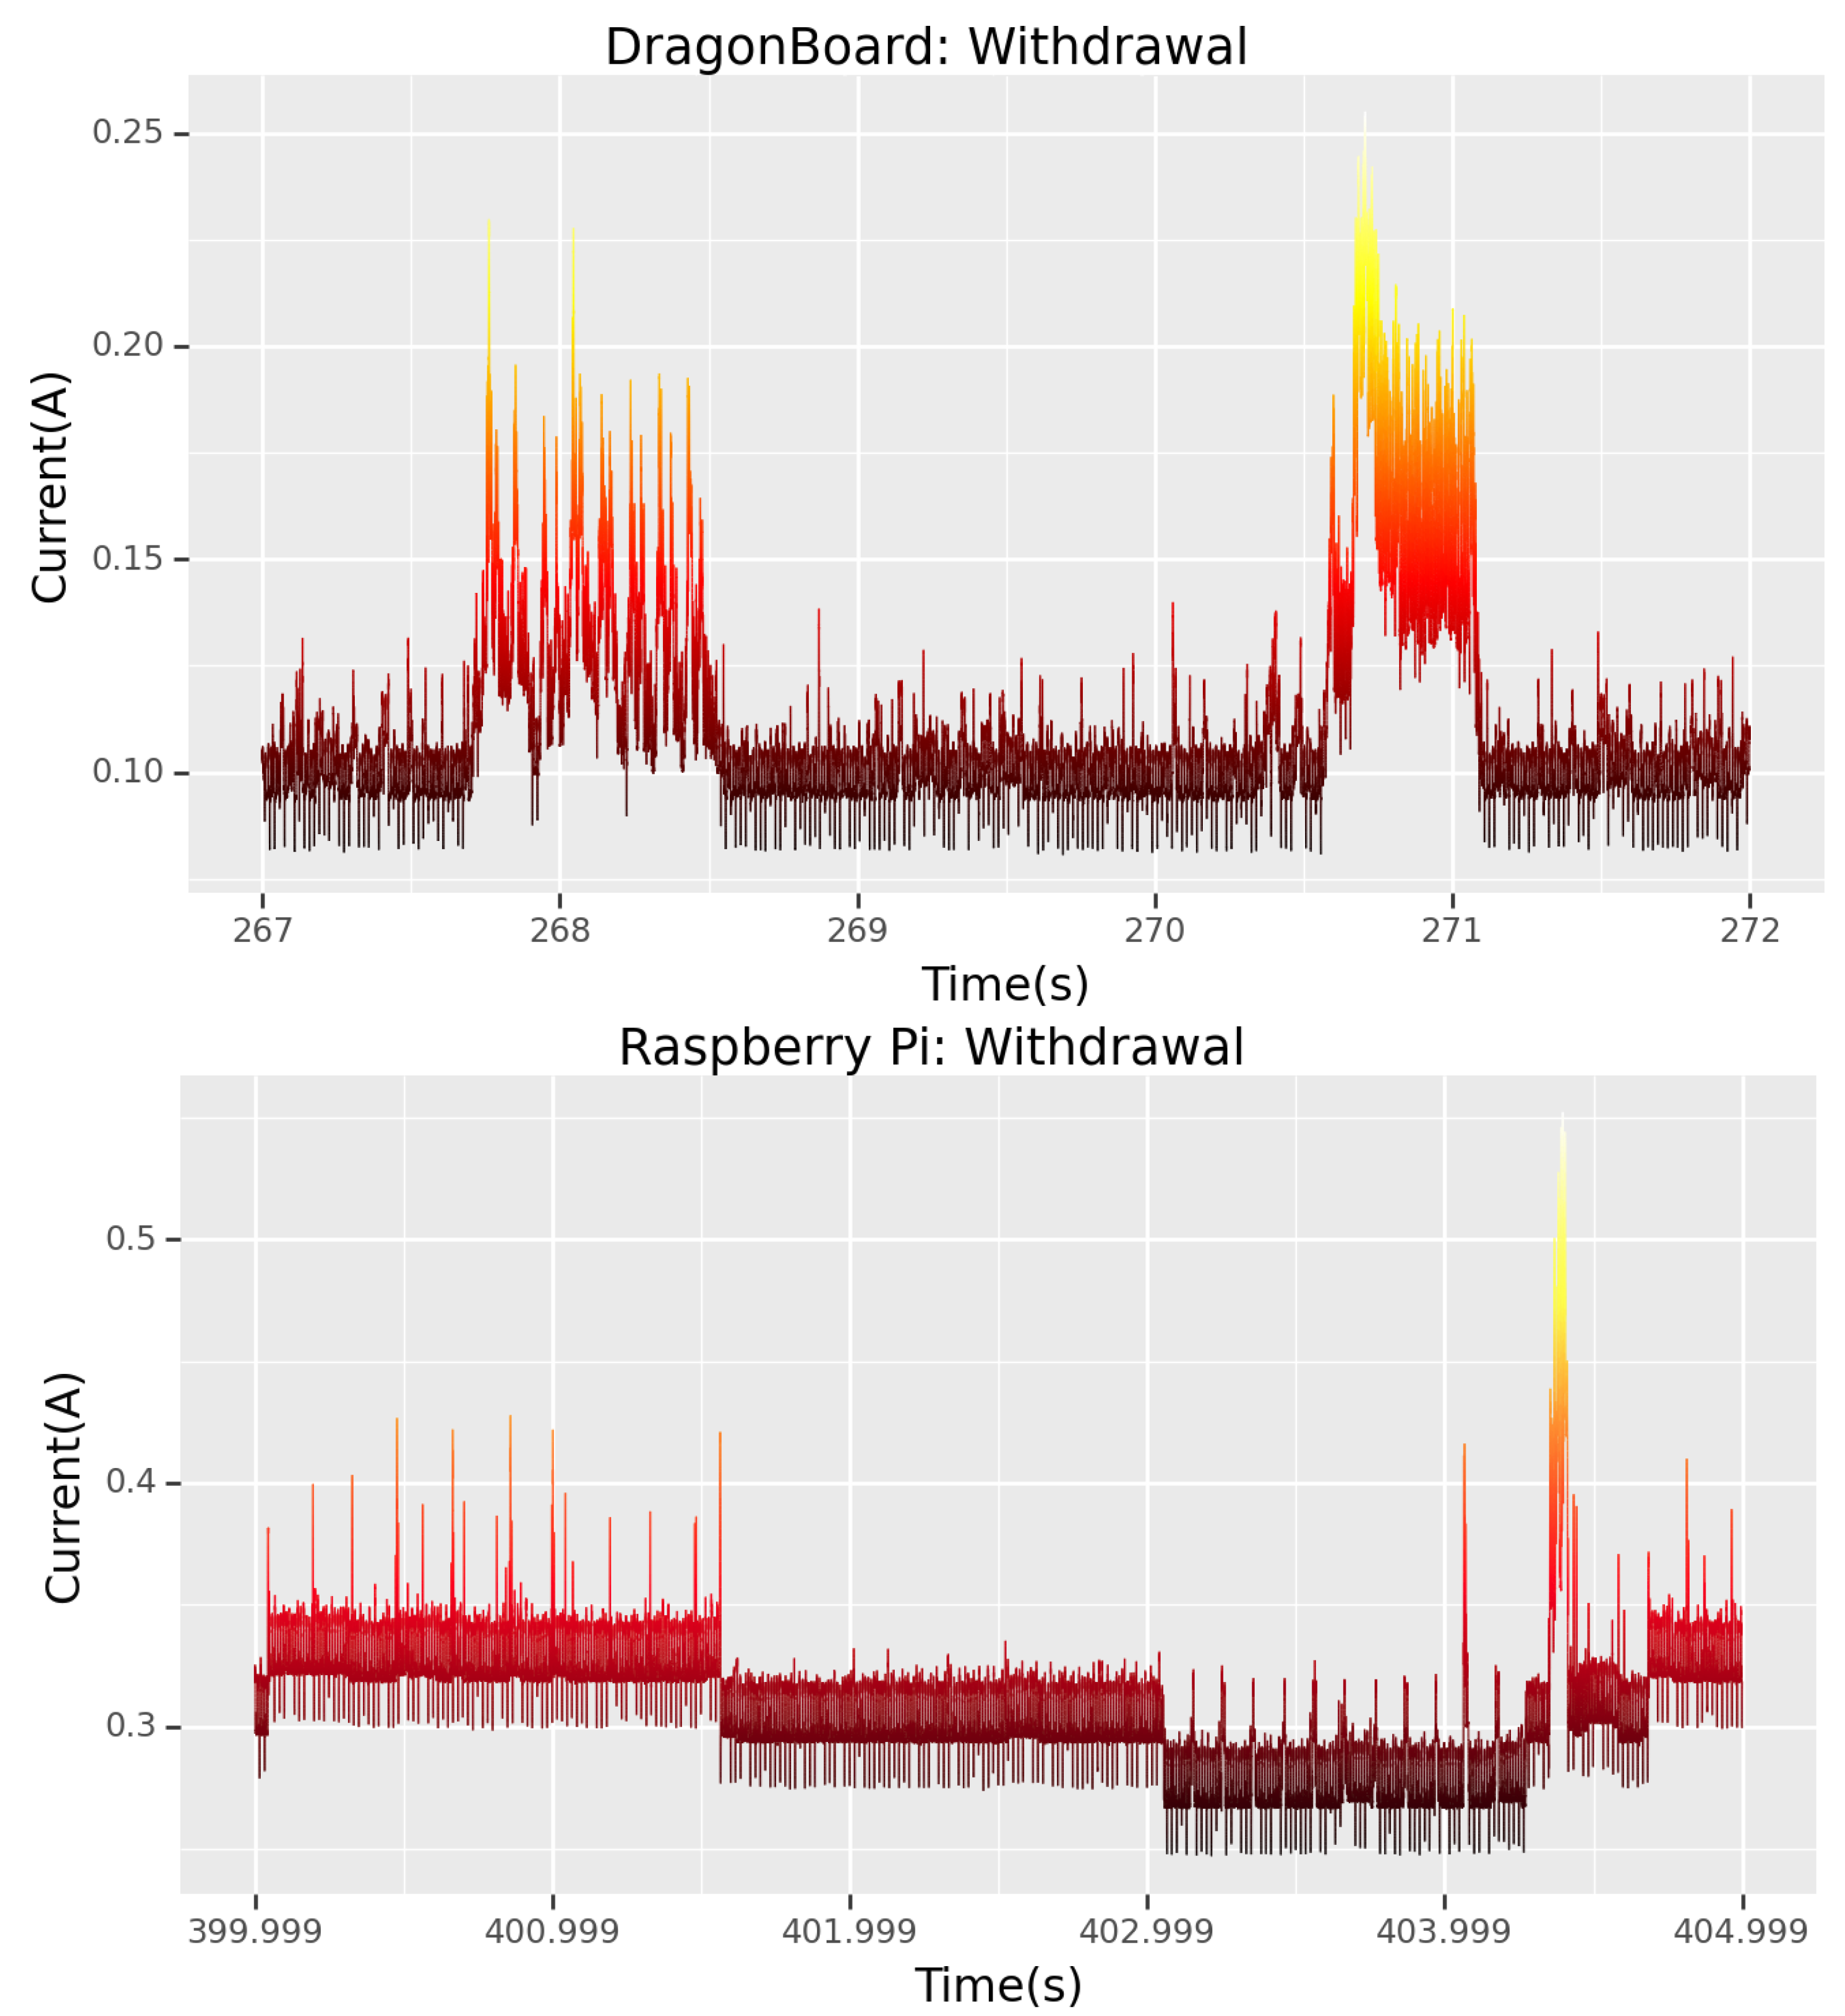
5.6. Withdrawal
After the attacker has completed their tasks, they close up communications over SSH. If they remained connected, this would expose them during any investigations, or their continued presence might alert users to their attack. Other than simply logging out, while it does not occur in this CTF scenario, the attacker can try to erase their presence by deleting or amending log files. This would be an attack on the integrity of the device. Studying
Figure 14, and refering back to the exfiltration signature, it is evident that the exfiltration signature comprises a login event, followed by a logout event. This means that the exfiltrated file’s signature will be the extra power signature in between.
6. Discussions
It is essential to consider the detection of the attacks featured in this study from the perspective of signature-based and anomaly-based machine-learning approaches. This study mainly discourages using signature-based methodologies using the side-channel power data for a core reason: the availability of the attacks’ signatures and the required quantity. To train a signature-based machine-learning model to classify if a segment is normal or anomalous, sufficient examples of the signatures of each attack would be necessary. If there is one key takeaway from this study, it is that each attack type has a vastly different signature from any other, and each attack itself has a signature which mutates greatly depending on the settings of the tool used to perform the attack. This means that a team hoping to develop a signature-based classifier for their device must obtain many signature examples for each attack and the many settings possible on the tool. This does not even consider that many different tools can perform the same attacks, all of which may have slightly different signatures. These factors make developing a fit-for-purpose signature-based model far too challenging to achieve using side-channel power data.
This is different for anomaly-detection-based machine-learning approaches, however. While clear signatures for both normal and attack classes are required for signature-based methodologies, only a clear signature for normal behaviour is necessary for anomaly-based approaches. These approaches tend to be either semi-supervised, with one labelled normal class, or completely unsupervised, with no labelled classes, and use their logic to cluster the data into the classes they perceive. This study demonstrates that a semi-supervised approach, which leverages the natural abundance of normal data, would be the most effective way to build an automated detector for these attacks. Recent studies such as [
57] demonstrate the effectiveness of semi-supervised methodologies such as Bagging-Random Miners (BRM), One-Class K-means with Randomly projected features Algorithms (OCKRA), Isolation Forests (ISOF), and One-Class Support Vector Machines (ocSVM) on the task of anomaly detection. Another approach, [
58], utilises unsupervised autoencoders and Gaussian mixture models (GMM) for anomaly detection for network security. As such, an IDS framework which uses a semi-supervised approach such as one of these would be most appropriate for IoT intrusion detection. Semi-supervised methods rely not on the anomaly class for training but on the normal class. Normal data is easily obtained; the more normal examples obtained, the better the model. In this way, a model trained only on normal data can determine if a segment is anomalous simply by the deviations it perceives from the normal behaviour.
While this study discourages using the raw side-channel power signatures of the attacks for signature-based approaches to intrusion detection, it encourages the study of these signatures. Understanding what these attacks look like in specific devices’ power data is immensely valuable. This information can be used to educate those in the security sector and influence the design and manufacture of IoT devices. Without a complete understanding of an attack and what it looks like from “all angles”, it is impossible to protect against it. A broader understanding of these signatures is also essential from the perspective of reverse engineering attacks. If forensics teams are able to more accurately ascertain what happened during an event, they can better approach protecting against further attacks.
It is crucial to consider far simpler approaches than machine learning to detect these attacks. Deploying a machine-learning approach is not appropriate in every scenario. The resources needed to train and deploy such a model are absent in many settings, especially for IoT devices. While some devices can host a machine-learning-based intrusion-detection system, such as the Raspberry Pi, for instance, excess power usage cannot be allowed for most IoT devices. This means these models must be implemented on IoT gateways instead, with the devices communicating their monitored side-channel data to the gateway for inference.
At a minimum, simple approaches to detecting these attacks must be deployed. With a clear normal class, simple techniques such as thresholds on the side-channel current draw can effectively detect an intrusion from the excess current draw over normal behaviour. If the normal class tends to infrequently surpass this threshold, simply having another threshold on the number of times the current draw can exceed a certain amount within a period would effectively reduce false positives. Excessive false positives can pose a significant problem. Similar to how an Intrusion Prevention System (IPS) works, a fully automated IDS will halt regular operation whenever an anomaly is detected, leading to too much interruption to normal behaviour. For a semi-automated IDS, with a human in the loop, while the human can discern if it is a false positive, too many false positives will lead to an excessive workload for the human. This will likely lead them to disable the IDS entirely. When intrusions do not exceed the normal behaviour’s current draw, comparing a data segment’s average current draw with a pre-defined baseline can effectively detect anomalies. While these approaches may seem simple, even this bare minimum to detect attacks is not currently being deployed to protect IoT devices in the field. This approach could save companies USD millions in the case of an attack. Where traditional packet-based detection approaches may fail, detecting a simple spike in the power draw of a critical piece of equipment could prevent catastrophic damage.
An essential aspect of this work is its non-intrusive nature. This means that systems can be retrofitted with side-channel monitoring systems without affecting the system’s original operation.
Another key takeaway of this study is that, for most of those working in the security sector, this will be the first time they see attacks they are familiar with represented in anything other than packer captures. This study investigates a far-too-overlooked key piece of basic information which every device has, its power data. It demonstrates how security teams in the field can use side-channel power data.


