Article

Mobile Application for Real-Time Food Plan Management for Alzheimer Patients through Design-Based Research

by
Rui P. Duarte
*,†,
Carlos A. S. Cunha
and
Valter N. N. Alves
CISeD—Research Centre in Digital Services, Polytechnic of Viseu, 3504-510 Viseu, Portugal
*
Author to whom correspondence should be addressed.
Current address: Department of Informatics, School of Technology and Management, Campus de Repeses, 3504-510 Viseu, Portugal.
Future Internet 2023, 15(5), 168; https://doi.org/10.3390/fi15050168
Submission received: 3 April 2023 / Revised: 25 April 2023 / Accepted: 28 April 2023 / Published: 29 April 2023
(This article belongs to the Special Issue Mobile Health Technology)

Abstract

:
Alzheimer’s disease is a type of dementia that affects many individuals, mainly in an older age group. Over time, it leads to other diseases that affect their autonomy and independence. The quality of food ingestion is a way to mitigate the disease and preserve the patient’s well-being, which substantially impacts their health. Many existing applications for food plan management focus on the prescription of food plans but do not provide feedback to the nutritionist on the real amount of ingested calories. It makes these applications inadequate for these diseases, where monitoring and control are most important. This paper proposed the design and development of a mobile application to monitor and control the food plans of Alzheimer’s patients, focused on informal caregivers and respective patients. It allows both the realistic visualization of the food plans and users to adjust their consumption and register extra meals and water consumption. The interface design process comprises a two-level approach: the user centered design methodology that accounts for users’ needs and requirements and the user experience questionnaire to measure user satisfaction. The results show that the interface is intuitive, visually appealing, and easy to use, adjusted for users that require a particular level of understanding regarding specific subjects.

1. Introduction

Alzheimer’s disease is a neurodegenerative pathology and a type of dementia that causes, for example, the loss of nerve cells, and mainly affects older adults. The main symptoms associated with the disease are the irreversible global and progressive deterioration of cognitive functions, such as memory (which is the most predominant), language, and concentration. The initial manifestations reflect the sudden loss of memory, mainly with more recent information, the demonstration of apathy, and the effort needed to pay attention. At a more advanced stage, this memory loss accentuates. There is great spelling difficulty, urinary incontinence, and an emotional imbalance that can sometimes develop some form of aggression. Dependence usually arises at this stage. In a more precarious moment, the patient can no longer identify objects and people, even the closest ones. Their memory losses intensify significantly, and the physical and functional capacities are almost all lost [1,2]. Therefore, AD inhibits the person from performing daily activities such as cooking, driving, working and, in the most extreme cases, even moving, thus requiring external assistance through a caregiver.
AD and other types of dementia are projected to increase drastically with the aging of the population. Currently, Alzheimer’s disease affects over 5 million Americans, and it is estimated that this number will triple by 2050 [3,4]. Most individuals with neurodegenerative diseases are cared for at home by family members. A caregiver is a paid or unpaid individual who provides physical and psychological assistance and support to another with reduced abilities and autonomy. There is a typology differentiation within the concept of a caregiver, which varies from formal (FC) to informal (IC). The FC refers to someone prepared for the position, hired and paid to care for the person whose tasks are guided by health or family professionals. On the other hand, an IC is usually someone close to the person with Alzheimer’s, who may or may not be a family member. This person takes full-time responsibility for the well-being of the person taking care of the same in an unpaid way and without any contract [5,6].
The spectrum of informal care difficulties arises due to the enormous dependence of care on the caregiver. Exercising this role is a task with tribulation due to the need to guarantee the safety of others, affecting one’s relationships, professional life, intimacy, and even freedom [7]. One must refer to objective and subjective burdens to describe these negative consequences in IC. The objective refers to the difficulty caused by limitations or life changes imposed on the caregiver because of care needs, such as time reduction, financial expenses, physical exhaustion, tiredness and irritability, and relationship restrictions. On the other hand, objective overload relates to emotions resulting from the experience with care. This overload can result in physical and psychological problems with the need for medication and the consequent reduction of the immune system, thus causing problems associated with cardiovascular diseases or even depression [6,7,8].
ICs prefer to communicate through mobile applications. mHealth is not only more affordable than face-to-face and web-based interventions but is also more accessible for informal caregivers [9,10]. Several studies [11,12,13] have demonstrated the positive impact of apps on the self-management of chronic diseases. However, apps to improve the quality of life of IC are still few. Most focus on improving the health of the individual receiving care [14]. mHealth can make significant improvements in patients’ health. This is because of the possibility of connecting to a smartphone anywhere. mHealth delivers healthcare services, overcoming geographical, temporal, and even organizational barriers. Additionally, the size of a smartphone plays a crucial role because it fits into hands and pockets, so ICs can carry their smartphones at all times [15].
A food plan prescribed by an expert brings a more suitable quality of life to AD patients. A balanced diet adapted to the individual will benefit health and long-term well-being. The major problem is monitoring the ingestion of food and providing nutritional feedback for all patients—in most cases—through their IC. The major contribution of this paper is the idealization, design, and implementation of a mobile application to monitor and control food plans for patients with Alzheimer’s disease. It allows the registration of the food consumed and water intake (hydration), making it possible to exchange food with an equivalent, considering a plan given by a nutritionist accompanied by the individual or the respective caregiver. One of the significant challenges for idealizing this application is that the users are the patients themselves or the IC. It is necessary to consider their level of understanding regarding particular subjects and to develop an easily absorbed application that is usable for everyone, even the patients themselves.
The rest of this article is organized as follows. Section 2 presents the related work. Section 3 defines the problem and enumerates the requirements of a possible solution. Section 4 presents the system architecture, the ideation process, and the application features. Section 5 describes the scenarios in which the system will be tested and the results obtained. Finally, Section 6 presents the conclusions and limitations and provides insights into future work.

2. Related Work

Mobile applications have proliferated in society in recent years, allowing us to carry out tasks anywhere. They also can potentially improve the quality of life of AD patients and their IC [16]. In this context, they can be roughly classified into two major AD categories: applications for patients and caregivers. The first focuses on aspects related to daily living and activities for self-assessment. They can be decomposed into self-diagnosis [17], brain stimulation and training [18,19,20], movement and navigation [21,22], tips and reminders [23], and communication with family members. For AD caregivers (either FC or IC), there are still few apps that focus on improving the quality of life of an IC [14], and those that are available focus on the monitoring and caring of AD patients. These can be subdivided into tips for caring, monitoring, tracking, and caring for health [24,25,26,27,28,29].
Despite many applications being available for healthy eating and AD care, they do not account for the specificity of each AD patient. They do not provide real-time feedback on the consumption of each meal to the nutritionist. For general well-being and weight loss, hundreds of applications are available. In this section, we review those that present more features related to the research presented in this paper. MyFitnessPal [30,31] contains a large food dataset and provides a calorie counter for users to track their diet and exercise.
In a similar context, FatSecret [32] is a calorie counter application that allows users to track their nutrition, exercise, and weight. Moreover, it contains dietitian meal plans and user communication with tips and shared recipes. An interesting feature in both applications is the barcode scanner for image recognition to track foods from images. Lifesum [33] is also a calorie counter (in kilojoules, instead of standard units of calories) and food-tracking app that can be used to help lose, maintain, or gain weight. More than a weight loss application, it allows the creation of personalized plans—based on government recommendations—that accommodate the user’s body type, nutritional level, exercise habits, and dietary needs.
Similarly, MyPlate Calorie Counter [34] provides information about meals, recommendations, and recipes for meals. Fooducate [35] is a food plan consumption tracking app that provides information on the calories ingested. These calories are related to health and nutrition goals. It allows the integration with standard diets such as paleo, keto, and the Mediterranean diet [36]. Similarly, Lose It! [37,38] is an app that helps people achieve their health and weight loss goals by tracking meals and calories throughout the day. It provides healthy recipes, guides to exercises, and water intake registration. In the My Plate app [39], the food is divided into groups (fruits, vegetables, grains, protein foods, dairy) that are represented with a specific color. However, the user has to specify the goals of the nutrients to consume instead of these being defined by a nutritionist. These are some of the hundreds of applications with essentially the same scope of functionalities. In Table 1, their features are presented. Noticeably, none of them was designed for older persons, nor people with dementia.
Specifically for people with particular health concerns, ADDietCoach [42] is a mobile application built on an ontological knowledge base related to the AD patient profile, food, and nutrition. It assists informal caregivers of AD in diet planning, recommendation of food and nutrition, and education. My Diet Diary [40] is an app for users with diabetes and works as a digital diary for their food consumption, water intake, and physical activity. It follows in line with most developed applications. Although Fooducate [35] is not designed for people with health concerns, it possesses dietary recommendations for diabetes, high cholesterol, and heart conditions.
The work presented in this paper aimed at filling a gap in most of the previous applications/research by including the control of the prescribed food in the meals and providing real-time feedback to the nutritionist. Moreover, it presents a simple interface, focused on an appealing look and feel of IC interest.

3. Materials and Methods

3.1. Design-Based Approach

The design of applications for older adults has to meet one major requirement: user satisfaction. In this context, several approaches have been presented throughout the years that apply quality factors to achieve this goal. The user-centered design (UCD) consists of a methodology based on the user’s interaction with an application through the development process [43,44]. This process is composed of two stages: discover (identification of requirements) and design (definition of style and content). The design stage also subdivides into prototyping (GUI and functionality refinement) and evaluation (tests with users).
In the first stage, several separate meetings were arranged with the different stakeholders —three meetings with therapists and caregivers (four therapists and three caregivers) and three meetings with nutritionists (two nutritionists) to identify the major requirements of a food plan application, which are as follows:
  • The application should be intuitive and easy to use;
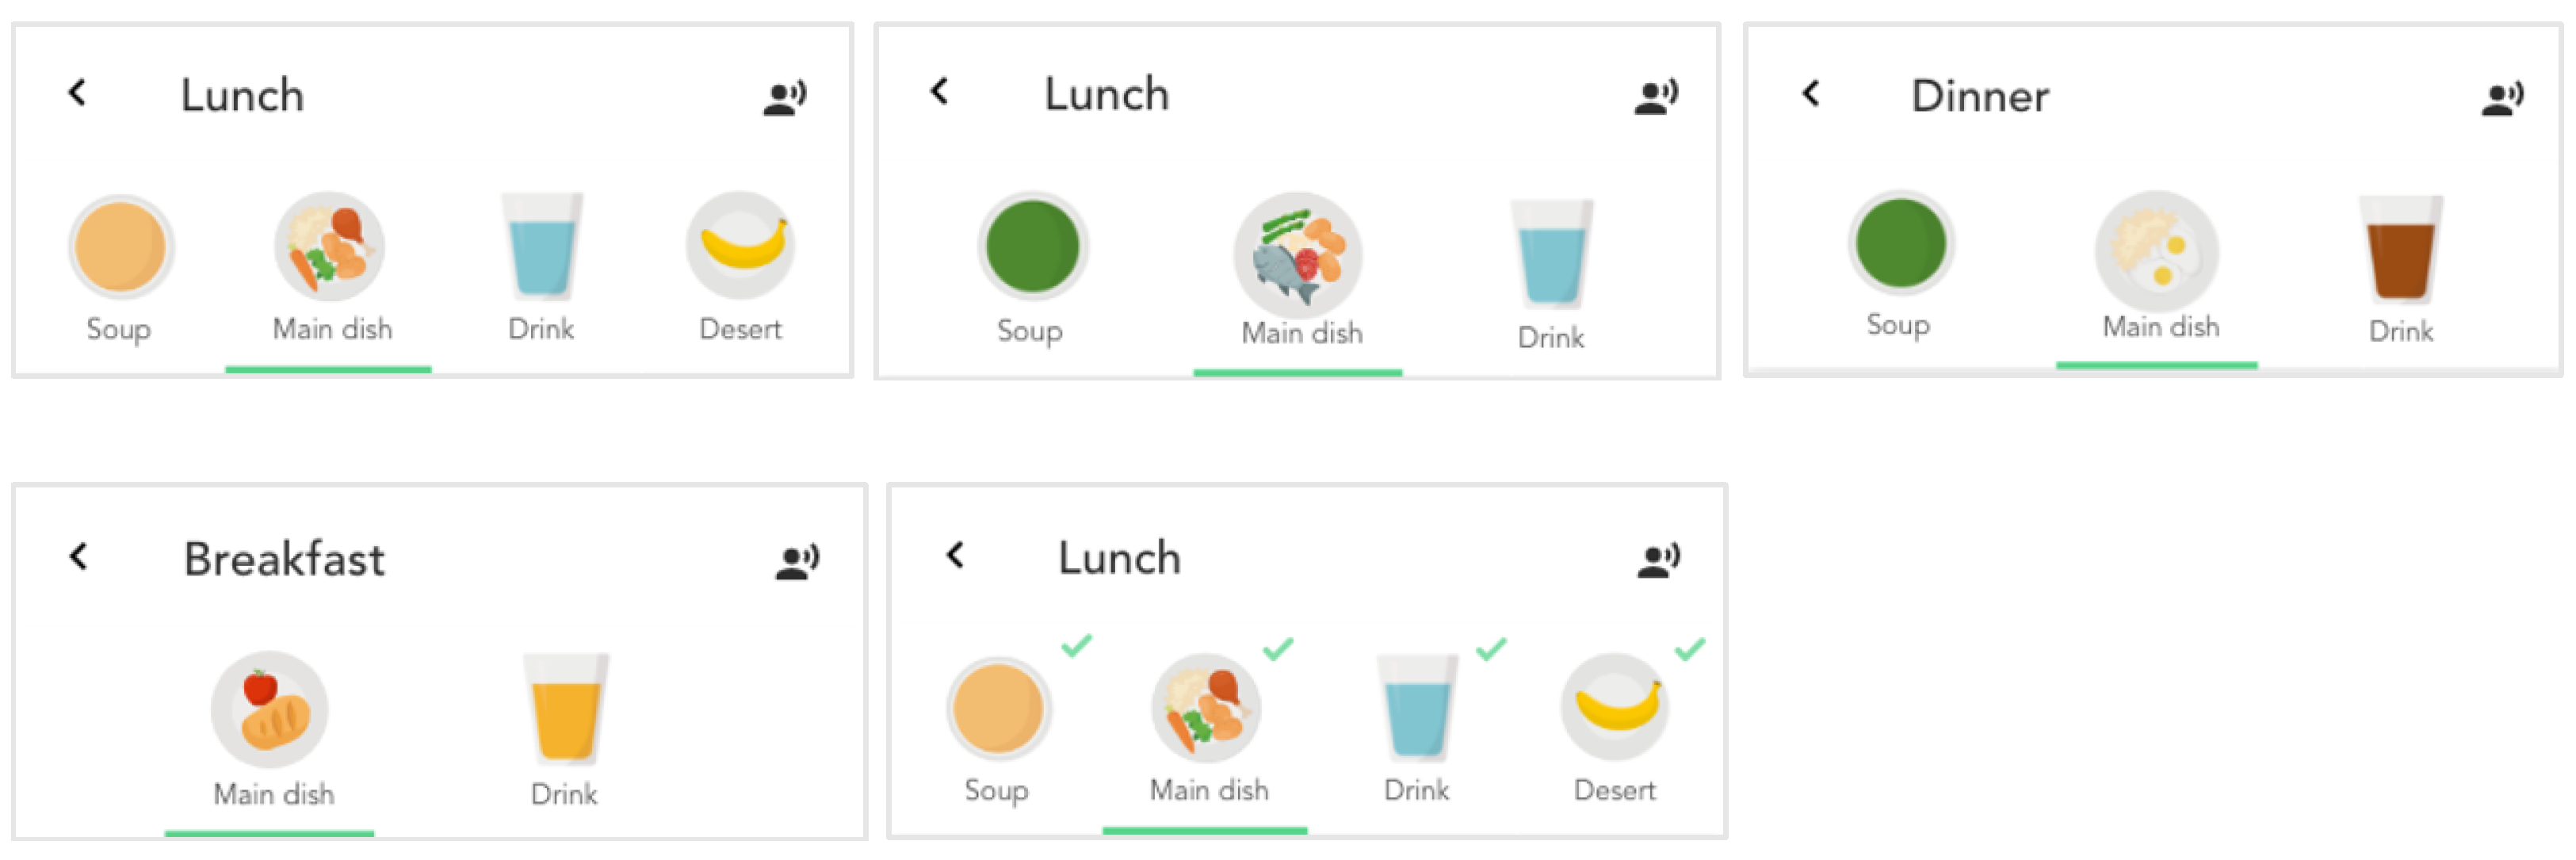
  • The application should map the real concept of what a meal is and use visual markers for better identification of components;
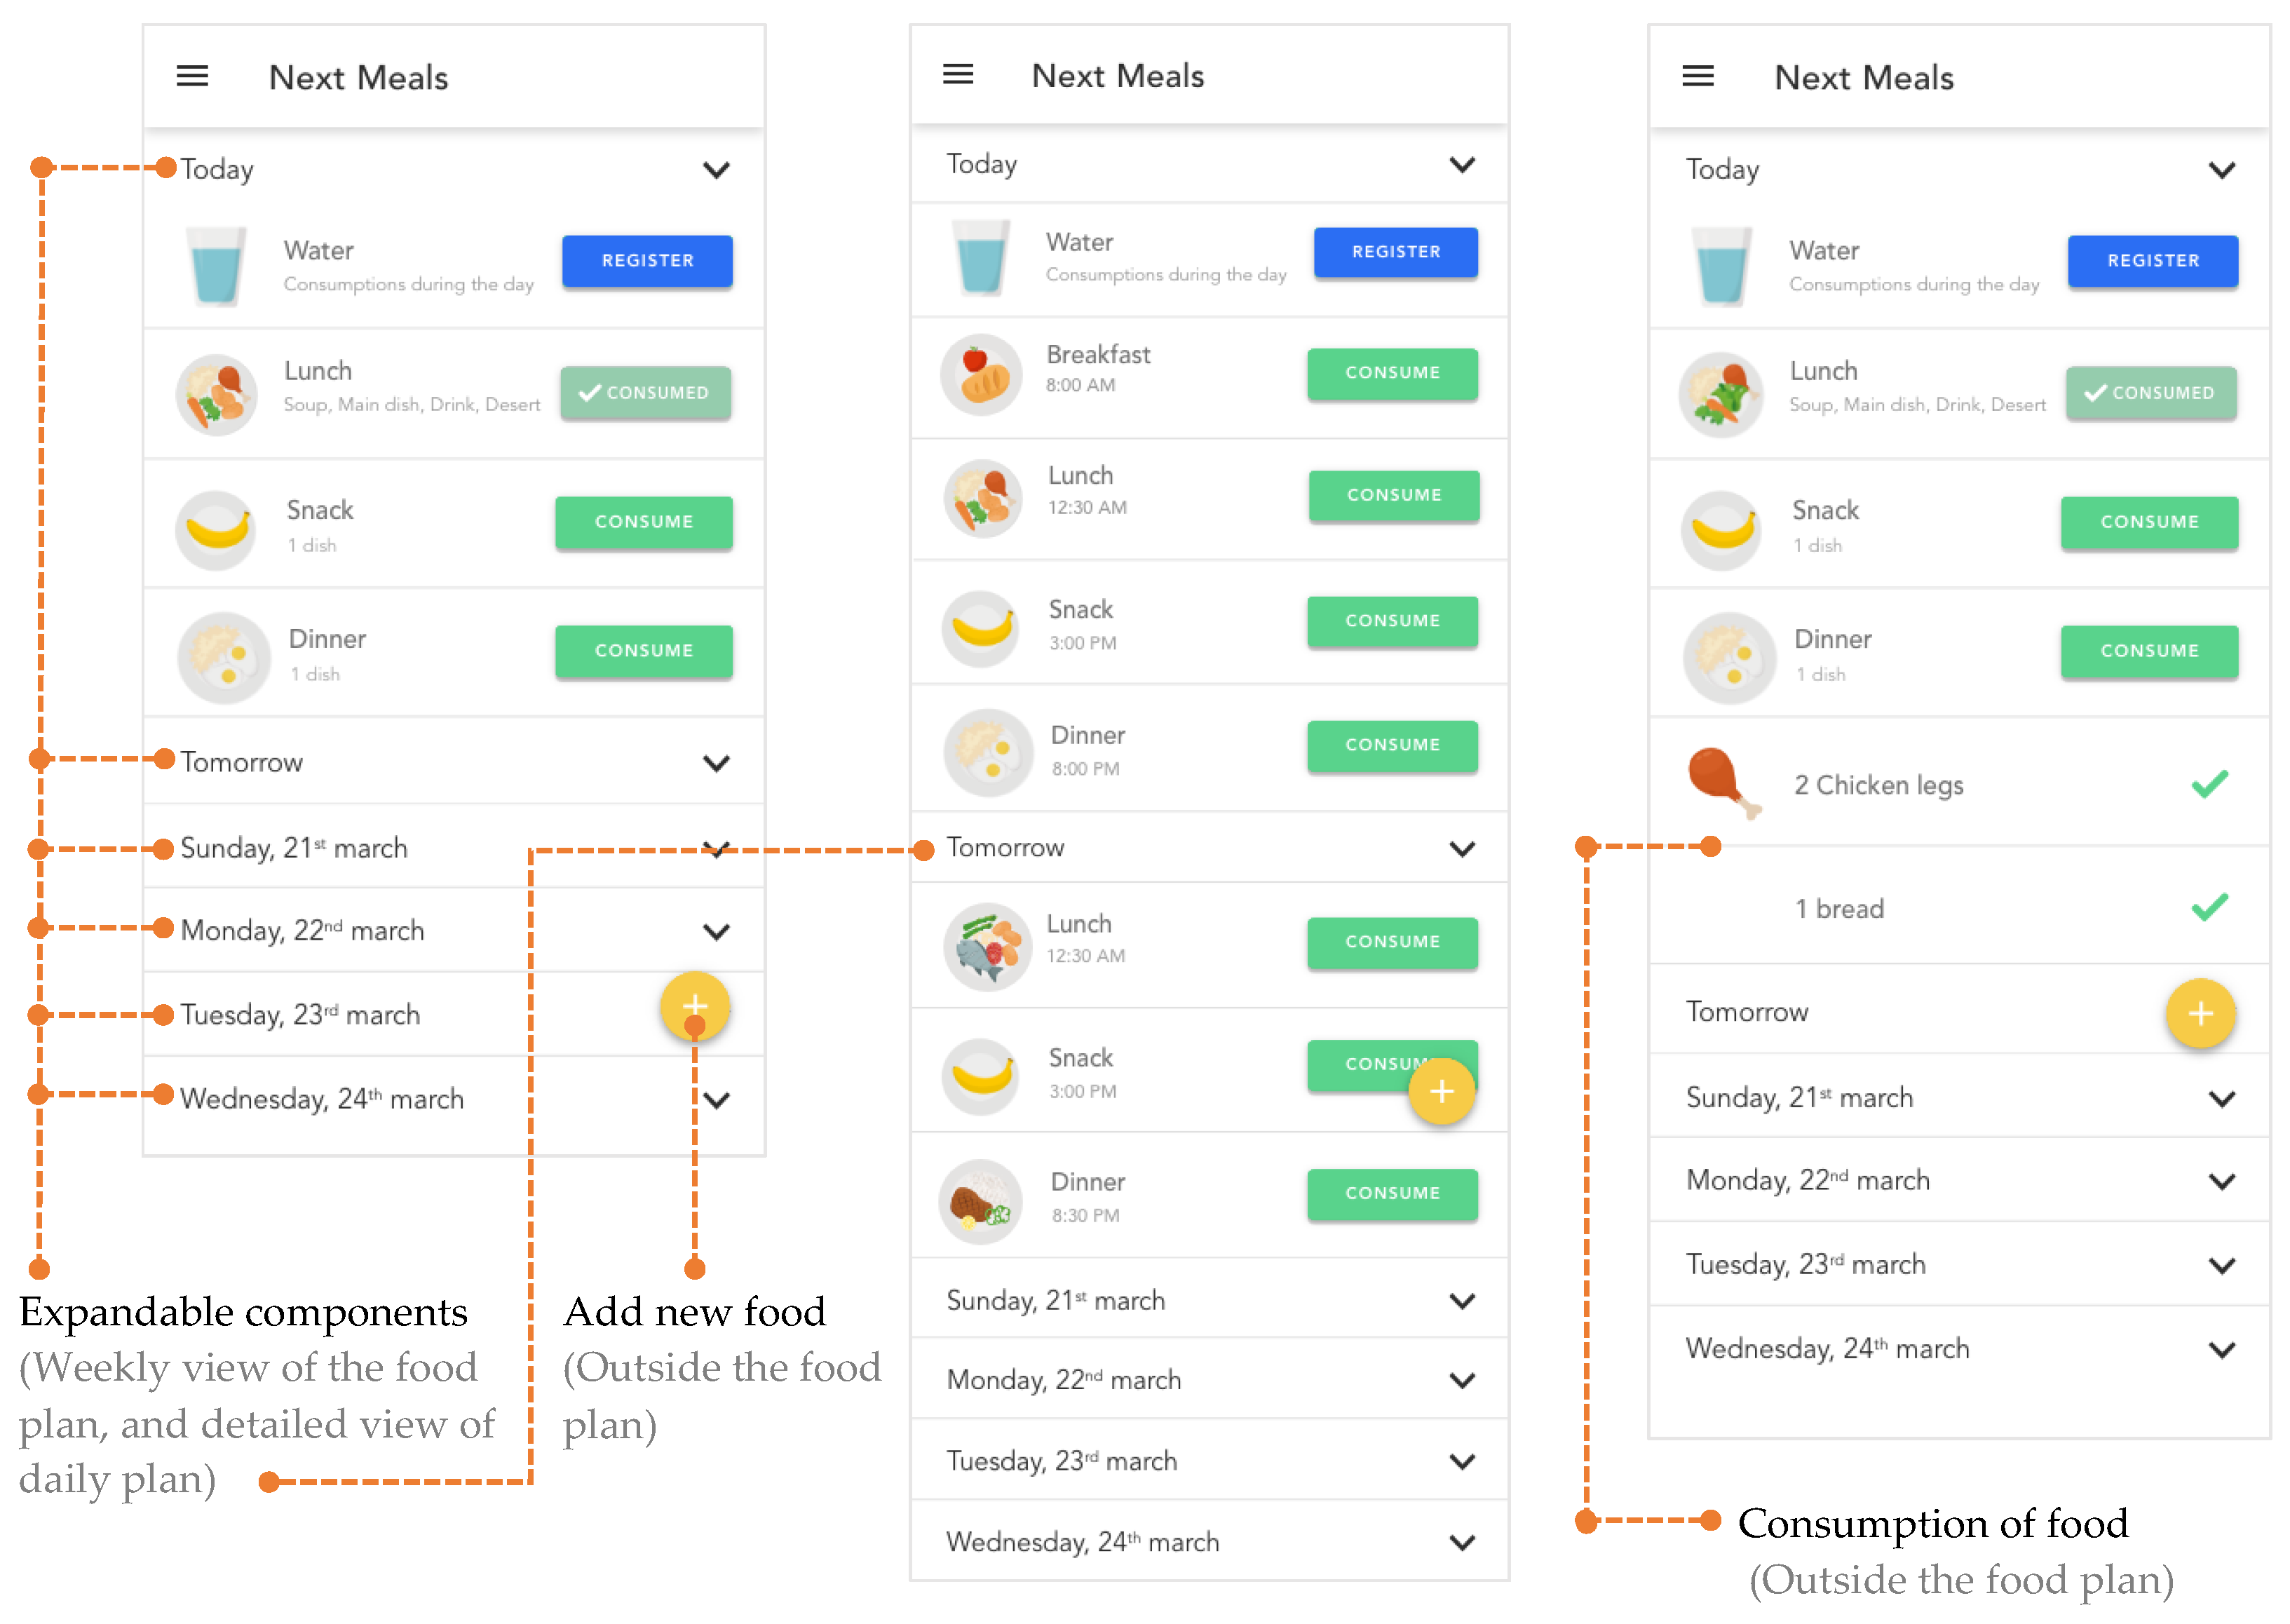
  • Make available a weekly list of meals provided by the nutritionist so that the caregiver or patient can plan and anticipate the meals for that week;
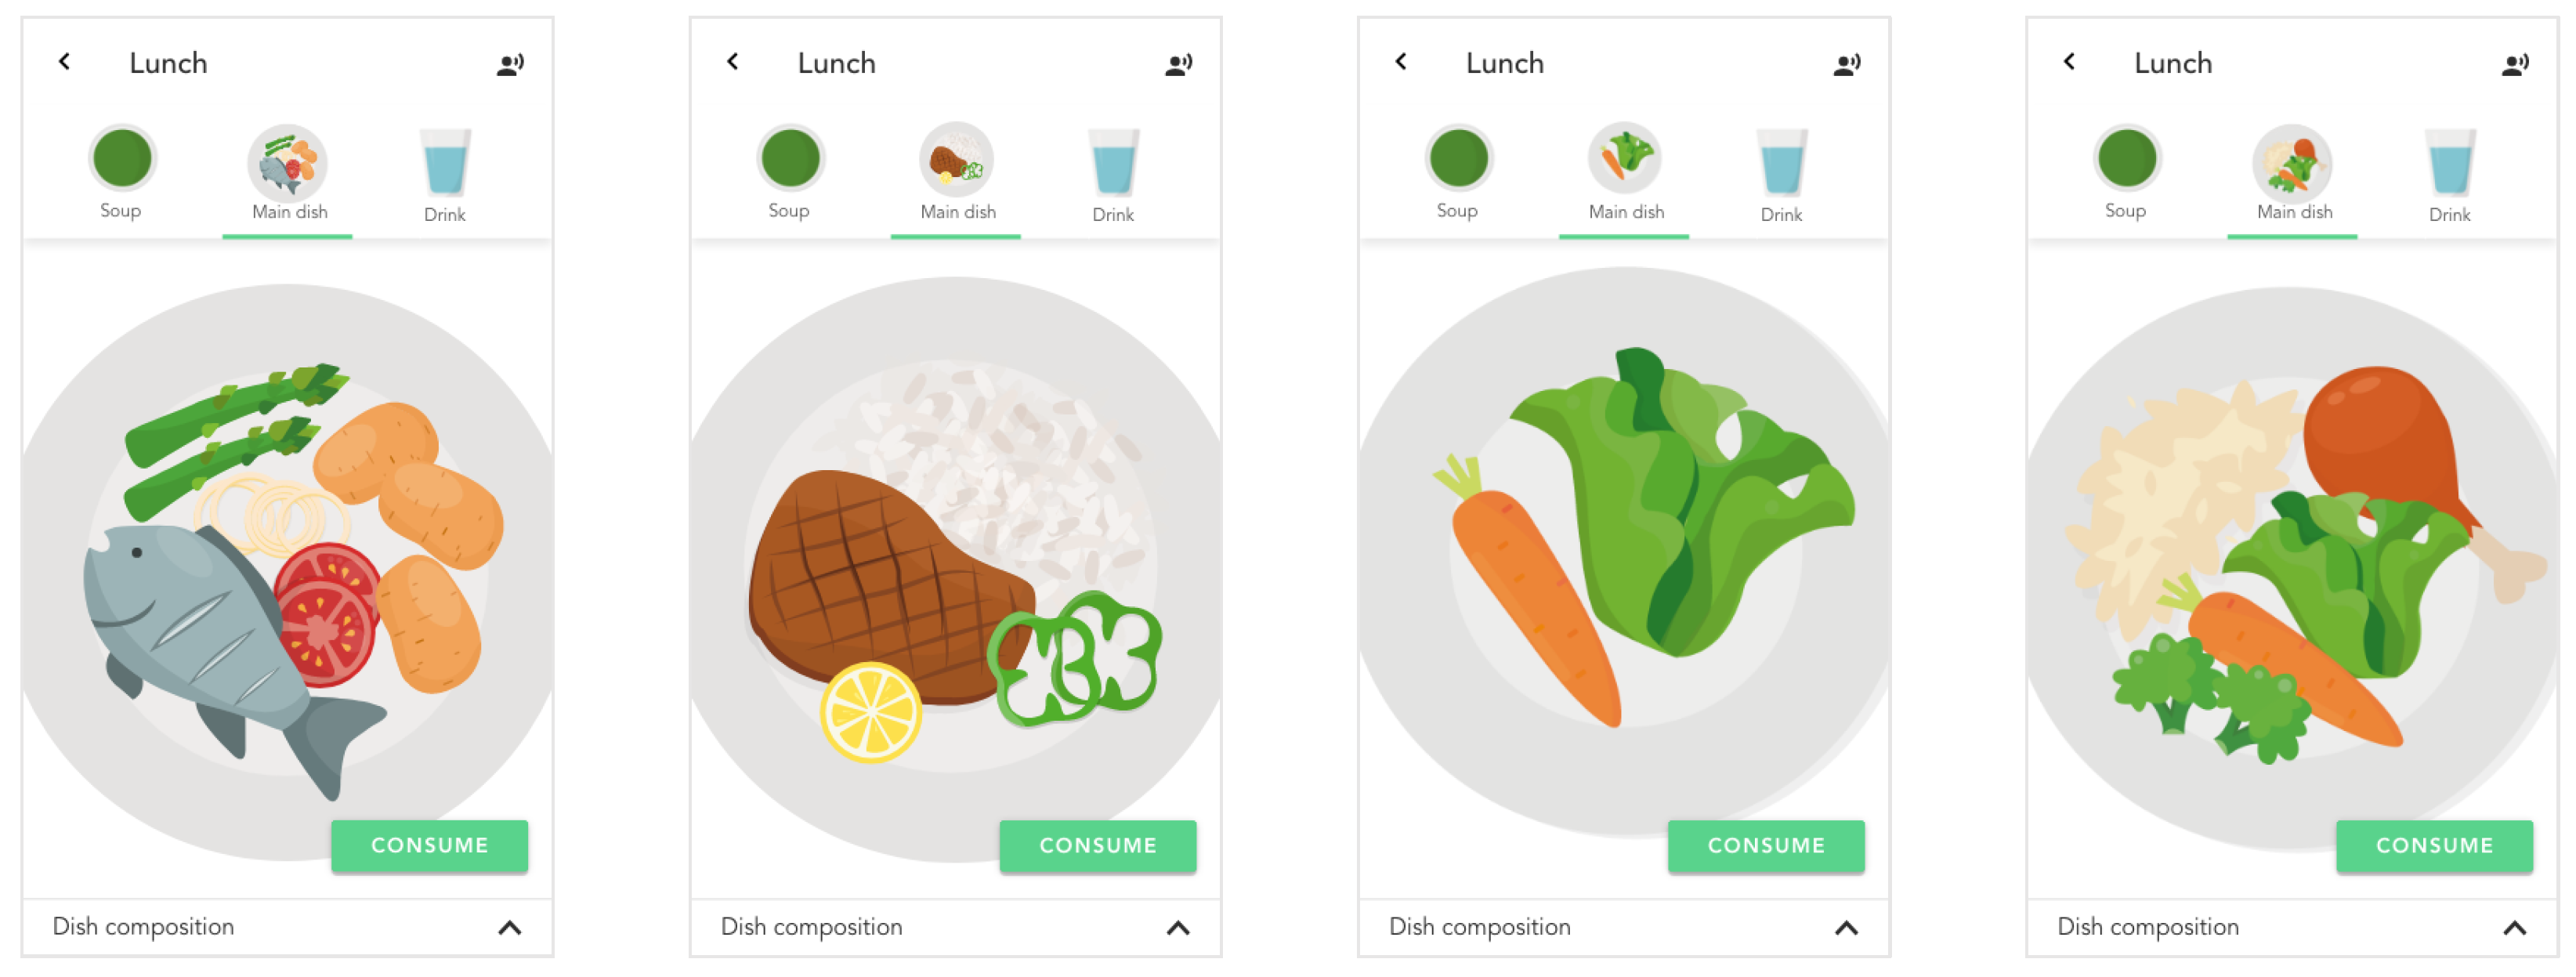
  • Provide a detailed view of each meal and use visual markers for each food;
  • Allow the change of food in a meal for an equivalent (with the same nutritional value);
  • Register the consumption of macro-nutrients, micro-nutrients, and water consumed in each meal of the food plan;
  • Provide the user with information on discrepancies between the defined nutrients and real consumption through statistics;
  • Push notifications for scheduled meals.
To acquire quantitative data, study participants were assigned several tasks to complete in the interface designed in Section 4.
The second stage focused on the system’s usability, and the users conducted tests. According to [45], four or five participants are enough to find 80% of usability problems. Based on the proposed methodology, it was essential to carry out evaluations to measure the impact on user satisfaction using two approaches: cognitive walkthrough [46,47] and user experience questionnaire (UEQ) [48]. For the first, the user receives a goal, searches in the interface, interacts with the interface, and provides feedback; in the second approach, applying the UEQ avoids extensive tests on the user interface that are time-consuming and involve costs [49]. UEQ combines attractiveness (users like or dislike the product), perspicuity (simple to become familiar with the product), dependability (the user perceives control over the interaction), efficiency (users perform their activities without exerting undue effort), novelty (uniqueness and innovation), and stimulation (fun and motivates the use of the product) measures, as well as a survey of 26 contradictory adjective pairs. The UEQ questionnaire contains a scale obtained from a benchmark that incorporates five quality levels: excellent (ranked in the top 10%), good (10–25%), above average (25–50%), below average (50–75%), and poor (<25%).
Moreover, to link the interface to the general tendency to model and learn by analogy, we used metaphors created with conceptual models to enable users to draw on their existing knowledge to act on a non-familiar domain [50], as presented in Section 5.

3.2. Participants and Tasks

A total of twenty participants were screened and recruited with the following inclusion criteria: (1) older adults that were IC; (2) do not have much proficiency in the use of mobile applications. Fourteen were women and six were men, aged between 60 and 70, with a mean age of 64.8 ( σ = 2.1 ).
From the requirements specified in Section 3.1, participants assumed the role of an IC caring for a person aged 78 years suffering from AD who must use a mobile app to register food and water consumption related to a prescribed food plan. Ten tasks were identified, as shown in Table 2.
The tasks were carried out offline, and no direct help was provided when participants encountered difficulties. After completing the task, they were asked to complete the UEQ questionnaire.

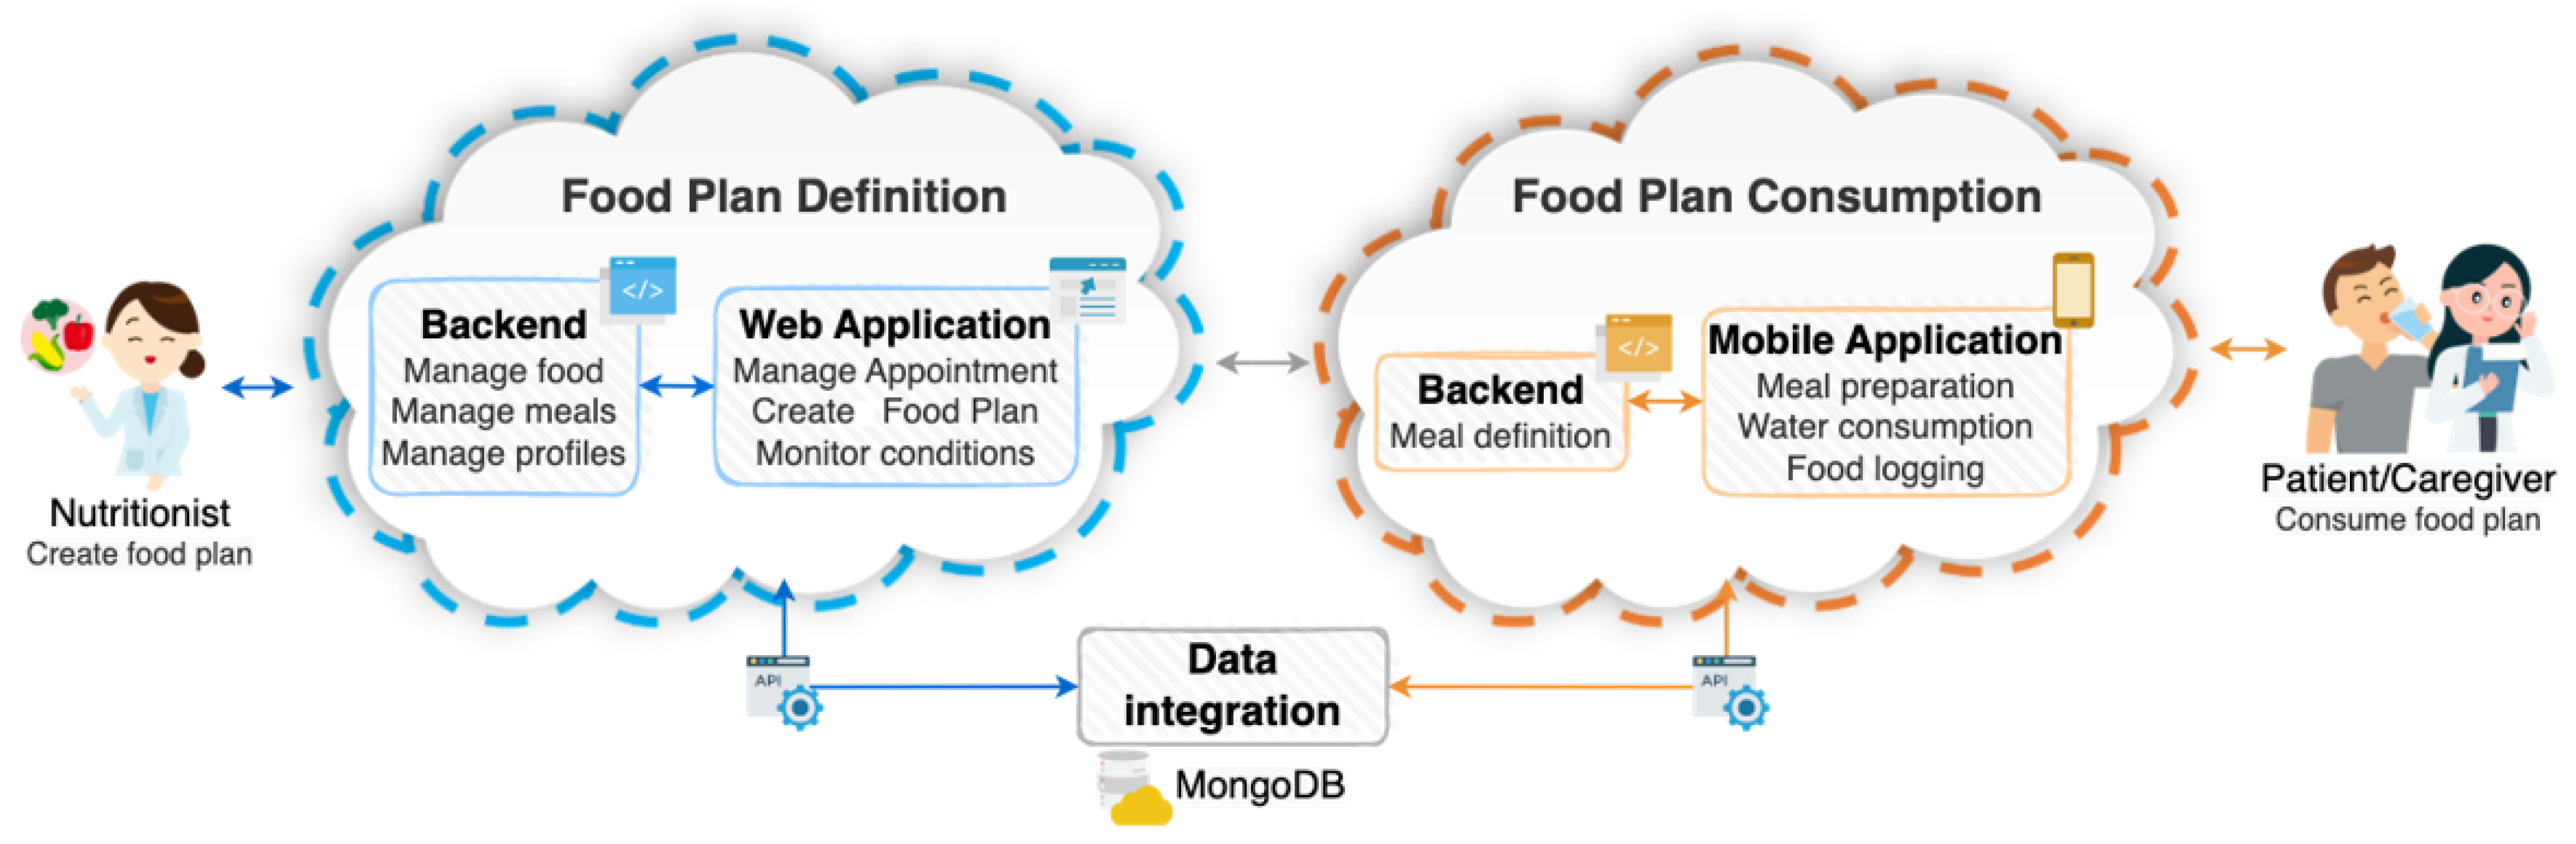
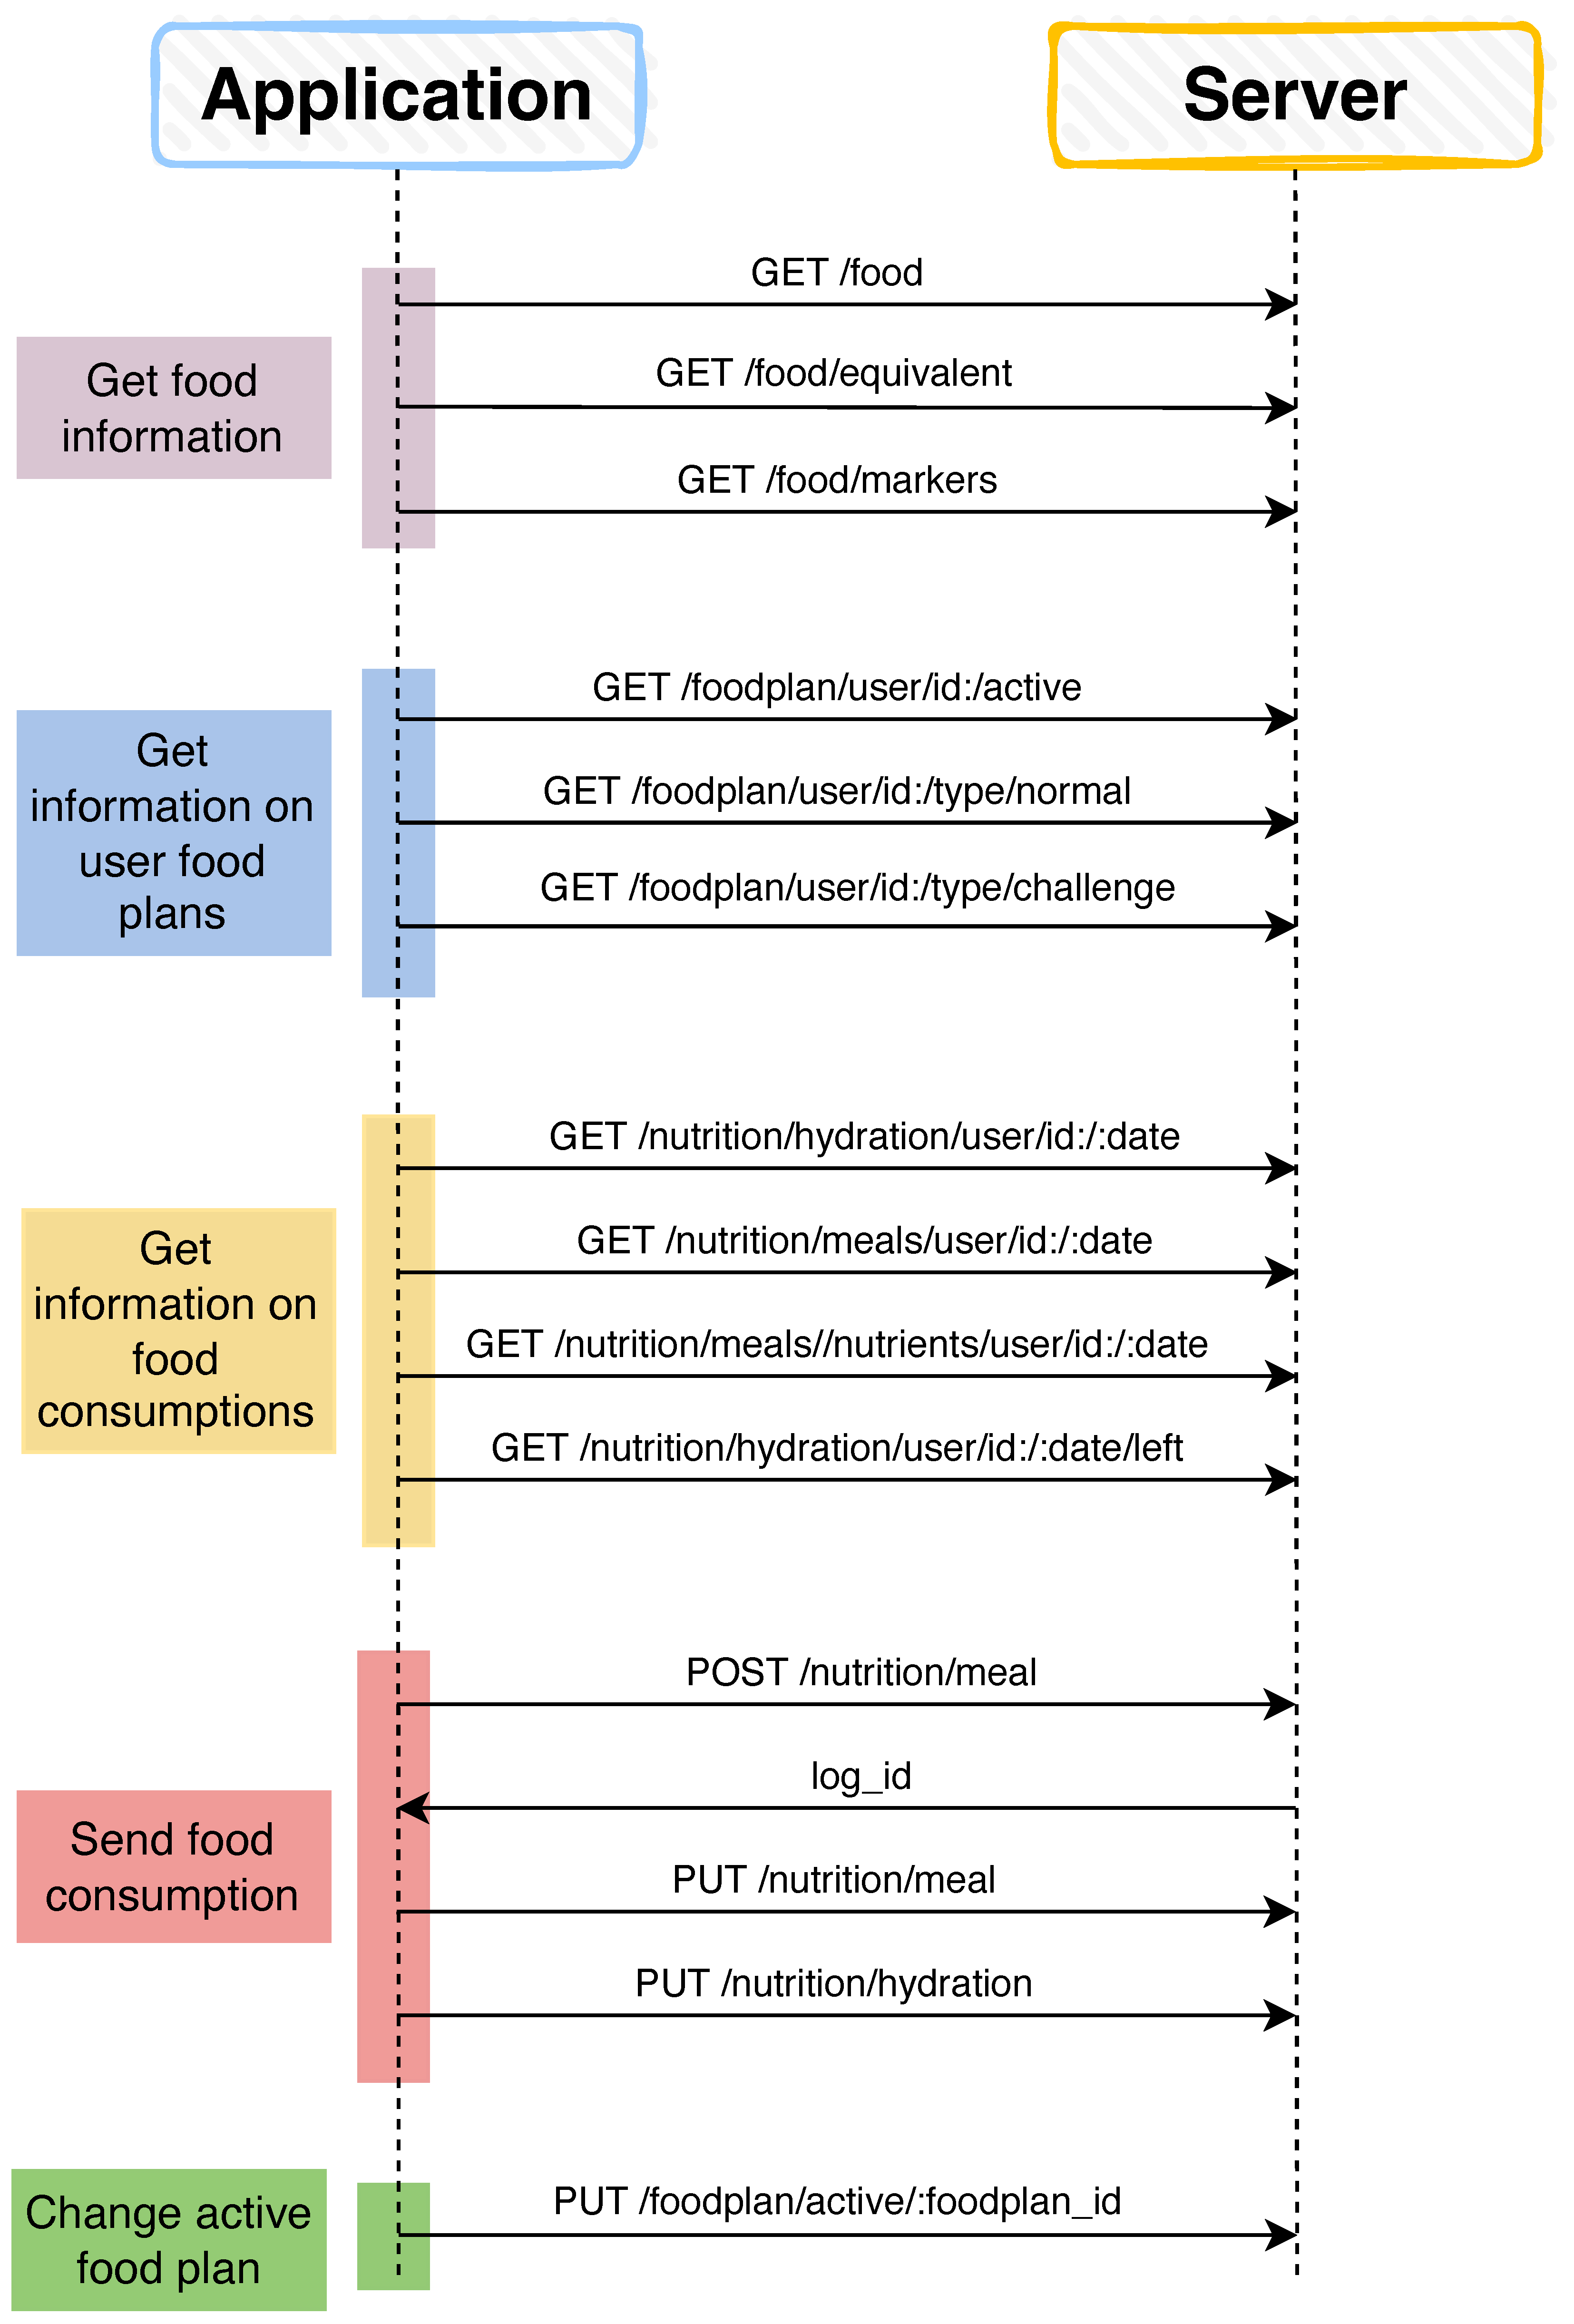
3.3. System Architecture

To support the interaction between AD patients/caregivers and the nutritionist, a framework based on the design of a mobile application focused on AD patients/caregivers to provide real-time data to the nutritionist was developed. The major focus was the user interface for the AD patient/caregiver. However, the system must inform the nutritionist of the discrepancies between the defined nutrients and real consumption. It will allow the adjustment of the food plan according to the effective consumption of nutrients. A detailed view of the framework is presented in Figure 1.
Generally, the system comprises three components: a web backend, a mobile frontend, and an offline API. The backend component is a critical part of the system since it allows the management of important elements [51]. The backend allows nutritionists to determine the physiological markers of AD patients and create food plans adjusted to the needs of each individual with a focus on nutrients. The nutritionist web application focuses on appointments and the food plan. The appointment refers to managing energy expenditure and its distribution throughout macro- and micro-nutrients. To support user monitoring between appointments, it presents historical data related to previous food plans, physical conditions (weight, body fat, visceral fat, fat-free mass, muscle mass, and body mass index), and other parameters for the control and analysis of user goals (bowel function, sleep quality, race, food preferences, lifestyle, clinical conditions, and water intake) [24]. It was developed as a Progressive Web Application (PWA) in LitElement [52].
The front end (also developed as a PWA) allows AD patients/caregivers to visualize the food plan and report food consumption, providing valuable information for the nutritionist. This component offers the following functionalities: meal import, weekly visualization of a food plan, view and consume meals, exchange, add or remove food, water consumption, and statistics. All the data are integrated into a MongoDB database [53], and the communication API places requests to the server, as shown in Figure A1 of Appendix A. These can be of type get, post, or put, related to the variables that have to be sent by URL. General information about food is stored in the local storage, while the remainder is stored in Redux [54].

4. Application Features

The proposed system’s major goal was to provide the IC or the patient with a tool to visualize a food plan prepared by a nutritionist. While the former used a mobile application to view the food plan, the nutritionist provided the food plan through a web application (which is out of the scope of this paper). Tasks in the interface have to be carried out intuitively by the users. In a broader view, this interaction allows the nutritionist to monitor the ingested nutrients prescribed in the food plan in real-time. It improves the quality of the information obtained and allows the adjustment of the food plan.

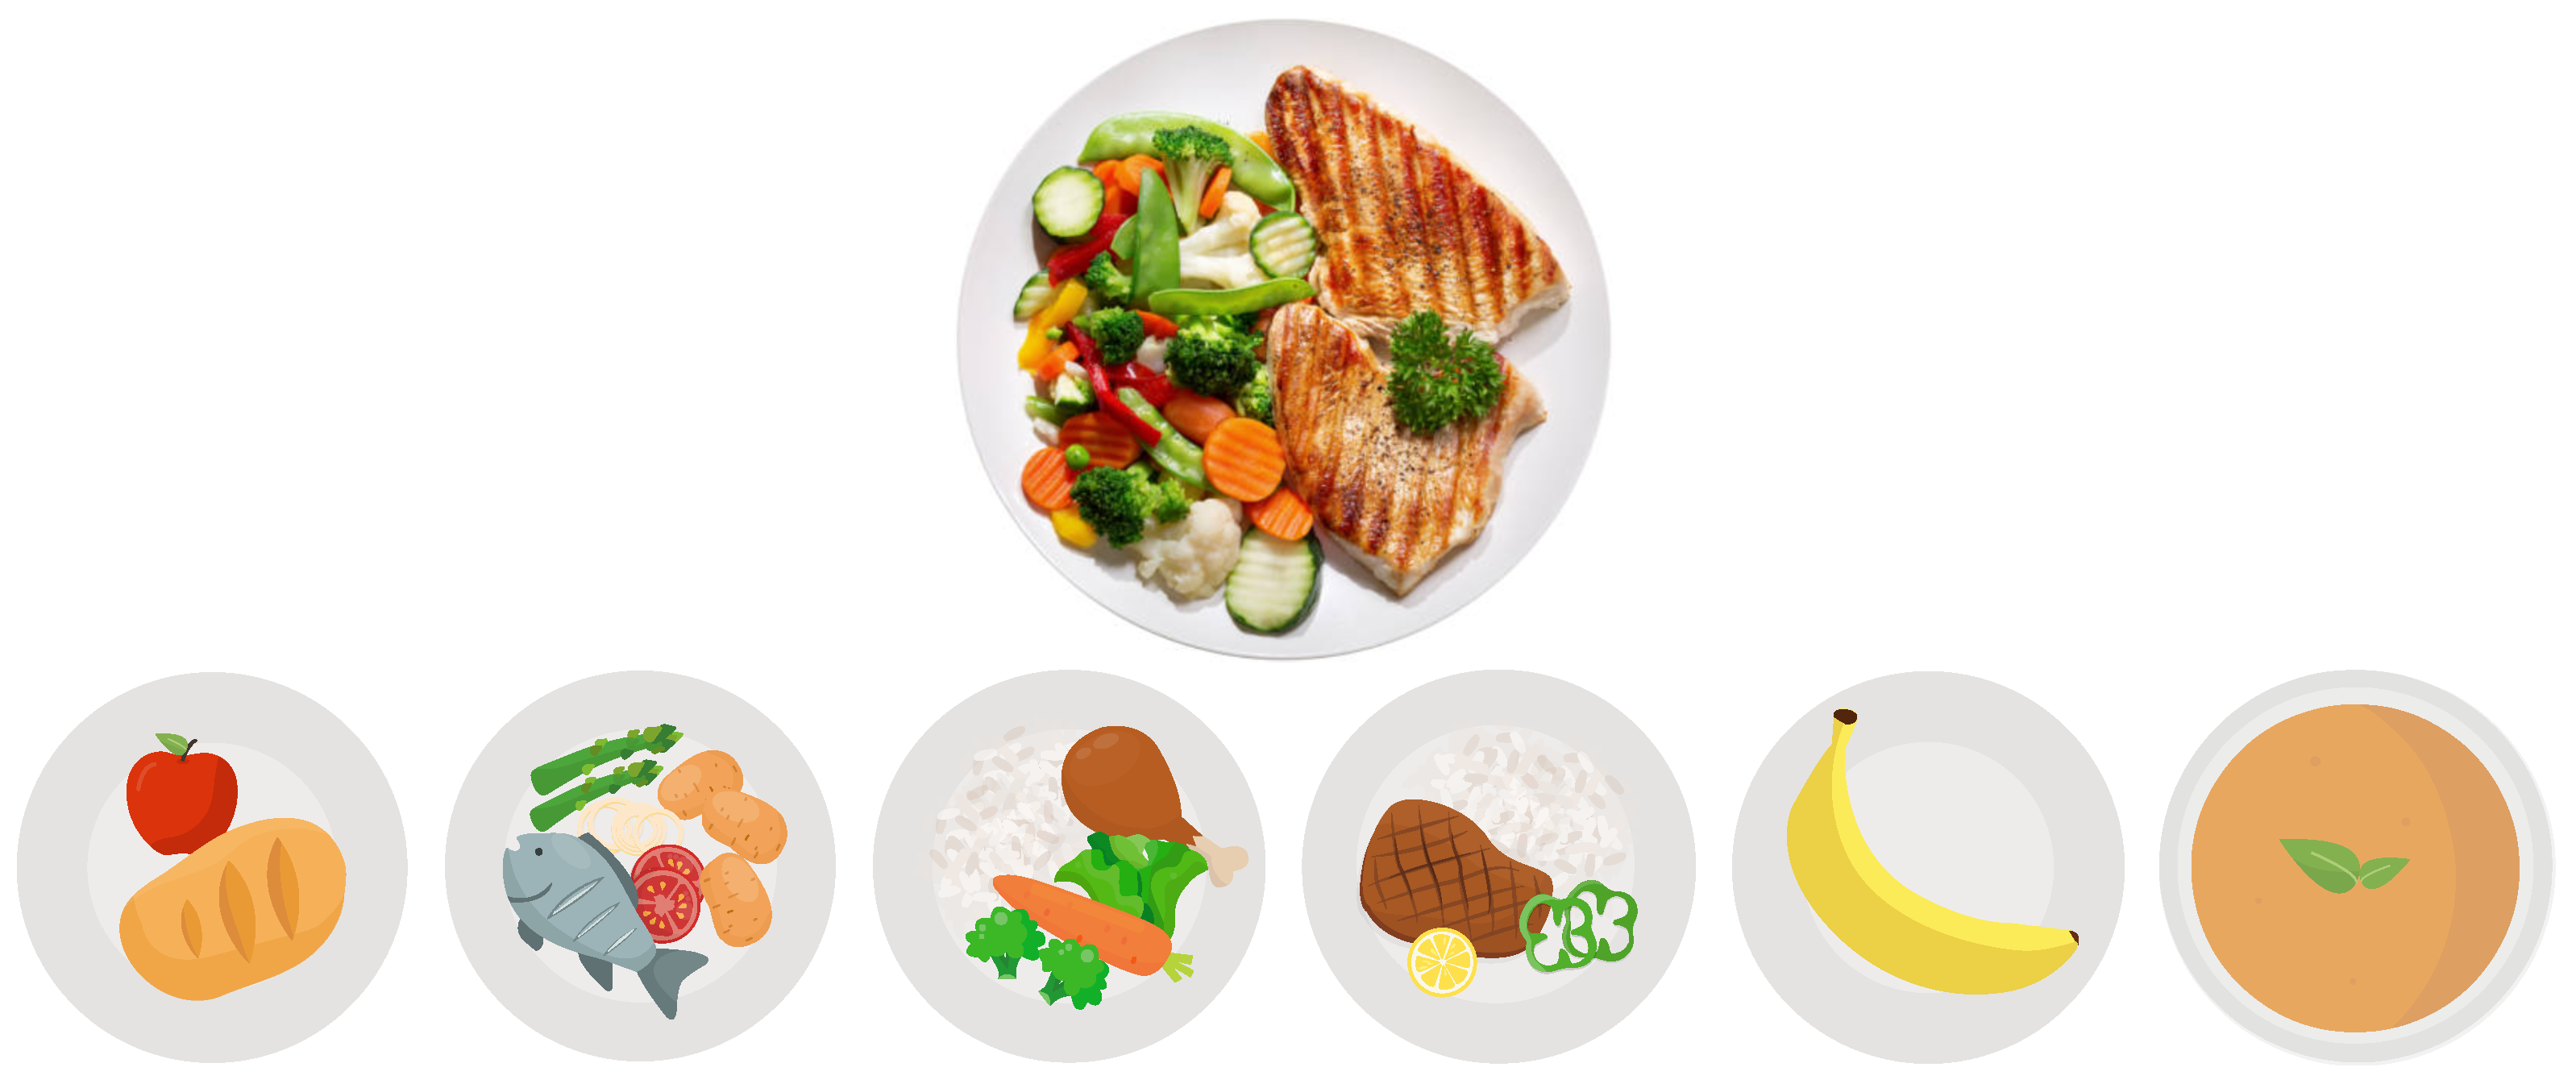
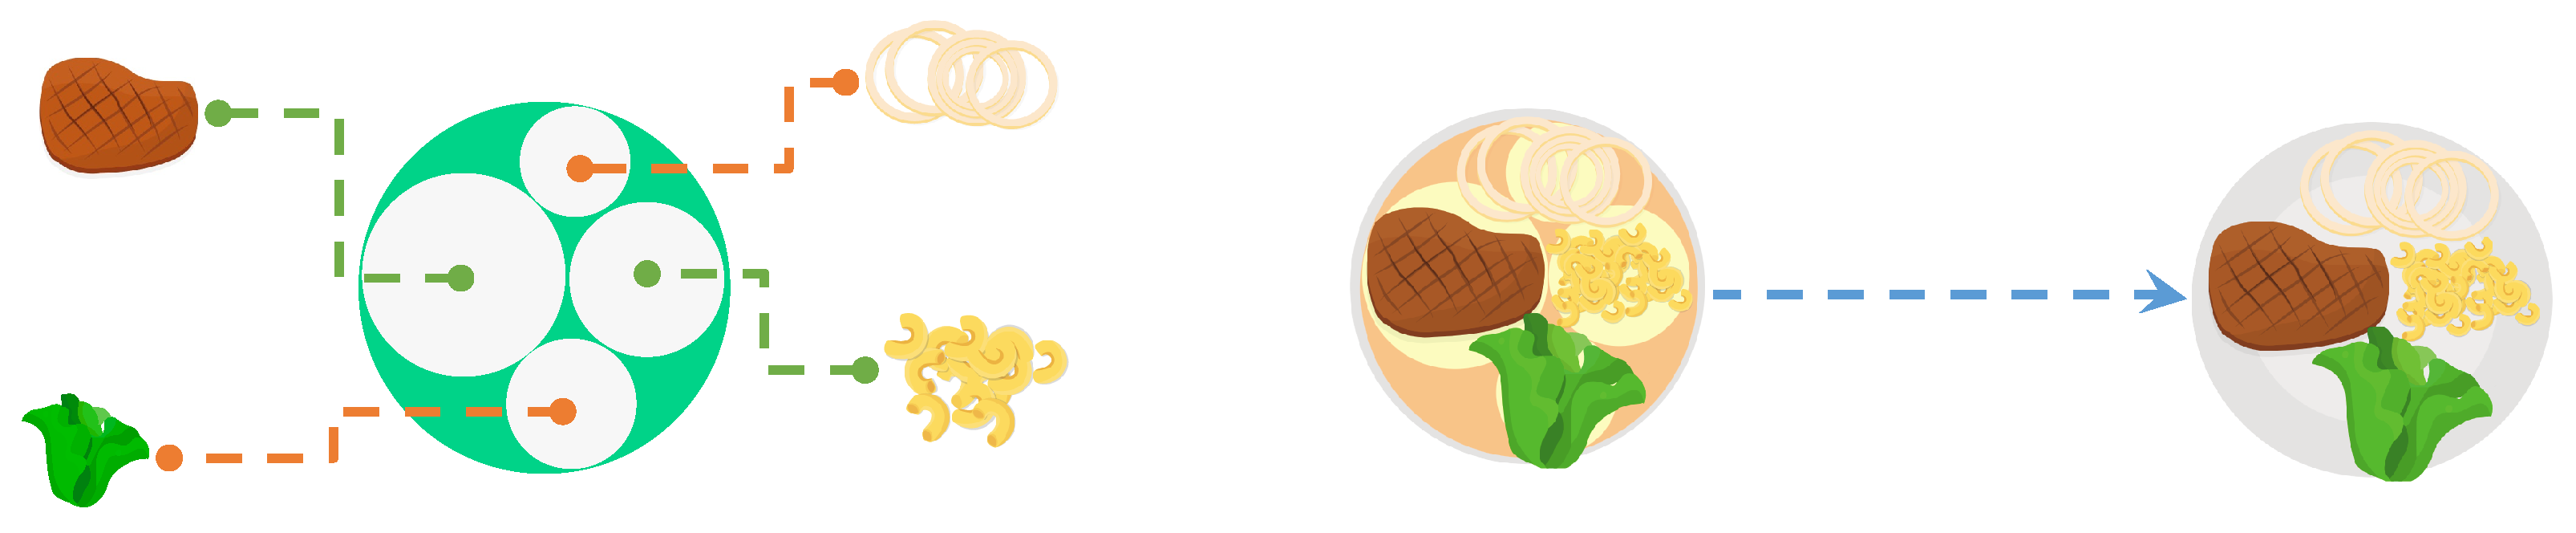
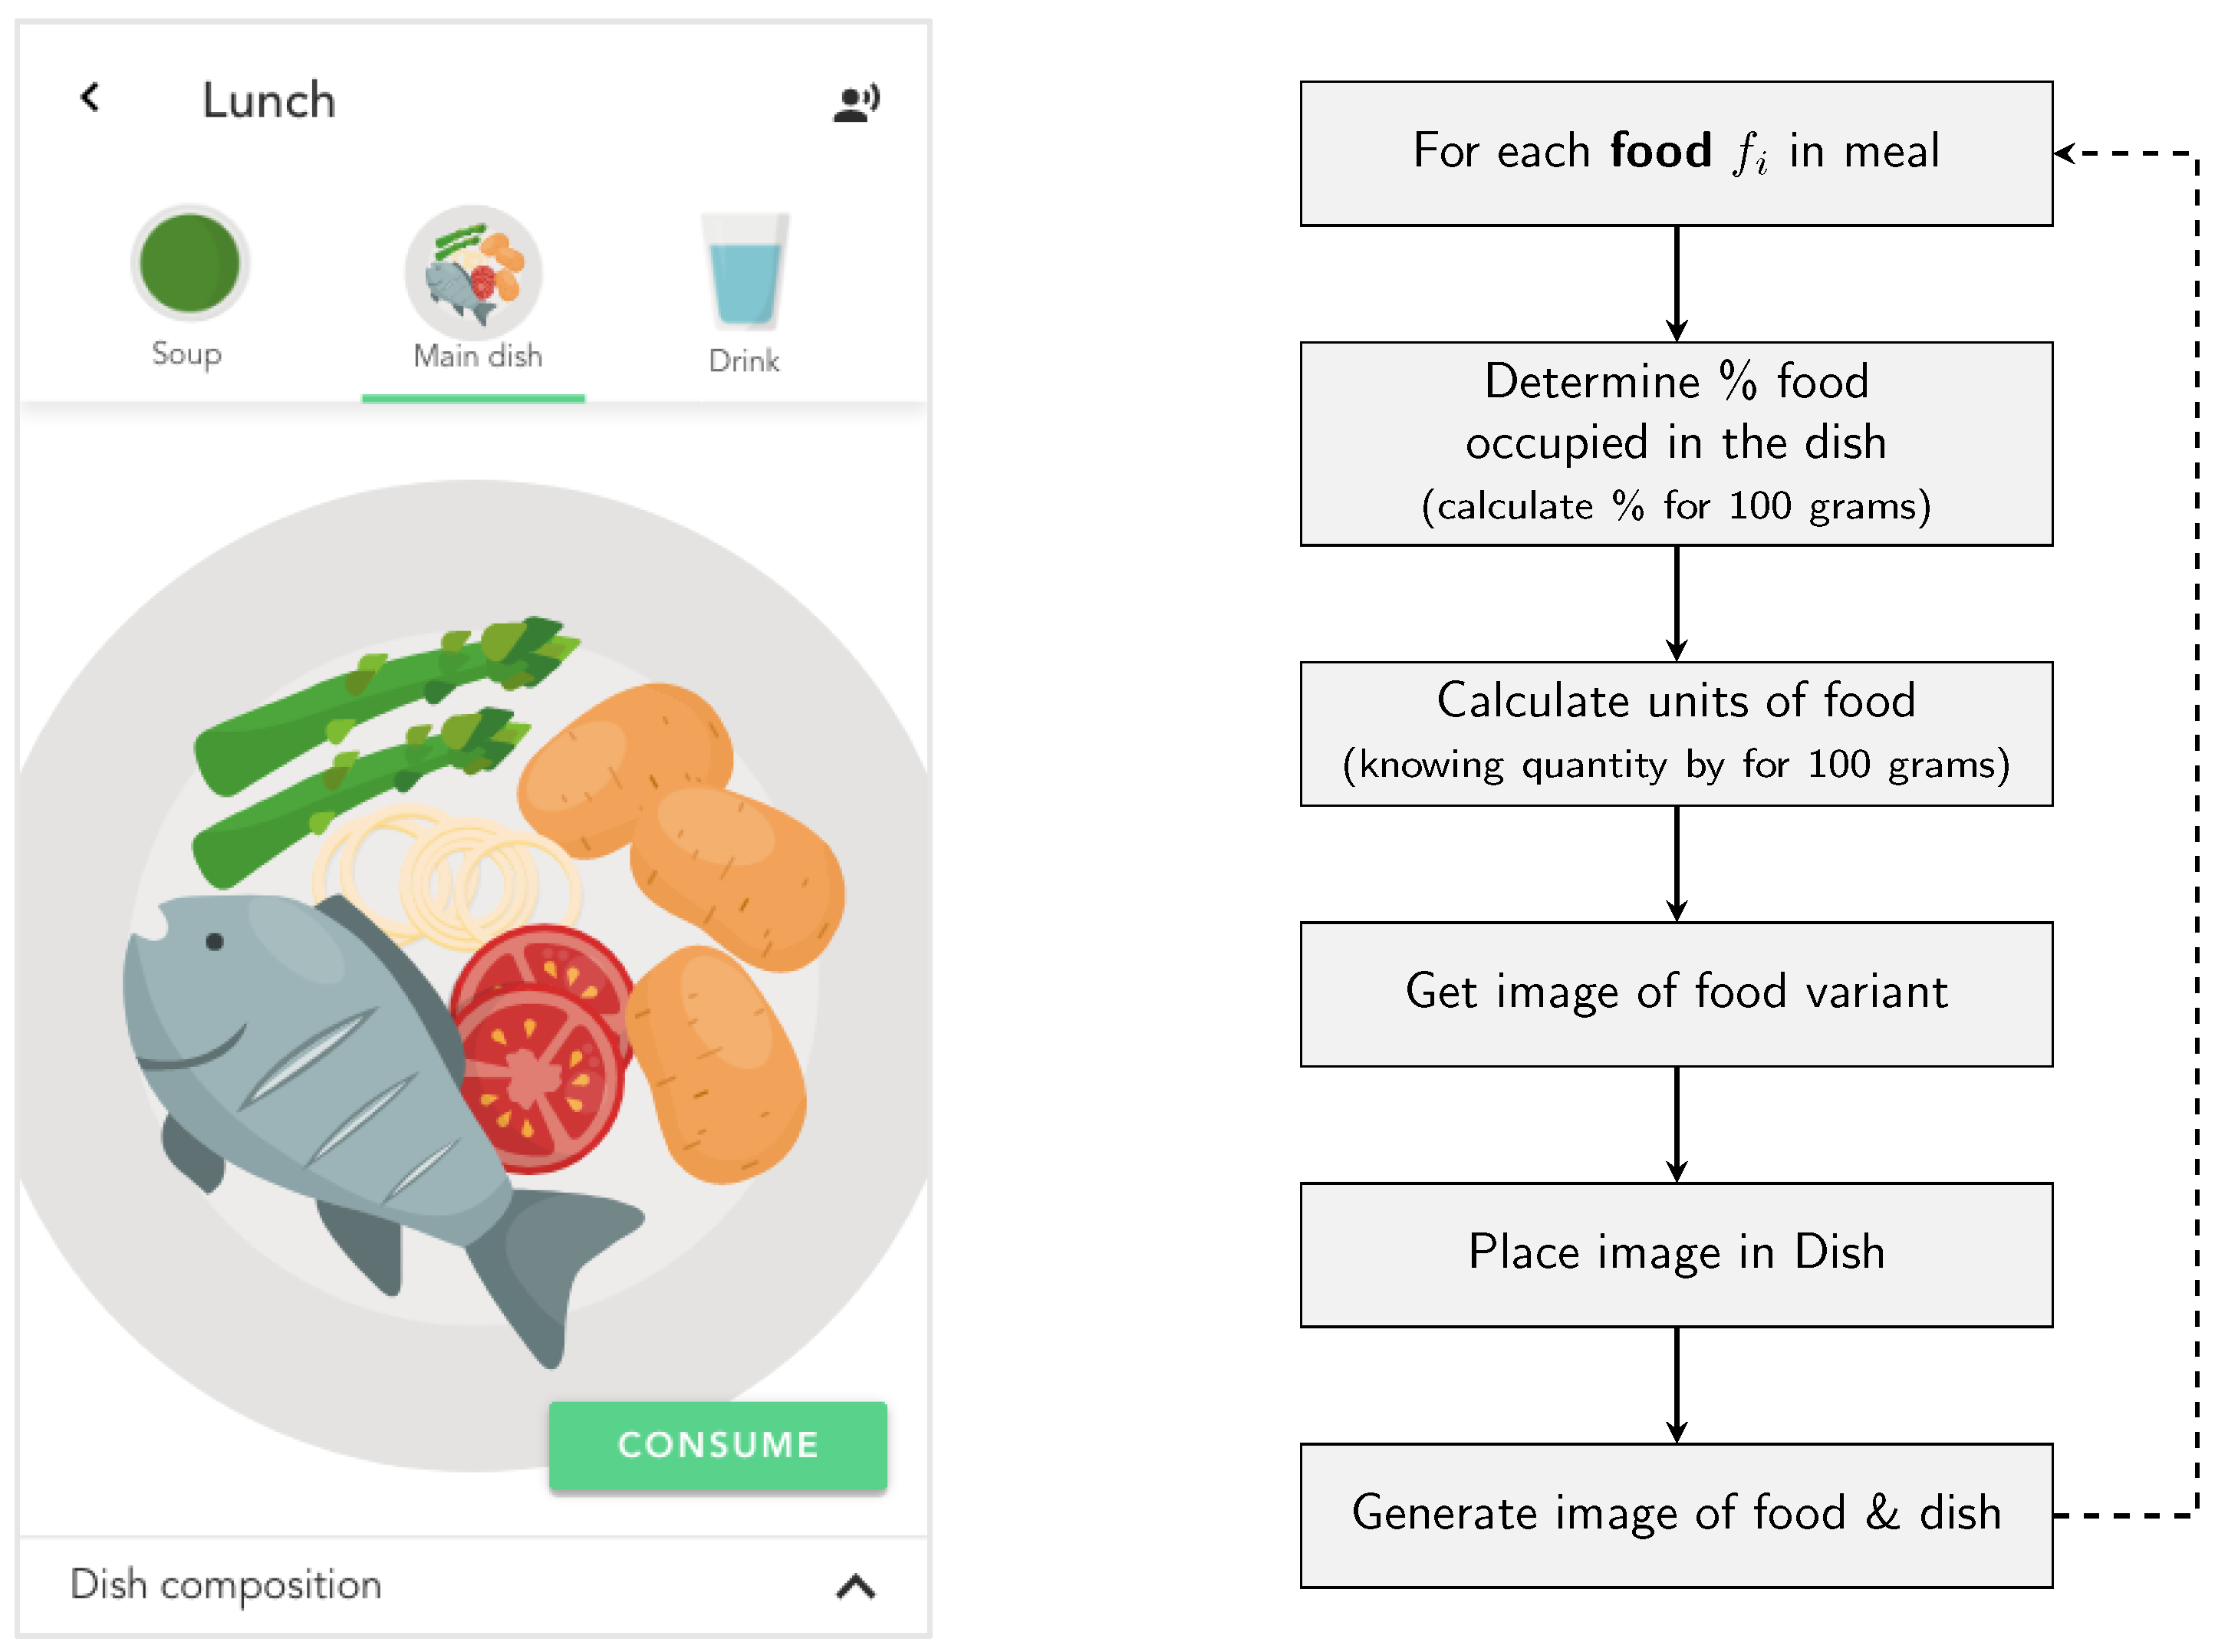
4.1. Mapping Real World Food Plans
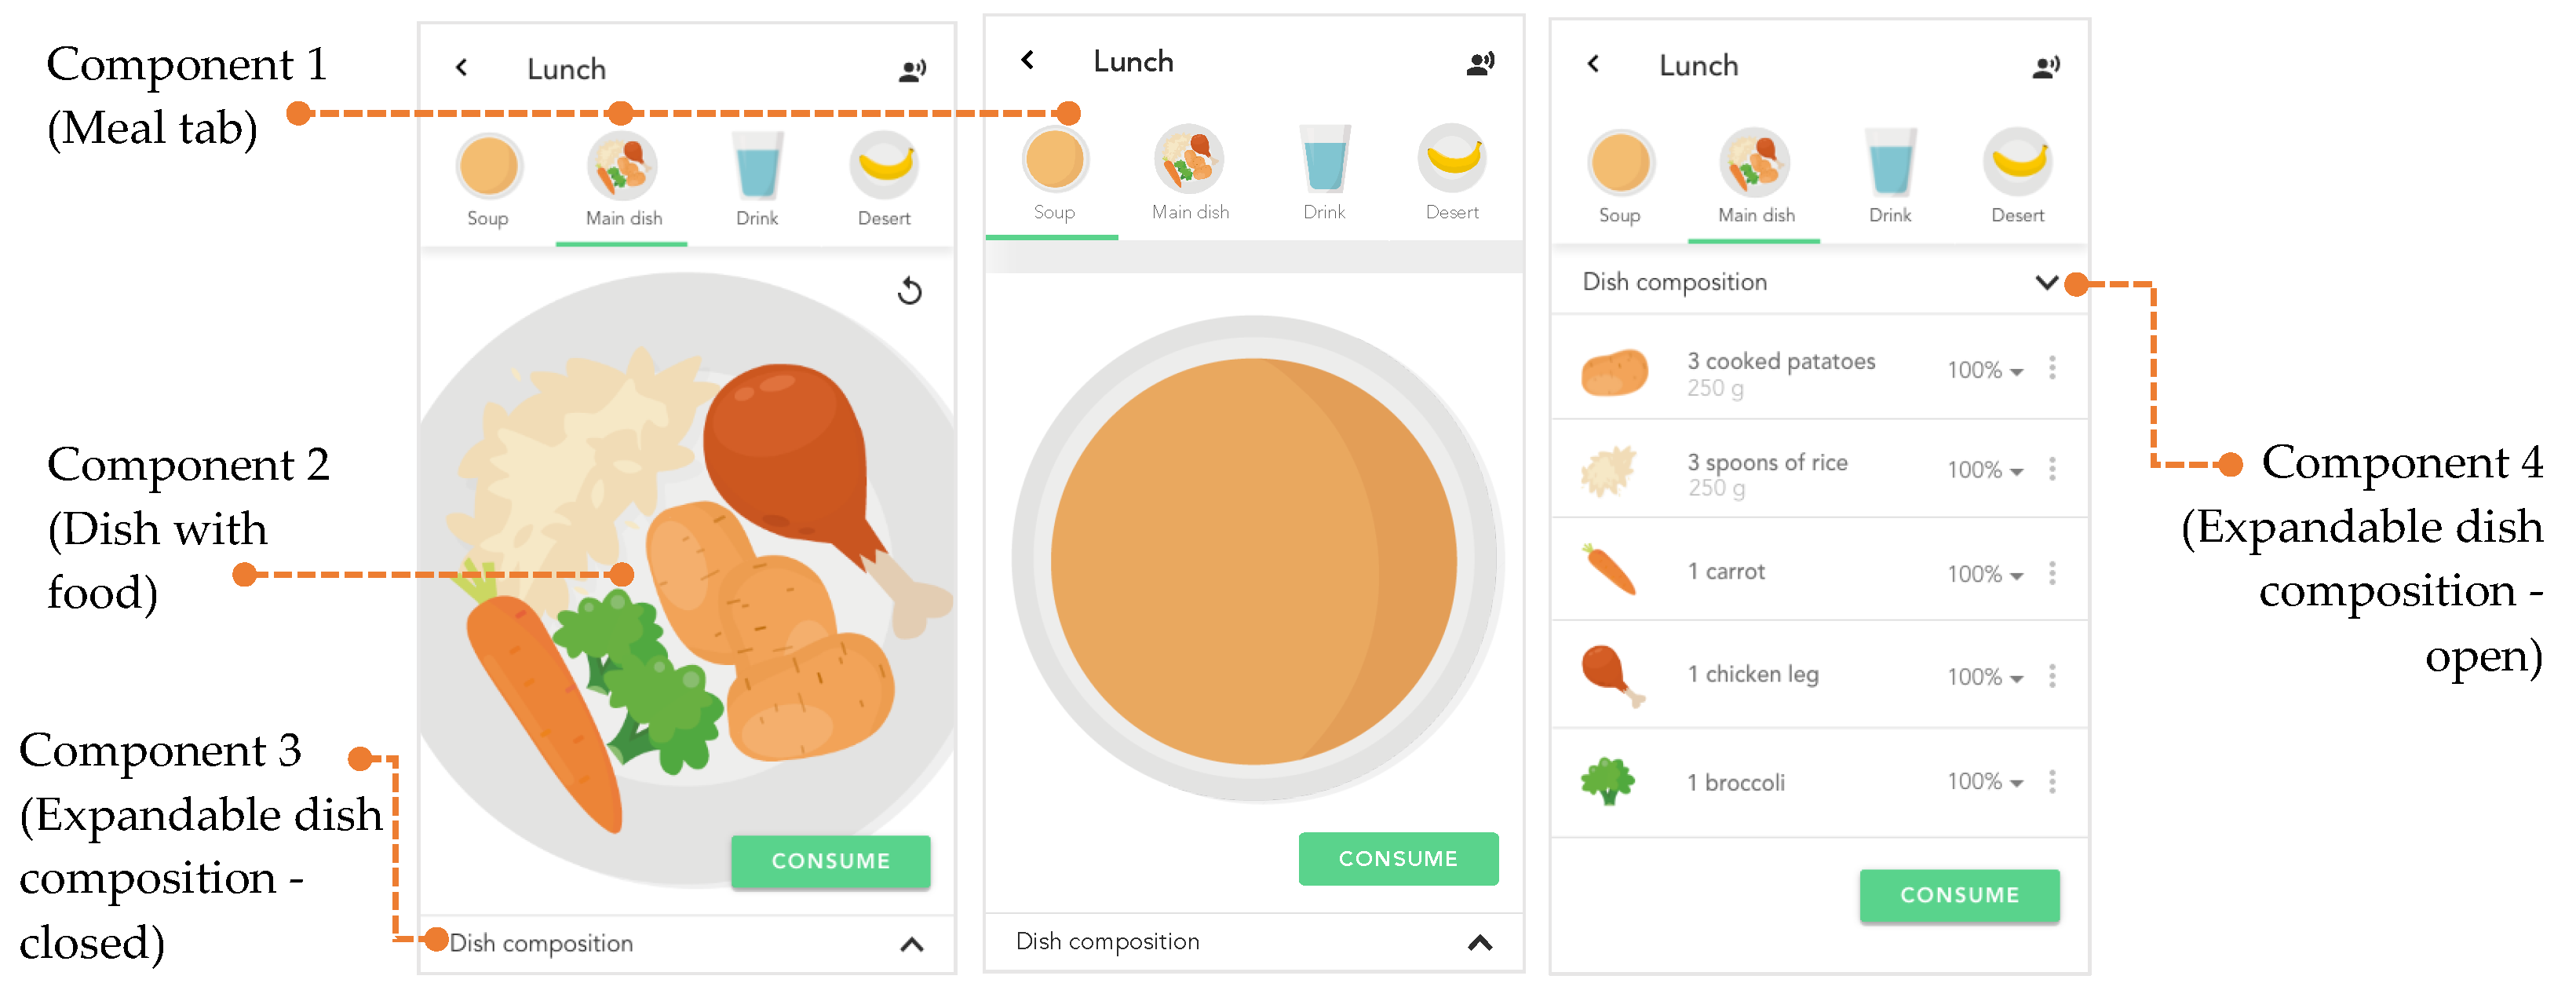
Before designing the interface, it was essential to understand what the system is to its users instead of how the designers present it. This was carried out by creating conceptual models, namely by the definition of a system metaphor [55]. The principles beneath this approach relate to the definition of analogies with the real world; the definition and relation between concepts correctly mapped to the task domain supported by the system. Therefore, in the context of the work presented in this paper, it was crucial to understand what meal planning is for users.
Conceptually, meal planning includes types and amounts of food, incorporating dietary fiber, understanding proper serving sizes, management of eating out and special occasions, as well as incorporating favorite recipes. In real terms, meal planning relates to different food types in a dish. Meals are different throughout the day; the major understood types are breakfast, lunch, snack, and dinner. With this in mind, and considering knowledge acquired by users throughout their lives, a metaphor for the system is the Plate Model [56], as presented in Figure 2. It is a visual method of food representation through pictures, graphs, charts, and food replicas. The centerpiece is the dinner plate, which serves as a pie chart representing the proportions of food. The model also includes side dishes, beverages, and other meal courses. One of the critical elements in nutrition is learning appropriate food quantities. To this end, portion size is an essential aspect of the plate model. Each food must be visually represented in the correct size concerning the overall food distribution on the plate. Using the plate model allows users to understand the concept and carry out tasks in an interface as in real life.
The metaphor used in this context imposes two significant constraints: the creation of sections in the dish—where food is placed—and the visual representation of food so that users will understand the meal. For the first, as presented in Figure 3, the general idea is to create sections in the dish that contain food (considering the food plan prescribed by a nutritionist). The algorithm used to create the circular areas is presented in Section 4.2.1.
For the visual representation of food products, a list of 1307 products was considered. Given the effort required to create each item, they were separated into 77 categories representing several food products or groups. Similar categories were grouped into contexts (presented in Table A1 of Appendix B): drinks, common carbohydrates, milk derivatives, deserts and sweet food, proteins, fruits, vegetables, and other categories that do not fit in the previous. All the elements were created in the scope of this paper for an accurate representation of the food products.
Another important aspect is the percentage of food ingested from the dish. The real-time monitoring of a food plan depends on the feedback on the adequate ingestion of nutrients. It avoids misleading feedback on meal consumption. Therefore, it is critical to represent the percentage of consumed food, which is concordant with the common knowledge of users and the plate model, instead of looking at grams of consumption, which are much more challenging to measure. This way, visual markers were created, representing 200%, 150%, 100%, 75%, 50%, and 25% of each food in the prescribed meal, as shown in Table A2 of Appendix B.

4.2. Components

As presented in Section 3 and Section 3.3, several requirements have to be met so that the application can be used by both AP (at an early stage of AD) and IC/FC. Therefore, this section aims to provide a tool to control a nutritionist’s real consumption of a prescribed food plan and the development of several components. First, the core component of the application is the dynamic import and presentation of the meal consultation and the consumption of food in a meal. It comprises a meal tab, a detailed view of the food that composes the meal, and the plate presentation and the food on the plate, as presented in Figure 4.
Given that dehydration is common in people with diseases that cause dementia, water intake outside meals is a critical aspect to consider for patients and has to be taken into account in the interface design and implementation. In the following subsections, several features of the application are presented. Figure A2 of Appendix C presents a general view of the navigation scheme of the application depicted in this section.

4.2.1. Import Meal

In a food plan, the nutritionist defines the meal and it is delivered to the patient or its IC. Every imported meal is dynamic and can be composed of a combination of soup, main dish, water, and desert (Figure 5). Each element contains different food consumed (or not) by the AD patient. These data are stored in a structure containing Boolean values determining the element’s visibility in the dish tab.
Moreover, when a user consumes a dish (c.f. Section 4.2.3), this list provides feedback to the user on the meal consumed. To achieve that, the data structure containing the food in the dish is compared to the food consumed. A checkmark is added to the meal to represent its consumption when there is a complete match.
Another important feature is the food placement in the dish when the food plan is imported. The D3.js (Data-Driven Documents) [57] provides a set of libraries that allow data to bind to a Document Object Model (DOM). This paper implemented a variation of the Zoomable Circle Packing library [58], where a circle represents each node (meal). All children of that node (food in a meal) are positioned next to each other at that level, as presented in Figure 3 of Section 4.1. This library determines the size and minor circle spaces considering the amount of food to be ingested (in grams). It allows the correct representation of food for a natural and dynamic visualization of meals to the user, depicted in Figure 6.
Another important feature is the correct representation of food in a meal when the food plan is imported into the application. Visually, if a certain amount of prescribed food is low, then the visual representation of this food in the dish must be low (as in a normal dish). For example, if broccoli has a low percentage in the dish, its size has to be adjusted to be visually adequate. To implement relative amounts of food in the dish, the flow presented in Figure 7 was applied.
The logic is implemented in the following manner. First, it is important to consider that a food plan is composed of the amount of food (in grams) that must be consumed to reach the goal of nutrients for each day. Therefore, the amount of food is converted into the percentage of food occupied in a dish. Next, the percentage of food is converted into images representing that food, and a meal is visually generated. For example, if 100 g of a specific food is represented by one image, 200 g is represented by two images of that food.

4.2.2. Weekly View of Food Plan

The previous knowledge of a future meal is of major interest to users once they can plan and anticipate food ingestion. Considering that people tend to shop for food on a weekly basis, the interface design focused on presenting the food plan for a week. This allows users to view the nutrients required for ingestion and change some food that is of interest (as presented in Section 4.2.3). The weekly view of the food plan is presented in Figure 8.
For each day, the food plan is presented to the user as a general view of the meals to be consumed. Moreover, the user can add an extra meal by clicking the “+” button (see Figure 9 of Section 4.2.3). When a portion of food is consumed (food with a checkmark in Figure 8), the nutrients associated with the food are added to the overall nutrients that are to be consumed on a specific day. So far, the natural operation of viewing and the general consumption of a food plan was created in the interface and is presented in Section 4.2.1 and Section 4.2.2. The following sections focus on the design of the remaining four natural operations on food in a meal: partial consumption, exchange, add/remove, and water consumption.

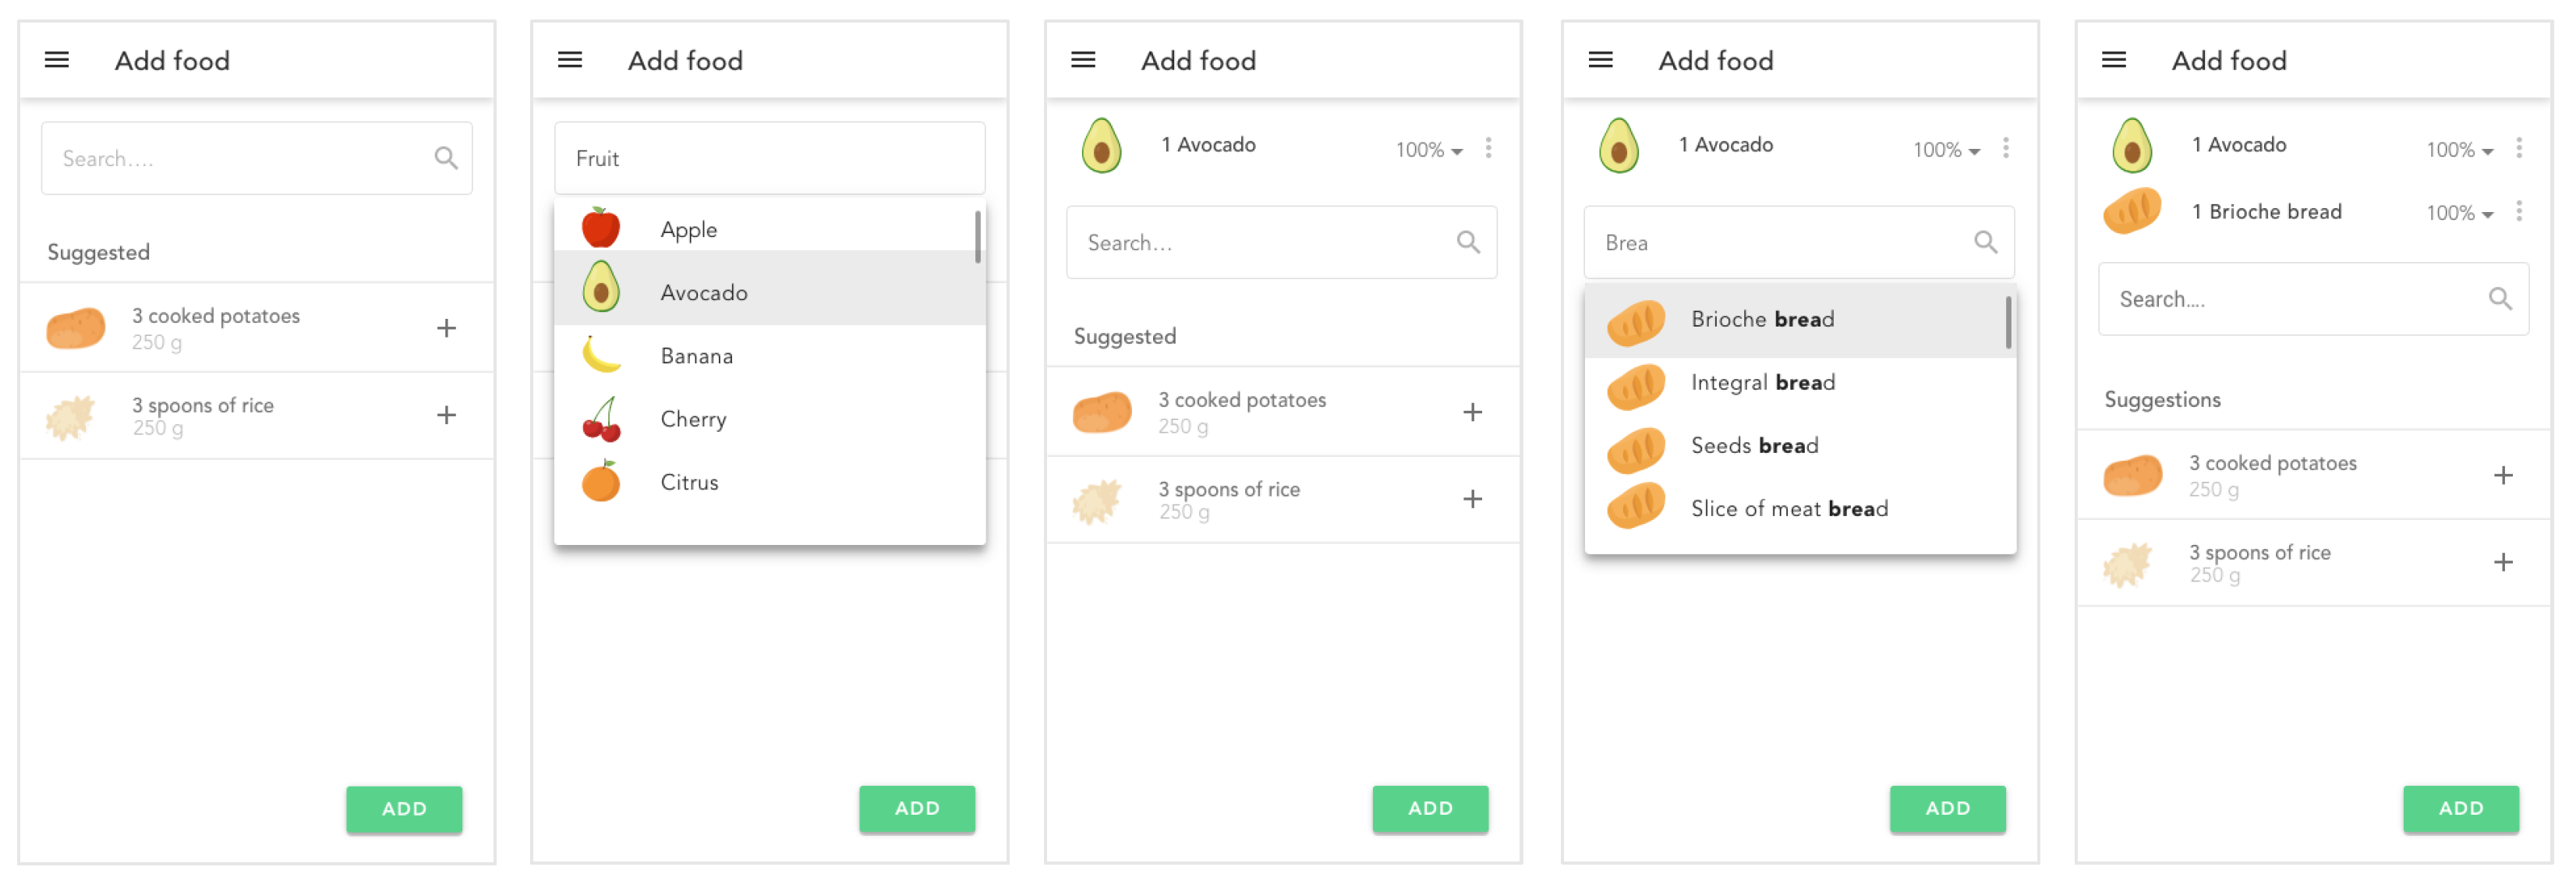
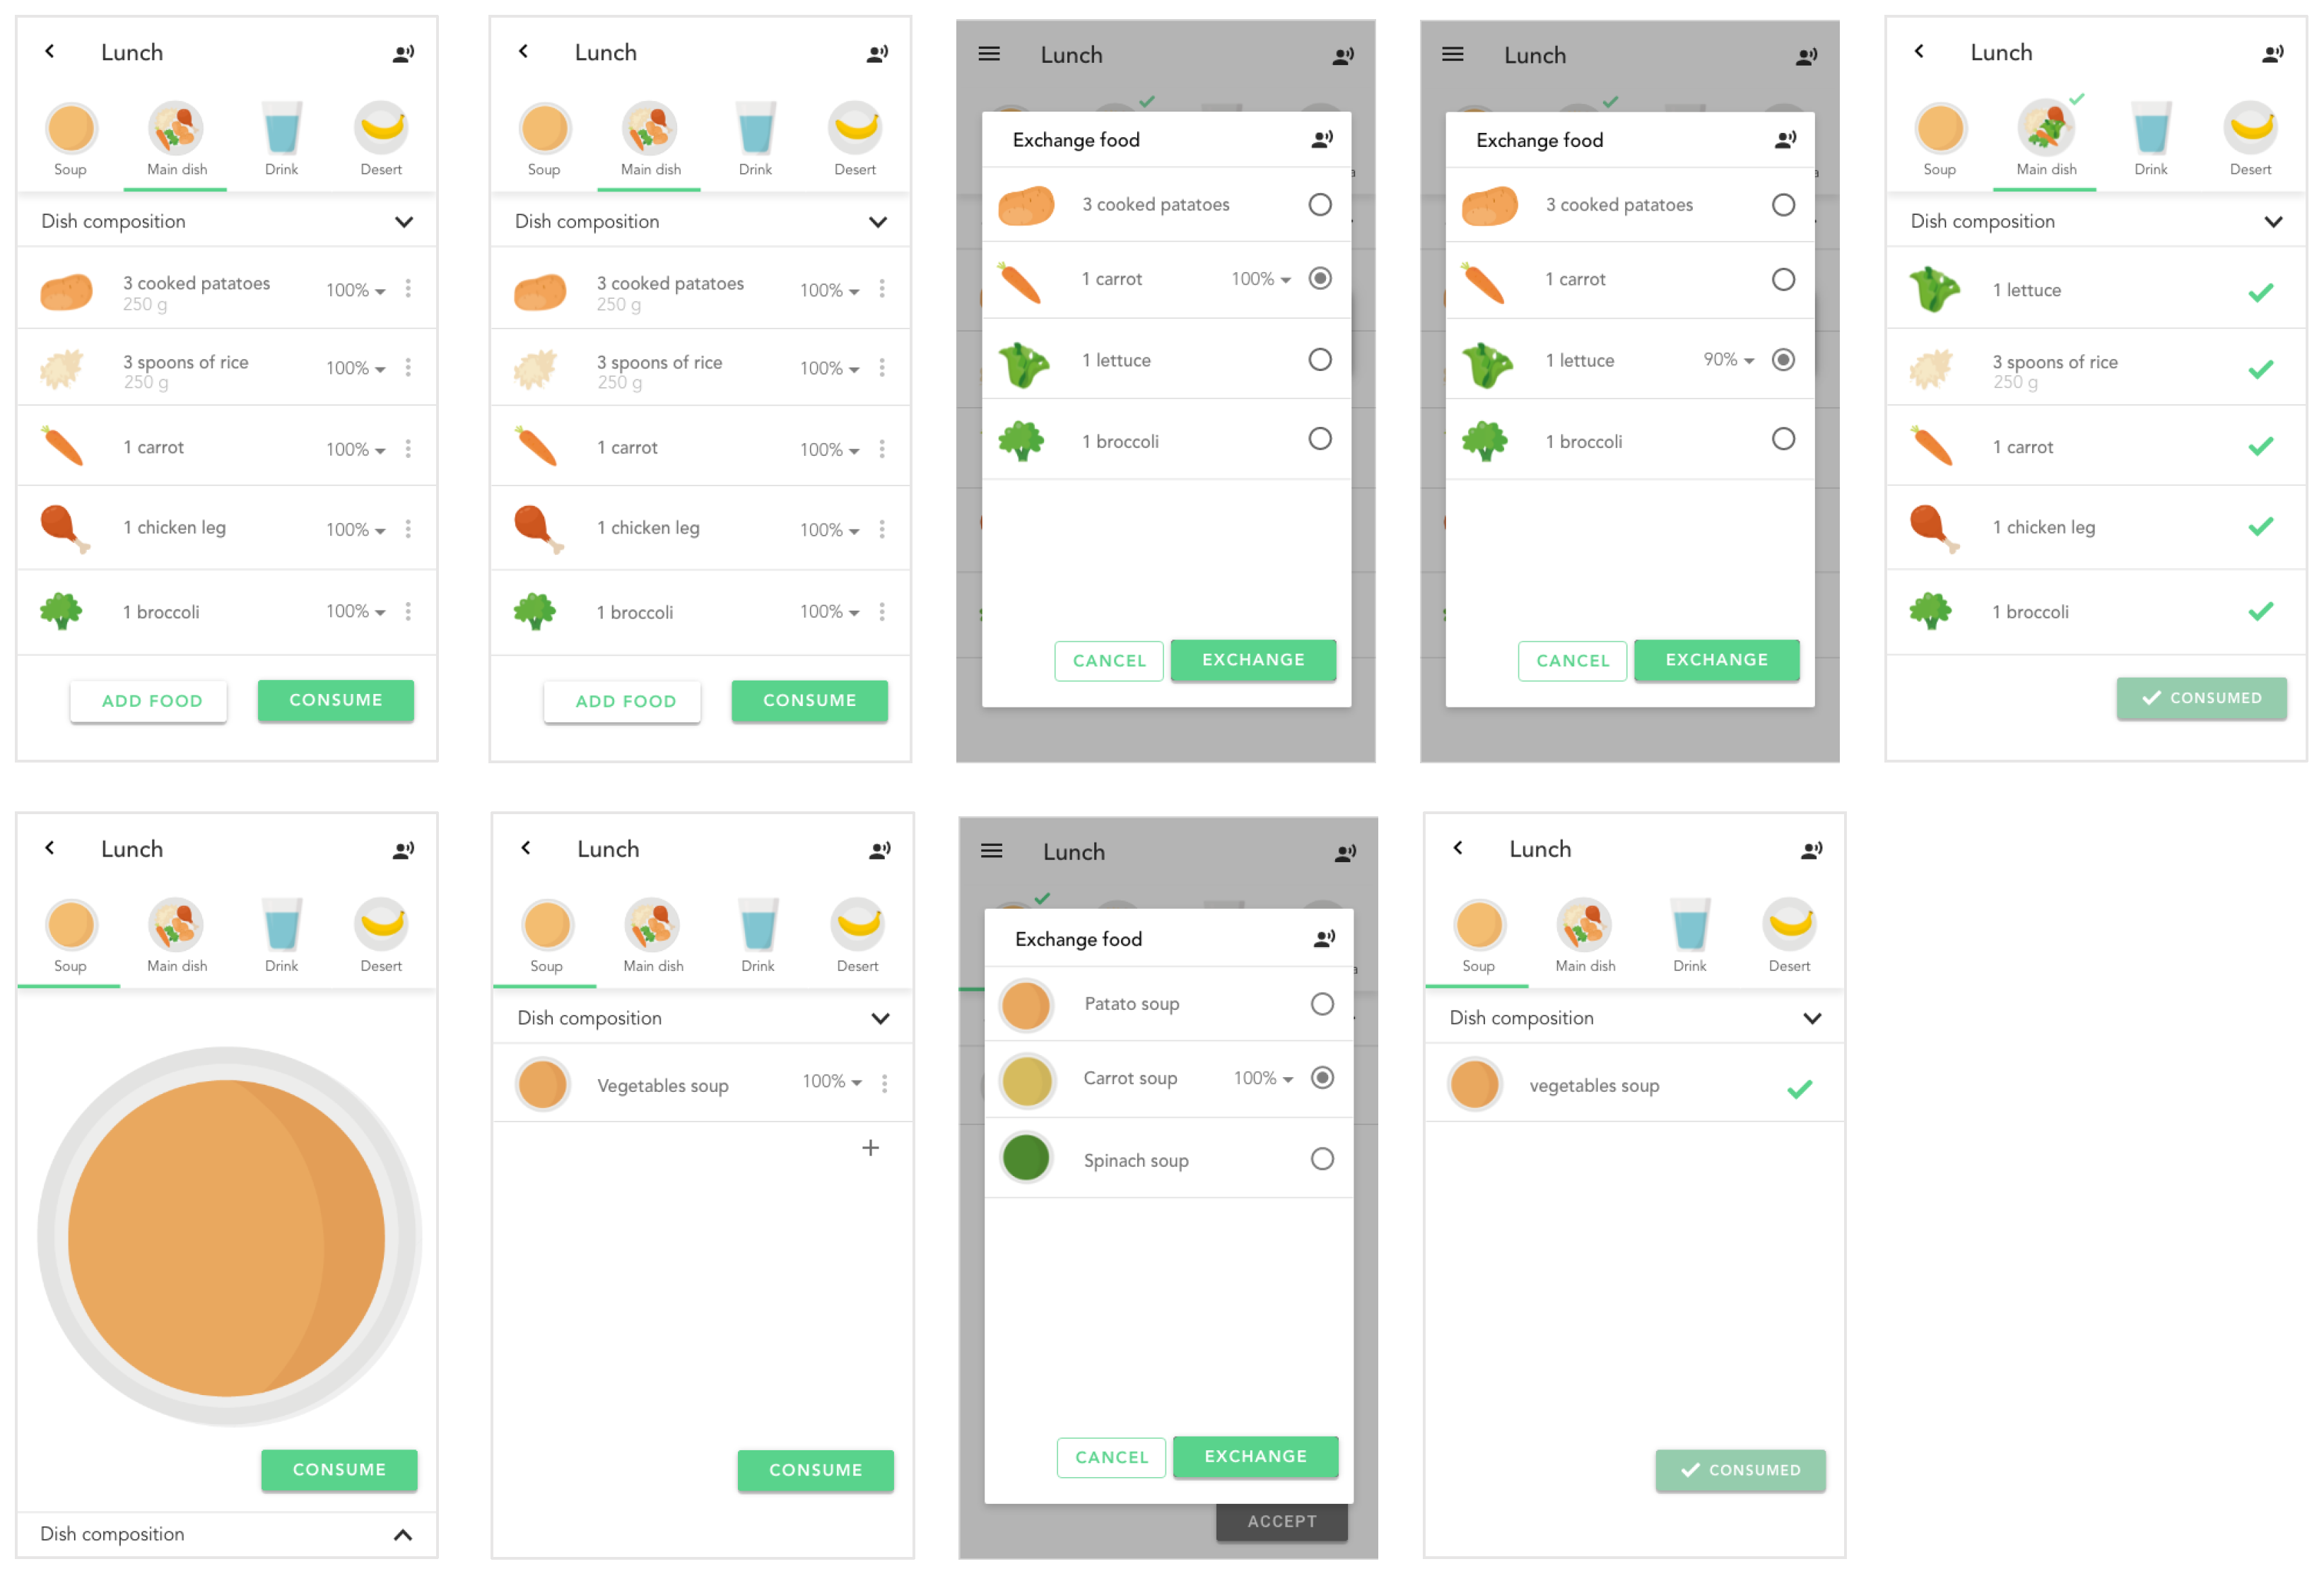
4.2.3. Operations on Food and Meal

The concept associated with partial food consumption in a meal is very important for nutritionists since it determines the number of nutrients consumed according to a prescribed food plan. Therefore, if a user only consumes 80% of a particular food, it is important to provide such feedback to the nutritionist since this will provide a realistic view of the food plan consumption and infer the real amount of nutrients consumed. This is presented in the first row of Figure 10, where the user registers the consumption of only 90% of the defined amount of carrots.
The concept of food change in a meal is associated with the ability of the user to change food from the food plan (with an equivalent) related to the user’s food preferences and the availability of specific food. This allows users to adjust the food plan, maintaining the base nutrients that compose a meal (second row of Figure 10, where a soup is changed with another soup). To this end, the user interface was created considering that food equivalent to the same nutritional level can be exchanged with another food.
Finally, adding food to a meal is an option that has to be provided to users. Consuming food outside a prescribed food plan is not a desirable option since the plan is adjusted to nutrients for each user. However, adding this feature allows positive feedback to the nutritionist and implements a realistic view of ingested food (Figure 9). Moreover, it allows the nutritionist to adjust periods of food ingestion and types of meals by considering the user’s food ingestion habits.

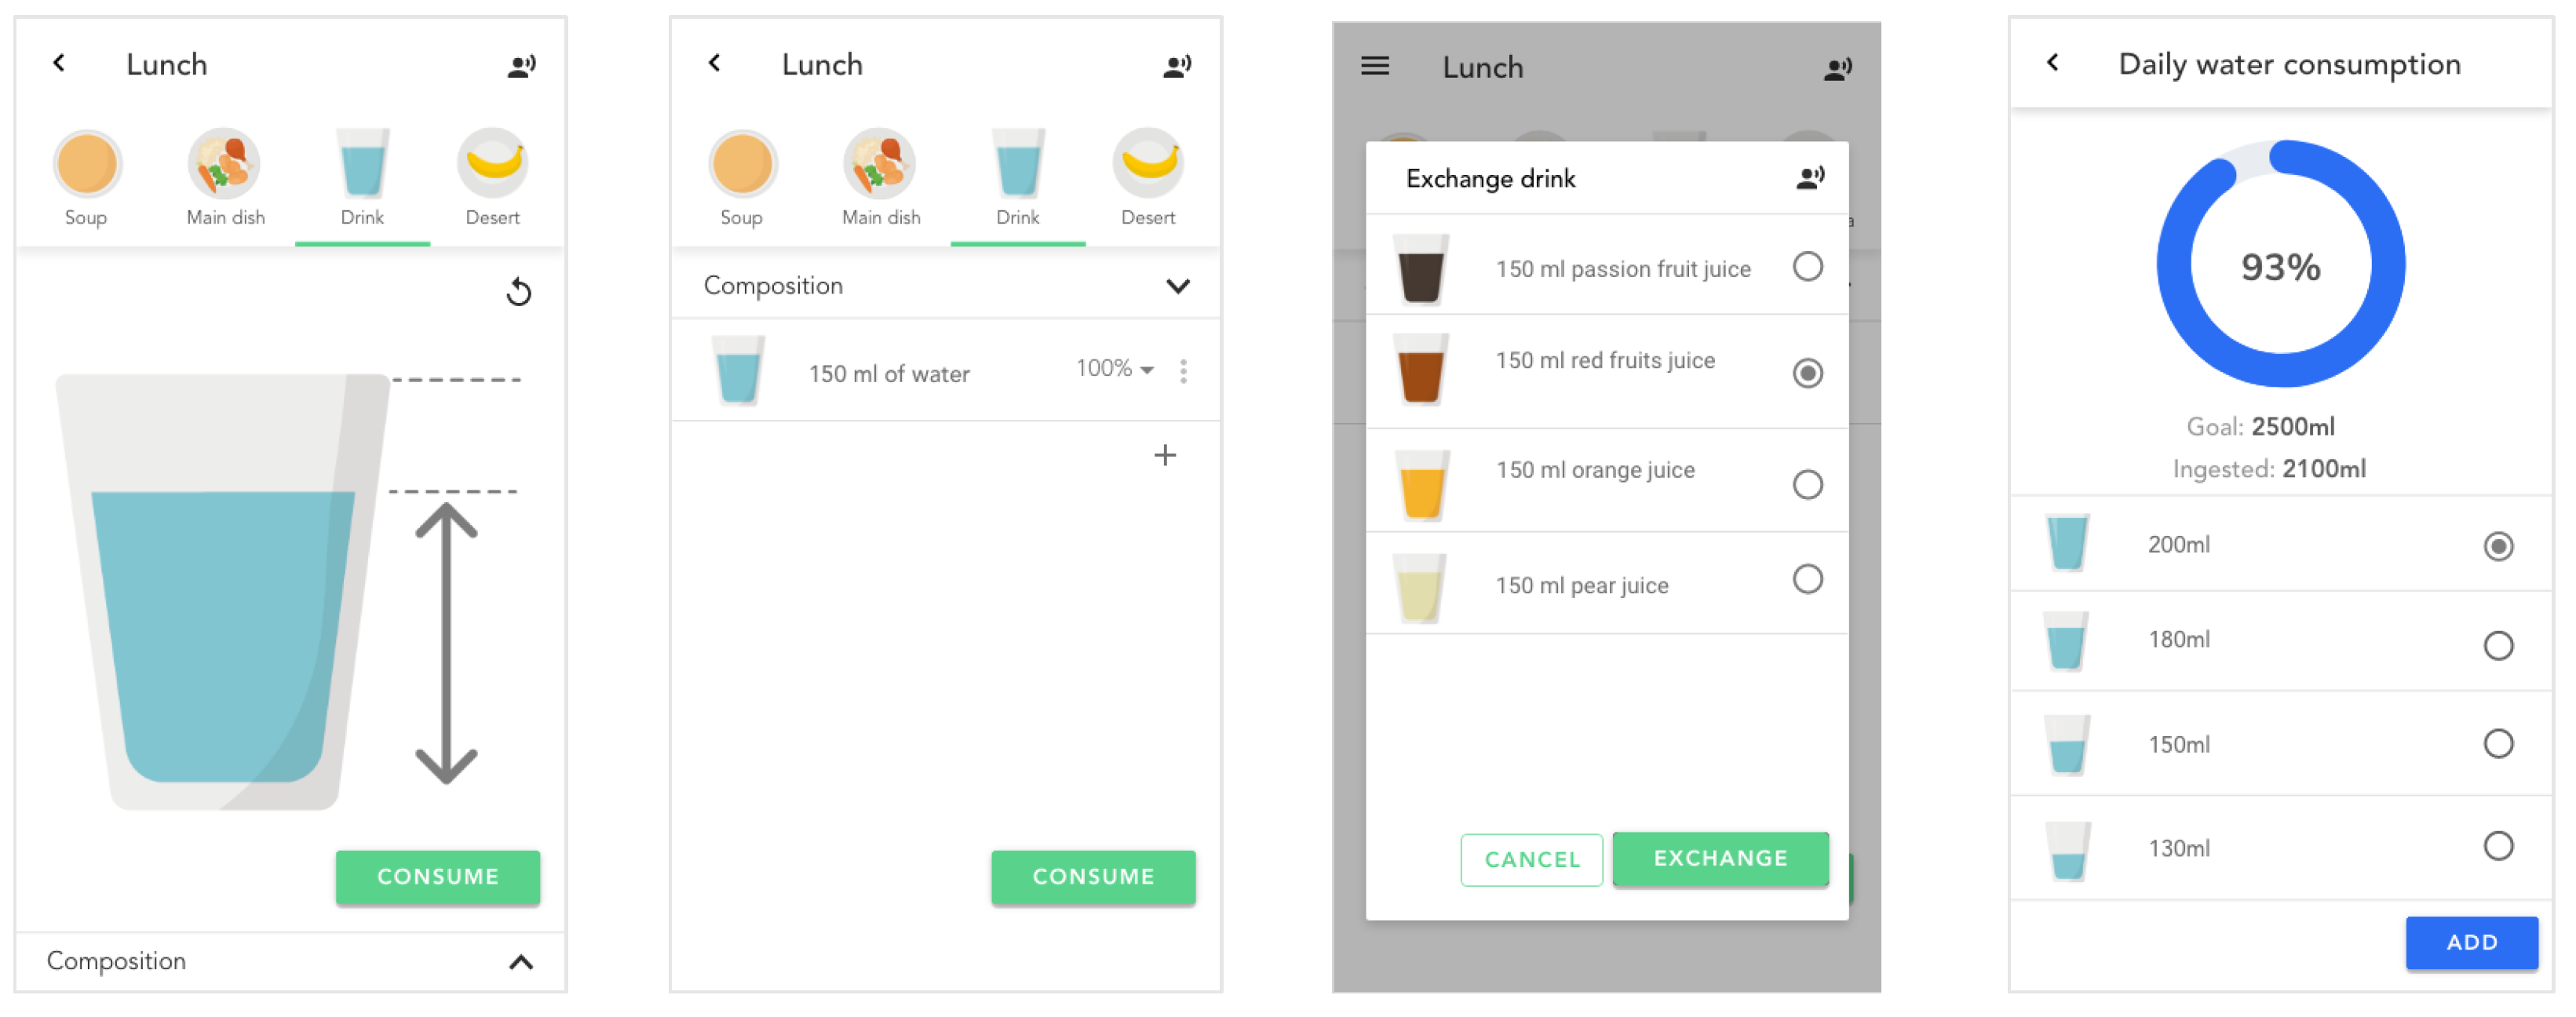
4.2.4. Water Consumption

Water consumption is most important to individuals with Alzheimer’s due to the impact of a lack of hydration. Therefore, this element, presented in Figure 11, is represented in the meal interface and the menu tab. The design process is analogous to the mental, where the user has visual markers for water ingestion and different quantities of water. The information on each day’s hydration goal is present since it is a stimulus for reaching the goal and maintaining adequate hydration levels.

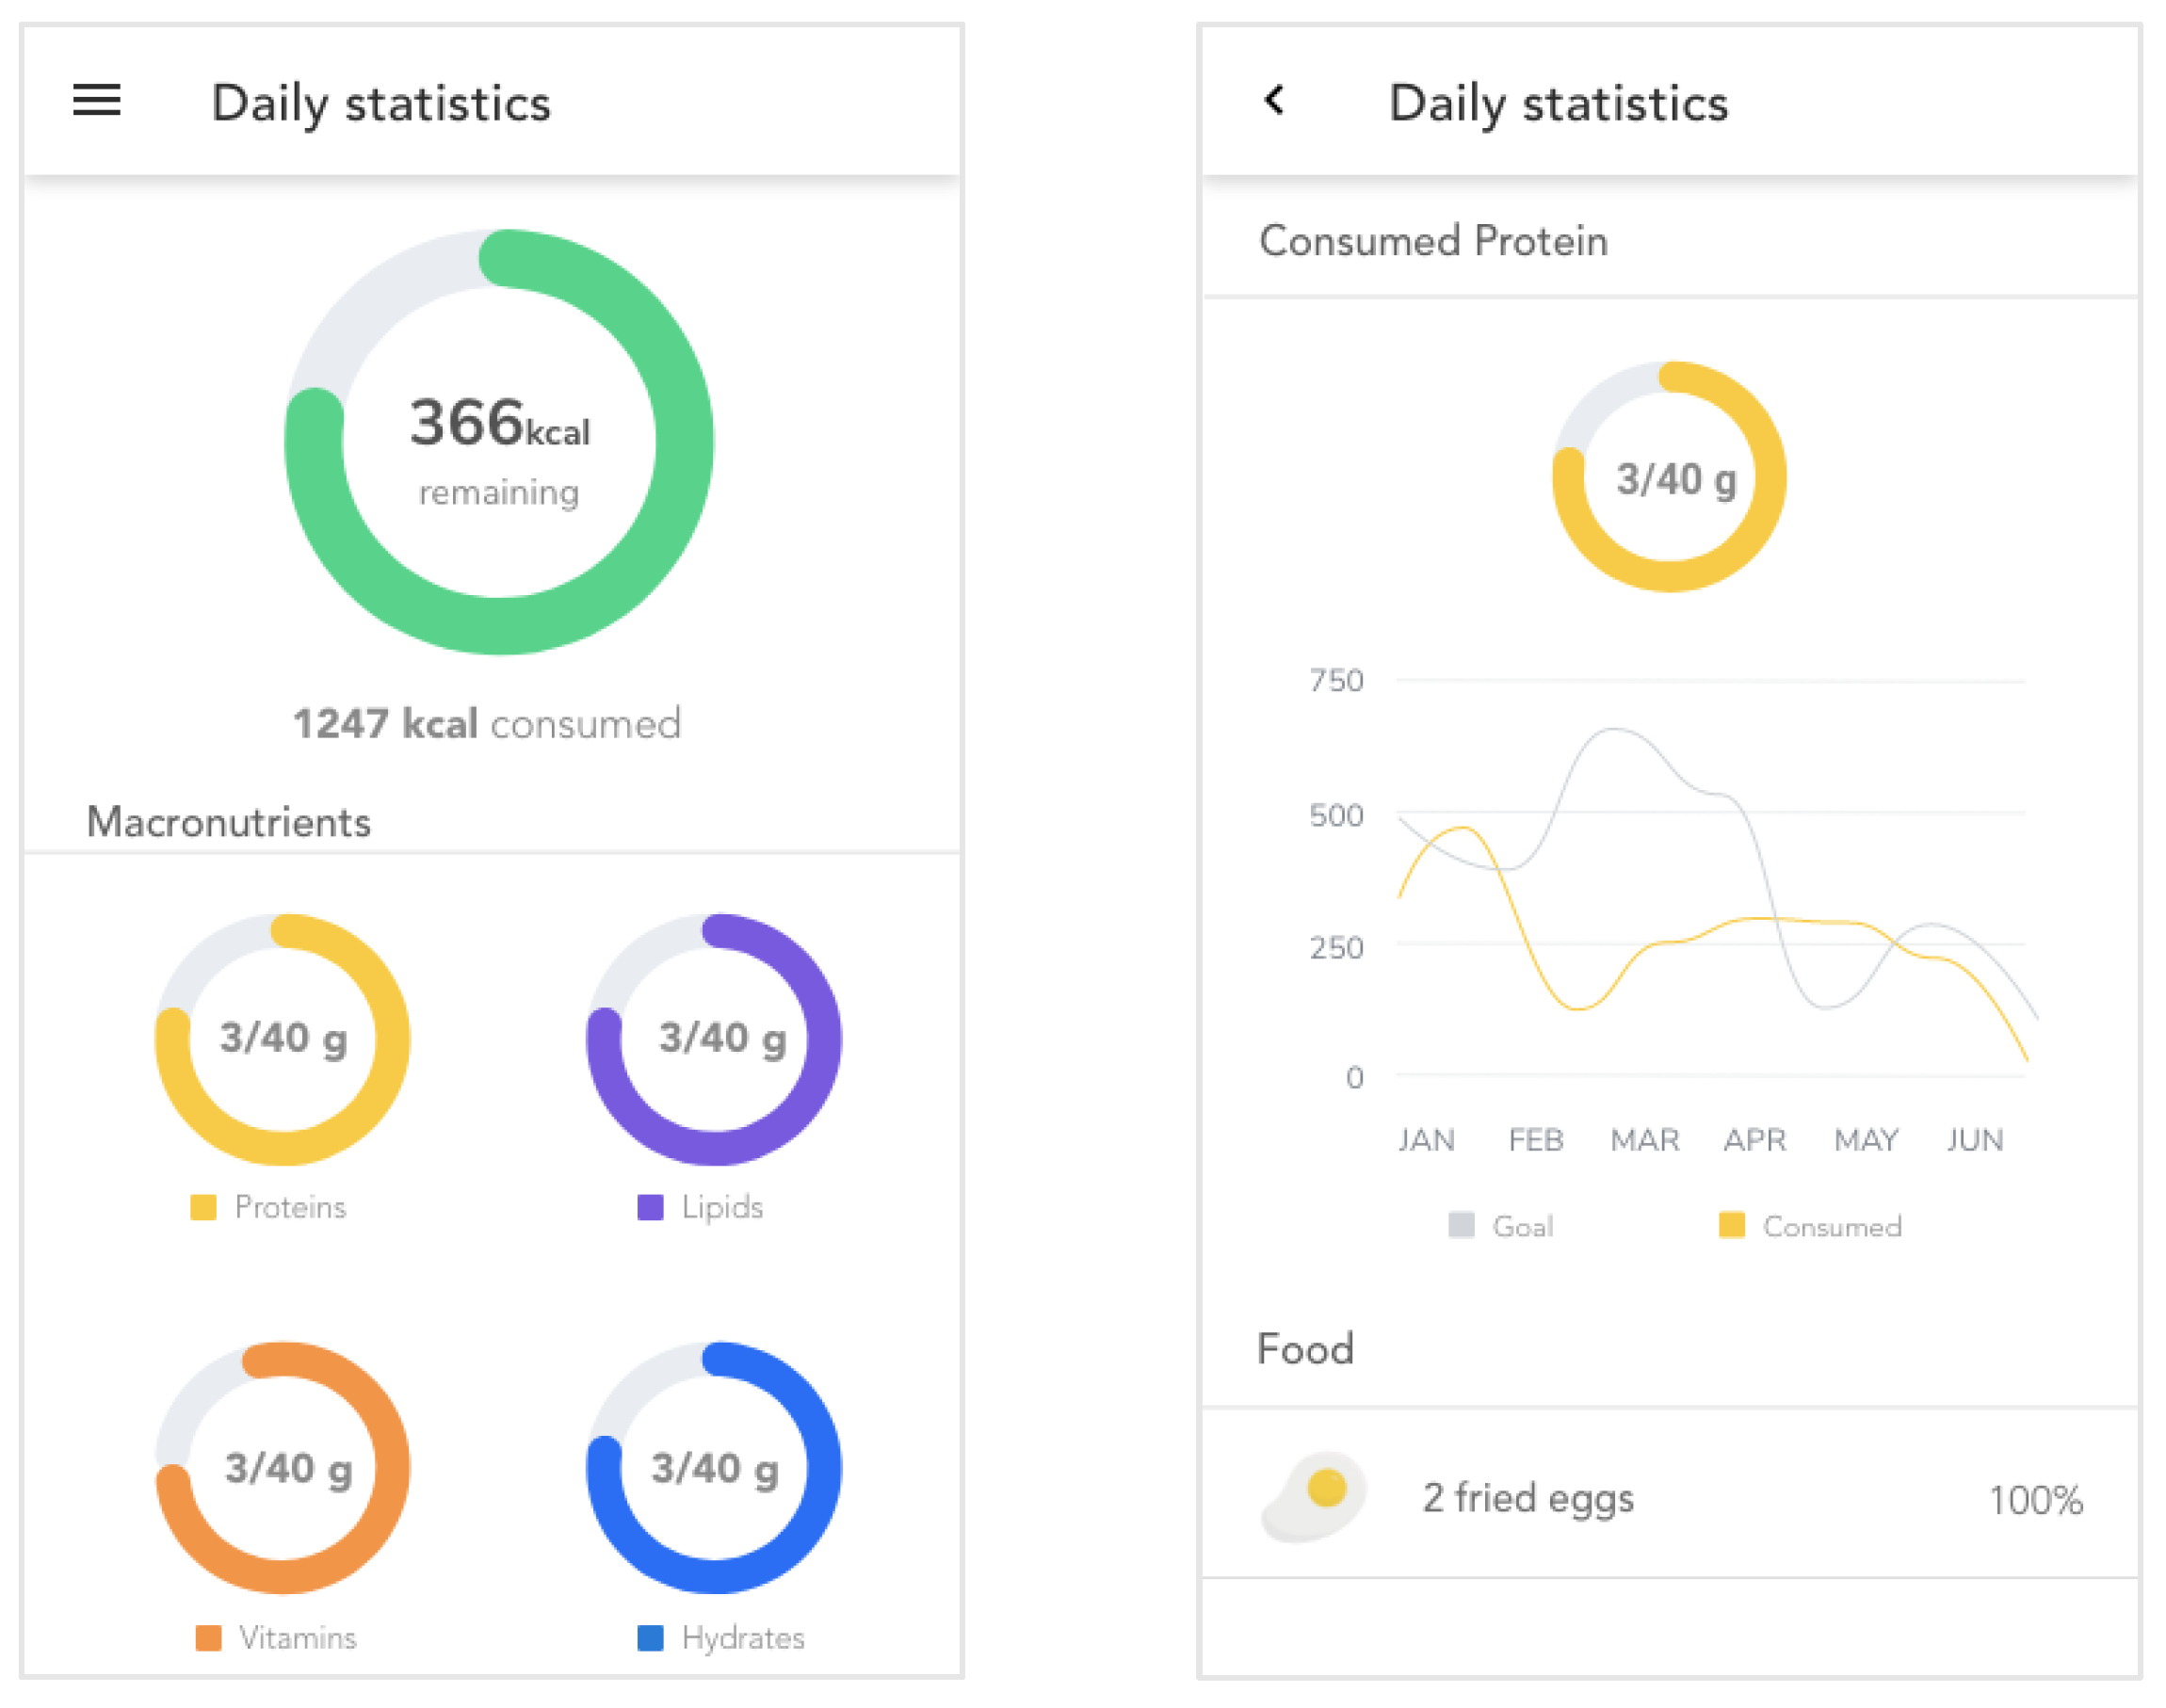
4.2.5. Macronutrients Statistics

Similar to hydration, daily statistics related to the ingestion of macronutrients are also available for consultation (Figure 12). More than a piece of information for consultation, these statistics also serve the purpose of goal-reaching either for the correct ingestion of macronutrients, materialized in calories, or the food that has most contributed to each category.

5. Evaluation

The findings of assessing the quantitative data acquired from the participants in the execution of the tasks identified in Table 2 with the app features are presented in this section. Results are based on the execution time for each task and the application of the UEQ.
Regarding the execution times for each task, Table 3 presents the average time (in seconds) that users took to complete the tasks. As expected, results show that tasks that change the original food plan for logging purposes manifest higher interaction costs. Each extra food added to the plan (lettuce or ice cream in the tasks, also presented in Figure 9) required 8.6 s of the user’s time. The most challenging UI tasks required manually searching for new food, since the keypress increases interaction costs. For example, exchanging food for an equivalent (3.6 s, also presented in Figure 10) reduces by more than half the time taken to execute the task (when compared to the 8.6 s adding extra food). The rationale is that to exchange food for an equivalent, a small list of equivalents is presented, while for adding an extra food, the user must search for food. Preference learning techniques based on customized food preferences can be a solution to help reduce the time required for logging extra food. The food search converts into a list of preferences, which will bring the execution times to the level of those of exchanging for an equivalent.
For the user to visualize a meal presented in the food plan required 3.5 s; this is related to the time taken to access the meal and the dish composition interaction (see Figure 4). Logging one meal by confirming the original food plan only required 1.2 s (accessing the meal tab and clicking on the consume button—last image of Figure 4). Given the similarity of the tasks that were designed considering the mental process of the user, several tasks have similar implementations. Water consumption outside the food plan (last image of Figure 11) required 2.3 s to complete the task.
Based on the UEQ scale benchmark, the product’s overall rating is excellent, as Table 4 and Figure 13 show. The highest mean score is efficiency, with a mean of 2.59 ( σ = 0.26 ), followed by novelty and attractiveness, with a mean of 2.48 ( σ = 0.20 and σ = 0.40 , respectively). This suggests that the product is considered easy to use, unique and innovative, and users like interacting with it.
The scales of the UEQ can be grouped into pragmatic quality (perspicuity, efficiency, dependability) and hedonic quality (stimulation, originality). Pragmatic quality describes task-related quality aspects, and hedonic quality refers to the non-task-related quality aspects. Since attractiveness is defined as the overall impression of the software application, it is considered an individual dimension. In Table 5, the mean of the three pragmatic and hedonic quality aspects is calculated.
Considering that the pragmatic quality mean is 2.30, it is noted that users can perform their tasks with greater efficiency and effectiveness. The hedonic quality mean is 2.38, implying that users have a positive experience and are willing to use it frequently.

6. Conclusions

This paper presented the user interface design and implementation of a mobile application to allow real-time food plan management for Alzheimer’s patients through a design based on UCD and UEQ. Focused on UCD, the application should be simple to use to allow the execution of complex tasks such as exchanging food in a meal for an equivalent and to have a detailed view of a food plan. This was achieved using the Plate Model [56] for the interface metaphor. Once the representation of realistic images of food in a dish presented a problem, we created visual representations of contexts of products to represent 77 categories containing 1307 products. This allowed the plate design to be easily manipulated in three levels: food placement, amount of food, and exchange of food for equivalents. The dynamic placement of food on a plate was carried out using the Zoomable Circle Packing library [57], which relates the size of the visual marker to the amount of food prescribed in a food plan.
To validate the quality of the design and the user experience, the UEQ was used. Results show that the application obtained excellent results for the interaction of IC and intuitively covers the most complex tasks. The attractiveness and the perspicuity of the application unveil the good perception that the ICs have of the execution of tasks, thus reducing the burden associated with the use of such applications in the care of AD patients. Moreover, the interface provides an efficient approach to complex tasks that, together with a perceived novelty and stimulation, provides users with a sensation of natural interaction with the system. Therefore, the major conclusion is that the complexity of accurate food plan management can be simplified through interface design based on UCD. This, together with the ability to provide real-time data to the nutritionist, improves on existing available applications that mostly allow the general control of a food plan and do not account for the amount of ingested food from a defined meal. This work presents a few limitations. First, we focused on designing a system based on the Plate Model, where the mapping between real food plans and their management was the core focus. We did not intend to duplicate features present in other mobile applications (which are very important) but to validate the Plate Model approach. Therefore, to be more complete and consider the age group with health conditions, our application should also include the design and implementation of features such as games for mental stimulation, tips for food, recipes, exercises, and the ability to communicate with others.
In future work, we plan to explore the ability to remove the role of the nutritionist in two ways. First, by using Preference Learning [59,60], the system will learn from users’ food preferences, and the interaction related to the exchange of food will be reduced. It is expected that, as the system learns, food suggestions in the food plan will be more personalized rather than predefined diets. This will improve the quality of food ingestion by AD patients. Next, by including the PL model together with the value of calories to be ingested and a type of diet to be followed by an AD patient, the system will automatically generate a food plan based on the needs of macro-nutrients (see [61,62] for related approaches), adjusted in real-time from the ingestion of food in food plans.

Author Contributions

Conceptualization and project administration, C.A.S.C.; Software Interaction Design, R.P.D. and V.N.N.A. All authors have read and agreed to the published version of the manuscript.

Funding

This work is funded by National Funds through the FCT—Foundation for Science and Technology, I.P., within the scope of the project Ref. UIDB/05583/2020. Furthermore, we thank the Research Centre in Digital Services (CISeD) and the Instituto Politécnico de Viseu for their support. Moreover, the authors greatly thank IPV/CGD—Instituto Politécnico de Viseu/Caixa Geral de Depósitos Bank, within the scope of the projects PROJ/IPV/ID&I/002 and PROJ/IPV/ID&I/007.

Data Availability Statement

Not applicable.

Acknowledgments

We want to thank the nutritionist Marco Pontes, São Mateus Hospital, Social Works of City Hall at Viseu, Maria João Sebastião, Maria João Lima, Carlos Vasconcelos, Lia Araújo, Sara Rocha, Joana Santos, and Carlos Albuquerque for their support in this project.

Conflicts of Interest

The authors declare no conflict of interest.

Appendix A. List of Server Requests

Figure A1. List of Server requests from the API.
Futureinternet 15 00168 g0a1

Appendix B. Categories and Contexts of Food Products

Table A1. Categories and contexts of food products.
Fruits
Star fruitBananaPersimmonAppleAvocadoCherryPomegranatePeachStrawberry
Futureinternet 15 00168 i001Futureinternet 15 00168 i002Futureinternet 15 00168 i003Futureinternet 15 00168 i004Futureinternet 15 00168 i005Futureinternet 15 00168 i006Futureinternet 15 00168 i007Futureinternet 15 00168 i008Futureinternet 15 00168 i009
LemonFigRaspberryPumpkinMelonQuinceCitrusGrapesMango
Futureinternet 15 00168 i010Futureinternet 15 00168 i011Futureinternet 15 00168 i012Futureinternet 15 00168 i013Futureinternet 15 00168 i014Futureinternet 15 00168 i015Futureinternet 15 00168 i016Futureinternet 15 00168 i017Futureinternet 15 00168 i018
PapayaPineapplePlumKiwiWatermelonPearTomato
Futureinternet 15 00168 i019Futureinternet 15 00168 i020Futureinternet 15 00168 i021Futureinternet 15 00168 i022Futureinternet 15 00168 i023Futureinternet 15 00168 i024Futureinternet 15 00168 i025
Drinks
WaterNatural
Juices
CoffeeWineBeerCarbonated
Drinks
MilkTea
Futureinternet 15 00168 i026Futureinternet 15 00168 i027Futureinternet 15 00168 i028Futureinternet 15 00168 i029Futureinternet 15 00168 i030Futureinternet 15 00168 i031Futureinternet 15 00168 i032Futureinternet 15 00168 i033
Deserts and sweet food
PuddingIce-creamCakeChocolateCookieGelatinCreamJam
Futureinternet 15 00168 i034Futureinternet 15 00168 i035Futureinternet 15 00168 i036Futureinternet 15 00168 i037Futureinternet 15 00168 i038Futureinternet 15 00168 i039Futureinternet 15 00168 i040Futureinternet 15 00168 i041
Vegetables
ArtichokePeasTurnipPeeperSaladCucumberRadishAsparagus
Futureinternet 15 00168 i042Futureinternet 15 00168 i043Futureinternet 15 00168 i044Futureinternet 15 00168 i045Futureinternet 15 00168 i046Futureinternet 15 00168 i047Futureinternet 15 00168 i048Futureinternet 15 00168 i049
CarrotBroccoliCourgetteGarlicEggplantOnionMushroom
Futureinternet 15 00168 i050Futureinternet 15 00168 i051Futureinternet 15 00168 i052Futureinternet 15 00168 i053Futureinternet 15 00168 i054Futureinternet 15 00168 i055Futureinternet 15 00168 i056
Proteins
SausageSalty meatPoultry meatMeatFinger foodEggFish
Futureinternet 15 00168 i057Futureinternet 15 00168 i058Futureinternet 15 00168 i059Futureinternet 15 00168 i060Futureinternet 15 00168 i061Futureinternet 15 00168 i062Futureinternet 15 00168 i063
Other categories
Dry fruitsBeansTruffleSoupCinnamonTofu
Futureinternet 15 00168 i064Futureinternet 15 00168 i065Futureinternet 15 00168 i066Futureinternet 15 00168 i067Futureinternet 15 00168 i068Futureinternet 15 00168 i069
Carbohydrates
PastaRiceCerealsPotatoBread
Futureinternet 15 00168 i070Futureinternet 15 00168 i071Futureinternet 15 00168 i072Futureinternet 15 00168 i073Futureinternet 15 00168 i074
Milk derivatives
YogurtCheeseButter
Futureinternet 15 00168 i075Futureinternet 15 00168 i076Futureinternet 15 00168 i077
Table A2. Visual representations of food (pasta, meat, salad, and bread) to reflect the percentage the patient ingests.
200%150%100%75%50%25%
Futureinternet 15 00168 i078Futureinternet 15 00168 i079Futureinternet 15 00168 i080Futureinternet 15 00168 i081Futureinternet 15 00168 i082Futureinternet 15 00168 i083
Futureinternet 15 00168 i084Futureinternet 15 00168 i085Futureinternet 15 00168 i086Futureinternet 15 00168 i087Futureinternet 15 00168 i088Futureinternet 15 00168 i089
Futureinternet 15 00168 i090Futureinternet 15 00168 i091Futureinternet 15 00168 i092Futureinternet 15 00168 i093Futureinternet 15 00168 i094Futureinternet 15 00168 i095
Futureinternet 15 00168 i096Futureinternet 15 00168 i097Futureinternet 15 00168 i098Futureinternet 15 00168 i099Futureinternet 15 00168 i100Futureinternet 15 00168 i101

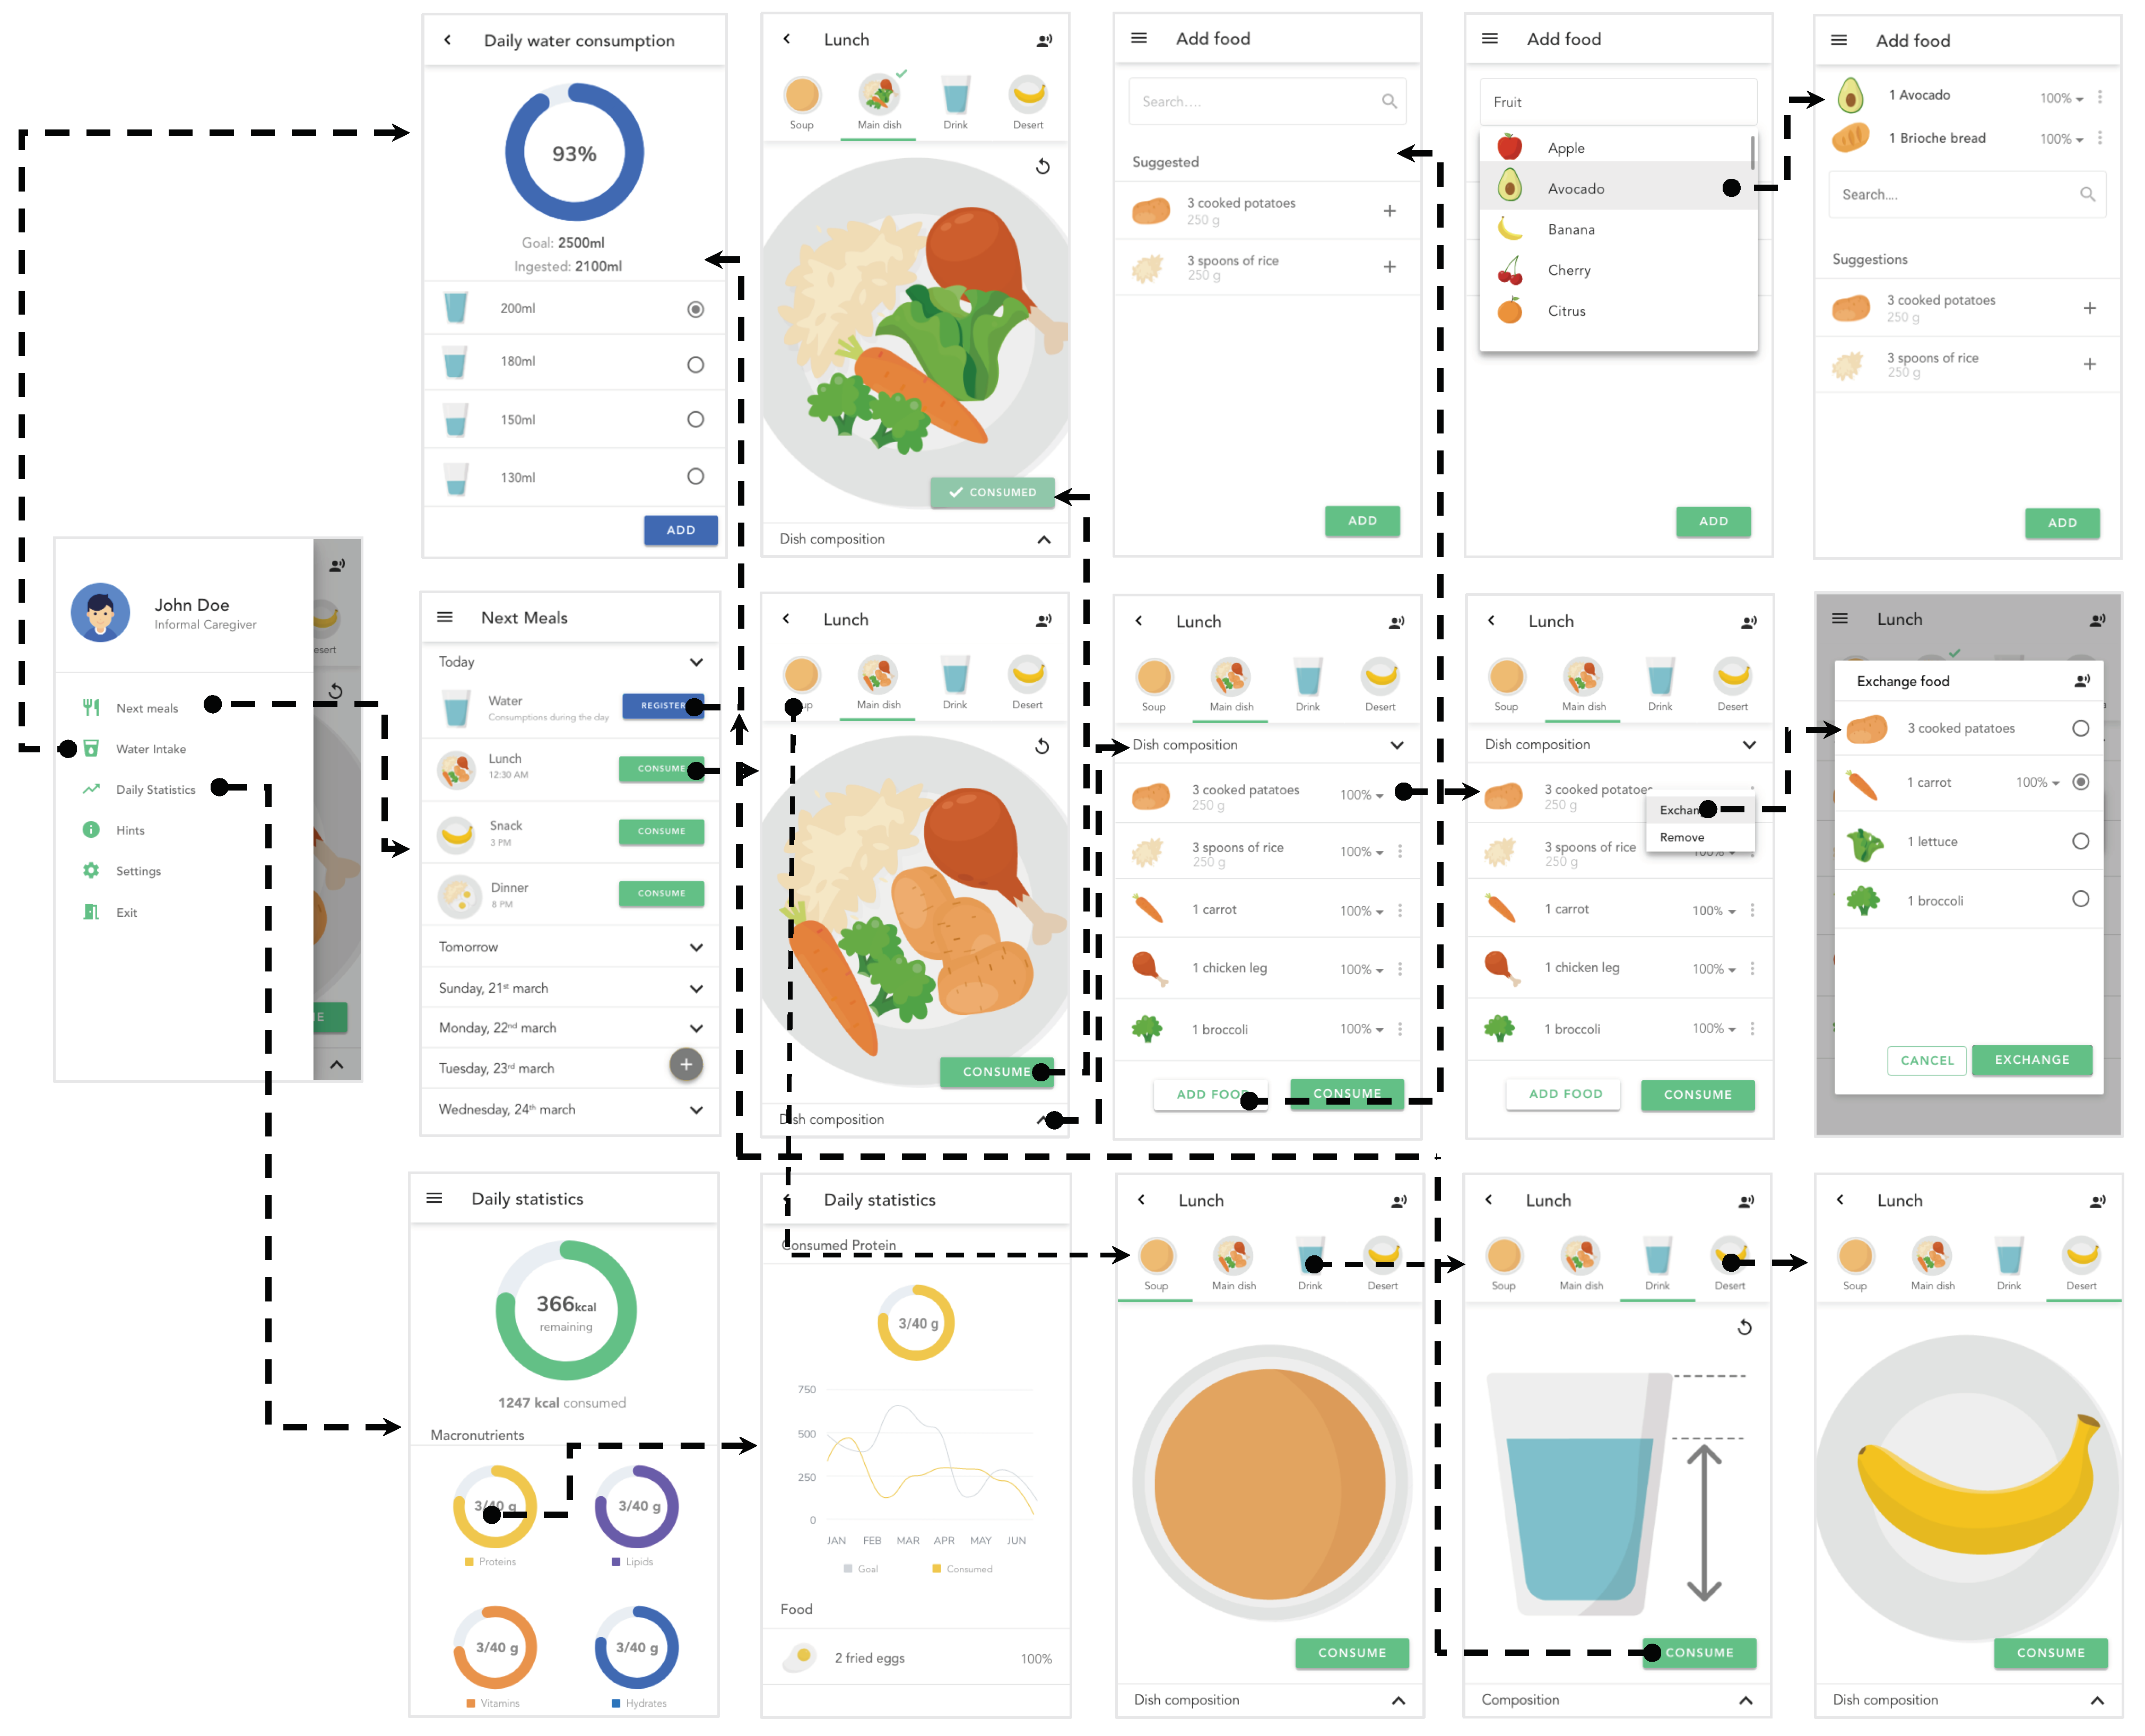
Appendix C. Navigation Scheme

Figure A2. Example of the navigation scheme of the application.
Futureinternet 15 00168 g0a2

References

  1. Association, A. 2016 Alzheimer’s disease facts and figures. Alzheimer’s Dement. 2016, 12, 459–509. [Google Scholar] [CrossRef] [PubMed]
  2. Spijker, A.; Vernooij-Dassen, M.; Vasse, E.; Adang, E.; Wollersheim, H.; Grol, R.; Verhey, F. Effectiveness of Nonpharmacological Interventions in Delaying the Institutionalization of Patients with Dementia: A Meta-Analysis. J. Am. Geriatr. Soc. 2008, 56, 1116–1128. [Google Scholar] [CrossRef] [PubMed]
  3. Hebert, L.E.; Weuve, J.; Scherr, P.A.; Evans, D.A. Alzheimer disease in the United States (2010–2050) estimated using the 2010 census. Neurology 2013, 80, 1778–1783. [Google Scholar] [CrossRef]
  4. Hung, Y.N.; Kadziola, Z.; Brnabic, A.J.; Yeh, J.F.; Fuh, J.L.; Hwang, J.P.; Montgomery, W. The epidemiology and burden of Alzheimer’s disease in Taiwan utilizing data from the National Health Insurance Research Database. Clin. Outcomes Res. 2016, 8, 387–395. [Google Scholar] [CrossRef]
  5. Walker, A.J.; Pratt, C.C.; Eddy, L. Informal Caregiving to Aging Family Members: A Critical Review. Fam. Relations 1995, 44, 402–411. [Google Scholar] [CrossRef]
  6. Guay, C.; Auger, C.; Demers, L.; Mortenson, W.B.; Miller, W.C.; Gélinas-Bronsard, D.; Ahmed, S. Components and Outcomes of Internet-Based Interventions for Caregivers of Older Adults: Systematic Review. J. Med. Internet Res. 2017, 19, e313. [Google Scholar] [CrossRef] [PubMed]
  7. Adelman, R.D.; Tmanova, L.L.; Delgado, D.; Dion, S.; Lachs, M.S. Caregiver Burden: A Clinical Review. JAMA 2014, 311, 1052–1060. [Google Scholar] [CrossRef]
  8. Zarit, S.H.; Todd, P.A.; Zarit, J.M. Subjective Burden of Husbands and Wives as Caregivers: A Longitudinal Study1. Gerontologist 1986, 26, 260–266. [Google Scholar] [CrossRef]
  9. Roberts, C.A.; Geryk, L.L.; Sage, A.J.; Sleath, B.L.; Tate, D.F.; Carpenter, D.M. Adolescent, caregiver, and friend preferences for integrating social support and communication features into an asthma self-management app. J. Asthma 2016, 53, 948–954. [Google Scholar] [CrossRef]
  10. Chiarini, G.; Ray, P.; Akter, S.; Masella, C.; Ganz, A. mHealth Technologies for Chronic Diseases and Elders: A Systematic Review. IEEE J. Sel. Areas Commun. 2013, 31, 6–18. [Google Scholar] [CrossRef]
  11. Donevant, S.B.; Estrada, R.D.; Culley, J.M.; Habing, B.; Adams, S.A. Exploring app features with outcomes in mHealth studies involving chronic respiratory diseases, diabetes, and hypertension: A targeted exploration of the literature. J. Am. Med Infor. Assoc. 2018, 25, 1407–1418. [Google Scholar] [CrossRef] [PubMed]
  12. Coorey, G.M.; Neubeck, L.; Mulley, J.; Redfern, J. Effectiveness, acceptability and usefulness of mobile applications for cardiovascular disease self-management: Systematic review with meta-synthesis of quantitative and qualitative data. Eur. J. Prev. Cardiol. 2020, 25, 505–521. [Google Scholar] [CrossRef]
  13. Lee, J.A.; Choi, M.; Lee, S.A.; Jiang, N. Effective behavioral intervention strategies using mobile health applications for chronic disease management: A systematic review. BMC Med. Inform. Decis. Mak. 2018, 18, 12. [Google Scholar] [CrossRef] [PubMed]
  14. Grossman, M.R.; Zak, D.K.; Zelinski, E.M. Mobile Apps for Caregivers of Older Adults: Quantitative Content Analysis. JMIR Mhealth Uhealth 2018, 6, e162. [Google Scholar] [CrossRef] [PubMed]
  15. Miller, G. The Smartphone Psychology Manifesto. Perspect. Psychol. Sci. 2012, 7, 221–237. [Google Scholar] [CrossRef]
  16. European Comission. Green Paper on Mobile Health (“mHealth”). Available online: https://digital-strategy.ec.europa.eu/en/library/green-paper-mobile-health-mhealth (accessed on 25 April 2023).
  17. Stanford/VA Alzheimer’s Center. Geriatric Depression and Dementia Scale. Available online: https://med.stanford.edu/svalz/apps.html (accessed on 25 April 2023).
  18. Lumos Labs, Inc. Lumosity. Available online: https://www.lumosity.com/en/ (accessed on 25 April 2023).
  19. Dakim, Inc. Dakim Brain Fitness. Available online: https://www.dakim.com (accessed on 25 April 2023).
  20. Elevate Labs. Elevate—Brain Training and Brain Games. Available online: https://elevateapp.com (accessed on 25 April 2023).
  21. AngelSense. GPS Tracker for Elderlys. Available online: https://www.angelsense.com/gps-tracker-for-elderly/ (accessed on 25 April 2023).
  22. Metalert. GPS SmartSole. Available online: https://www.gpssmartsole.com (accessed on 25 April 2023).
  23. Chaudhry, B.M. Health is fine if pills are on time. Mhealth 2016, 2, 40. [Google Scholar] [CrossRef]
  24. Cunha, C.A.S.; Duarte, R.P. Multi-Device Nutrition Control. Sensors 2022, 22, 2617. [Google Scholar] [CrossRef]
  25. Honor Care Network. Help for Alzheimers Families. Available online: https://www.helpforalzheimersfamilies.com (accessed on 25 April 2023).
  26. K. Burns et al. Care4Dementia App. Available online: https://dementiaresearch.org.au/resources/zz-app-care4dementia/ (accessed on 25 April 2023).
  27. AppInst Ltd. Dementia Emergency. Available online: https://apps.apple.com/us/app/dementia-emergency/id1072396675 (accessed on 25 April 2023).
  28. American Red Cross. Emergency App. Available online: https://www.redcross.org/get-help/how-to-prepare-for-emergencies/mobile-apps.html (accessed on 25 April 2023).
  29. Sanvello Health 2022 ©. Home—Sanvello. Available online: https://www.sanvello.com (accessed on 25 April 2023).
  30. Evans, D. MyFitnessPal. Br. J. Sport. Med. 2017, 51, 1101–1102. [Google Scholar] [CrossRef]
  31. Levinson, C.A.; Fewell, L.; Brosof, L.C. My Fitness Pal calorie tracker usage in the eating disorders. Eat. Behav. 2017, 27, 14–16. [Google Scholar] [CrossRef]
  32. FatSecret. FatsecretPlatform API. Available online: https://platform.fatsecret.com/api/ (accessed on 25 April 2023).
  33. Tredrea, M.S.; Dalbo, V.J.; Scanlan, A.T. Lifesum: Easy and effective dietary and activity monitoring. Br. J. Sport. Med. 2017, 51, 1042. [Google Scholar] [CrossRef]
  34. Livestrong. MyPlate Calorie Counter. Available online: https://www.livestrong.com/myplate/ (accessed on 25 April 2023).
  35. Corcoran, K. Fooducate. Available online: https://www.fooducate.com/ (accessed on 25 April 2023).
  36. Willett, W.C. The Mediterranean diet: Science and practice. Public Health Nutr. 2006, 9, 105–110. [Google Scholar] [CrossRef] [PubMed]
  37. Dohan, M.; Tan, J. Lose It! Int. J. Healthc. Inf. Syst. Inform. (IJHISI) 2011, 6, 60–65. [Google Scholar] [CrossRef]
  38. Fitnow, Inc. Lose It! Available online: https://www.loseit.com/ (accessed on 25 April 2023).
  39. US Department of Agriculture. Start Simple with My Plate. Available online: https://www.myplate.gov/resources/tools/startsimple-myplate-app (accessed on 25 April 2023).
  40. MedHelp. My Diet Diary. Available online: https://www.medhelp.org/land/calorie-counter-app (accessed on 25 April 2023).
  41. GetFit Apps. GetFit Calorie Counter. Available online: https://getfitapps.com/ (accessed on 25 April 2023).
  42. Hendawi, R.; Li, J.; Alian, S. ADDietCoach: A Personalized Virtual Diet Coach for Alzheimer’s Disease. Int. J.-Health Med. Commun. (IJEHMC) 2021, 12, 1–18. [Google Scholar] [CrossRef]
  43. Nielsen, J. Usability Engineering; Morgan Kaufmann: Burlington, MA, USA, 1994. [Google Scholar]
  44. ISO I. 9241-210; 2019 Ergonomics of Human-System Interaction. Part 210: Human-Centred Design for Interactive Systems. ISO: Geneva, Switzerland, 2019. Available online: https://www.iso.org/standard/77520.html (accessed on 2 March 2023).
  45. Virzi, R.A. Refining the Test Phase of Usability Evaluation: How Many Subjects Is Enough? Hum. Factors 1992, 34, 457–468. [Google Scholar] [CrossRef]
  46. Rieman, J.; Franzke, M.; Redmiles, D. Usability Evaluation with the Cognitive Walkthrough. In Proceedings of the Conference Companion on Human Factors in Computing Systems (CHI ’95), Denver, CO, USA, 7–11 May 1995; Association for Computing Machinery: New York, NY, USA, 1995; pp. 387–388. [Google Scholar] [CrossRef]
  47. Mahatody, T.; Sagar, M.; Kolski, C. State of the Art on the Cognitive Walkthrough Method, Its Variants and Evolutions. Int. J. Hum.–Comput. Interact. 2010, 26, 741–785. [Google Scholar] [CrossRef]
  48. Schrepp, M.; Thomaschewski, J.; Hinderks, A. Construction of a benchmark for the user experience questionnaire (UEQ). Int. J. Interact. Multimed. Artif. Intell. 2017, 4, 40–44. [Google Scholar] [CrossRef]
  49. Boivie, I.; Åborg, C.; Persson, J.; Löfberg, M. Why usability gets lost or usability in in-house software development. Interact. Comput. 2003, 15, 623–639. [Google Scholar] [CrossRef]
  50. Neale, D.C.; Carroll, J.M. Chapter 20—The Role of Metaphors in User Interface Design. In Handbook of Human-Computer Interaction, 2nd ed.; Helander, M.G., Landauer, T.K., Prabhu, P.V., Eds.; North-Holland: Amsterdam, The Netherlands, 1997; pp. 441–462. [Google Scholar] [CrossRef]
  51. Reese, G. Cloud Application Architectures: Building Applications and Infrastructure in the Cloud; O’Reilly Media, Inc.: Sebastopol, CA, USA, 2009. [Google Scholar]
  52. Lit. LitElement. Available online: https://lit.dev (accessed on 25 April 2023).
  53. MongoDB. Available online: https://www.mongodb.com/ (accessed on 25 April 2023).
  54. Dan Abramov and the Redux Documentation Authors. Redux—A Predictable State Container for JS Apps. Available online: https://redux.js.org/ (accessed on 25 April 2023).
  55. Johnson, J.; Henderson, A. Conceptual Models: Begin by Designing What to Design. Interactions 2002, 9, 25–32. [Google Scholar] [CrossRef]
  56. Camelon, K.M.; Hadell, K.; Jamsen, P.T.; Ketonen, K.J.; Kohtamaki, H.M.; Makimatilla, S.; Tormala, M.L.; Valve, R.H. The Plate Model: A Visual Method of Teaching Meal Planning. J. Am. Diet. Assoc. 1998, 98, 1155–1158. [Google Scholar] [CrossRef] [PubMed]
  57. Bostock, M.; Ogievetsky, V.; Heer, J. D3 Data-Driven Documents. IEEE Trans. Vis. Comput. Graph. 2011, 17, 2301–2309. [Google Scholar] [CrossRef]
  58. Bostock, M. Zoomable Circle Packing. Available online: https://observablehq.com/@d3/zoomable-circle-packing (accessed on 25 April 2023).
  59. Rashid, A.M.; Albert, I.; Cosley, D.; Lam, S.K.; McNee, S.M.; Konstan, J.A.; Riedl, J. Getting to Know You: Learning New User Preferences in Recommender Systems. In Proceedings of the Proceedings of the 7th International Conference on Intelligent User Interfaces (IUI ’02), San Francisco, CA, USA, 13–16 January 2002; Association for Computing Machinery: New York, NY, USA, 2002; pp. 127–134. [Google Scholar] [CrossRef]
  60. Fürnkranz, J.; Hüllermeier, E. Preference Learning and Ranking by Pairwise Comparison. In Preference Learning; Fürnkranz, J., Hüllermeier, E., Eds.; Springer: Berlin/Heidelberg, Germany, 2011; pp. 65–82. [Google Scholar] [CrossRef]
  61. Noah, S.A.; Abdullah, S.N.; Shahar, S.; Abdul-Hamid, H.; Khairudin, N.; Yusoff, M.; Ghazali, R.; Mohd-Yusoff, N.; Shafii, N.S.; Abdul-Manaf, Z. DietPal: A Web-Based Dietary Menu-Generating and Management System. J. Med. Internet Res. 2004, 6, e4. [Google Scholar] [CrossRef] [PubMed]
  62. Ramos-Pérez, J.M.; Miranda, G.; Segredo, E.; León, C.; Rodríguez-León, C. Application of Multi-Objective Evolutionary Algorithms for Planning Healthy and Balanced School Lunches. Mathematics 2021, 9, 80. [Google Scholar] [CrossRef]
Figure 1. System architecture.
Futureinternet 15 00168 g001
Figure 2. Different representations of meals that map a real meal (depicted in the plate image presented in the first row).
Futureinternet 15 00168 g002
Figure 3. Representation of the interface metaphor. Food is placed in a dish according to its proportions.
Futureinternet 15 00168 g003
Figure 4. General view of a meal and food placement in a meal.
Futureinternet 15 00168 g004
Figure 5. Meal import with different meal tabs depending on the prescribed food plan, and feedback on meal consumed using a visual marker.
Futureinternet 15 00168 g005
Figure 6. View of meals dynamically created using the Zoomable Circle Packing library.
Futureinternet 15 00168 g006
Figure 7. Logic associated with dish presentation.
Futureinternet 15 00168 g007
Figure 8. Weekly view of the food plan and detailed view of meals.
Futureinternet 15 00168 g008
Figure 9. Add food to a meal or outside the meal as an extra.
Futureinternet 15 00168 g009
Figure 10. Exchange food from a meal and consumption indicators for the main dish in lunch and soup.
Futureinternet 15 00168 g010
Figure 11. Consumption of water.
Futureinternet 15 00168 g011
Figure 12. Statistics of consumption of macronutrients.
Futureinternet 15 00168 g012
Figure 13. UEQ Benchmark graph for the developed application.
Futureinternet 15 00168 g013
Table 1. Comparison of features of mobile applications for healthy eating and food plan management.
MyFitnessPal
[30,31]
MyPlate
Calorie
Counter [34]
Fooducate
[35]
FatSecret
[32]
Start Simple
with
My Plate [39]
My Diet
Diary [40]
GetFit
[41]
Lose It!
[37,38]
ADDietCoach
[42]
Lifesum
[33]
Meal plan tracking
Intended for the older age group
Designed for people with health concerns
Records water consumption
Records food/nutrients ingested
Control amounts of food/nutrients
Meal listing
Provides statistics
Meal consultation
Allows food exchange for equivalents
Allows to add food
Interface design quality
Real time nutritionist feedback
Table 2. Task description.
No.TaskProcess
1Register the consumption of 130 mL of water
outside the food plan
Grab a cup of water, fill it with the amount
2For lunch, check which food will be consumed,
of the prescribed food plan from the nutritionist
Identify a meal in a list and see the food that
it contains
3Exchange the food corn in the lunch for another equivalentIn the preparation of food, an ingredient is
missing. It needs to be exchanged
4Remove broccoli from the mealLunch contains broccoli, which are not of the
interest of the patient. They are to be removed
5Add lettuce to a mealThe patient loves lettuce. It must be added to
the dish.
6Register the consumption of the lunchCheck the dish to identify the amount of food
consumed
7Reduce the amount of food in a dish to 50%A prescribed food was not completely ingested
8Add an ice cream as an extra mealThe patient really wants an ice cream. Give it
to him
9The food plan for the day is complete. See if all the
macronutrients were ingested
Ingestion of all (or parts) of food from the meals
10Check the lunch in two daysIn the prescribed food plan, see the food that
composes the lunch
Table 3. Interaction results.
No.TaskAverage Time (Seconds)
1Register the consumption of 130 mL of water outside the food plan2.3
2For lunch, check which food will be consumed, of the prescribed food plan from the nutritionist3.5
3Exchange the food corn in the lunch for another equivalent3.6
4Remove broccoli from the meal3.6
5Add lettuce to a meal8.6
6Register the consumption of the lunch1.2
7Reduce the amount of food in a dish to 50%4.8
8Add an ice cream as an extra meal8.6
9The food plan for the day is complete. See if all the macronutrients were ingested1.2
10Check the lunch in two days2.3
Table 4. UEQ results for the overall rating.
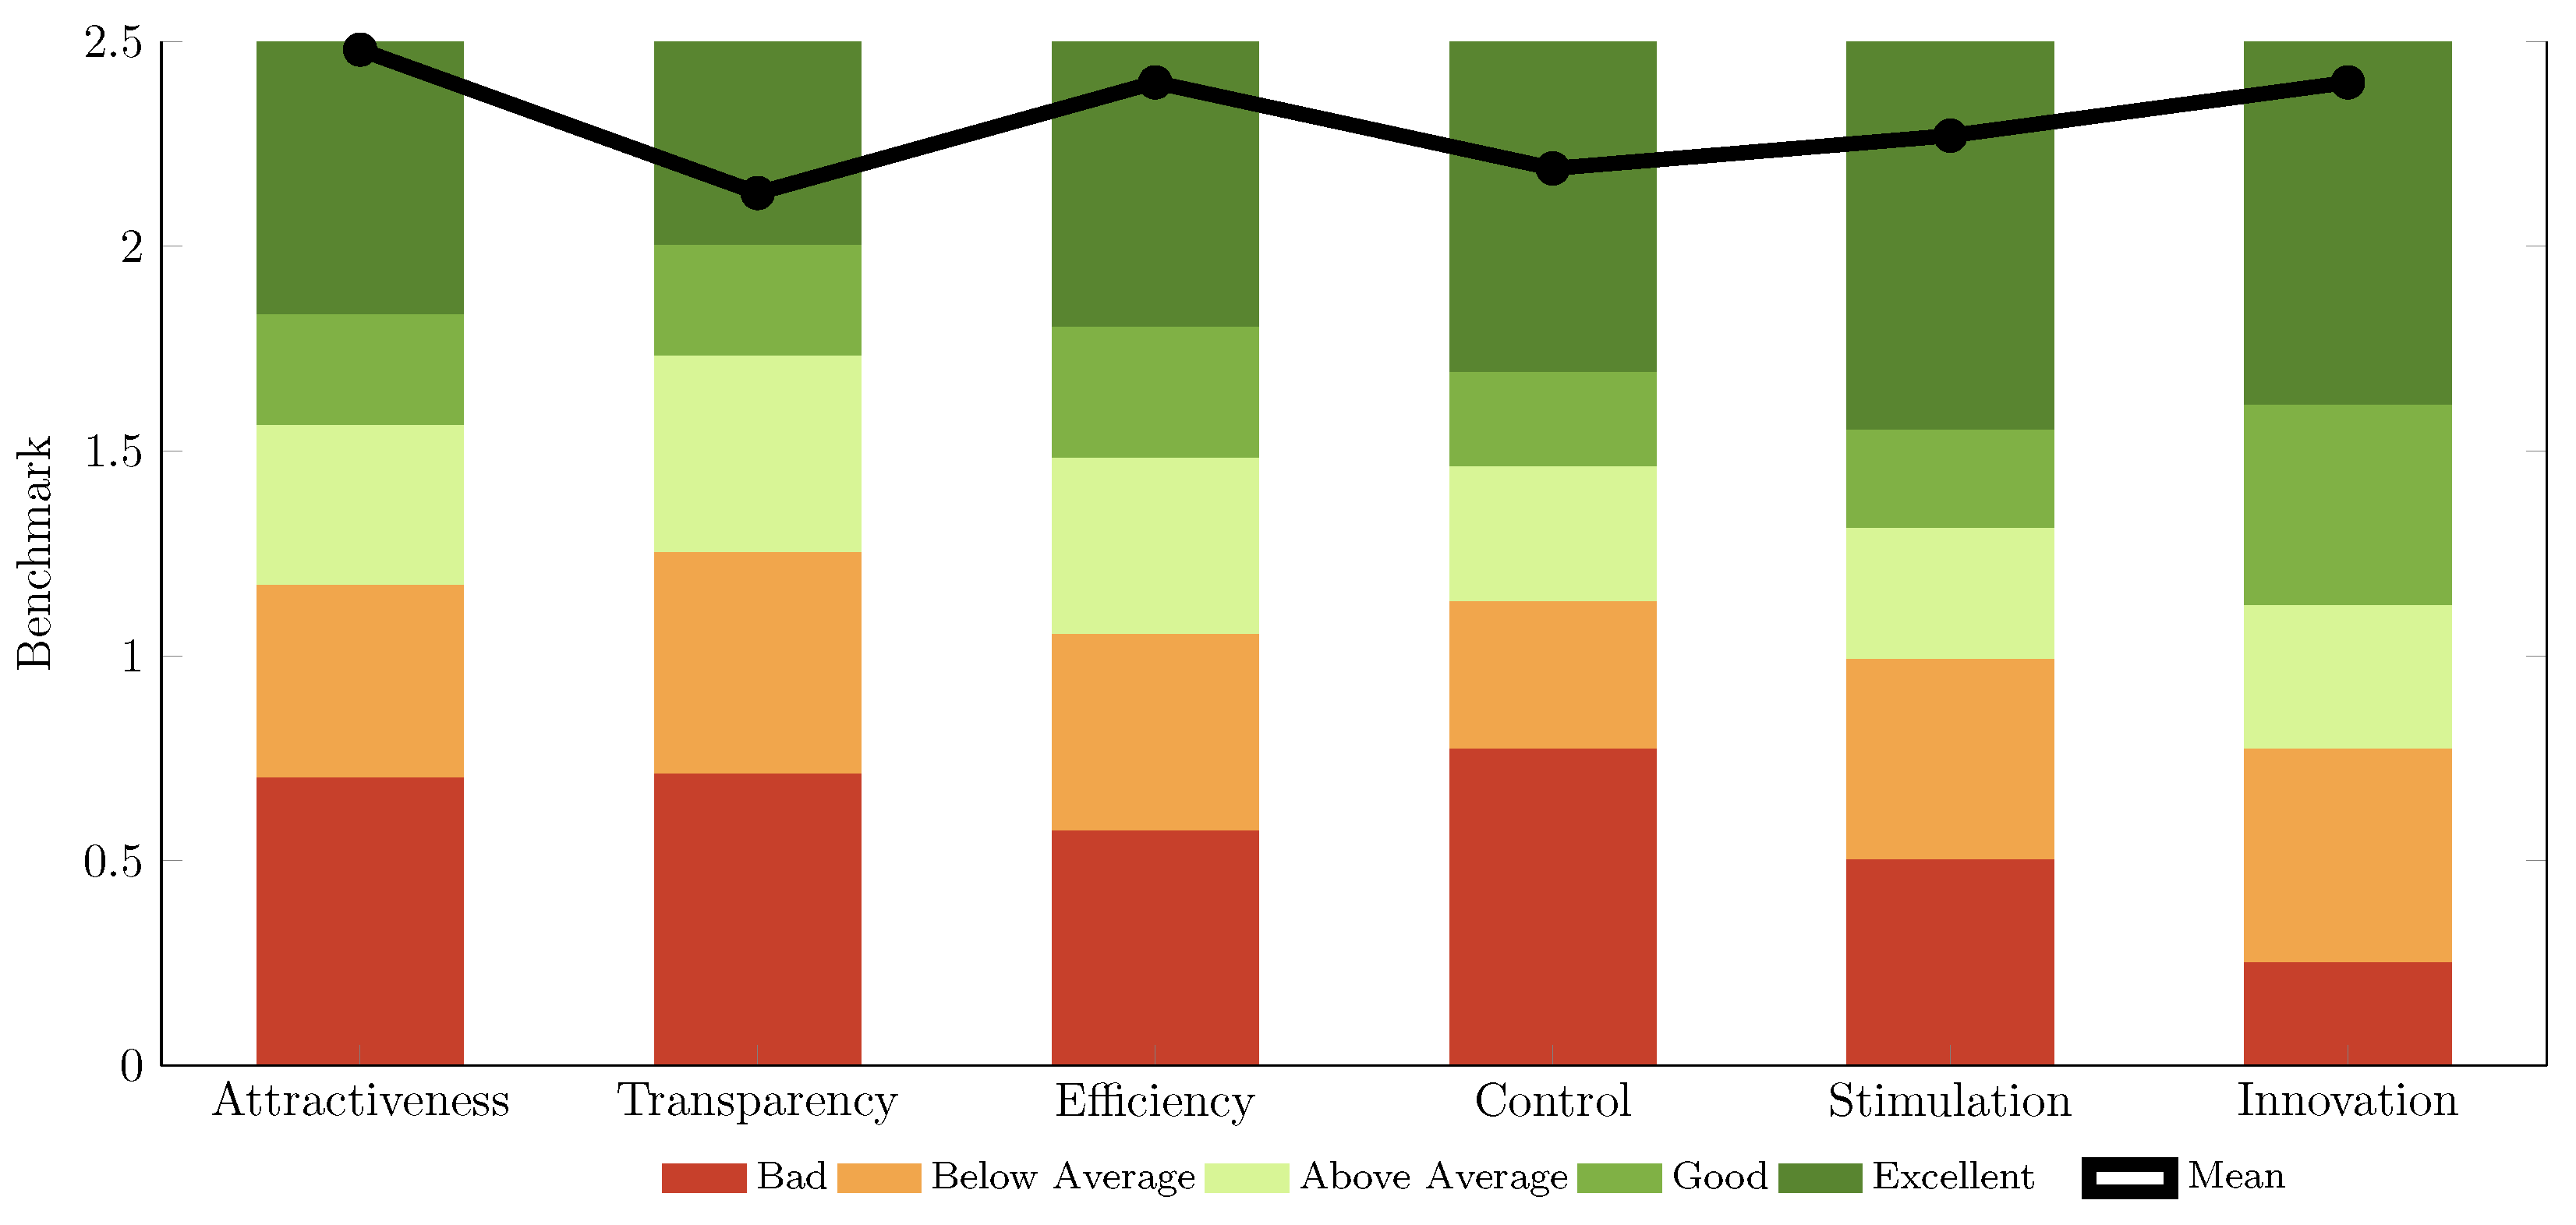
Confidence Intervals (p = 0.05) per Scale
ScaleMeanStd. Dev.ConfidenceConfidence IntervalRating
Attractiveness2.480.200.102.382.58Excellent
Perspicuity2.130.420.201.922.33Excellent
Efficiency2.590.260.132.472.72Excellent
Dependability2.190.250.122.072.31Excellent
Stimulation2.270.450.222.042.49Excellent
Novelty2.480.400.202.292.68Excellent
Table 5. UEQ quality dimensions (mean values).
Pragmatic and Hedonic Quality
Attractiveness2.48
Pragmatic Quality2.30
Hedonic Quality2.38
Disclaimer/Publisher’s Note: The statements, opinions and data contained in all publications are solely those of the individual author(s) and contributor(s) and not of MDPI and/or the editor(s). MDPI and/or the editor(s) disclaim responsibility for any injury to people or property resulting from any ideas, methods, instructions or products referred to in the content.

