1. Introduction
A series of requirements are being established for the 802.11bc standard to provide efficient broadcast transmission without interfering with the existing 802.11 family standard. This new standard defines the parameters and functionalities necessary for optimal data dissemination within WiFi networks. The 802.11bc standard seeks to establish the foundations to optimize the transmission of information to multiple recipients simultaneously, such as in scenarios where it is necessary to send entertainment content to many users, for example, in stadiums or concert halls. The ultimate goal is to improve the efficiency and quality of broadcast transmission, maximizing the performance and capacity of the WiFi network without compromising compatibility with the existing 802.11 standards.
Various requirements have been placed on this new standard, described in [
1]. First, the new 802.11bc must comply with the Project Authorization Request (PAR) and Criteria for Standards Development (CSD) established for it. It should provide authenticity protection for broadcast data messages. It must support modes of operation in a BSS (Basic Service System) infrastructure with association between the transmitter and receivers and cases without association. It must also include a mechanism to facilitate efficient diffusion in terms of energy consumption. Finally, it should provide a mechanism for the discovery of 11bc-compatible STAs and for the discovery of STAs that consume a specific broadcasting service.
The single most problematic aspect of WiFi broadcast is the inability of the Access Point (AP) to obtain real-time feedback from stations (STAs), as it becomes troublesome for users to send ACKs after receiving each message without causing a collision. Developing efficient and scalable feedback mechanisms from STAs in WiFi broadcast applications has historically been addressed through four distinct approaches. Each of these approaches offers advantages but also entails inevitable trade-offs. The first approach tries to decrease the number of transmitted feedback messages [
2,
3] but requires previous management among STAs (along with its signaling costs) so they all agree on which STAs can send feedback. The second approach makes the feedback messages collision-resistant [
4,
5]. However, implementing the scheme under this approach requires complex coding or sending the messages through a different communication channel. The third approach decreases the size of the feedback messages [
6]; nevertheless, the problem remains as the number of STAs increases, even for small feedback messages. Finally, some approaches transmit broadcast messages into unicast [
7,
8,
9,
10]. However, such solutions must be properly scaled since it may take a long time to complete the feedback transmission process, depending on the number of receivers. One aspect they all have in common is that they seek to ensure that the ACKs do not collide, thus allowing the AP to obtain feedback from the STAs.
In this work, we propose a method comprised of two sequential algorithms to reduce the collision probability of the feedback messages. Our method is based on the foundation that STAs should not send feedback messages every time after receiving a message correctly/incorrectly from the AP but should transmit ACK/NACK only with a given probability. The first algorithm allows the AP to search for the best probability value for STAs to transmit ACK/NACK messages, depending on the percentage of successfully received feedback messages, collided feedback messages, or no feedback (silences). This feedback allows the AP to estimate the number of STAs receiving messages correctly/incorrectly. In the second algorithm, the AP uses this feedback to adjust the MCS to increase the data rate at the physical layer while keeping the percentage of STAs that do not receive messages correctly within a predefined range. This data rate adaption allows the AP to send better-quality content to a high proportion of the STAs in the venue, thus improving user experience. We tested the proposed method in different scenarios, varying the number of STAs and the venue’s dimensions and showing that it provides fast-reliable feedback, allowing the AP to select the best MCS in only a few seconds. The method proposed in this work goes around most of the trade-offs in previous works. Our proposal does not require previous management among STAs or a different channel to send feedback messages, it has no limitations on the number of STAs, and it takes only a few seconds to complete, independent of the size and density of the scenario. An essential distinguishing feature of our proposal is its ability to monitor collisions related to feedback messages, allowing for the estimation of the number of STAs receiving messages accurately or encountering errors.
There are many challenges for next-generation networks to improve communications capabilities. As stated in [
11], these shortcomings include spectral efficiency, coverage, interference, security, and privacy. These concerns and those presented in this work contribute to developing next-generation networks that enable high-throughput, low-delay communications.
This work makes the following specific contributions:
We propose a method that quickly finds the best probability value for STAs to send ACK/NACK messages back to the AP. This allows a fast and accurate estimation of the number of STAs receiving messages correctly/incorrectly.
Apart from using the number of ACK/NACK messages received correctly to estimate the number of STAs receiving messages correctly/incorrectly, the algorithm can also perform the very same estimation by counting the number of collisions of feedback messages and even the number of no feedback transmissions (silences) occurring after the transmission of each broadcast message. This technique allows redundancy as it provides the AP with three simultaneous and independent ways to perform the same estimation of STAs receiving messages correctly/incorrectly.
We propose a second algorithm that uses the previous estimation to allow for the AP to adapt the MCS to increase the data rate at the physical layer while maintaining the percentage of STAs that do not receive broadcast messages correctly within acceptable limits, thus allowing for higher-quality content to be sent to most STAs, improving user experience.
We implemented the complete method in ns-3 under diverse network conditions. We found that it provides quick (only a few seconds on average) and reliable (less than 5% estimation error) feedback, allowing the AP to rapidly adjust the MCS to maximize the users’ experience.
The rest of the paper is organized as follows:
Section 2 shows the most relevant works in the literature related to WiFi broadcast and how the proposed method sets apart from them.
Section 3 presents an algorithm that searches for the best probability of transmitting ACK/NACK messages to estimate the number of STAs receiving messages correctly/incorrectly.
Section 4 presents an algorithm that uses this estimation to select the best MCS to increase the speed rate at the physical layer, thus allowing for better-quality content to be sent to users.
Section 5 details the implementation of the two algorithms, the conducted experiments, and the obtained results. Next,
Section 6 presents a discussion of the findings and drawbacks of the proposed method. Finally,
Section 7 presents our conclusions.
2. Related Work
Inherently, broadcast in the 802.11 standards is defined to be implemented without any acknowledgment (ACK) [
12]. As mentioned, if more than one STA receives the broadcast message correctly, their corresponding ACKs will likely collide in the AP. However, sending no acknowledgment brings up many problems related to the uncertainty of the broadcast mechanism because it is impossible for the AP to know whether broadcast messages are beingreceived correctly. This problem makes it difficult for any rate-adaption algorithms to work properly. A trivial solution for this problem is continuously broadcasting messages with the lowest MCS available. Although this measure ensures that the maximum number of STAs receive broadcast messages correctly, the data rate will be the lowest, which might lead to a degradation in the quality of the broadcast content and the associated poor user experience.
The problem of adapting the data rate has been addressed from four different perspectives in the past. In general terms, the first approach tries to decrease the number of feedback messages, the second approach makes the feedback messages collision-resistant, the third approach decreases the size of the feedback messages, and the last approach turns the broadcast messages into unicast (thus avoiding collisions since unicast ACKs are transmitted at different times). However, one aspect they all have in common is that they seek that the ACKs do not collide, thus allowing the AP to obtain feedback from the receiving STAs.
In the first category, we have solutions to minimize the number of feedback messages sent by receiving STAs. The LBP [
2] (Leader Based Protocol) uses the Automatic Repeat Request (ARQ) mechanism with ACK combined with leader-based techniques to minimize the number of sent ACKs, thus increasing the probability of ACK reception. Later, Ref. [
3] used probabilistic NACK suppression to decrease the number of sent NACKs.
A second approach tries to decrease the size of the feedback messages to decrease their probability of collision. In [
6], the authors explored using ARQ messages combined with virtual ACK bitmaps significantly shorter than the actual ACK/NACK messages. The AP assigns small time slots to each STA in which they will answer with ACK pulses. Although this technique prevents collisions, it assumes that STAs previously received the time distribution correctly.
A third solution makes the ACK/NACK collision-resistant, as in [
4]. Although this proposal needs extra hardware, it increases the probability that the feedback is received correctly, even if obtained from collisions. Later, HIMAC [
5] proposes using Unary Channels to transmit the feedback to overcome collisions.
The last approach is to turn the broadcast messages into individual unicast messages as introduced in the BMW protocol proposed in [
7], which was further improved in the BMMM protocol in [
8] by grouping the transmissions into a single one and introducing Request for ACK (RAK) messages. Then, the author of [
9] proposed an improvement that reduced the number of RAK transmissions. Later, a similar approach in which clients can request the AP to send a multicast stream as unicast was incorporated in the Directed Multicast Service (DMS) of the IEEE 802.11v amendment [
10].
Apart from these four general categories, other particular approaches deal with similar problems. One of these approaches overcomes reception errors of multicast messages using the Groupcast with Retries (GCR), adopted in the IEEE 802.11aa amendment [
13]. Further, Ref. [
14] combined GCR with the Adaptive Auto Rate Fallback (AARF) method to change the modulation to decrease the Packet Loss Ratio.
More recent solutions, such as the one presented by T. Kanda et al. [
15], use the RSSI of unicast ACKs coming from non-eBCS APs and deep reinforcement learning to estimate the eBCS STAs. Their work assumes that the distribution on the eBCS and non-eBCS STAs is the same, which might only sometimes occur. Further, the authors use distributional reinforcement learning in [
16] and evaluated their algorithm regarding the data rate of the broadcast messages and the reception success rate at STAs.
In [
17], the authors proposed MuDRA, a rate adaption algorithm for multicast flows. MuDRA relies on the information of the
K STAs with the worst channel conditions, which the AP selects. Once selected, these STAs send their packet delivery ratio after a short random interval to avoid collisions. In order to reach the target rate, the proposed algorithm monitors the number of devices switching from PDR of 100% to 0% to satisfy the maximum permitted number of abnormal devices. Authors in [
18] designed and tested AMuSe, a mechanism to broadcast packets to a large group of STAs. AMuSe relies on the cluster formation of adjacent neighbors and feedback from cluster heads. Although this might be a good technique in static scenarios, cluster formation might lead to long delays and lots of overhead in the presence of mobility. AMuSe provides rate adaption provided by MuDRA [
17] to transmit at the highest possible bitrate while meeting some constraints. AMuSe is the only proposal verified on a testbed with over 150 STAs [
19].
Further, the authors of [
20] proposed ATRaCt, a cross-layer rate control for wireless multicast that takes information from the transport layer to modify the data rate of the link layer. The transport layer information is taken using the NORM protocol [
3]. Also, ATRaCt periodically sends MSRq control messages using the base transmission rate to get statistics that are obtained via MSRp messages.
Table 1 shows a summary of the above literature review, which denotes that most efforts related to feedback acquisition in broadcast services consider feedback from ACKs and/or NACKs in various ways. Other works use RTS/CTS messages to avoid collisions, and many seek the reception of every message from all STAs. Different from all these works, our proposal not only introduces a probability in the transmission of ACK/NACK messages that allows for the estimation of the number of STAs receiving messages correctly/incorrectly but also, from the percentage of both, collisions and absent periods (silence). The latter refers to the scenario in which the AP does not receive an ACK/NACK message in response to the transmission of a broadcast message. In other words, our proposal can estimate the number of STAs receiving messages correctly/incorrectly from three different events simultaneously and independently of each other (i.e., successfully received ACK/NACK messages, ACK/NACK collisions, and ACK/NACK silences). The proposed method relies on traditional ACK/NACK transmissions. It requires no additional signaling or hardware to quickly and reliably estimate the percentage of STAs receiving messages correctly/incorrectly at the present MCS, which only takes a few seconds to converge to the actual number of STAs. On top of that, our method can use this estimation to select the best possible MCS while keeping the percentage of STAs that do not receive broadcast transmission under the desired levels.
3. Estimation of the Number of STAs Receiving Broadcast Messages Correctly/Incorrectly
This section presents an algorithm that allows for the AP to estimate the number of STAs that are receiving broadcast messages correctly (
) or incorrectly (
). The solution uses probabilistic ACKs/NACKs as feedback from STAs. When an STA correctly decodes the preamble and the corresponding message payload, it sends an ACK to the AP with probability
. Similarly, when an STA correctly decodes the preamble of a message but incorrectly decodes the rest of the payload, it sends a NACK to the AP with probability
. This scheme is aided by the preambles being always sent using BPSK with a 1/2 coding rate [
12] (the lowest MCS) to maximize the probability of preamble reception. STAs know precisely which values of
and
to use because the AP includes those probabilities within each message it transmits. In this algorithm, the AP performs an active role in selecting the best values of
and
that will result in the best estimation of
and
. On the other hand, STAs play a passive role as they simply react to sending feedback messages according to the probabilities included in each message.
To avoid ACK and NACK colliding in the AP after each transmitted message, NACKs are only sent in response to the odd-sequenced AP messages, and ACKs are sent only in response to even-sequenced AP messages. This work assumes no previous association of STAs with the AP, as this is one requirement of the new 802.11bc standard. This condition makes the problem harder, as the AP does not know the total number of listening STAs and their distribution over the network area. However, in those scenarios in which the number of STAs is known in advance, it will simplify the protocol’s operation as it is only necessary to estimate either or to calculate the other.
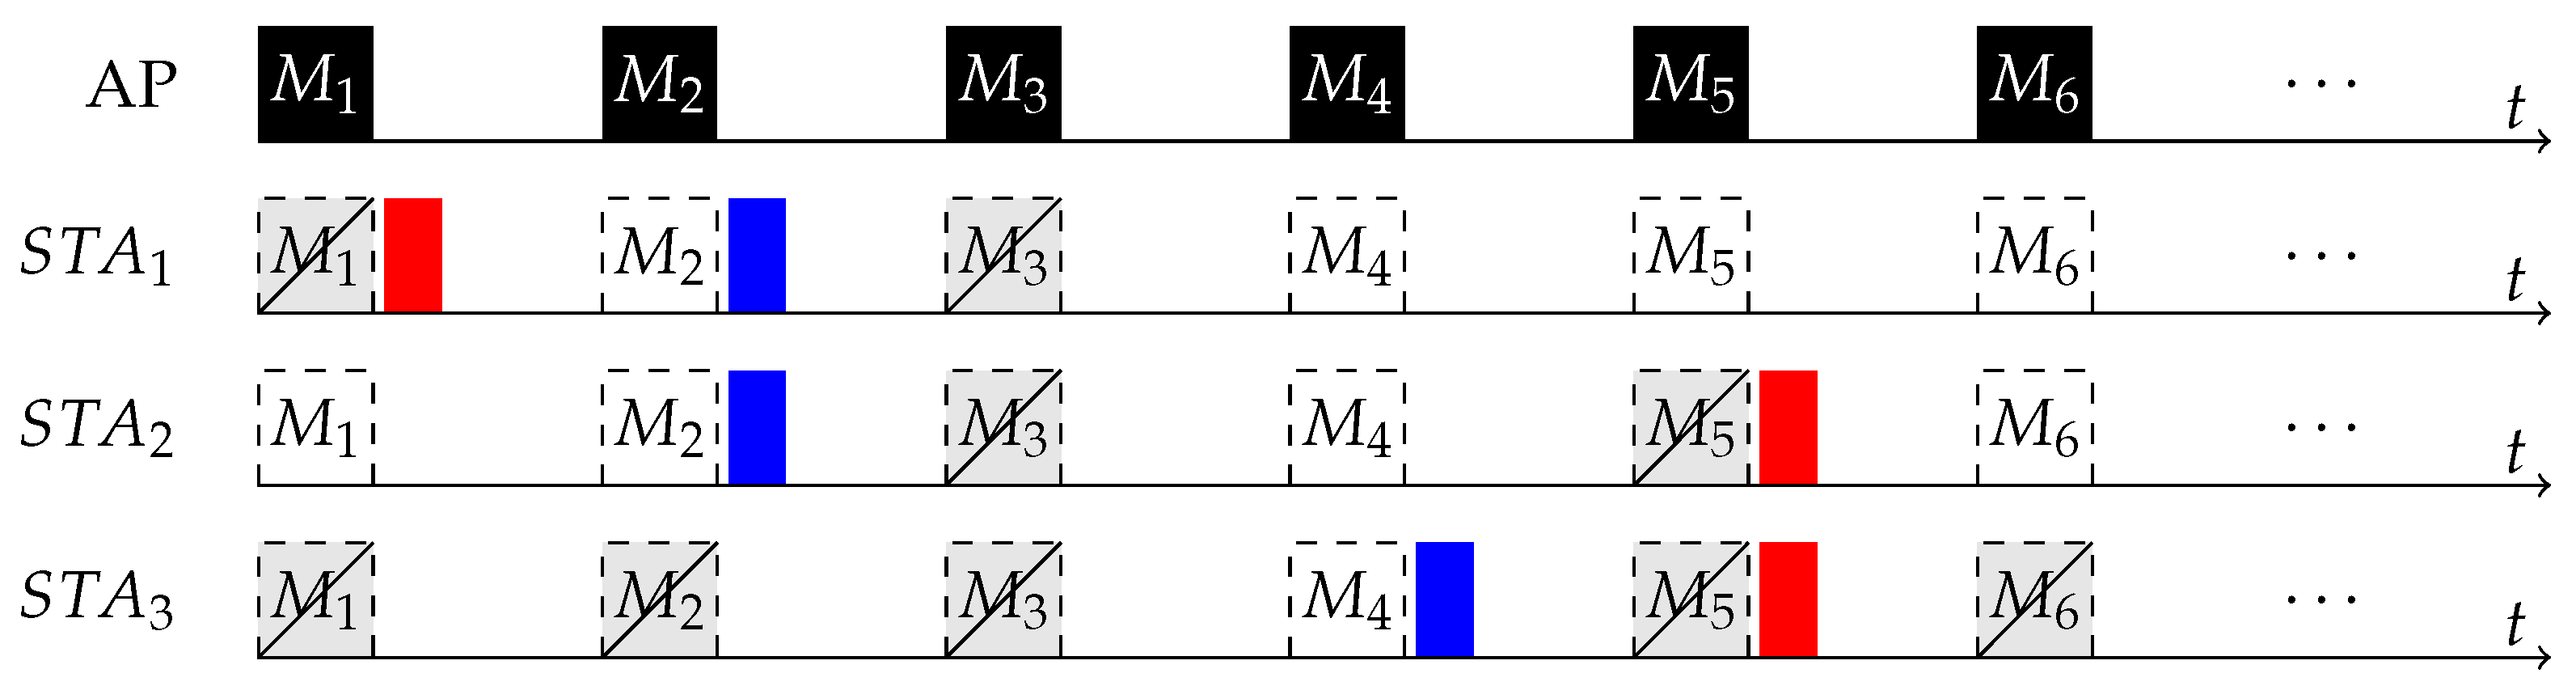
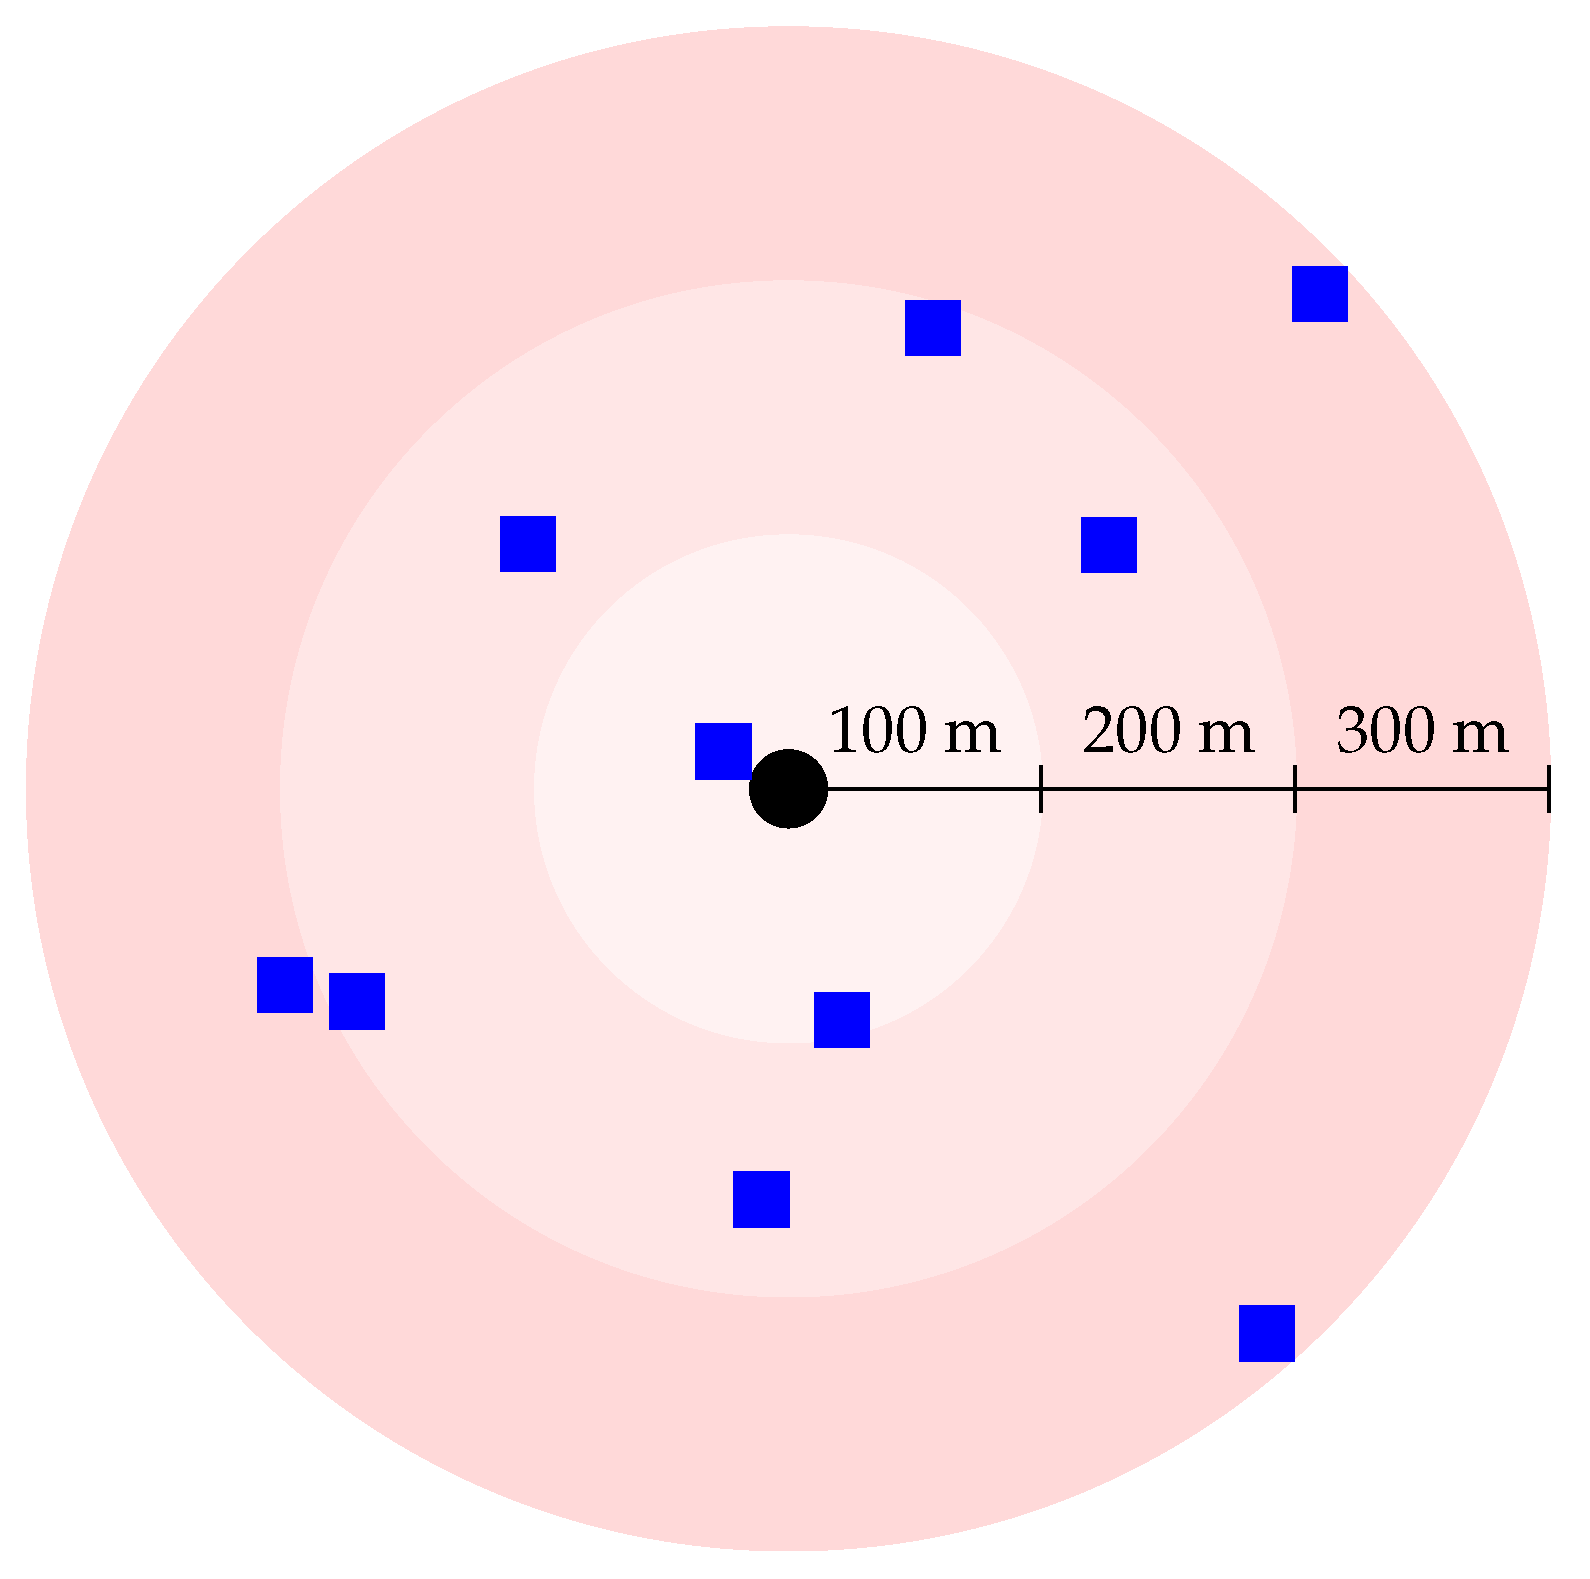
Figure 1 illustrates the operation of the proposed algorithm with three STAs, where transmitted NACKs and ACKs are represented as red and blue rectangles, respectively. After sending message
,
and
received it incorrectly, while
received it correctly.
and
will transmit a NACK with probability
. In this example, only
sends the NACK, which is received in the AP. Message
is received correctly by
and
, and both transmit an ACK with probability
. In the example, both STAs transmitted an ACK, resulting in a collision in the AP. For message
, none of the three STAs received it correctly, and none transmitted a NACK, resulting in a silence event. Similarly, message
resulted in a correct reception of one ACK,
resulted in a collision of NACKs, and
resulted in a silence event.
To estimate the number of STAs receiving messages correctly/incorrectly, the AP waits for
messages (
f messages for NACKs and
f messages for ACKs)—which we call a
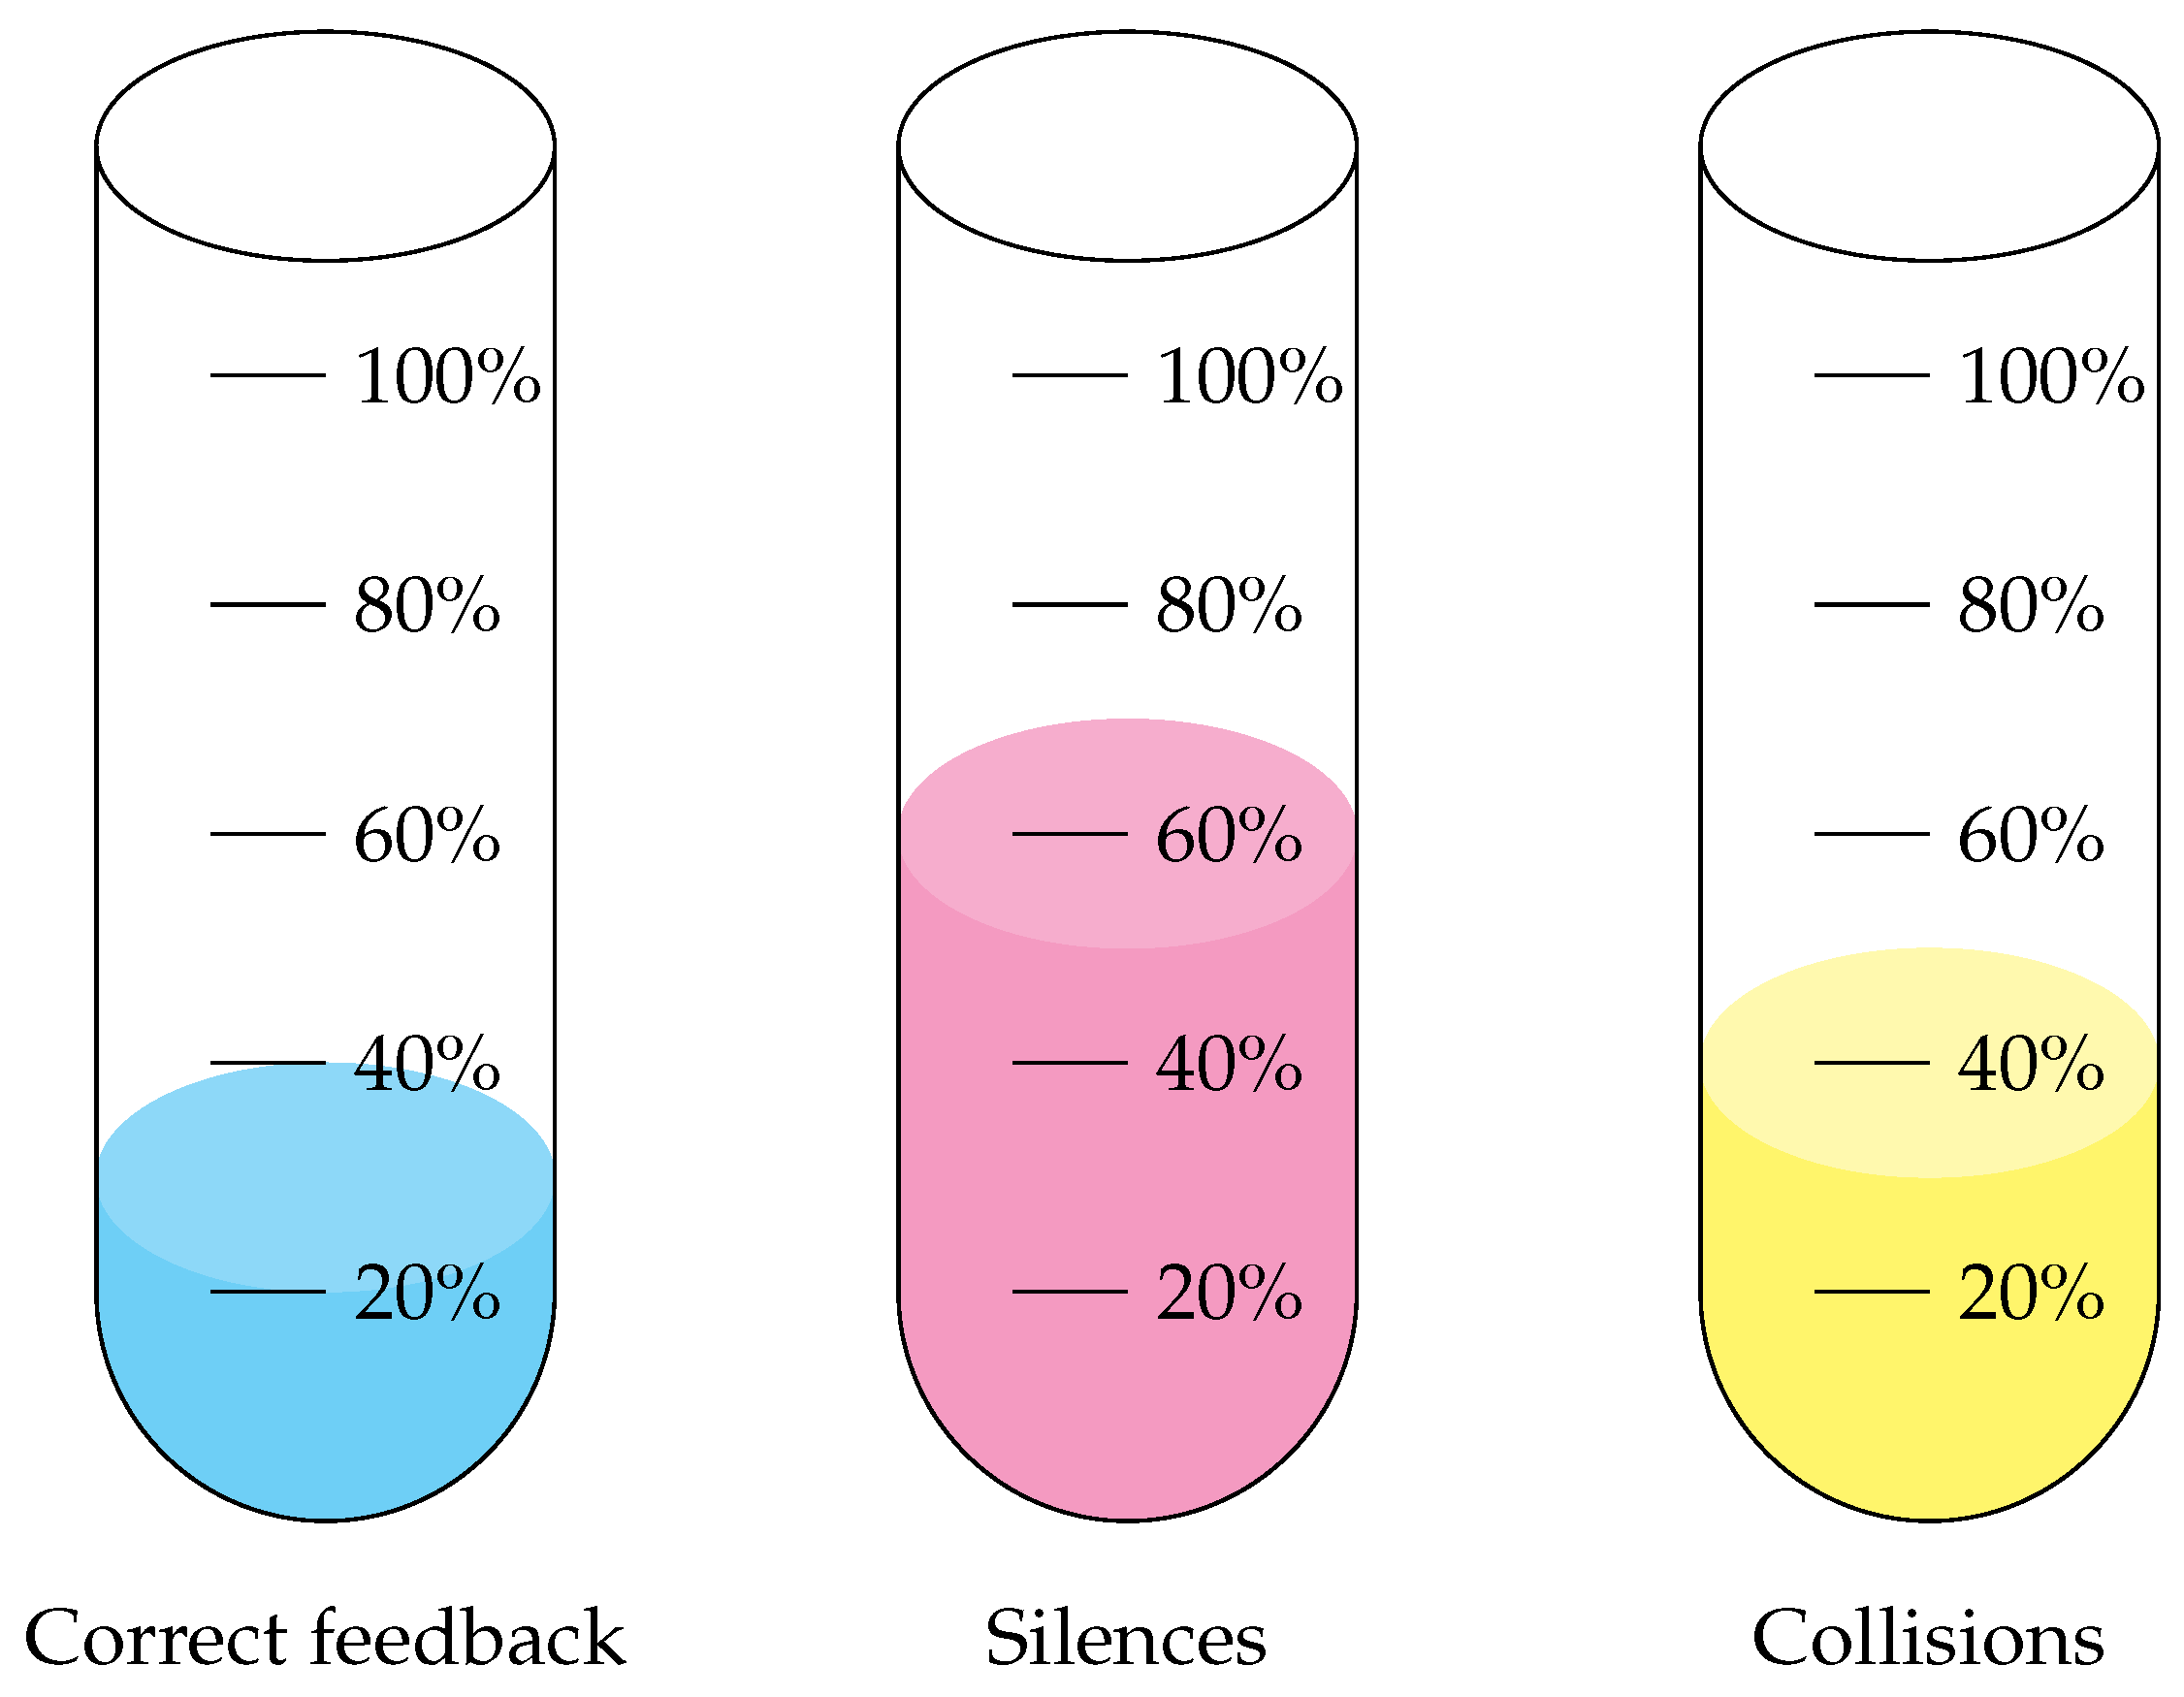
frame—and counts how many of these messages resulted in receiving ACK/NACK messages from only one STA (no collision), received no ACK/NACK feedback (silence), and received multiple ACK/NACK messages from more than one STA (collisions). The AP then counts the number of messages that fall into each of the previous three categories, as shown in
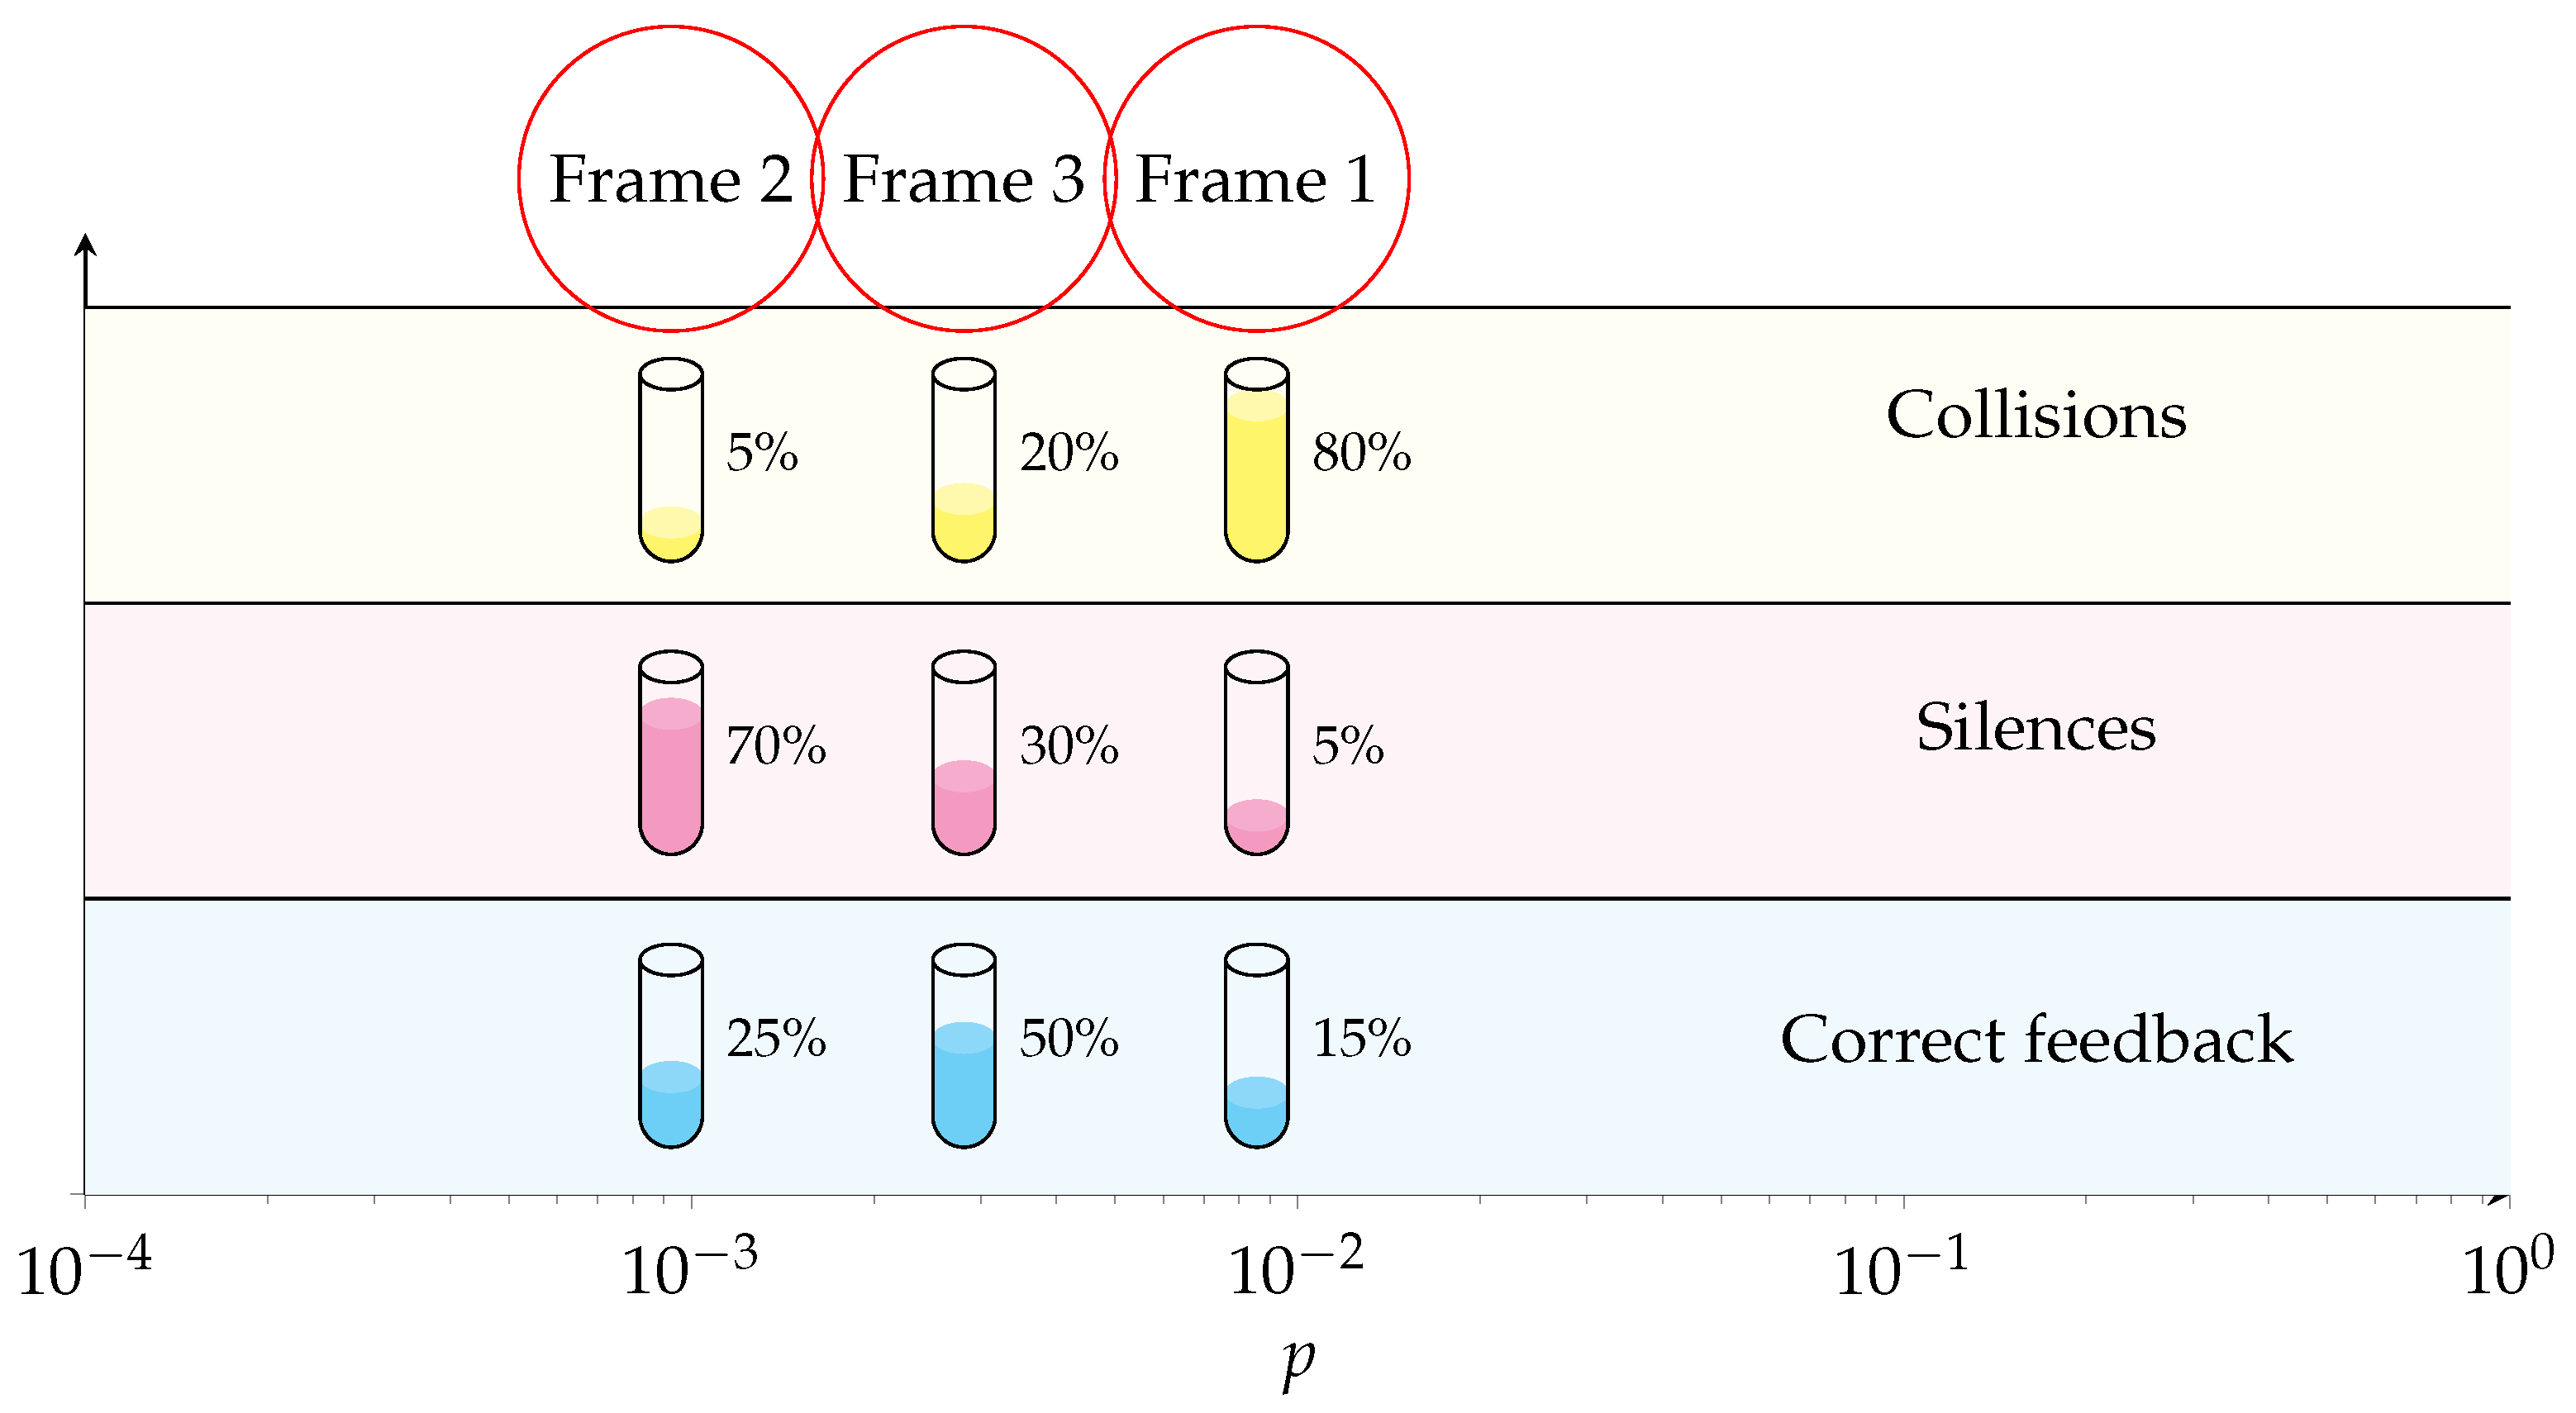
Figure 2, where it is possible to see in this example that, for 20% of transmitted messages, the AP could decode a feedback message (i.e., correct feedback), for 50% of the messages no feedback response was received (i.e., silence), and for 30% of the messages more than one response was received causing a collision. In most cases, the distribution of the three events will be different depending on whether it corresponds to ACK or NACK messages, the probabilities of sending ACK/NACK feedback, the density of STAs, and the dimensions of the scenario.
Not all possible values for and allow the AP to accurately estimate the number of STAs receiving messages correctly/incorrectly for a finite number of messages (). However, when and are tuned correctly, the probabilistic estimation of either number of STAs becomes quite accurate, as shown later. With the transmitted messages associated with one of the three possible events, the AP can estimate the number of STAs receiving messages correctly/incorrectly using standard probability functions.
The expected number of correct ACK/NACK receptions after
messages are transmitted is shown in Equations (
1) and (
2), respectively.
and are the number of ACKs and NACKs received correctly by the AP after transmitting messages, respectively. and are the probabilities that a STA transmits an ACK or NACK message. Finally, and are the number of STAs that received messages correctly/incorrectly after messages were transmitted, respectively.
Similarly, the expected number of silences related to ACK and NACK messages after
messages were transmitted become
Finally, the expected number of collisions related to ACK and NACK messages after
messages were transmitted become
From these equations, the AP can compute
using either Equations (
1), (
3), or (
5). Similarly, the AP can compute
using either Equations (
2), (
4), or (
6). Thus, the AP has three different, independent, and simultaneous ways of computing the number of STAs receiving messages correctly/incorrectly. In theory, the three ways should provide the same estimation, which adds robustness to the system; however, as we will see soon, depending on the chosen probabilities, not all three alternatives provide an accurate estimation for a finite number of messages. Similarly, in some scenarios, the capture effect might change a collision into a correct reception in the AP, thus introducing additional errors while using the correct feedback and collision estimators.
The only equation with a closed form when solving for
is Equation (
3),
and the only equation with a closed form when solving for
is Equation (
4),
Equation (
7) is valid while
and
, while Equation (
8) is valid when
and
. Although there is no closed form for the other equations, they can be solved via numerical methods.
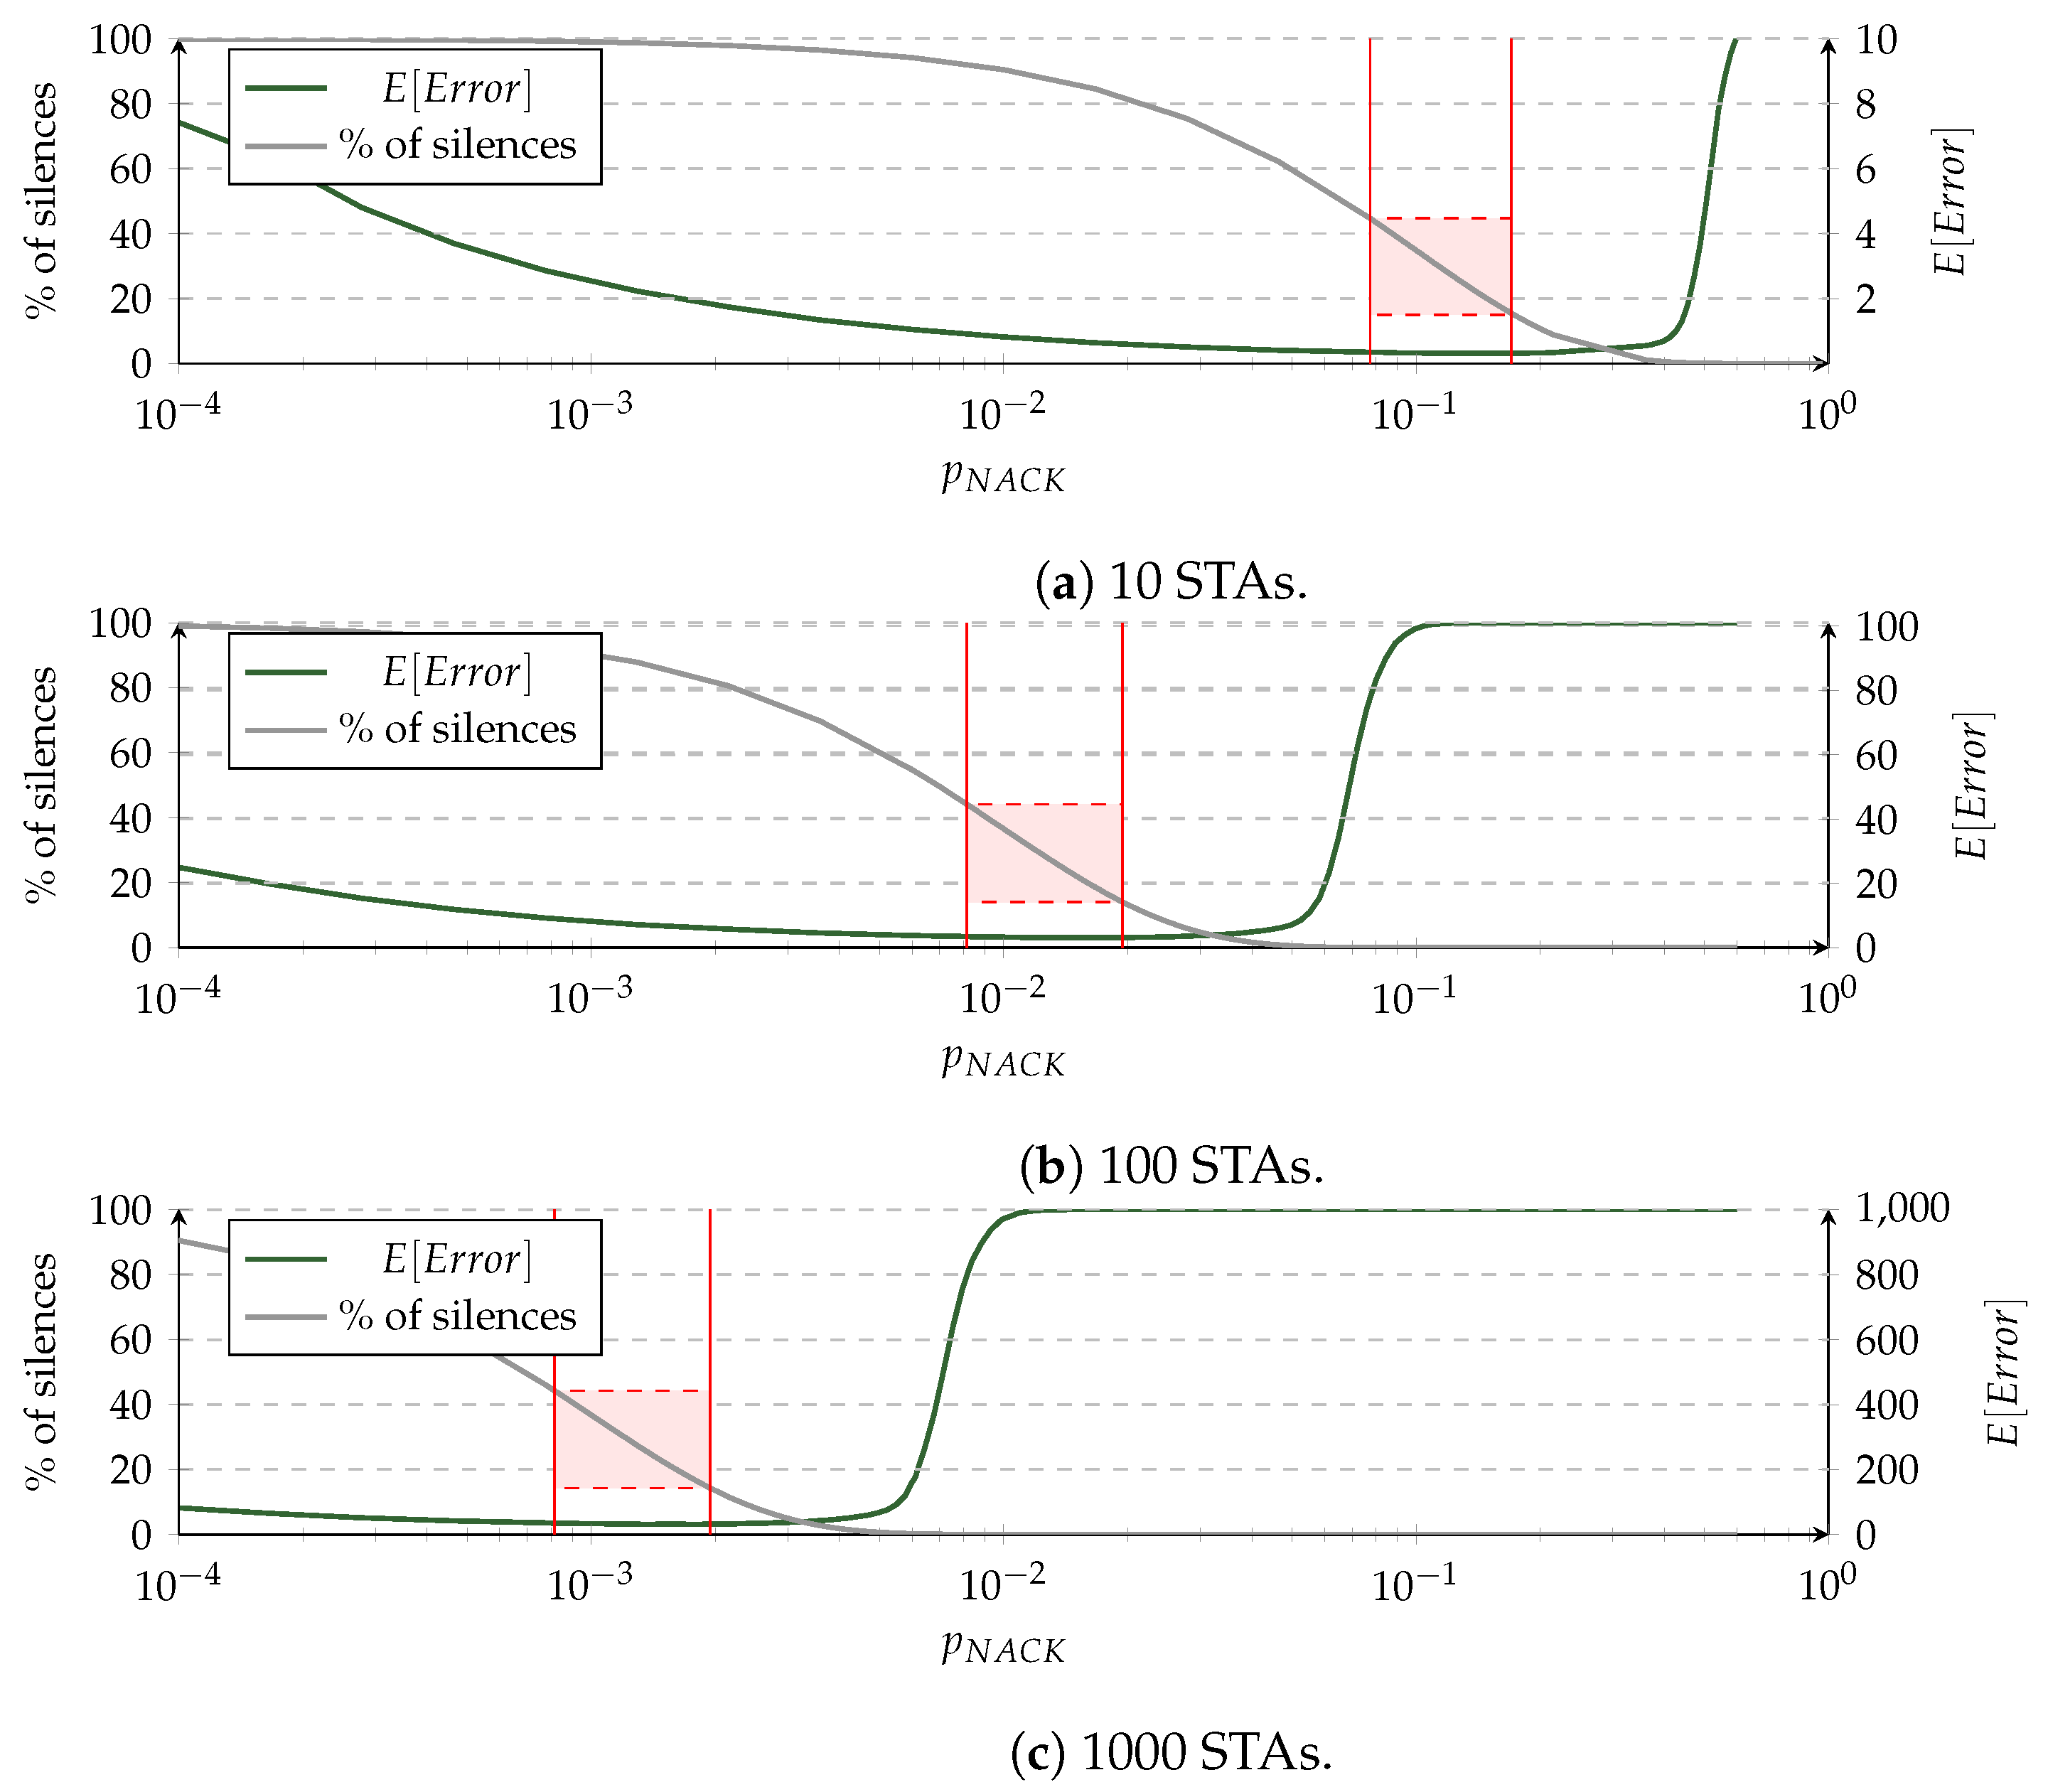
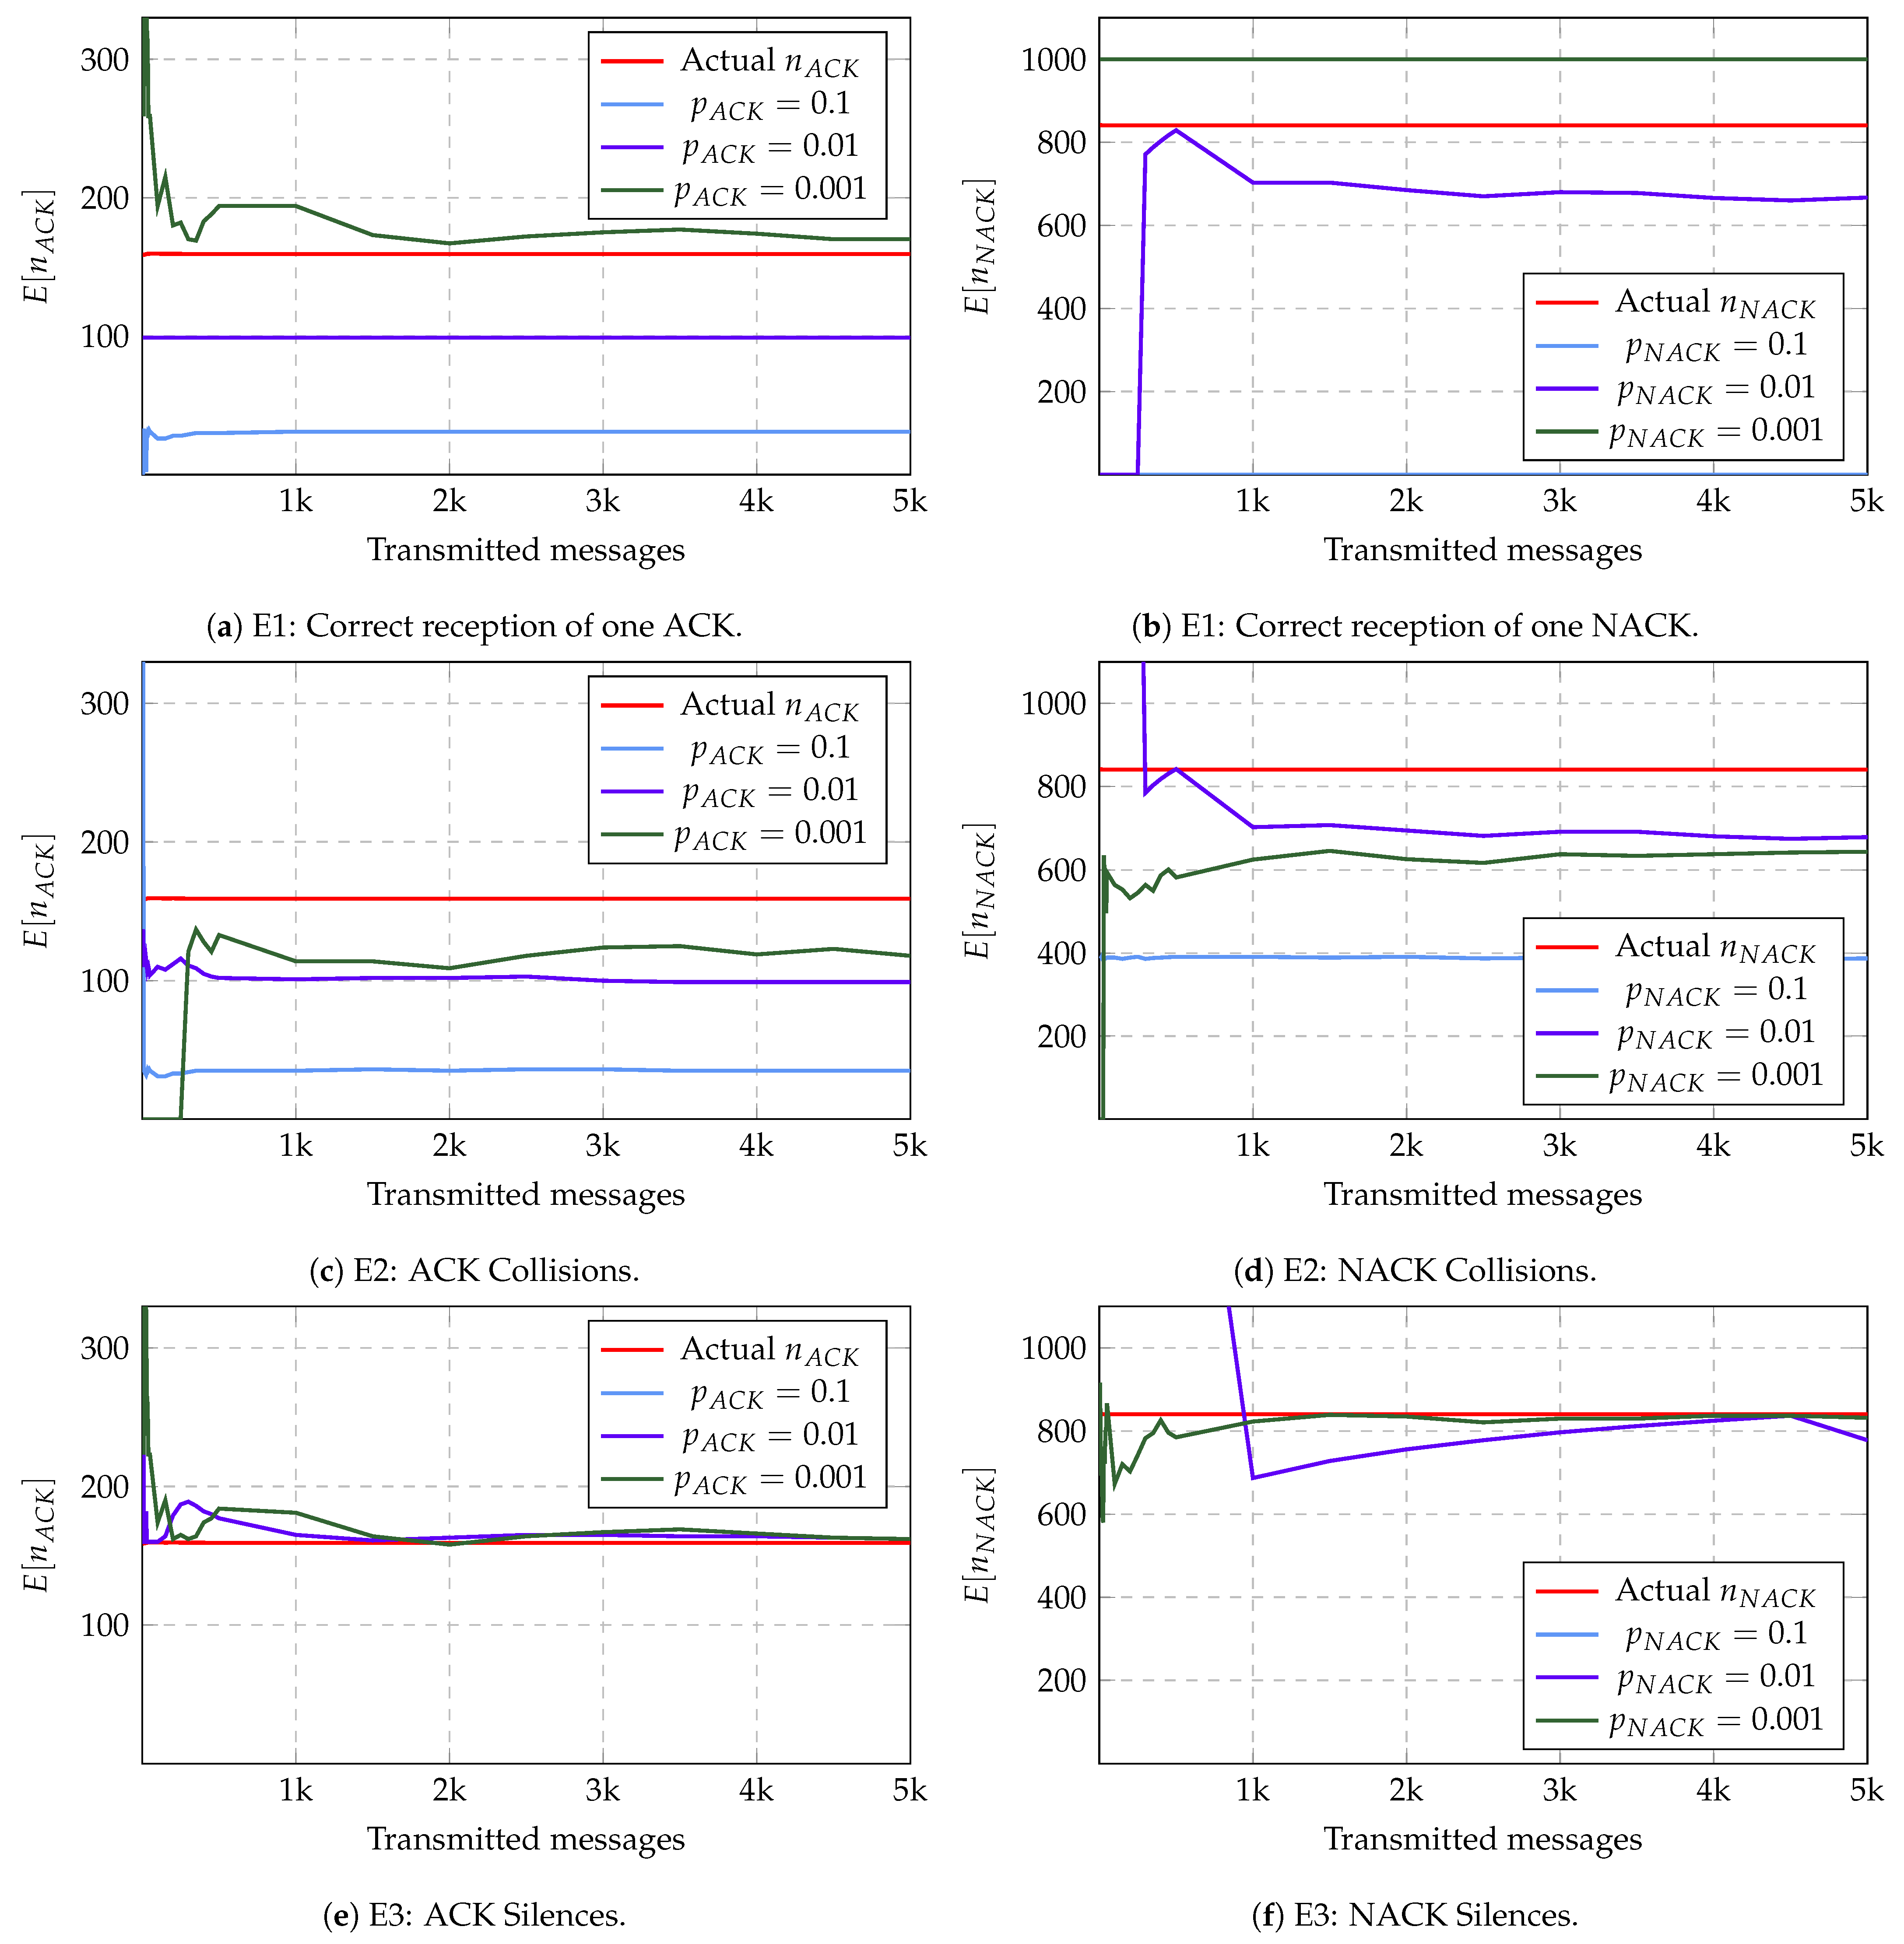
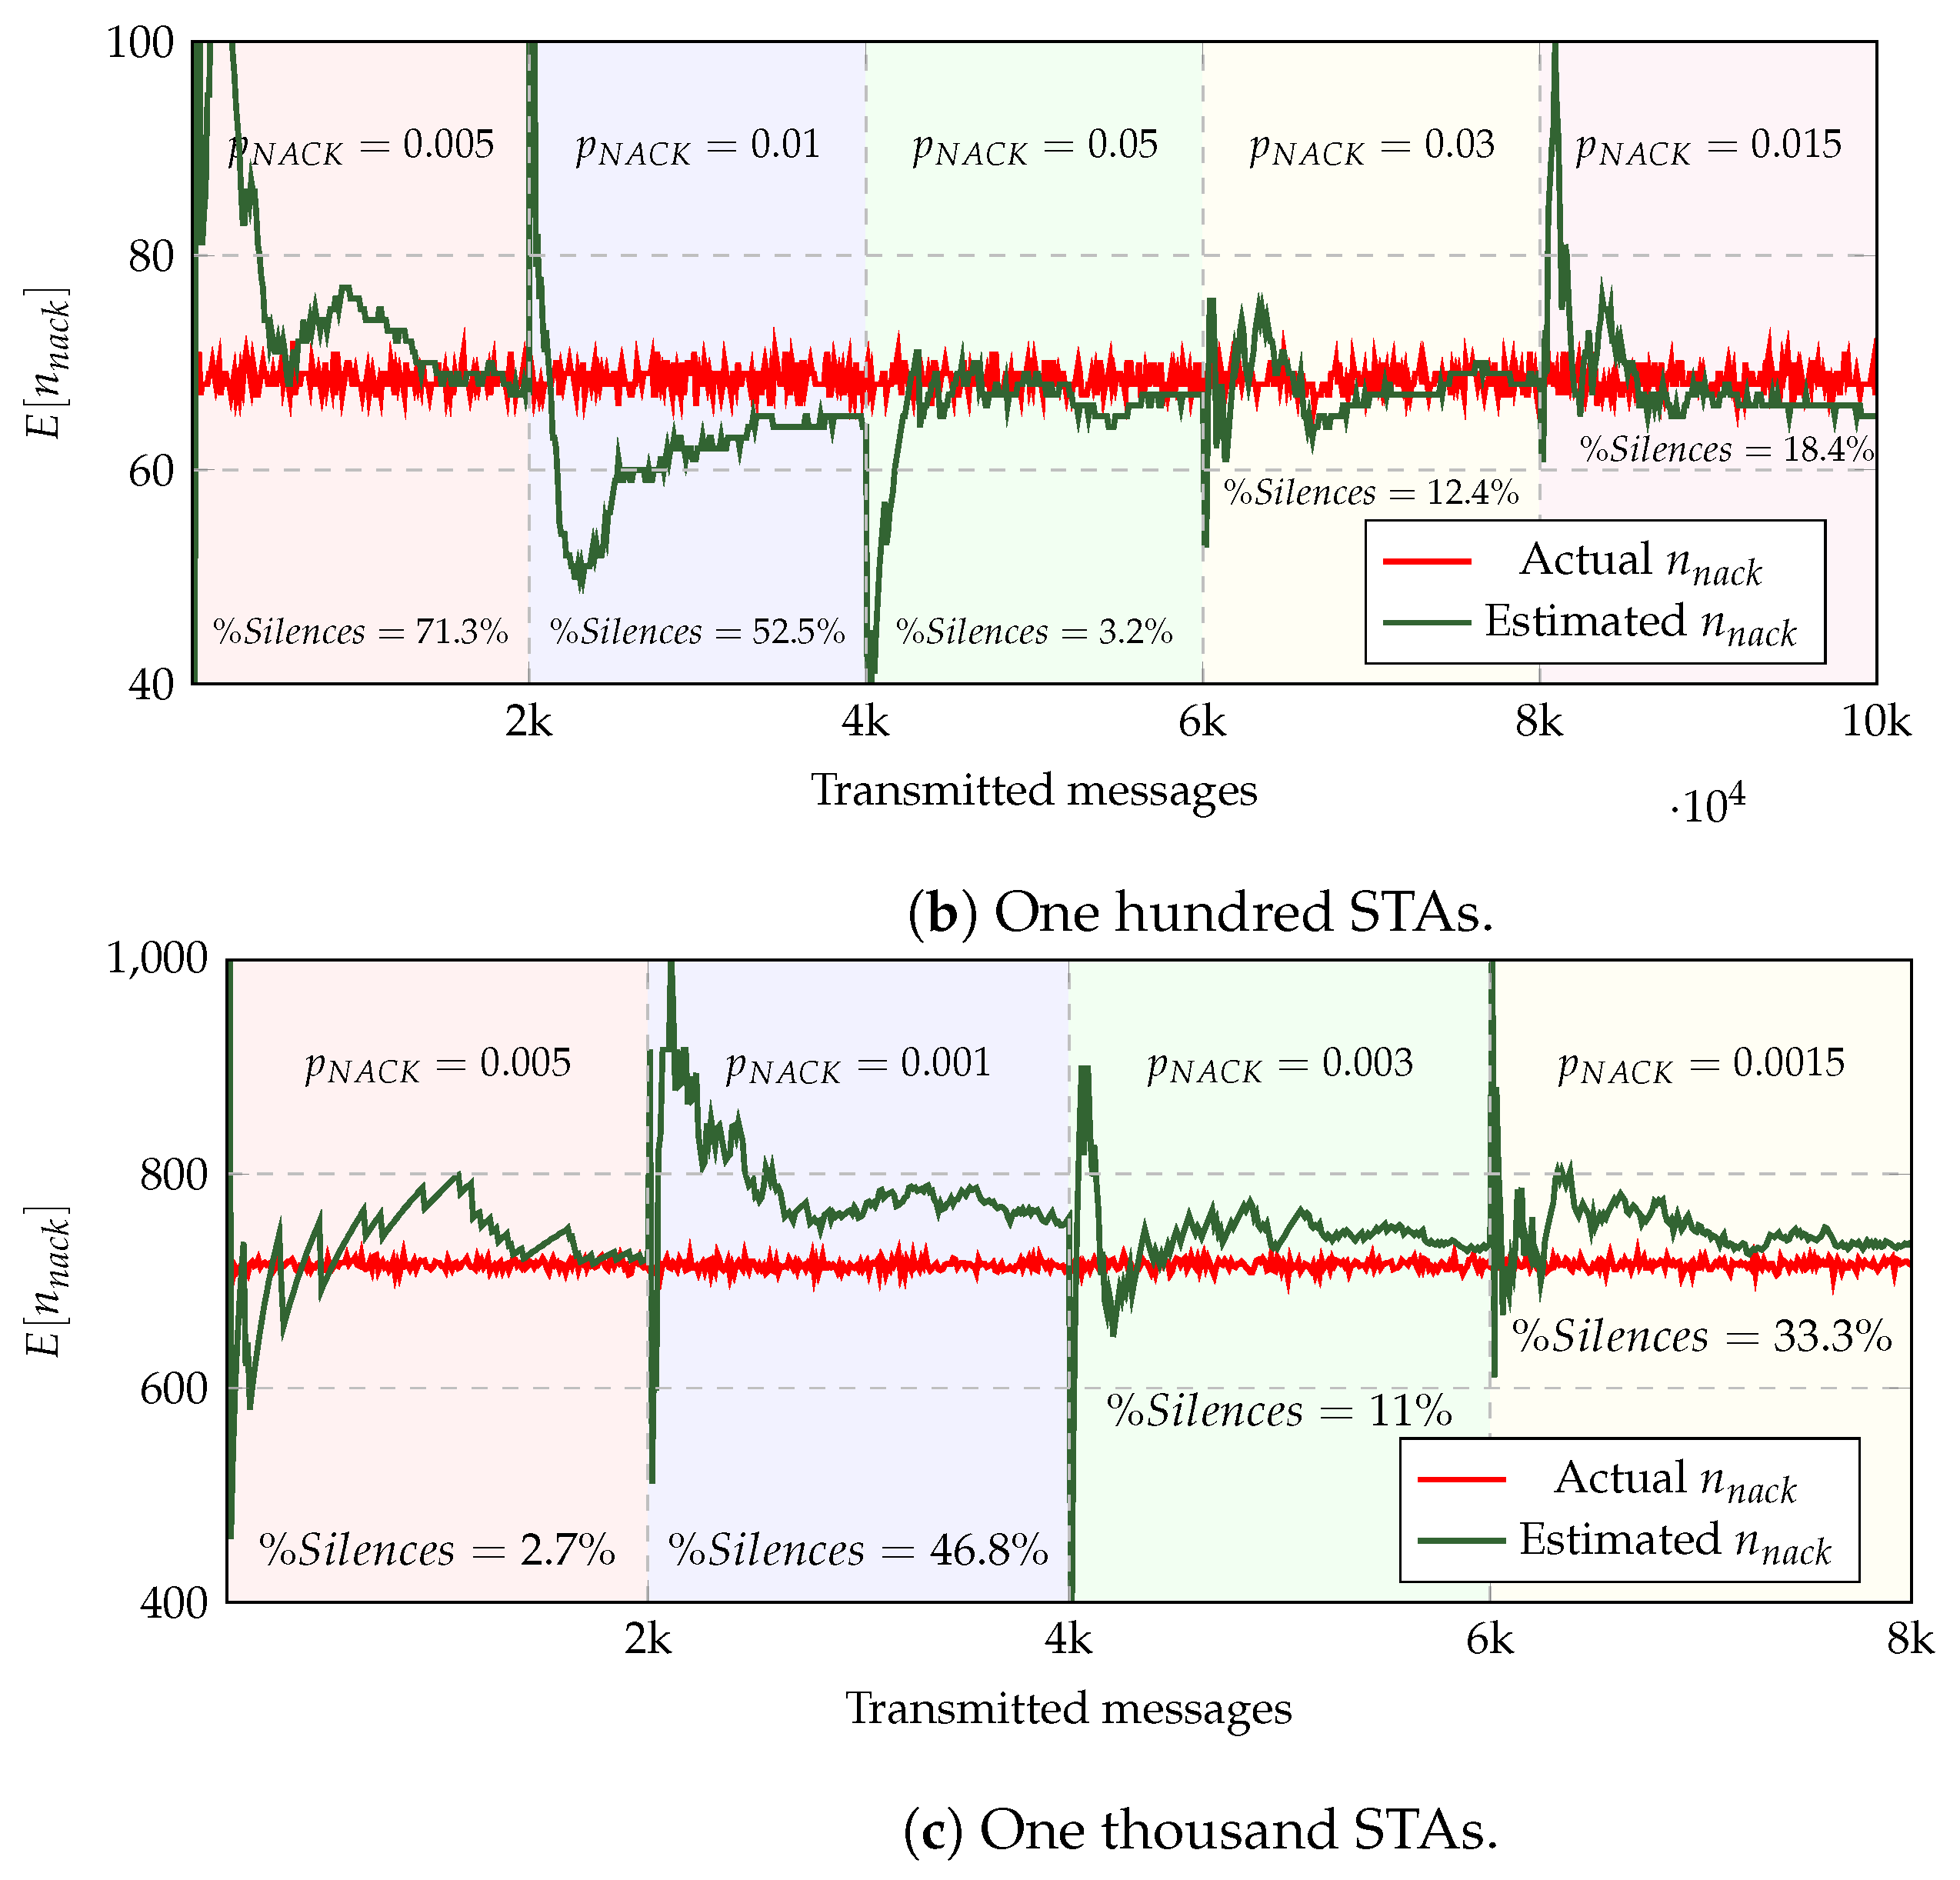
In order to illustrate the error and estimation convergence time, we evaluated the expected error by comparing the number of STAs obtained from Equation (
8), and the number of STAs obtained via simulations for estimating
using the
silence estimator. The experiment was performed in Python for
messages and 10, 100, and 1000 STAs. Each STA transmitted with probability
in each slot and did not transmit with probability
. When no STA transmitted a NACK, a silence event was counted. A collision event was counted when more than one STA transmitted a NACK, and when exactly one STA transmitted a NACK, a successful NACK reception was counted. After 1000 messages,
was estimated using Equation (
8), and the estimation error was computed. This process was repeated 10,000 times to obtain the expected error for such probability.
Figure 3 shows the results of the simulations for evaluating the expected error for estimating
for different values of
using the expected number of silences
. The plots also show the analytic plot of Equation (
4) for
,
, and
. These plots show an area (red rectangle) where the percentage of silences minimizes the expected error in estimating
after 1000 messages. Notice that, in these figures, this is between 15% and 45% of silence events, which we will call
and
, respectively. Notice that, although the simulations are performed for estimating
, the same process coincides with estimating
.
To achieve the percentage of silences that minimizes the expected error in the estimation of
and
, we propose a simple algorithm that iterates over different values of
and
, respectively, until it finds one that satisfies that the target percentage of silence events, in this case, is between
and
(or
and
). The proposed algorithm is similar to a binary search algorithm as shown in Algorithm 1. On each iteration, the value of
or
will logarithmically approach to a value that satisfies
(or
). Notice that the maximum value for
and
is
, as shown in lines 13–15 of the algorithm, which works well for more than 10 STAs.
| Algorithm 1 Algorithm to tune to achieve minimum expected error on estimation |
- 1:
- 2:
magnitude order - 3:
while do - 4:
if f messages passed until the last check then state percentage of silence/collision/reception detected - 5:
if then - 6:
- 7:
- 8:
else if then - 9:
- 10:
- 11:
end if - 12:
if then - 13:
- 14:
break - 15:
end if - 16:
end if - 17:
end while
|
Although the algorithm is presented for , a similar one works for by changing for and and for and . When an appropriate value of or is found, the expected error in the estimation will be the minimum, which means that the AP will estimate or as accurately as possible.
Figure 4 shows an example of how the first algorithm works for ACKs when
and
as defined earlier. In Frame 1, the algorithm chooses
. Since the percentage of silences is below 15% at the end of Frame 1,
switches to
for Frame 2. Now the percentage of silence events is over
, and
switches to the logarithmic halfway between
and
(
) for Frame 3, that is
. Finally, at the end of Frame 3, the percentage of silences is
, which is within
and
; thus, the first algorithm ends and the AP proceeds to estimate
.
4. Adaptive Modulation Algorithm
The general purpose of an adaptive modulation algorithm is to find the best MCS that maximizes the physical transmission speed at the physical layer with a low Bit Error Rate (BER). Historically, these algorithms have been used in unicast scenarios, where the AP adapts the MCS independently for each user. Each MCS changes the number of bits encoded in each symbol and the coding rate, resulting in a different transmission speed at the physical layer.
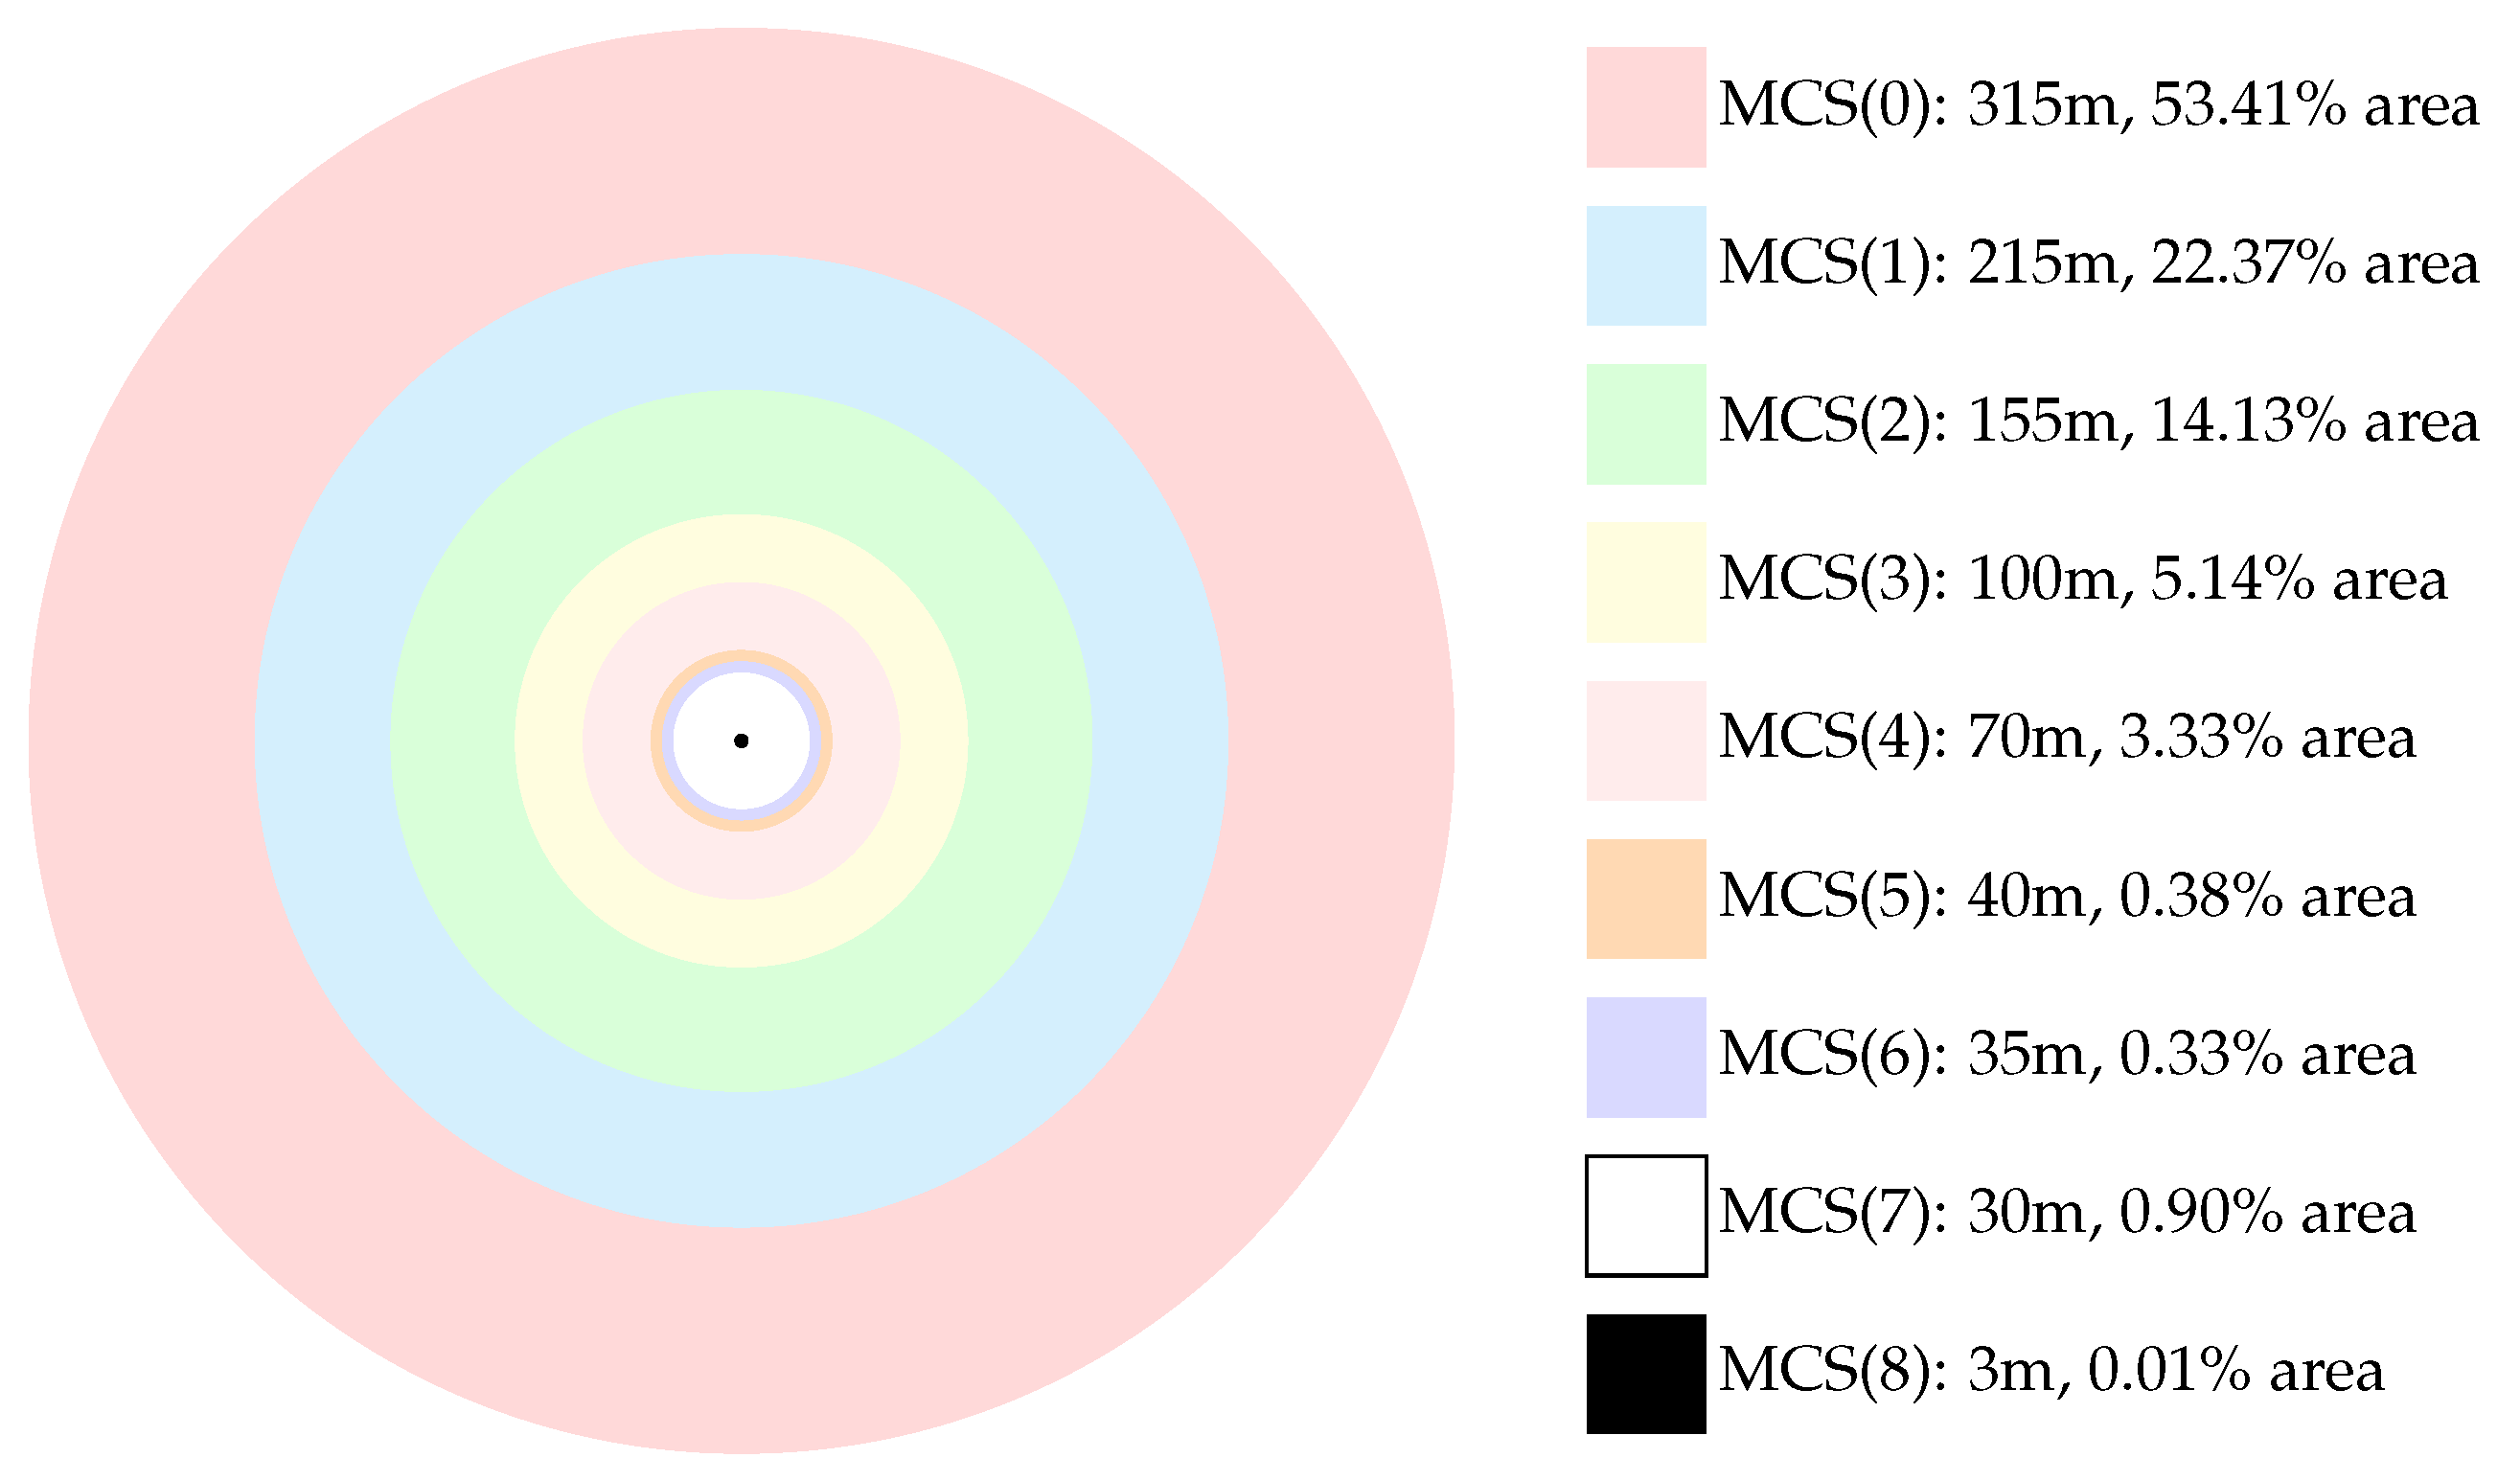
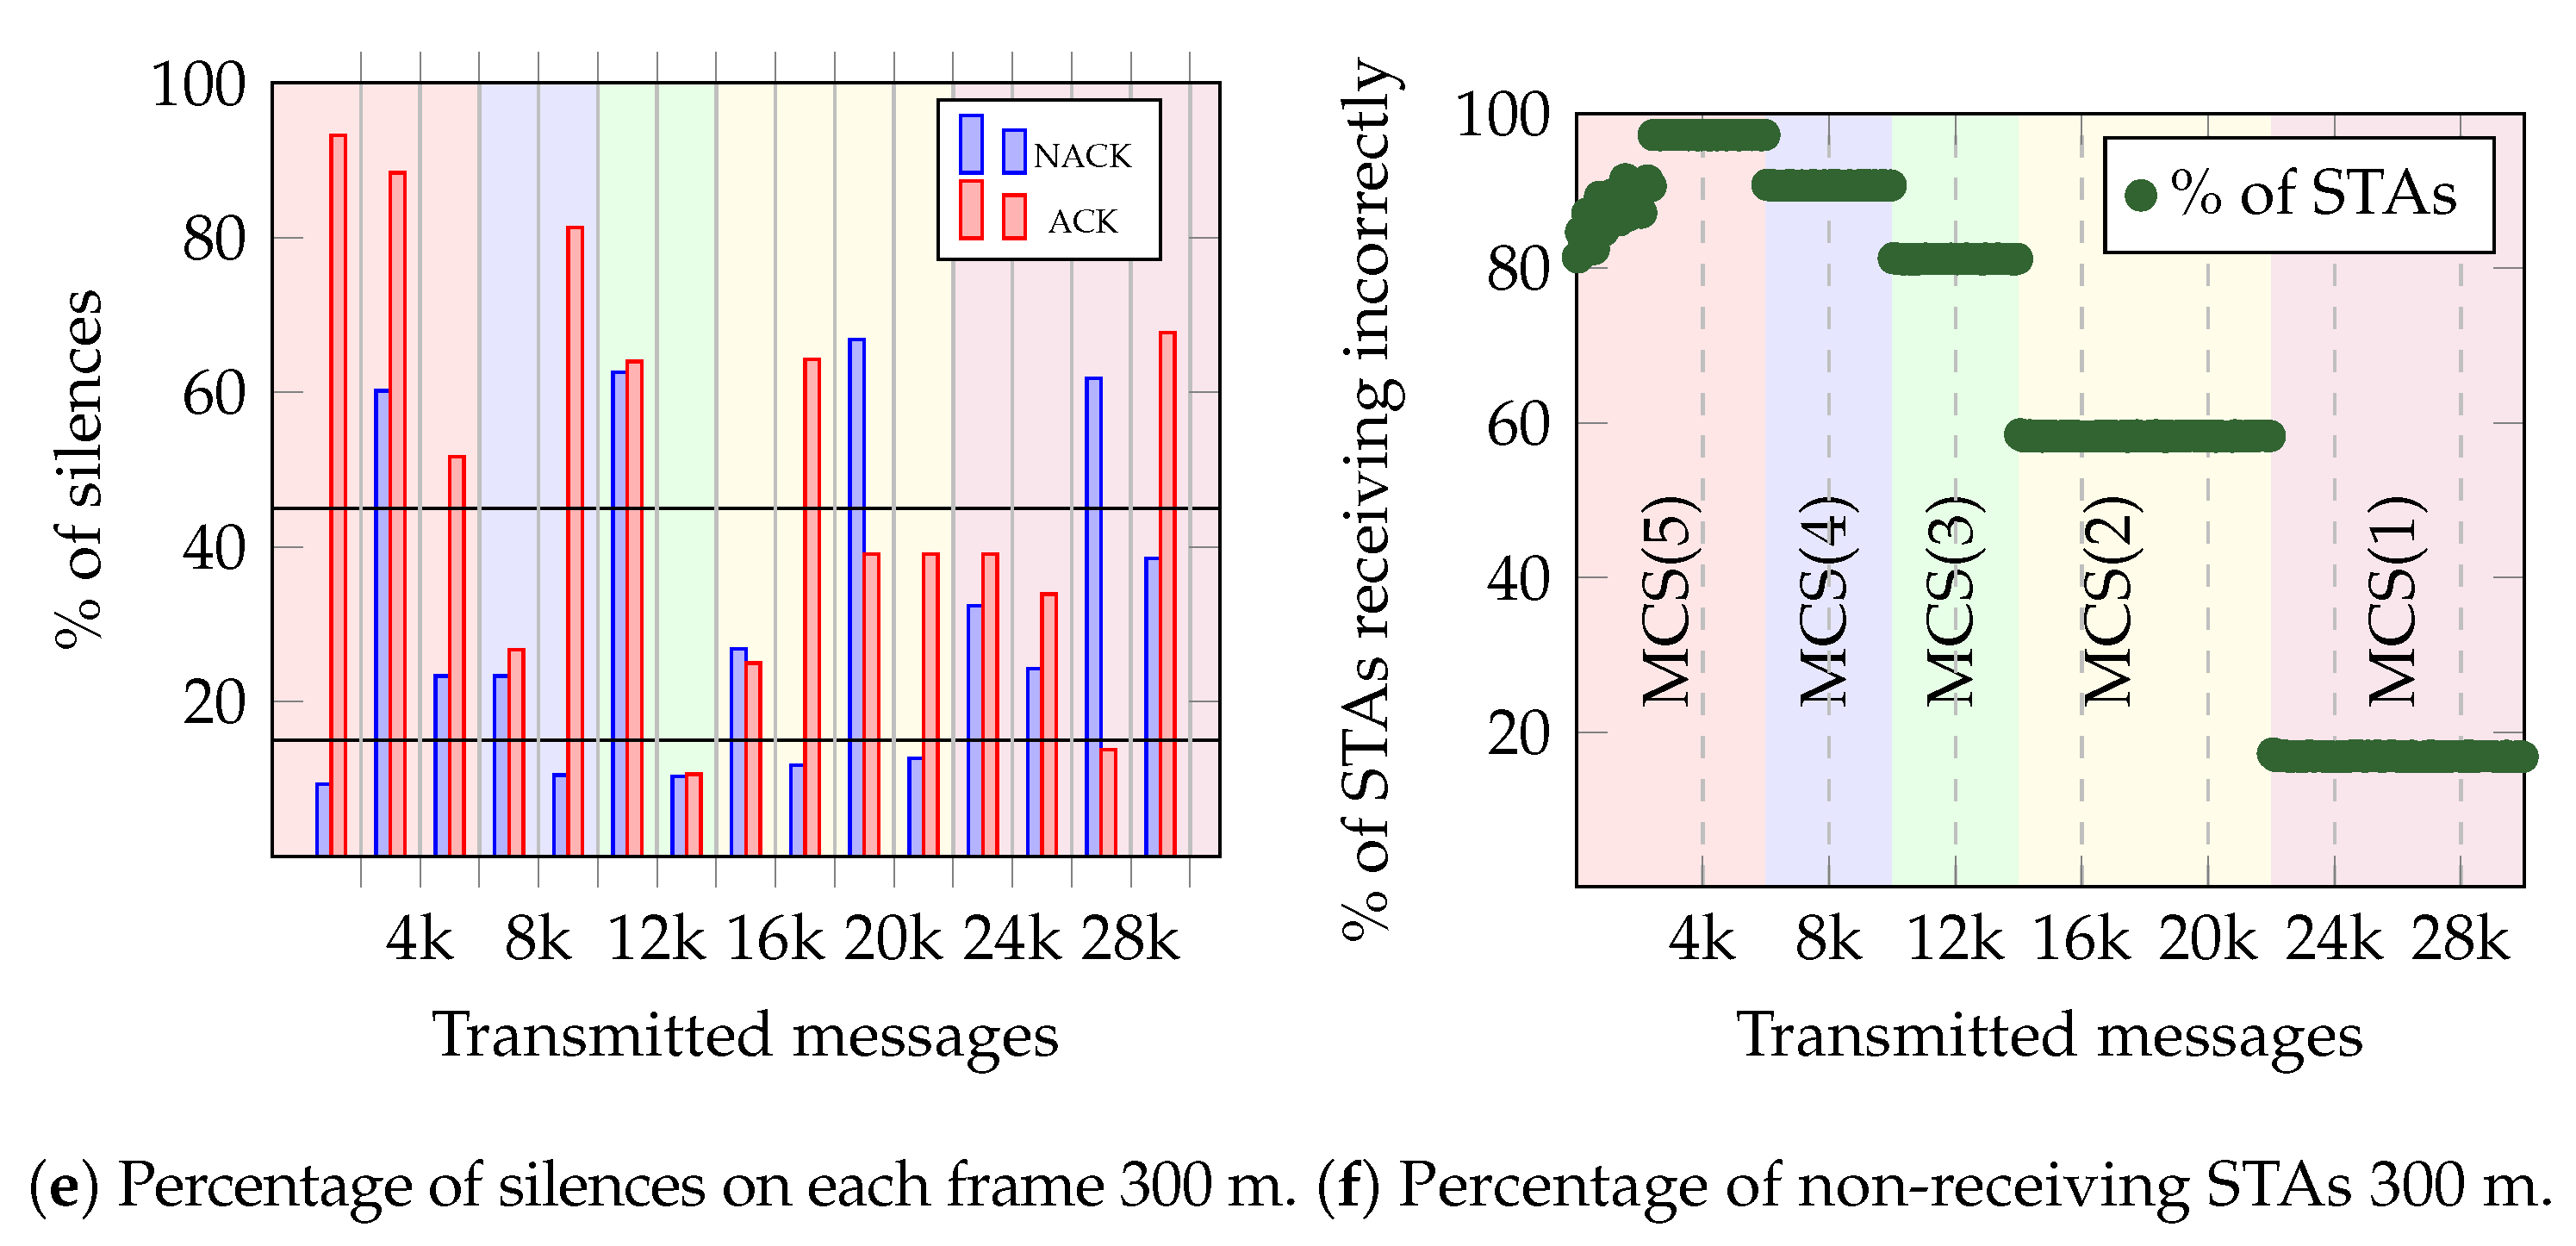
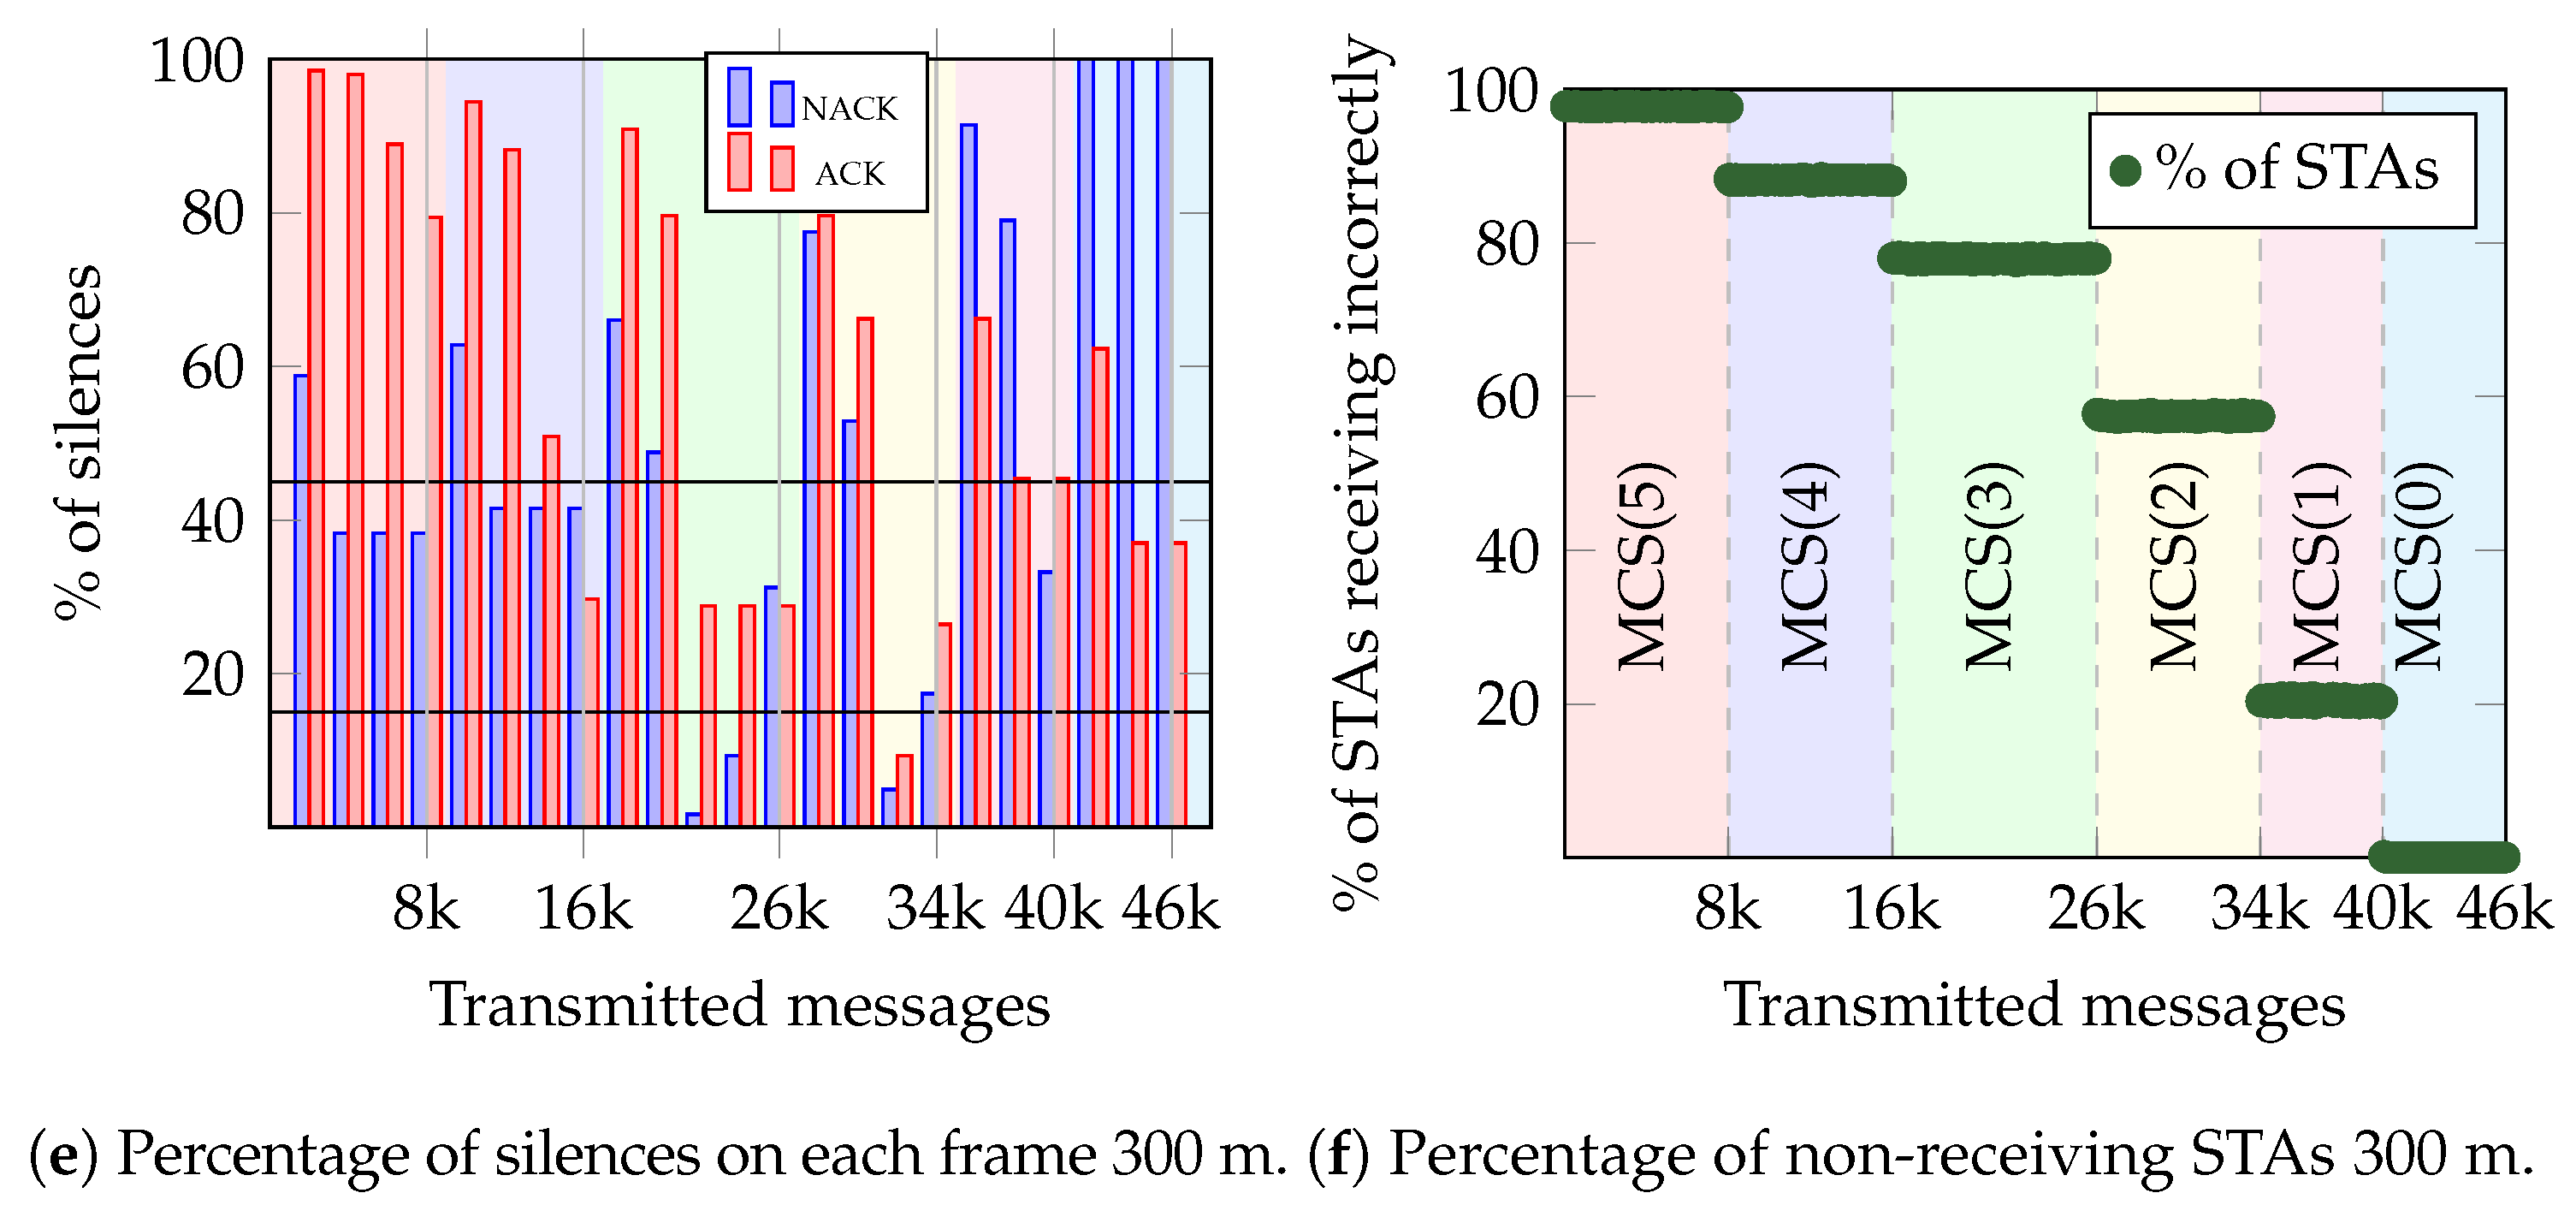
Figure 5 shows an example of the network coverage for MCS(0)-MCS(8). A disk with a different color represents the area covered by a different MCS. Notice that MCS(0) covers 53.41% of the total area, while MCS(8) covers only 0.01%.
Table 2 shows the different MCSs and their characteristics for the IEEE 802.11ax standard. The same table shows (in the right-hand part) the various H.265 video levels that can be supported by the corresponding MCS on the left. Each H.265 level provides a different video resolution and refresh rate, generating a different transmission bandwidth. This table does not show an exhaustive list of all the different H.265 levels but lists some to illustrate how a different MCS will support all H.265 levels up to a particular level. For example, MCS(5) can support all H.265 levels up to level 5.1. In summary, the proposed method in this work will look for the best MCS(i) that supports the best video quality to users yet keeps the percentage of STAs receiving no video content correctly within the desired tolerated limits.
In the case of WiFi broadcast, one transmission performed by the AP is expected to reach hundreds, if not thousands, of receiving STAs simultaneously. Thus, the concept of an adaptive modulation algorithm takes a slightly new turn, and now it seeks to find the best MCS that maximizes the transmission speed with a low BER for a given percentage of STAs.
In the previous section, we proposed an algorithm that estimates, for a current MCS(i),
and
. Thus, we can compute the percentage of STAs receiving messages incorrectly (
) as
We now define
as a range of values of
that is considered acceptable, and then the Algorithm 2 modifies (or not) the current MCS(i) at the end of each frame of
messages according to
From Equation (
10), it results that the MCS(i) will be increased by one index if
is lower than the minimum tolerated percentage (
) to test a higher MSC that provides higher data speed, decreased by one if
is above the maximum tolerated percentage (
) to increase the number of STAs that received messages correctly. The MCS will remain the same index for the following
messages as long as
is within
. The purpose of the adaptive modulation algorithm in the broadcast scenario will be to reach the third case, where the MCS(i) in the current frame remains the same in the next one (as long as the distribution of users does not change).
The reason why we defined a range to determine an acceptable percentage of STAs not receiving messages correctly (
) is to force the AP to find an MCS(i) that keeps
under the desired maximum tolerated level (
), but at the same time allows the AP to tolerate a minimum percentage of STAs with bad reception by setting
. This strategy allows the AP to select a higher MCS(i), likely providing most users better-quality broadcast content. Ultimately, it is up to the network administrator and the specific media content to set the
. In the experiments section and for performance testing purposes, we used a
.
| Algorithm 2 Algorithm to select the MCS for the next cycle |
- 1:
- 2:
if then - 3:
- 4:
else if then - 5:
- 6:
else if then - 7:
- 8:
end if
|
6. Discussion
When evaluating the performance of the three estimators for Algorithm 1, the initial expectation was that all three would yield similar estimations, thereby enhancing the system’s robustness. However, it became evident that the silence estimator outperformed the others for a finite number of messages, providing superior results. The explanation for this outcome is the frequent occurrence of packet capture during the experiments. Packet capture enables a receiver to retrieve a single packet (typically the one with the highest signal-to-noise ratio (SNR) from a collision of packets. This mechanism transforms a collision event into a successful reception event, introducing discrepancies or errors in the collision and correct feedback estimators. Interestingly, the silence estimator remained unaffected by this issue and consistently delivered accurate estimations of the number of STAs receiving messages, demonstrating remarkable accuracy (within a 1% margin of the actual number of STAs).
In the evaluation of Algorithm 2 in
Section 5.3, focusing on the adjustment of MCS, the experiments were conducted using a high value for MCS(i). However, alternative strategies, such as commencing with a middle-valued MCS(i), can be explored. Furthermore, instead of the incremental or decremental adjustment of the current MCS(i) by one step per frame, Algorithm 2 could evaluate the percentage of STAs experiencing message reception errors to execute larger jumps across multiple MCS indexes after each frame. Irrespective of the initial MCS index chosen, the results illustrate that the ultimate MCS outcome remains consistent—solely the time taken to achieve convergence varies. Yet, commencing with a higher MCS offers an advantage by expediting the transmission of broadcast messages. This facilitates a quicker estimation by the AP of the number of STAs that receive messages inaccurately, in contrast to initiating the process with a lower MCS. Due to limitations in space, we only presented the results of experiments using a NACK range set between 10% and 20%. Nevertheless, experiments were conducted with varying NACK ranges, revealing that a reduction in the NACK range (e.g., 5% to 10%) led to the AP selecting a lower MCS index. Conversely, a higher NACK range (e.g., 20% to 40%) resulted in a higher MCS index compared to the findings detailed in
Section 5.3.
While the present analysis exclusively focuses on static scenarios, it is worth noting that, even in scenarios where STAs are mobile, the time it takes for an STA to traverse a single disk associated with a specific MCS(i) (under the scenario depicted in
Figure 5) ranges between 15 to 50 s. Considering that the proposed method achieves convergence to the optimal MCS within 1 to 8 s, the convergence will most likely occur before an STA transitions to a different disk area due to movement. It’s also essential to emphasize that the 802.11bc standard mainly envisions static scenarios. This assumption aligns with the understanding that engaging in activities like viewing multimedia content while walking should be discouraged.
Nonetheless, the proposed method presents its limitations and tradeoffs. On one hand, the time it takes to converge is directly proportional to the rate of broadcast messages. In some high-quality video stream applications, it will take the method a very short time to converge (less than one second); however, if the content is being sent at a slow pace, convergence times to find the optimum MCS will take much longer. Also, this work assumes that only one AP operates in the venue. Having one or more APs interfering with the AP sending broadcast content might cause a collision of broadcast and feedback messages, adding errors in the estimation process. In the future, we plan on modifying the base method to make it resilient to this constraint.
Finally, we evaluated the performance of the method in a simulation environment. Thus, future work should focus on implementing the presented strategy to validate its operation in real-world conditions. However, we anticipate several discrepancies impacting the proposed method’s performance in a real-world setting. On the one hand, SNR variations are similar from one instant to the next in the simulations. However, this may not happen in real-world conditions where, due to channel conditions, SNR might experience significant changes in a very short time. On the other hand, the simulation assumes symmetric channels. This condition will not always happen in real-world situations, thus introducing errors in the number of events the AP counts for each of the three estimators. Then, more experiments must be conducted in heterogeneous networks where devices have different hardware features, such as antennas or transceiver capabilities.


 ,
, 


