Article

Towards an Optimal Cloud-Based Resource Management Framework for Next-Generation Internet with Multi-Slice Capabilities

by
Salman Ali AlQahtani
New Emerging Technologies and 5G Network and Beyond Research Chair, Department of Computer Engineering, College of Computer and Information Sciences, King Saud University, Riyadh 11421, Saudi Arabia
Future Internet 2023, 15(10), 343; https://doi.org/10.3390/fi15100343
Submission received: 19 September 2023 / Revised: 9 October 2023 / Accepted: 12 October 2023 / Published: 19 October 2023

Abstract

:
With the advent of 5G networks, the demand for improved mobile broadband, massive machine-type communication, and ultra-reliable, low-latency communication has surged, enabling a wide array of new applications. A key enabling technology in 5G networks is network slicing, which allows the creation of multiple virtual networks to support various use cases on a unified physical network. However, the limited availability of radio resources in the 5G cloud-Radio Access Network (C-RAN) and the ever-increasing data traffic volume necessitate efficient resource allocation algorithms to ensure quality of service (QoS) for each network slice. This paper proposes an Adaptive Slice Allocation (ASA) mechanism for the 5G C-RAN, designed to dynamically allocate resources and adapt to changing network conditions and traffic delay tolerances. The ASA system incorporates slice admission control and dynamic resource allocation to maximize network resource efficiency while meeting the QoS requirements of each slice. Through extensive simulations, we evaluate the ASA system’s performance in terms of resource consumption, average waiting time, and total blocking probability. Comparative analysis with a popular static slice allocation (SSA) approach demonstrates the superiority of the ASA system in achieving a balanced utilization of system resources, maintaining slice isolation, and provisioning QoS. The results highlight the effectiveness of the proposed ASA mechanism in optimizing future internet connectivity within the context of 5G C-RAN, paving the way for enhanced network performance and improved user experiences.

1. Introduction

It is no secret that mobile data traffic has been rising at an alarming rate recently. Research indicates that by 2022, monthly internet traffic will reach 77.5 exabytes [1], with the majority of that coming from video and social networking services. For bandwidth-hungry applications, the limitations of current 4G cellular technology have prompted widespread adoption of the next generation of cellular networks, 5G.
Vertical industries, including healthcare, transportation, and manufacturing, may rest assured that their customers will have a positive experience thanks to the reliability of the 5G network [2]. With speeds of up to 20 Gbps, latency of 1 millisecond, and support for 1 million users per square kilometer, it has the potential to completely overhaul the current 4G network. Additional benefits of the 5G network include improved energy efficiency and a tenfold increase in battery life [3].
Enhanced Mobile Broadband (eMBB), Massive Machine Type Communications (mMTC), and Ultra-Reliable Low-Latency Communication (uRLLC) are the three use cases that 3GPP identified for 5G networks. Video streaming, virtual reality (VR) gaming, and social media all put a strain on the network and necessitate a high throughput to keep up with user demand in the eMBB scenario. URLLC, on the other hand, necessitates low latency and excellent dependability to enable time-sensitive applications like e-health, smart cities, and smart autos. Furthermore, the mMTC use case necessitates a sizable network capacity to accommodate numerous connections from low-power devices, like those used in IoT software. The specifications for these 5G applications are detailed in Table 1.
Scientists have put forth a lot of time and effort to develop 5G-compatible devices. Software-defined networks (SDN), network function virtualization (NFV), mobile edge computing (MEC), and cloud radio access network (C-RAN) methods are all examples of such critical enabling technologies [2]. C-RAN design is used in 5G networks to handle the growing number of connections with varying quality of service needs. Baseband units (BBUs) are decoupled from physical base stations to build a virtual centralized BBU pool as part of our investigation of a two-layer, fully centralized C-RAN architecture. The BBU pool processes and allocates the radio resources on demand [5,6], as it is responsible for all the functions of the physical, MAC, and network layers.
The 5G networks introduce the idea of network slicing, which helps vertical businesses meet their varied needs. With network slicing, a single physical infrastructure can be partitioned into many, autonomous virtual slices, each of which can have its own set of performance characteristics and set of resources [7]. Network functions virtualization (NFV) and software-defined networking (SDN) are just two examples of the technologies that have helped with the creation and management of virtual functions in network slices. In particular, the network slices in 5G C-RAN are able to handle their requests and distribute resources with greater flexibility because to the virtualization of BBU functions [8,9].
Through network slicing, individual 5G use cases can be allocated their own dedicated slice of the network, with their own set of quality-of-service settings. The C-RAN, the transport network, and the core network are all included in the end-to-end network slices it creates [4]. End-to-end slicing has been the subject of extensive research, particularly in the context of the central network. For the purpose of this study, we isolate the topic of network slicing in C-RAN. When a C-RAN network is being sliced, the BBU pool’s radio resources are divided up and allocated to each individual slice. It satisfies the Quality-of-Service (QoS) needs of all the slices, and it offers numerous other advantages in terms of resource utilization [5].
Network slicing in C-RAN has several advantages, but it is still difficult to implement in 5G networks. In order to dynamically assign PRBs from the BBU pool to each network slice depending on the various QoS factors required by the slices, C-RAN-based 5G networks need efficient slicing algorithms [10]. It also needs an admission control method to reduce the call blocking probability (BP) [11]. In addition, in a C-RAN, slice isolation is critical to safeguard the minimum QoS needs of all the slices by allocating a minimum resource portion in the BBU pool to each slice [12].
The proposed system has many advantages. It aims to increase resource utilization in the 5G CRAN’s BBU pool of resources. In addition, it seeks to guarantee the minimum QoS requirements for each 5G network slice while maintaining isolation. The proposed system dynamically allocates the resources of the BBU pool among the three 5G slices, each with different traffic sources. Moreover, it assigns a resource portion for each 5G slice based on its QoS requirement in terms of bandwidth and delay.
This paper’s structure continues below. The relevant literature and research issue is presented in Section 2. The 5G C-RAN network model and detailed analysis of the suggested systems are presented in Section 3. The simulation setup and the implemented experiments to evaluate the suggested systems are shown and discussed in detail in Section 4. The paper is wrapped up in Section 5 with a summary and some suggestions for moving forward.

2. Related Works and Research Problem

Network slicing in the 5G core radio access network is the subject of a large body of literature. 5G C-RAN slicing faces numerous issues due to the limited quantity of radio resources in C-RAN and the ever-increasing traffic from a wide range of vertical businesses. Slicing a network has a number of issues, not the least of which is determining how best to allocate resources so that individual slices can maximize resource usage and ensure they receive the quality of service they demand. Many academics have recently focused on the topic of resource distribution for network slices in 5G C-RAN. The 3GPP in particular has been the focus of a variety of studies in this area. Resources can be allocated in two distinct ways: statically or dynamically. Without taking into account fluctuations in slice traffic, static allocation assigns the same amount of resources to each slice at all times.
With dynamic allocation, resources are distributed among slices on the fly, based on the volume of traffic in each slice [13]. However, it is more difficult to make real-time changes to the allocation when using this method. In [14], the authors explored how eMBB and URLLC network slices’ resource distribution in 5G C-RAN is adjusted to meet the needs of the slices. To meet the stringent requirements of the URLLC slice, they devised an algorithm employing a mixed-integer nonlinear program to allocate the resources and isolate the slice traffic. In compared to previous allocation methods that are solely concerned with power transmission, simulation results revealed that this one might deliver a high throughput percentage. However, the algorithm in that study did not take slice admission control into account, and it focused solely on two network slices without addressing the mMTC network slice. By taking into account both admission control and resource allocation in the RAN, the authors of [15] studied resource management for numerous network slices. The purpose of this research was to implement regulations for controlling who can access the slices. As an added bonus, their proposed approach would improve bandwidth consumption while also resolving the bandwidth distribution for the slices, assuring the necessary QoS. The numerical findings for throughput and bandwidth utilization [16] demonstrated that the suggested admission control strategies are superior to other approaches. However, [14,15] relied on static resource allocation algorithms that are inflexible in the face of fluctuating data traffic. Reduced resource utilization and inability to meet QoS requirements for network slices are both consequences of static resource allocation. To address this problem, the team behind [17] developed a dynamic resource allocation strategy based on deep reinforcement learning to distribute the RAN’s shared resources across its several slices. To assign radio resources to a slice without knowing the slice’s traffic demands beforehand, they propose a new technique called generative adversarial network-powered deep distributional Q network (GAN-DDQN). As can be seen from the simulation results, the algorithm outperformed the traditional approaches. Under the URRLC scenario, however, which mandates low-latency communication, the proposed technique does poorly.
To increase transmission speed while still meeting the QoS criteria of the network slices, the authors of [18] looked into the various latency limitations imposed by the slices. A dynamic resource allocation mechanism was implemented in the RAN with the help of the constrained Markov decision process (CMDP). Based on the simulation results, it is clear that the suggested algorithm satisfies the delay requirement for the eMBB, mMTC, and URLLC use cases. In order to better allocate radio resources for network slices in a software-defined network-based radio access network (SDN-RAN), a dynamic user count aware (DUCA) system was developed in a recent study [19]. To dynamically revise the resource portion for each slice, the system calculates the total number of active users and the number of new user requests. Results from a simulation shown that DUCA helps serve more people across the eMBB, URLLC, and mMTC network slices while keeping them separate.
The authors of [20] implemented a dynamic resource allocation approach in the RAN to satisfy the joint QoS requirements of URLLC and eMBB slices. Lyapunov optimization is used in the proposed method to schedule the service of the two network slices and allocate the RAN resources. The numerical results for URLLC and eMBB showed that the suggested method successfully achieved reduced latency and high data quality. In [21], the authors proposed using game theory to create a strategy that dynamically allocates radio resources to each slice in the RAN. Critical Internet of Things (cIoT), Enhanced Mobile Broadband Premium (eMBB Pr.), and Enhanced Mobile Broadband were modeled using a 3GPP system-level simulator. The researchers then compared the results to those of a fixed allocation of resources. As demonstrated by the results obtained, the proposed method met the Quality of Service (QoS) standards despite the varied nature of the data traffic encountered throughout all three test cases.
The research team behind [22] looked at the use of several 5G gNobeB base stations to serve multiple network slices, with the goal of discovering the optimal resource sharing algorithm for RAN slicing. To maximize efficiency, the system allotted radio bandwidth to network slices from each gNodeB base station. In addition, [23] proposed a dynamic resource allocation mechanism for RAN slicing, which was the subject of research into slice isolation. If you do not want one slice’s data traffic to affect the other slices, slice isolation is a must. The results of the study demonstrated that optimal slice isolation leads to greater resource utilization and a larger number of consumers being serviced.
Admittance control in C-RAN slicing is a topic that has been investigated in a number of recent papers. C-RAN has limited resources and hence cannot serve all users at once. In order to ensure that each slice meets its minimum QoS criteria, an admission process must be used to accept just the necessary users. To reduce the BP of eMBB and URLLC slices in the 5G C-RAN, the authors of [24] propose an admission control strategy. In the event of a C-RAN resource shortage, BP indicates the proportion of users who will be affected. Traditionally, efforts to admission control have placed greater emphasis on lowering the BP of the URLLC slice than the BP of the eMBB slice. According to the findings of that investigation, the proposed method decreases BP in eMBB while keeping BP in URLLC at a lower level [24].
In addition, [25] laid out a plan for how to develop an effective admission control mechanism for the 5G C-RAN, which boosts revenue for network operators. The authors employed mixed-integer nonlinear programming and eMBB and URLLC use case simulations to prioritize accepting customers who would bring in the most money for network owners. It was demonstrated that using the proposed framework boosted operator profit and reduced power usage. However, in improving resource usage, the techniques reported in [24,25] only considered admission control on two slices of the RAN slicing.
Last but not least, in [26], the authors explore the burgeoning demand for the few RAN resources and suggest a system for admission control and resource allocation for network slicing in the RAN. This system determines which users are eligible based on a minimal Quality of Service (QoS) that can be met in each slice, and then provides those users with the necessary resources. Both the number of allowed users and the efficiency with which resources were used increased throughout the course of the experiments. Increasing resource usage while guaranteeing the minimum QoS requirements for the usual slices in the 5G C-RAN has not been the focus of any previous research project to the best of our knowledge.
C-RAN-based 5G cellular networks have limited number of available resources to serve the growing number of users with different QoS requirements. The concept of network slicing was introduced in C-RAN to support various 5G services, such as eMBB, URLLC, and mMTC [18,19]. Although there is a massive amount of data traffic in C-RAN, the research on C-RAN slicing is still limited. Efficient resource allocation algorithms for the network slices in C-RAN are essential to increase resource utilization and improve the QoS requirements for users. While the 3GPP used static resource allocation in C-RAN, the need for a scalable system that accommodates changes in the network environment led to a focus on dynamic resource allocation [20]. Unlike previous studies in the literature, our proposed system will combine dynamic resource allocation with admission control and slice isolation to provide better QoS requirements and maximize resource utilization. Our research approach can enhance the methods for developing resource allocation in 5G C-RAN slicing. In addition, the developed system and results can be widely used by researchers attempting to solve comparable resource allocation challenges in communication systems.
This research study will focus on resource allocation for network slices in the 5G C-RAN network. Previously, static resource allocation was used to address the allocation problem in C-RAN [27,28]. However, more recently, dynamic resource allocation has also been used. The primary goal of this paper is to develop a system that uses dynamic resource allocation to satisfy the various requirements of network slices. Moreover, it considers the admission control and isolation between the network slices to increase resource utilization. Toward these ends, the proposed study has the following objectives:
  • Investigate the current allocation techniques in 5G C-RAN, such as static and dynamic resource allocation algorithms.
  • Design a system for resource allocation at the slice level and then implement a system that has combined functions, such as admission control, resource allocation, and slice isolation. Initially, the system will implement admission control to admit the users to existing slices. Then, the system will dynamically allocate the RBs to the different slices, such as eMBB, URLLC, and mMTC, in the C-RAN based on the priority and the QoS of the slices. The system will also implement isolation between the network slices to protect the minimum QoS requirements for the slices while increasing system utilization.
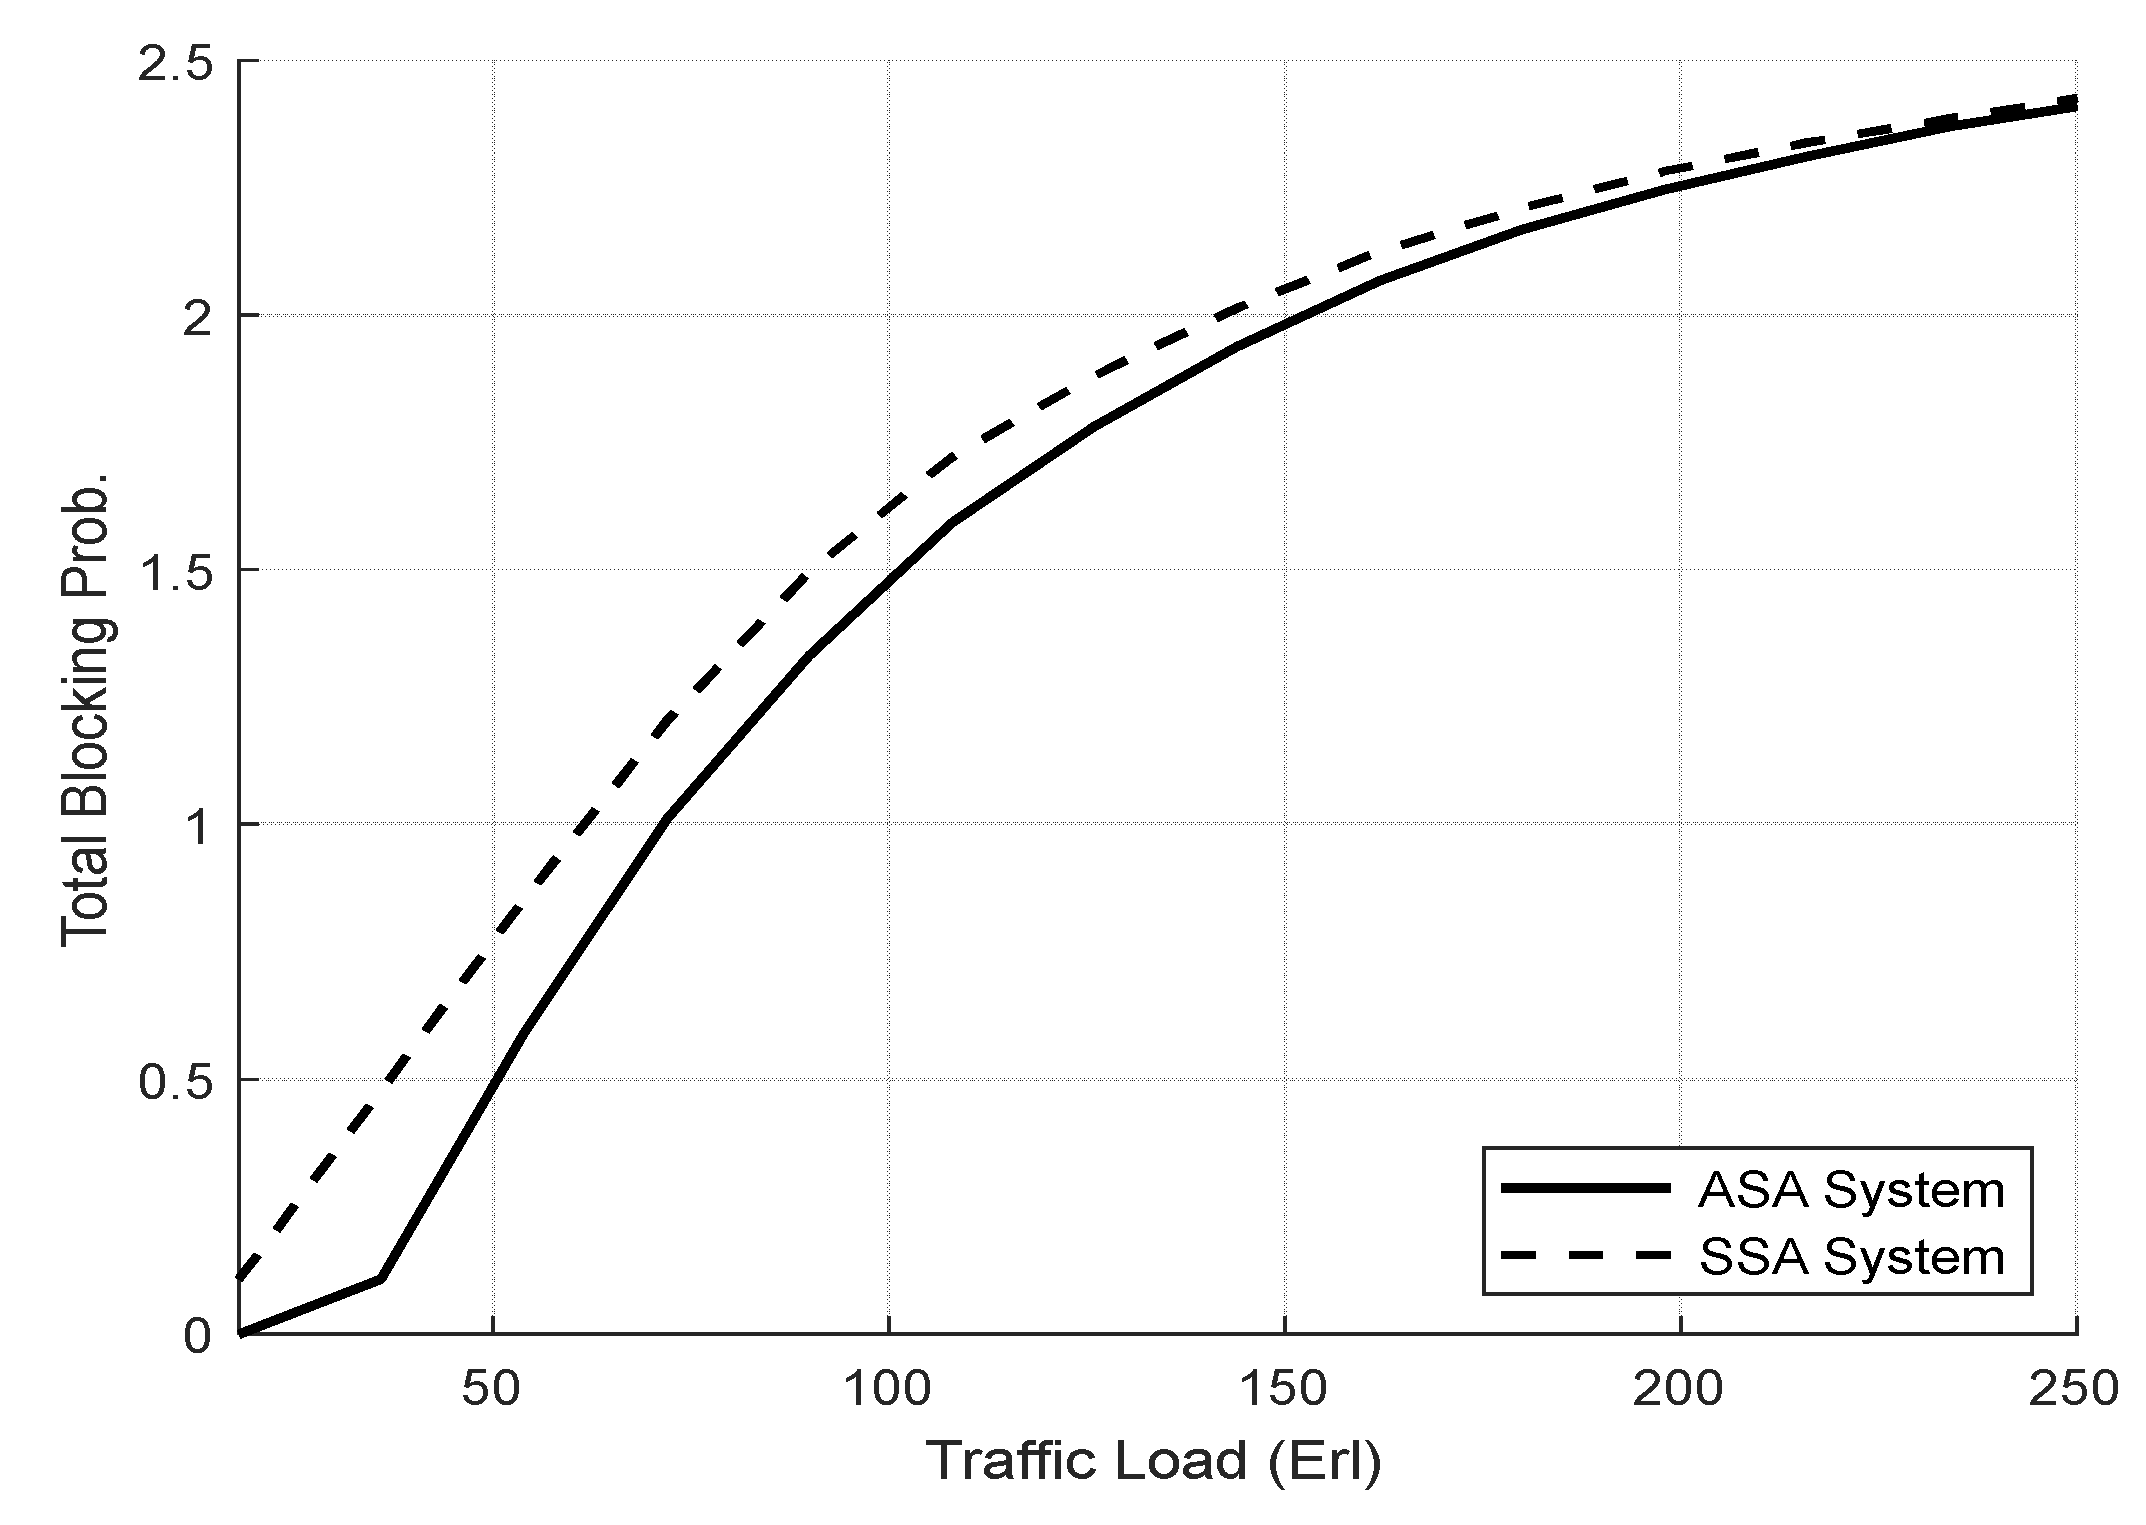
  • Implement a performance evaluation and develop a simulation model to evaluate the performance of the proposed system against the static slice allocation (SSA) system. We will compare the result to the SSA system by considering some performance measures such as resource utilization, average waiting time, and the total blocking probability (TBP).

3. System Model and Assumptions

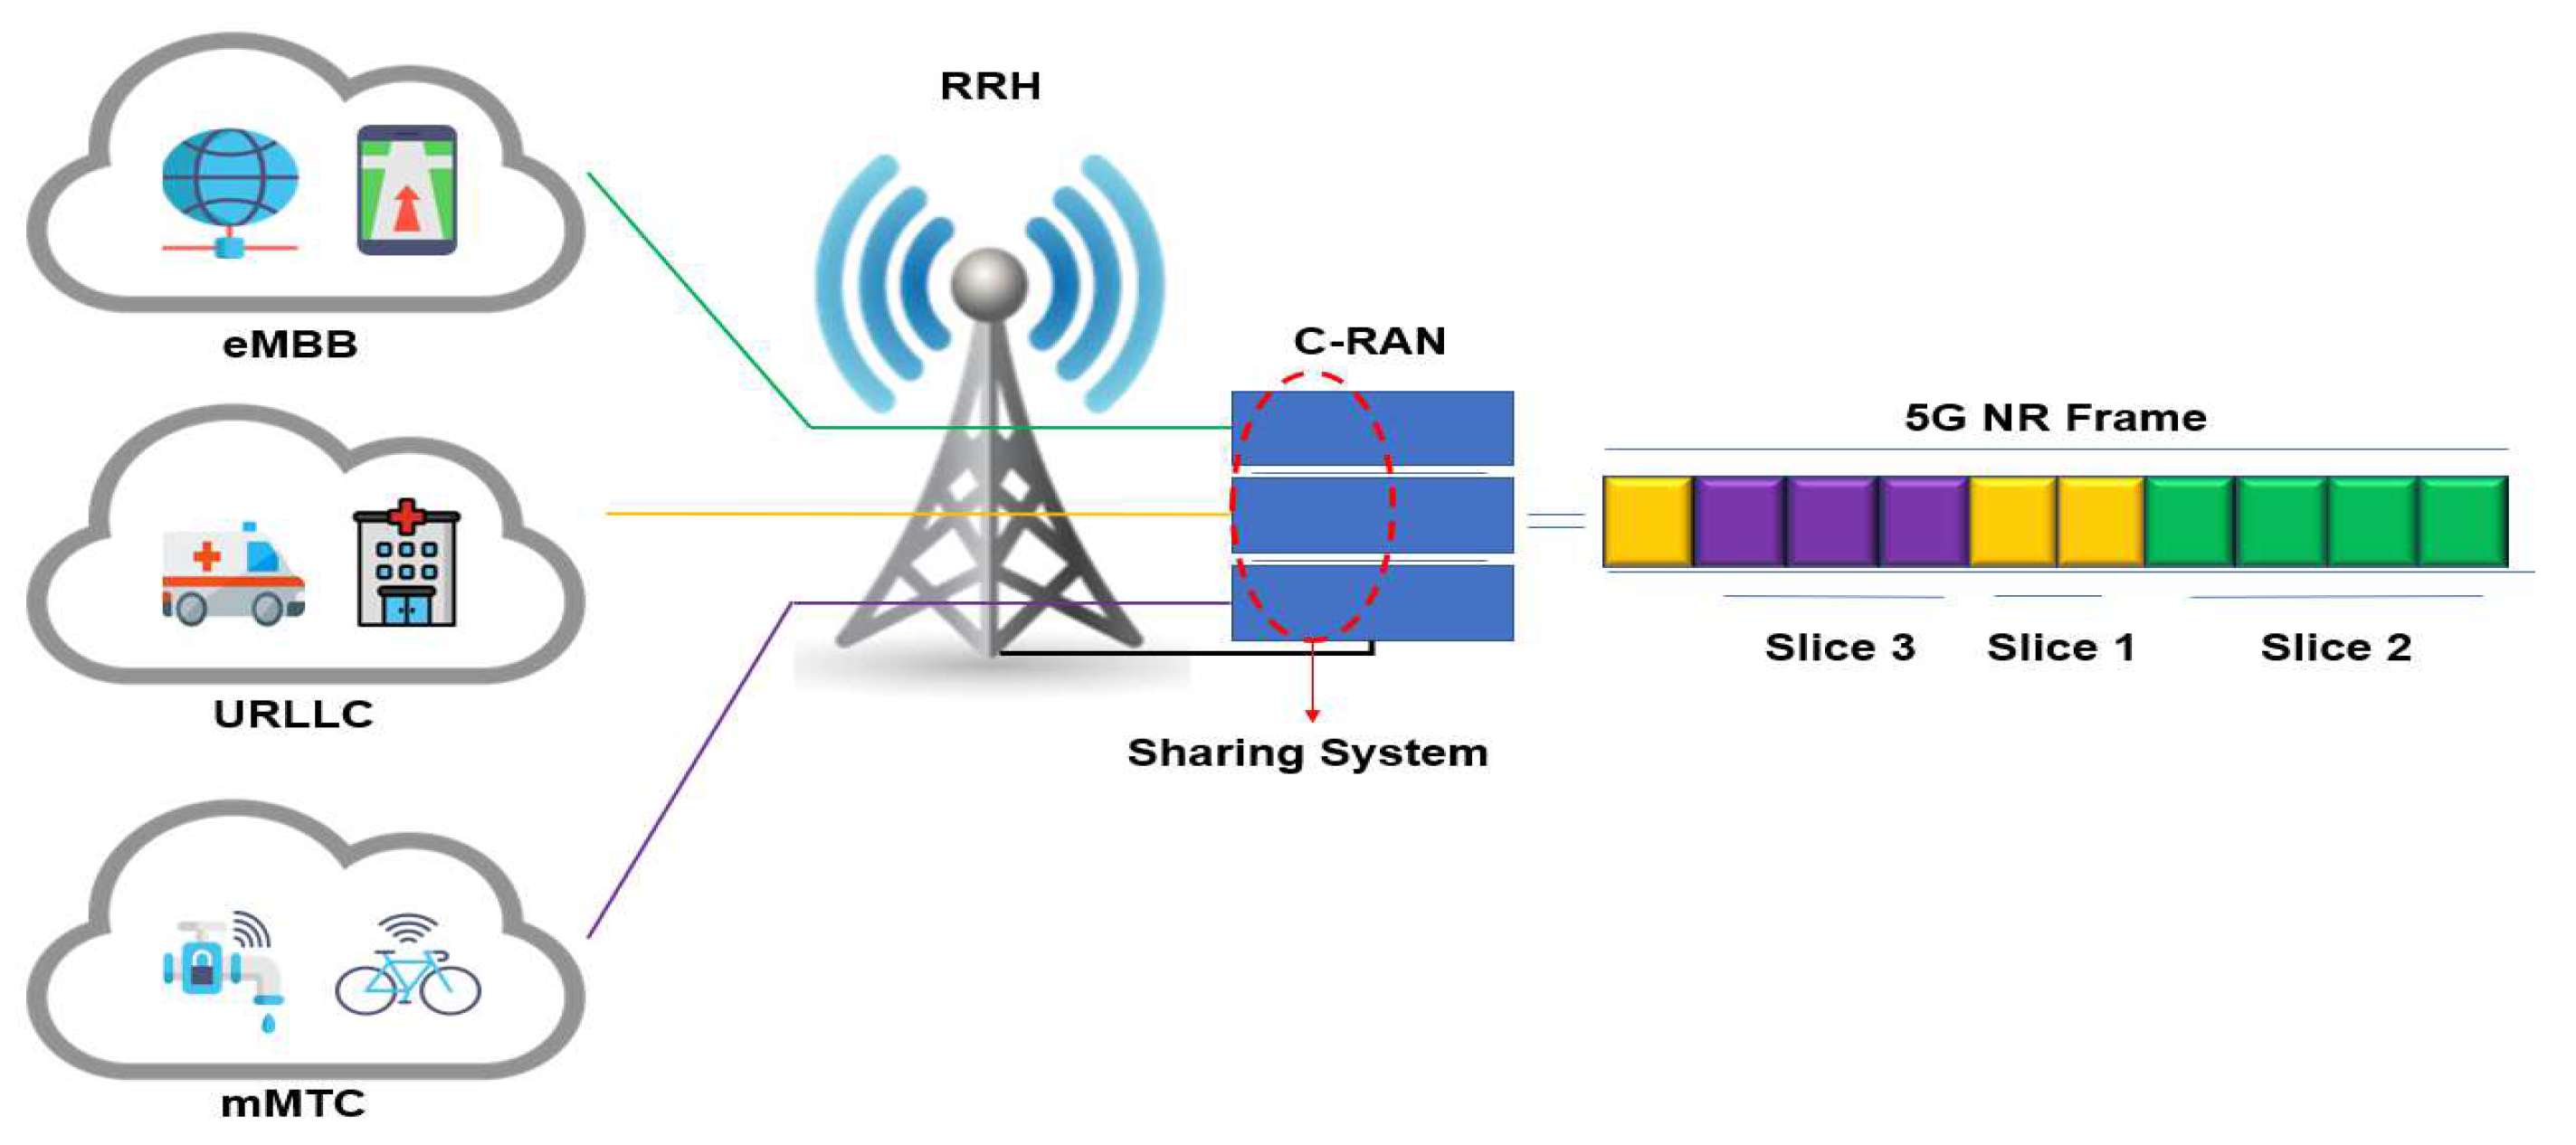
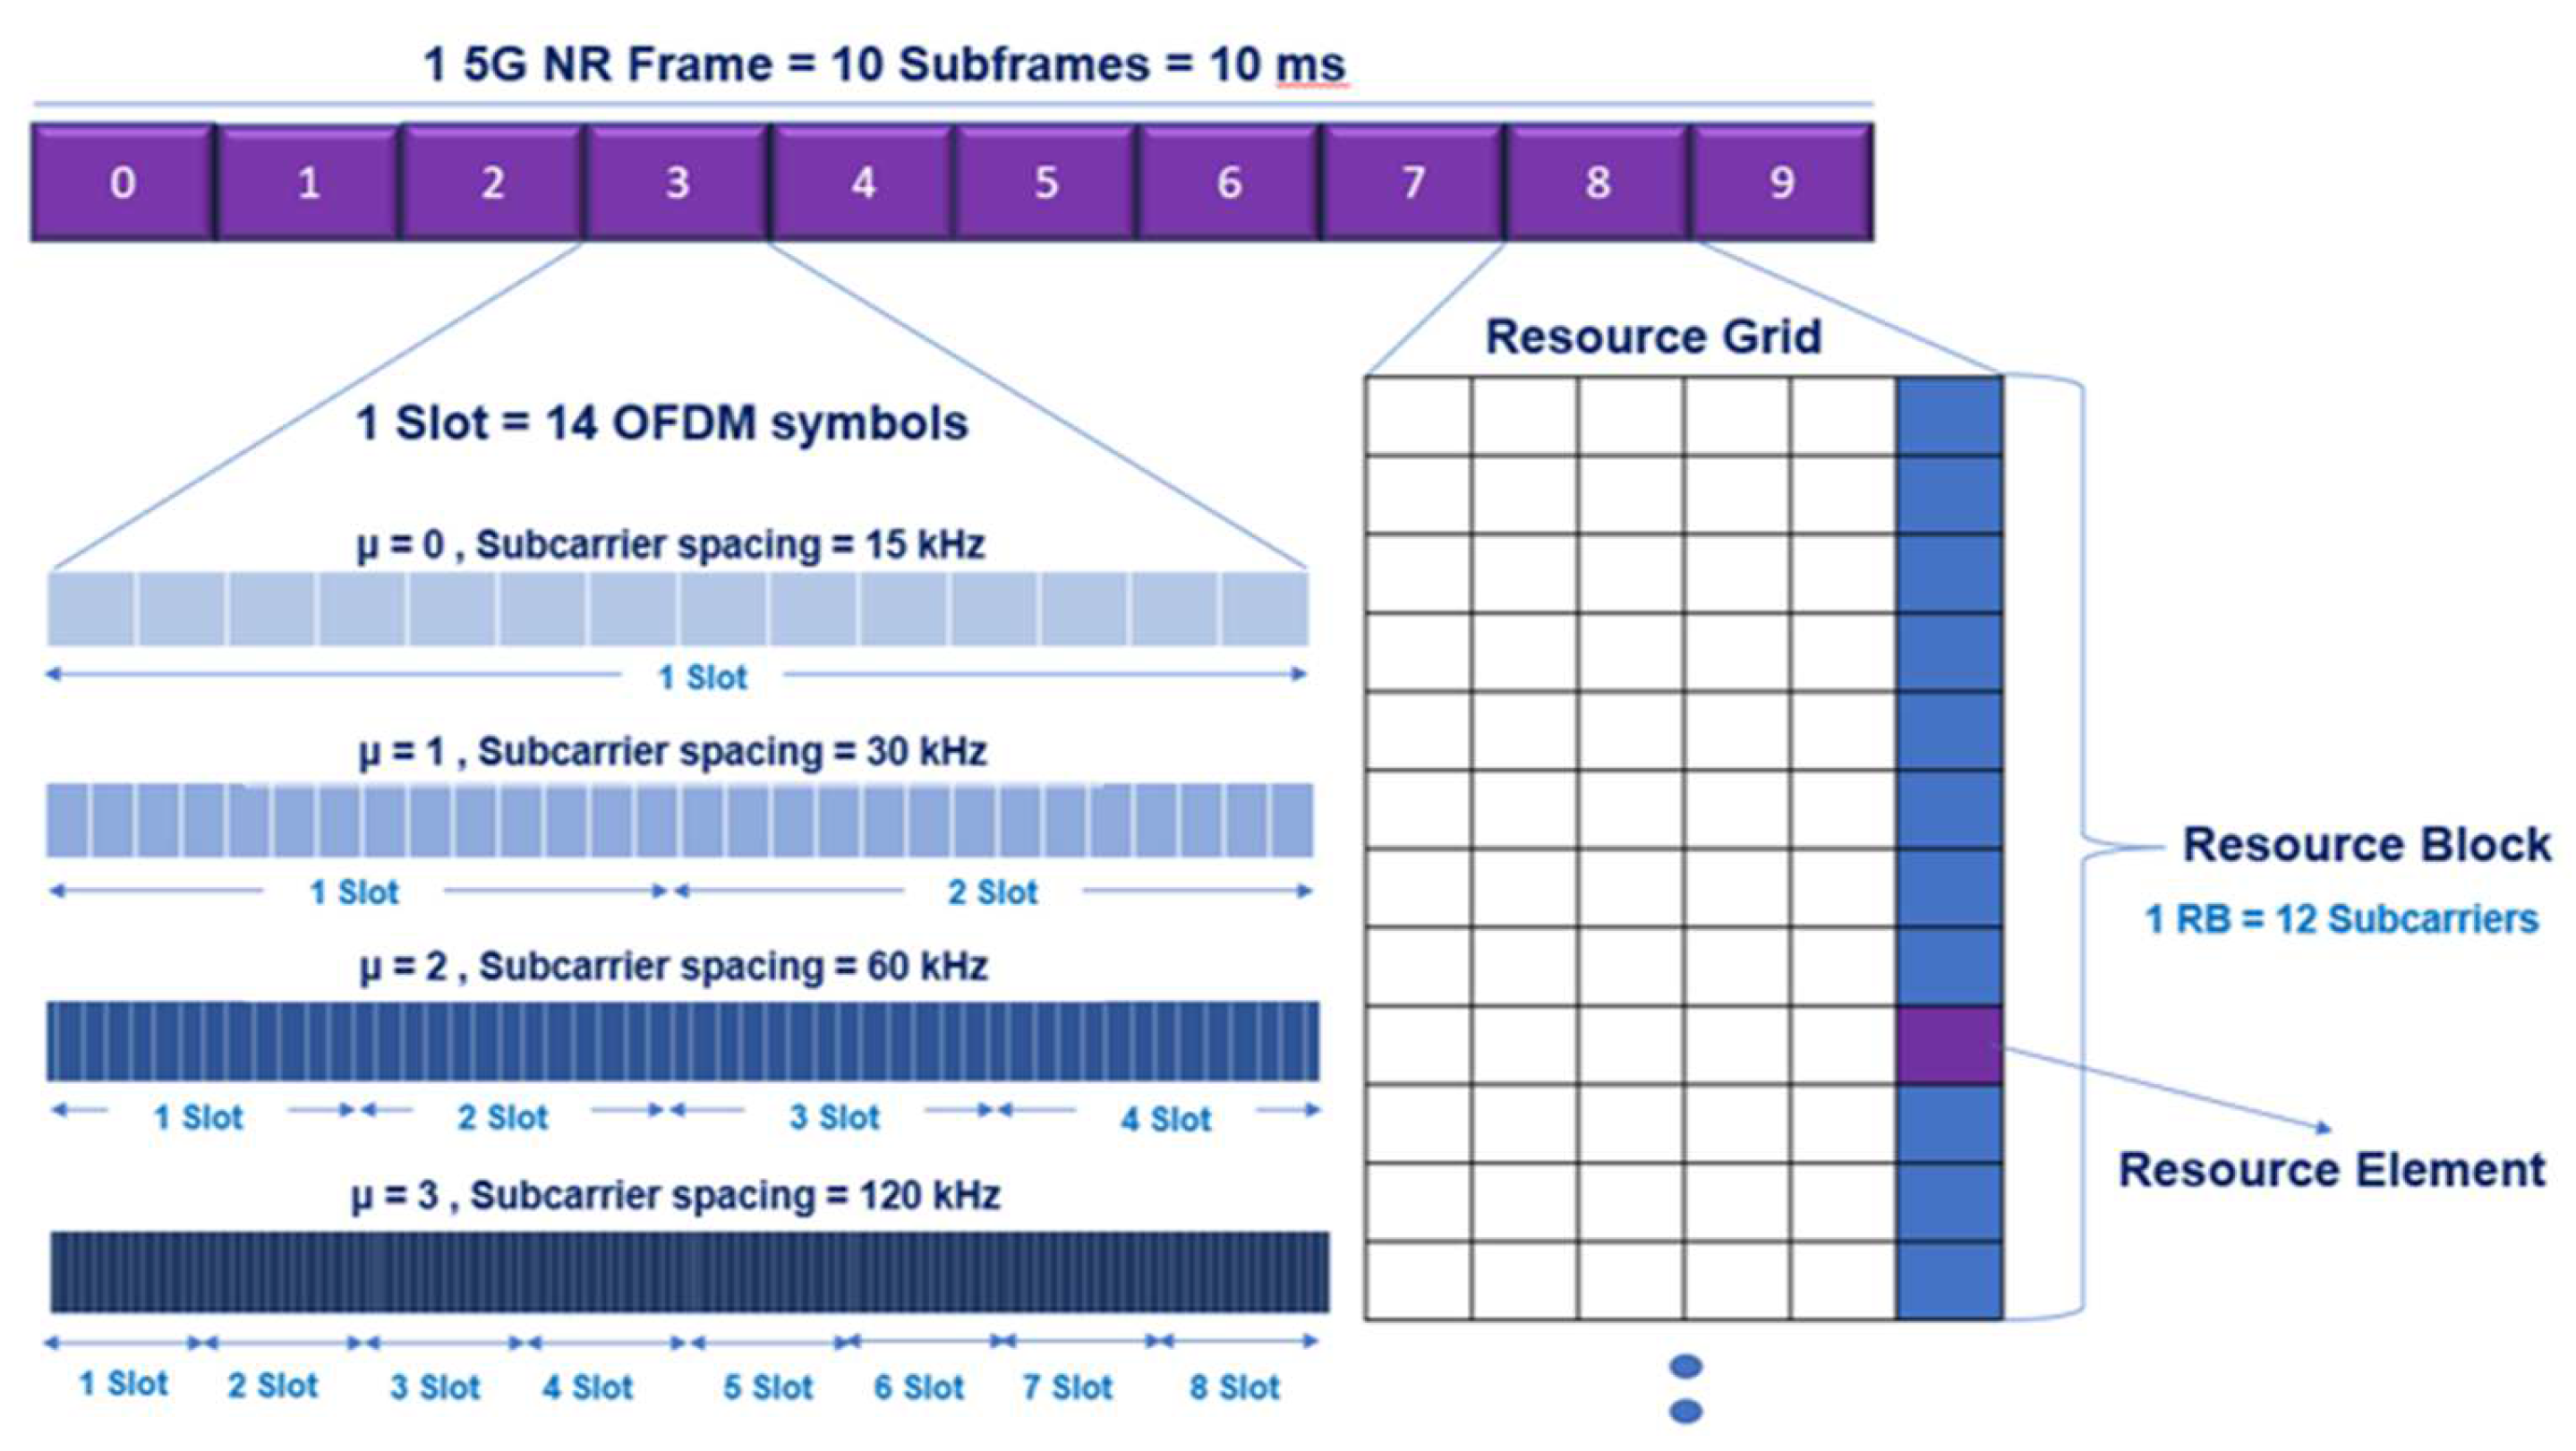
3.1. 5G C-RAN Architecture Model and Resource Allocation

This study considers radio resource allocation for network slices in the 5G C-RAN system model. Figure 1 illustrates the components of the 5G C-RAN architecture. We consider an enabled SDN/NFV 5G C-RAN where the NFV deploys a virtual BBU (vBBU) pool, shared by the three slices, in which each slice can be assigned several vBBUs based on its QoS requirements [29,30]. The virtual centralized BBU pool can then allocate shared resources based on the dynamic traffic flows associated with each slice. We assumed a centralized C-RAN architecture with a single RRU serving three different 5G slices (uRLLC, eMBB, and mMTC) [5].
Resource allocation is implemented using new 5G radio frames that use orthogonal frequency-division multiplexing (OFDM) on both the uplink and downlink to achieve high-bandwidth channels. According to 3GPP standards, the 5G NR uses two frequency ranges: frequency range 1 (FR1) and frequency range 2 (FR2). FR1, also known as sub-6 GHz, supports the lower- and middle-frequency bands, ranging from 450 MHz to 7.125 × 10³ MHz. It is responsible for transporting typical cellular communications traffic. FR2, also known as millimeter waves, supports higher frequency bands ranging from 24.25 GHz to 52.6 GHz and offers extremely high data rates over a short range [31].
The 5G NR uses flexible numerology, described by the parameter μ (as defined in 3GPP Release 15), to support a wide range of services with different QoS requirements [32]. Figure 2 shows the frame structure of the 5G NR. We considered a 5G NR radio frame with a 10-ms duration consisting of 10 each one 1-ms subframes. Each subframe is comprised of 2 μ slots, each with a slot length of 1 / 2 μ ms and 14 OFDM symbols [31,33].
Table 2 shows the different numerologies of 5G NR. The number of slots in a subframe increases as the value of μ increases, leading to a higher total number of symbols that can be sent in each amount of time. The OFDM subcarrier spacing scales to 2 μ × 15 kHz with different values of μ = 1, 2, 3, 4 to accommodate a wide range of services with different QoS requirements. The subcarrier spacing in the sub-6 GHz band is 15 kHz, 30 kHz, and 60 kHz, whereas millimeter-wave spacing is 60 kHz and 120 kHz, with 240 kHz reserved for signaling channels. As the subcarrier spacing increases, the slot size, and the symbol duration decrease, which is useful for services with lower latency requirements [31,33].
The resource grid is a frequency representation of radio transmission resources that maps to a single subframe in the time domain and a whole carrier bandwidth in the frequency domain. It has many transmission resources, known as resource blocks (RBs). Each RB consists of 12 subcarriers with a frequency range of 180 kHz. The RB consists of resource elements (REs), which are the smallest units of the resource grid, and each RE is defined in the frequency domain by one subcarrier [31,34].
Resource allocation to a slice involves assigning an integer number of resource blocks with a minimum allocation of one RB. The transmission rate assigned to each slice was determined according to the number of RBs allocated. We assumed a system with a full transmission bandwidth of 20 MHz and 100 RBs. Some of the total RBs were reserved for control and signaling overhead; these are denoted by R c o n . Therefore, the number of RBs available for data transmission is equal to the total number of RBs minus the reserved RBs of control transmission and signaling overhead, represented as R R c o n .
Table 3 describes the equations used to calculate the number of virtually reserved RBs for the slices. Table 4 describes the parameters and notation of the system. In our network model, the RBs were divided into three virtual partitions: R 1 , R 2 , and R 3 . The R 1 RBs were allocated to URLLC slices, R 2 RBs were allocated to eMBB slices, and R 3 RBs were allocated to mMTC slices, where R 1 + R 2 + R 3 = R . The resource allocation for each slice was dynamically predefined according to the slice priority ratio.
In our network model, users were categorized into three slices denoted by i slice type (where URLLC slice i = 1, eMBB slice i = 2, and mMTC slice i = 3). Therefore, we used three types of slice requests. We assumed that URLLC slice requests would have the highest priority, which is calculated using a priority ratio denoted as P U R L L C . The eMBB slice requests were assumed to be mid-priority, as determined by a priority ratio denoted as P e M B B . The mMTC slice requests were assumed to have the lowest priority, which was calculated using a priority ratio denoted as P m M T C Where 0 < P U R L L C < 1, 0 < P e M B B < 1, and 0 < P m M T C < 1, respectively. We assumed that all the slice requests would follow a Poisson arrival process with mean rates of λ i ( λ 1 , λ 2 , and λ 3 , respectively) [24]. The system arrival rate was calculated as follows:
λ = i = 1 i = 3 λ i
There were three queues for the aggregated slice requests where each slice request i has its own slice queue ( Q i ). The queuing time limit of each slice request was denoted as M T D i , which was dependent on the slice QoS requirements. Each slice’s request i had a negative exponential service time (connection time) with mean rates of 1 / μ i . The generated load of each slice requests type i, denoted as ρi, is given by:
ρ i = μ i 1 λ i
The total traffic intensity for the system, denoted by ρ, is given by:
ρ = i = 1 i = 3 μ i 1 λ i
An important feature in our network model is the call admission control (CAC), which decides whether to accept or reject a new call request based on the number of current RBs. The CAC denies a call request if the available RBs are insufficient for the proposed request. It controls the number of users in each slice of the 5G C-RAN to guarantee the QoS requirements of the slices [11].
The CAC first determines the total number of currently active RBs (the total current cell load), denoted as R c , and the required number of RBs (new load increment) from request i denoted as Δ R i . It then determines whether to accept or reject the new call request i based on the values of R c and Δ R i . To calculate the new load increment ( Δ R i ), it is necessary to estimate the amount of bandwidth ( B i ) required by a new call request i. The data rate requirement ( D R i ) for each call request i can be defined in terms of its required RBs. Moreover, the bandwidth ( B i ) required to provide the required data rates can be stated as:
B i = D R i log ( 1 + S N R )
Assuming there are three different call request types, the new load increment ( Δ R i ) from a request i in terms of the required RBs can be computed as follows:
Δ R i = S × B i B W R B
where BWRB is the bandwidth of one resource block, S is the number of subframes (S = 10 in the 5G NR standard), and ⌈x⌉ maps x to the least integer greater than or equal to x [35]. Each request i can have C i active connections, and each active user can occupy only one RB.
The variable R c denotes the total number of RBs that are currently utilized by all active users, which is the total current cell load. Therefore, R c can be expressed as follows:
R c = i = 1 i = 3 R c i × Δ R i
Therefore, the required RBs ( Δ R i ) for all active connections in our systems can be classified into three different loads (where i = 1 for URLLC, i = 2 for eMBB, and i = 3 for mMTC) and can be calculated as follows:
(1)
for URLLC connection requests:
Δ R 1 = B 1 B W R B
(2)
for eMBB connection requests:
Δ R 2 = B 2 B W R B
(3)
for mMTC connection requests:
Δ R 3 = B 3 B W R B

3.2. Proposed Slice Allocation System

This section introduces and explains the proposed adaptive slice allocation system intended for use inside the 5G C-RAN. The proposed system aims to increase resource utilization in the 5G CRAN’s BBU pool of resources. In addition, it seeks to guarantee the minimum QoS requirements for each 5G network slice while maintaining isolation. The proposed system dynamically allocates the resources of the BBU pool among the three 5G slices, each with different traffic sources. Moreover, it assigns a resource portion for each 5G slice based on its QoS requirement in terms of bandwidth and delay.
The system will initially implement a CAC to admit or reject each arriving slice request based on resource availability and slice priority. The slice priority varies dynamically to prevent requests from one slice from affecting other slices, thus ensuring slice isolation.
In Section 3.2.1, we introduce an SSA, which is an existing slice allocation system [14,15]. We adapt the SSA system to use as a reference to compare its performance with that of the proposed system. In Section 3.2.2 and Section 3.2.3, we present our proposed ASA and DA-ASA.

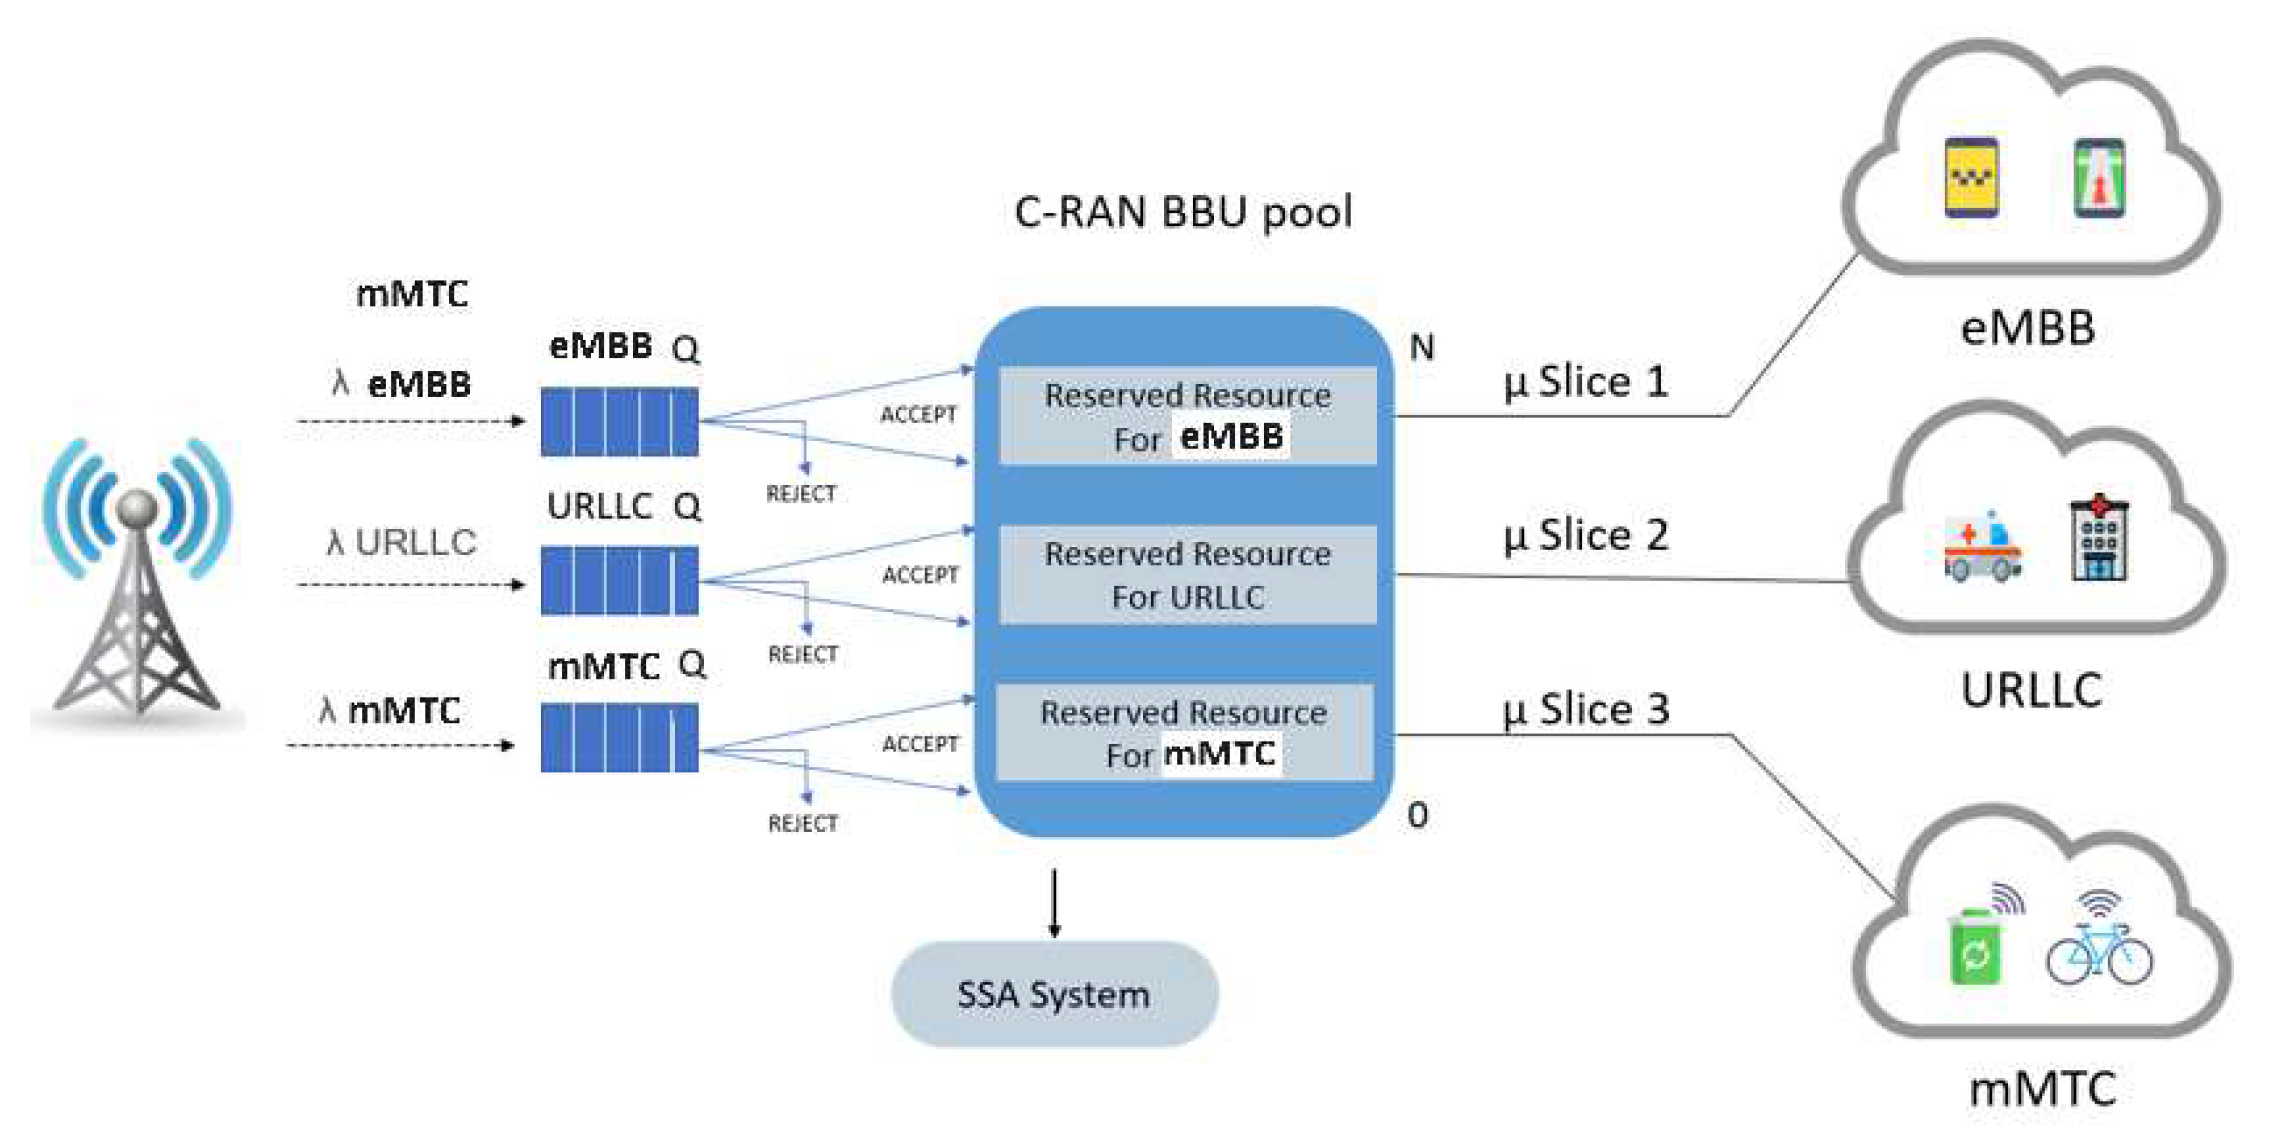
3.2.1. Static Slice Allocation System (SSA)

The SSA system is an adaptation of the schemes proposed in [14,15], but it differs in that it considers the combined admission control and resource allocation for the three slices in the 5G C-RAN. In addition, we evaluate the SSA system using different performance metrics from the schemes in [14,15]. We use the SSA system as a reference to compare it with the proposed ASA system.
The SSA system divides the total BBUs pool resources (in terms of RBs) into three parts: the first part for URLLC slice traffic, the second for eMBB slice traffic, and the third for mMTC slice traffic. Figure 3 shows the SSA system model. From a logical point of view, the system behaves like three separate systems: each slice request has its own queue and reserved resources.
The total resources reserved for uRLLC:
R R S V D 1 = P u R L L C × R
The total resources reserved for eMBB:
R R S V D 2 = P e M B B × R
The total resources reserved for mMTC:
R R S V D 3 = P m M T C × R
The total number of RBs currently used by all connected requests of slice i is limited by R R S V D i , such that:
i = 1 i = 3 R R S V D i R
The arrival slice’s request i is admitted if the sum of the slice’s currently utilized RBs and the increment load of this arrived request are less than or equal to the total reserved resource of this slice. Therefore, the admission criterion for the new slice’s request i can be expressed as:
R c i + Δ R i R R S V D i
If the total RB partition of slice i requests is consumed, then the newly arriving slice’s request i will be buffered in its corresponding queue and serviced according to the First In, First Out (FIFO) policy. If the queue for slice i is full, the incoming slice’s request i will be rejected. Moreover, if a queued request exceeds the queuing time limit ( M T D i ) before receiving service, it will be dropped from its queue. Each resource partition R R S V D i is dedicated to serving requests for slice i and cannot be utilized for other slices, even if it is available. Therefore, the system can guarantee the QoS requirements of each network slice. However, the system resources are underutilized due to a lack of resource sharing between the slice partitions.

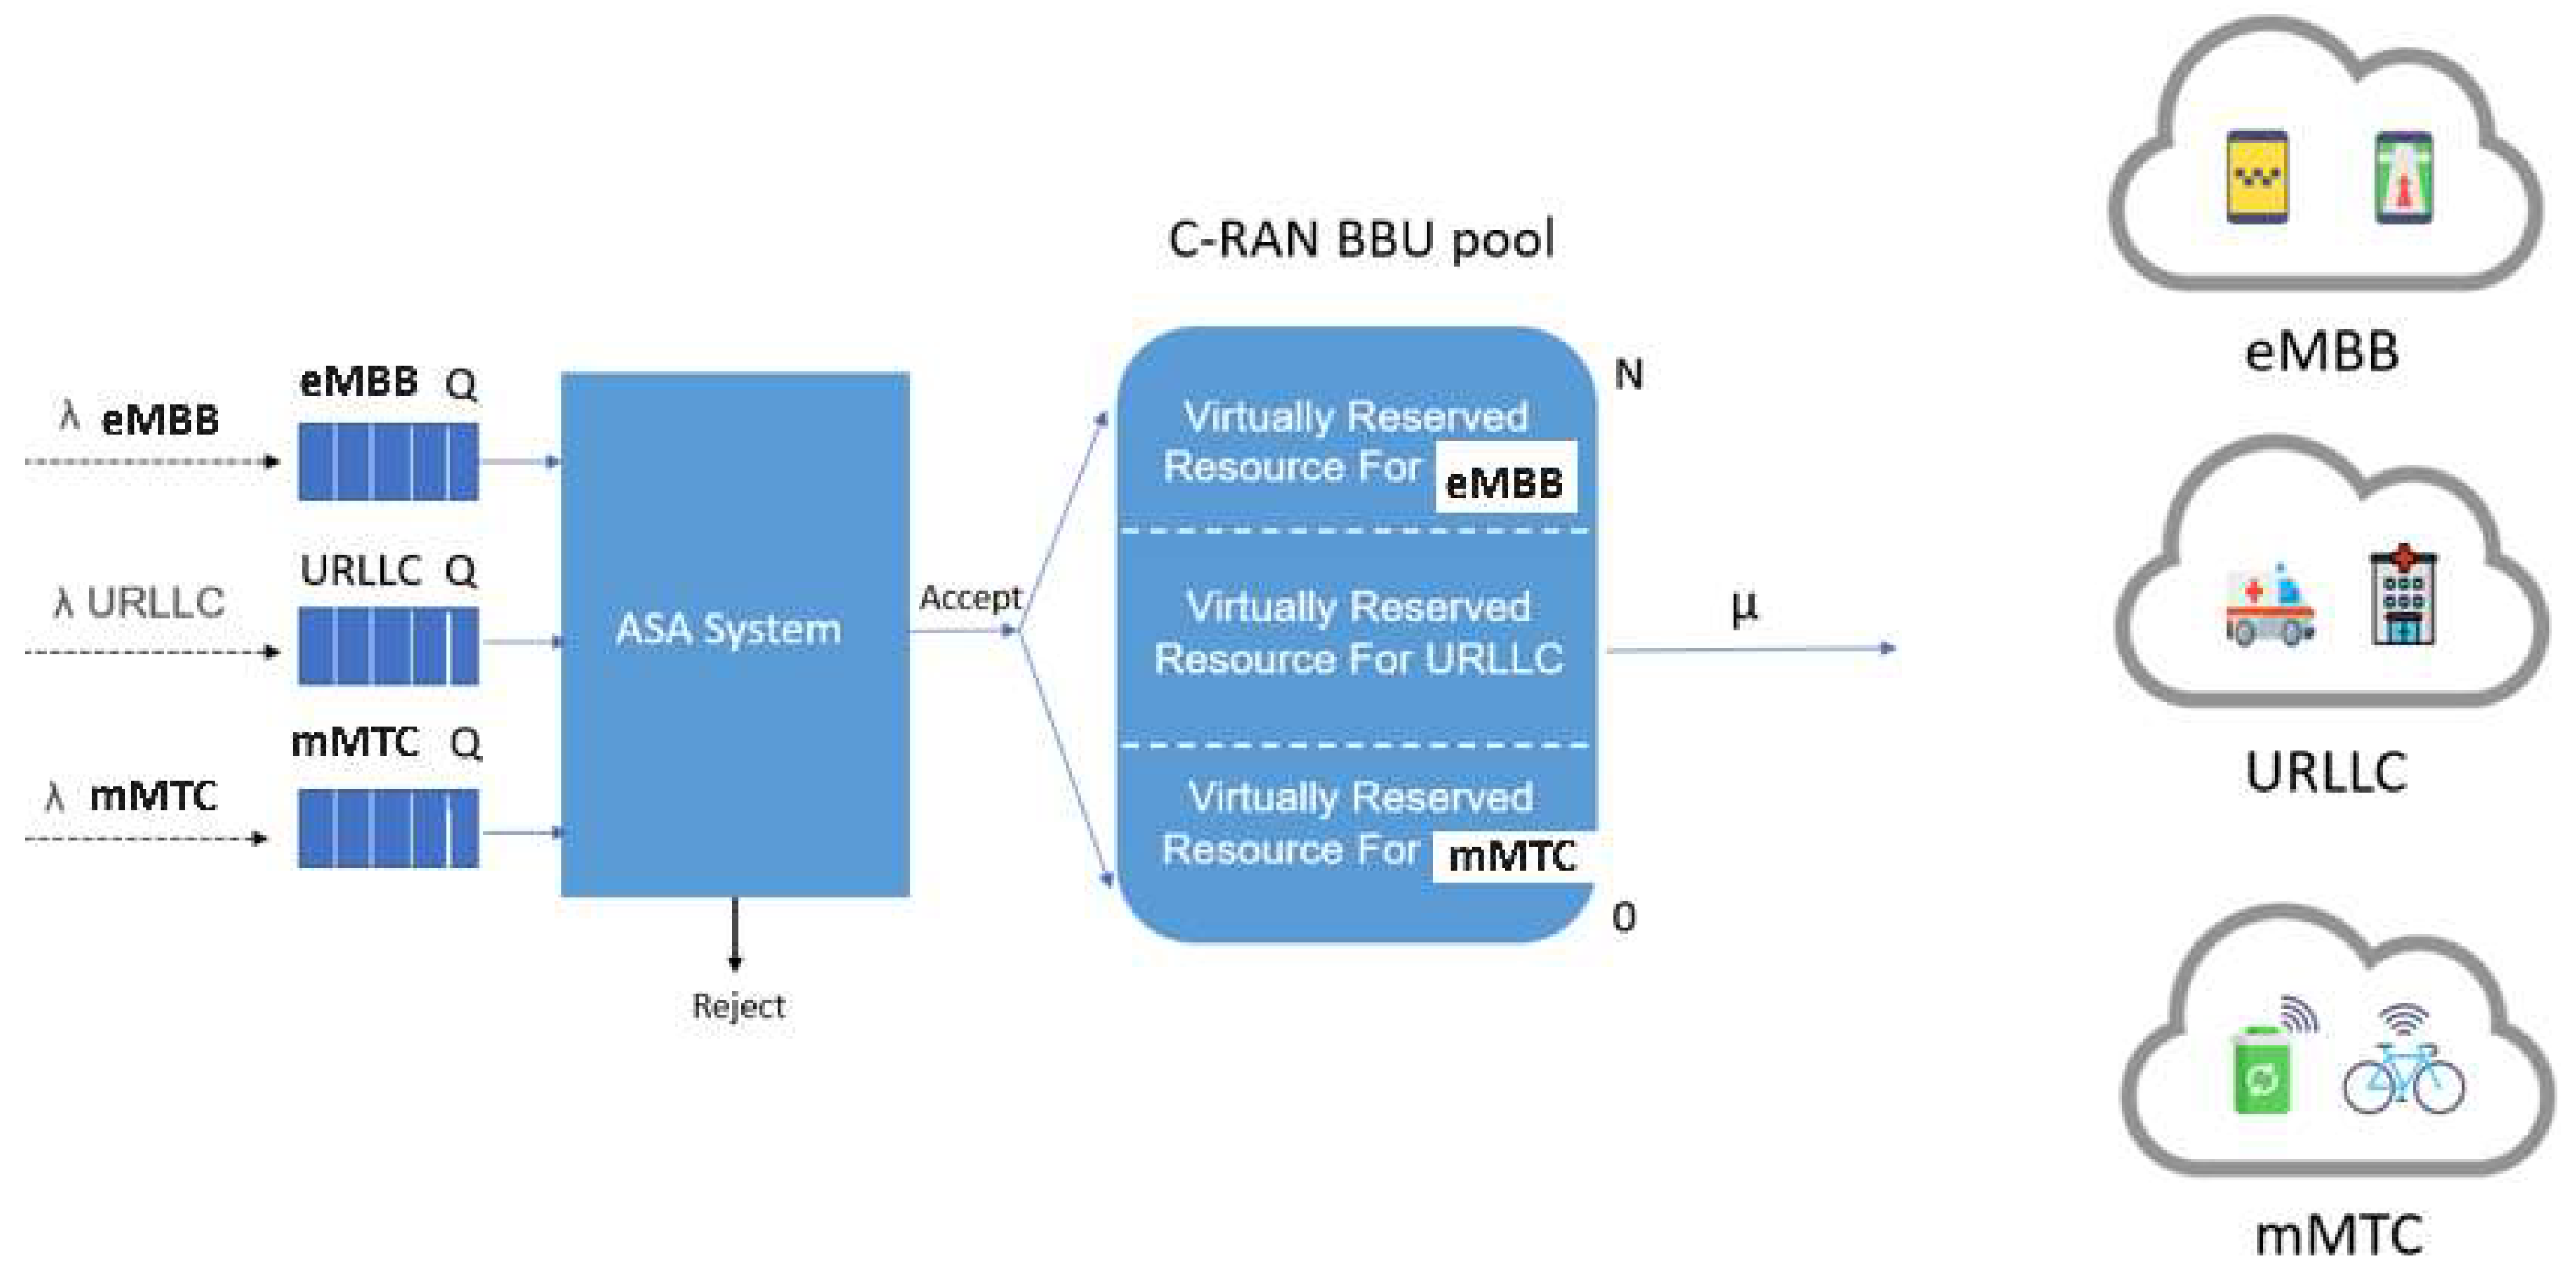
3.2.2. Proposed Adaptive Slice Allocation System (ASA)

The drawback of the above SSA system is that it guarantees the QoS requirements of each slice at the expense of efficient system utilization. Therefore, we propose an ASA system that considers the aforementioned drawback and provides an efficient resource allocation that satisfies the minimum QoS requirements of network slices while maintaining slice isolation and increasing system utilization. Figure 4 shows the system model for the ASA system.
In the ASA system, each slice request has its own queue, and all slice requests share the available RBs. In addition, each slice request has a predefined virtual resource partition specified as R v 1 RBs for URLLC slice, R v 2 for eMBB slice, and R v 3 RBs for mMTC slice, so that R v 1 + R v 2 + R v 3 = R . Each queued request of slice i is assigned an adaptive slicing priority (ASP) that is dynamically calculated based on the predefined virtual resource partition value, R v i , and the current total cell load, R c i . The predefined resource partition for each slice request R v i is used only to maintain the ASP for each slice request, which means that it is not used to statically partition the resources into three separate partitions.
For low-to-moderate traffic loads, all RBs are available for slices requests to increase system utilization. However, at high traffic loads, the ASP is used to differentiate between queued requests. The priority is modified adaptively so that if a slice’s request i currently occupies fewer RBs than its predefined virtual resource partition ( R v i ) it will be given a higher priority. Therefore, slice isolation is guaranteed such that slices with a lower priority are not affected by other slices with a higher priority [36].
The system procedure can be stated as follows:
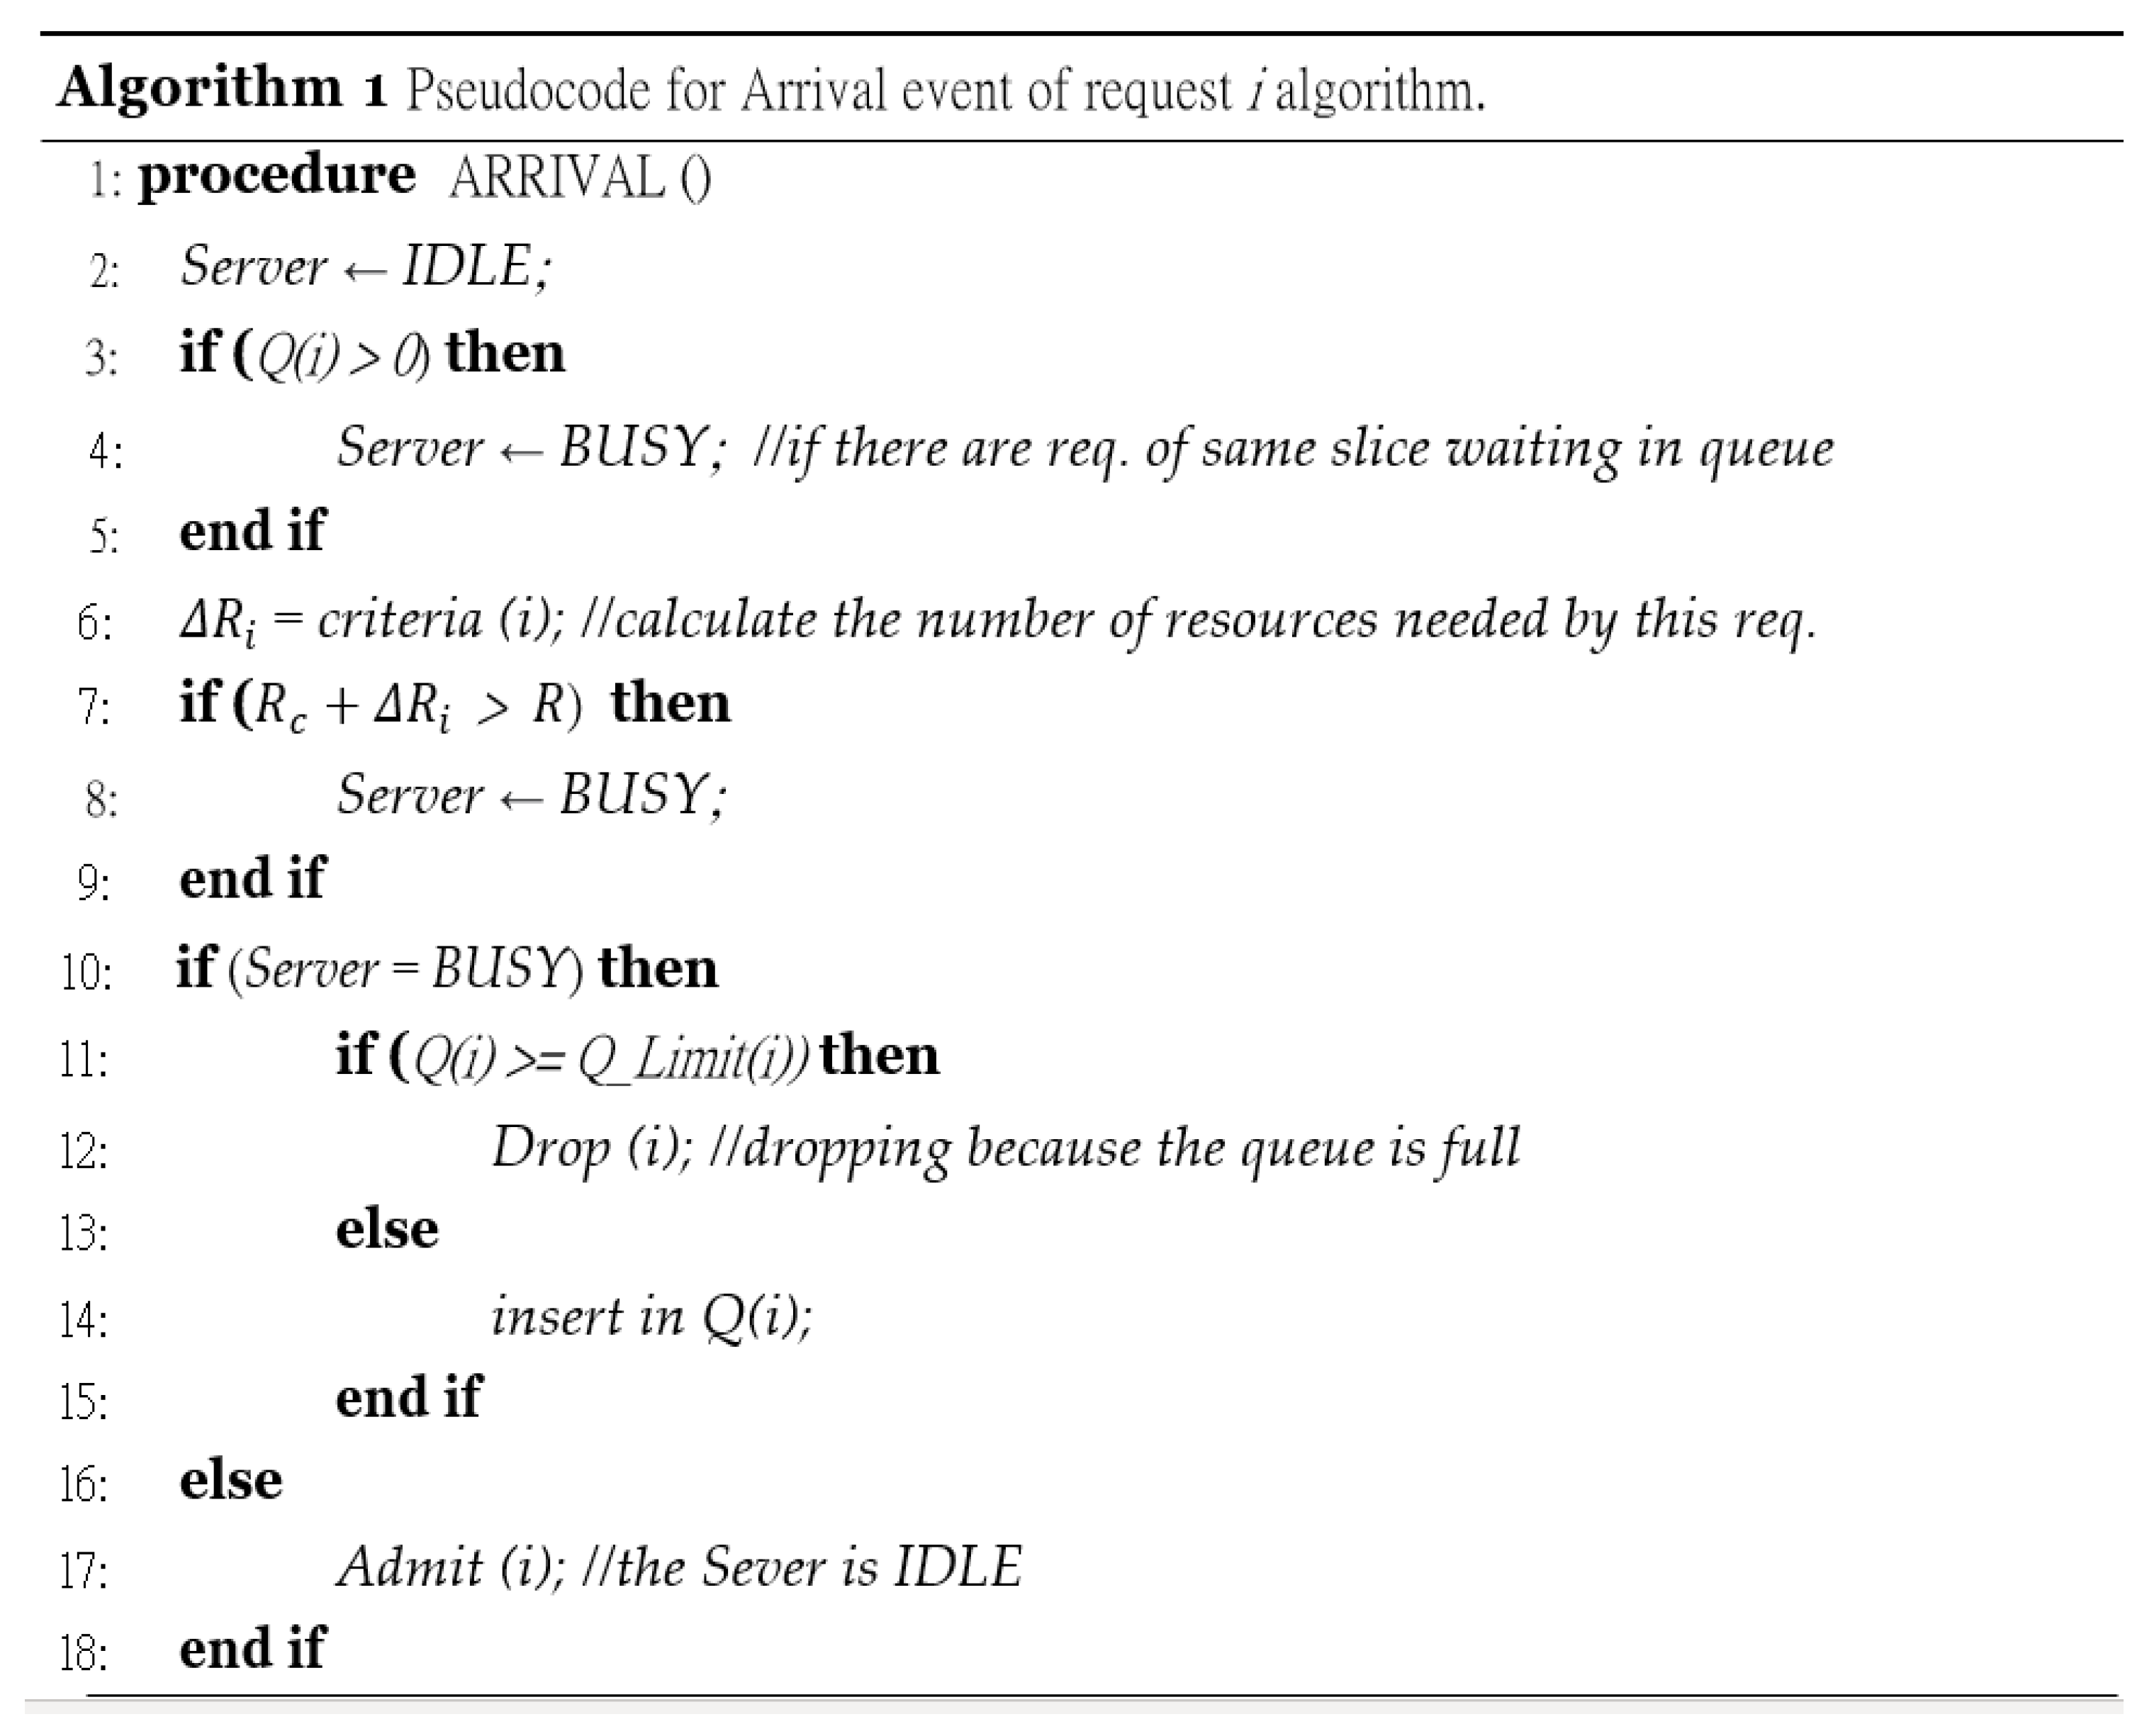
  • The arrived slice’s request i is accepted if the following criterion is satisfied:
    R c + Δ R i R
  • When all system RBs are utilized, an arriving slice’s request i is inserted into its corresponding queue or blocked if it is full.
  • If a slice’s request i exceeds its queuing time limit, it will be dropped from its queue.
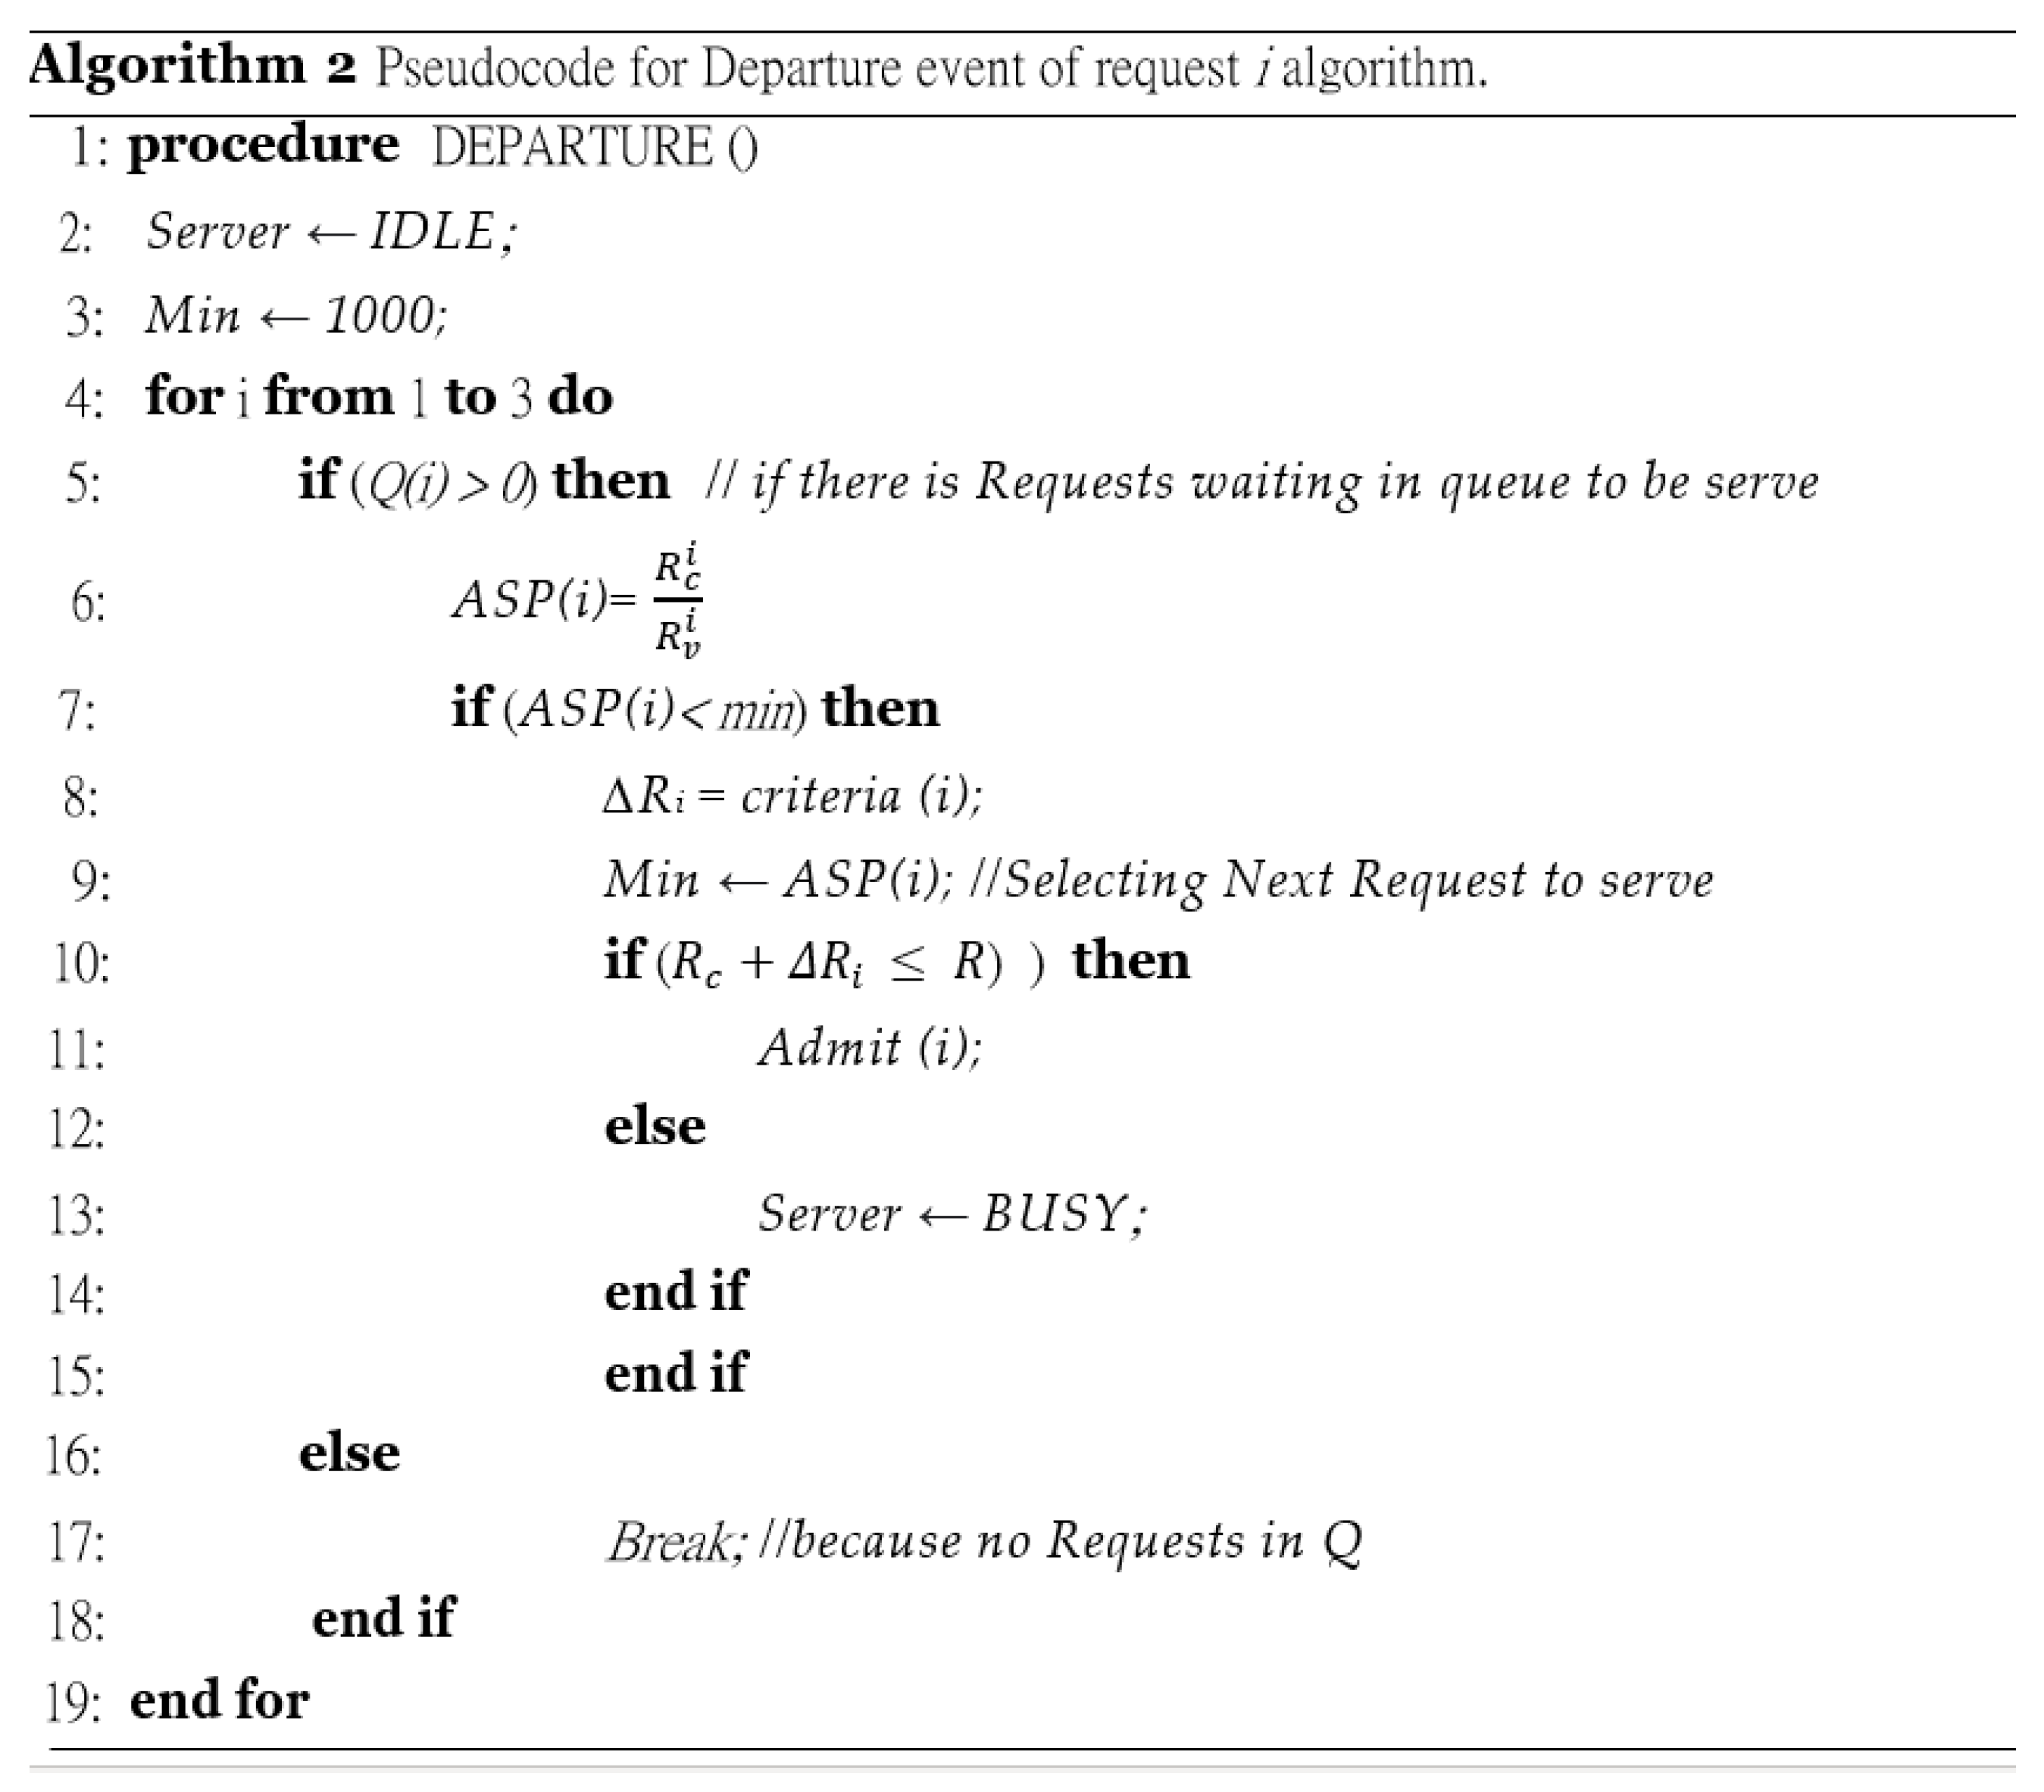
  • When a slice’s request i departs, its corresponding occupied RBs are released, and the ASP is computed for all queued slices requests that have non-empty queues. Then, the queue with the lowest ASP value, which indicates that it has the highest priority, is served first based on the FIFO policy.
The ASP value for a slice’s request i used in step 4 of the above procedure, is calculated using the following:
  • The total number of RBs that are currently utilized by all active users of the i t h slice, denoted as R c i .
  • The number of RBs that are virtually reserved for the ith slice, denoted as R v i Therefore, the ASP value for slice’s request i is given by
    A S P i = R c i R v i
The ASP of each request i depends on the value of its slice priority ratios. Table 5 shows the ASP of each slice’s request i in the ASA system.
The slice’s request i with the lowest ASP value will be given the highest priority in receiving the service. The value of the predefined virtual resource partition ( R v i ) for each slice has a significant impact on determining its priority level. Therefore, the URLLC slice has the highest R v i value, which raises its priority.
However, when the total current RBs occupied by the requests of slice i drops below the predefined virtual resource partition R v i , the ASP value of the slice’s request i is decreases, and it receives a higher priority. For example, suppose the R v i value of the URLLC slice is 50 RBs, whereas the current R c i value is 40 RBs. The R v i value of the eMBB slice 35 RBs, and the current R c i value is 5 RBs. The R v i value of the mMTC slice is 15 RBs, whereas the current R c i value is 10 RBs. Using Equation (16), the ASP value for the URLLC slice is 0.8, 0.4 for the eMBB slice, and 0.6 for the mMTC slice. As a result, when we receive requests from all slices, the eMBB slice request will have the highest priority and obtain the service first since it has the lowest ASP value.
When three different slice requests have the same ASP value, the request with the lowest priority index (i.e., URLLC) will be served first. For example, suppose the R v i value of the URLLC slice is 50 RBs, whereas the current R c i value is 25 RBs. The R v i value of the eMBB slice 35 RBs, and the current R c i value is 18 RBs. The R v i value of the mMTC slice is 15 RBs, whereas the current R c i value is 8 RBs. Using Equation (16), the ASP value for the URLLC slice is 0.5, 0.5 for the eMBB slice, and 0.5 for the mMTC slice. As a result, when the ASA system receives requests from all slices, the URLLC slice request will have the highest priority and obtain the service first since it has the lowest priority index.
Therefore, the unutilized RBs of one slice request can be utilized by another slice request, as needed. Furthermore, the ASP value achieves slice isolation by preventing slice requests from affecting each other. Table 6 summarizes the CAC procedures of the ASA system, Figure 5 illustrates the pseudocode for the arrival event of the request i algorithm, and Figure 6 illustrates the pseudocode for the departure event of the request i algorithm.

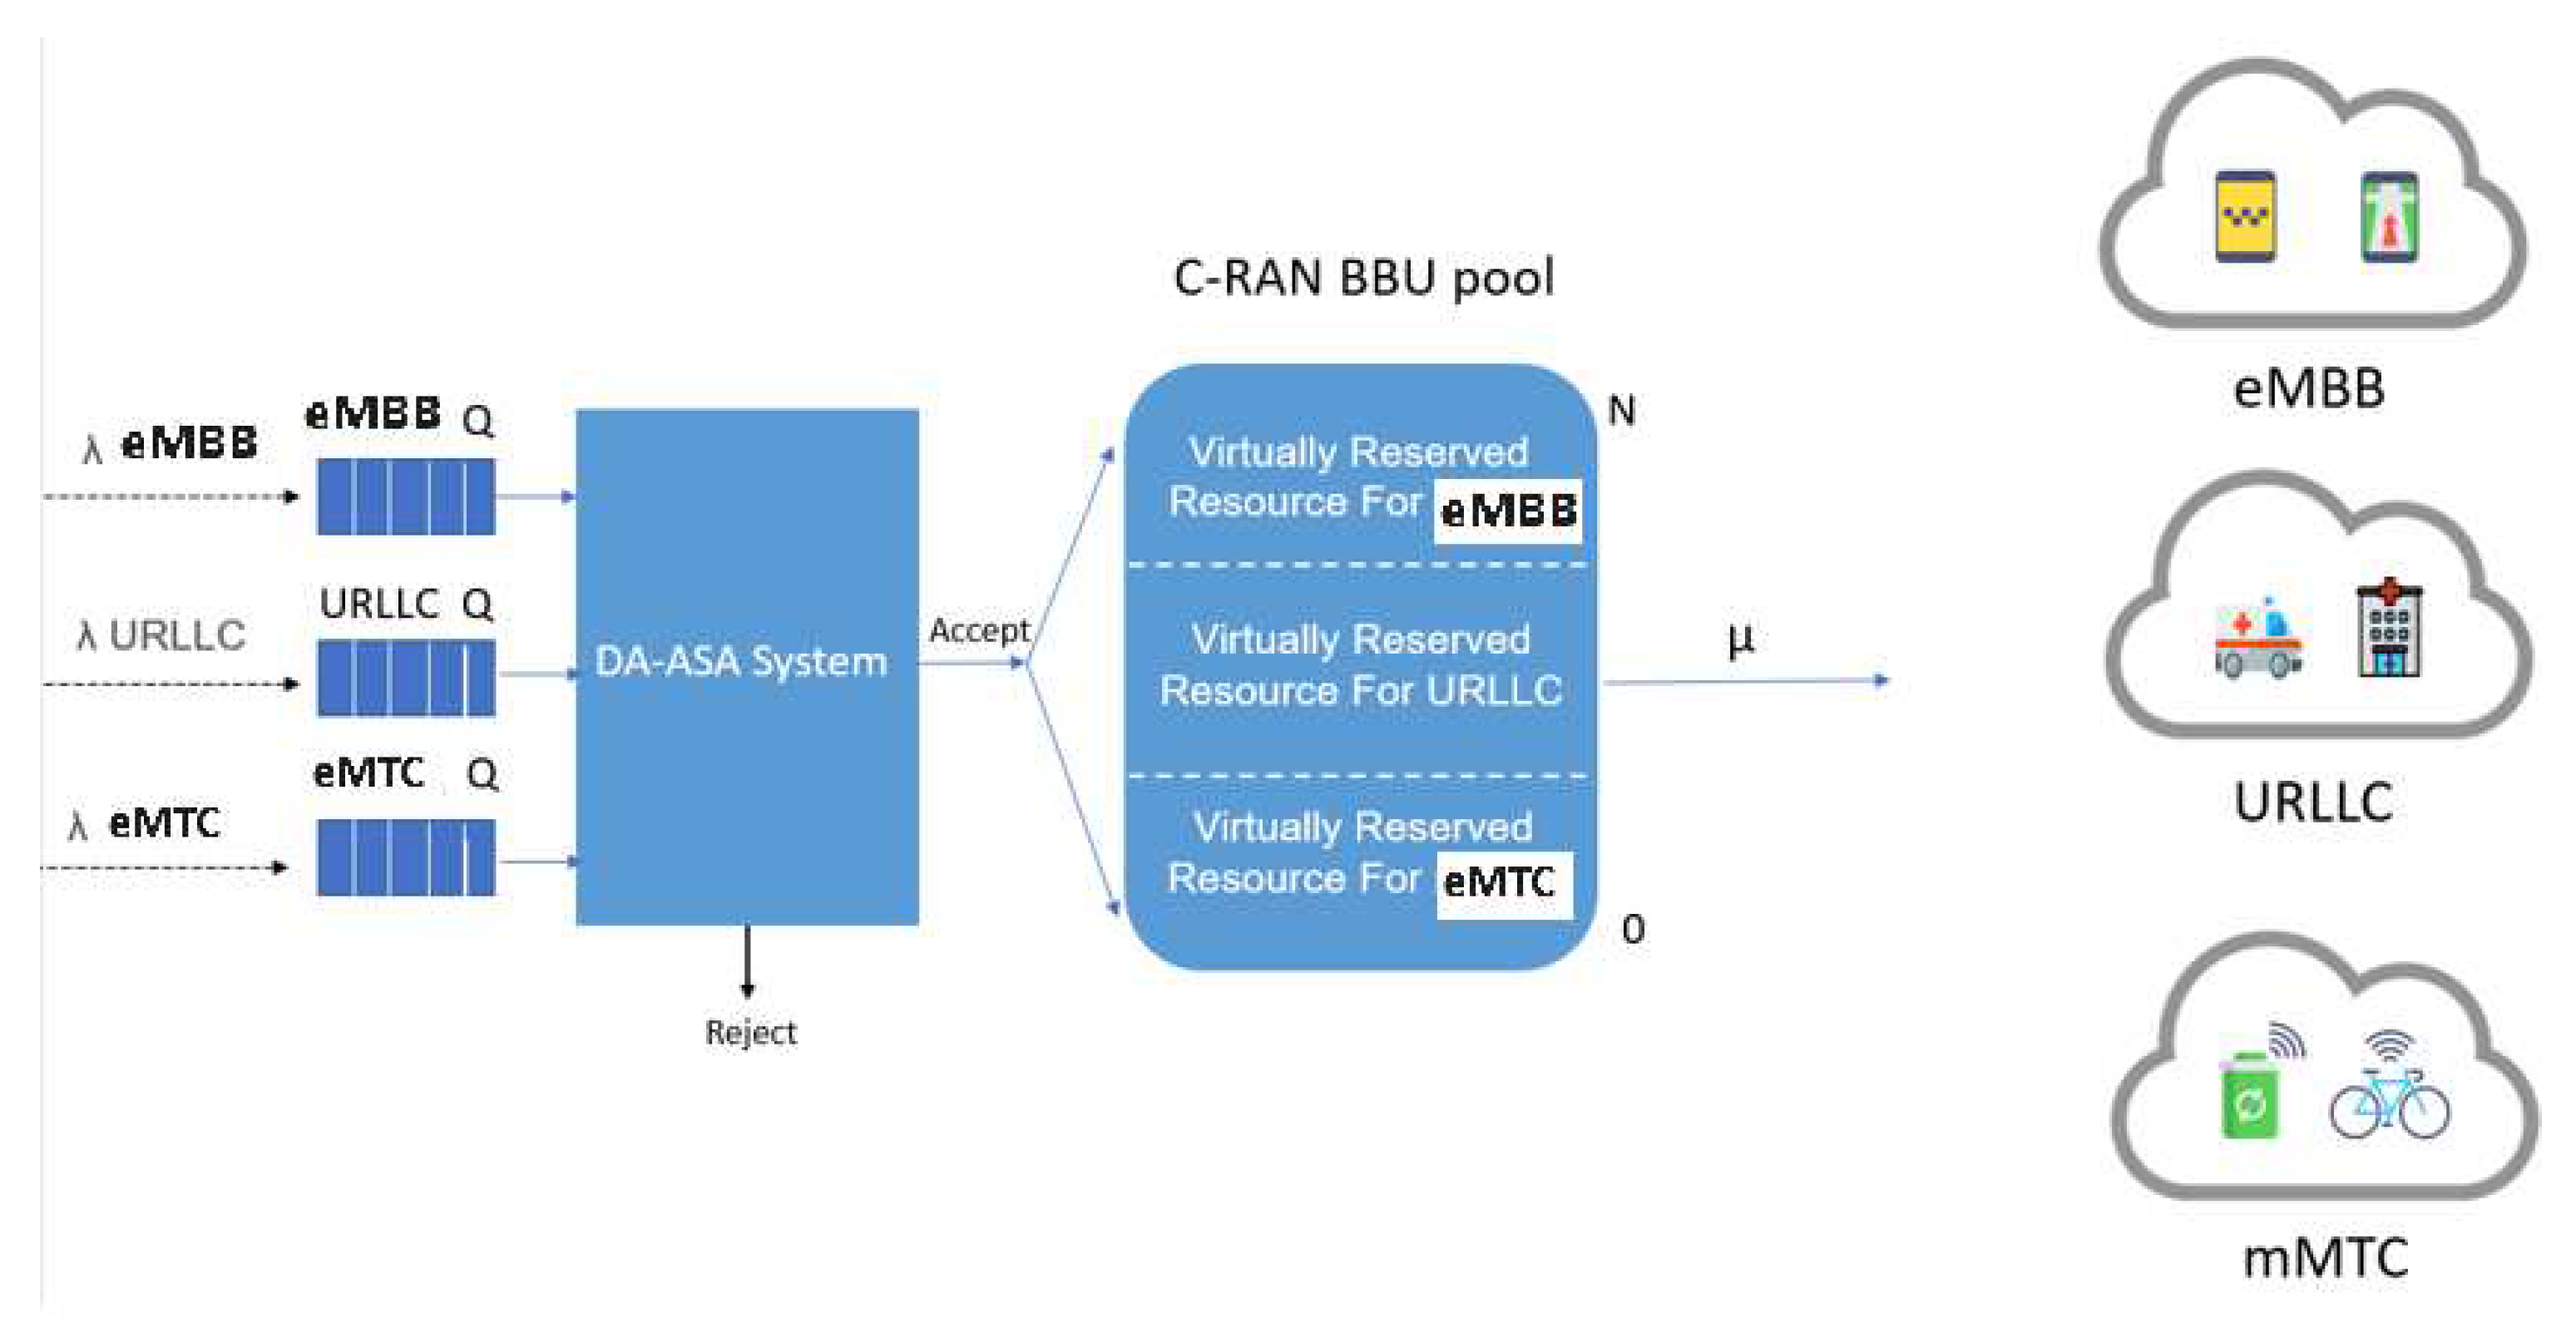
3.2.3. Proposed Delay Aware Adaptive Slice Allocation System (DA-ASA)

The second system we propose is a delay-aware ASA (DA-ASA) system. This system adds maximum time delay tolerance as a new parameter in ASP calculations. It assigns a high-priority value to a slice’s request i when the difference between the pre-defined maximum tolerable delay M T D i and the current delay of the slice request, D i (i.e., M T D i D i ), decreases. Figure 7 shows the system model for the DA-ASA system.
The procedure for this system is the same as that of the ASA system, except that the ASP is calculated using:
  • The total number of RBs that are currently utilized by all active users of the i t h slice, denoted as R c i .
  • The number of RBs that are virtually reserved for the i t h slice, denoted as R v i .
  • The maximum tolerable delay limit for a user request in the ith slice, denoted as M T D i .
  • The current delay for a request in the i t h slice, denoted as D i .
Therefore, the ASP value for slice’s request i is calculated as follows:
A S P i = R c i R v i × ( M T D i D i )
Table 7 shows the ASP of each slice’s request i of the DA-ASA system.
In (17), if a slice’s request i has a large queuing delay, the difference between its maximum tolerable delay M T D i and its current request delay D i decreases, resulting in a lower ASP value. Therefore, when the ASP value of the slice’s request i decreases, its priority in obtaining the service increases. At high traffic load, the delay parameter maintains slice isolation by preventing the slices from negatively affecting each other.
For example, suppose the DA-ASA system receive requests from each slice. The URLLC slice’s R v i value is 50 RBs, the current R c i value is 25 RBs, the MTD is 1 ms, and the current delay of a queued URLLC request is 0.9 ms. The eMBB slice’s R v i value is 35 RBs, the current R c i value is 5 RBs, the MTD is 4 ms, and the current delay of a queued eMBB request is 1 ms. The mMTC slice’s R v i value is 15 RBs, the current R c i value is 10 RBs, the MTD is 7 ms, and the current delay of a queued mMTC request is 6 ms. As previously stated, when calculating the ASP, the DA-ASA takes into account the difference between the slice’s M T D i and the current request delay. Using Equation (17), the ASP value for the URLLC slice is 0.7, 1.2 for the eMBB slice, and 0.6 for the mMTC slice. As a result, the mMTC slice request will have the highest priority and obtain the service first since it has the lowest ASP value.
Table 8 summarizes the CAC of the DA-ASA system. The Pseudo code for the ARRIVAL and DEPARTURE event of the DA-ASA system is the same as the ASA system, except that the ASP is calculated using the equation shown in (17).

4. Simulation Results and Discussions

4.1. Performance Measures

The system performance metrics used to evaluate the proposed systems are system utilization, average waiting time, and the TBP of each slice traffic. They are defined as follows:
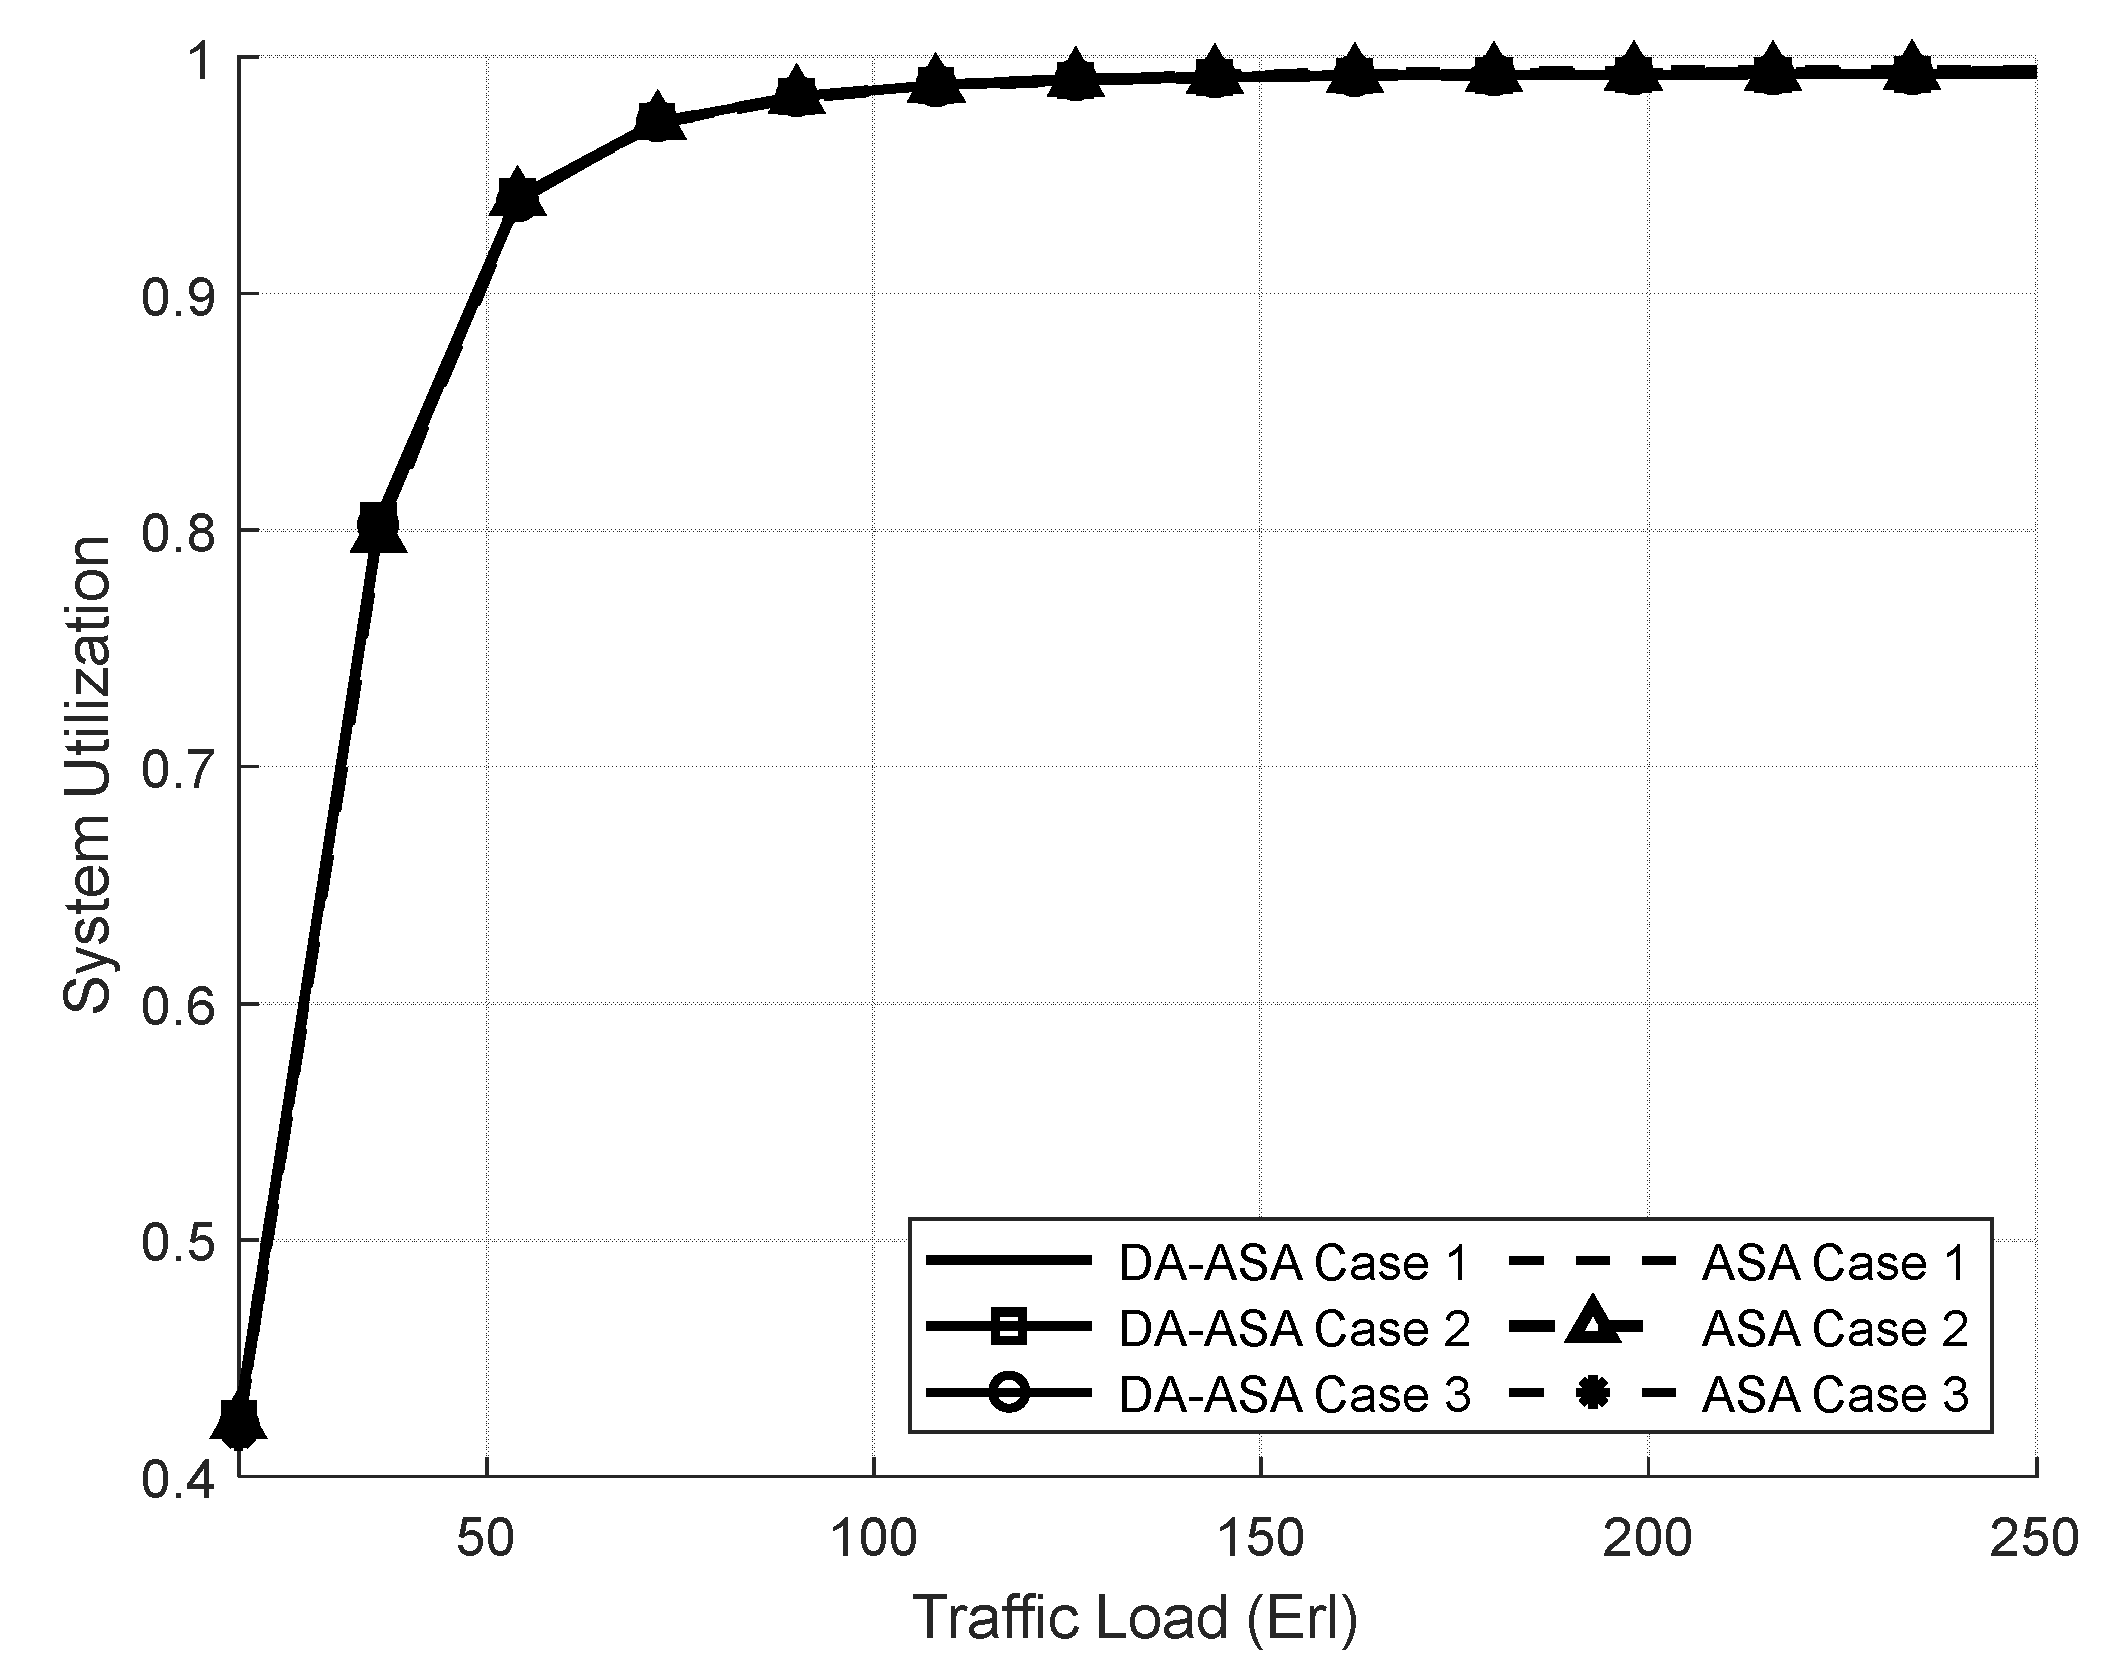
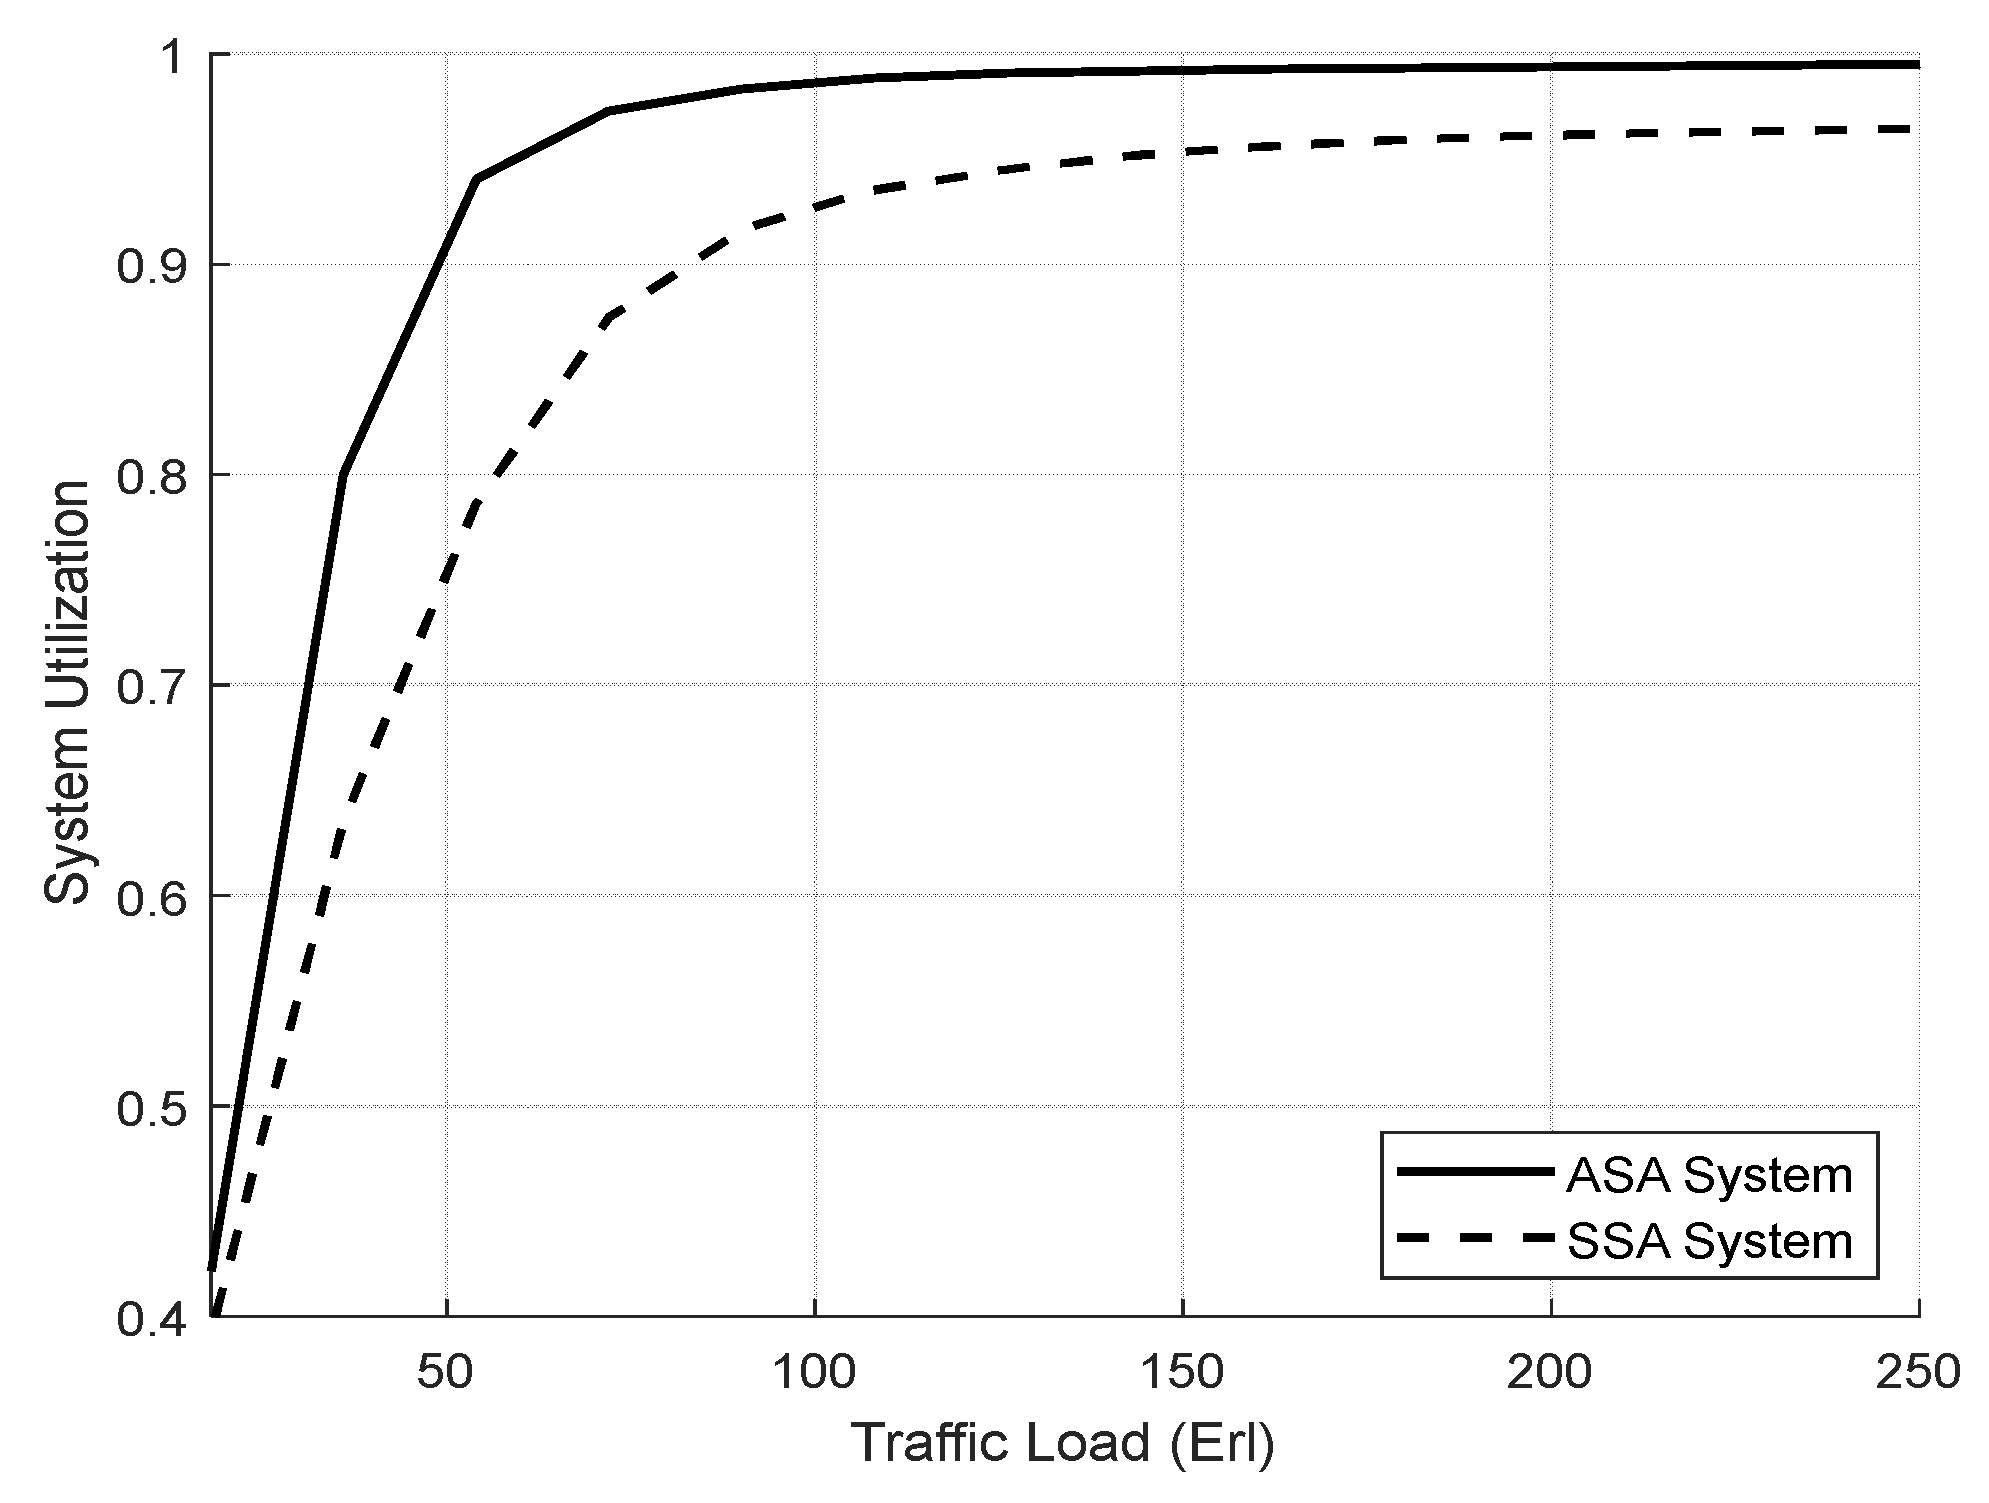
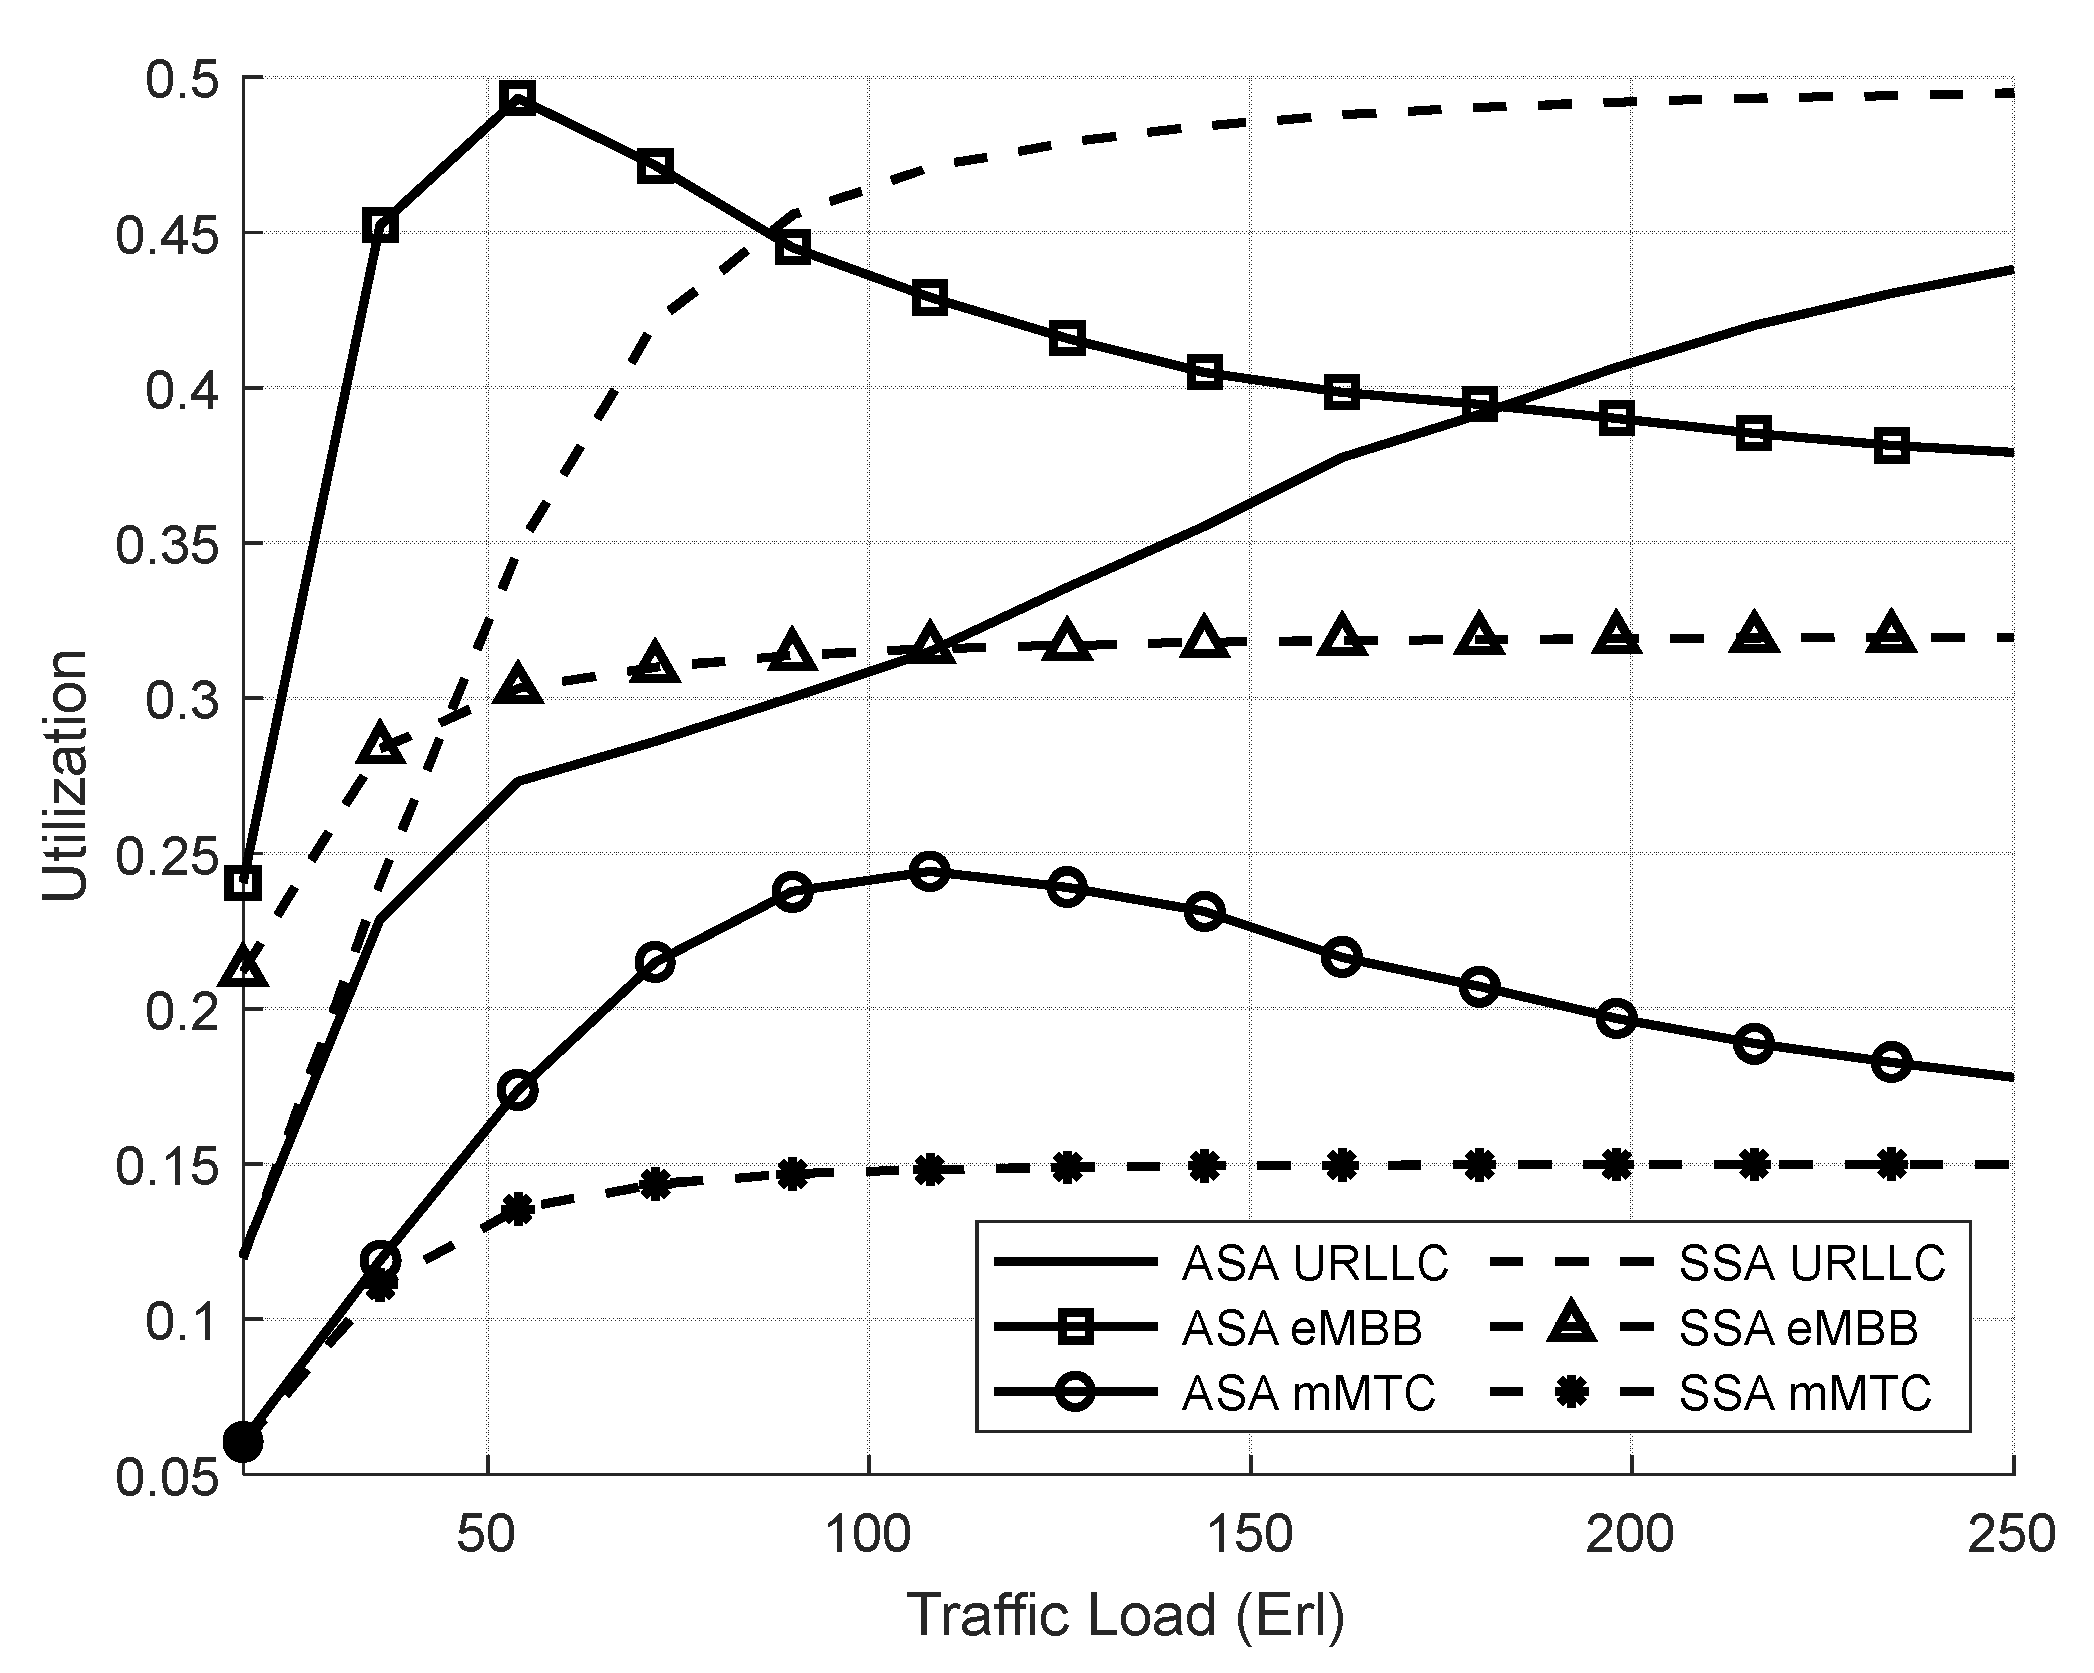
  • System utilization (U)
System utilization measures the efficiency of the slice allocation system. it can be defined as the ratio of the average number of the total current cell occupied RBs ( R c ) to the total number of RBs in one radio frame (R) [37]. Therefore, utilization can be expressed as follows:
U = R c R
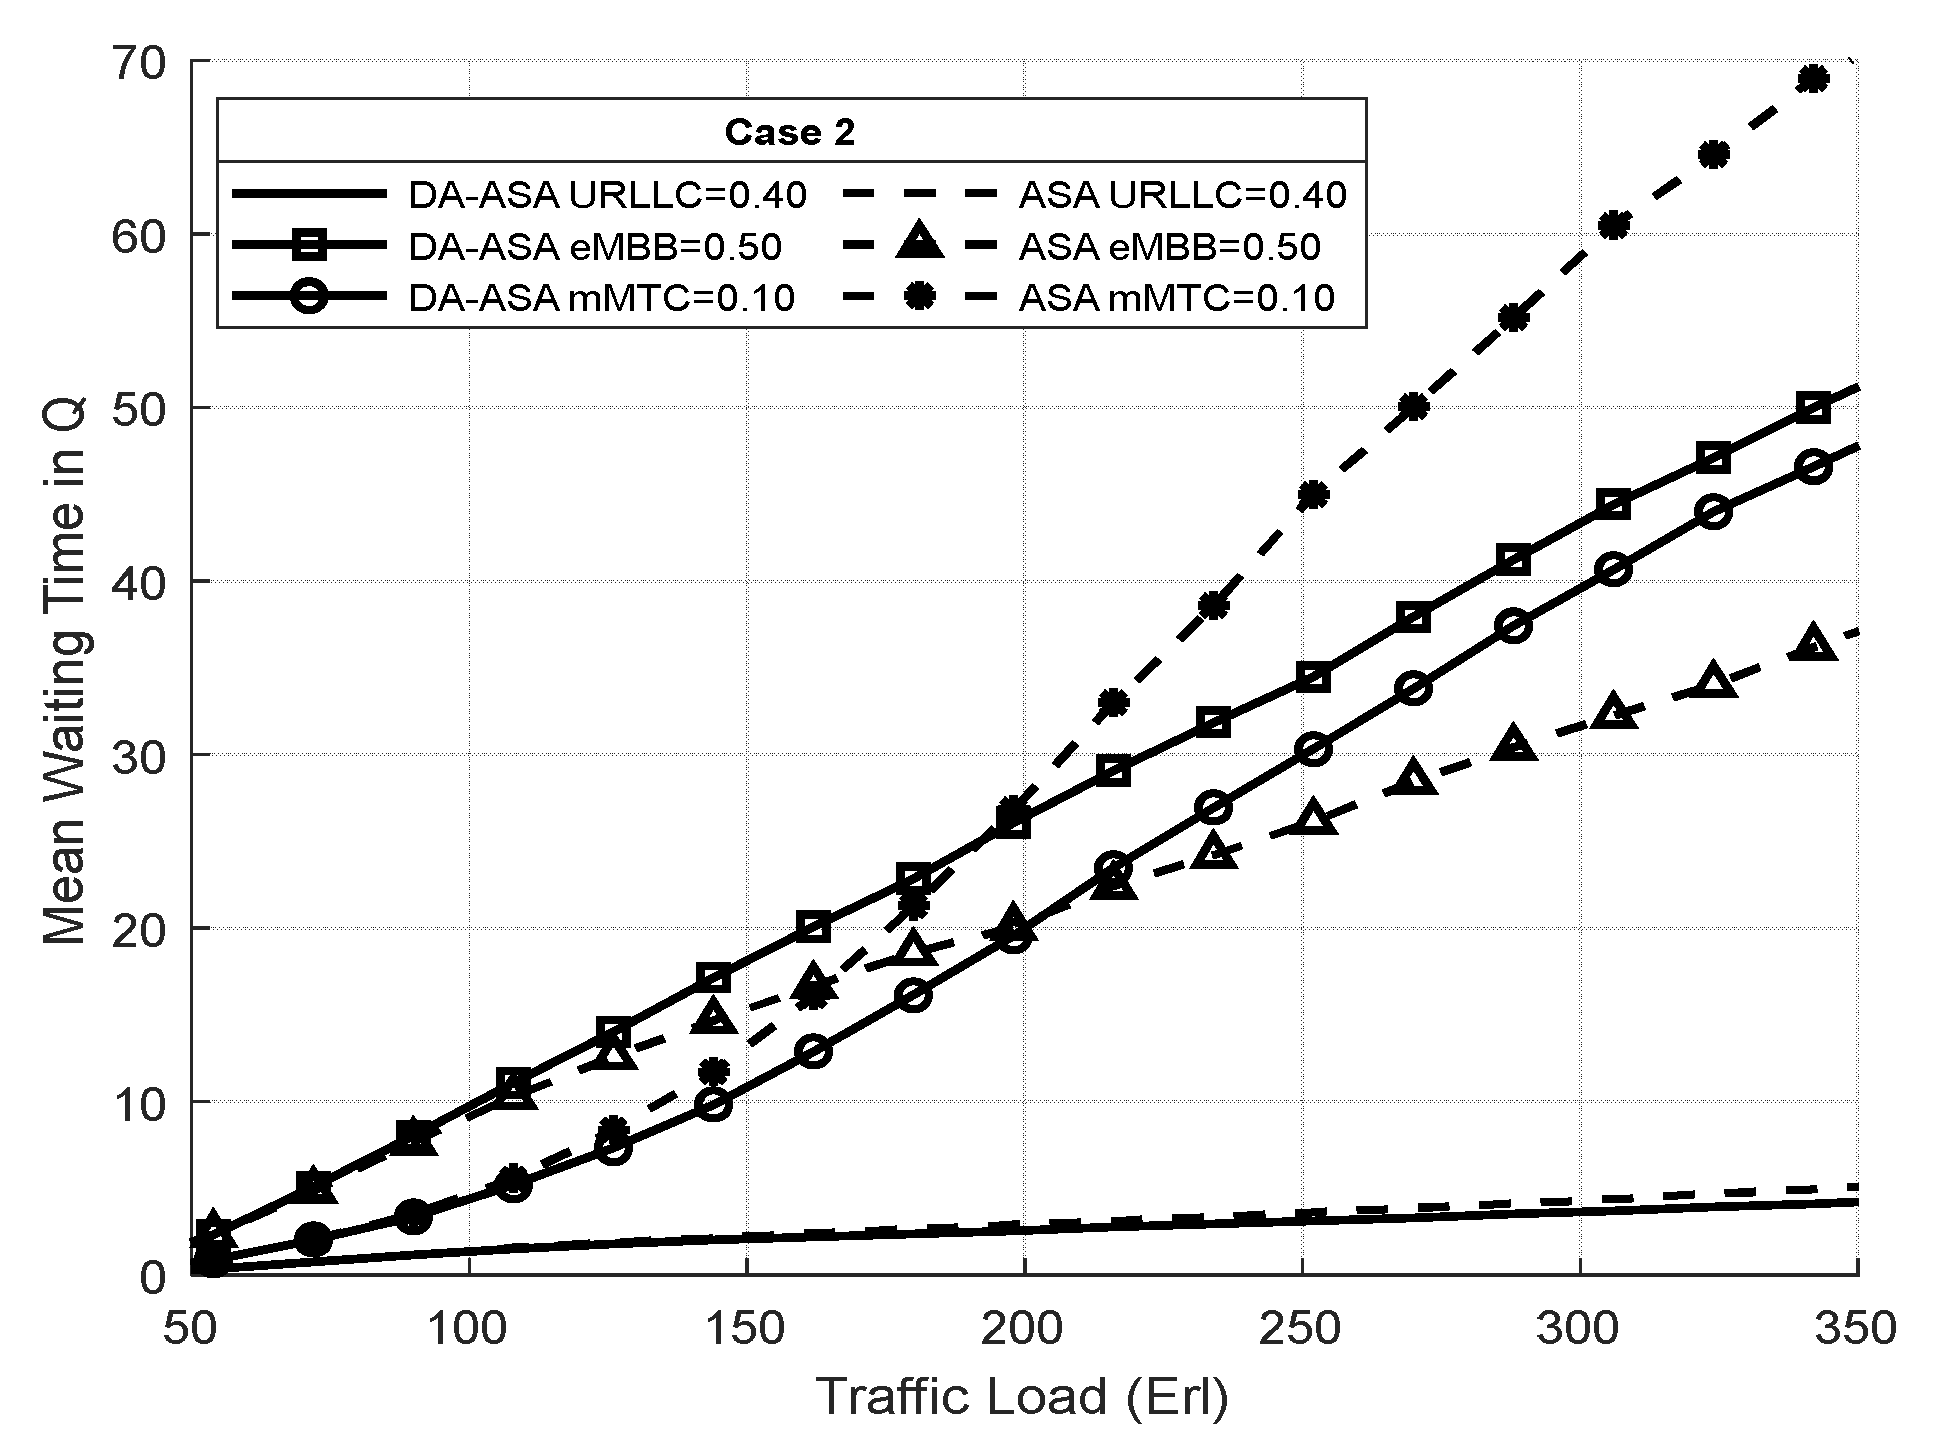
  • Average waiting time (W)
The average queuing time delay for a request i, W i , is the average waiting time of a new arrival user (call) before being served or blocked [37]. It can be expressed as follows:
W i = W a i t i n g   t i m e   o f   r e q u e s t   i T o t a l   n u m .   o f   a r r i v e d   r e q u e s t s   i
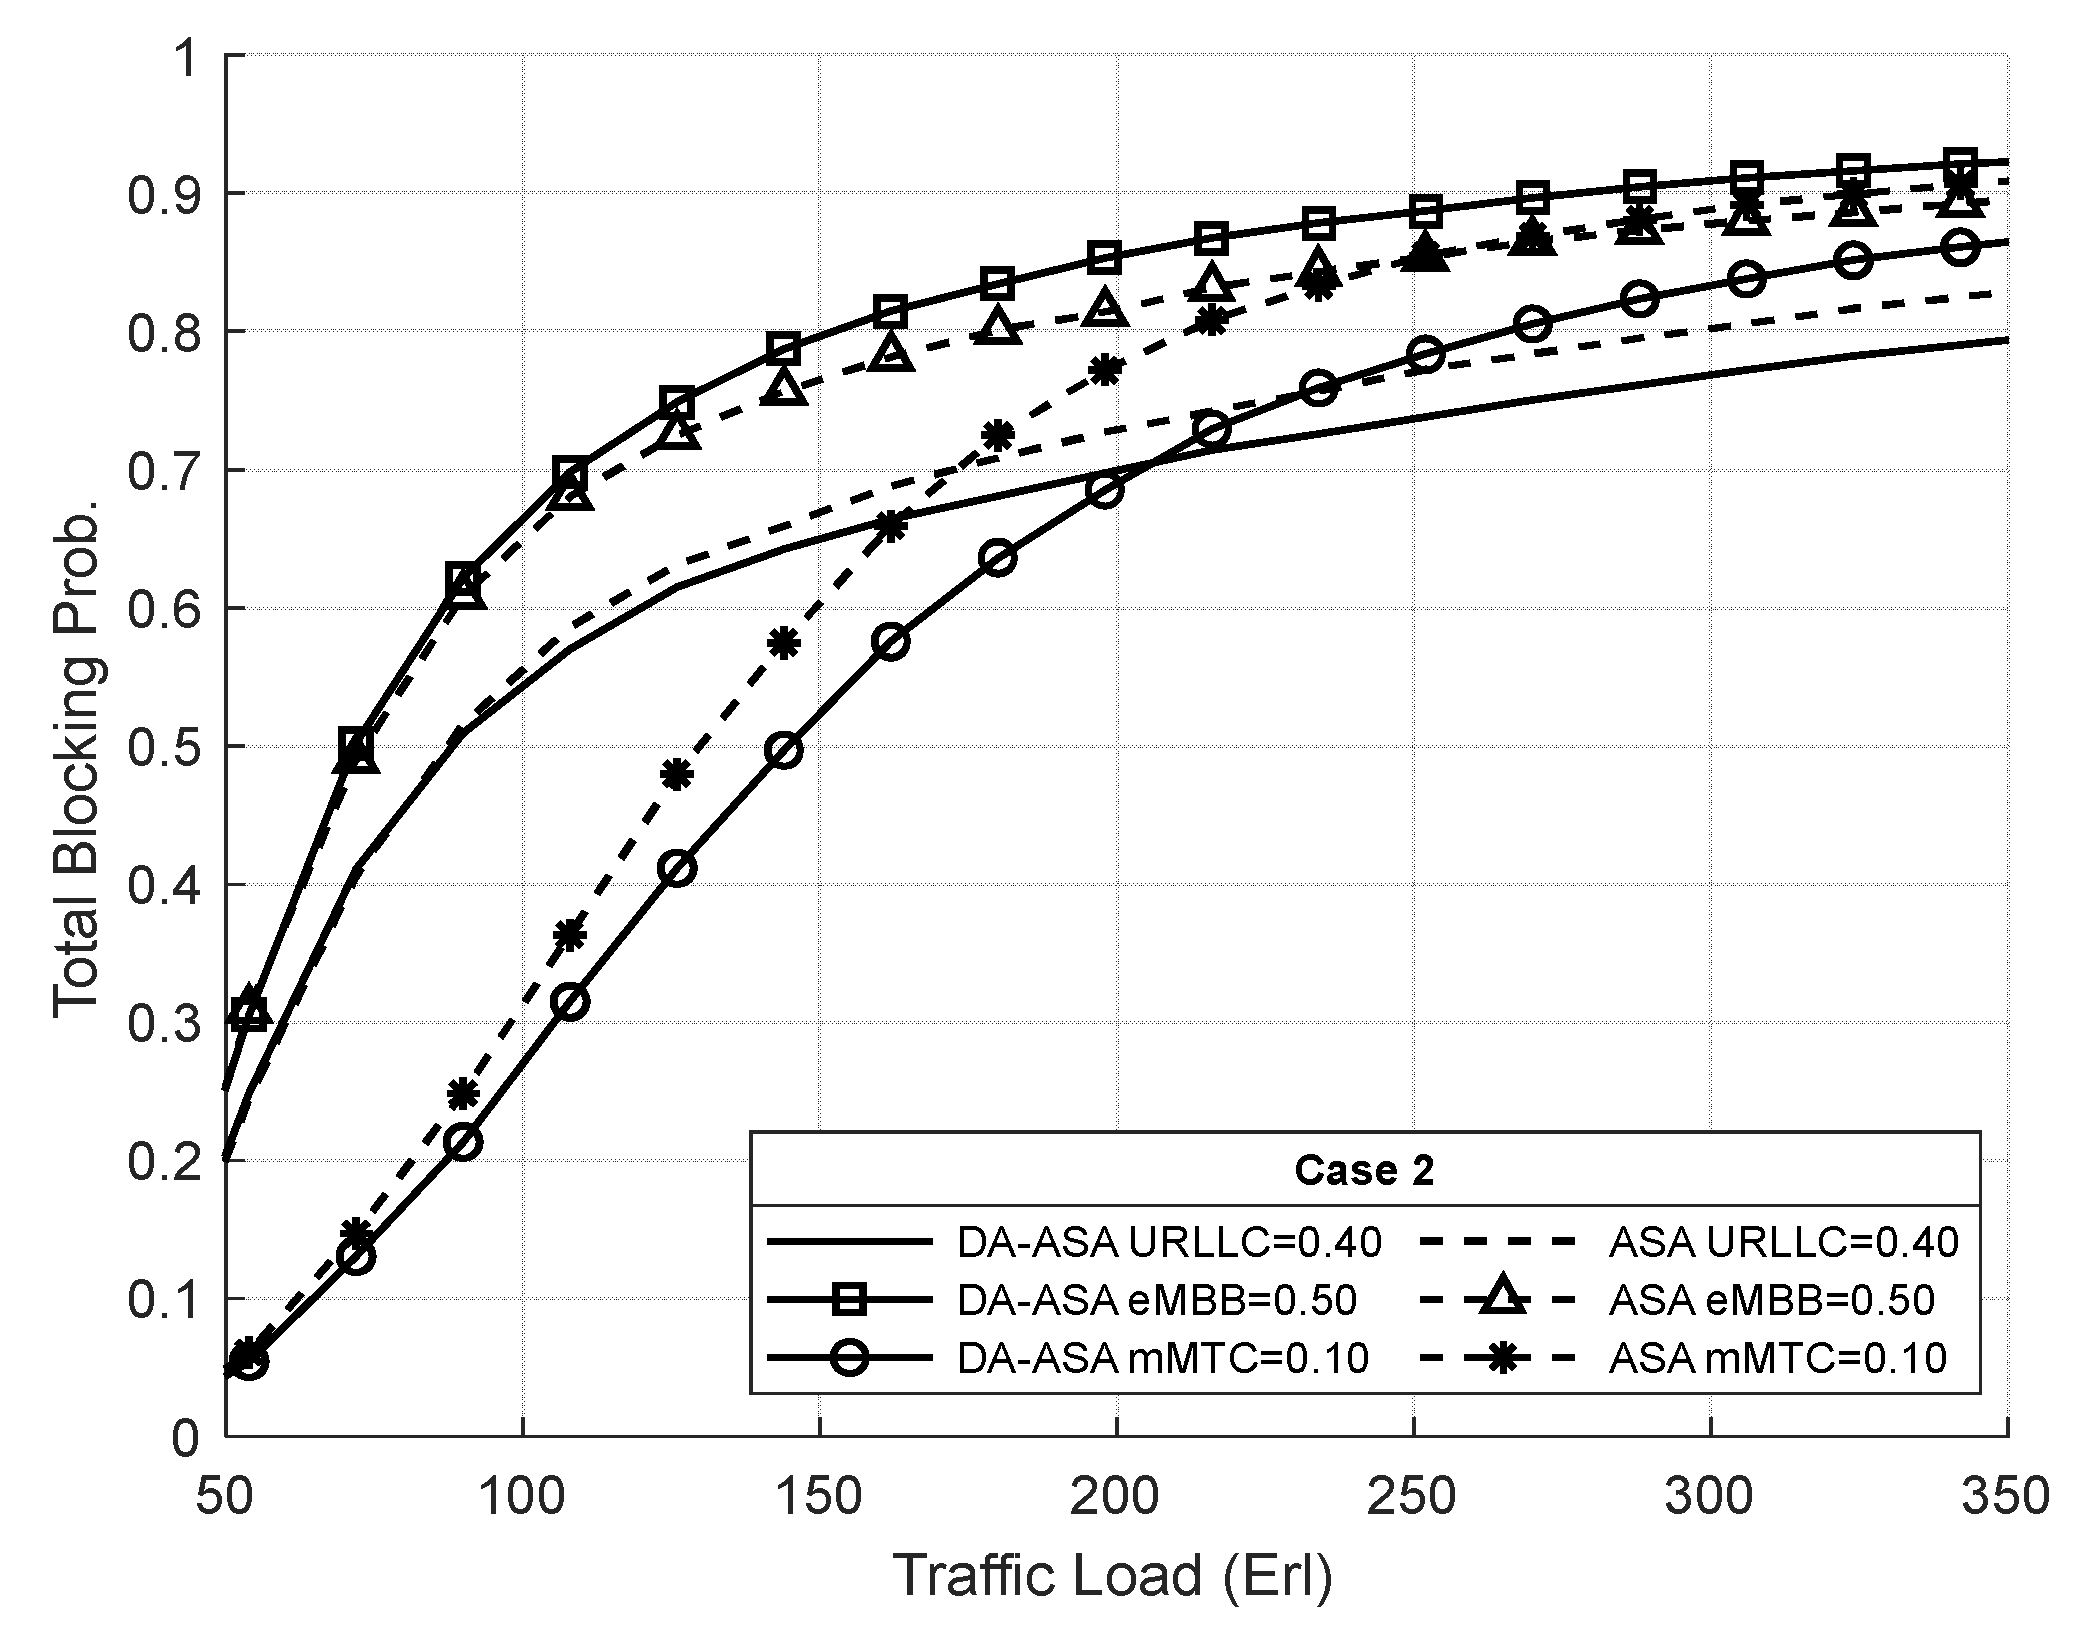
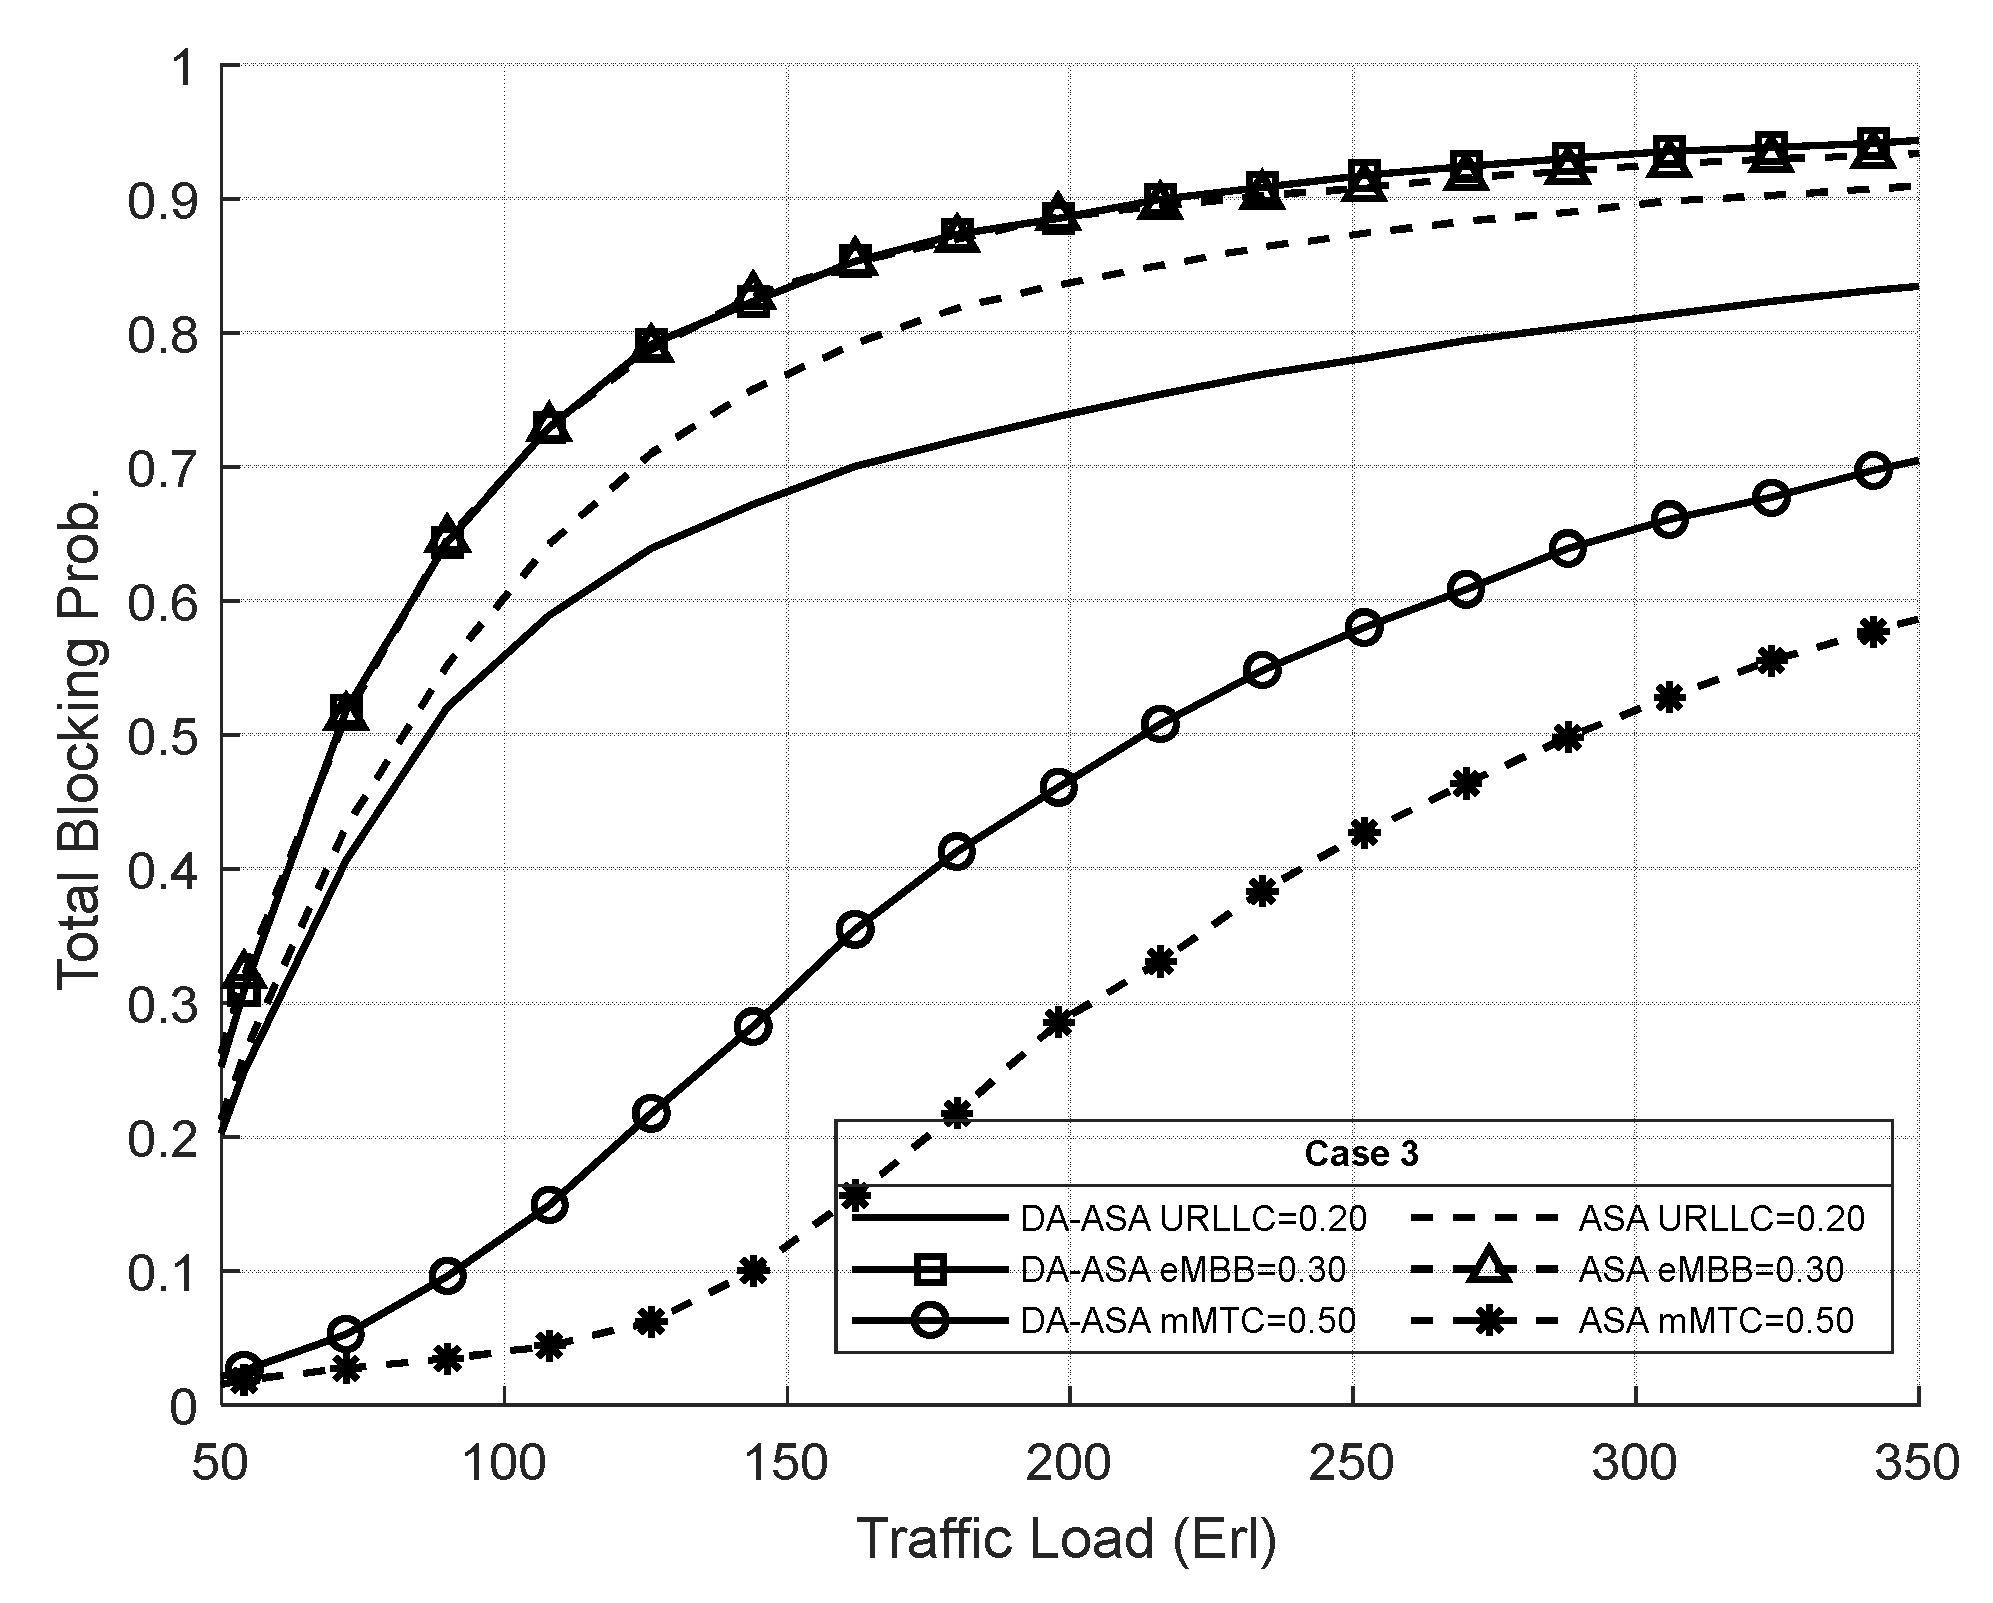
  • Total Blocking Probabilities (TBP)
The ( T B P i ) of a request i is the probability that request i will be rejected due to a lack of resources [11]. This probability is the sum of the blocking probability and the time-out probability. The blocking probability ( B P i ), of a request i is the probability that request i is rejected (i.e., blocked) when its queue is full. It can be defined as follows:
B P i = B k i A r i
where B k i is the total number of type i requests that are blocked, and A r i is the total number of type i requests that have arrived.
The time-out probability ( T O P i ) is the probability that a queued request i is dropped from its queue when it exceeds its maximum waiting time before receiving service. It can be defined as follows:
T O P i = D p i A r i
where D p i is the total number of type i requests that dropped, and A r i is the total number of type i requests that have arrived. Therefore, the T B P i of a request i can be written as follows:
T B P i = B P i + T O P i

4.2. Simulation Setup

In this section, we discuss the simulation model of the proposed ASA system for network slices in 5G C-RAN. To validate the results of the proposed system, a discrete event simulation program was developed using MATLAB. The intended simulation model is composed of a single cell set up with one RRH based on the 3GPP 5G system model. The total bandwidth considered is B = 20 MHz, subdivided into 100 RBs of 12 subcarriers. Three different 5G slices (URLLC, eMBB, and mMTC) with multiple priority levels share the BBU pool bandwidth of the 5G C-RAN, and each slice traffic has different parameters considering its required QoS. We discuss different performance metrics from the schemes in [14,15] and 5G Releases and recommendations.
The simulation has three FIFO queues that hold the value of the arrival time and drop time of each connection request. Table 9 shows the main simulation parameters.
The QoS requirements for the 5G network slices utilized in our simulation are shown in Table 10. The parameters in Table 9 and Table 10 are used unless otherwise specified. For the URLLC slice, we set its priority ratio, P U R L L C , to 50%, meaning it has the highest priority level. We set the queuing delay for the URLLC to 1 ms, and the data rate is 128 Kbps. Moreover, for the eMBB slice, we set its priority ratio, P e M B B , to 35%, meaning it has a medium priority level. In addition, we set the queuing delay for the eMBB to 4 ms, and the data rate is 256 Kbps. For the mMTC slice, we set its priority ratio, P m M T C , to 15%, meaning it has the lowest priority level. We set the queuing delay for the mMTC to 7 ms, and the data rate is 64 Kbps.
Slices requests are generated in the system with a Poisson arrival process. The arrival rate of all slices’ users is assumed to be the same (i.e., λ i are equal for all i slices). In addition, the service rate of all slices’ users is μ where μ i = μ for all i slices. The utilization rate is given by λ i / μ . The simulation has four main events: initialize, arrival, depart, and drop events. The arrival and depart events are already described for each system in the previous section in Table 6 and Table 8. The selection of the next event is based on the event’s time. The simulation ends when the total number of served calls reaches one million.

4.3. Results and Discussions

In this section, we compare the performance of the proposed ASA system with that of the other proposed systems under the same measures in terms of system utilization and other QoS metrics, such as average waiting time and TBP. The average holding time for all users is the same. Therefore, the increase in request arrival rates (i.e., offered traffic loads) corresponds to the increase in traffic intensity. Consequently, most of the performance measures are plotted against the total offered load measured in Erlang (Erl).
In the following subsections, we discuss several experiments to investigate the full impact of our proposed system. The first experiment evaluated the performance of our proposed ASA system and compares it with the SSA system. The second experiment studied the impact of adding a maximum tolerable delay parameter on the ASA system. The third experiment evaluated the effect of changing the priority ratios of the slices in both ASA and DA-ASA systems. The fourth experiment explicated and compares the performance of ASA and DA-ASA at different queuing time limits. The last experiment evaluates the performance of ASA and DA-ASA at different queue size.
The experiments consider a wide range of offered traffic, from a low value of 50 Erl to a larger value of 350 Erl to capture the behavior of the proposed systems in all traffic load conditions (i.e., at low, moderate, and high traffic loads). In the first experiment, we investigate the general behavior of our proposed ASA system against the SSA system.
In addition, we consider a wide range of offered traffic values, ranging from 20 Erl to 250 Erl, to evaluate the systems’ behavior under various traffic volumes (i.e., low, moderate, and high traffic loads). The comparison is under the same conditions regarding system utilization and other QoS metrics, such as TBP, and average waiting time. We then plot the performance measures against the total offered load measured in Erl.

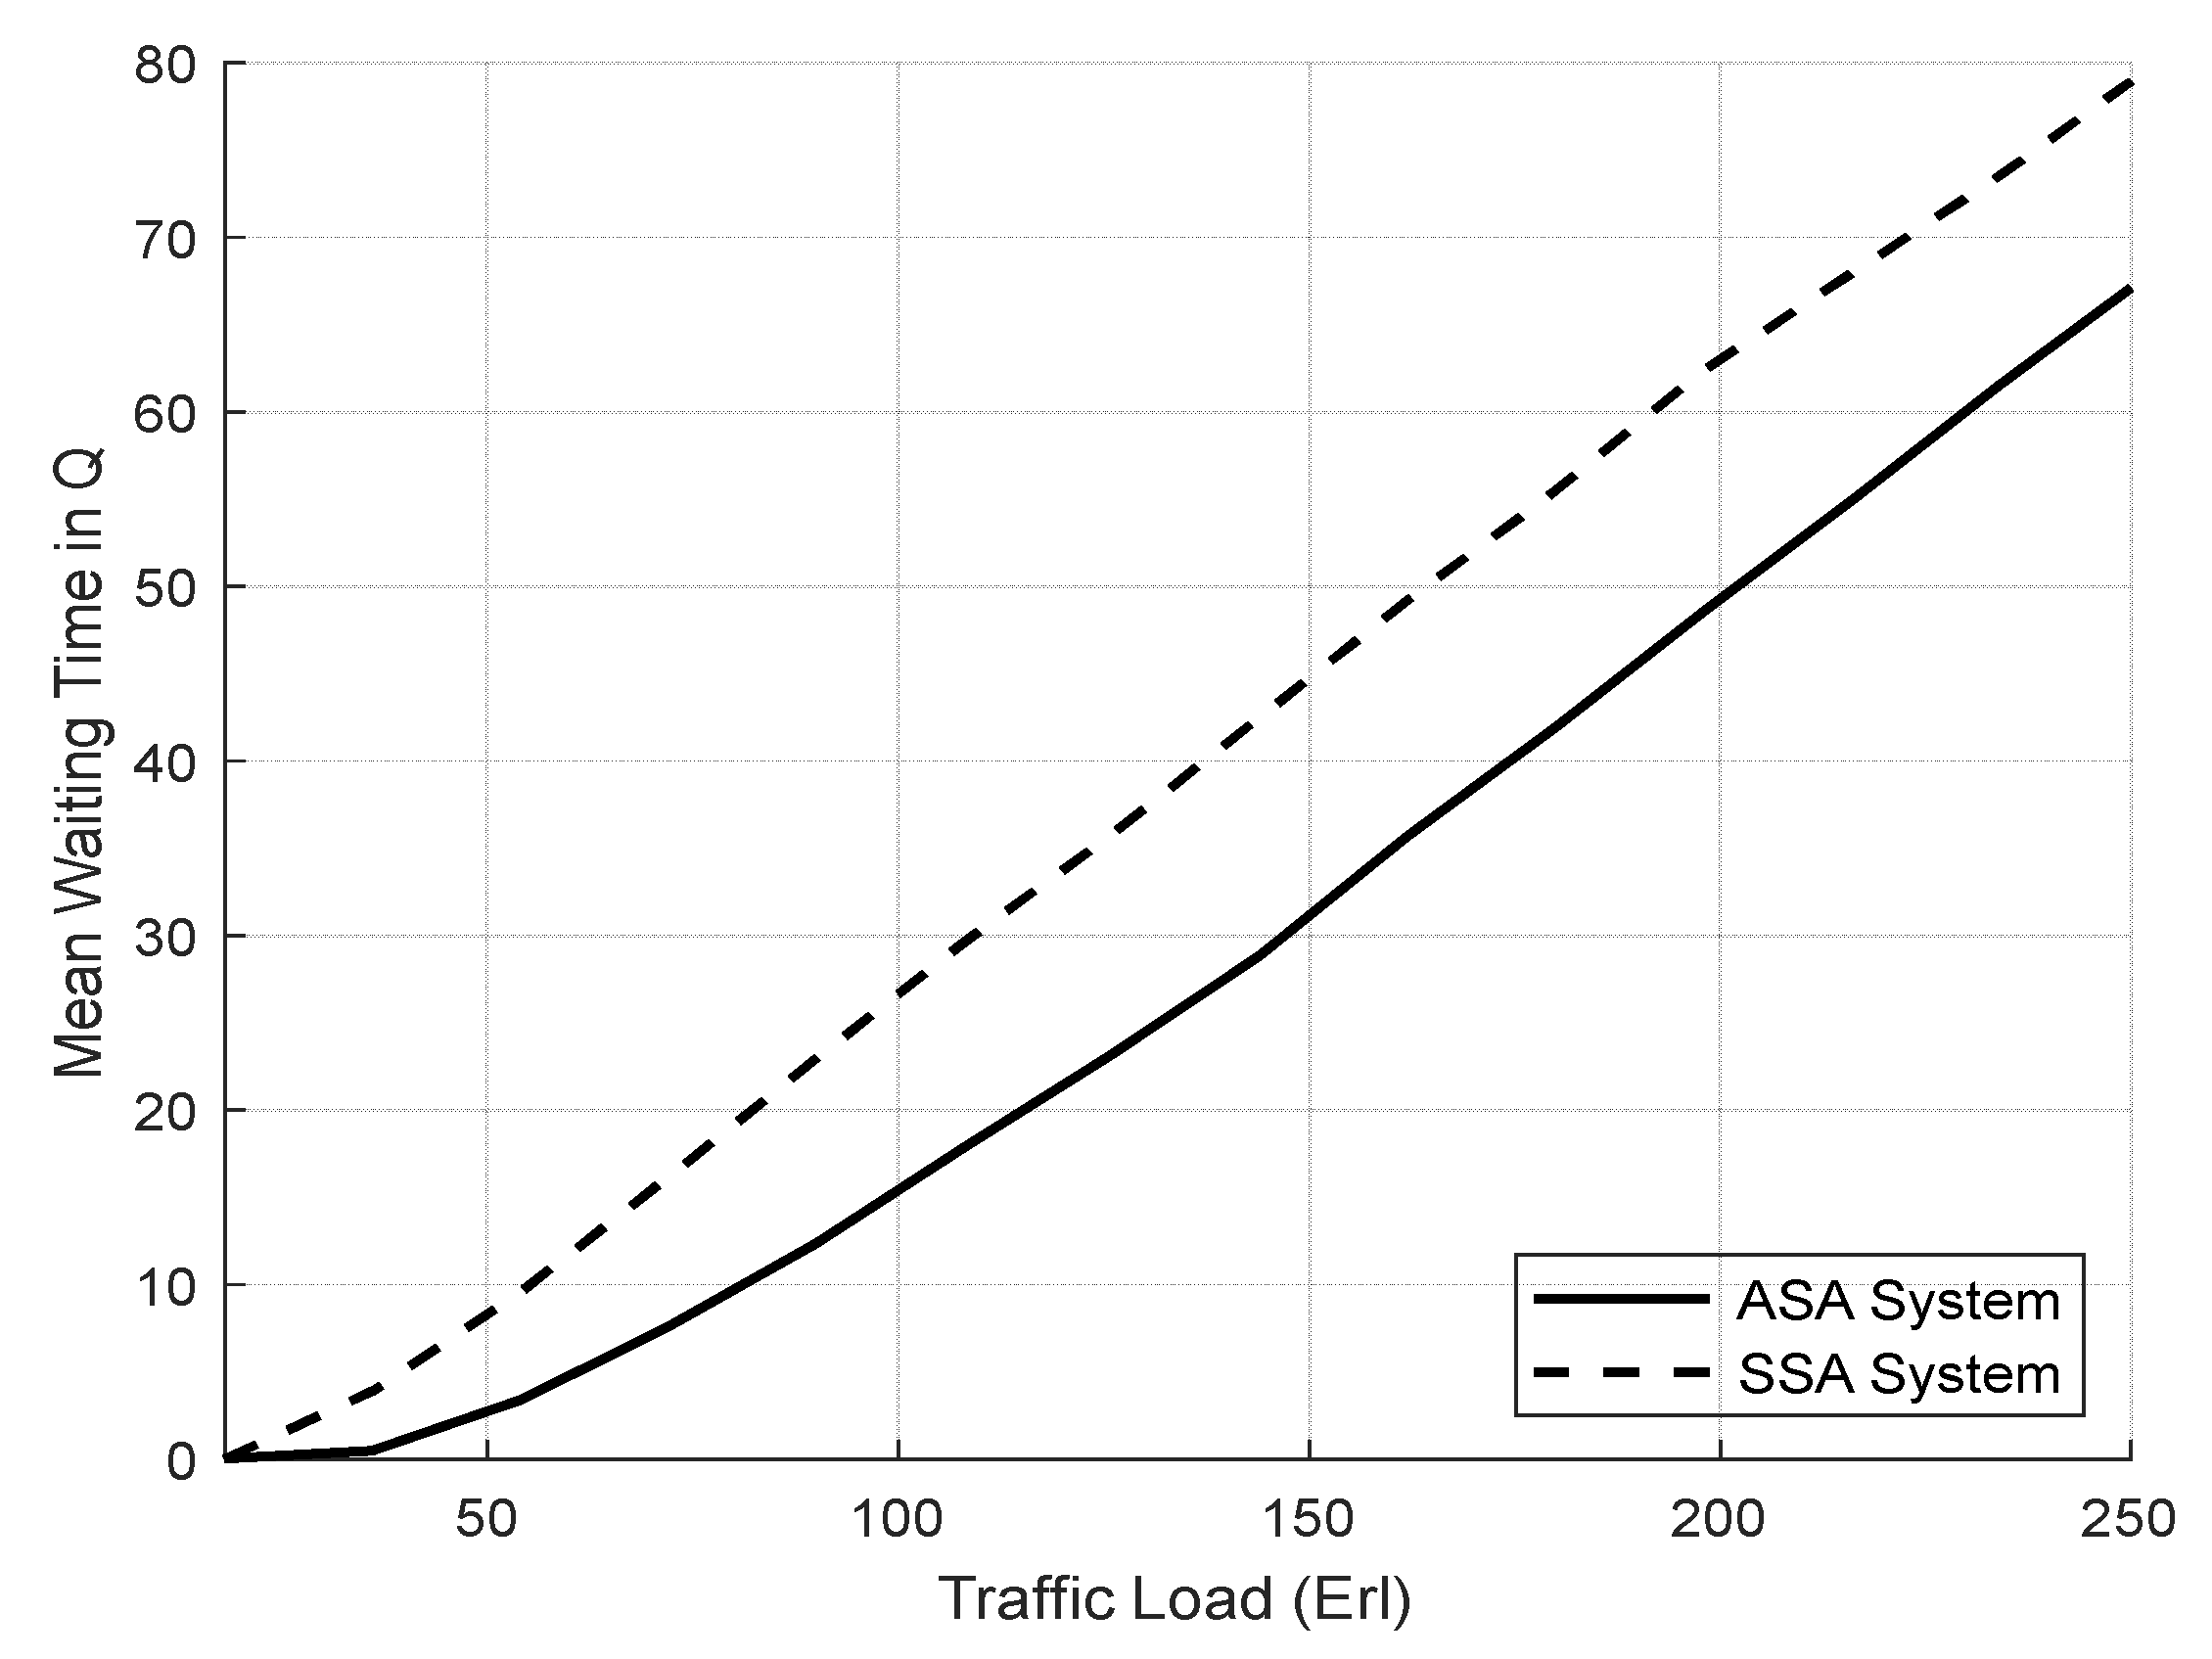
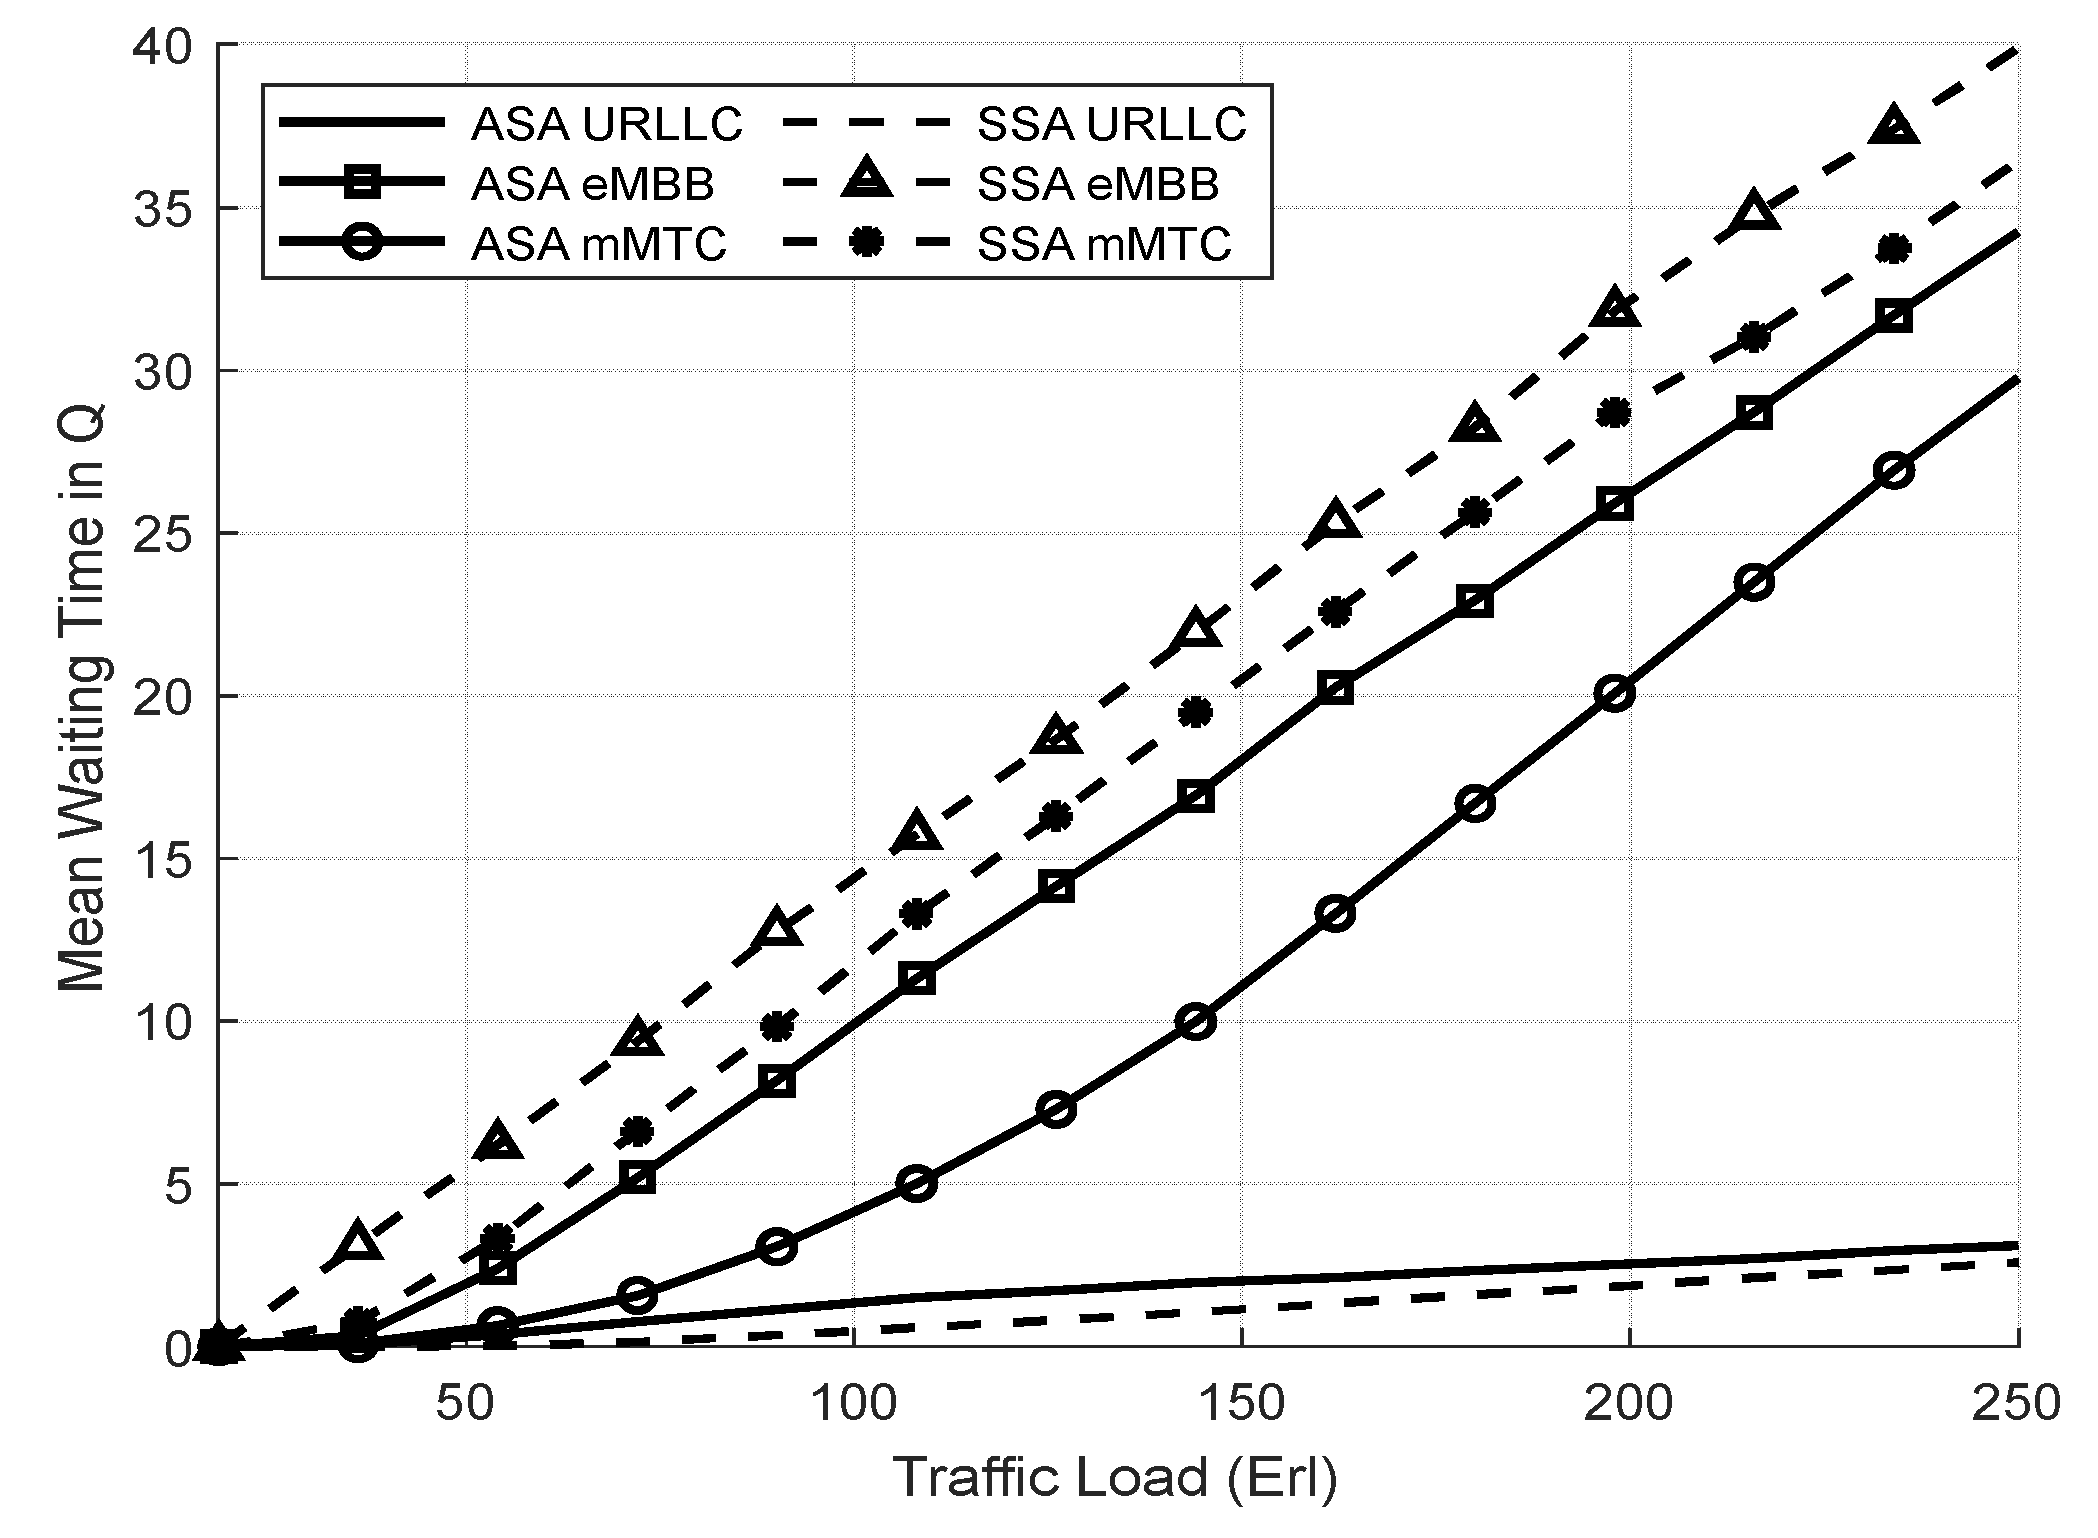
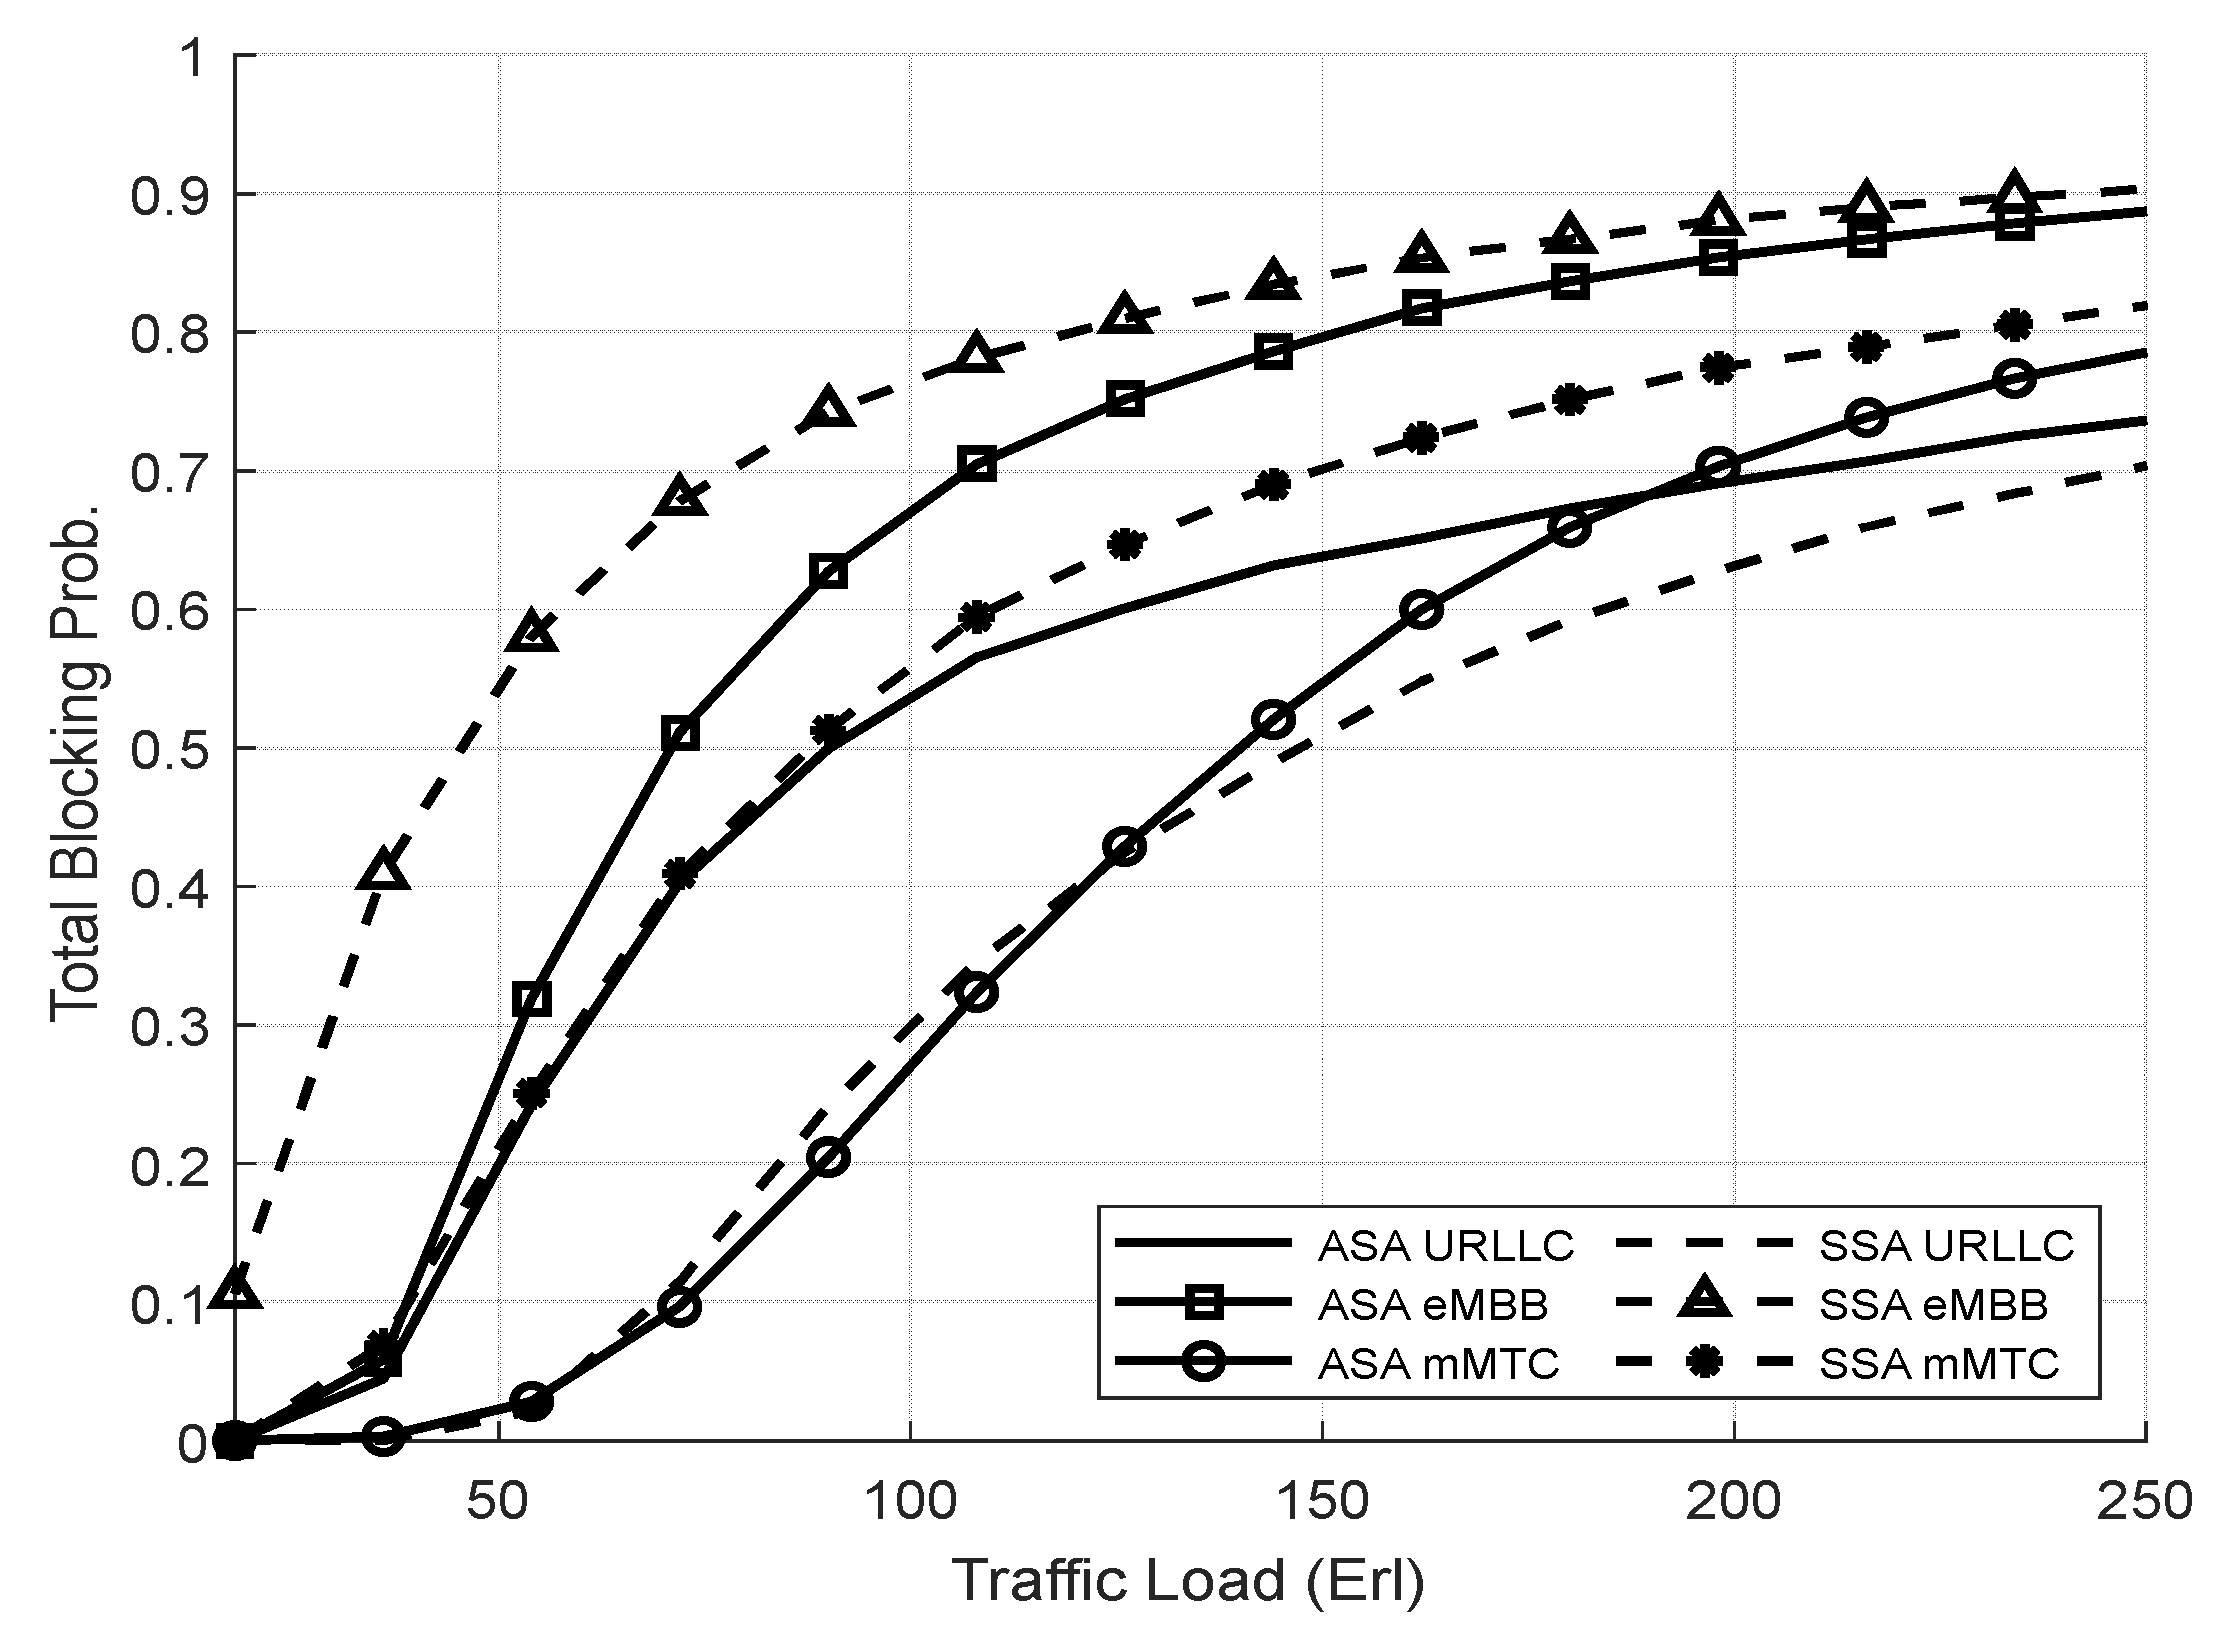
4.3.1. Evaluation Result of the SSA and the ASA Systems

In the first experiment, we evaluate the performance measures against the total traffic loads for the ASA and SSA systems. We use the SSA system as a reference to compare the performance of our proposed ASA system. Table 9 and Table 10 provide the system parameters we consider for this experiment, unless otherwise specified. Moreover, the traffic loads of eMBB, mMTC, and URLLC increase at the same rate with different priority ratios (i.e., 50% for URLLC, 35% for eMBB, and 15% for mMTC).
Figure 8 shows the total system utilization in both schemes. The ASA system achieves full system utilization. However, as predicted, SSA has lower system utilization because traffic from other slices cannot reach the available resource in one slice.
Figure 9 shows the resource utilization of the network slices. In eMBB and mMTC slices, the resource utilization of ASA is higher than SSA because ASA adapts the priority of the slices when they have a low ASP value, which allows them to utilize the shared resources. In addition, the slice ratio specifies the number of resources allocated for each slice in the SSA, and each slice’s performance is independent of the others.
The SSA allocates 50% of the available resources to the URLLC slice and utilizes them only with its requests; the URLLC resources cannot be shared with other slices, even if it has idle resources. Therefore, the utilization of URLLC is lower in ASA than in SSA because the ASP parameter in ASA prevents the URLLC slice from starving other slices.
Figure 10 illustrates the average waiting time of both systems. We notice that the average waiting time is proportional to the traffic volume. In addition, the ASA archives lower average waiting time for the system than the SSA due to the lack of resource sharing since each slice request must wait until its server is ready to process it.
Figure 11 shows the average waiting time of the network slices in both systems. The ASA reduces the average waiting time for eMBB and mMTC slices compared to the SSA system by allowing them to use the total available resources. However, the enhancement of the ASA system results in a slight increase in the average waiting time of URLLC slice compared to the SSA system.
Figure 12 illustrates the TBP of both systems. At low to moderate loads (i.e., 20–150 Erl), the ASA achieves lower TBP of the system than the SSA, since it can admit more requests by utilizing the unused resources of one slice for other slices. However, at high traffic loads (i.e., above 160 Erl), the TBP for the ASA is almost equal that of the SSA due to the high resource consumption in both systems.
Figure 13 shows the TBP of the network slices in both systems. The ASA enhances the TBP for eMBB and mMTC slices compared to the SSA system, despite their lower priority ratios. ASA permits eMBB and mMTC slices to exploit the total underutilized resources, enabling greater admission of their requests. In contrast, SSA has a distinct resource partition for eMBB and mMTC, preventing them from accessing the available resources in all slices. Given that the URLLC slice has the highest priority, SSA always provides the best performance at the expense of the performance of other slices. Therefore, the SSA achieves lower TBP for URLLC compared to the ASA.
The performance of each slice in the SSA system is based on its priority ratio, which specifies its reserved resource partition and is independent of the other slices. Therefore, SSA allows more control of the QoS of each slice at the expense of overall resource utilization. However, the ASA operates similarly to SSA, preventing one slice’s traffic from negatively impacting other slices. ASA applies the ASP equation to adaptively modify the priority of each slice to protect slices from each other, preventing the URLLC slice from starving the other slices (i.e., eMBB and mMTC slices) and degrading its QoS performance.
ASA outperformed SSA, especially for eMBB and mMTC slices, with slight degradation in the QoS of the URLLC service. ASA improves system utilization by allowing unutilized resources from one slice to be utilized by other slices that require additional resources. Finally, ASA achieves a superior balance of efficiency and fairness compared to SSA.

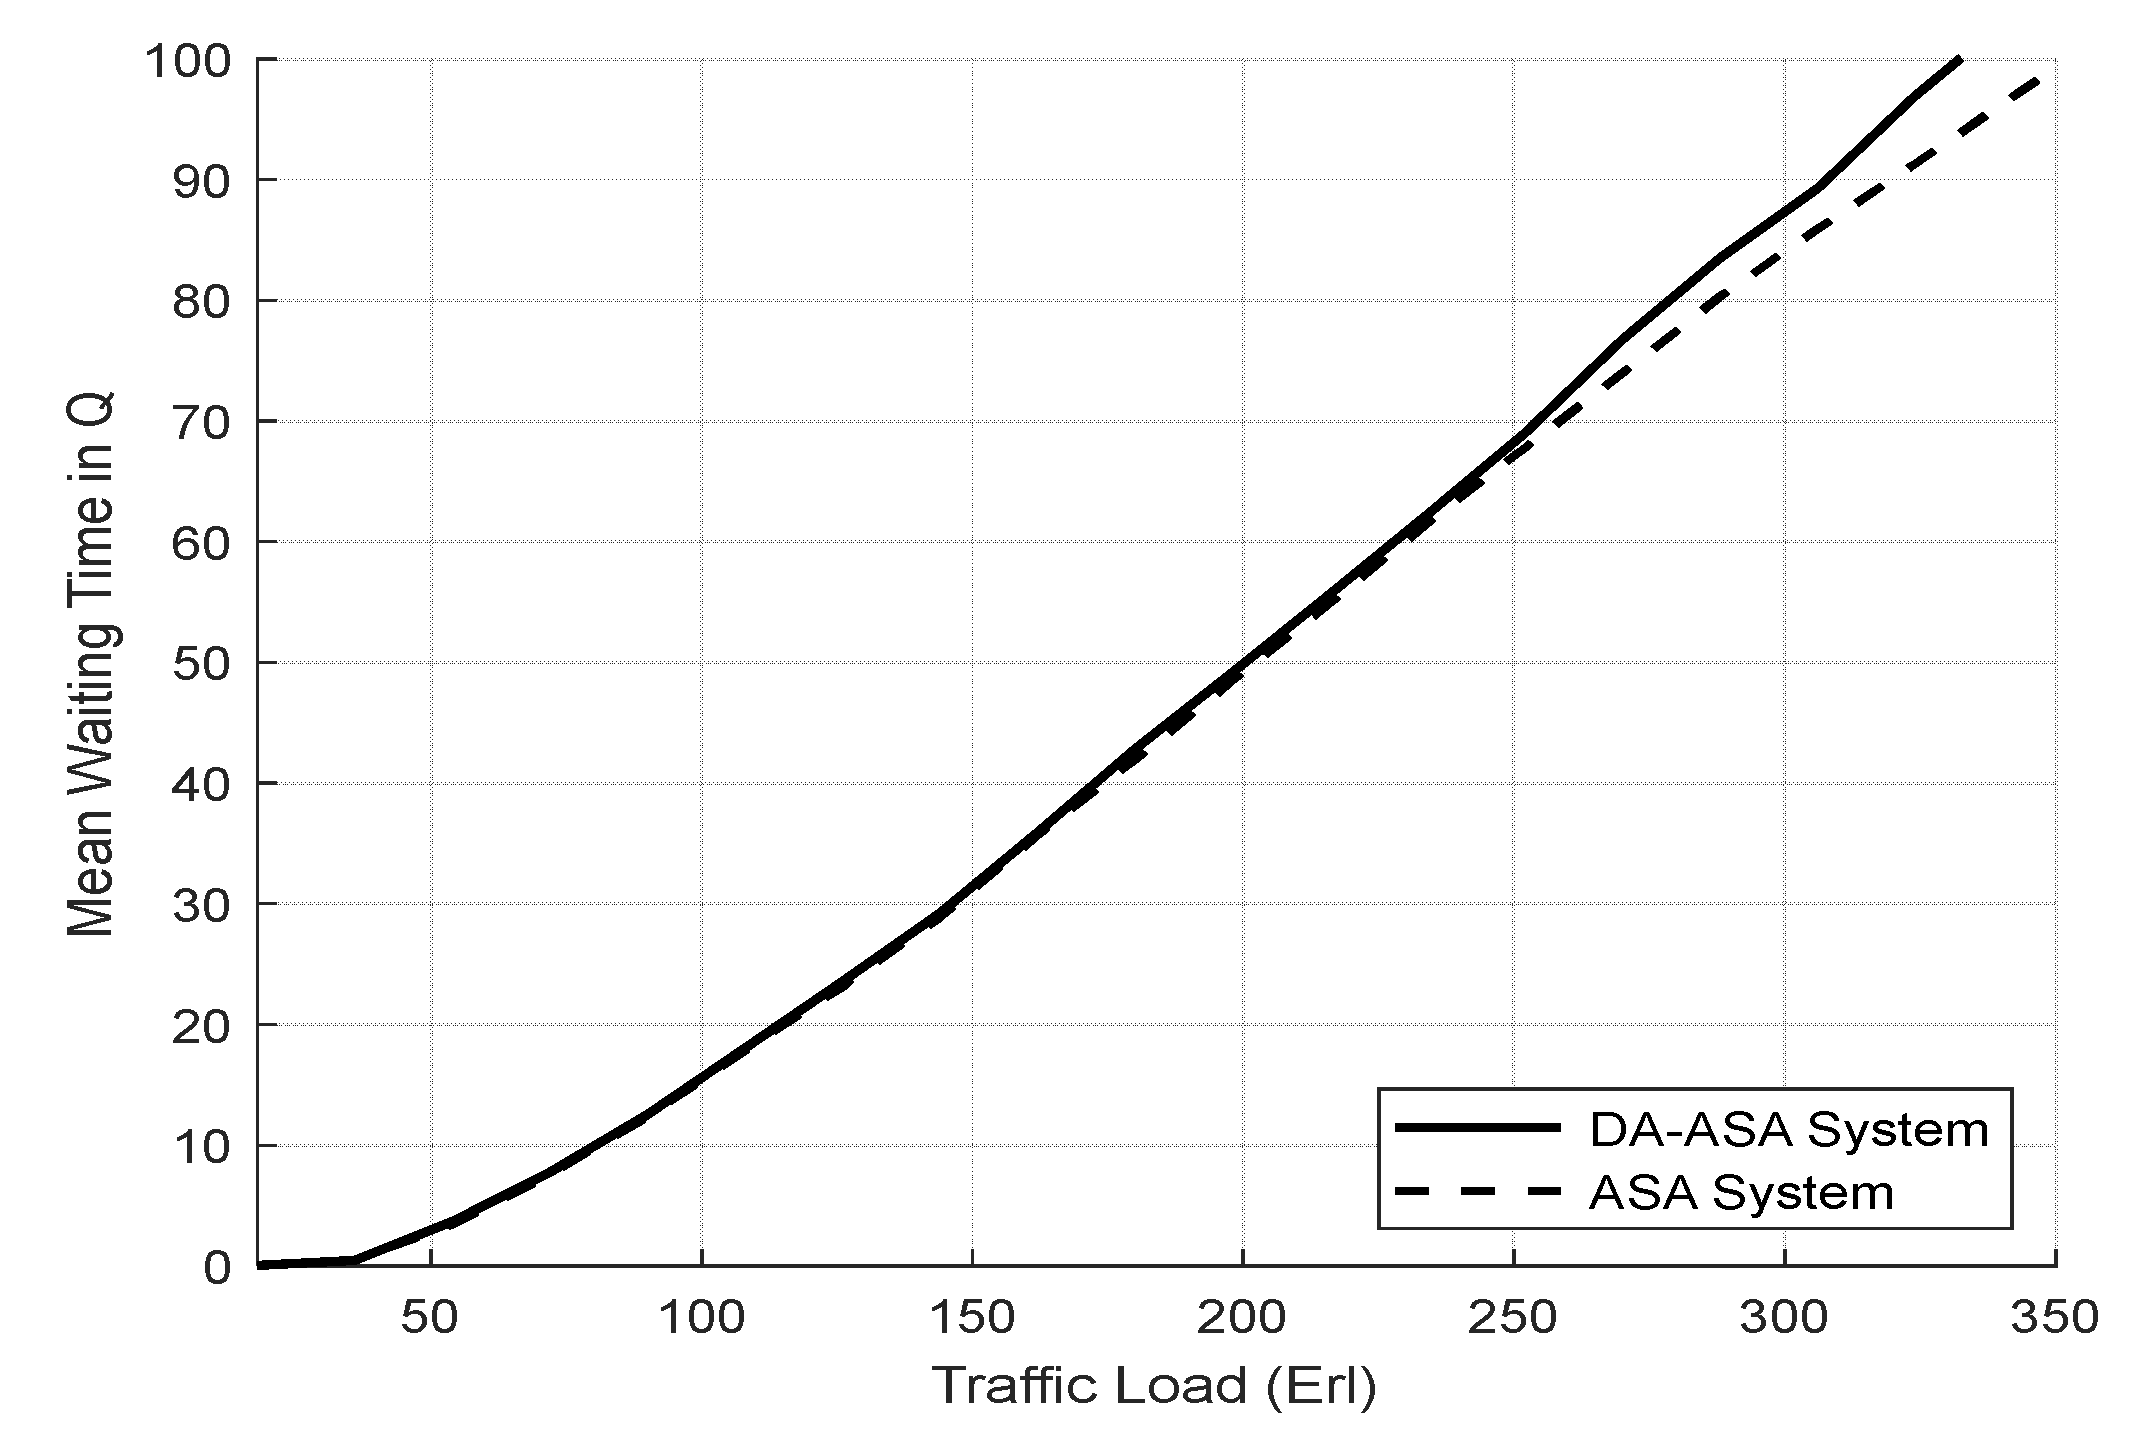
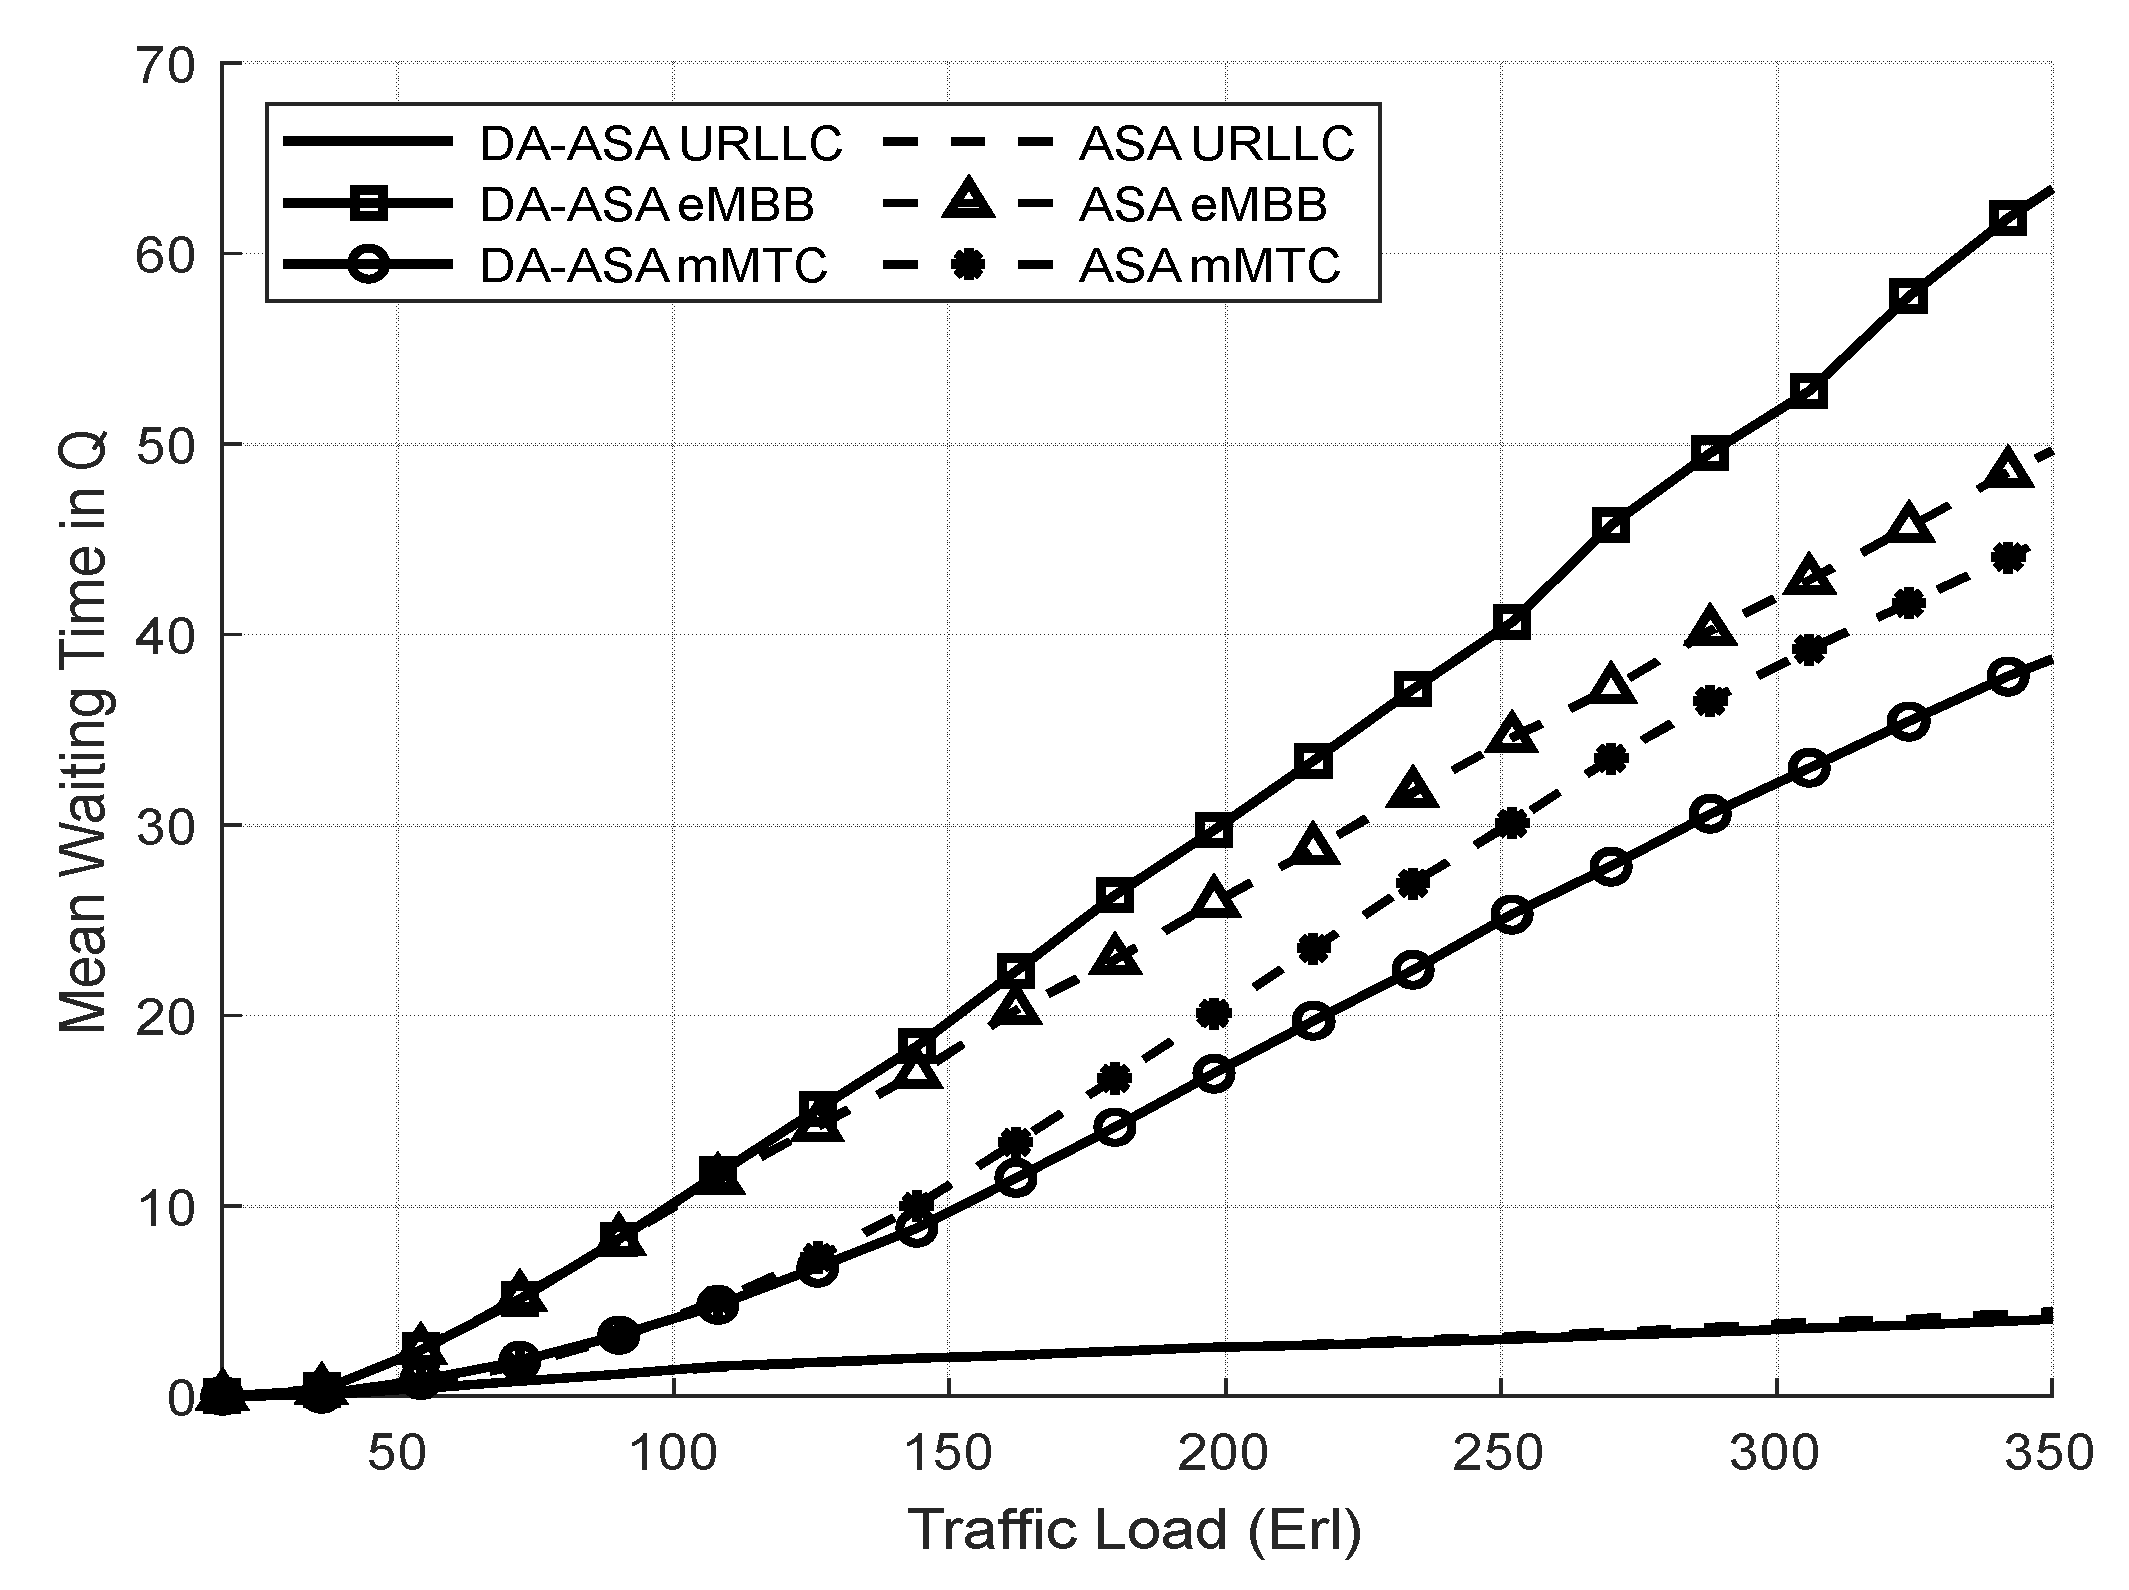
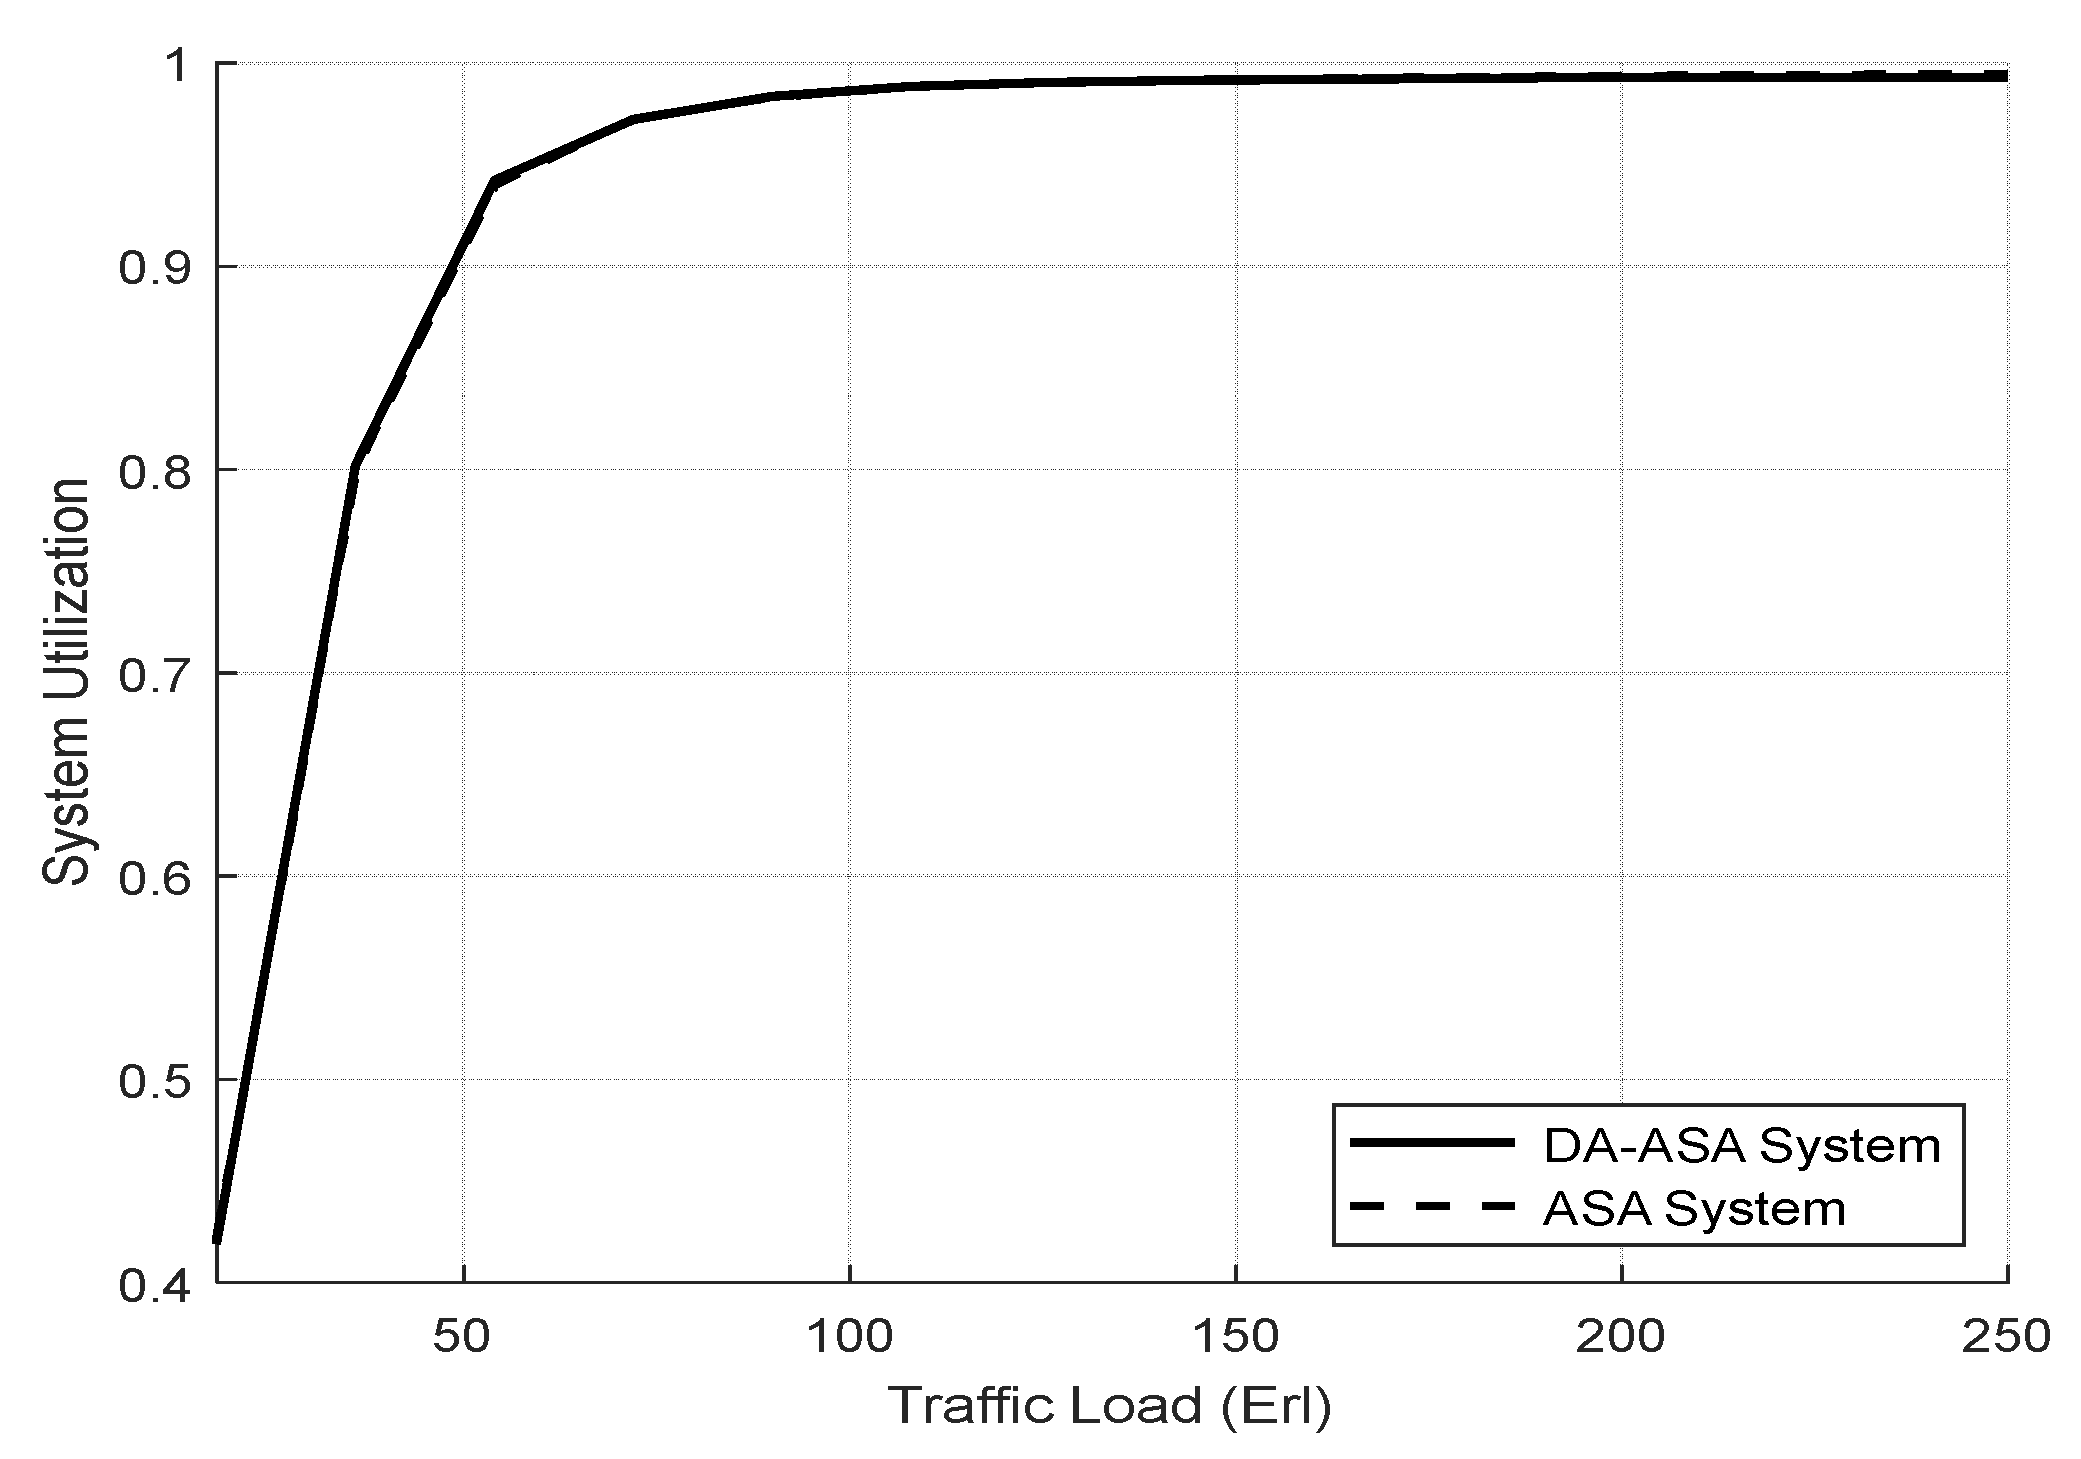
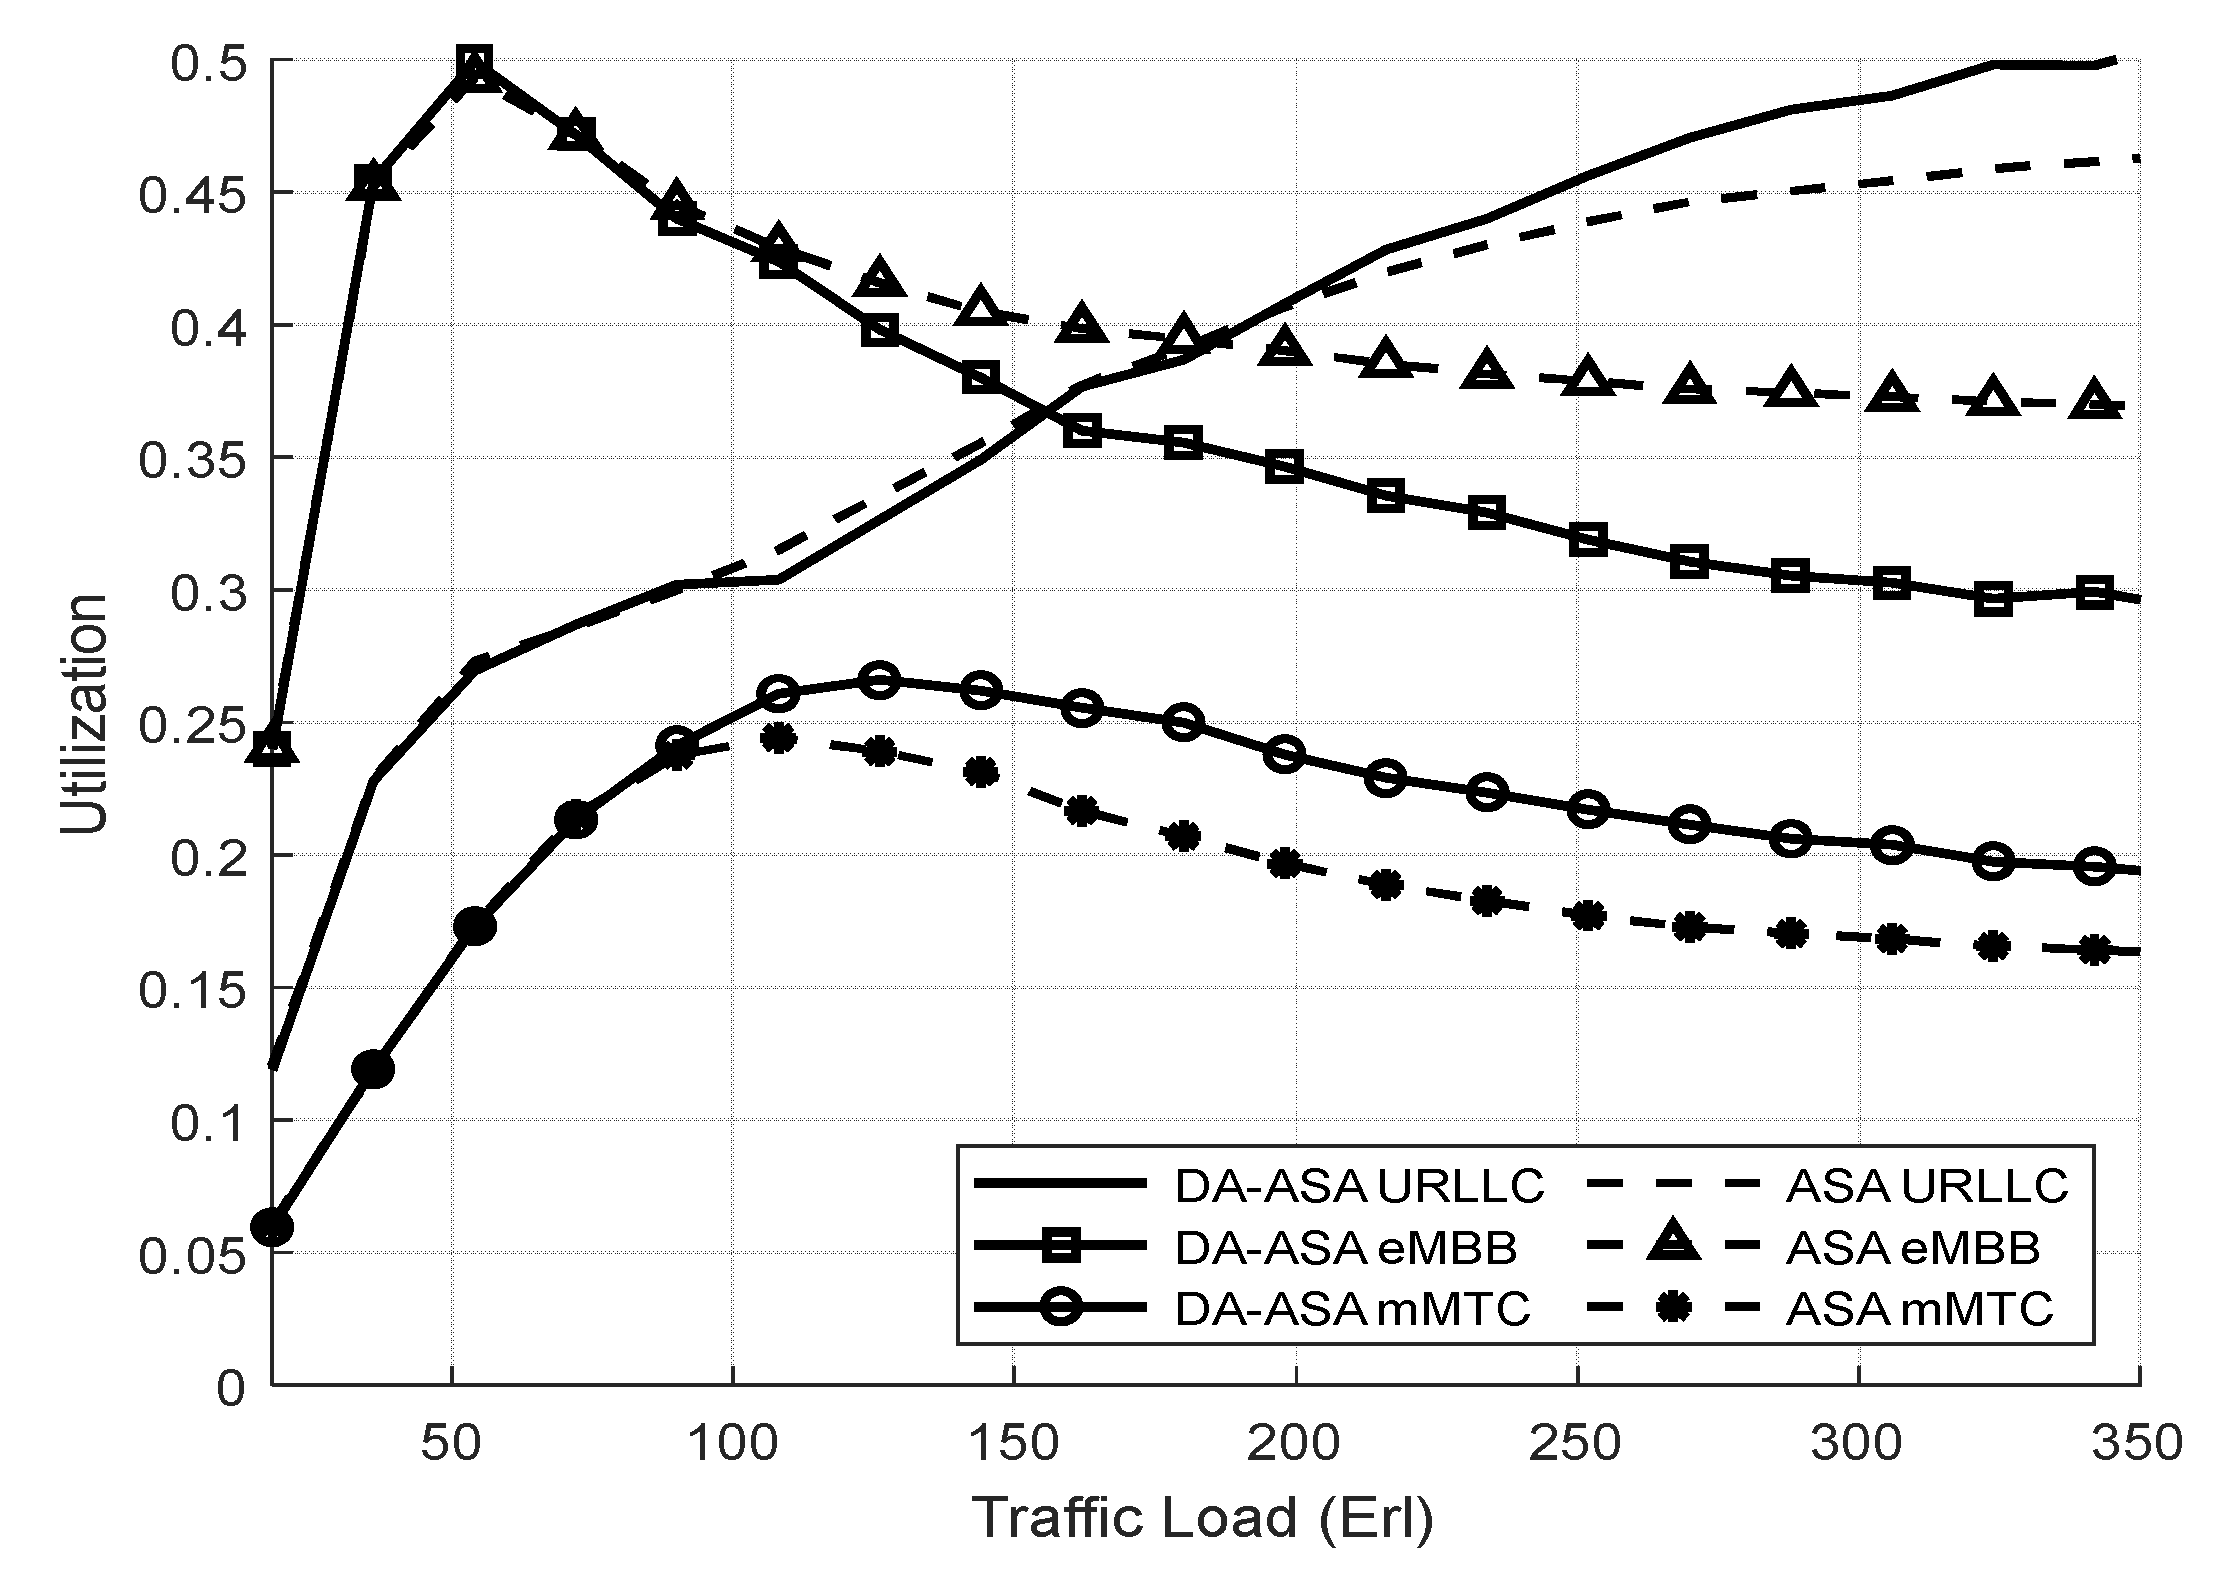
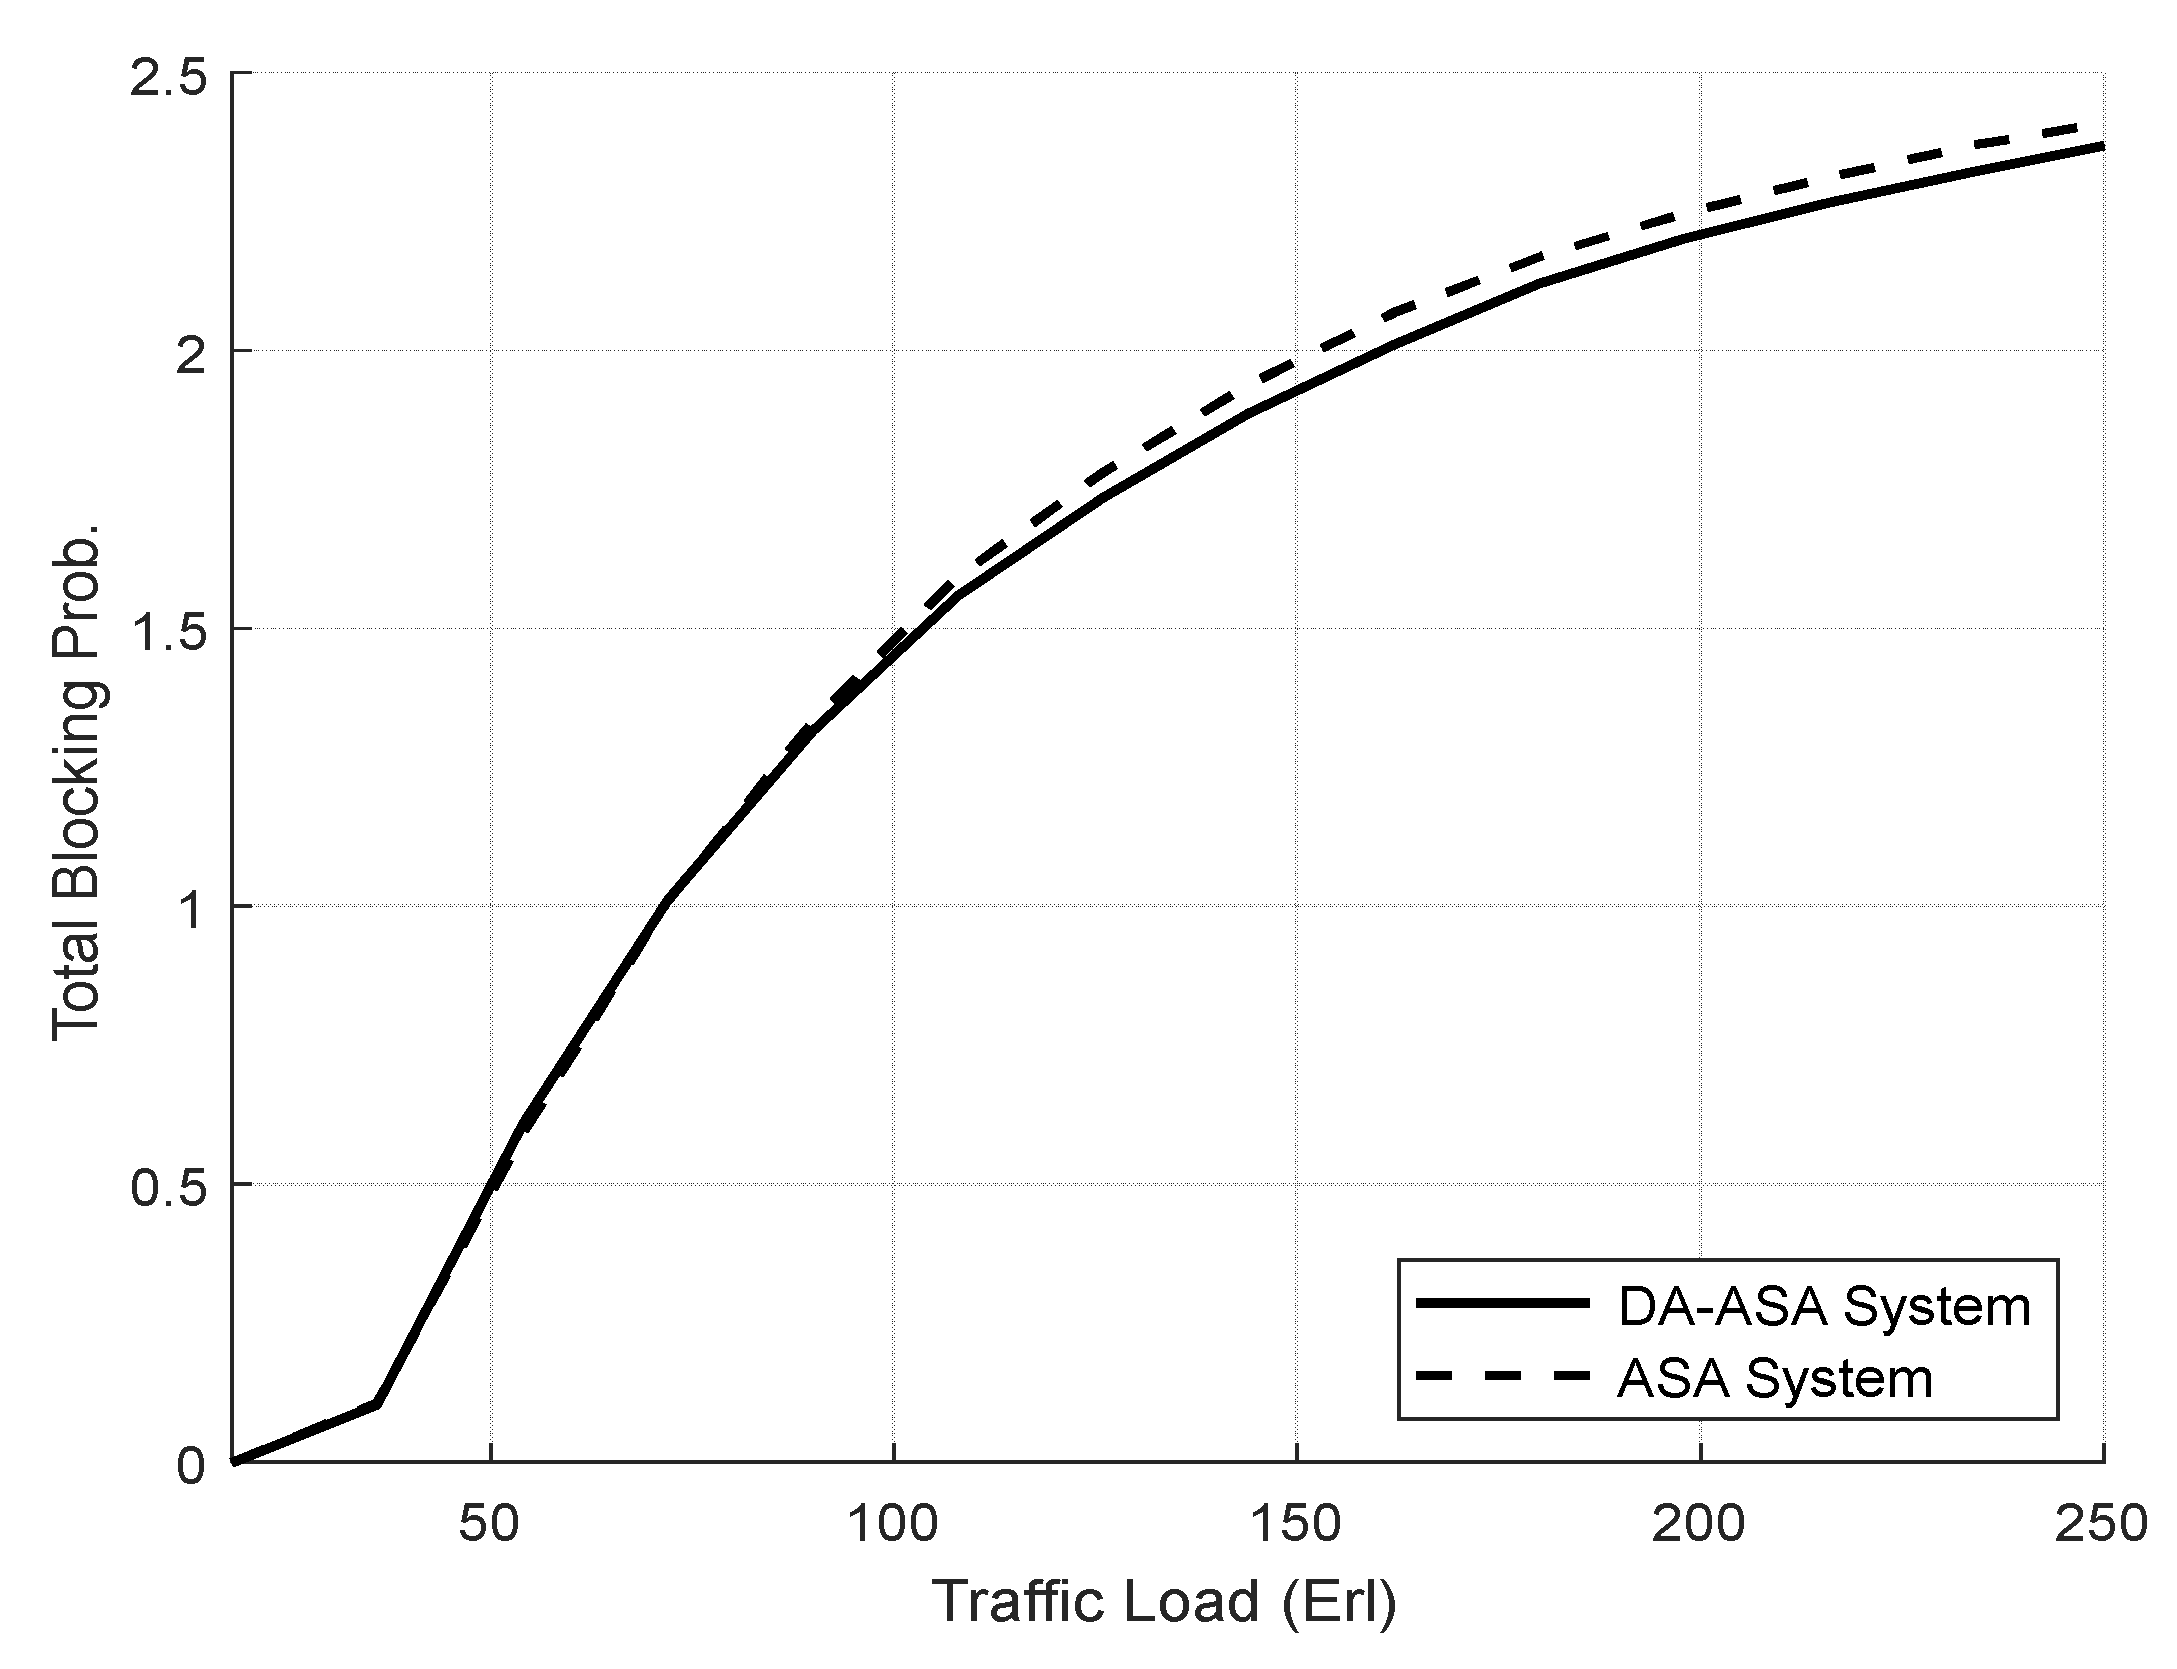
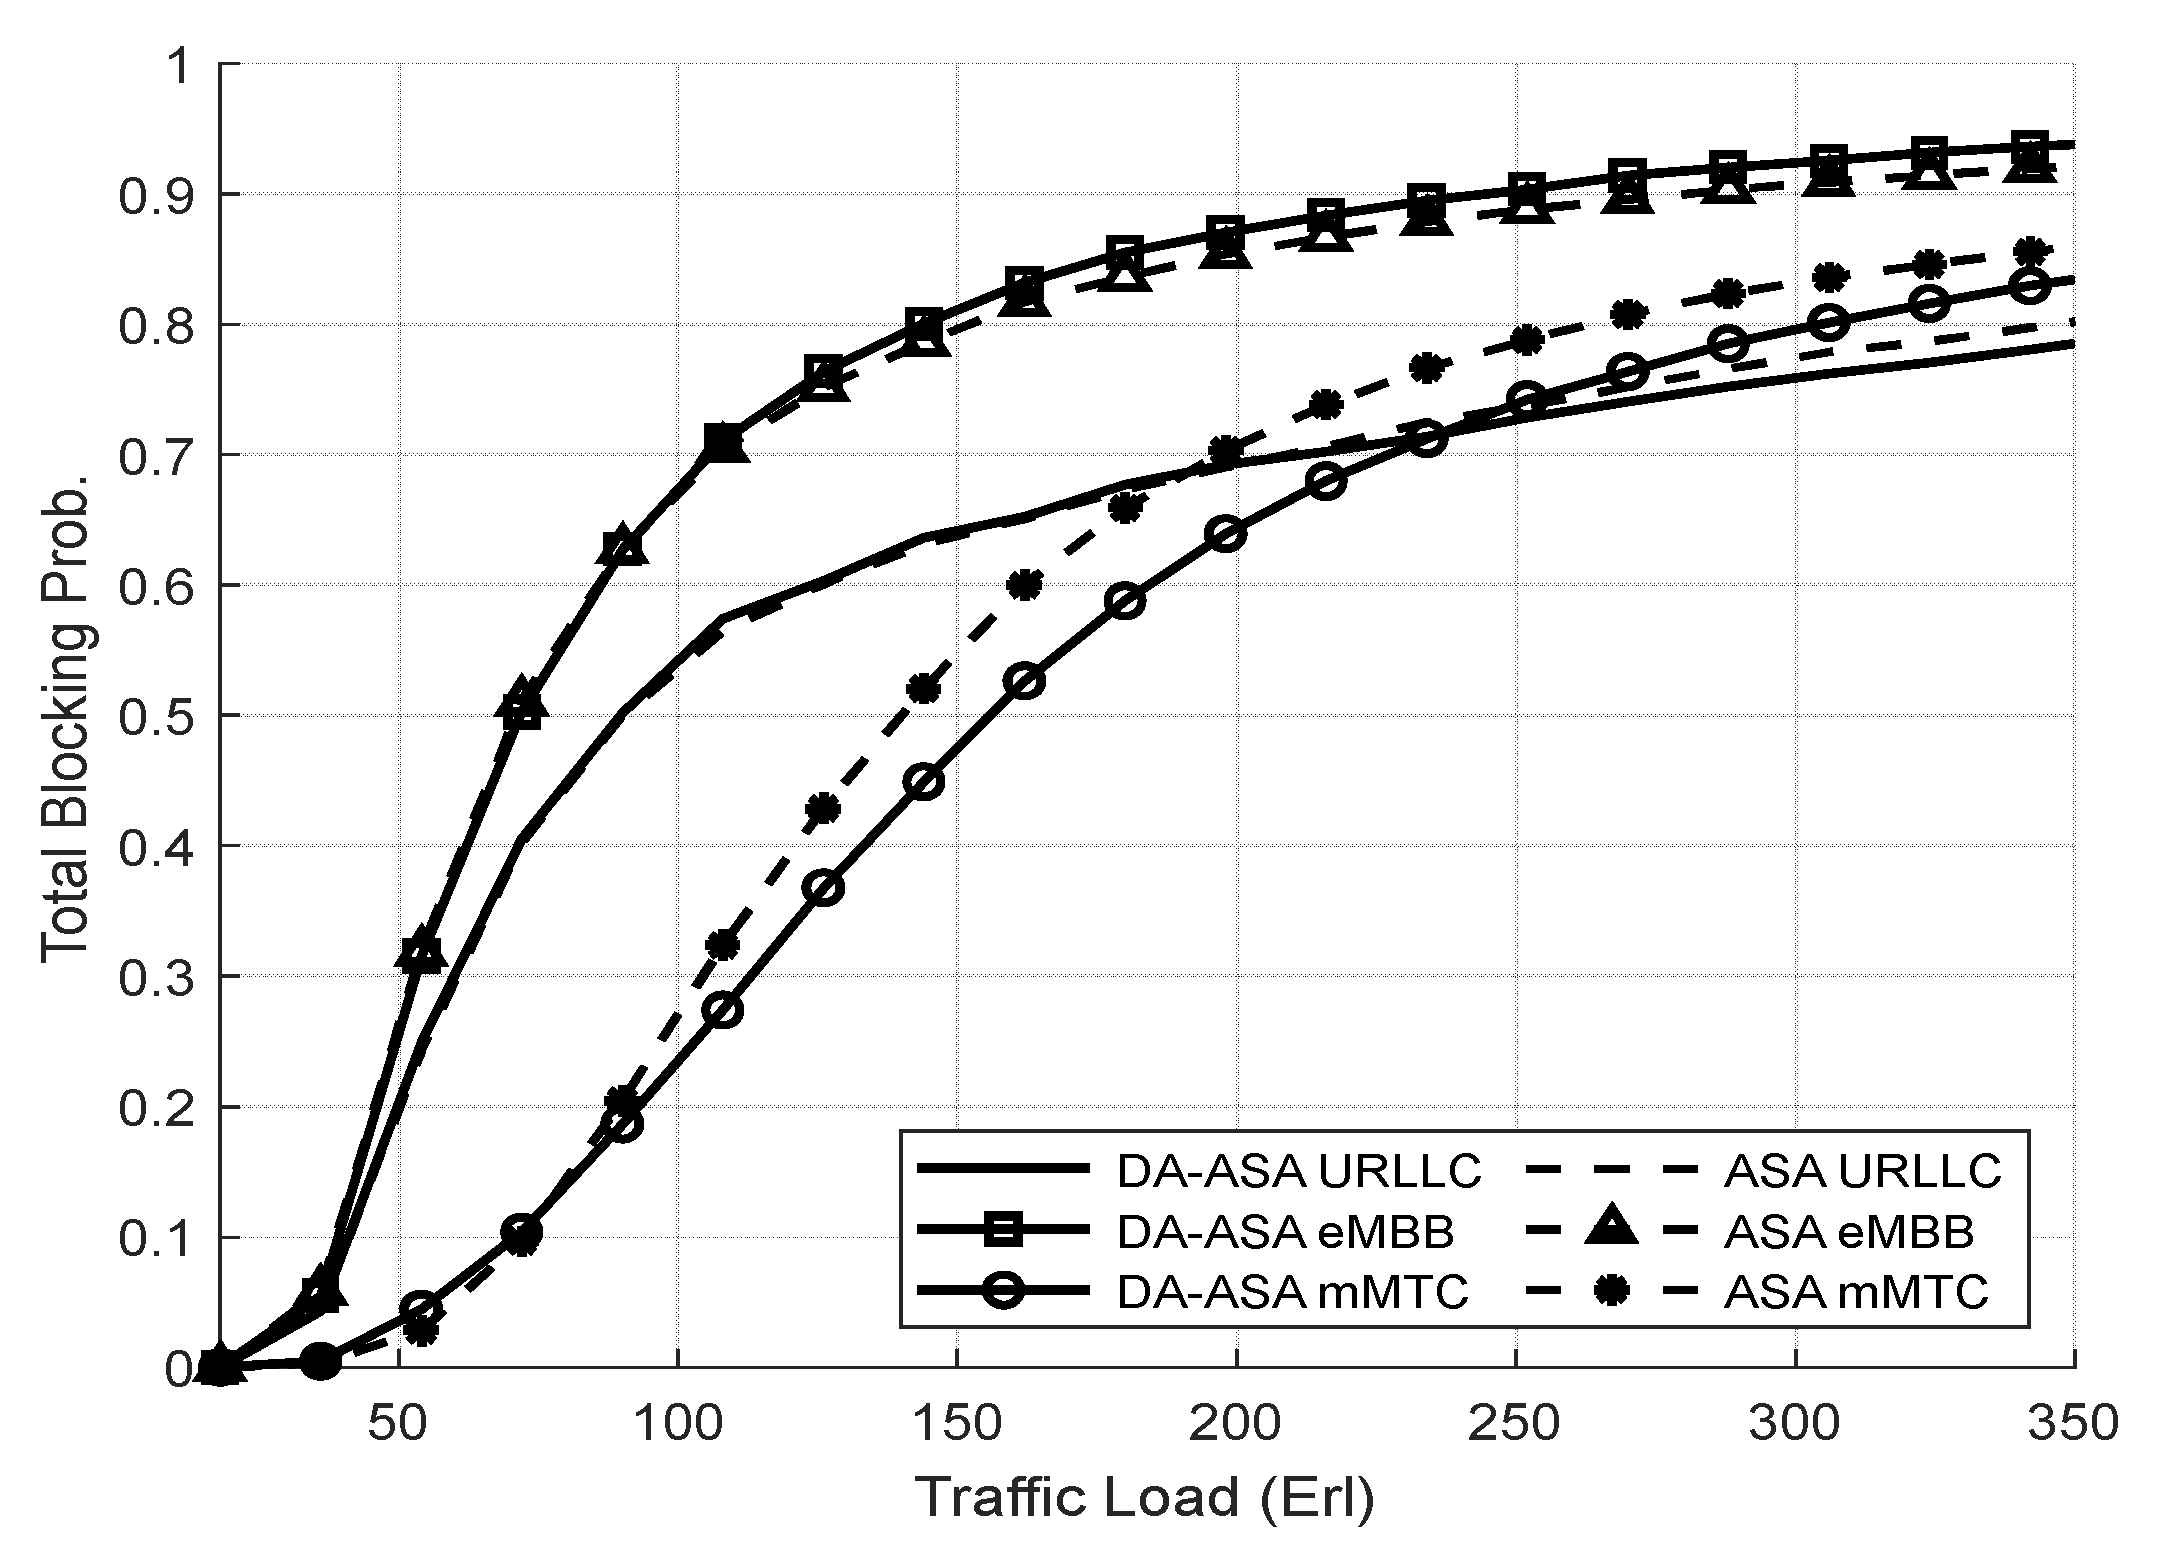
4.3.2. Evaluation Result of the Delay-Aware on the Adaptive Slicing System

In the second experiment, we examine the impact of the delay-aware ASA (DA-ASA) system, which adds a maximum tolerable delay ( M T D i ) factor to the ASP Equation (17) for each slice. We use the ASA system as a reference to compare it with the DA-ASA system. As previously stated, the URLLC slice has the highest priority, the eMBB has a medium priority, and the mMTC slice has the lowest priority.
The ASA system adaptively adjusts the priority of each slice by applying the ASP Equation (16). Moreover, in the DA-ASA system, the priority of each slice is adaptively modified using the ASP Equation (17). We exploit the parameters listed in Table 9 and Table 10 unless otherwise specified. We display the performance measures of each slice as a function of total system’s traffic loads. Then, we investigate the similarities and differences between DA-ASA and the ASA.
Figure 14 shows the total system utilization of both systems. DA-ASA and ASA achieve full system utilization due to similarities in their functions. Figure 15 shows the resource utilization of the network slices. The DA-ASA slightly increases the utilization of the URLLC compared to the ASA. In addition, since the mMTC slice has the lowest priority, it has a small portion of the available resources.
When the mMTC requests wait longer to be served, the M T D i parameter of mMTC in the ASP equation will increase its priority, which will allow it more access to resources. Therefore, the DA-ASA increases the utilization of the mMTC compared to the ASA, particularly at high traffic loads (i.e., above 160 Erl). However, the improvement of the mMTC utilization in DA-ASA comes at the expense of a slight decrease in eMBB utilization in comparison to ASA.
Figure 16 illustrates the average waiting time of both systems. At low-to-moderate loads (i.e., 50–250 Erl), the average waiting time of the DA-ASA is almost equal to the ASA. However, at high traffic loads (i.e., above 260 Erl), the average waiting time of the DA-ASA is slightly higher than that of the ASA due to the increase in the average waiting time of the eMBB.
Figure 17 shows the average waiting time of the network slices in both systems. the average waiting time of the URLLC is the same in both systems. In addition, we notice that the average waiting time of the mMTC in DA-ASA is lower than the ASA. As the traffic load increases, the requests of the mMTC slice, which has the lowest priority, must wait longer for services since there are limited resources. The ASP value of the mMTC in DA-ASA decreases as the difference between the M T D i and the current delay of mMTC request decreases. Therefore, in DA-ASA, when the ASP value of the mMTC request decreases, its priority in obtaining the service increases. However, the eMBB in the DA-ASA has a longer average waiting time compared to the ASA due to the increase in resource consumption from the mMTC.
Figure 18 illustrates the TBP of both systems. The DA-ASA achieves a slight decrease in the TBP compared to the ASA. Figure 19 shows the TBP of the network slices in both systems. The DA-ASA slightly lowers the TBP of the URLLC in comparison to the ASA, particularly at high traffic loads. The DA-ASA increase the mMTC priority, which enables more admission of its requests. Therefore, The DA-ASA lower the TBP of mMTC compared to the ASA. Consequently, The DA-ASA slightly increase the TBP of the eMBB in comparison to the ASA.
We can conclude that the DA-ASA improves the performance of the mMTC, which is the lowest priority slice by increasing its chance in obtaining service. When the current delay, D i , of the mMTC requests approaches its maximum delay, M T D i the the value of M T D i D i will become very small and will result in a very low ASP value, which will increase its service priority. Therefore, the DA-ASA achieves greater fairness between the slices by increasing the performance of the mMTC slice. In addition, it adds a slight enhancement to performance of the URLLC compared to ASA.
The results indicate that the addition of the M T D i factor in the DA-ASA serves an additional role in enhancing QoS requirements for the URLLC and mMTC slice. Moreover, this enhancement comes at the cost of a slight degradation in eMBB performance compared to ASA. However, this improvement does not lower the performance measures of eMBB slice below the mMTC slice’ performance. the performance measures of eMBB slice’ traffic is still better than that of mMTC slice’ traffic using both schemes. Additionally, the ASP value in both systems maintain slice isolation by preventing traffic from one slice from adversely affect the service of other slices, particularly in the case of URLLC slice.

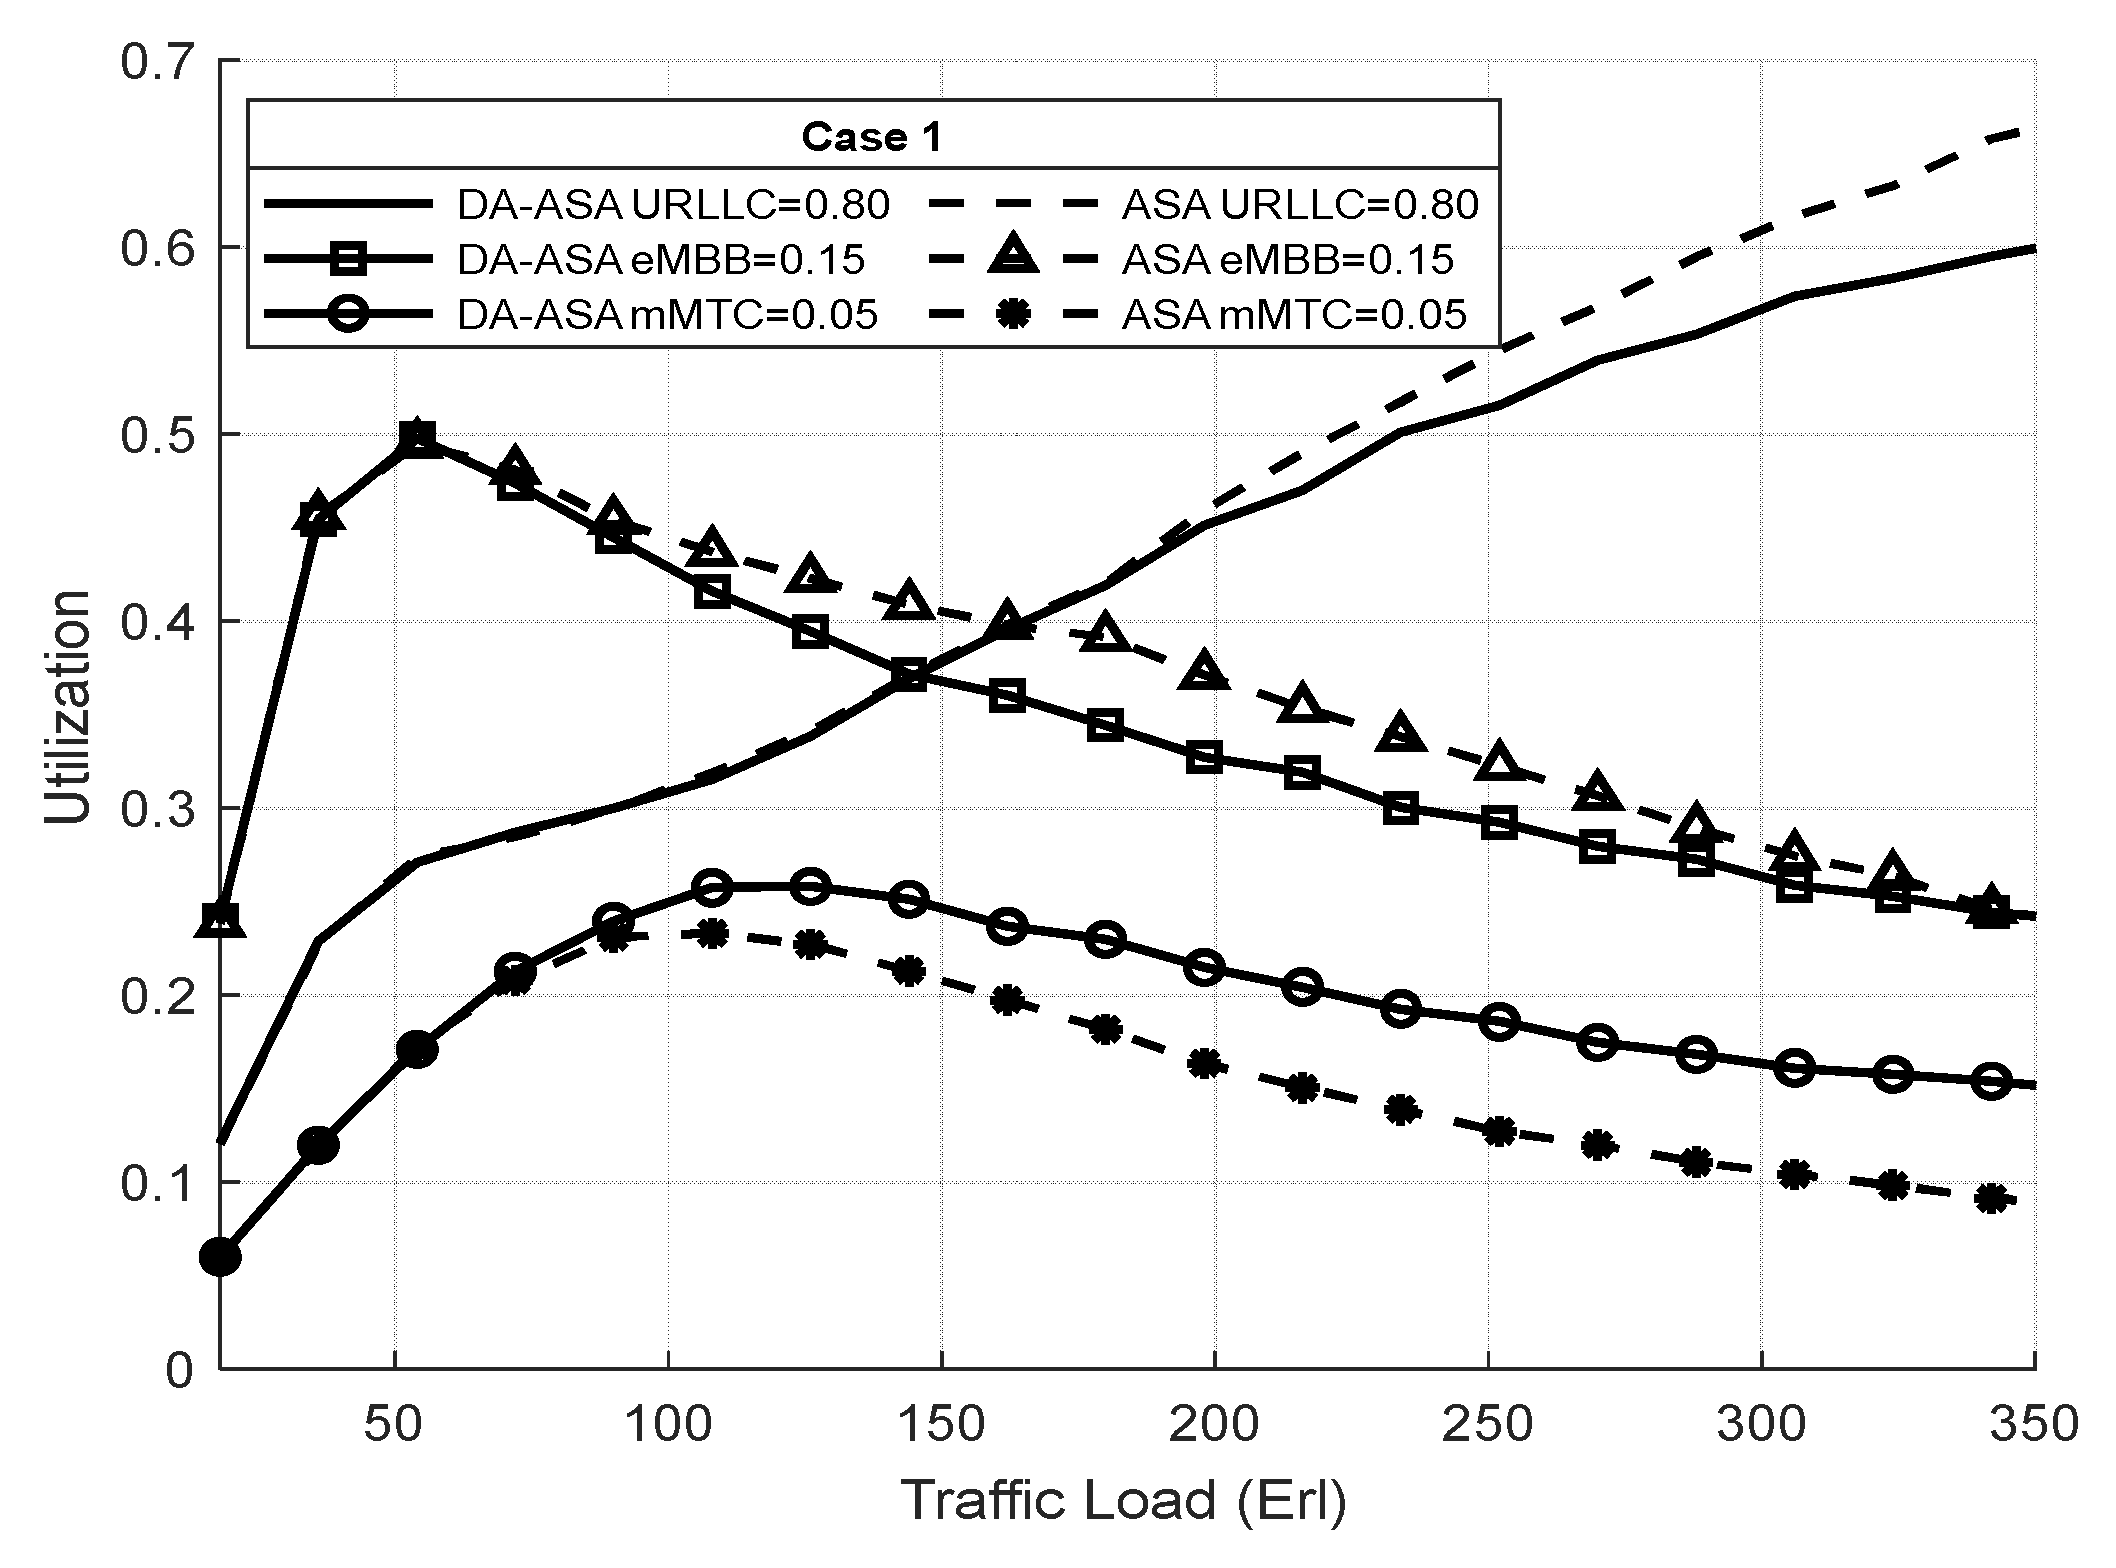
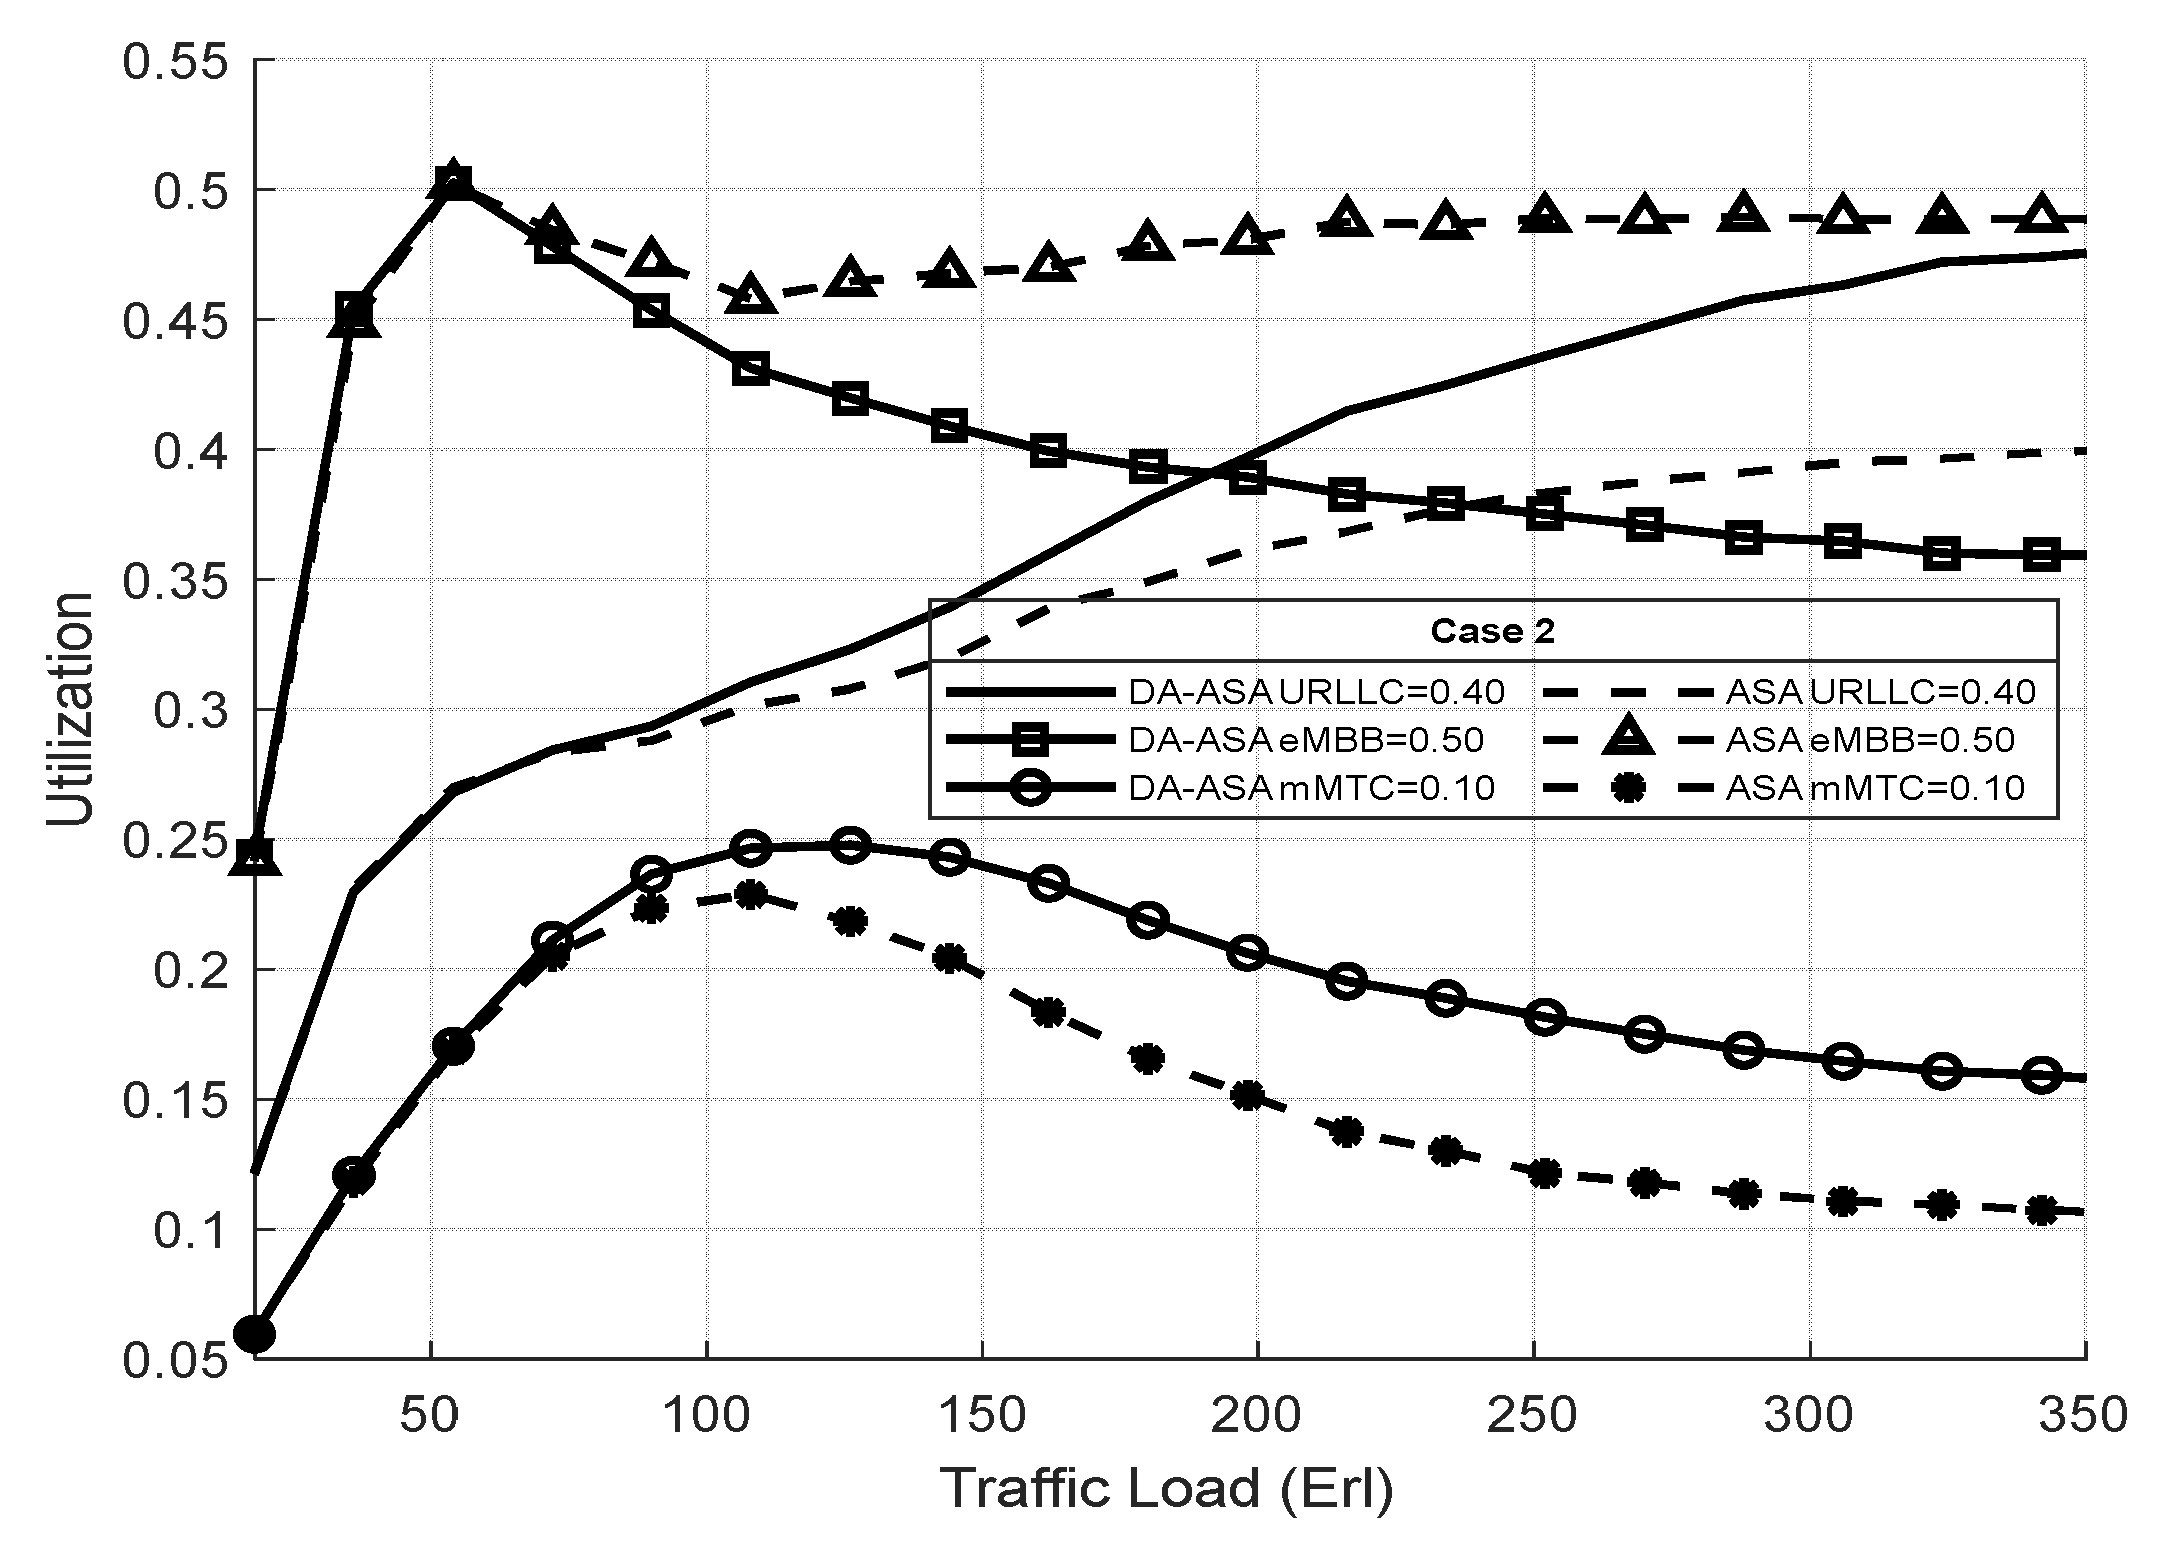
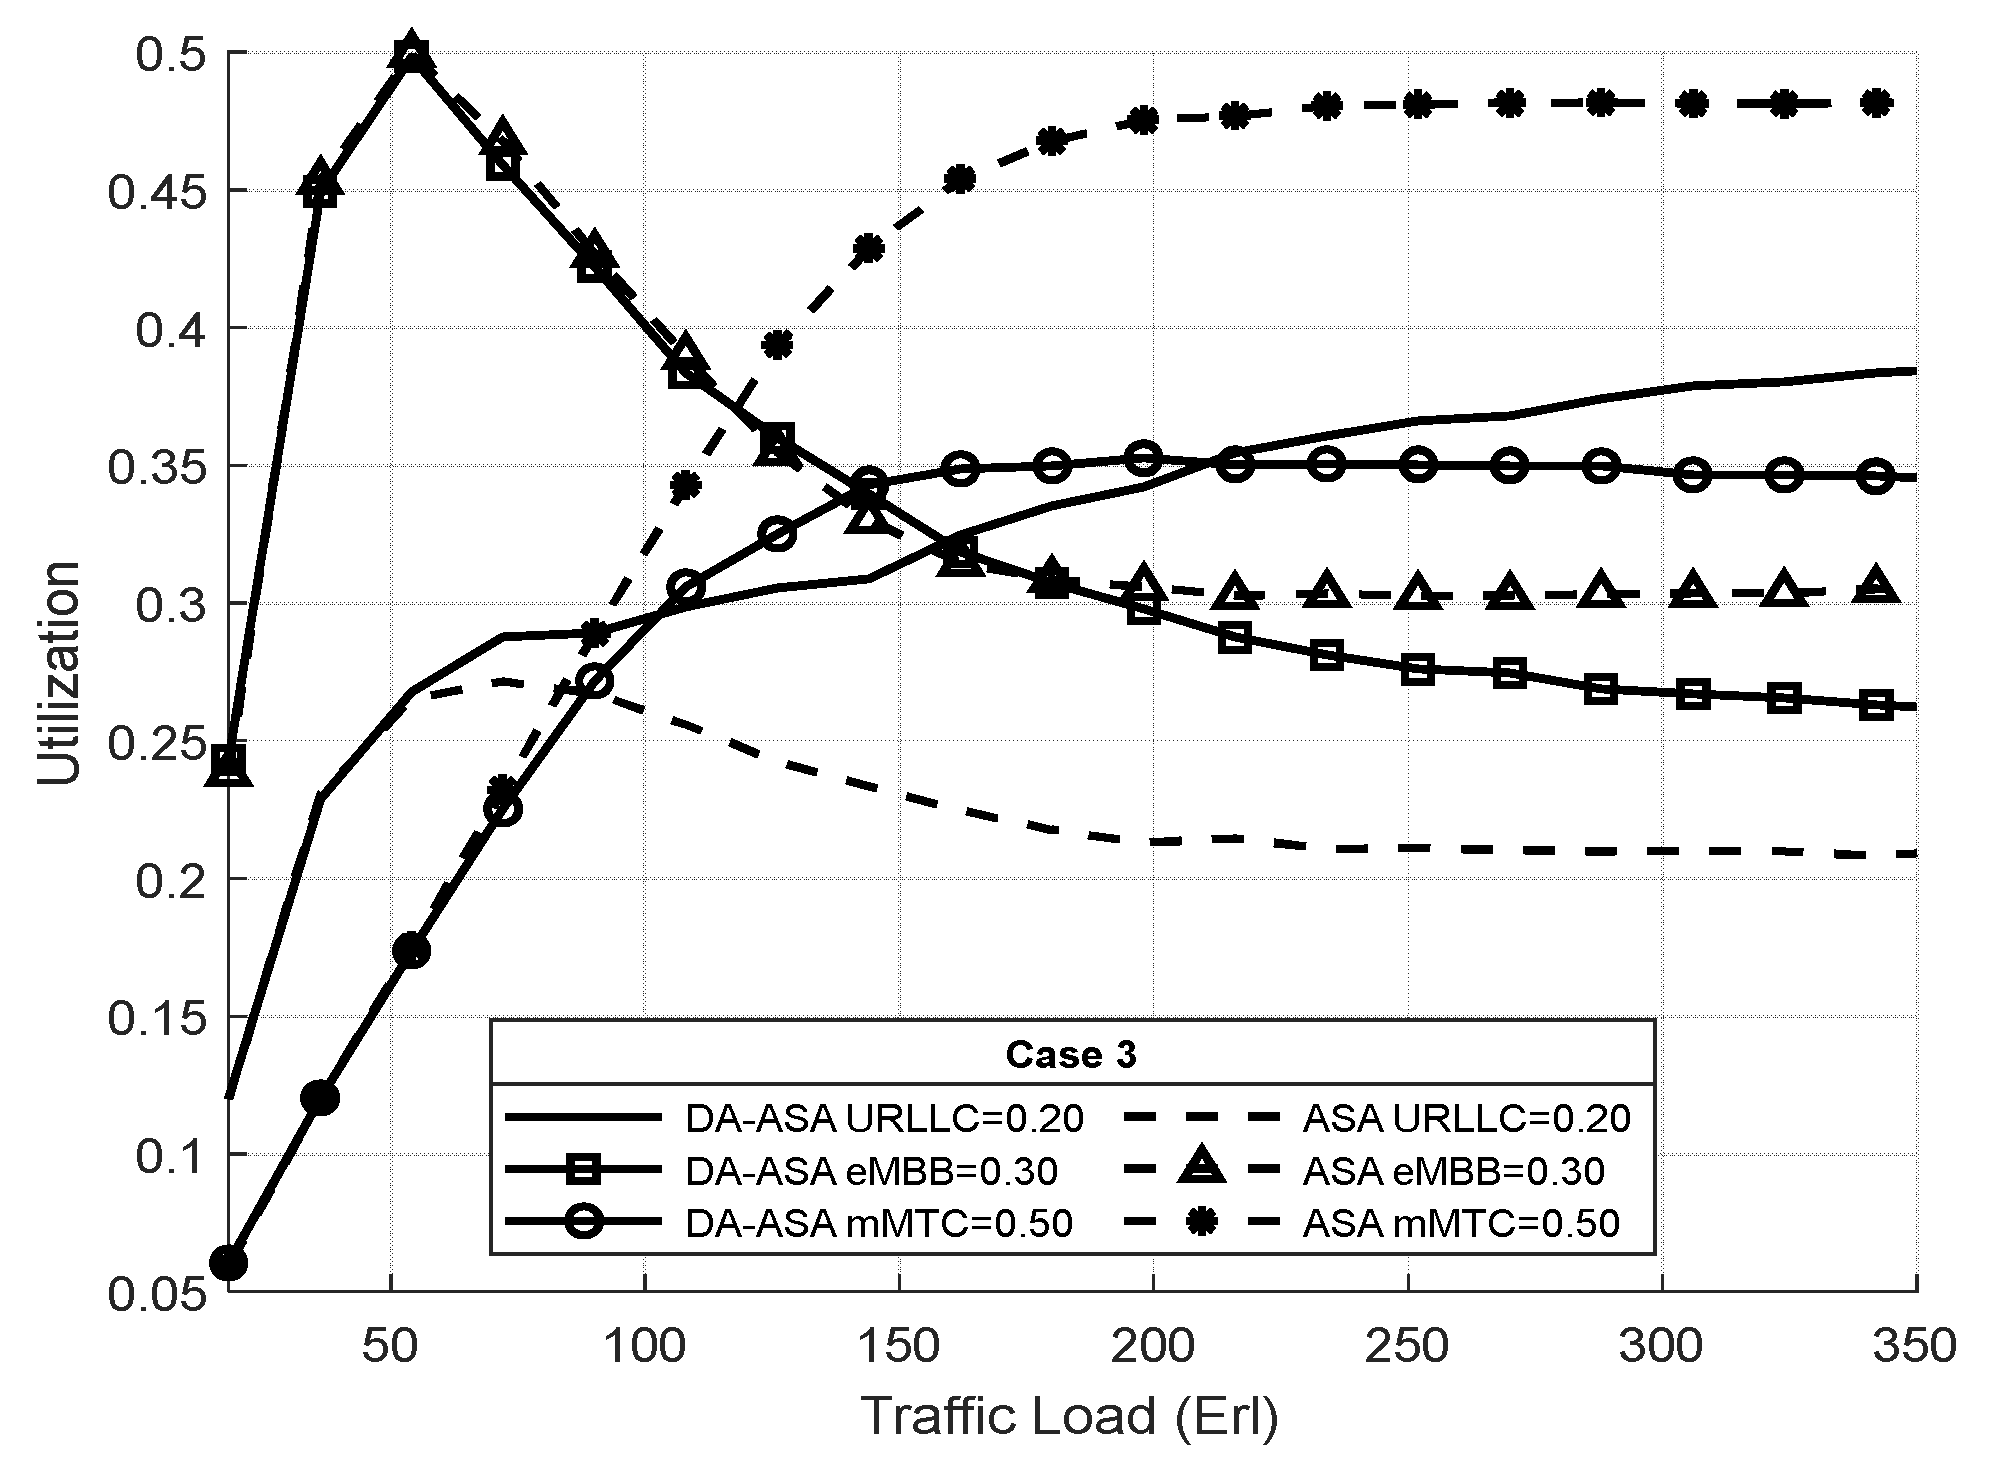
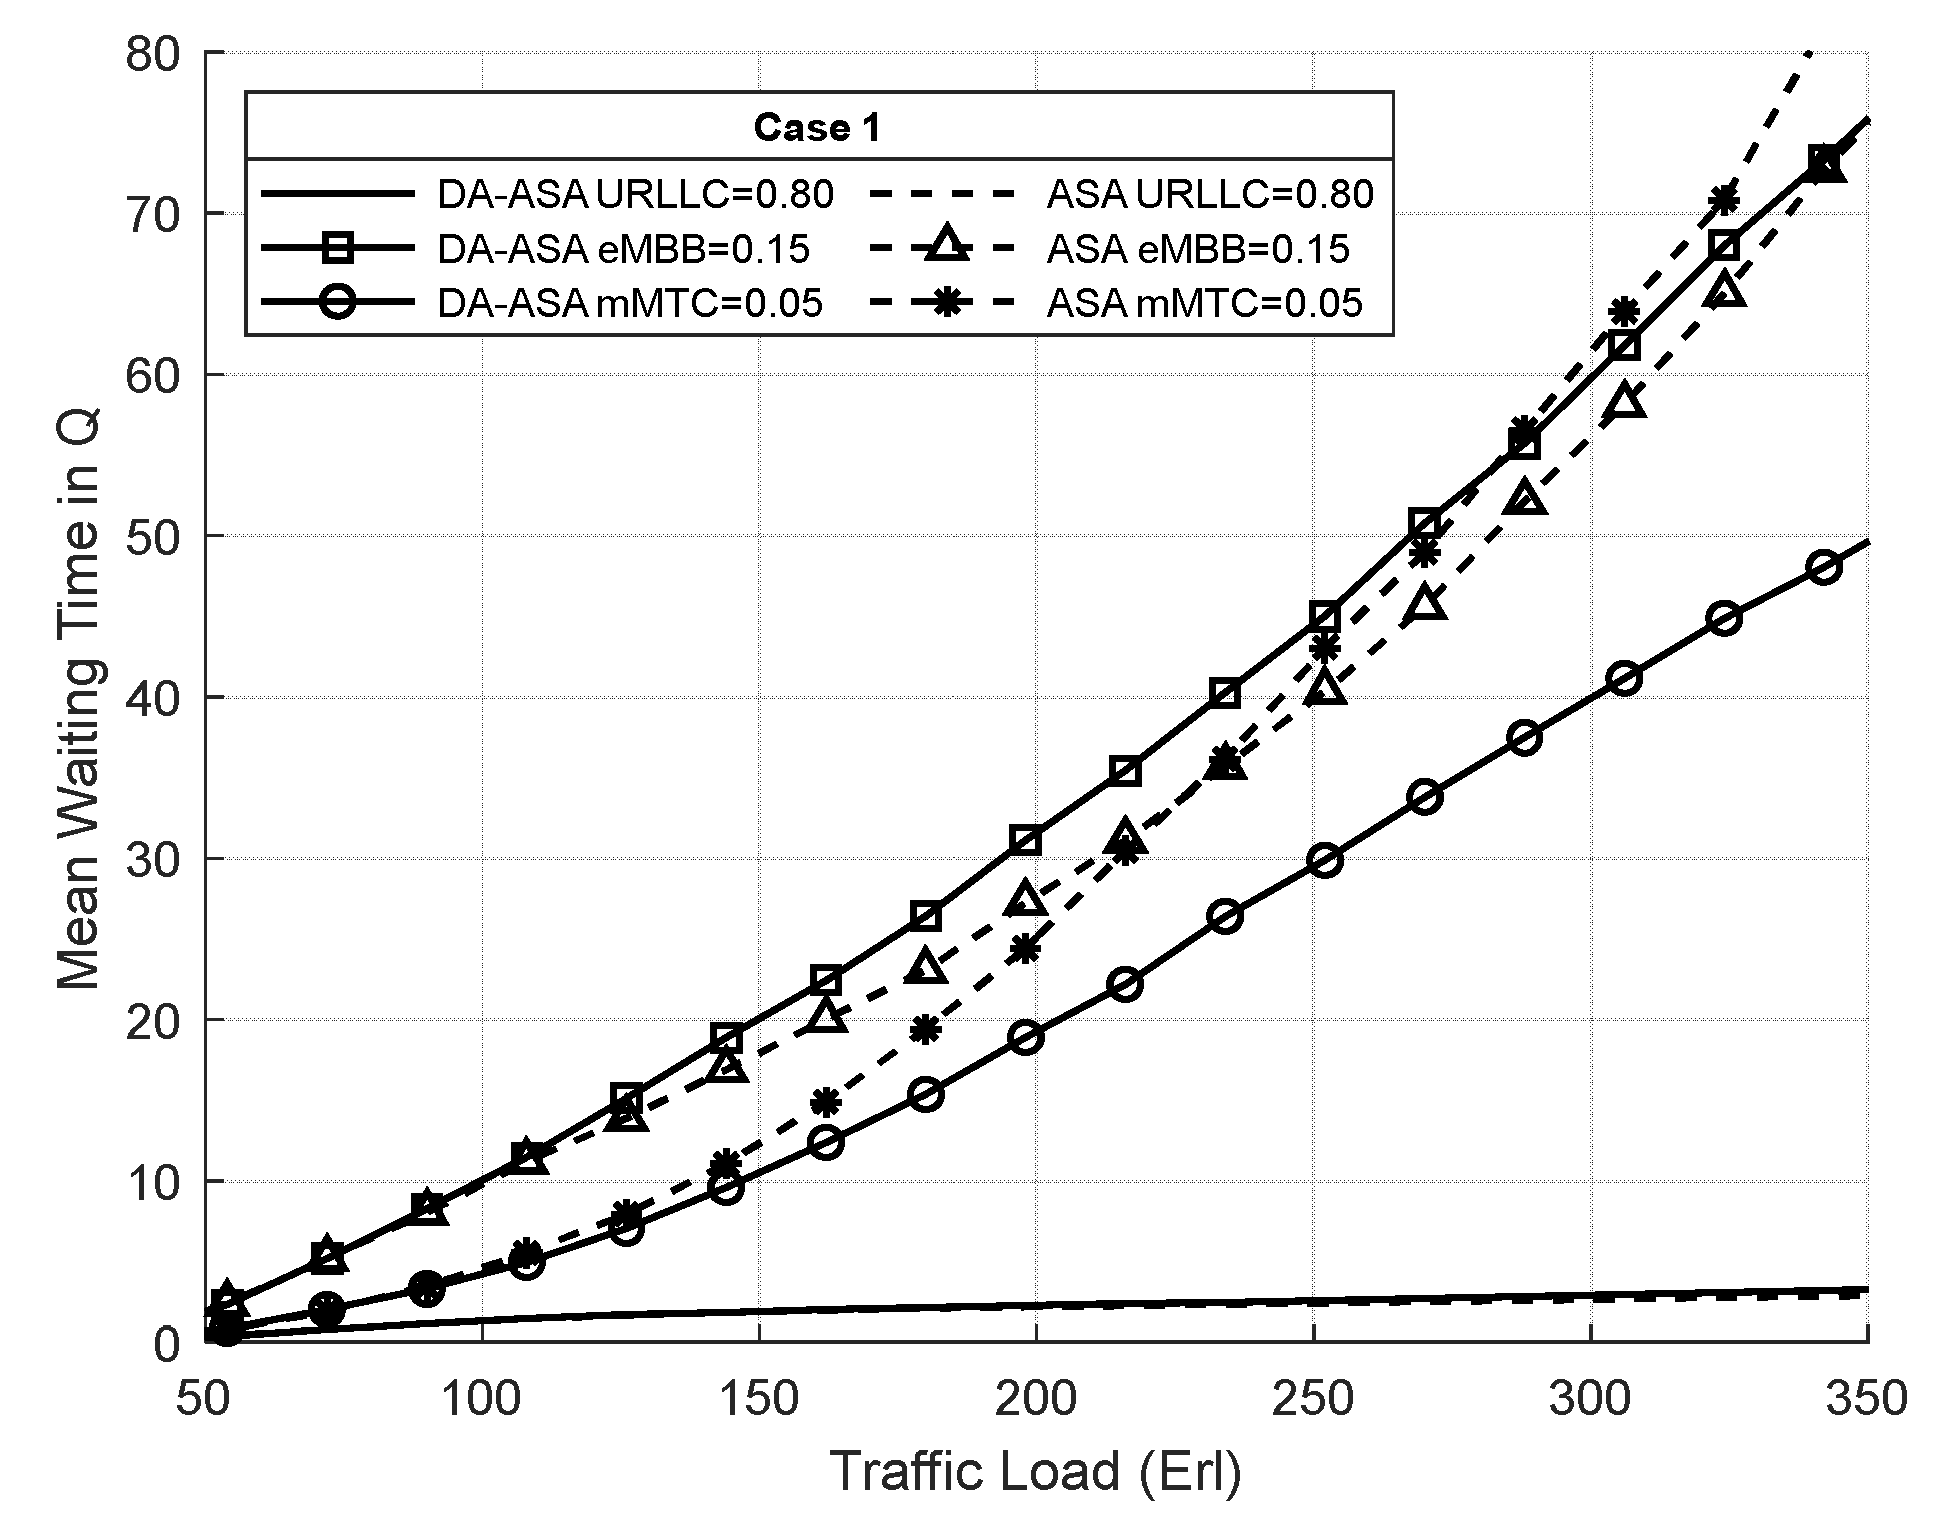
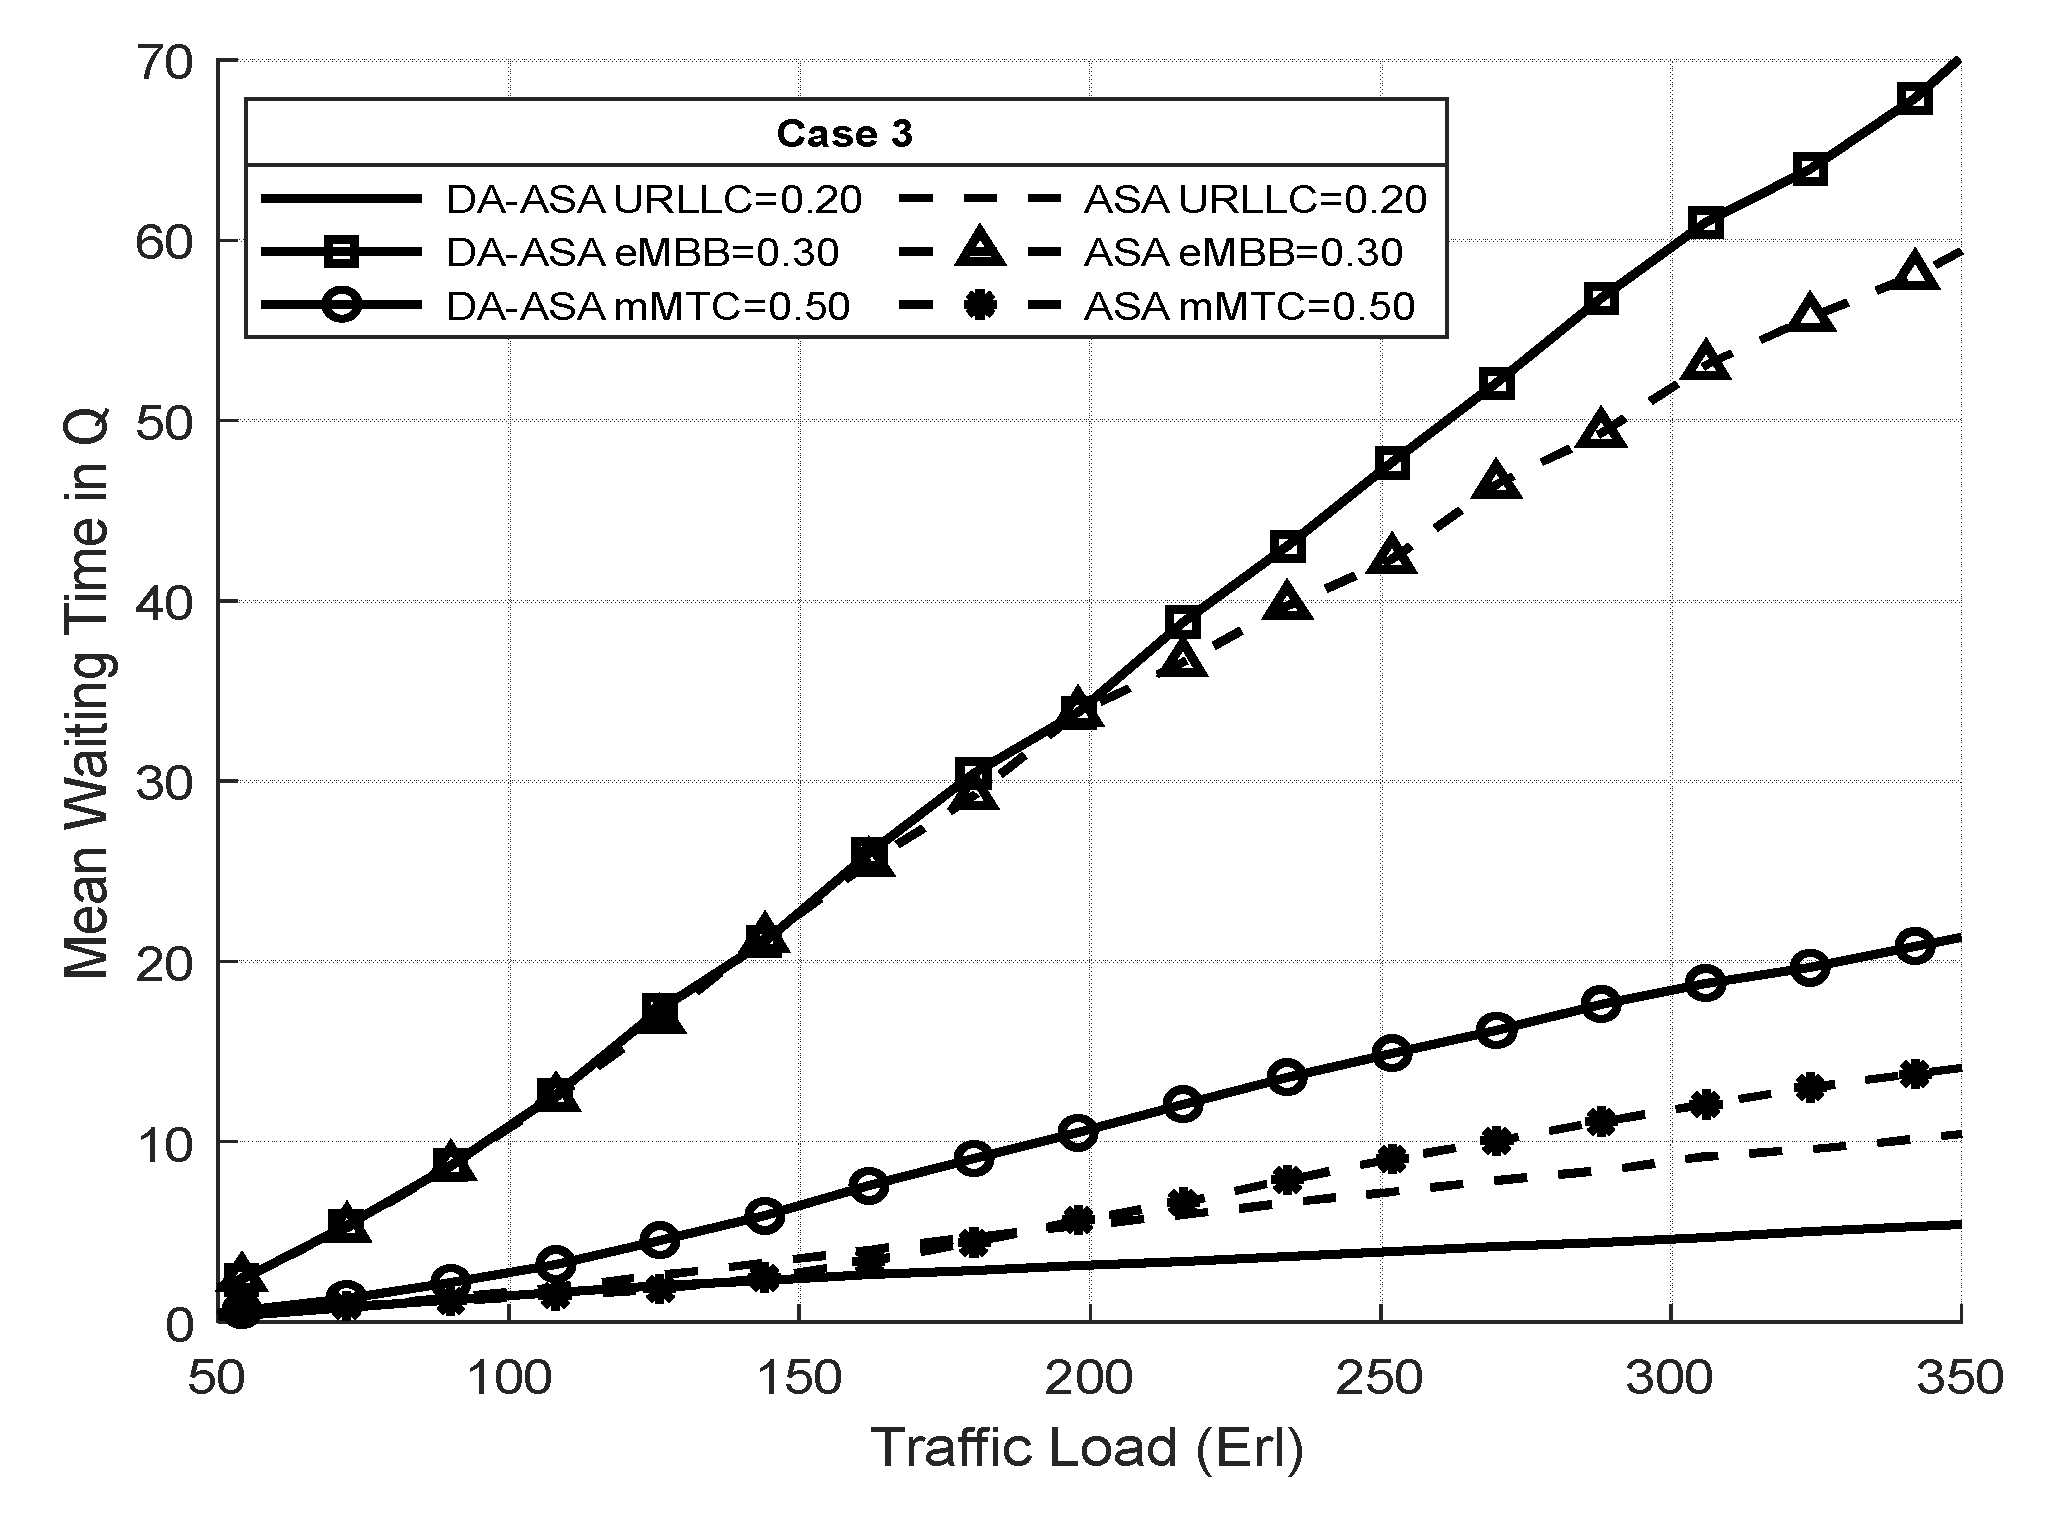
4.3.3. Evaluation Result of the ASA and the DA-ASA with Different Priority Ratio

In the third experiment, we examine the effect of changing the slices’ priority ratios to give one slice preferential consideration over the others in our proposed DA-ASA and ASA systems. Each slice’s virtual resource partition is predefined dynamically based on its priority ratios. In our proposed DA-ASA and ASA systems, the priority ratios of the slices are defined and estimated by the service provider (operator) according to the target revenue and the importance of the slice traffic. The slice’s traffic with the higher ratio has the higher priority.
We exploit the parameters listed in Table 9 and Table 10, expect we consider three cases in which the slices have different priority ratio. Table 11 shows the specified priority ratios of the slices in each case. The P U R L L C ratio is used to determine the level of URLLC priority. The P e M B B ratio is used to determine the priority level for eMBB. The P m M T C ratio is used to determine the priority level for mMTC. In fact, the parameter values selected for the priority ratios will play the most significant role in delivering the performance outcomes required by each slice.
To investigate this issue more, we compare and evaluate the outcomes of the three cases with varying priority ratios in both systems. In the first case, we assume that the URLLC slice has a high traffic load and requires more RBs than the other slices, so we give it a high priority ratio value. Moreover, in the second case, the value of URLLC’s priority ratio is reduced to give the eMBB and the mMTC slices a greater chance of obtaining service. Alternately, in the third case, we further decrease the value of URLLC’s priority ratio to provide high priority ratio the mMTC slice, giving it precedence over the URLLC and eMBB slices.
The status of the performance metrics of each slice depends on the effect of the priority ratio when calculating the ASP (16, 17). Based on the ASP equations shown in Table 5 and Table 7 for both systems, when the URLLC priority ratio, P U R L L C , increases, the ASP value of URLLC traffic decreases while the ASP value of the other slices increases. As the ASP of any slice decreases, the service priority of that slice increases, and hence its performance metrics improve and vice versa.
Figure 20 shows the total system utilization of both systems in all cases. The DA-ASA and ASA achieve full system utilization due to similarities in their functions.
Figure 21 shows the resource utilization of the network slices in case one. The utilization of URLLC is the highest since it has the highest priority. The eMBB has a medium utilization since it has more priority than mMTC. However, the DA-ASA slightly decreases the utilization of the URLLC and eMBB compared to the ASA in order to increase the priority of mMTC and allocate more resource for it. Despite this decline in URLLC performance in the case of DA-ASA, it remains superior to eMBB and mMTC slices in both systems.
Figure 22 shows the resource utilization of the network slices in case two. The utilization of eMBB in the ASA is highest in this case, since it has a 50% priority ratio and consumes a significant number of resources. The M T D i factor of the ASP equation in the DA-ASA increases the priority of the URLLC and mMTC if their requests are delayed. Therefore, the DA-ASA decreases the utilization of eMBB compared to ASA in order to increase the utilization of the URLLC and mMTC.
Figure 23 shows the resource utilization of the network slices in case three. Since mMTC has the highest priority, ASA provides it a highest utilization at the expense of a lower utilization of the URLLC and eMBB. Moreover, The URLLC has a strict delay requirement of 1 ms. Whenever the delay of its request approaches its M T D i the ASP value decreases, resulting in an increase in its priority. Therefore, the DA-ASA decreases the utilization of mMTC and slightly decreases the utilization of eMBB compared to ASA in order to allocate resources to the URLLC.
Figure 24 and Figure 25 show the average waiting time of the network slices in cases one and two, respectively. The average waiting time of the URLLC is almost the same in both systems. The DA-ASA slightly increase the average waiting time of the eMBB compared to the ASA to serve the requests of mMTC. Therefore, the DA-ASA provides better treatment for mMTC in comparison to the ASA.
Figure 26 shows the average waiting time of the network slices in case three. In this case, URLLC, which supports applications with low delay requirements, has the lowest priority. The DA-ASA increases the average waiting time of the eMBB and mMTC compared to the ASA in order to minimize the average waiting time of the URLLC.
Figure 27 shows the TBP of the network slices in case one. The eMBB requests require a significant number of resources, which prevents other slices from accessing the resources. Therefore, the TBP of eMBB is the highest, particularly at high traffic loads. Since the priorities of URLLC and eMBB are higher than that of mMTC, the DA-ASA slightly increases their TBP in comparison to the ASA in order to decrease the TBP of the mMTC.
Figure 28 shows the TBP of the network slices in case two. Since the priority of URLLC decreases in this case, the DA-ASA increase the TBP of the eMBB in comparison to the ASA to allow more admission of URLLC requests. In addition, DA-ASA decreases the TBP of mMTC compared to ASA.
Figure 29 shows the TBP of the network slices in case three. The TBP of mMTC is the lowest in this case since it has the highest priority. We can notice that the DA-ASA increases the TBP of the mMTC compared to the ASA in order to decrease the TBP of the URLLC, which has the lowest priority. Moreover, the TBP of the eMBB is almost equal to the ASA. However, at high traffic loads, the TBP of the eMBB in the DA-ASA is slightly higher than the ASA to allow more admission of the URLLC requests.
We can conclude that increasing the priority ratio for one slice improves its performance metrics in terms of utilization, average waiting time, and TBP. However, an improvement in one slice’s performance comes at the expense of the performance of other slices. Although, Both ASA and DA-ASA systems prevent the high-priority slice from starving the other slices, the DA-ASA achieves a sufficient performance of the slices. The maximum tolerance delay, M T D i , parameter in the ASP equation of the DA-ASA system slightly decreases the performance of the highest priority slice to enhance the performance of the other slices. In addition, in DA, the calcultaion the waiting time of each queued request from each slices create more processing overhead.

5. Conclusions

For 5G C-RAN with heterogeneous traffic, the design of a dynamic network slicing system is a crucial issue. To address these problems with SSA, we have developed and analyzed an alternative adaptive slicing method (ASA). The goal of the proposed ASA system is to fairly distribute 5G CRAN network resources across three categories of slices (URLLC, eMBB, and mMTC slices). In addition, it needs to prioritize the various slices in a way that is both adaptable and dynamic, taking into account the values assigned to each slice’s virtual resources and the current demand on the cell.
Utilization, typical wait times, and throughput per patient (TBP) were used to describe and simulate the system model. The outcomes showed that the ASA method was superior to the SSA system across the board. Additionally, the DA-ASA system’s delay factor improves the functionality of time-critical delay services. For instance, because the URLLC’s maximum delay is smaller than the other slices’, the URLLC’s adaptive slicing priority (ASP) value drops as the URLLC’s delay nears its maximum, leading to better performance. As a result, both ASA and DA-ASA systems maintain optimal performance for URLLC while guaranteeing sufficient quality of service (QoS) for each individual slice. Furthermore, the DA-ASA system is able to provide acceptable and good performance by striking a compromise between the maximum delay tolerance of other traffic and the high priority of URLLC users.

Funding

The author extends his appreciation to the Deputyship for Research and Innovation, Ministry of Education in Saudi Arabia for funding this research. (IFKSURC-1-7116).

Data Availability Statement

The data that support the findings of this study are available from the corresponding author, upon reasonable request.

Acknowledgments

The author extend his appreciation to the Deputyship for Research and Innovation, Ministry of Education in Saudi Arabia for funding this research. (IFKSURC-1-7116).

Conflicts of Interest

The author declares no conflict of interest.

References

  1. Statista. Global Mobile Data Traffic 2023|Statistic. 2023. Available online: https://www.statista.com/statistics/271405/global-mobile-data-traffic-forecast/ (accessed on 14 August 2023).
  2. Ficzere, D. Complex network theory to model 5G Network Slicing. In Proceedings of the NOMS 2022-2022 IEEE/IFIP Network Operations and Management Symposium, Budapest, Hungary, 25–29 April 2022; pp. 1–4. [Google Scholar]
  3. Lin, X. An Overview of 5G Advanced Evolution in 3GPP Release 18. IEEE Commun. Stand. Mag. 2022, 6, 77–83. [Google Scholar] [CrossRef]
  4. Shehab, M.J.; Kassem, I.; Kutty, A.A.; Kucukvar, M.; Onat, N.; Khattab, T. 5G Networks Towards Smart and Sustainable Cities: A Review of Recent Developments, Applications and Future Perspectives. IEEE Access 2022, 10, 2987–3006. [Google Scholar] [CrossRef]
  5. Salman, T.; Jain, R. Cloud RAN: Basics, advances and challenges. Washington University in St. Louis. April 2016. Available online: https://www.cse.wustl.edu/~jain/cse574-16/ftp/cloudran.pdf (accessed on 18 September 2023).
  6. Baranda, J.; Mangues-Bafalluy, J. End-to-End Network Service Orchestration in Heterogeneous Domains for Next-Generation Mobile Networks. In Proceedings of the NOMS 2022-2022 IEEE/IFIP Network Operations and Management Symposium, Budapest, Hungary, 25–29 April 2022; pp. 1–6. [Google Scholar]
  7. Gomes, R.; Vieira, D.; de Castro, M.F. Application of Meta-Heuristics in 5G Network Slicing: A Systematic Review of the Literature. Sensors 2022, 22, 6724. [Google Scholar] [CrossRef]
  8. Habibi, M.A.; Nasimi, M.; Han, B.; Schotten, H.D. A Comprehensive Survey of RAN Architectures Toward 5G Mobile Communication System. IEEE Access 2019, 7, 70371–70421. [Google Scholar] [CrossRef]
  9. Pana, V.S.; Babalola, O.P.; Balyan, V. 5G radio access networks: A survey. Array 2022, 14, 100170. [Google Scholar] [CrossRef]
  10. Mamane, A.; Fattah, M.; El Ghazi, M.; El Bekkali, M.; Balboul, Y.; Mazer, S. Scheduling Algorithms for 5G networks and beyond: Classification and Survey. IEEE Access 2022, 10, 51643–51661. [Google Scholar] [CrossRef]
  11. Ojijo, M.O.; Falowo, O.E. A Survey on Slice admission Control Strategies and Optimization Schemes in 5G Network. IEEE Access 2020, 8, 14977–14990. [Google Scholar] [CrossRef]
  12. Yarkina, N.; Correia, L.M.; Moltchanov, D.; Gaidamaka, Y.; Samouylov, K. Multi-tenant resource sharing with equitable-priority-based performance isolation of slices for 5G cellular systems. Comput. Commun. 2022, 188, 39–51. [Google Scholar] [CrossRef]
  13. Li, W.; Liu, R.; Dai, Y.; Wang, D.; Cai, H.; Fan, J.; Li, Y. Research on Network Slicing for Smart Grid. In Proceedings of the 2020 IEEE 10th International Conference on Electronics Information and Emergency Communication (ICEIEC), Beijing, China, 17–19 July 2020. [Google Scholar] [CrossRef]
  14. Setayesh, M.; Bahrami, S.; Wong, V.W.S. Joint PRB and Power Allocation for Slicing eMBB and URLLC Services in 5G C-RAN. In Proceedings of the GLOBECOM 2020—2020 IEEE Global Communications Conference, Taipei, Taiwan, 7–11 December 2020. [Google Scholar] [CrossRef]
  15. Sun, Y.; Feng, G.; Zhang, L.; Yan, M.; Qin, S.; Imran, M.A. User Access Control and Bandwidth Allocation for Slice-Based 5G-and-Beyond Radio Access Networks. In Proceedings of the ICC 2019—2019 IEEE International Conference on Communications (ICC), Shanghai, China, 20–24 May 2019. [Google Scholar] [CrossRef]
  16. Vila, I.; Perez-Romero, J.; Sallent, O.; Umbert, A. Characterization of Radio Access Network Slicing Scenarios with 5G QoS Provisioning. IEEE Access 2020, 8, 51414–51430. [Google Scholar] [CrossRef]
  17. Hua, Y.; Li, R.; Zhao, Z.; Chen, X.; Zhang, H. GAN-Powered Deep Distributional Reinforcement Learning for Resource Management in Network Slicing. IEEE J. Sel. Areas Commun. 2020, 38, 334–349. [Google Scholar] [CrossRef]
  18. Song, F.; Li, J.; Ma, C.; Zhang, Y.; Shi, L.; Jayakody, D.N.K. Dynamic virtual resource allocation for 5g and beyond network slicing. IEEE Open J. Veh. Technol. 2020, 1, 215–226. [Google Scholar] [CrossRef]
  19. Canpolat, C.; Schmidt, E.G. Dynamic User Count Aware Resource Allocation for Network Slicing in Virtualized Radio Access Networks. In Proceedings of the 2020 IEEE Symposium on Computers and Communications (ISCC), Rennes, France, 7–10 July 2020. [Google Scholar] [CrossRef]
  20. Feng, L.; Zi, Y.; Li, W.; Zhou, F.; Yu, P.; Kadoch, M. Dynamic Resource Allocation with RAN Slicing and Scheduling for uRLLC and eMBB Hybrid Services. IEEE Access 2020, 8, 34538–34551. [Google Scholar] [CrossRef]
  21. Lieto, A.; Malanchini, I.; Mandelli, S.; Moro, E.; Capone, A. Strategic Network Slicing Management in Radio Access Networks. IEEE Trans. Mob. Comput. 2022, 21, 1434–1448. [Google Scholar] [CrossRef]
  22. Li, J.; Shi, W.; Yang, P.; Ye, Q.; Shen, X.S.; Li, X.; Rao, J. A Hierarchical Soft RAN Slicing Framework for Differentiated Service Provisioning. IEEE Wirel. Commun. 2020, 27, 90–97. [Google Scholar] [CrossRef]
  23. Zhou, L.; Zhang, T.; Li, J.; Zhu, Y. Radio Resource Allocation for RAN Slicing in Mobile Networks. In Proceedings of the 2020 IEEE/CIC International Conference on Communications in China (ICCC), Chongqing, China, 9–11 August 2020. [Google Scholar] [CrossRef]
  24. Ha, V.N.; Nguyen, T.T.; Le, L.B.; Frigon, J.F. Admission Control and Network Slicing for Multi-Numerology 5G Wireless Networks. IEEE Netw. Lett. 2019, 2, 5–9. [Google Scholar] [CrossRef]
  25. Tang, J.; Shim, B.; Quek, T.Q.S. Service Multiplexing and Revenue Maximization in Sliced C-RAN Incorporated with URLLC and Multicast eMBB. IEEE J. Sel. Areas Commun. 2019, 37, 881–895. [Google Scholar] [CrossRef]
  26. Sun, Y.; Qin, S.; Feng, G.; Zhang, L.; Imran, M.A. Service Provisioning Framework for RAN Slicing: User Admissibility, Slice Association and Bandwidth Allocation. IEEE Trans. Mob. Comput. 2021, 20, 3409–3422. [Google Scholar] [CrossRef]
  27. Zou, H.; Zhou, M.; Cui, Y.; He, P.; Zhang, H.; Wang, R. Service provisioning in sliced cloud radio access networks. Wirel. Commun. Mob. Comput. 2022, 2022, 7326172. [Google Scholar] [CrossRef]
  28. Xie, Y.; Kong, Y.; Huang, L.; Wang, S.; Xu, S.; Wang, X.; Ren, J. Resource allocation for network slicing in dynamic multi-tenant networks: A deep reinforcement learning approach. Comput. Commun. 2022, 195, 476–487. [Google Scholar] [CrossRef]
  29. Degambur, L.N.; Mungur, A.; Armoogum, S.; Pudaruth, S. Resource Allocation in 4G and 5G Networks: A Review. Int. J. Commun. Netw. Inf. Secur. 2021, 13, 5116. [Google Scholar] [CrossRef]
  30. Awad, A.M.; Shehata, M.; Gasser, S.M.; EL-Badawy, H. CoMP-Aware BBU Placements for 5G Radio Access Networks over Optical Aggregation Networks. Appl. Sci. 2022, 12, 8586. [Google Scholar] [CrossRef]
  31. Adda, S.; Aureli, T.; Coltellacci, S.; D’Elia, S.; Franci, D.; Grillo, E.; Pasquino, N.; Pavoncello, S.; Suman, R.; Vaccarono, M. A methodology to characterize power control systems for limiting exposure to electromagnetic fields generated by massive MIMO antennas. IEEE Access 2020, 8, 171956–171967. [Google Scholar] [CrossRef]
  32. 3GPP Specification Series: 38 Series. Available online: https://www.3gpp.org/dynareport?code=38-series.htm (accessed on 17 October 2022).
  33. 5G Flexible Numerology—What Is It? Why Should You Care?—Technical Support Knowledge Center Open. Available online: https://edadocs.software.keysight.com/kkbopen/5g-flexible-numerology-what-is-it-why-should-you-care-598781627.html (accessed on 17 October 2022).
  34. 5G NR Resource block—Gaussian Waves. Available online: https://www.gaussianwaves.com/2022/02/5g-nr-resource-block/ (accessed on 17 October 2022).
  35. Floor and Ceiling Functions—Wikipedia. Available online: https://en.wikipedia.org/wiki/Floor_and_ceiling_functions (accessed on 17 October 2022).
  36. Alotaibi, D. Survey on Network Slice Isolation in 5G Networks: Fundamental Challenges. Procedia Comput. Sci. 2021, 182, 38–45. [Google Scholar] [CrossRef]
  37. Demirovic, S.; Kis, P.; Jankovic, J.; Ilic, Z. Resource Utilization—QoS Isolation Trade-Off in 5G Networks Considering Network Slicing Reconfiguration Interval. In Proceedings of the 2020 43rd International Convention on Information, Communication and Electronic Technology (MIPRO), Opatija, Croatia, 28 September–2 October 2020. [Google Scholar] [CrossRef]
Figure 1. 5G C-RAN architecture with different types of slices (e.g., URLLC, eMBB, and mMTC traffic).
Futureinternet 15 00343 g001
Figure 2. 5G NR Frame structure [31].
Futureinternet 15 00343 g002
Figure 3. The system model for the SSA system. The system can be described as follows: the total number of RBs is divided into three non-overlapping partitions, with one partition per slice traffic, which can be expressed as.
Futureinternet 15 00343 g003
Figure 4. The system model for the ASA system.
Futureinternet 15 00343 g004
Figure 5. Arrival event of request i.
Futureinternet 15 00343 g005
Figure 6. Departure event of request i.
Futureinternet 15 00343 g006
Figure 7. The system model for the DA-ASA system.
Futureinternet 15 00343 g007
Figure 8. Total system utilization vs. total offered traffic loads (Experiment 1).
Futureinternet 15 00343 g008
Figure 9. Utilization of network slices vs. total offered traffic loads (Experiment 1).
Futureinternet 15 00343 g009
Figure 10. Average waiting time of system vs. total offered traffic loads (Experiment 1).
Futureinternet 15 00343 g010
Figure 11. Average waiting time of network slices vs. total offered traffic loads (Experiment 1).
Futureinternet 15 00343 g011
Figure 12. TBP of system vs. total offered traffic loads (Experiment 1).
Futureinternet 15 00343 g012
Figure 13. TBP of network slices vs. total offered traffic loads (Experiment 1).
Futureinternet 15 00343 g013
Figure 14. Total system utilization vs. total offered traffic loads (Experiment 2).
Futureinternet 15 00343 g014
Figure 15. Utilization of network slices vs. total offered traffic loads (Experiment 2).
Futureinternet 15 00343 g015
Figure 16. Average waiting time of system vs. total offered traffic loads (Experiment 2).
Futureinternet 15 00343 g016
Figure 17. Average waiting time of network slices vs. total offered traffic loads (Experiment 2).
Futureinternet 15 00343 g017
Figure 18. TBP of system vs. total offered traffic loads (Experiment 2).
Futureinternet 15 00343 g018
Figure 19. TBP of network slices vs. total offered traffic loads (Experiment 2).
Futureinternet 15 00343 g019
Figure 20. Total system utilization vs. total offered traffic loads (Experiment 3).
Futureinternet 15 00343 g020
Figure 21. Utilization of network slices vs. total offered traffic loads in case 1 (Experiment 3).
Futureinternet 15 00343 g021
Figure 22. Utilization of network slices vs. total offered traffic loads in case 2 (Experiment 3).
Futureinternet 15 00343 g022
Figure 23. Utilization of network slices vs. total offered traffic loads in case 3 (Experiment 3).
Futureinternet 15 00343 g023
Figure 24. Average waiting time of network slices vs. total offered traffic loads in case 1 (Experiment 3).
Futureinternet 15 00343 g024
Figure 25. Average waiting time of network slices vs. total offered traffic loads in case 2 (Experiment 3).
Futureinternet 15 00343 g025
Figure 26. Average waiting time of network slices vs. total offered traffic loads in case 3 (Experiment 3).
Futureinternet 15 00343 g026
Figure 27. TBP of network slices vs. total offered traffic loads in case 1 (Experiment 3).
Futureinternet 15 00343 g027
Figure 28. TBP of network slices vs. total offered traffic loads in case 2 (Experiment 3).
Futureinternet 15 00343 g028
Figure 29. TBP of network slices vs. total offered traffic loads in case 3 (Experiment 3).
Futureinternet 15 00343 g029
Table 1. Performance requirements of the 5G use cases [4].
RequirementseMBBmMTCuRLLC
Average throughput0.1–1 GbpsUp to 1 Mbps25 Mbps
Latency10 ms>1 h1 ms
Availability0.97%0.999%0.99999%
OtherMobility up to 500 km/hBattery life up to 10 yearsReliability up to 0.99999%
Table 2. 5G NR flexible numerology [31].
μ Num. of Slots in a SubframeSlot Time LengthSubcarrier Spacing
011 ms15 kHz
120.5 ms30 kHz
240.25 ms60 kHz
380.125 ms120 kHz
Table 3. Equations for calculating the number of virtually reserved RBs.
DescriptionEquation
Number of virtual reserved RBs for all user of the URLLC slice R v 1 = P U R L L C × R
Number of virtual reserved RBs for all user of the eMBB slice. R v 2 = P e M B B × R
Number of virtual reserved RBs for all user of the mMTC slice. R v 3 = P m M T C × R
Table 4. Description of symbols and notations.
SymbolDescription
P U R L L C The priority ratio for serving URLLC slice traffic, specified as a real number between 0 and 1, where 1 means highest priority.
P e M B B The priority ratio for serving eMBB slice traffic, specified as a real number between 0 and 1, where 1 means highest priority.
P m M T C The priority ratio for serving mMTC slice traffic, specified as a real number between 0 and 1, where 1 means highest priority.
A S P i An   adaptive   slicing   priority   for   the   i t h slice, specified as a real number between 0 and 1, where 0 means highest priority.
R The total number of RBs. An integer count of physical resource blocks.
R c The total number of RBs that are currently utilized by all active users.
R c i The   total   number   of   RBs   that   are   currently   utilized   by   all   active   users   of   the   i t h slice. Where i is a number ranging from 1 to 3 for URLLC, eMBB, and mMTC slices, respectively.
R c o n Total number of RBs allocated for transmission control overhead.
R v i The   number   of   RBs   that   are   virtually   reserved   for   the   i t h slice.
R R S V D i The   number   of   RBs   that   are   reserved   for   the   i t h slice.
B i The   amount   of   bandwidth   required   to   guarantee   adequate   data   rate   for   the   i t h slice.
D R i The required average data rates for each connection request. Unit: integer.
R m a x The maximum number of RBs required.
R r e q The required number of RBs.
R m i n Minimum number of RBs required.
Δ R i The   number   of   RBs   required   to   admit   a   new   request   to   the   i t h slice.
C i Number of active connections for each slice’s request i. Unit: integer.
M T D i Maximum   tolerable   delay   for   the   requests   of   the   i t h slice. Unit: integer value in ms.
D i The   current   latency   of   a   user s   request   for   the   i t h slice. Unit: ms.
Table 5. The ASP of each slice’s request i in the ASA system.
5G Slice A S P i
URLLC A S P 1 = R c 1 P U R L L C × R
eMBB A S P 2 = R c 2 P e M B B × R
mMTC A S P 3 = R c 3 P m M T C × R
Table 6. The arrival and departure procedures in the ASA.
Arrival Event of Request i Departure Event of Request i
if   ( R c + Δ R i R )if   ( Q i is full)
 Admit request i Set   ASP ( i ) = R C i R v i
else Select   Q i with the lowest ASP value.
if   ( Q i not reaches its limits)if ( R c + Δ R i R )
  Admit request i
  Insert   in   Q i else
   Release the resource.
end if
else
   Reject request i
else
   Release the resource
end if
end if
end if
Table 7. The ASP of each slice’s request i in the DA-ASA system.
5G Slice A S P i
URLLC A S P 1 =   R c 1 P U R L L C × R × ( M T D 1 D 1 )
eMBB A S P 2 =   R c 2 P e M B B × R × ( M T D 2 D 2 )
mMTC A S P 3 = R c 3 P m M T C × R × ( M T D 3 D 3 )
Table 8. The arrival and departure procedures in the DA-ASA.
Arrival Event of Request i Departure Event of Request i
if   ( R c + Δ R i R ) if   ( Q i is full)
 Admit request i Set   ASP ( i ) = R C i R v i × ( M T D i D i )
else Select   Q i with the lowest ASP value.
if   ( Q i not reaches its limits) if   ( R c + Δ R i R )
  Admit request i
Insert   in   Q i  else
   Release the resource.
  end if
 else
  Reject request i
else
  Release the resource
 end if
end if
end if
Table 9. Simulation Parameters.
ParameterAssumption
System bandwidth20 MHz (100 PRBs, 180 kHz per PRB)
TTI1 ms
Number of PRBs for data transmission96
Number of PRBs for control transmission4
User arrivalPoisson process
Number of admitted calls simulated1,000,000
Call durationExponential 120 sec.
Calls Queue size10
Table 10. QoS requirements for 5G network slices.
5G SlicePriority RatioDelay BudgetRate Budget
URLLC P U R L L C = 50%1 ms128 Kbps
eMBB P e M B B = 35%4 ms256 Kbps
mMTC P m M T C = 15%7 ms64 Kbps
Table 11. Priority ratios of the network slices.
Priority RatioCase No. 1Case No. 2Case No. 3
P U R L L C 80%40% 20%
P e M B B 15%50% 30%
P m M T C 5%10%50%
Disclaimer/Publisher’s Note: The statements, opinions and data contained in all publications are solely those of the individual author(s) and contributor(s) and not of MDPI and/or the editor(s). MDPI and/or the editor(s) disclaim responsibility for any injury to people or property resulting from any ideas, methods, instructions or products referred to in the content.

