
Application of an Effective Hierarchical Deep-Learning-Based Object Detection Model Integrated with Image-Processing Techniques for Detecting Speed Limit Signs, Rockfalls, Potholes, and Car Crashes


Abstract
:1. Introduction
2. Related Work
2.1. Studies Related to the Detection of Traffic Signs
2.2. Studies Related to the Detection of Objects Other Than Traffic Signs
3. Model Design
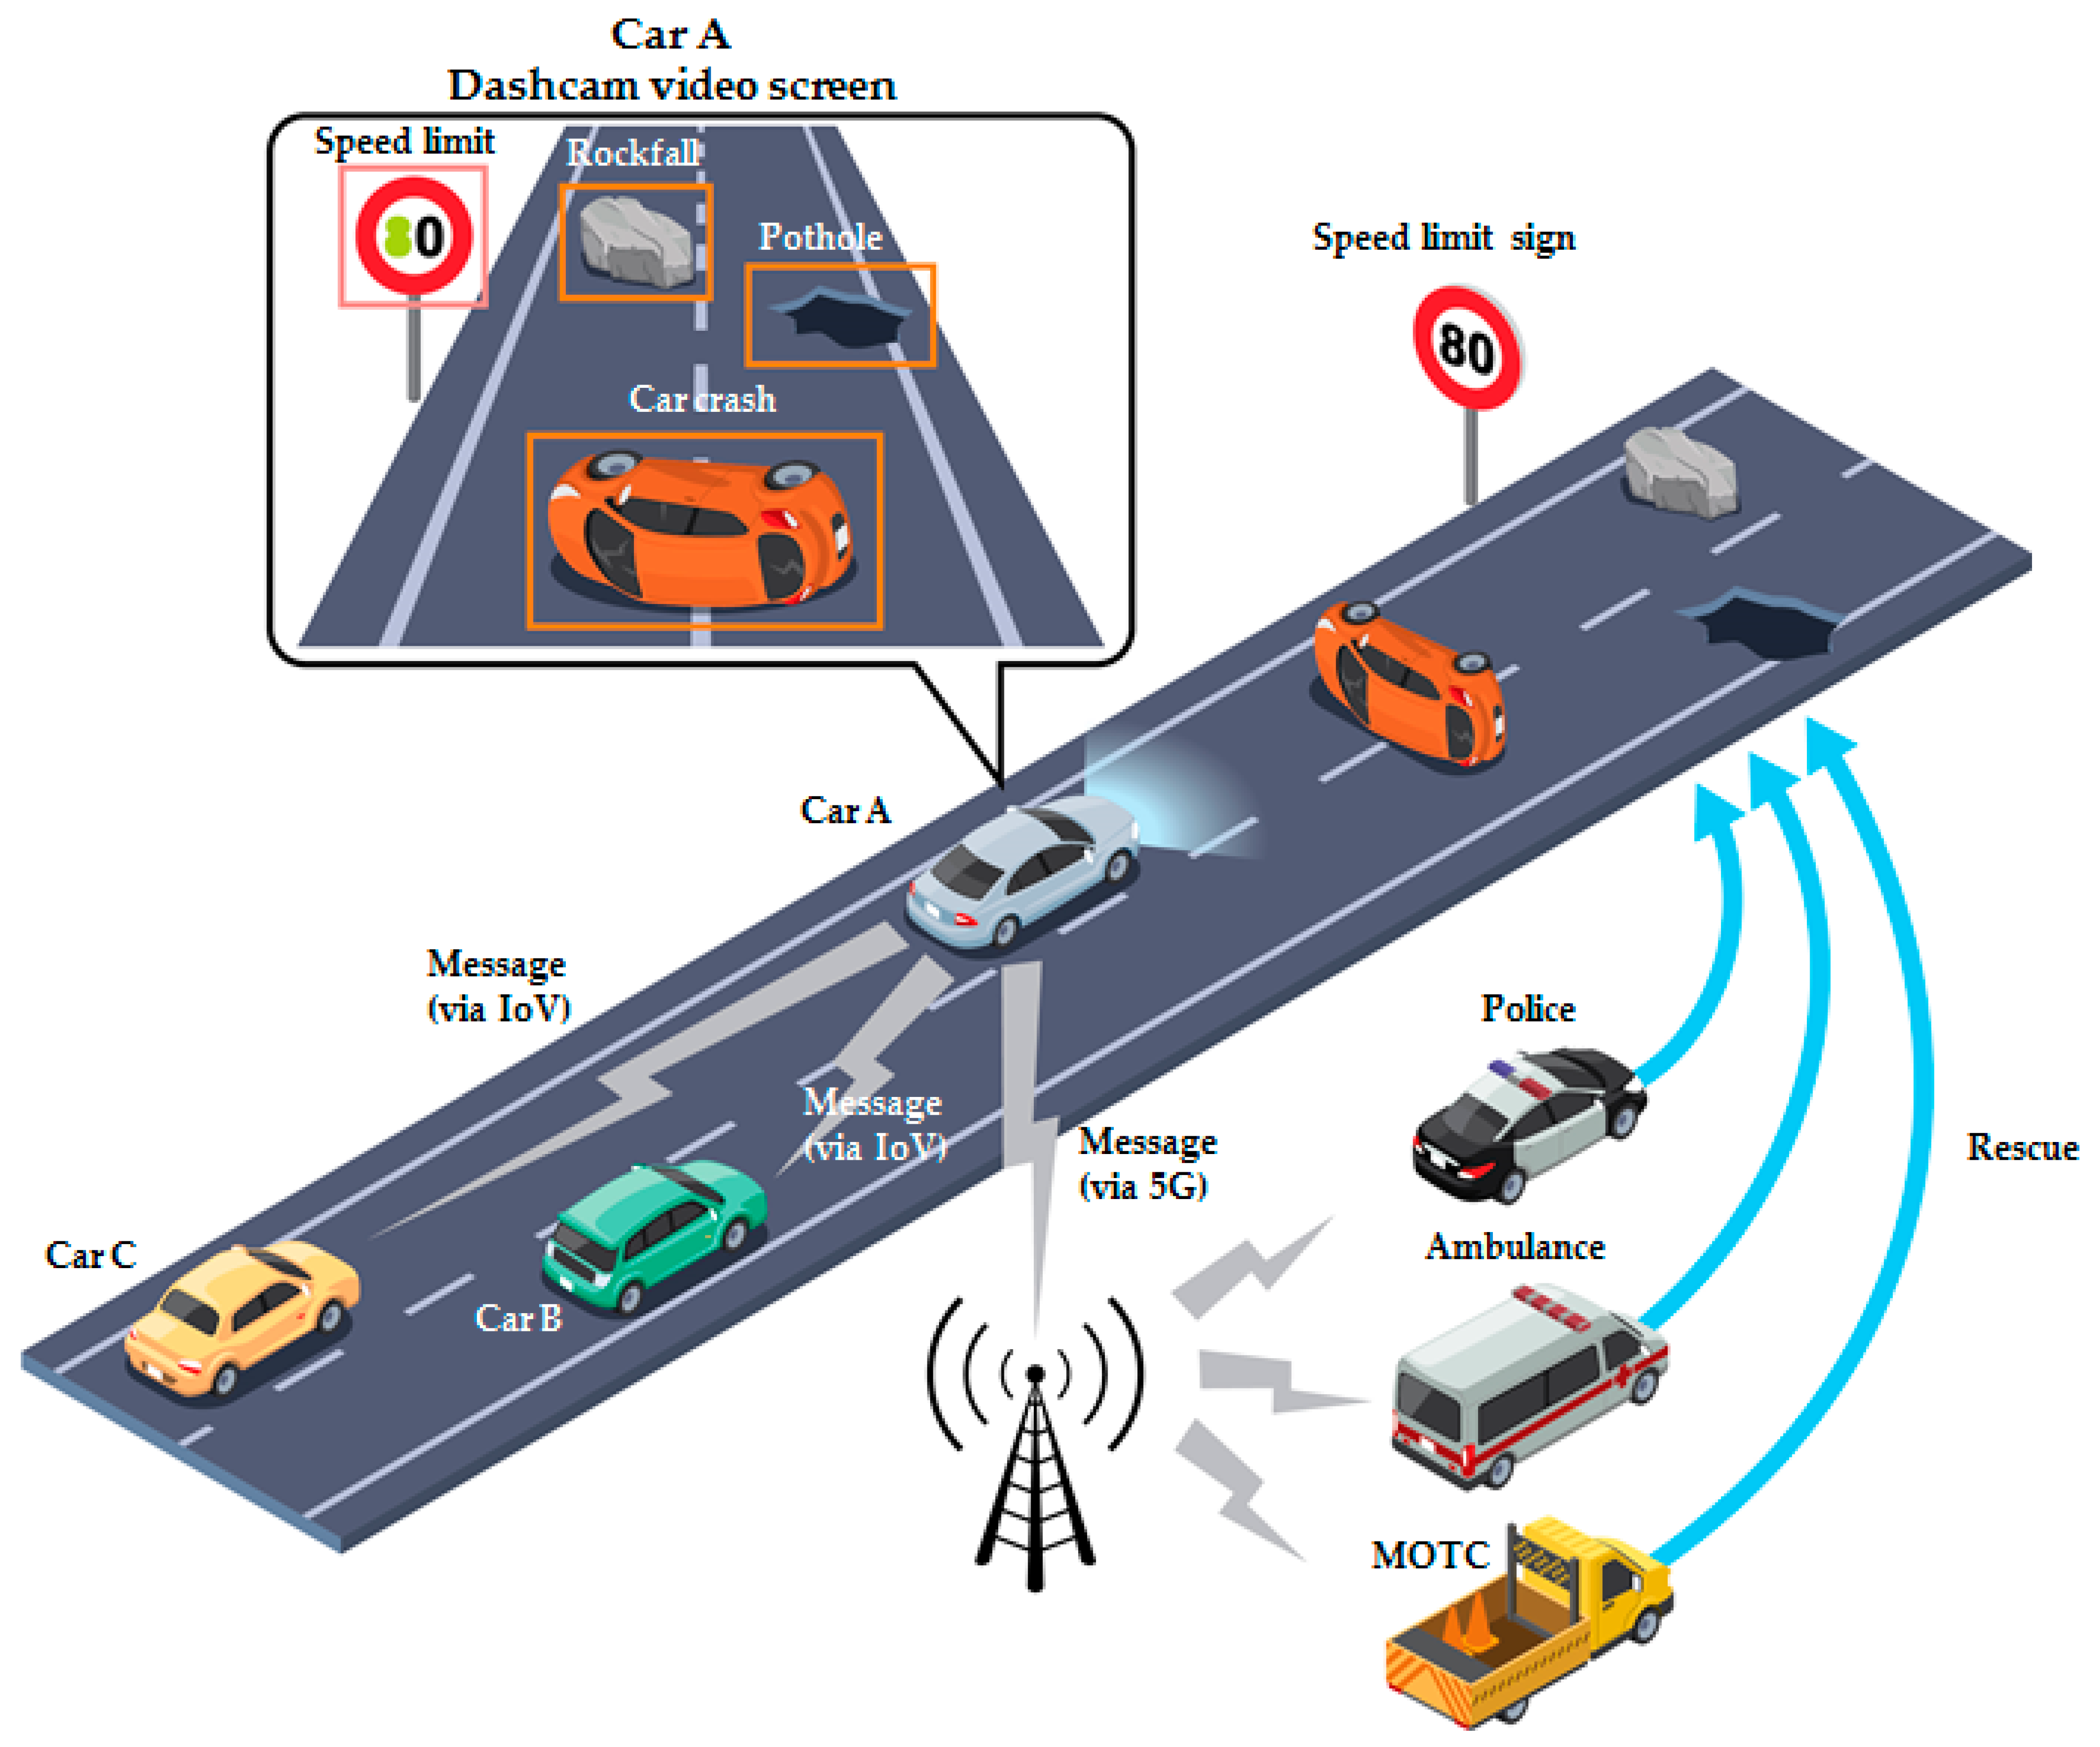
3.1. Scenario Description
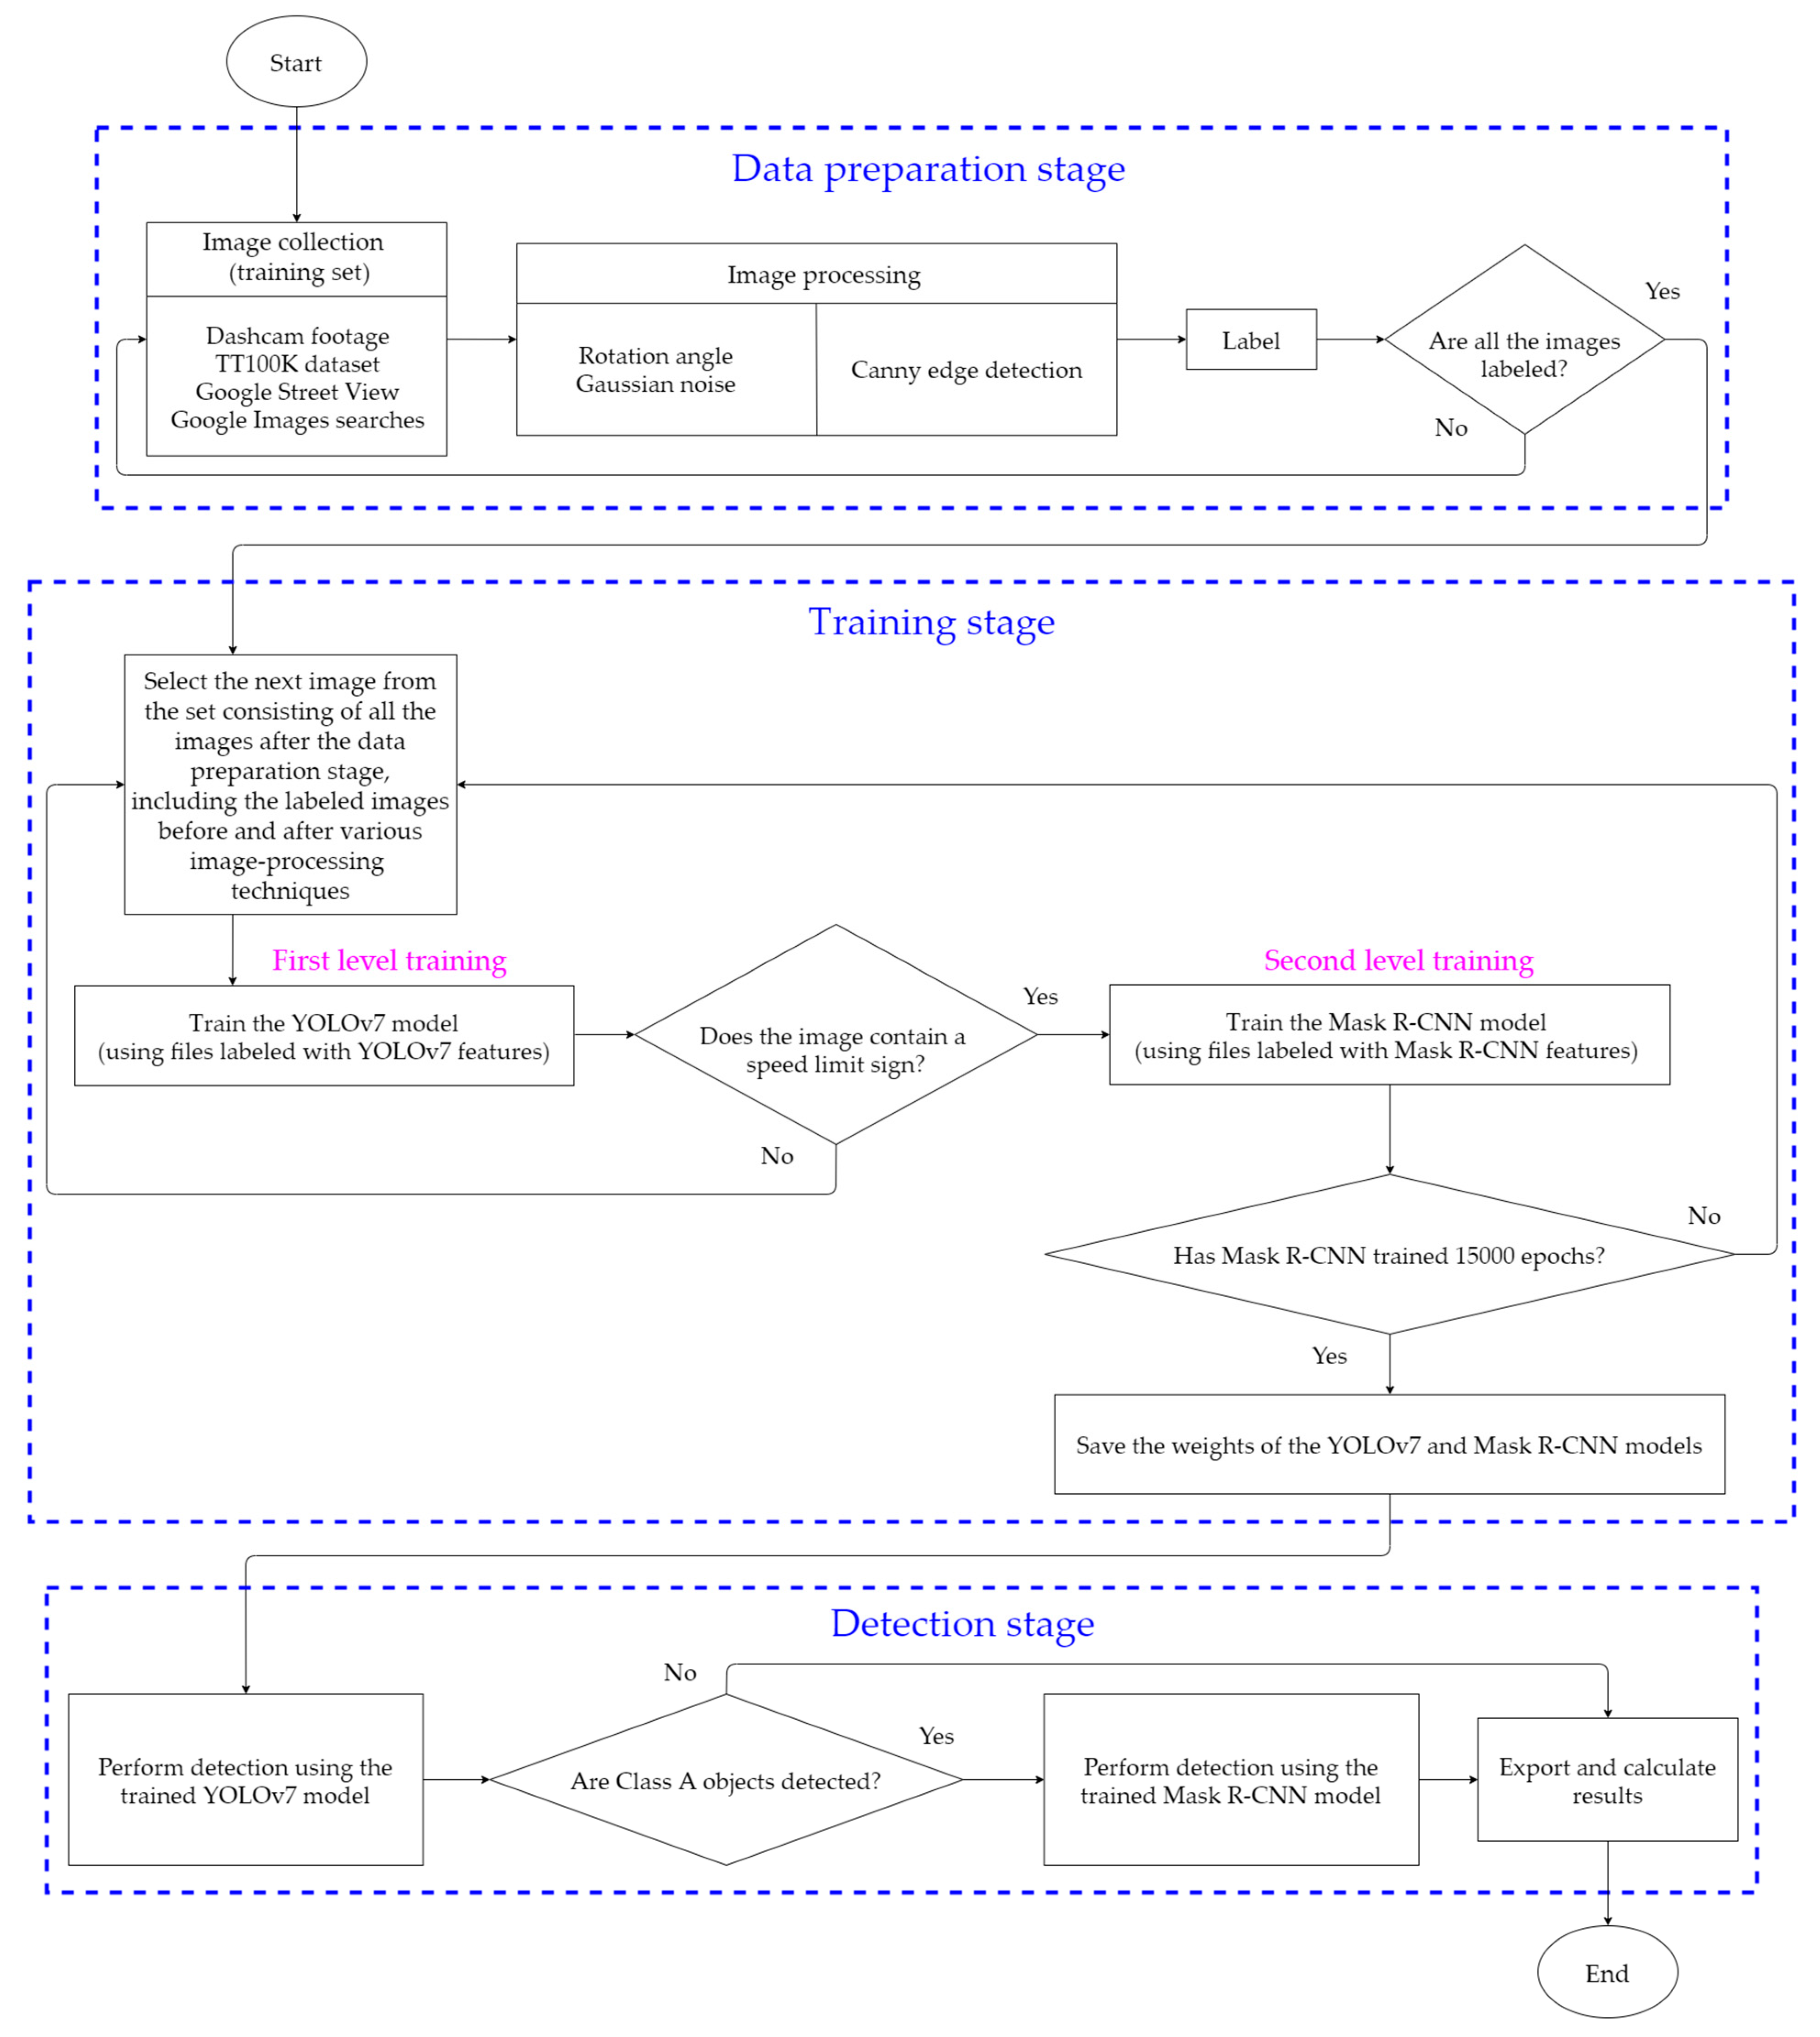
3.2. Design of the Overall Process Framework
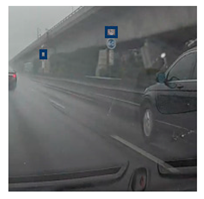
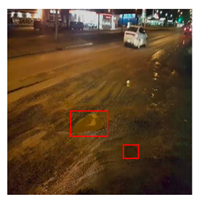
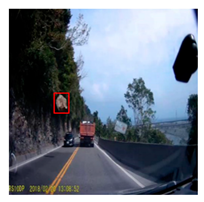
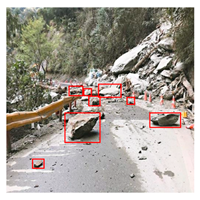
3.2.1. Data Preparation Stage
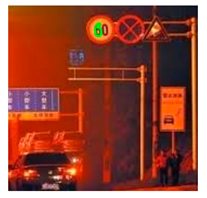
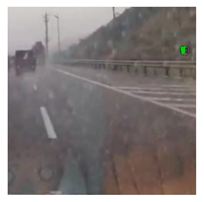
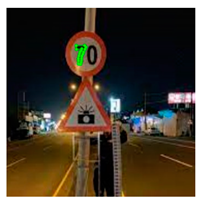
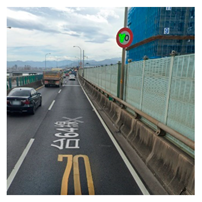
Image Collection
- (1)
- Dashcam footage:These were videos recorded by actual drivers on the road. The collected dashcam footage was trimmed into pictures that were saved as JPG files for training and later testing.
- (2)
- TT100K dataset:This dataset contains data collected by street-mapping vehicles and includes various weather conditions. We screened the dataset and extracted the required information.
- (3)
- Google Street View:From this, we screen-captured street imagery that contained speed limit signs.
- (4)
- Google Images searches:We used this resource to search for suitable images.
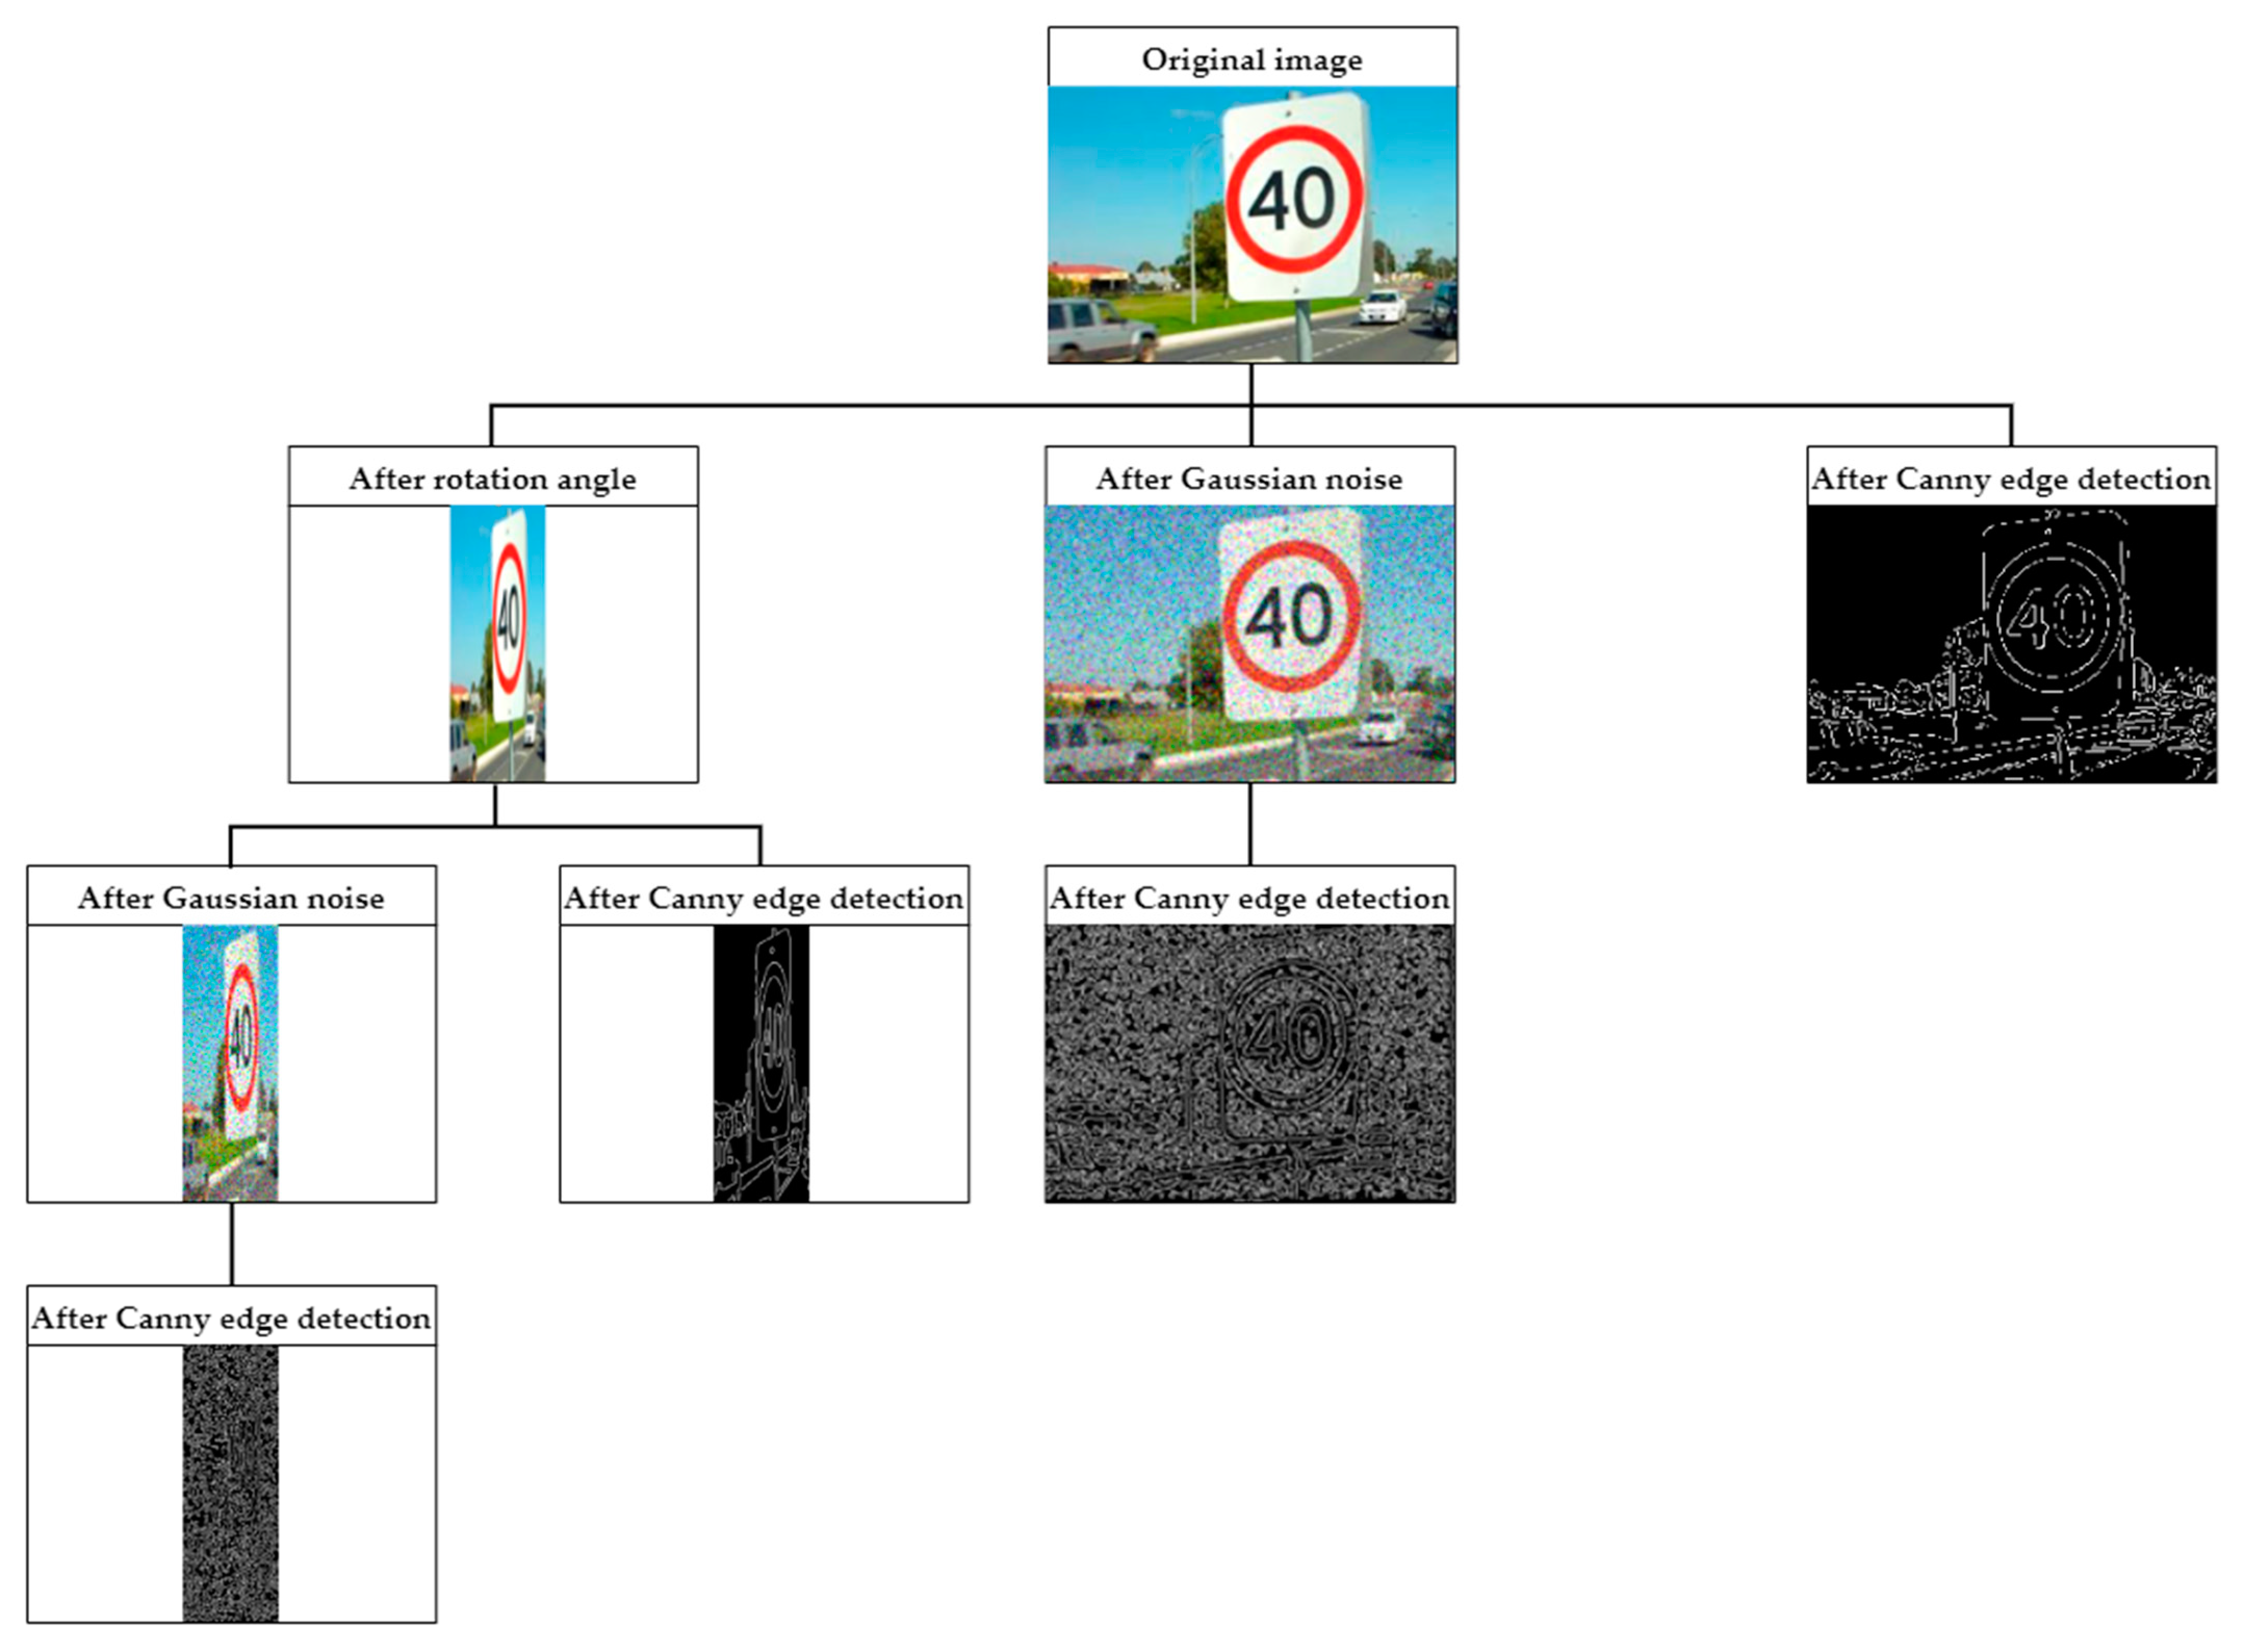
Image Processing
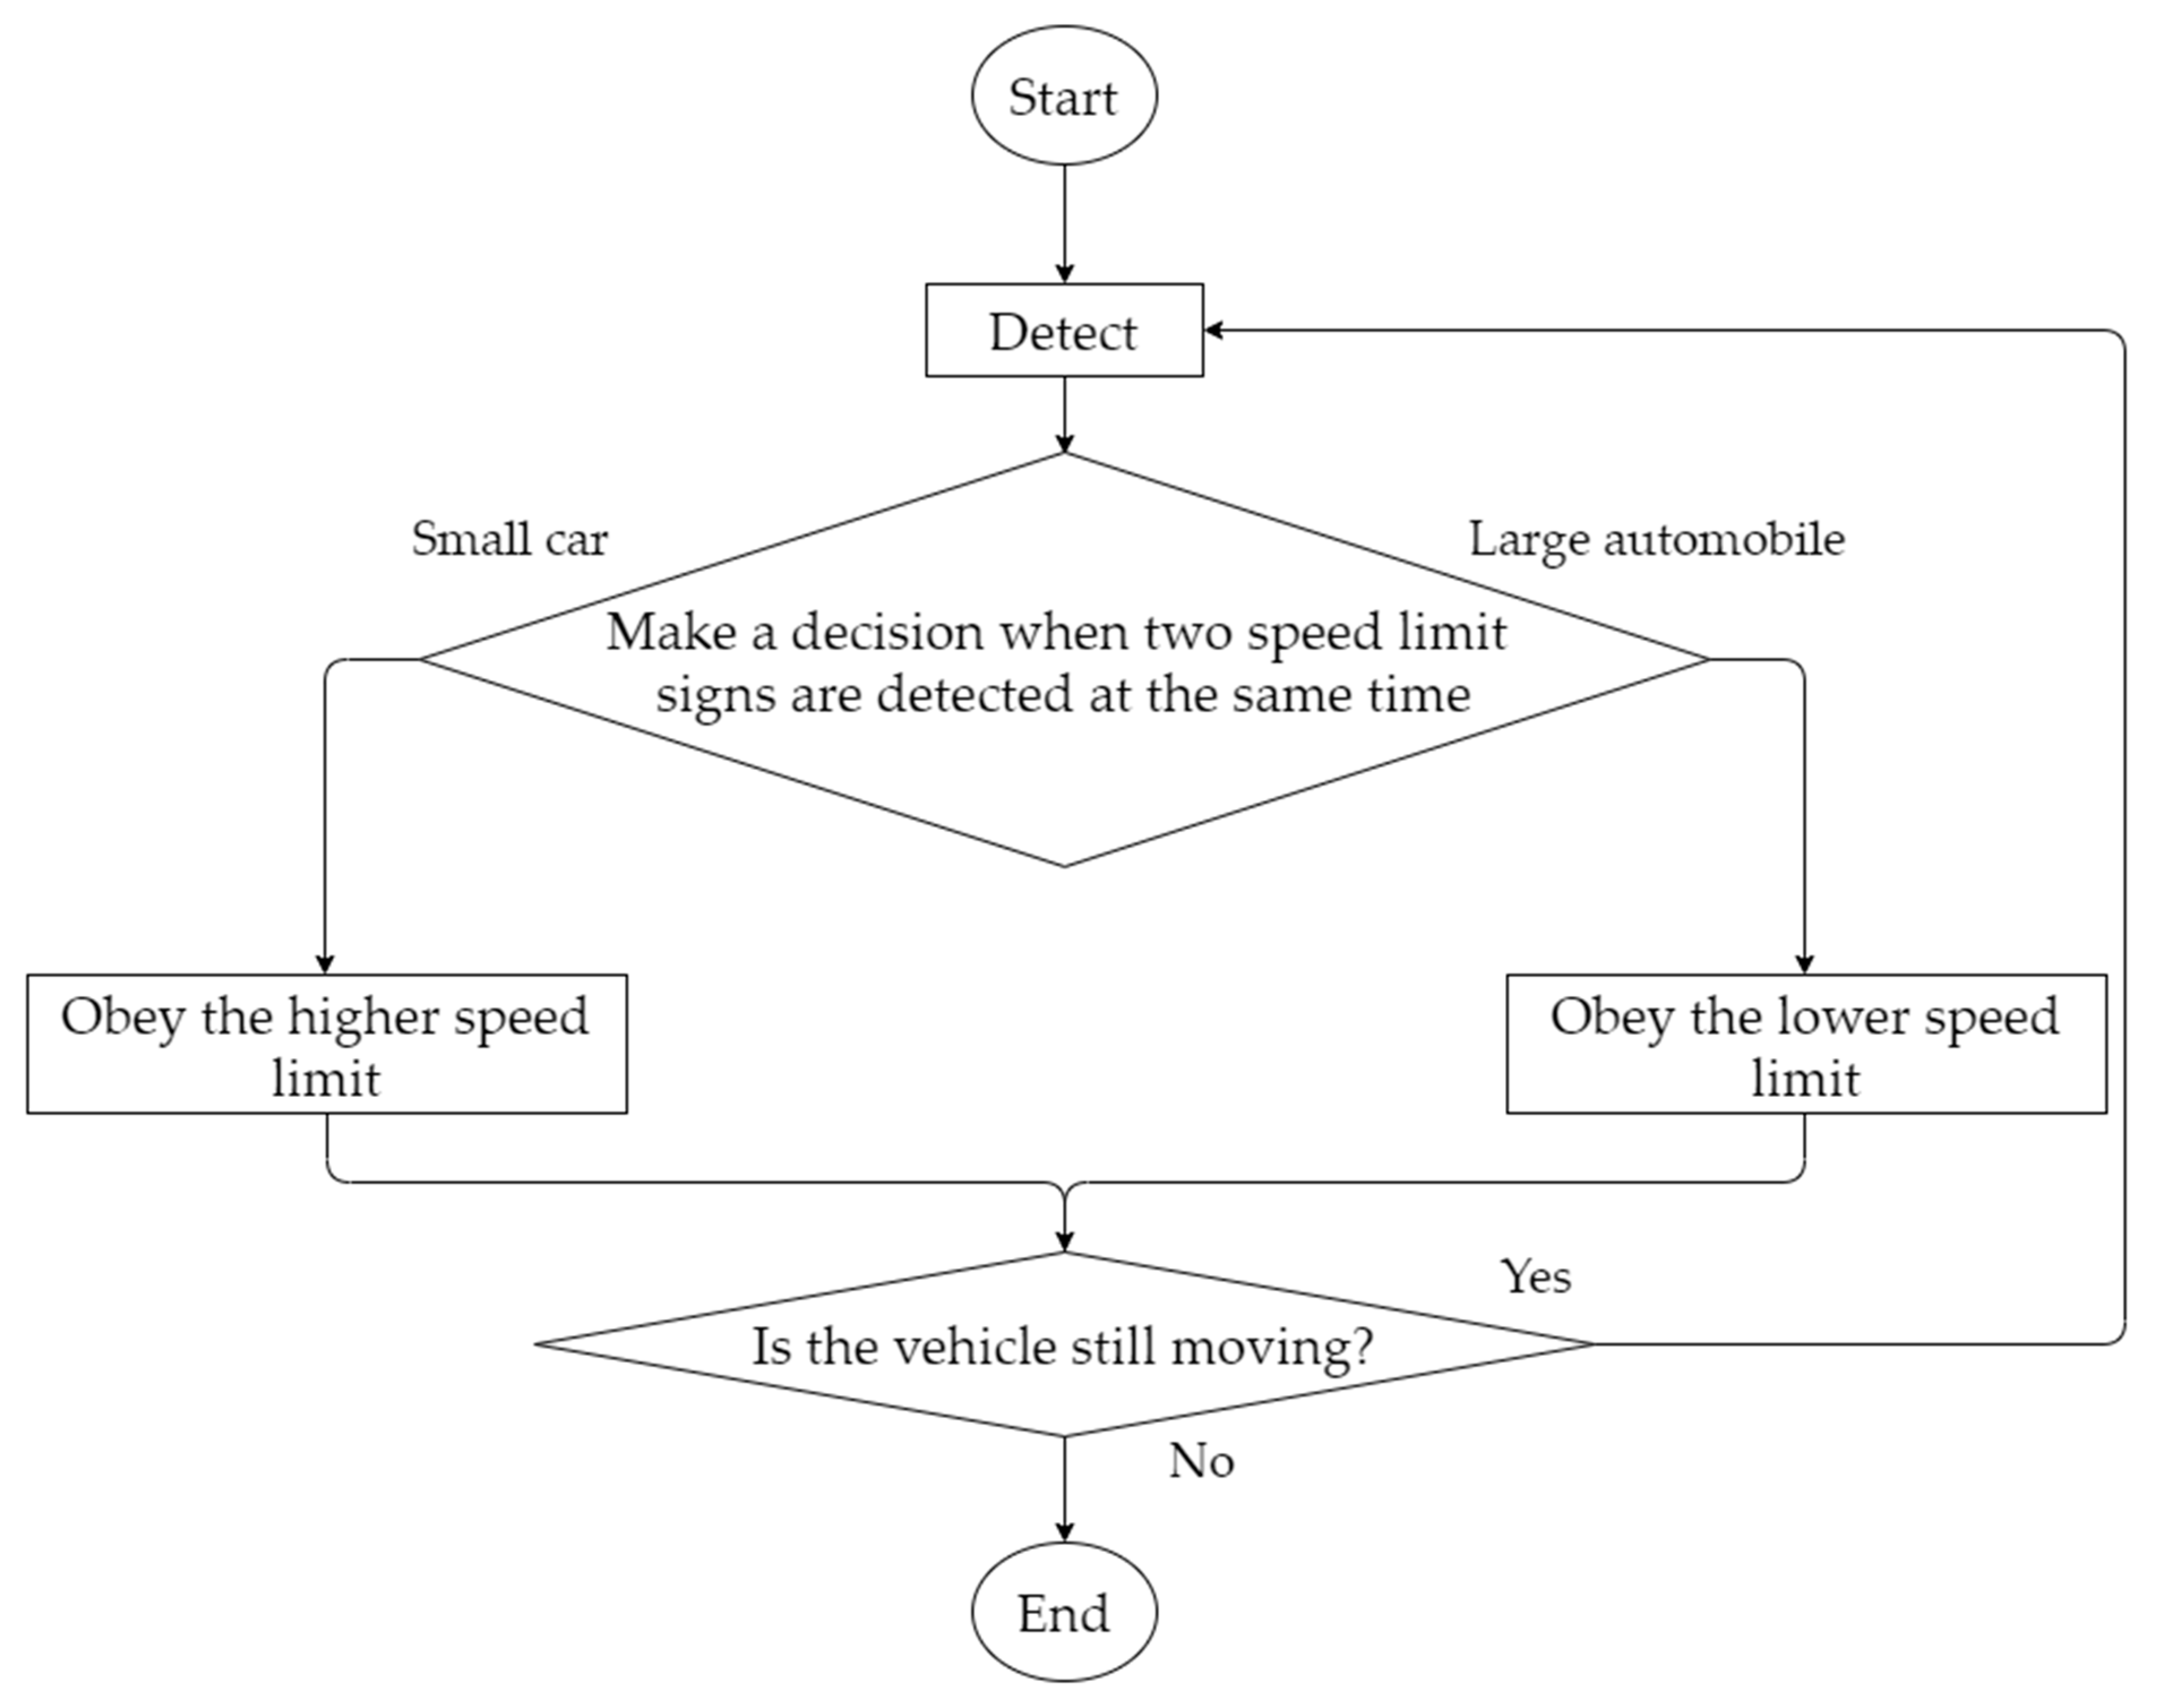
Labeling Design
3.2.2. Model Training
3.2.3. Model Detection
4. Experimental Results and Discussion
4.1. Hardware
4.2. Training Set
4.3. Test Set
4.4. Model Testing
4.4.1. Comparison of the mAPs of YOLOv7 and Mask R-CNN in Each Model
4.4.2. Comparison between the mAP of M4 and the Other Controls
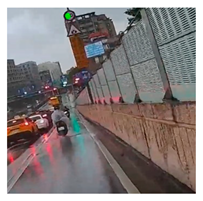
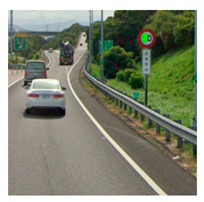
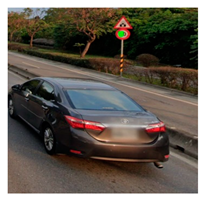
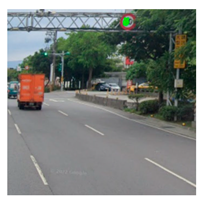
4.4.3. Continuous Image Testing Using M4
4.5. Discussion
5. Conclusions and Directions for Future Research
Funding
Data Availability Statement
Conflicts of Interest
References
- National Police Agency, Ministry of the Interior. Available online: https://www.npa.gov.tw/en/app/data/view?module=wg055&id=8026&serno=6f85cc4f-cd02-40d9-b4ea-2c0cc066c17b (accessed on 18 May 2023).
- Zou, Z.; Chen, K.; Shi, Z.; Guo, Y.; Ye, J. Object detection in 20 years: A survey. Proc. IEEE 2023, 111, 257–276. [Google Scholar] [CrossRef]
- Redmon, J.; Divvala, S.; Girshick, R.; Farhadi, A. You Only Look Once: Unified, Real-Time Object Detection. In Proceedings of the 2016 IEEE Conference on Computer Vision and Pattern Recognition, Las Vegas, NV, USA, 27–30 June 2016. [Google Scholar]
- Redmon, J.; Farhadi, A. YOLO9000: Better, Faster, Stronger. In Proceedings of the 2017 IEEE Conference on Computer Vision and Pattern Recognition, Honolulu, HI, USA, 21–26 July 2017. [Google Scholar]
- Redmon, J.; Farhadi, A. YOLOv3: An Incremental Improvement. arXiv 2018, arXiv:1804.02767. [Google Scholar]
- Bochkovskiy, A.; Wang, C.-Y.; Liao, H.-Y.M. YOLOv4: Optimal Speed and Accuracy of Object Detection. arXiv 2020, arXiv:abs/2004.10934. [Google Scholar]
- YOLOv5 Is Here: State-of-the-Art Object Detection at 140 FPS. Available online: https://blog.roboflow.com/yolov5-is-here (accessed on 12 December 2022).
- Li, C.; Li, L.; Jiang, H.; Weng, K.; Geng, Y.; Li, L.; Ke, Z.; Li, Q.; Cheng, M.; Nie, W.; et al. YOLOv6: A Single-Stage Object Detection Framework for Industrial Applications. arXiv 2022, arXiv:2209.02976. [Google Scholar]
- Wang, C.-Y.; Bochkovskiy, A.; Liao, H.-Y.M. YOLOv7: Trainable Bag-of-Freebies Sets New State-of-the-Art for Real-Time Object Detectors. arXiv 2022, arXiv:2207.02696. [Google Scholar]
- Girshick, R.; Donahue, J.; Darrell, T.; Malik, J. Rich Feature Hierarchies for Accurate Object Detection and Semantic Segmentation. In Proceedings of the 2014 IEEE Conference on Computer Vision and Pattern Recognition, Columbus, OH, USA, 23–28 June 2014. [Google Scholar]
- Girshick, R. Fast R-CNN. In Proceedings of the 2015 IEEE International Conference on Computer Vision, Santiago, Chile, 7–13 December 2015. [Google Scholar]
- Ren, S.; He, K.; Girshick, R.; Sun, J. Faster R-CNN: Towards Real-Time Object Detection with Region Proposal Networks. arXiv 2016, arXiv:1506.01497v3. [Google Scholar] [CrossRef]
- He, K.; Gkioxari, G.; Dollár, P.; Girshick, R. Mask R-CNN. arXiv 2018, arXiv:1703.06870v3. [Google Scholar]
- Ultralytics YOLOv8 Docs. Available online: https://docs.ultralytics.com/models/yolov8 (accessed on 6 February 2023).
- Deci Introduces YOLO-NAS—A Next-Generation, Object Detection Foundation Model Generated by Deci’s Neural Architecture Search Technology. Available online: https://deci.ai/blog/yolo-nas-foundation-model-object-detection (accessed on 15 August 2023).
- Yin, T.; Zhou, X.; Krähenbühl, P. Center-based 3D Object Detection and Tracking. In Proceedings of the 2021 IEEE/CVF Conference on Computer Vision and Pattern Recognition, Nashville, TN, USA, 20–25 June 2021. [Google Scholar]
- Xia, Y.; Wu, Q.; Li, W.; Chan, A.B.; Stilla, U. A lightweight and detector-free 3D single object tracker on point clouds. IEEE Trans. Intell. Transp. Syst. 2023, 24, 5543–5554. [Google Scholar] [CrossRef]
- Wang, L.; Zhang, X.; Song, Z.; Bi, J.; Zhang, G.; Wei, H.; Tang, L.; Yang, L.; Li, J.; Jia, C.; et al. Multi-modal 3D object detection in autonomous driving: A survey and taxonomy. IEEE Trans. Intell. Veh. 2023, 8, 3781–3798. [Google Scholar] [CrossRef]
- Güney, E.; Bayilmiş, C.; Çakan, B. An implementation of real-time traffic signs and road objects detection based on mobile GPU platforms. IEEE Access 2022, 10, 86191–86203. [Google Scholar] [CrossRef]
- Yan, W.; Yang, G.; Zhang, W.; Liu, L. Traffic Sign Recognition using YOLOv4. In Proceedings of the 2022 7th International Conference on Intelligent Computing and Signal Processing, Xi’an, China, 15–17 April 2022. [Google Scholar]
- Wang, L.; Zhou, K.; Chu, A.; Wang, G.; Wang, L. An improved light-weight traffic sign recognition algorithm based on YOLOv4-Tiny. IEEE Access 2021, 9, 124963–124971. [Google Scholar] [CrossRef]
- Yang, T.; Tong, C. Small Traffic Sign Detector in Real-time Based on Improved YOLO-v4. In Proceedings of the 2021 IEEE 23rd International Conference on High Performance Computing & Communications; the 7th International Conference on Data Science & Systems; the 19th International Conference on Smart City; the 7th International Conference on Dependability in Sensor, Cloud & Big Data Systems & Application, Haikou, China, 20–22 December 2021. [Google Scholar]
- Jiang, J.; Yang, J.; Yin, J. Traffic Sign Target Detection Method Based on Deep Learning. In Proceedings of the 2021 International Conference on Computer Information Science and Artificial Intelligence, Kunming, China, 17–19 September 2021. [Google Scholar]
- Wang, F.; Li, Y.; Wei, Y.; Dong, H. Improved Faster RCNN for Traffic Sign Detection. In Proceedings of the 2020 IEEE 23rd International Conference on Intelligent Transportation Systems, Rhodes, Greece, 20–23 September 2020. [Google Scholar]
- Yang, W.; Zhang, W. Real-Time Traffic Signs Detection Based on YOLO Network Model. In Proceedings of the 2020 International Conference on Cyber-Enabled Distributed Computing and Knowledge Discovery, Chongqing, China, 29–30 October 2020. [Google Scholar]
- Lin, H.; Zhou, J.; Chen, M. Traffic Sign Detection Algorithm Based on Improved YOLOv4. In Proceedings of the 2022 IEEE 10th Joint International Information Technology and Artificial Intelligence Conference, Chongqing, China, 17–19 June 2022. [Google Scholar]
- Chen, Y.; Wang, J.; Dong, Z.; Yang, Y.; Luo, Q.; Gao, M. An Attention Based YOLOv5 Network for Small Traffic Sign Recognition. In Proceedings of the 2022 IEEE 31st International Symposium on Industrial Electronics, Anchorage, AK, USA, 1–3 June 2022. [Google Scholar]
- Bhatt, N.; Laldas, P.; Lobo, V.B. A Real-Time Traffic Sign Detection and Recognition System on Hybrid Dataset using CNN. In Proceedings of the 2022 7th International Conference on Communication and Electronics Systems, Coimbatore, India, 22–24 June 2022. [Google Scholar]
- Tabernik, D.; Skočaj, D. Deep learning for large-scale traffic-sign detection and recognition. IEEE Trans. Intell. Transp. Syst. 2020, 21, 1427–1440. [Google Scholar] [CrossRef]
- Barodi, A.; Bajit, A.; Aidi, S.E.; Benbrahim, M.; Tamtaoui, A. Applying Real-Time Object Shapes Detection to Automotive Traffic Roads Signs. In Proceedings of the 2020 International Symposium on Advanced Electrical and Communication Technologies, Marrakech, Morocco, 25–27 November 2020. [Google Scholar]
- Liu, Z.; Musha, Y.; Wu, H. Detection of Traffic Sign Based on Improved YOLOv4. In Proceedings of the 2022 7th International Conference on Intelligent Computing and Signal Processing, Xi’an, China, 15–17 April 2022. [Google Scholar]
- Liu, S.; Li, H. Application of Chinese Traffic Sign Detection Based on Yolov4. In Proceedings of the 2021 7th International Conference on Computer and Communications, Chengdu, China, 10–13 December 2021. [Google Scholar]
- Gan, Z.; Wenju, L.; Wanghui, C.; Pan, S. Traffic Sign Recognition Based on Improved YOLOv4. In Proceedings of the 2021 6th International Conference on Intelligent Informatics and Biomedical Sciences, Oita, Japan, 25–27 November 2021. [Google Scholar]
- Zhang, T.; Gao, H. Detection Technology of Traffic Marking Edge. In Proceedings of the 2020 IEEE 2nd International Conference on Civil Aviation Safety and Information Technology, Weihai, China, 14–16 October 2020. [Google Scholar]
- Dewi, C.; Chen, R.-C.; Liu, Y.-T.; Jiang, X.; Hartomo, K.D. Yolo V4 for advanced traffic sign recognition with synthetic training data generated by various GAN. IEEE Access 2021, 9, 97228–97242. [Google Scholar] [CrossRef]
- Gu, Y.; Si, B. A Novel Lightweight real-time traffic sign detection integration framework based on YOLOv4. Entropy 2022, 24, 487. [Google Scholar] [CrossRef] [PubMed]
- Gong, Y.; Peng, J.; Jin, S.; Li, X.; Tan, Y.; Jia, Z. Research on YOLOv4 Traffic Sign Detection Algorithm Based on Deep Separable Convolution. In Proceedings of the 2021 IEEE International Conference on Emergency Science and Information Technology, Chongqing, China, 22–24 November 2021. [Google Scholar]
- Kong, S.; Park, J.; Lee, S.-S.; Jang, S.-J. Lightweight Traffic Sign Recognition Algorithm Based on Cascaded CNN. In Proceedings of the 2019 19th International Conference on Control, Automation and Systems (ICCAS), Jeju, Republic of Korea, 15–18 October 2019. [Google Scholar]
- Abraham, A.; Purwanto, D.; Kusuma, H. Traffic Lights and Traffic Signs Detection System Using Modified You Only Look Once. In Proceedings of the 2021 International Seminar on Intelligent Technology and Its Applications, Surabaya, Indonesia, 21–22 July 2021. [Google Scholar]
- Prakash, A.S.; Vigneshwaran, D.; Ayyalu, R.S.; Sree, S.J. Traffic Sign Recognition using Deeplearning for Autonomous Driverless Vehicles. In Proceedings of the 2021 5th International Conference on Computing Methodologies and Communication, Erode, India, 8–10 April 2021. [Google Scholar]
- Pavani, K.; Sriramya, P. Comparison of KNN, ANN, CNN and YOLO Algorithms for Detecting the Accurate Traffic Flow and Build an Intelligent Transportation System. In Proceedings of the 2022 2nd International Conference on Innovative Practices in Technology and Management, Gautam Buddha Nagar, India, 23–25 February 2022. [Google Scholar]
- He, H. Yolo Target Detection Algorithm in Road Scene Based on Computer Vision. In Proceedings of the 2022 IEEE Asia-Pacific Conference on Image Processing, Electronics and Computers, Dalian, China, 14–16 April 2022. [Google Scholar]
- Yang, K.; Gui, X. Research on Real-Time Detection of Road Vehicle Targets Based on YOLOV4 Improved Algorithm. In Proceedings of the 2022 3rd International Conference on Electronic Communication and Artificial Intelligence, Zhuhai, China, 14–16 January 2022. [Google Scholar]
- Hu, X.; Wei, Z.; Zhou, W. A Video Streaming Vehicle Detection Algorithm Based on YOLOv4. In Proceedings of the 2021 IEEE 5th Advanced Information Technology, Electronic and Automation Control Conference, Chongqing, China, 12–14 March 2021. [Google Scholar]
- Yang, F.; Zhang, X.; Zhang, S.; Li, C.; Hu, H. Design of Real-Time Vehicle Detection Based on YOLOv4. In Proceedings of the 2021 International Conference on Control, Automation and Information Sciences, Xi’an, China, 14–17 October 2021. [Google Scholar]
- Wang, H.; Zang, W. Research on Object Detection Method in Driving Scenario Based on Improved YOLOv4. In Proceedings of the 2022 IEEE 6th Information Technology and Mechatronics Engineering Conference, Chongqing, China, 4–6 March 2022. [Google Scholar]
- Wu, T.-H.; Wang, T.-W.; Liu, Y.-Q. Real-Time Vehicle and Distance Detection Based on Improved Yolo v5 Network. In Proceedings of the 2021 3rd World Symposium on Artificial Intelligence, Guangzhou, China, 18–20 June 2021. [Google Scholar]
- Altaf, M.; Rehman, F.U.; Chughtai, O. Discernible Effect of Video Quality for Distorted Vehicle Detection using Deep Neural Networks. In Proceedings of the 2021 IEEE 94th Vehicular Technology Conference (VTC2021-Fall), Norman, OK, USA, 27–30 September 2021. [Google Scholar]
- Zhu, D.; Xu, G.; Zhou, J.; Di, E.; Li, M. Object Detection in Complex Road Scenarios: Improved YOLOv4-Tiny Algorithm. In Proceedings of the 2021 2nd Information Communication Technologies Conference, Nanjing, China, 7–9 May 2021. [Google Scholar]
- Yu, X.; Marinov, M. A Study on Recent Developments and Issues with Obstacle Detection Systems for Automated Vehicles. Sustainability 2020, 12, 3281. [Google Scholar] [CrossRef]
- Hng, T.J.; Weilie, E.L.; Wei, C.S.; Srigrarom, S. Relative Velocity Model to Locate Traffic Accident with Aerial Cameras and YOLOv4. In Proceedings of the 2021 13th International Conference on Information Technology and Electrical Engineering, Chiang Mai, Thailand, 14–15 October 2021. [Google Scholar]
- Chen, T.; Yao, D.-C.; Gao, T.; Qiu, H.-H.; Guo, C.-X.; Liu, Z.-W.; Li, Y.-H.; Bian, H.-Y. A fused network based on PReNet and YOLOv4 for traffic object detection in rainy environment. J. Traffic Transp. Eng. 2022, 22, 225–237. [Google Scholar]
- Wang, C.; Dai, Y.; Zhou, W.; Geng, Y. A vision-based video crash detection framework for mixed traffic flow environment considering low-visibility condition. J. Adv. Transp. 2020, 2020, 9194028. [Google Scholar] [CrossRef]
- Yan, S.; Liu, X.; Qian, W.; Chen, Q. An End-to-End Traffic Light Detection Algorithm Based on Deep Learning. In Proceedings of the 2021 International Conference on Security, Pattern Analysis, and Cybernetics, Chengdu, China, 18–20 June 2021. [Google Scholar]
- Shubho, F.H.; Iftekhar, F.; Hossain, E.; Siddique, S. Real-time Traffic Monitoring and Traffic Offense Detection Using YOLOv4 and OpenCV DNN. In Proceedings of the TENCON 2021—2021 IEEE Region 10 Conference (TENCON), Auckland, New Zealand, 7–10 December 2021. [Google Scholar]
- Yu, G.; Qiu, D. Research on Lane Detection Method of Intelligent Vehicle in Multi-road Condition. In Proceedings of the 2021 China Automation Congress, Beijing, China, 22–24 October 2021. [Google Scholar]
- Trivedi, Y.; Negandhi, P. An Advanced Driver Assistance System Using Computer Vision and Deep-Learning. In Proceedings of the 2018 Second International Conference on Intelligent Computing and Control Systems, Madurai, India, 14–15 June 2018. [Google Scholar]
- Chen, P.-R.; Lo, S.-Y.; Hang, H.-M.; Chan, S.-W.; Lin, J.-J. Efficient Road Lane Marking Detection with Deep Learning. In Proceedings of the 2018 IEEE 23rd International Conference on Digital Signal Processing, Shanghai, China, 19–21 November 2018. [Google Scholar]
- Wu, J.-W.; Wu, C.-C.; Cen, W.-S.; Chao, S.-A.; Weng, J.-T. Integrated Compressed Sensing and YOLOv4 for Application in Image-storage and Object-recognition of Dashboard Camera. In Proceedings of the 2021 Australian & New Zealand Control Conference, Gold Coast, Australia, 25–26 November 2021. [Google Scholar]
- Chung, Y.-L.; Lin, C.-K. Application of a model that combines the YOLOv3 object detection algorithm and Canny edge detection algorithm to detect highway accidents. Symmetry 2020, 12, 1875. [Google Scholar] [CrossRef]
- Chung, Y.-L.; Yang, J.-J. Application of a Mask R-CNN-Based Deep Learning Model Combined with the Retinex Image Enhancement Algorithm for Detecting Rockfall and Potholes on Hill Roads. In Proceedings of the 11th IEEE International Conference on Consumer Electronics—Berlin, Berlin, Germany, 15–18 November 2021. [Google Scholar]
- Chung, Y.-L. ETLU: Enabling efficient simultaneous use of licensed and unlicensed bands for D2D-assisted mobile users. IEEE Syst. J. 2018, 12, 2273–2284. [Google Scholar] [CrossRef]
- Chung, Y.-L.; Wu, S.-H. An effective toss-and-catch algorithm for fixed-rail mobile terminal equipment that ensures reliable transmission and non-interruptible handovers. Symmetry 2021, 13, 582. [Google Scholar] [CrossRef]
- Car Crashes Time YouTube Channel. Available online: https://www.youtube.com/user/CarCrashesTime (accessed on 17 September 2023).
- Zhu, Z.; Liang, D.; Zhang, S.; Huang, X.; Li, B.; Hu, S. Traffic-Sign Detection and Classification in the Wild. In Proceedings of the 2016 IEEE Conference on Computer Vision and Pattern Recognition (CVPR), Las Vegas, NV, USA, 27–30 June 2016. [Google Scholar]
- On a Normal Road in the Daytime under a Rush-Hour Traffic Jam Condition. YouTube. Available online: https://youtu.be/xMHtpM6rSmk (accessed on 16 January 2023).
- On a Hill Road in the Daytime. YouTube. Available online: https://youtu.be/a1_DcM5tGYM (accessed on 16 January 2023).
- GS980D Front View Footage in 4K on a Highway on a Rainy Night. YouTube. Available online: https://youtu.be/gCry3oTFIc0 (accessed on 16 January 2023).
- Please Drive Safely on Hill Roads When It’s Raining. YouTube. Available online: https://youtu.be/RO9-R_EN3nY (accessed on 1 February 2023).
- Rainy Day Dashcam Footage. YouTube. Available online: https://youtu.be/iQkxeghxAvQ (accessed on 1 February 2023).
- Mio Mivue M733 WIFI Dashcam Footage on a Scooter on a Foggy day. YouTube. Available online: https://youtu.be/CUn27eD0JaQ (accessed on 1 February 2023).

| Year | Total |
|---|---|
| 2016 | 305,556 |
| 2017 | 296,826 |
| 2018 | 320,315 |
| 2019 | 341,972 |
| 2020 | 362,393 |
| 2021 | 358,221 |
| 2022 | 375,632 |
| Year | Total |
|---|---|
| 2016 | 2,783,751 |
| 2017 | 2,816,540 |
| 2018 | 2,953,940 |
| 2019 | 3,130,010 |
| 2020 | 3,169,631 |
| 2021 | 3,572,665 |
| 2022 | 3,621,383 |
| Speed Limit | 30 | 40 | 50 |
|---|---|---|---|
| Speed limit sign | 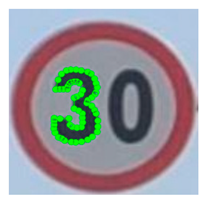 | 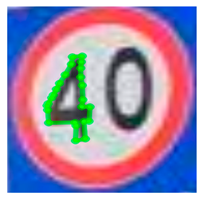 |  |
| Speed Limit | 60 | 70 | 80 |
| Speed limit sign |  |  | 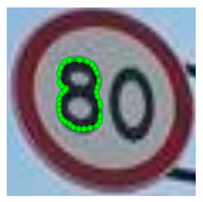 |
| Speed Limit | 90 | 100 | 110 |
| Speed limit sign | 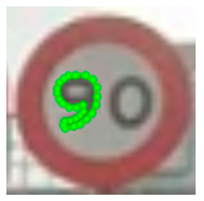 | 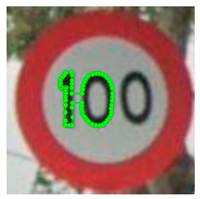 |  |
 |  |  |
 |  |  |
 |  |  |
 |  |  |
 |  |  |
 |  |  |
 |  |  |
 |  |  |
 |  |  |
 |  |  |
 |  |  |
 |  |  |
 |  |  |
 |  |  |
 |  |  |
 |  |  |
 |  |  |
 |  |  |
 |  |  |
 |  |  |
 |  |  |
 |  |  |
| Model | M1 | M2 | M3 | M4 |
|---|---|---|---|---|
| Components | YOLOv7 | YOLOv7 + Mask R-CNN | Rotation angle and Gaussian noise + YOLOv7 + Mask R-CNN | Rotation angle and Gaussian noise + Canny edge detection + YOLOv7 + Mask R-CNN |
| Processor | Intel(R)Core(TM)i5-8500CPU @ 3.00GHZ * 6 |
| Display card | NVIDIA GeForce RTX 3060 12 GB |
| Operating system | Windows 10 |
| Memory | 32 GB (RAM) |
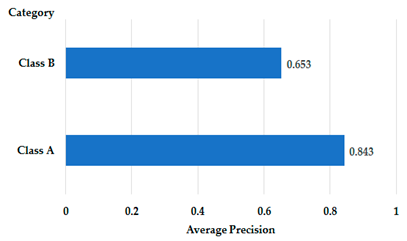
| Category | Class A (Speed Limit Signs) | Class B (Rockfalls, Potholes, and Car Crashes) | |
|---|---|---|---|
| Condition | |||
| Daytime | 1854 | 252 | |
| Nighttime | 441 | 147 | |
| Rainy day | 273 | 160 | |
| Foggy day | 132 | 37 | |
| Category | Class A (Speed Limit Signs) | Class B (Rockfalls, Potholes, and Car Crashes) | |
|---|---|---|---|
| Condition | |||
| Daytime | 186 | 25 | |
| Nighttime | 55 | 15 | |
| Rainy day | 27 | 16 | |
| Foggy day | 13 | 4 | |
| M1 mAP: 79.60% | mAP of YOLOv7 in M2: 74.80% |
 |  |
| mAP of YOLOv7 in M3: 79.30% | mAP of YOLOv7 in M4: 85.80% |
 |  |
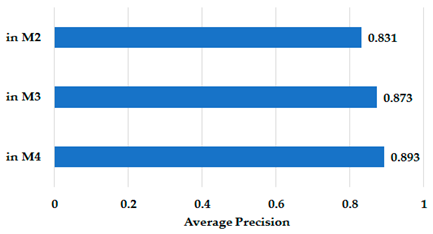
| mAPs of Mask R-CNN in M2, M3, M4: 83.10%, 87.30%, 89.30%, respectively | |
 | |
| Model | M1 | M2 | M3 | M4 |
|---|---|---|---|---|
| Model mAP | 79.60% | 81.32% | 85.60% | 88.20% |
| Images That Did Not Contain Class A or Class B Objects | Images That Contained Class A Objects | Images That Contained Class B Objects | Number of Incorrectly Detected Images | Error Rate | |
|---|---|---|---|---|---|
| Video 1 | 59 | 3 | 0 | 1 | 1.69% |
| Video 2 | 54 | 0 | 6 | 0 | 0% |
| Video 3 | 50 | 0 | 0 | 7 | 14% |
| Video 4 | 20 | 0 | 0 | 0 | 0% |
| Video 5 | 62 | 0 | 0 | 3 | 4.84% |
| Video 6 | 74 | 0 | 0 | 14 | 18.92% |
Disclaimer/Publisher’s Note: The statements, opinions and data contained in all publications are solely those of the individual author(s) and contributor(s) and not of MDPI and/or the editor(s). MDPI and/or the editor(s) disclaim responsibility for any injury to people or property resulting from any ideas, methods, instructions or products referred to in the content. |
© 2023 by the author. Licensee MDPI, Basel, Switzerland. This article is an open access article distributed under the terms and conditions of the Creative Commons Attribution (CC BY) license (https://creativecommons.org/licenses/by/4.0/).
Share and Cite
Chung, Y.-L. Application of an Effective Hierarchical Deep-Learning-Based Object Detection Model Integrated with Image-Processing Techniques for Detecting Speed Limit Signs, Rockfalls, Potholes, and Car Crashes. Future Internet 2023, 15, 322. https://doi.org/10.3390/fi15100322
Chung Y-L. Application of an Effective Hierarchical Deep-Learning-Based Object Detection Model Integrated with Image-Processing Techniques for Detecting Speed Limit Signs, Rockfalls, Potholes, and Car Crashes. Future Internet. 2023; 15(10):322. https://doi.org/10.3390/fi15100322
Chicago/Turabian StyleChung, Yao-Liang. 2023. "Application of an Effective Hierarchical Deep-Learning-Based Object Detection Model Integrated with Image-Processing Techniques for Detecting Speed Limit Signs, Rockfalls, Potholes, and Car Crashes" Future Internet 15, no. 10: 322. https://doi.org/10.3390/fi15100322
APA StyleChung, Y.-L. (2023). Application of an Effective Hierarchical Deep-Learning-Based Object Detection Model Integrated with Image-Processing Techniques for Detecting Speed Limit Signs, Rockfalls, Potholes, and Car Crashes. Future Internet, 15(10), 322. https://doi.org/10.3390/fi15100322