
A Novel Machine Learning Prediction Model for Aerosol Transport in Upper 17-Generations of the Human Respiratory Tract


Abstract
1. Introduction
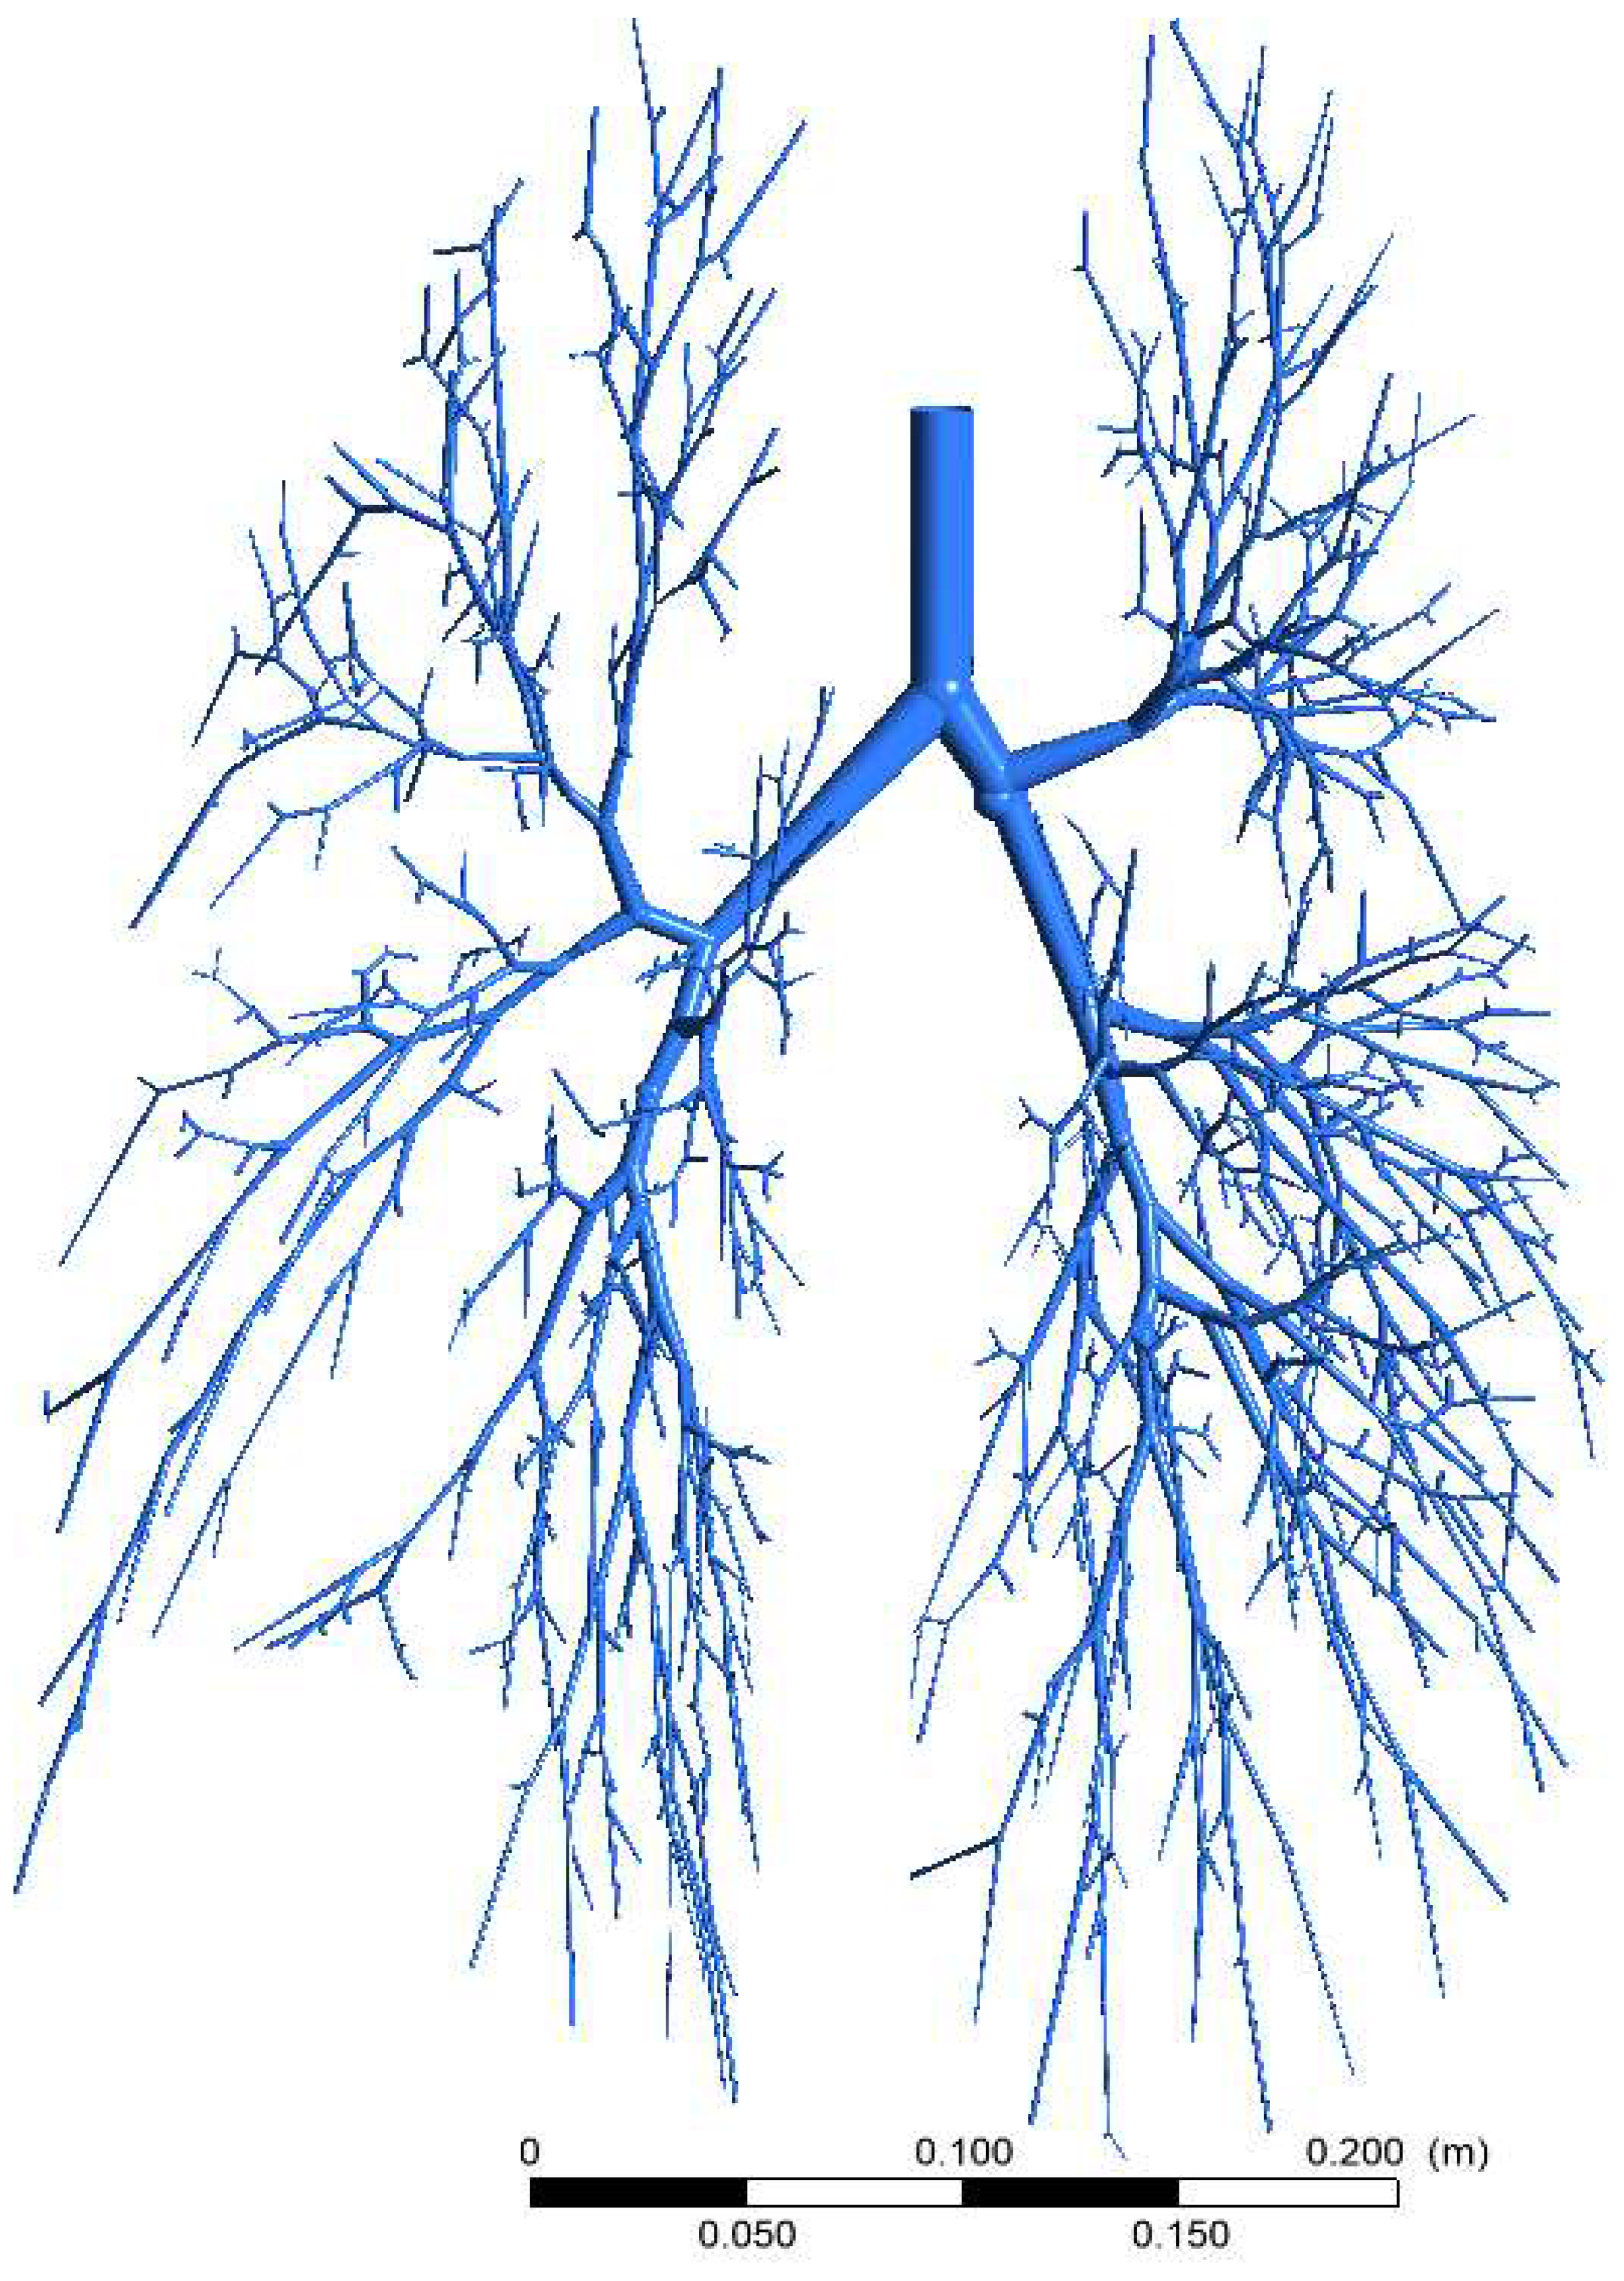
2. Problem Definition and Numerical Methods
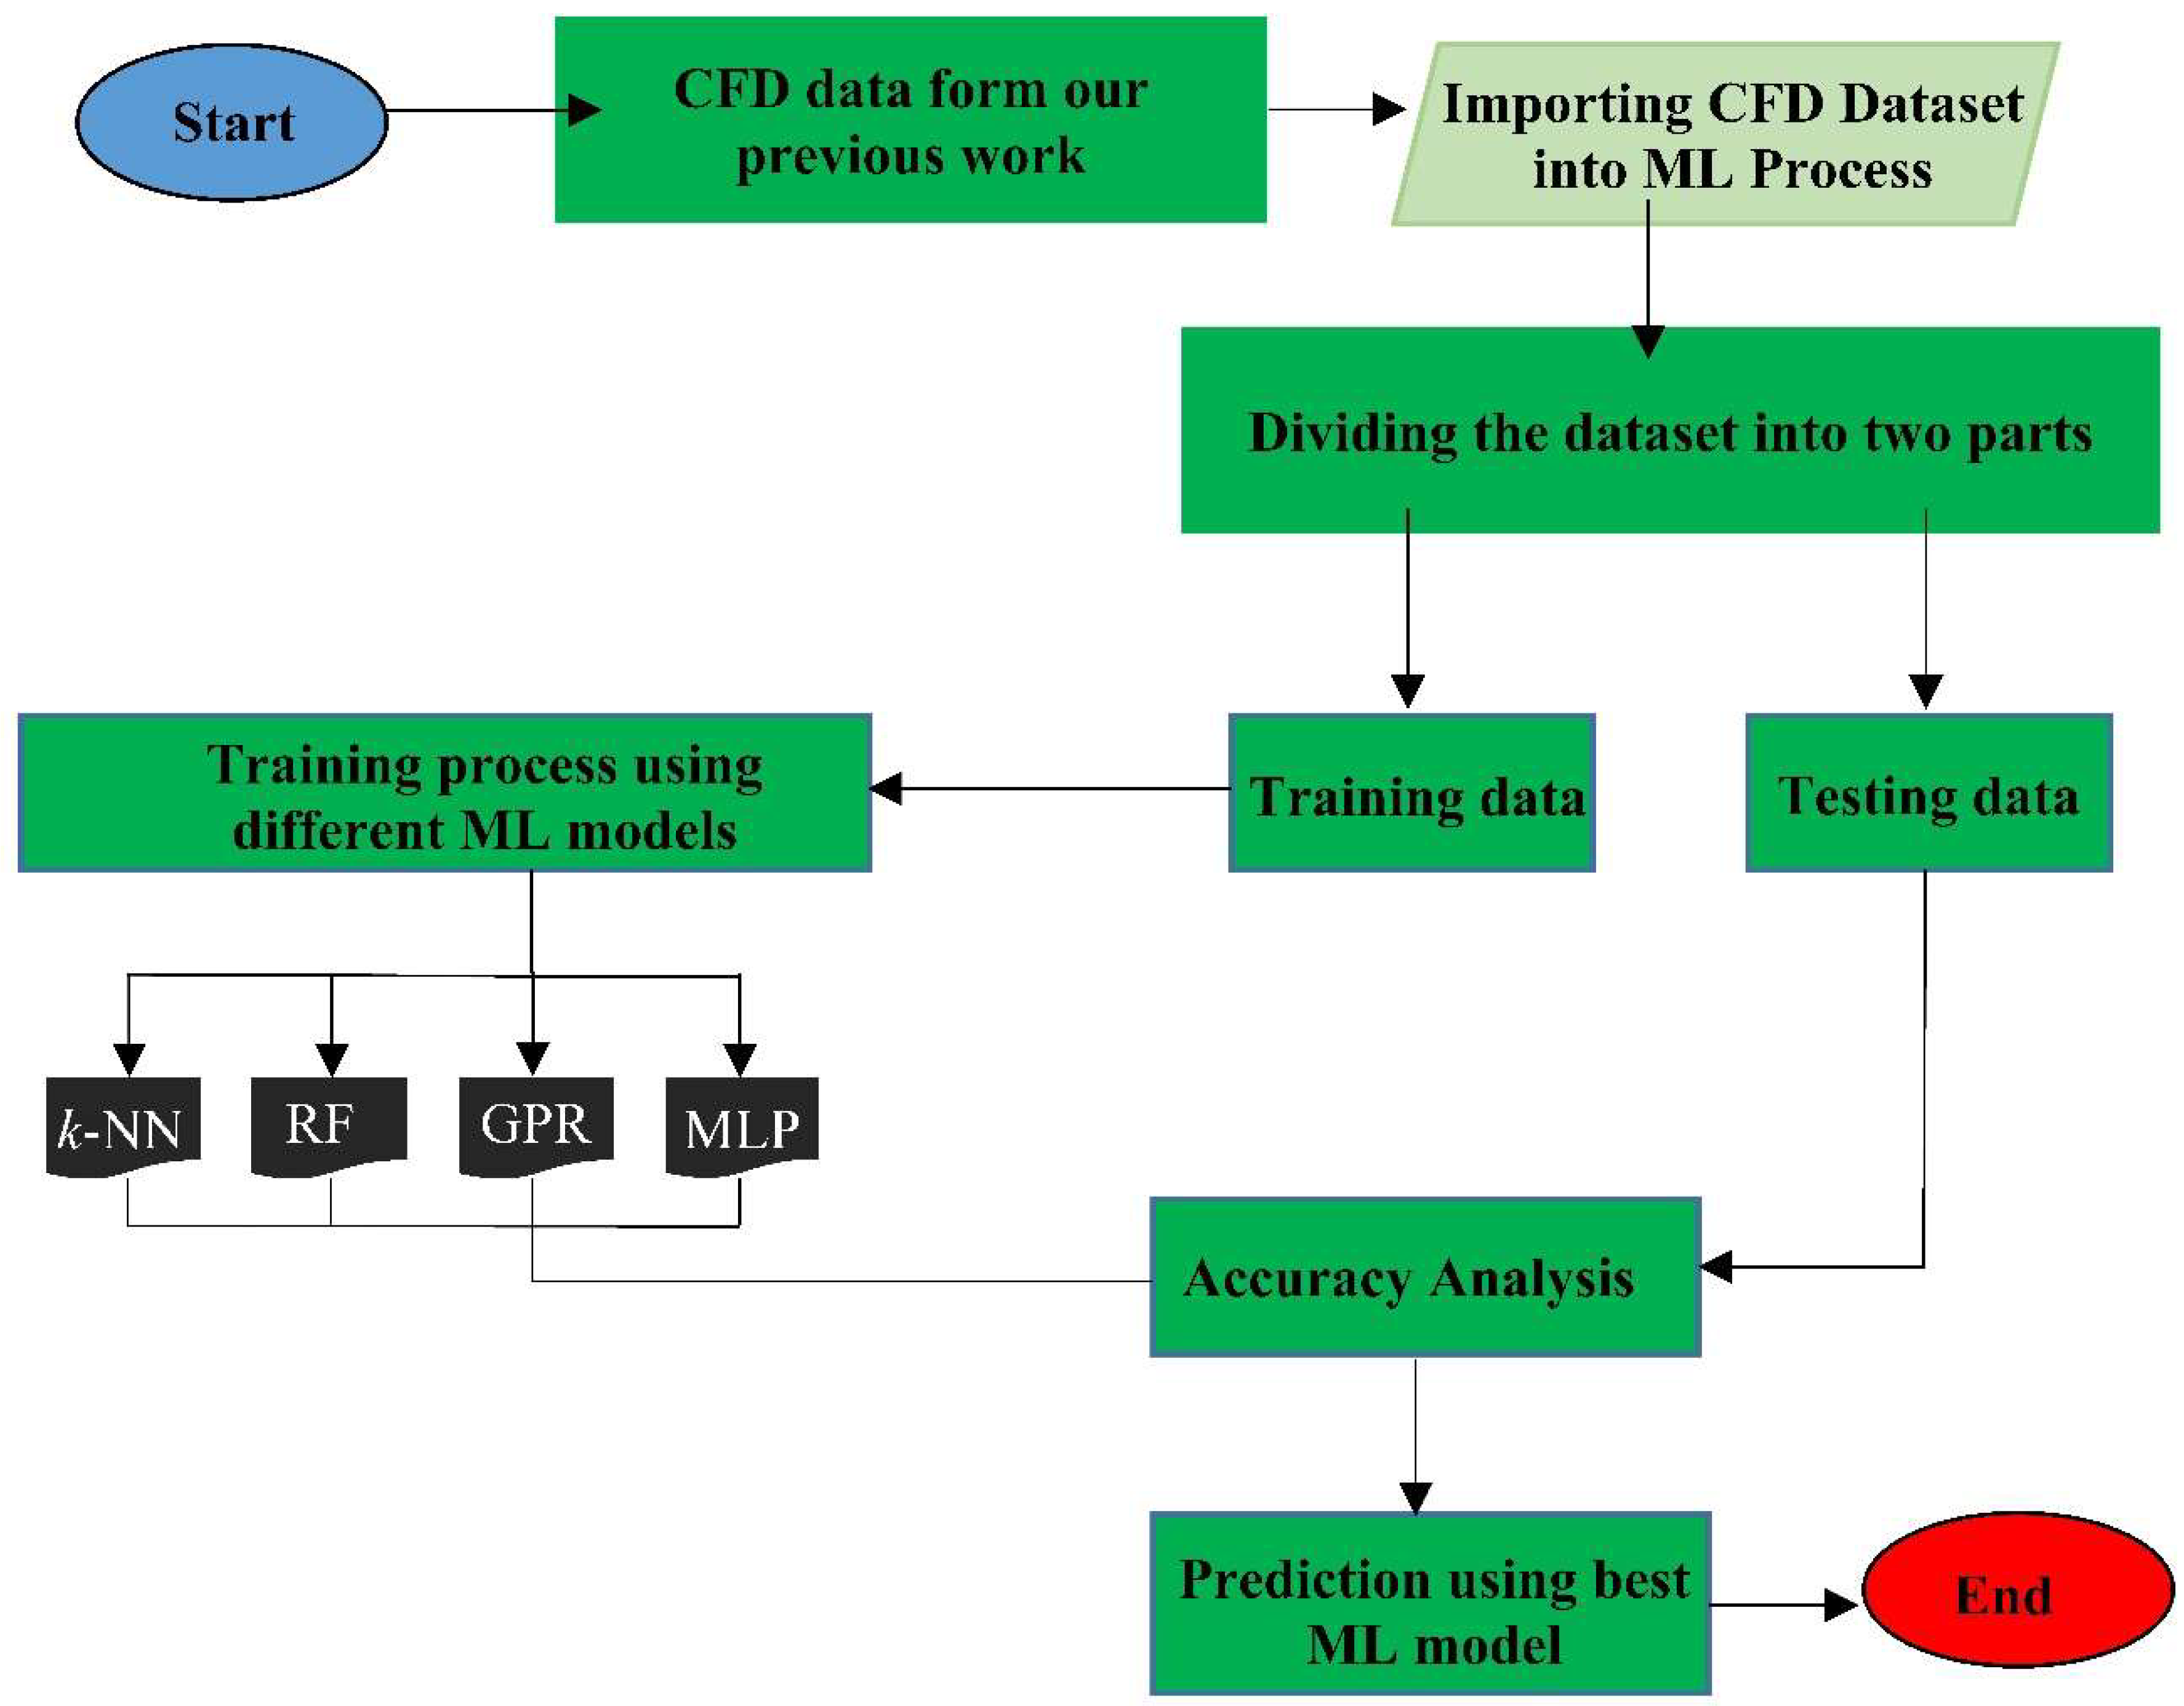
3. Methodology
Machine Learning Regression Models
4. Results and Discussion
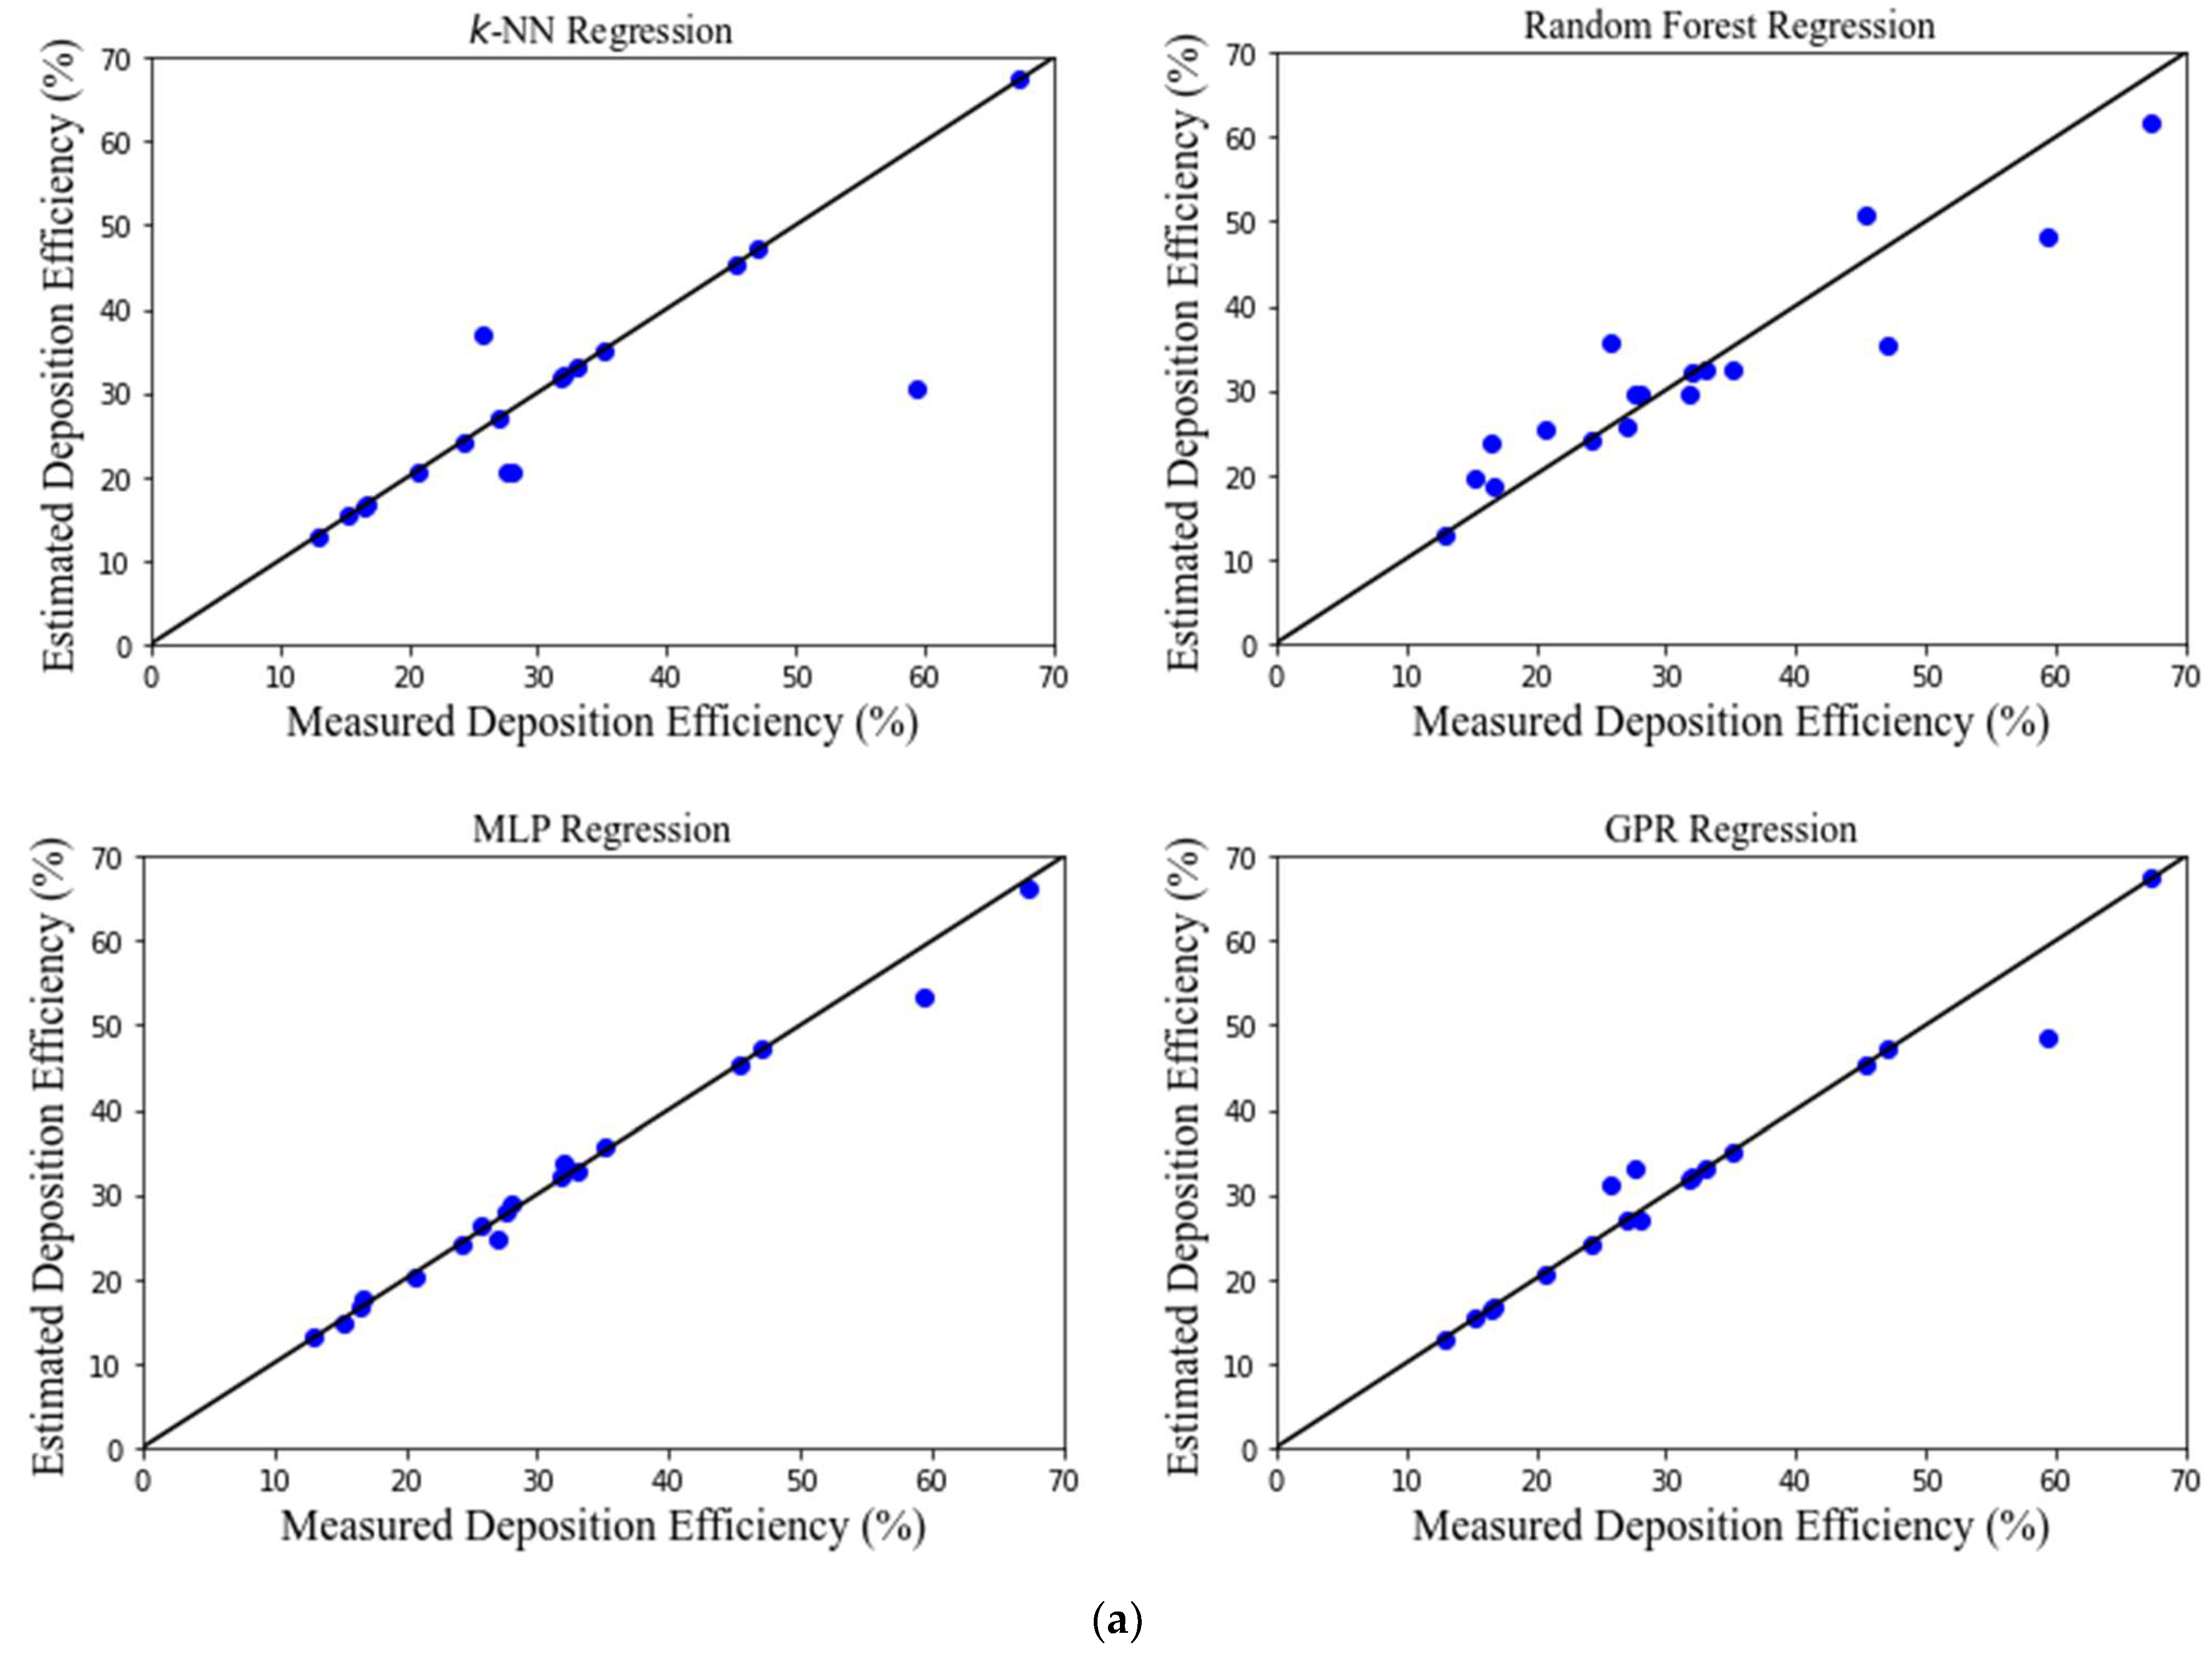
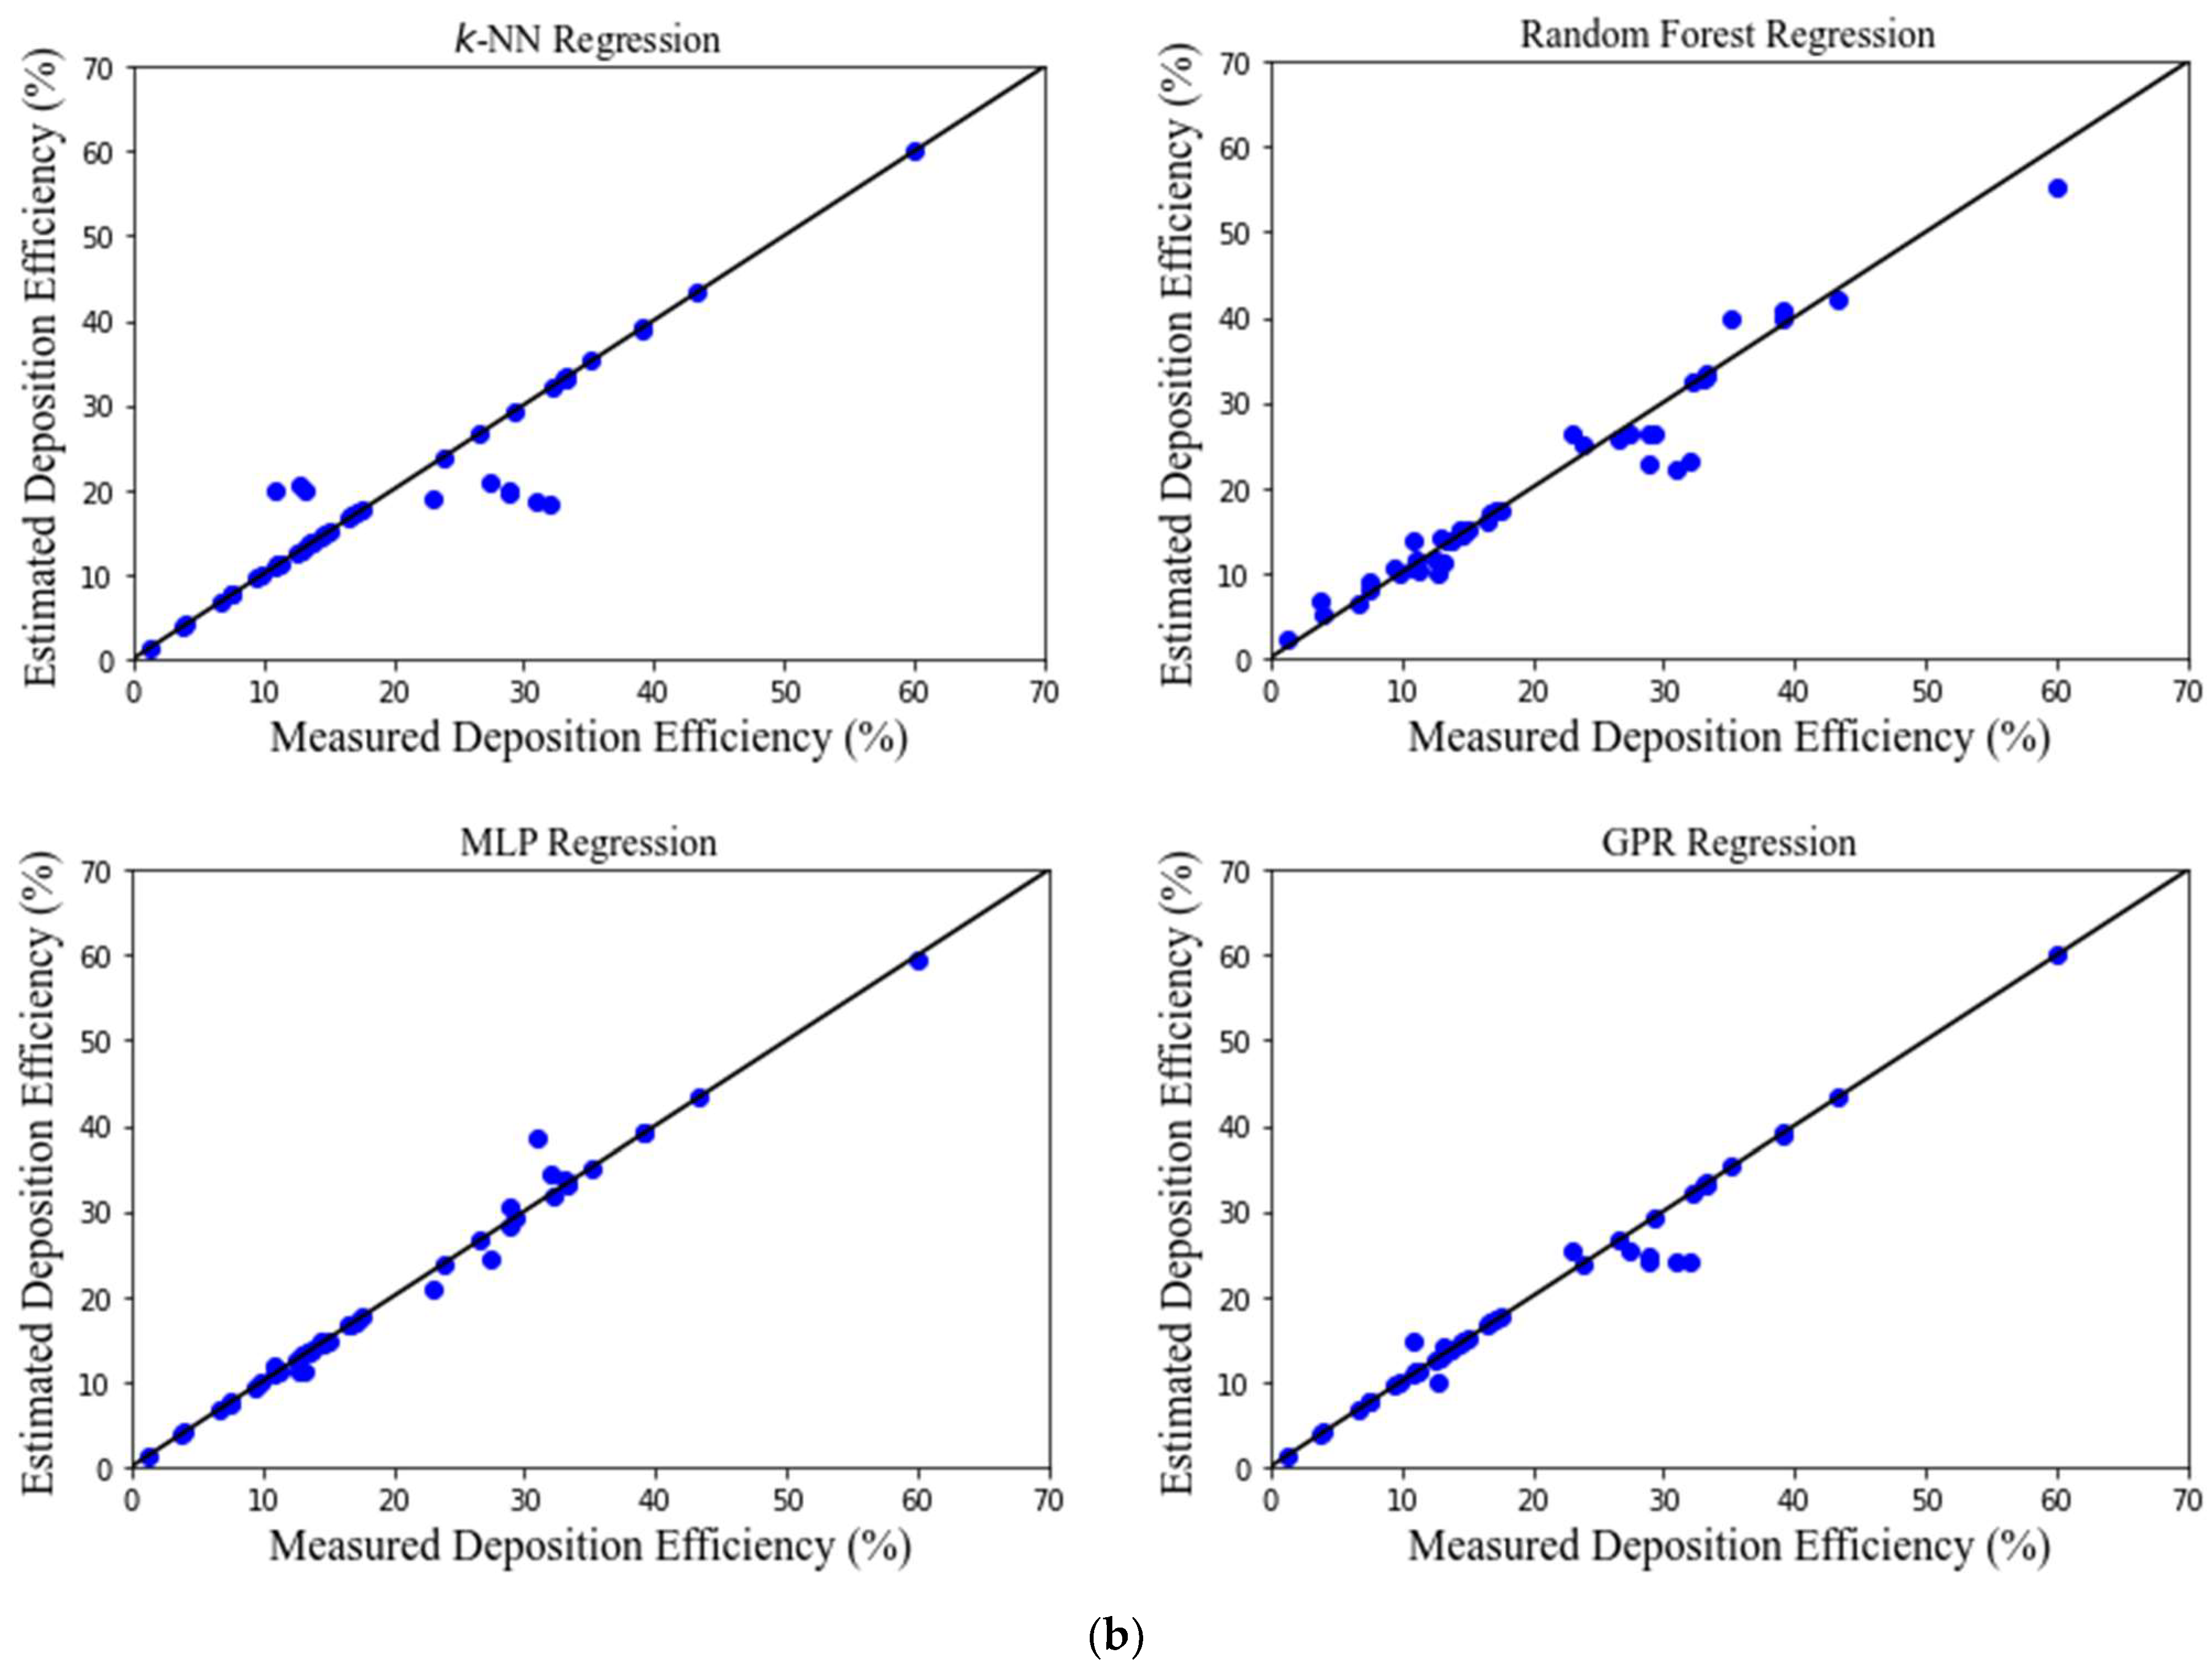
4.1. Regression Model Results
- Performance evaluation
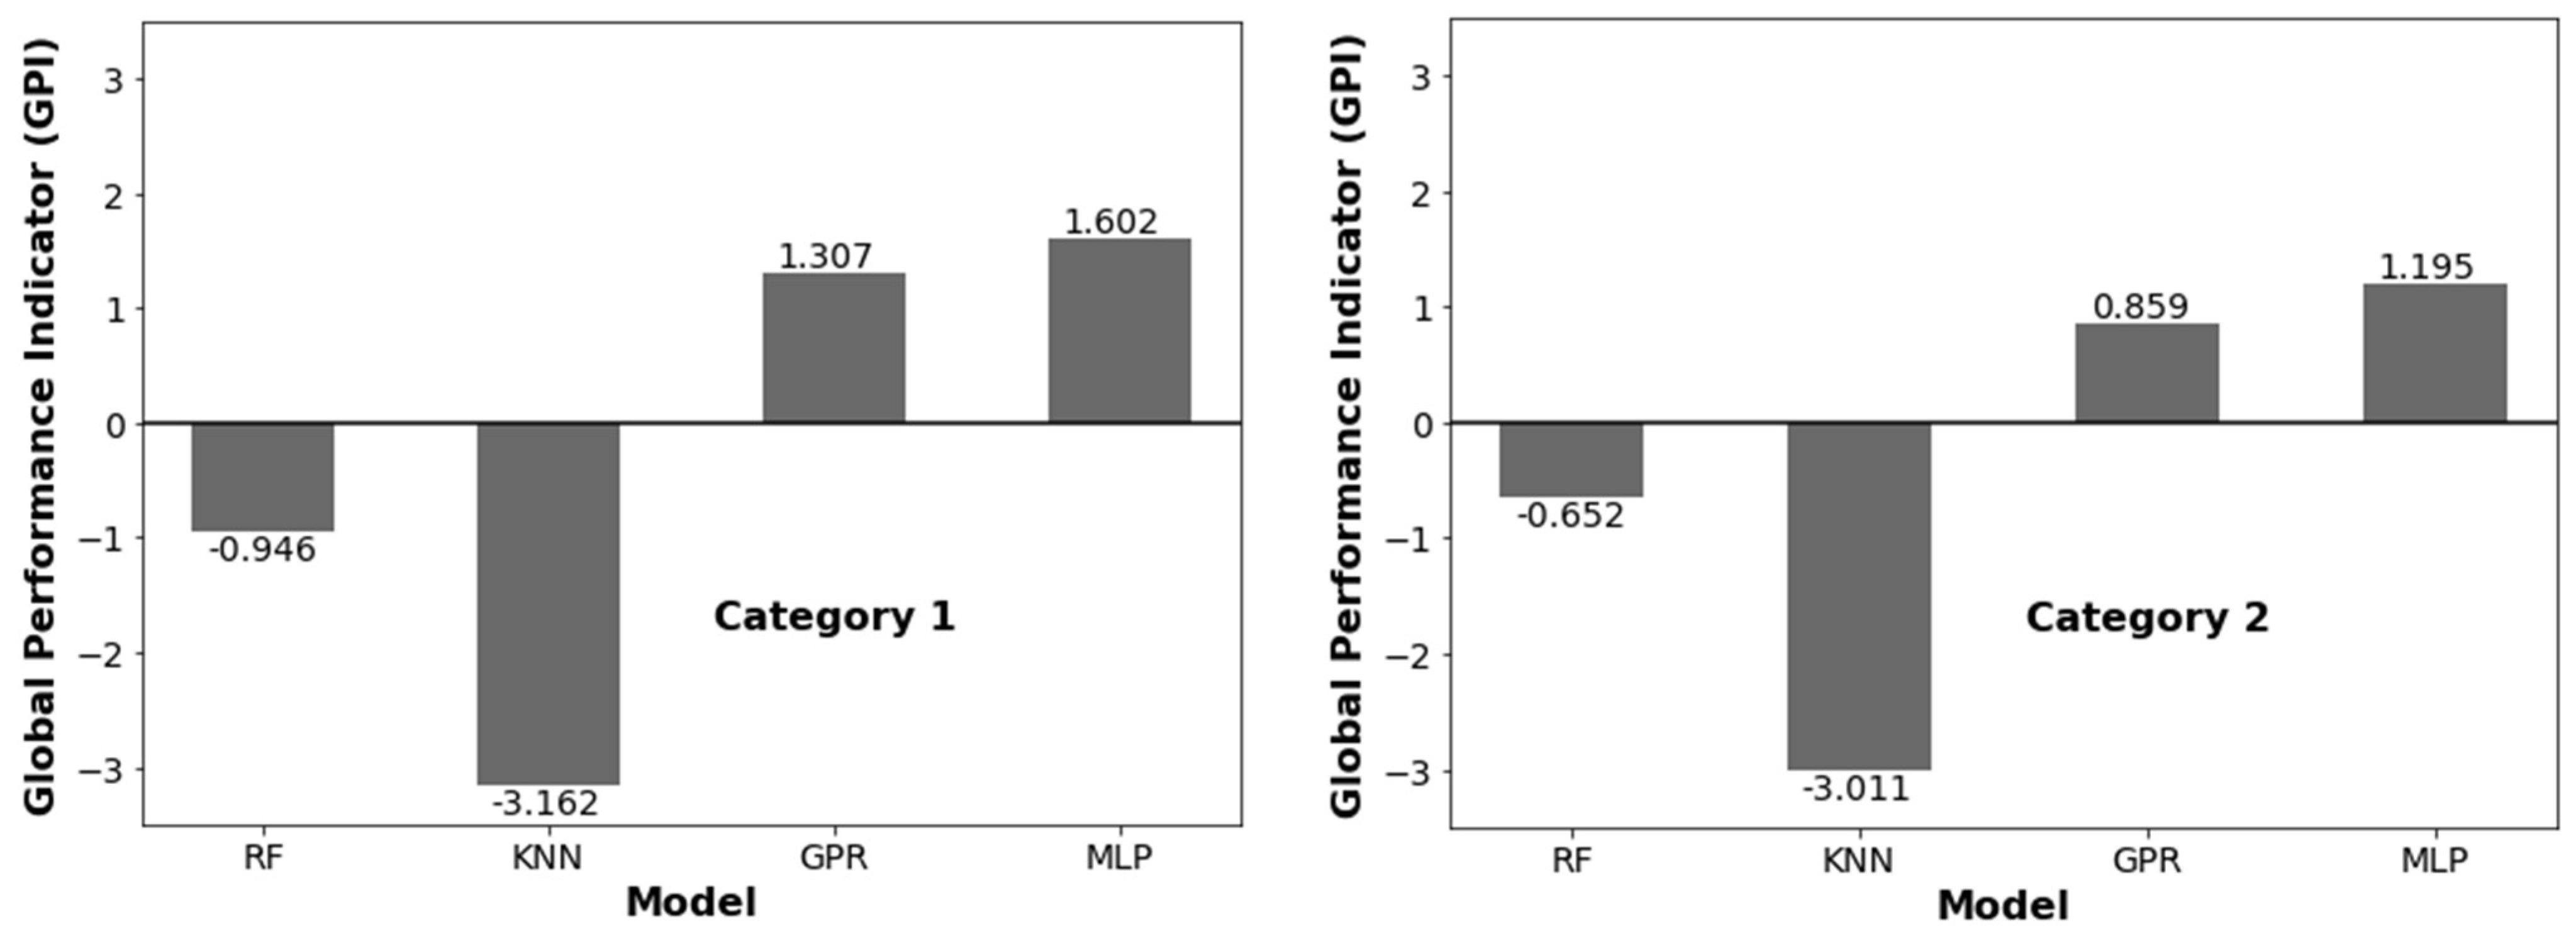
- Global Performance Indicator (GPI)
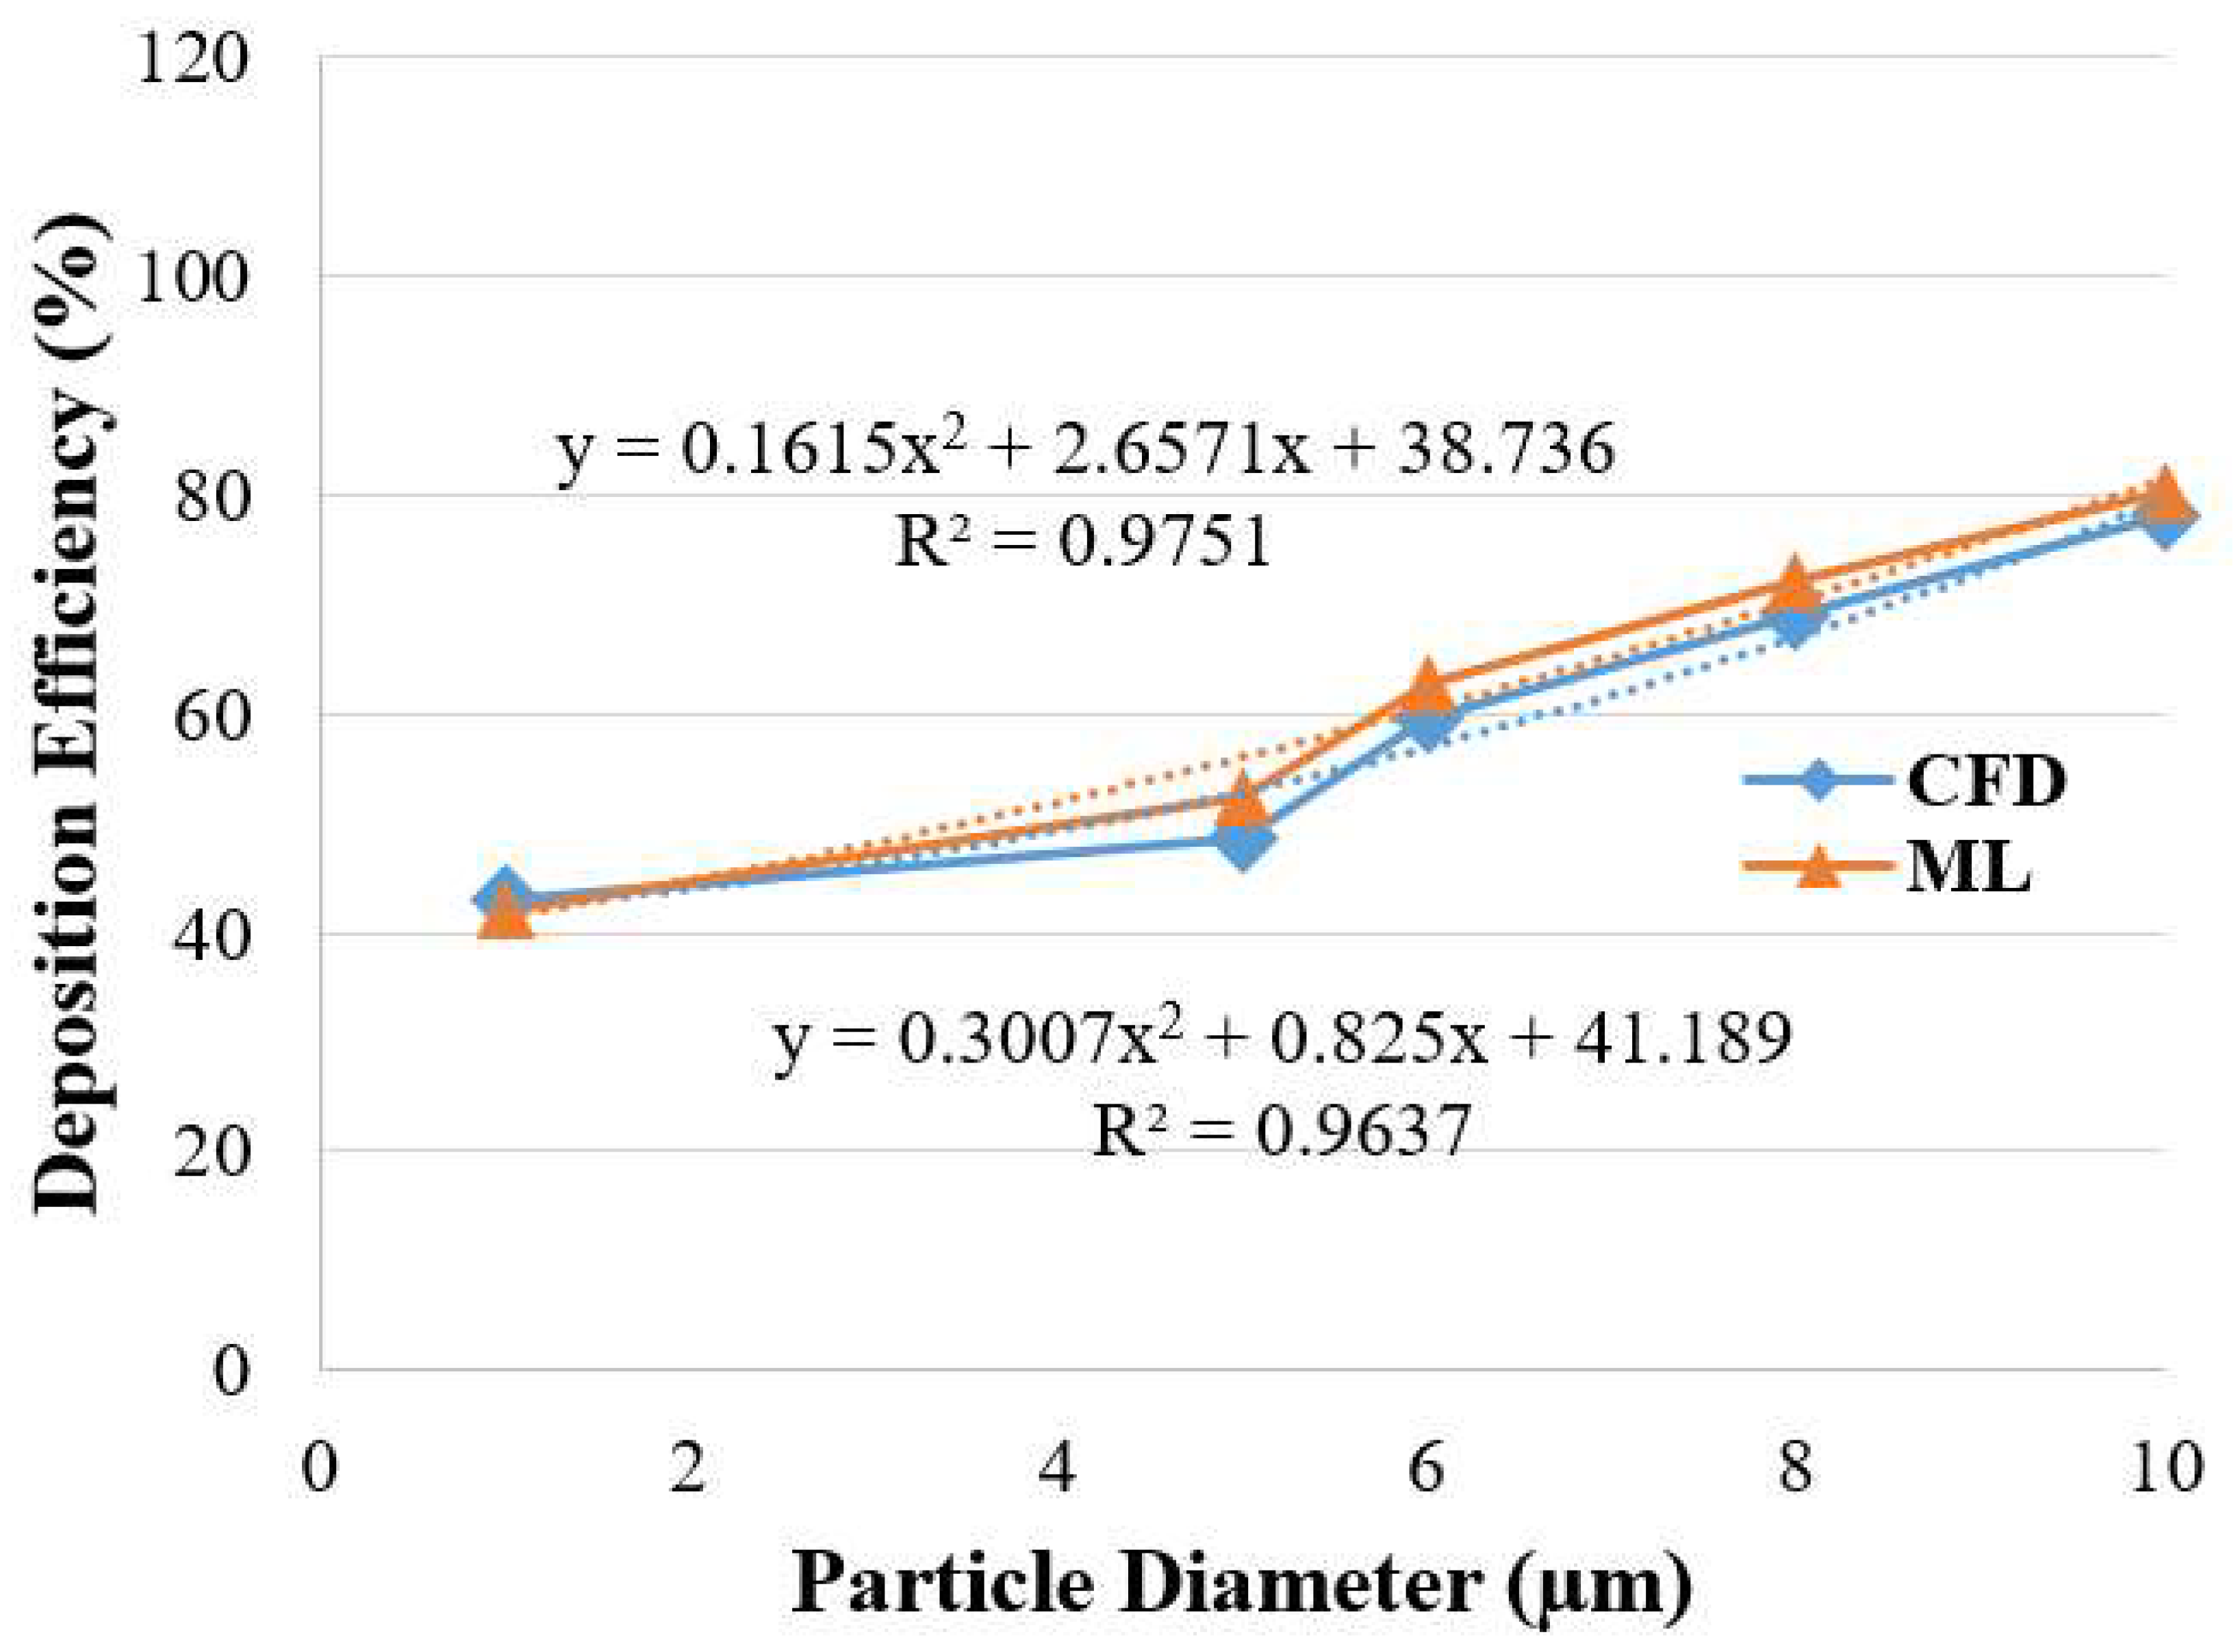
4.2. Prediction Using ML Regression
5. Conclusions
Author Contributions
Funding
Institutional Review Board Statement
Informed Consent Statement
Data Availability Statement
Conflicts of Interest
References
- Bass, K.; Farkas, D.; Hassan, A.; Bonasera, S.; Hindle, M.; Longest, W. High-efficiency dry powder aerosol delivery to children: Review and application of new technologies. J. Aerosol Sci. 2020, 153, 105692. [Google Scholar] [CrossRef] [PubMed]
- Koullapis, P.; Nicolaou, L.; Kassinos, S.C. In silico assessment of mouth-throat effects on regional deposition in the uppertracheobronchial airways. J. Aerosol Sci. 2018, 117, 164–188. [Google Scholar] [CrossRef]
- Cheng, Y.-S.; Smith, S.M.; Yeh, H.-C.; Kim, D.-B.; Cheng, K.-H.; Swift, D.L. Deposition of ultrafine aerosols and thoron progeny in replicas of nasal airways of young children. Aerosol Sci. Technol. 1995, 23, 541–552. [Google Scholar] [CrossRef]
- Hofmann, W.; Steinhausler, F.; Pohl, E. Dose Calculations For the Respiratory Tract From Inhaled Natural Radioactive NuclidesAs a Function of Age-I: Compartmental Deposition, Retention and Resulting Dose. Health Phys. 1979, 37, 517–532. [Google Scholar] [CrossRef] [PubMed]
- Gemci, T.; Ponyavin, V.; Chen, Y.; Chen, H.; Collins, R. Computational model of airflow in upper 17 generations of human respiratory tract. J. Biomech. 2008, 41, 2047–2054. [Google Scholar] [CrossRef]
- Zhang, Z.; Kleinstreuer, C.; Donohue, J.F.; Kim, C.S. Comparison of micro- and nano-size particle depositions in a human upper airway model. J. Aerosol Sci. 2005, 36, 211–233. [Google Scholar] [CrossRef]
- Islam, M.S.; Saha, S.C.; Sauret, E.; Gemci, T.; Gu, Y.T. Pulmonary aerosol transport and deposition analysis in upper 17 generations of the human respiratory tract. J. Aerosol Sci. 2017, 108, 29–43. [Google Scholar] [CrossRef]
- Cheng, K.-H.; Cheng, Y.-S.; Yeh, H.-C.; Guilmette, R.A.; Simpson, S.Q.; Yang, Y.-H.; Swift, D.L. In vivo measurements of nasal airway dimensions and ultrafine aerosol deposition in the human nasal and oral airways. J. Aerosol Sci. 1996, 27, 785–801. [Google Scholar] [CrossRef]
- Zhang, Z.; Kleinstreuer, C.; Kim, C.S. Airflow and nanoparticle deposition in a 16-generation tracheobronchial airway model. Ann. Biomed. Eng. 2008, 36, 2095–2110. [Google Scholar] [CrossRef]
- Schmidt, A.; Zidowitz, S.; Kriete, A.; Denhard, T.; Krass, S.; Peitgen, H.O. A digital reference model of the human bronchial tree. Comput. Med. Imaging Graph. 2004, 28, 203–211. [Google Scholar] [CrossRef]
- Islam, M.S.; Saha, S.C.; Sauret, E.; Gemci, T.; Yang, I.A.; Gu, Y. Ultrafine particle transport and deposition in a large scale 17-generation lung model. J. Biomech. 2017, 64, 16–25. [Google Scholar] [CrossRef] [PubMed]
- Jalalifar, S.; Masoudi, M.; Abbassi, R.; Garaniya, V.; Ghiji, M.; Salehi, F. A hybrid SVR-PSO model to predict a CFD-based optimised bubbling fluidised bed pyrolysis reactor. Energy 2020, 191, 116414. [Google Scholar] [CrossRef]
- Gholizadeh, M.; Jamei, M.; Ahmadianfar, I.; Pourrajab, R. Prediction of nanofluids viscosity using random forest (RF) approach. Chemom. Intell. Lab. Syst. 2020, 201, 104010. [Google Scholar] [CrossRef]
- Kwon, B.; Ejaz, F.; Hwang, L.K. Machine learning for heat transfer correlations. Int. Commun. Heat Mass Transf. 2020, 116, 104694. [Google Scholar] [CrossRef]
- Jamei, M.; Ahmadianfar, I.; Olumegbon, I.A.; Karbasi, M.; Asadi, A. On the assessment of specific heat capacity of nanofluids for solar energy applications: Application of Gaussian process regression (GPR) approach. J. Energy Storage 2021, 33, 102067. [Google Scholar] [CrossRef]
- Modaresi, F.; Araghinejad, S.; Ebrahimi, K. A Comparative Assessment of Artificial Neural Network, Generalized Regression Neural Network, Least-Square Support Vector Regression, and K-Nearest Neighbor Regression for Monthly Streamflow Forecasting in Linear and Nonlinear Conditions. Water Resour. Manag. 2018, 32, 243–258. [Google Scholar] [CrossRef]
- Rasmussen, C.E.; Williams, C.K.I. Gaussian Processes for Machine Learning; MIT Press: Cambridge, MA, USA, 2018. [Google Scholar] [CrossRef]
- Breiman, L. Random Forests. Mach. Learn. 2001, 45, 5–32. [Google Scholar] [CrossRef]
- Pedregosa, F.; Varoquaux, G.; Gramfort, A.; Michel, V.; Thirion, B.; Grisel, O.; Blondel, M.; Prettenhofer, P.; Weiss, R.; Dubourg, V.; et al. Scikit-learn: Machine Learning in Python. J. Mach. Learn. Res. 2012, 12, 2825–2830. [Google Scholar] [CrossRef]
- Husain, S.; Khan, U.A. Machine learning models to predict diffuse solar radiation based on diffuse fraction and diffusion coefficient models for humid-subtropical climatic zone of India. Clean. Eng. Technol. 2021, 5, 100262. [Google Scholar] [CrossRef]
- Mohammadpour, J.; Salehi, F.; Sheikholeslami, M.; Masoudi, M.; Lee, A. Optimisation of nanofluid heat transfer in a microchannel heat sink with multiple synthetic jets based on CFD-DPM and MLA. Int. J. Therm. Sci. 2021, 167, 107008. [Google Scholar] [CrossRef]
- Hu, H. Enhanced Gabor Feature Based Classification Using a Regularized Locally Tensor Discriminant Model for Multiview Gait Recognition. IEEE Trans. Circuits Syst. Video Technol. 2013, 23, 1274–1286. [Google Scholar] [CrossRef]
- Vinci, A.; Zoli, L.; Sciti, D.; Melandri, C.; Guicciardi, S. Understanding the Mechanical Properties of Novel UHTCMCs through Random Forest and Regression Tree Analysis. Mater. Des. 2018, 145, 97–107. [Google Scholar] [CrossRef]
- Williams, C.K.I. Gaussian Processes Formachine Learning; Taylor & Francis Group: Abingdon, UK, 2006. [Google Scholar]
- Mukherjee, S.; Mishra, P.; Ali, N.; Aljuwayhel, N.; Ebrahim, S.; Chaudhuri, P. Thermo-Physical Properties and Heat Transfer Potential of Novel Silica-Ethylene Glycol Mono Nanofluid: Experiments and Multi-Layer Perceptron (MLP) Modelling. In Colloids and Surfaces A: Physicochemical and Engineering Aspects; Elsevier: Amsterdam, The Netherlands, 2022; p. 129412. [Google Scholar] [CrossRef]
- Nguyen, Q.H.; Ly, H.-B.; Ho, L.S.; Al-Ansari, N.; Le, H.; Van Tran, V.Q.; Prakash, I.; Pham, B.T. Influence of Data Splitting on Performance of Machine Learning Models in Prediction of Shear Strength of Soil. Math. Probl. Eng. 2021, 2021, 1–15. [Google Scholar] [CrossRef]
- Jamil, B.; Akhtar, N. Empirical models for estimation of diffuse solar radiation based on measured data for humid-subtropical climatic region of India. J. Renew. Sustain. Energy 2017, 9, 033702. [Google Scholar] [CrossRef]
- Despotovic, M.; Nedic, V.; Despotovic, D.; Cvetanovic, S. Review and statistical analysis of different global solar radiation sunshine models. Renew. Sustain. Energy Rev. 2015, 52, 1869–1880. [Google Scholar] [CrossRef]
- Husain, S.; Khan, U.A. Development of machine learning models based on air temperature for estimation of global solar radiation in India. Environ. Prog. Sustain. Energy 2021, 41, e13782. [Google Scholar] [CrossRef]


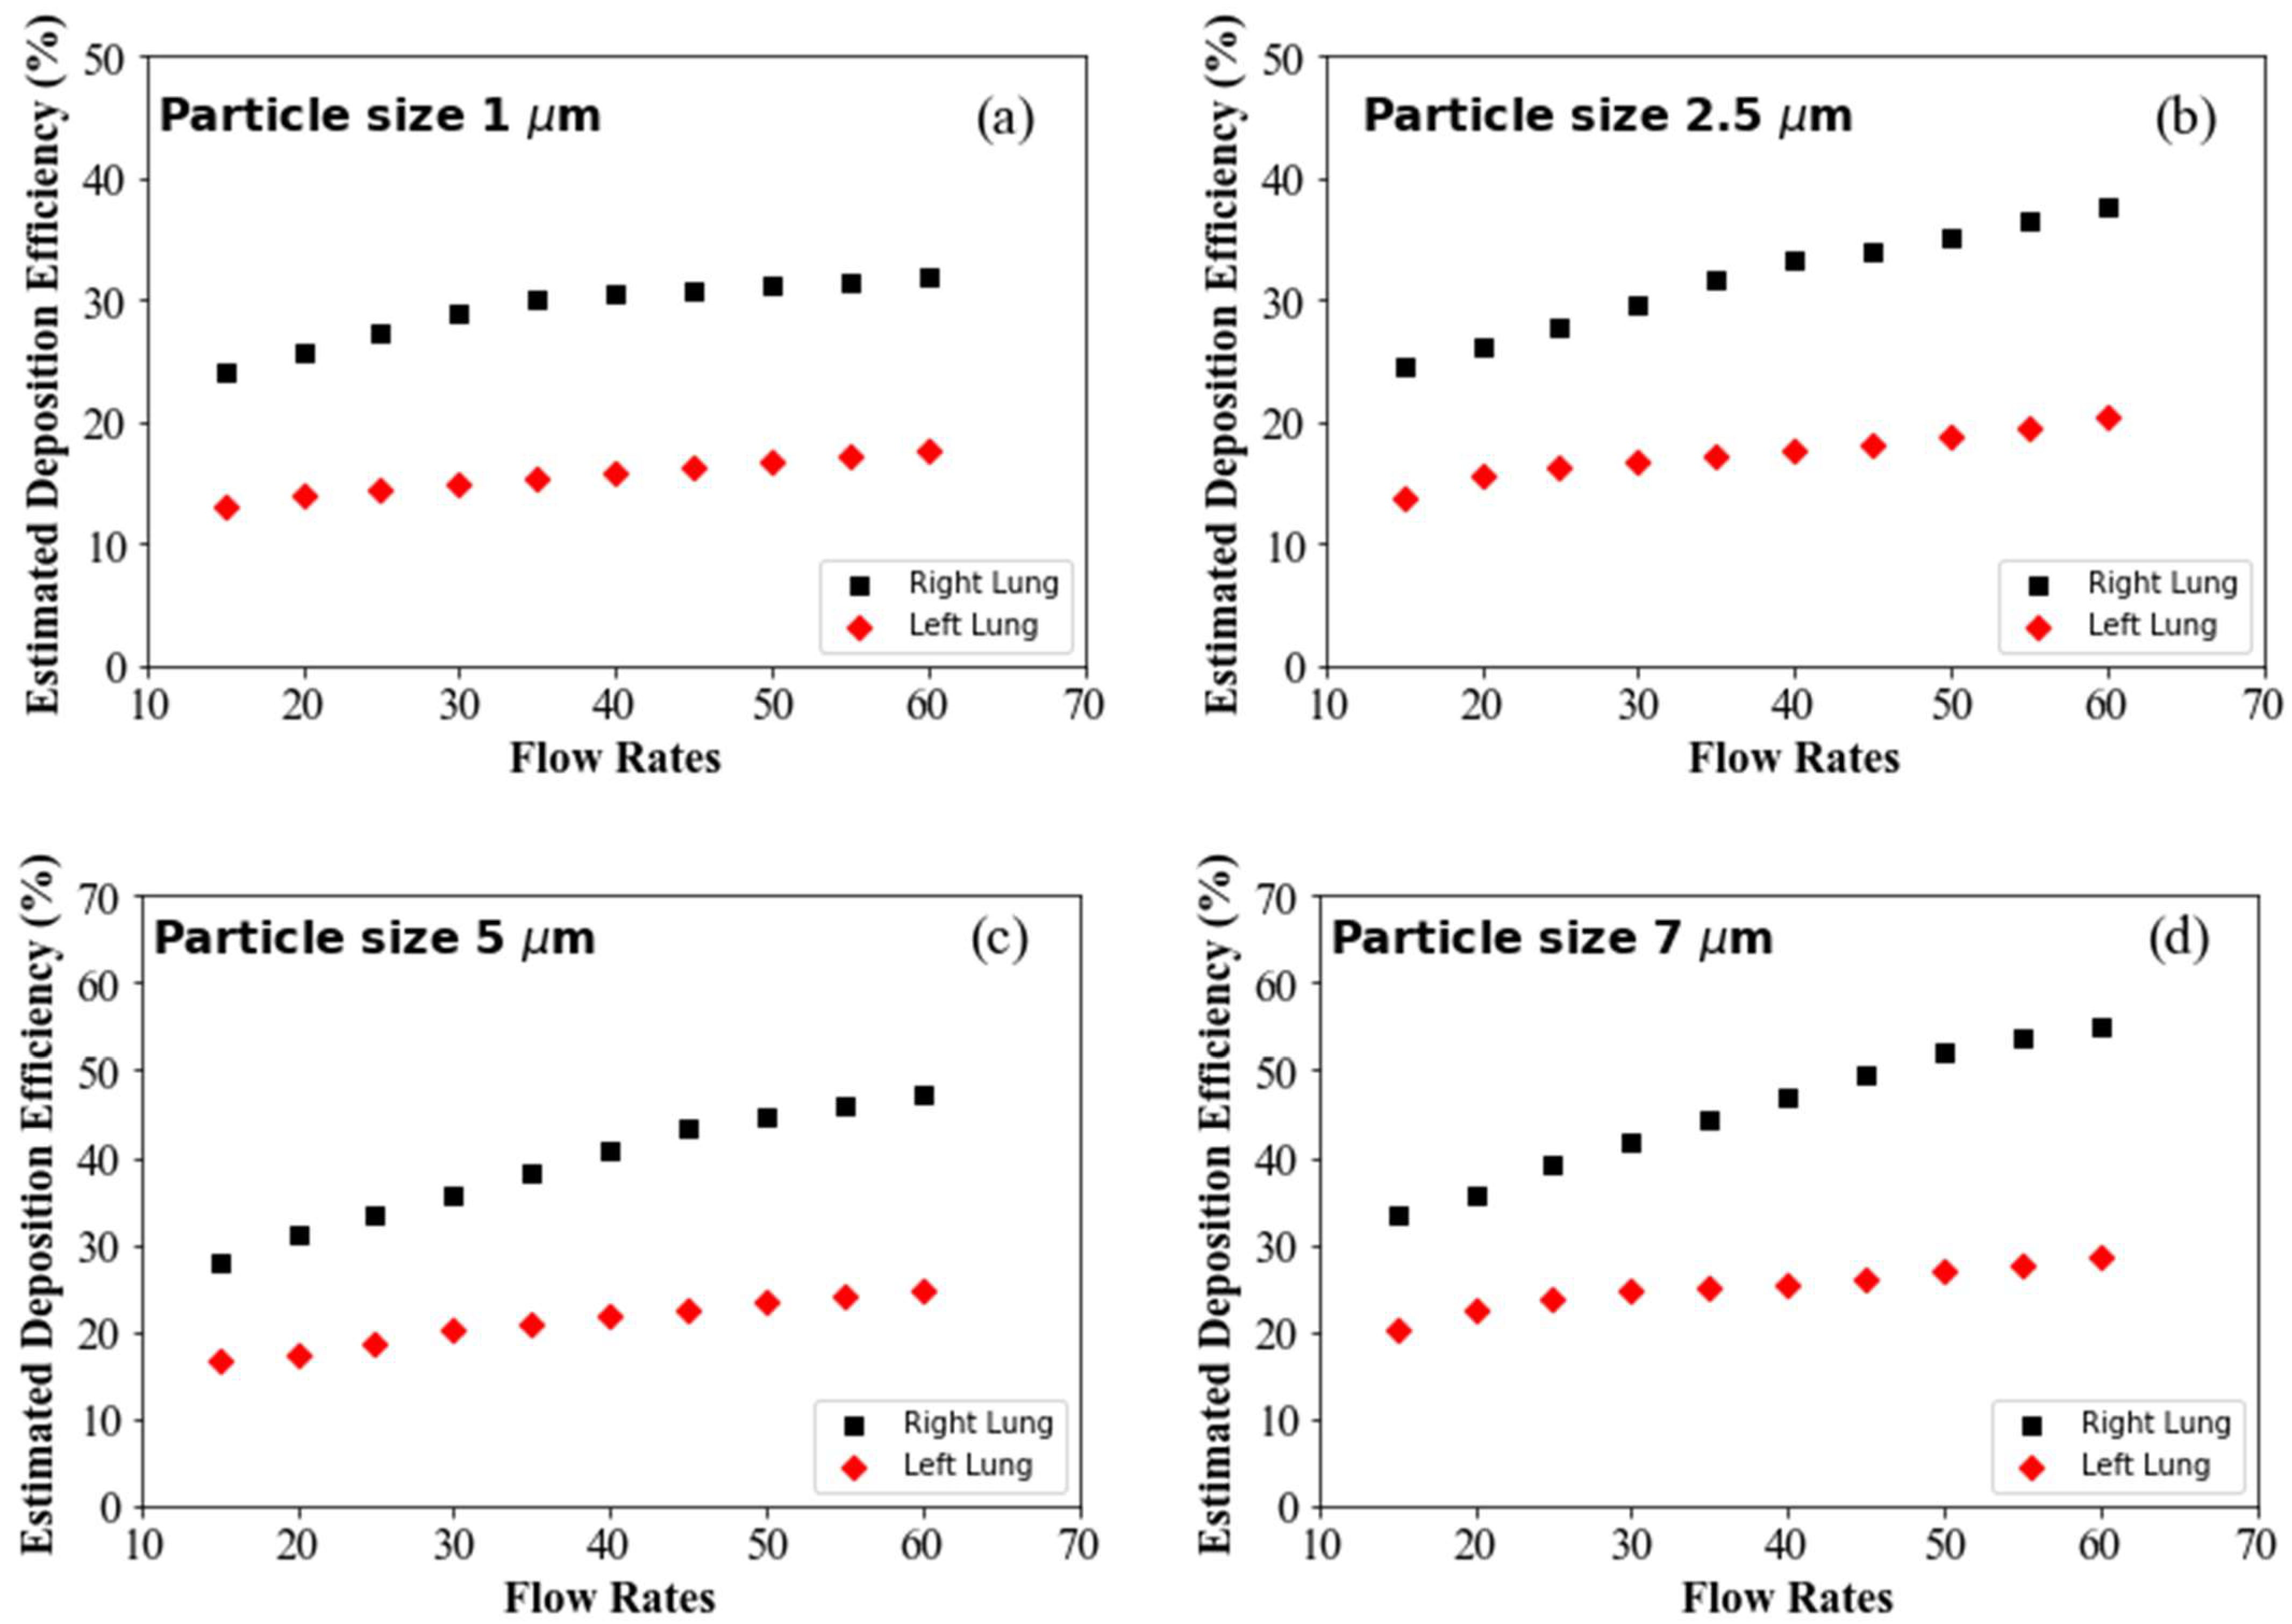
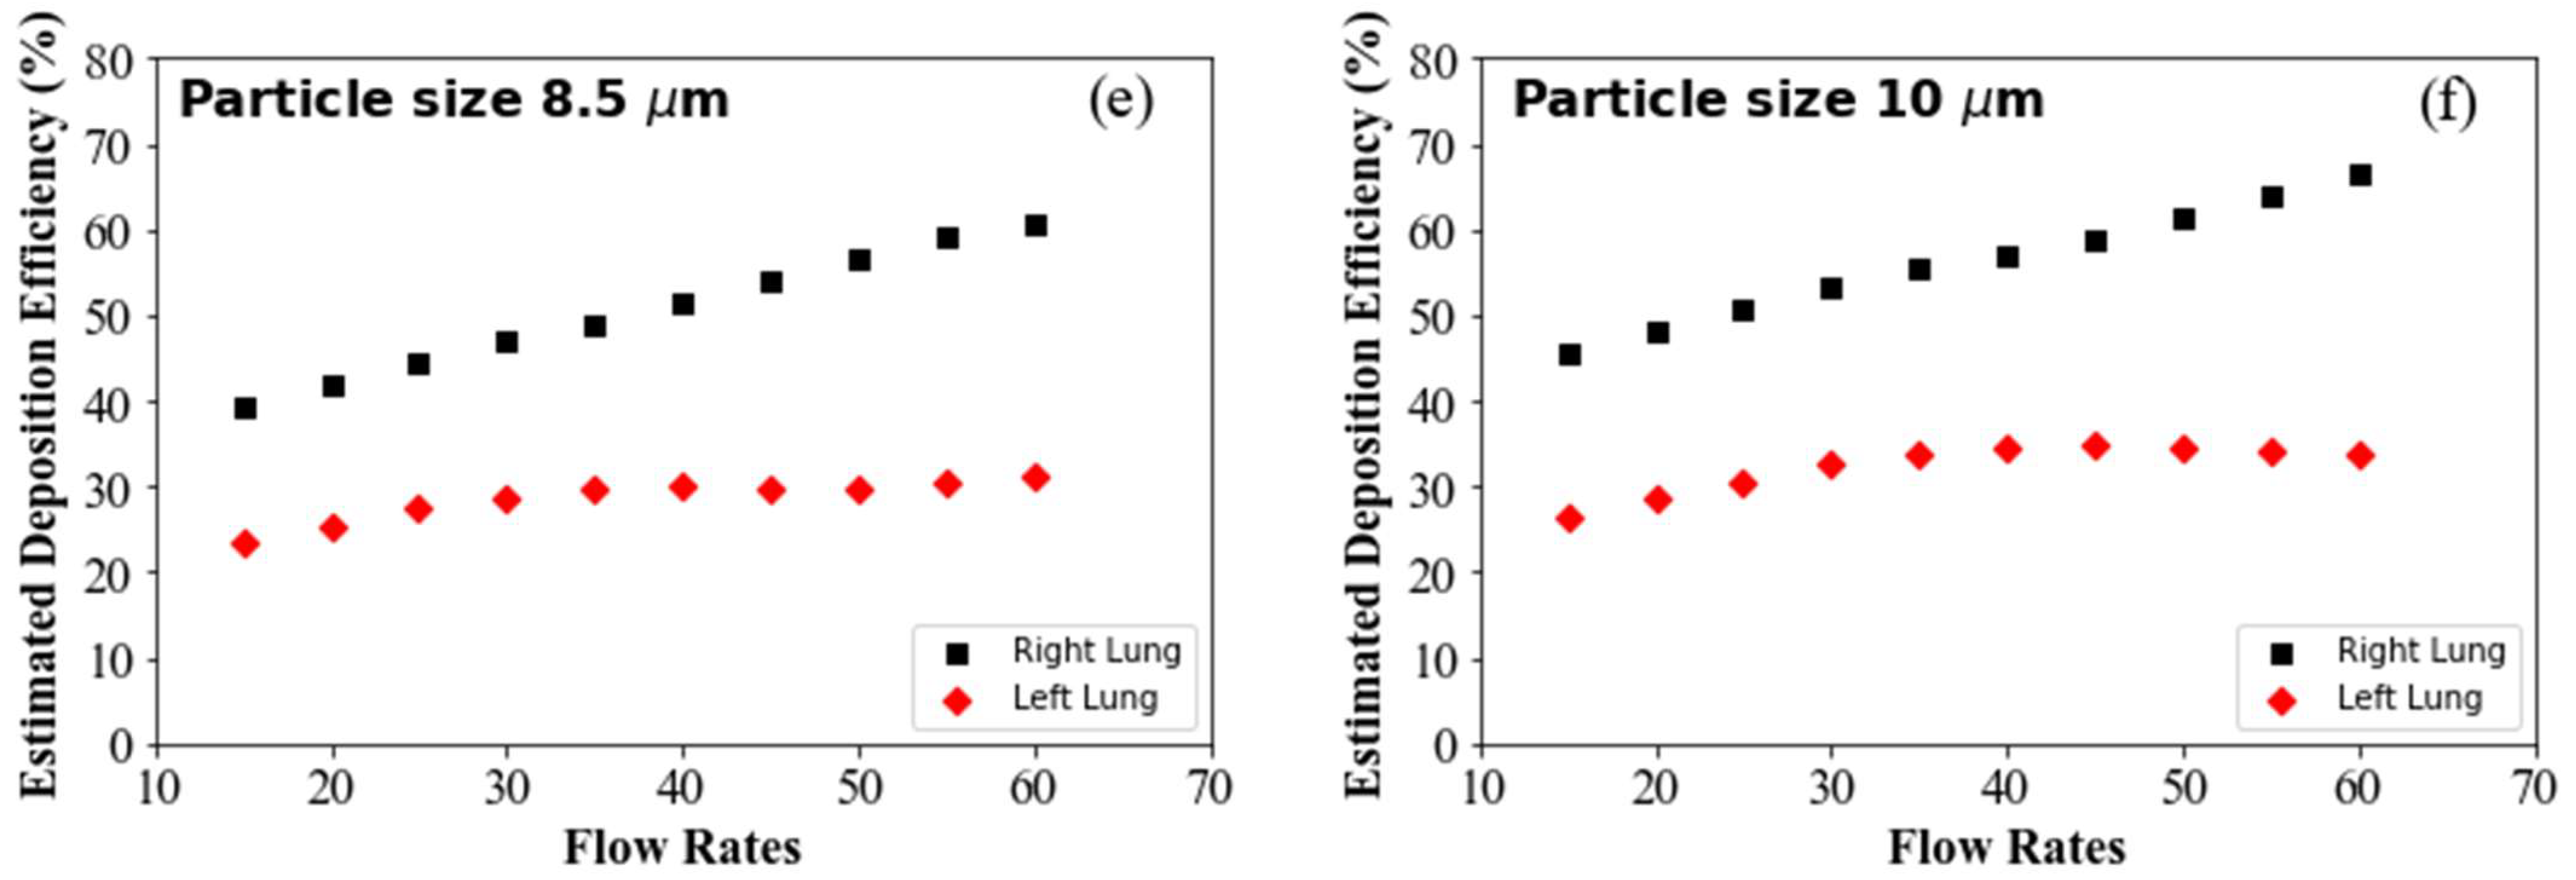
| 10-μm | 5-μm | 1-μm | ||||
|---|---|---|---|---|---|---|
| Left Lung | Right Lung | Left Lung | Right Lung | Left Lung | Right Lung | |
| 15 lpm | 25.81081 | 45.27027 | 16.48649 | 27.63514 | 12.90541 | 24.18919 |
| 30 lpm | 32.97297 | 59.45946 | 20.60811 | 35.06757 | 15.27027 | 27.97297 |
| 60 lpm | 32.02703 | 67.36486 | 26.89189 | 47.09459 | 16.68919 | 31.75676 |
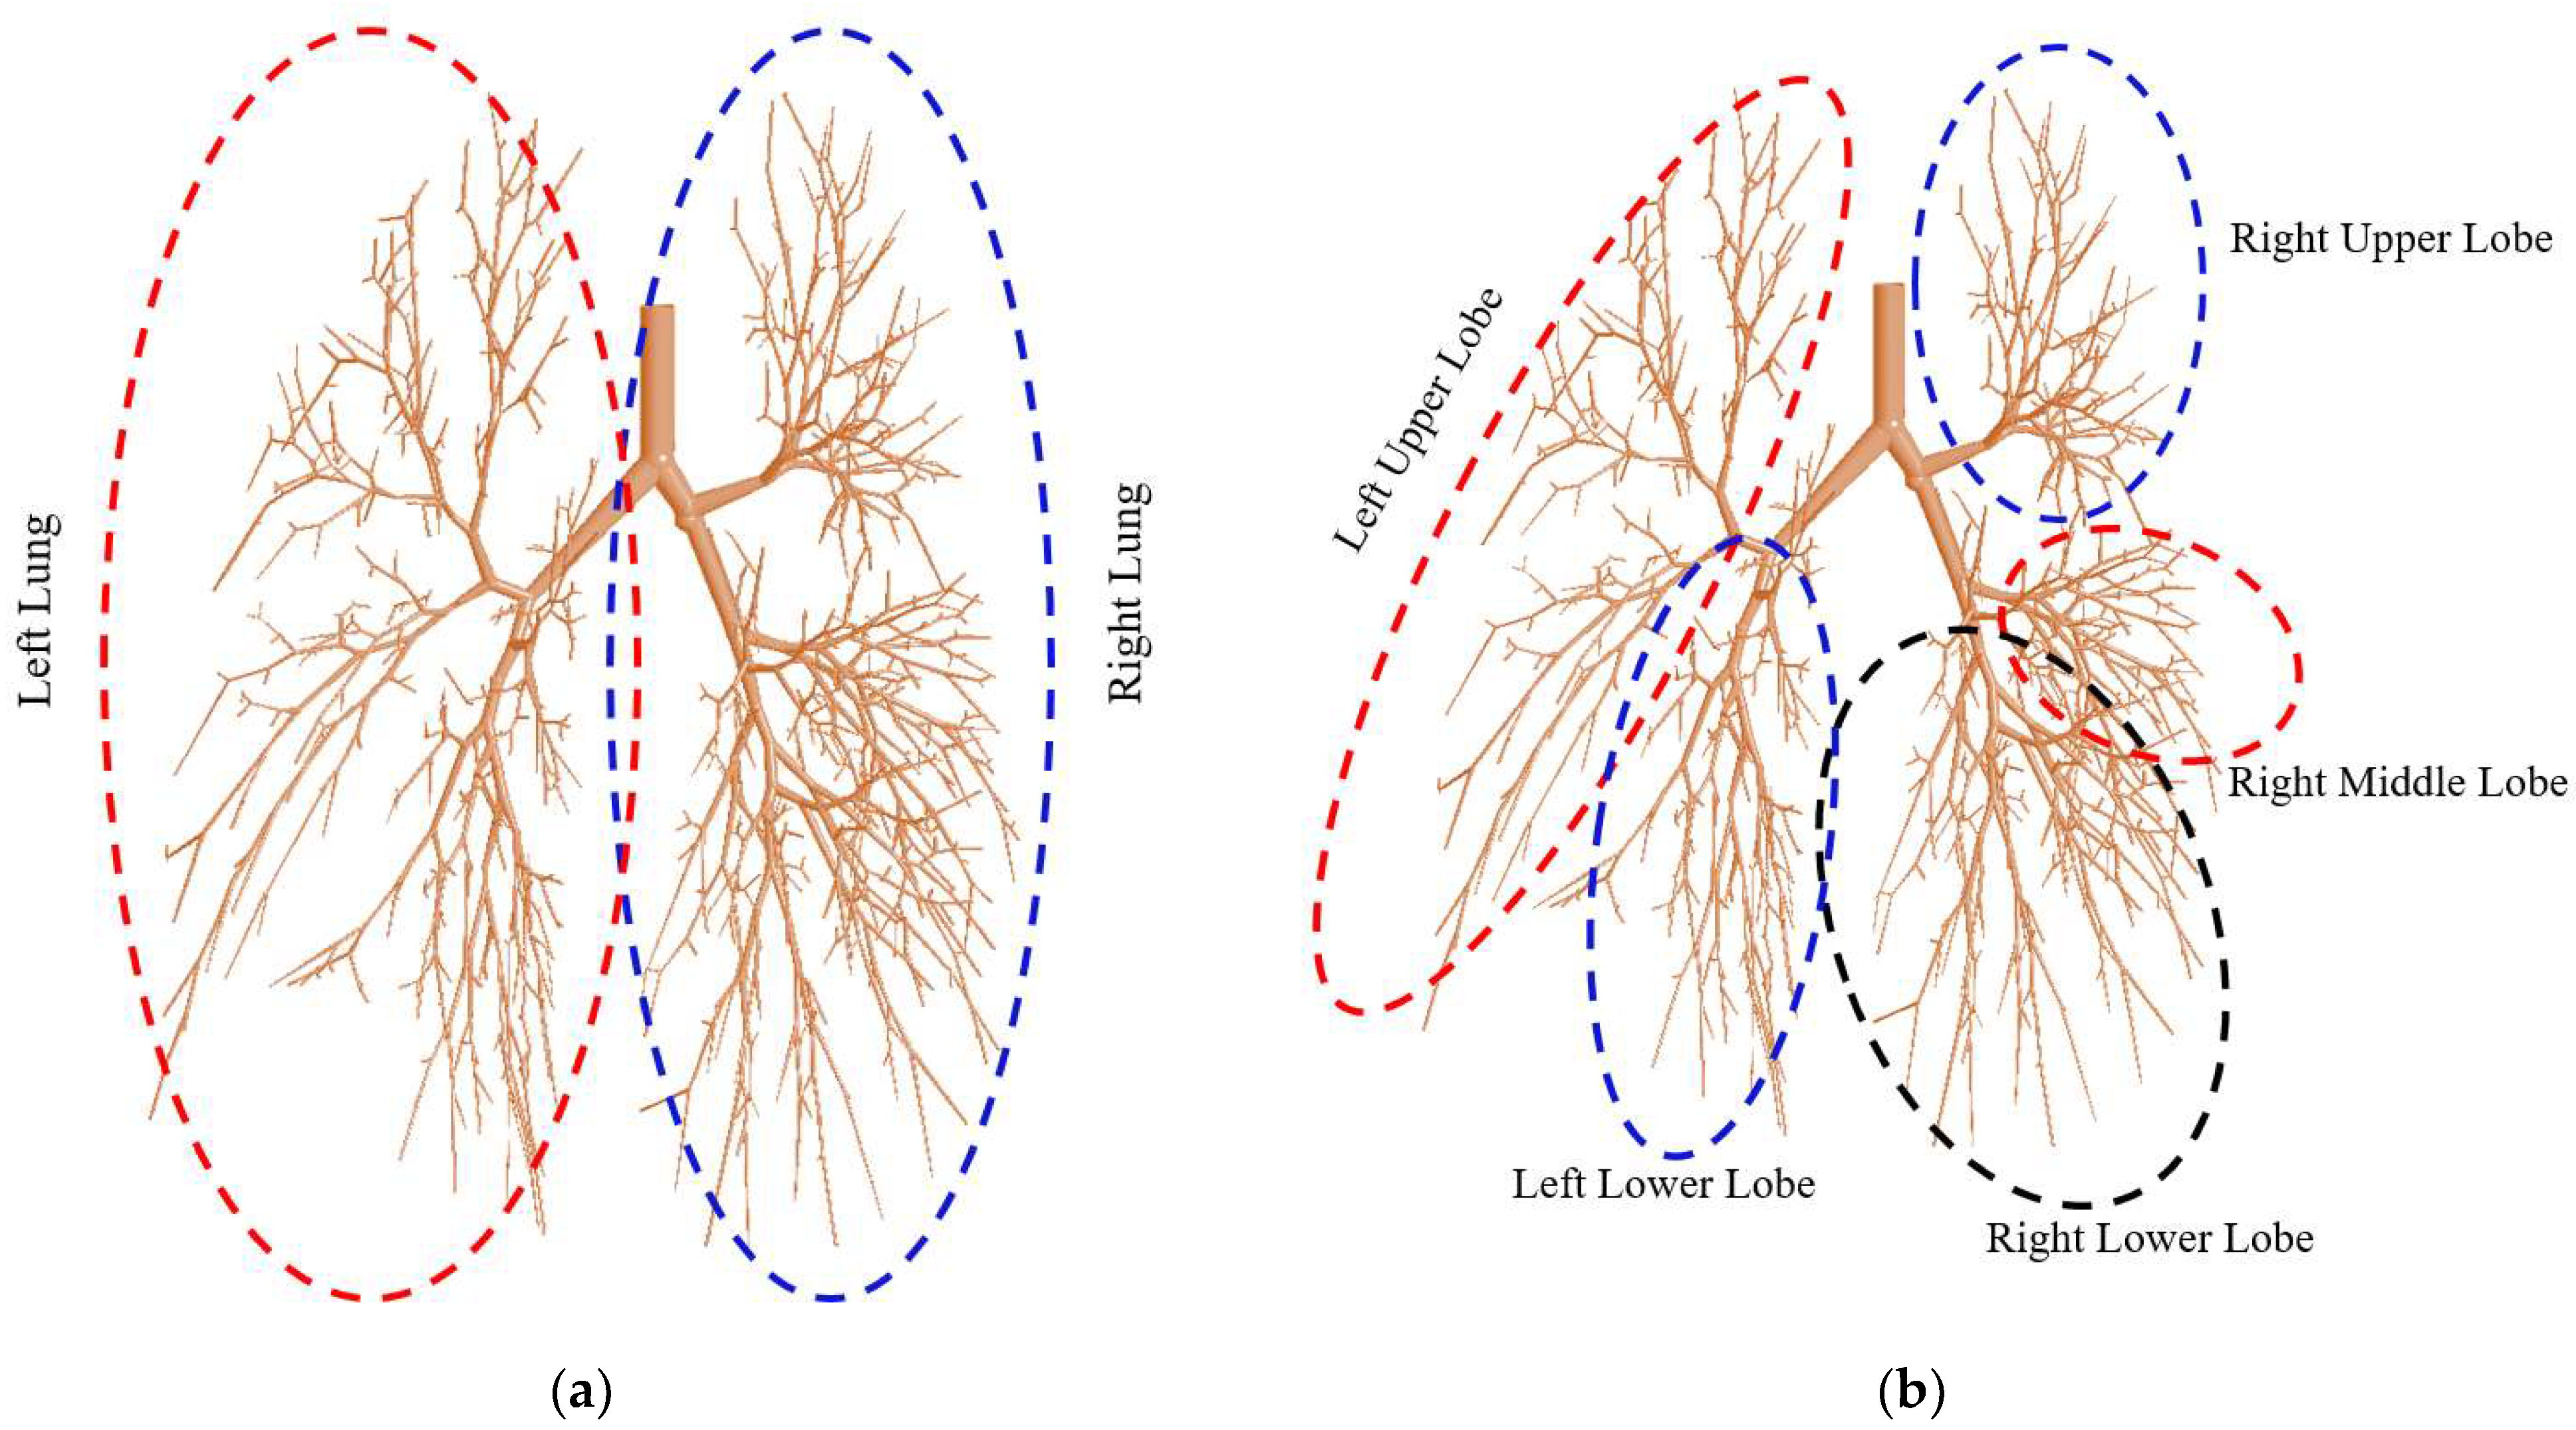
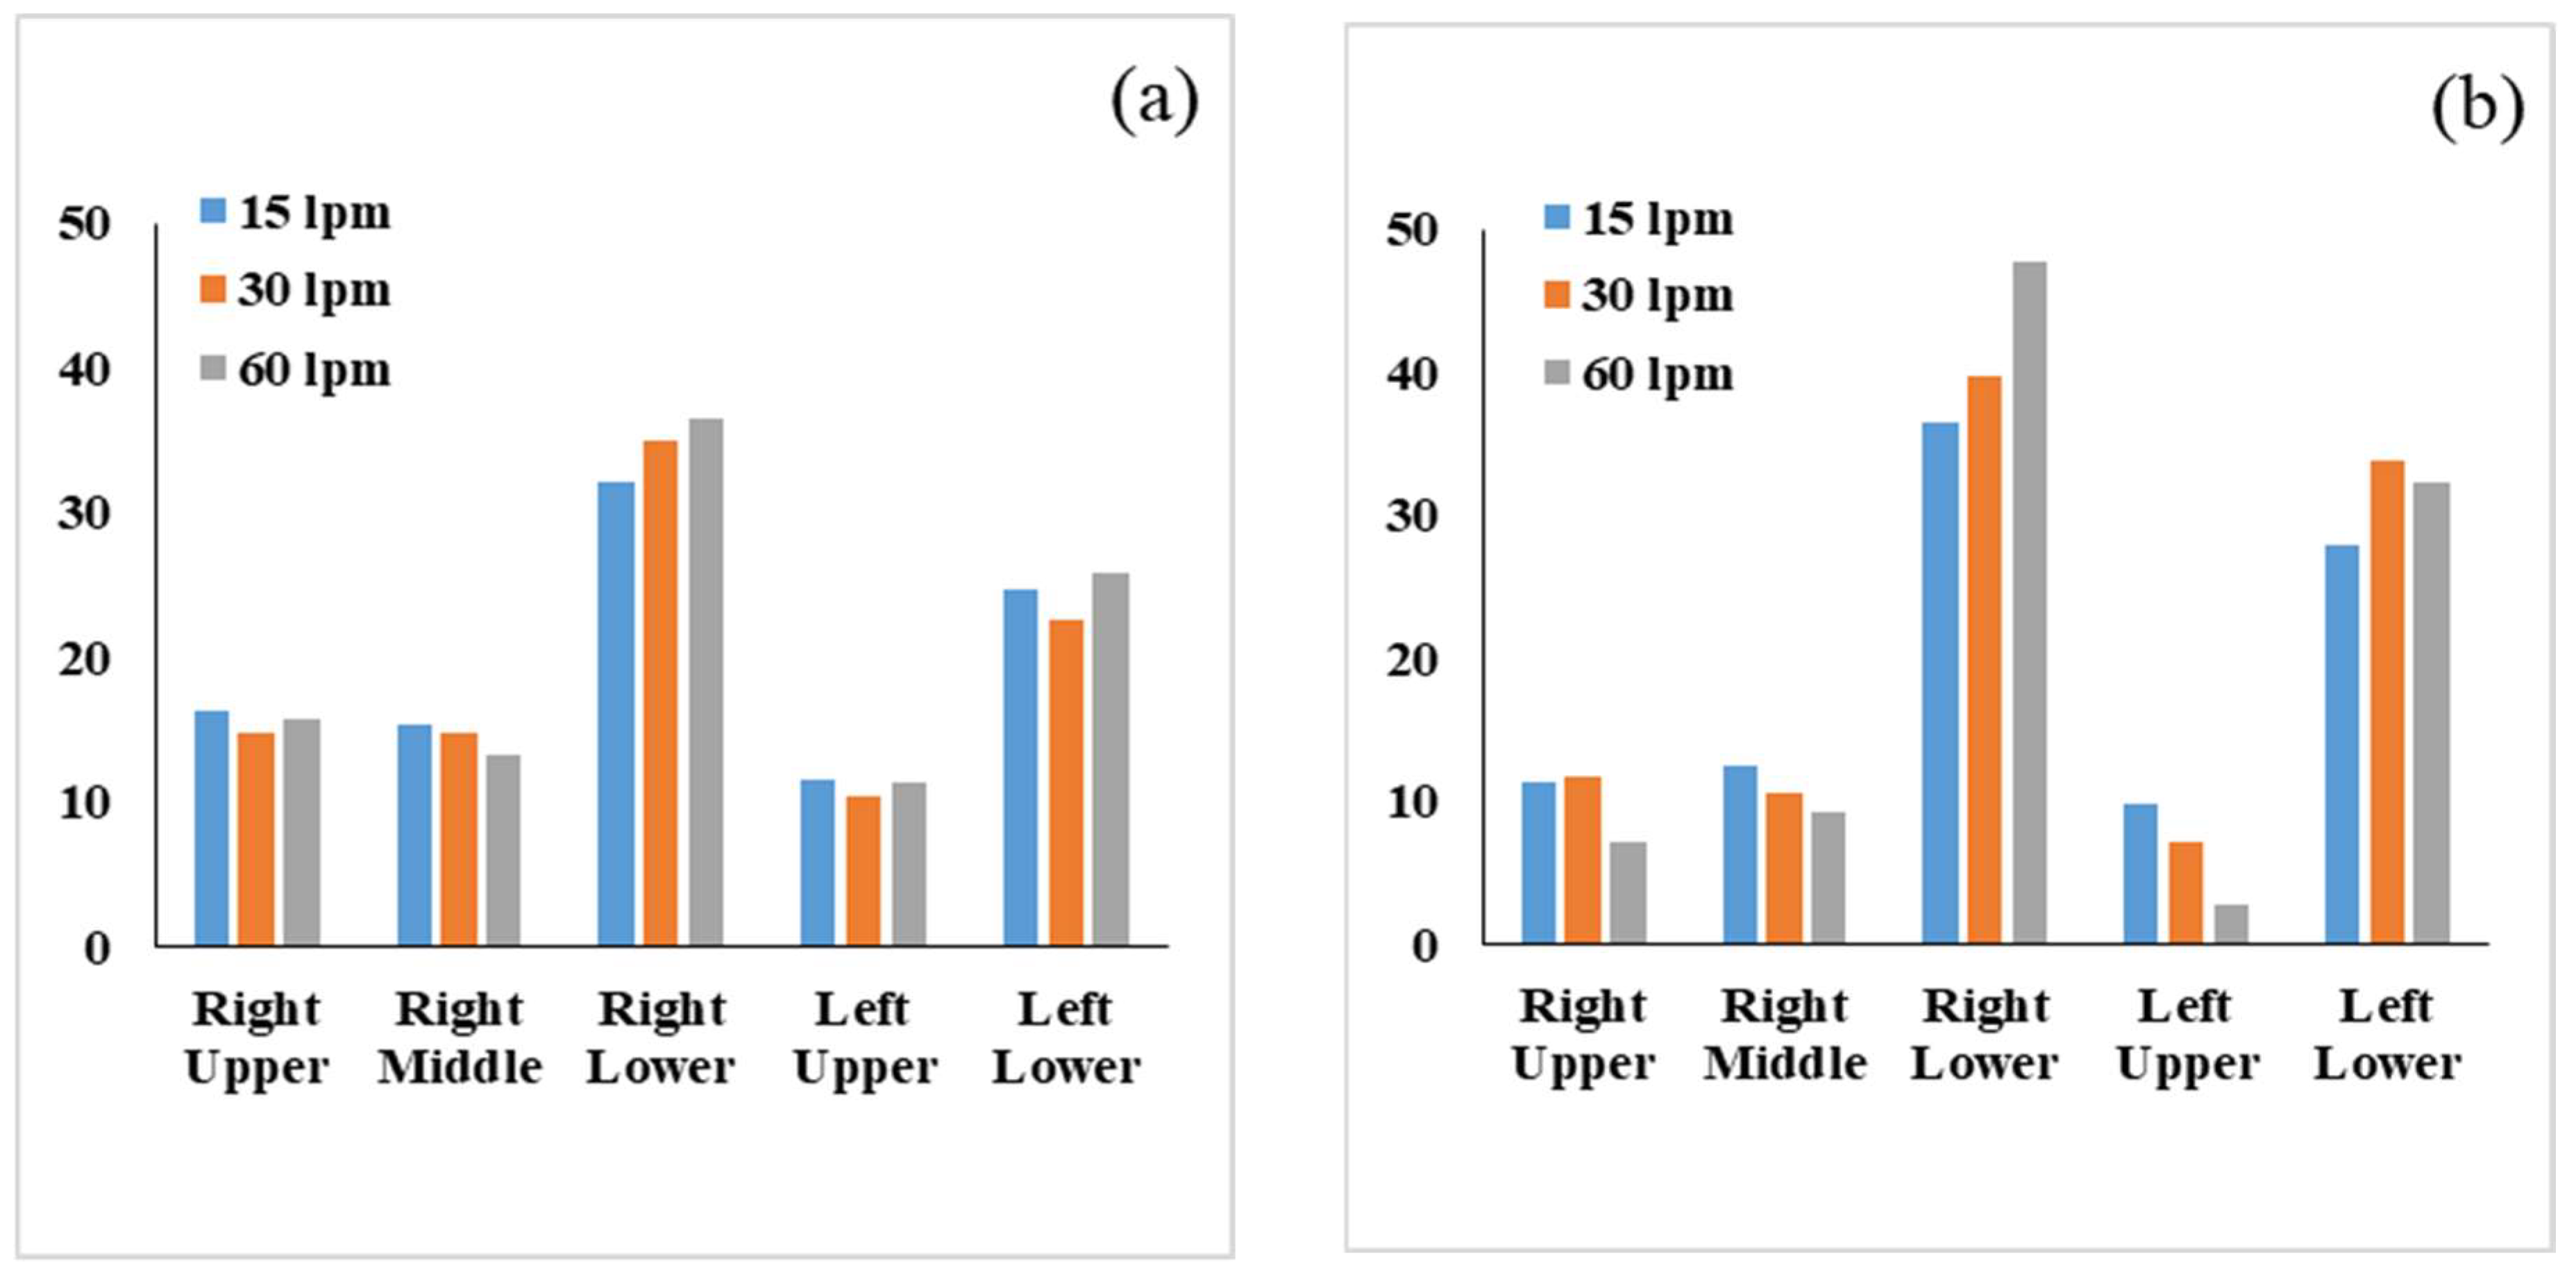
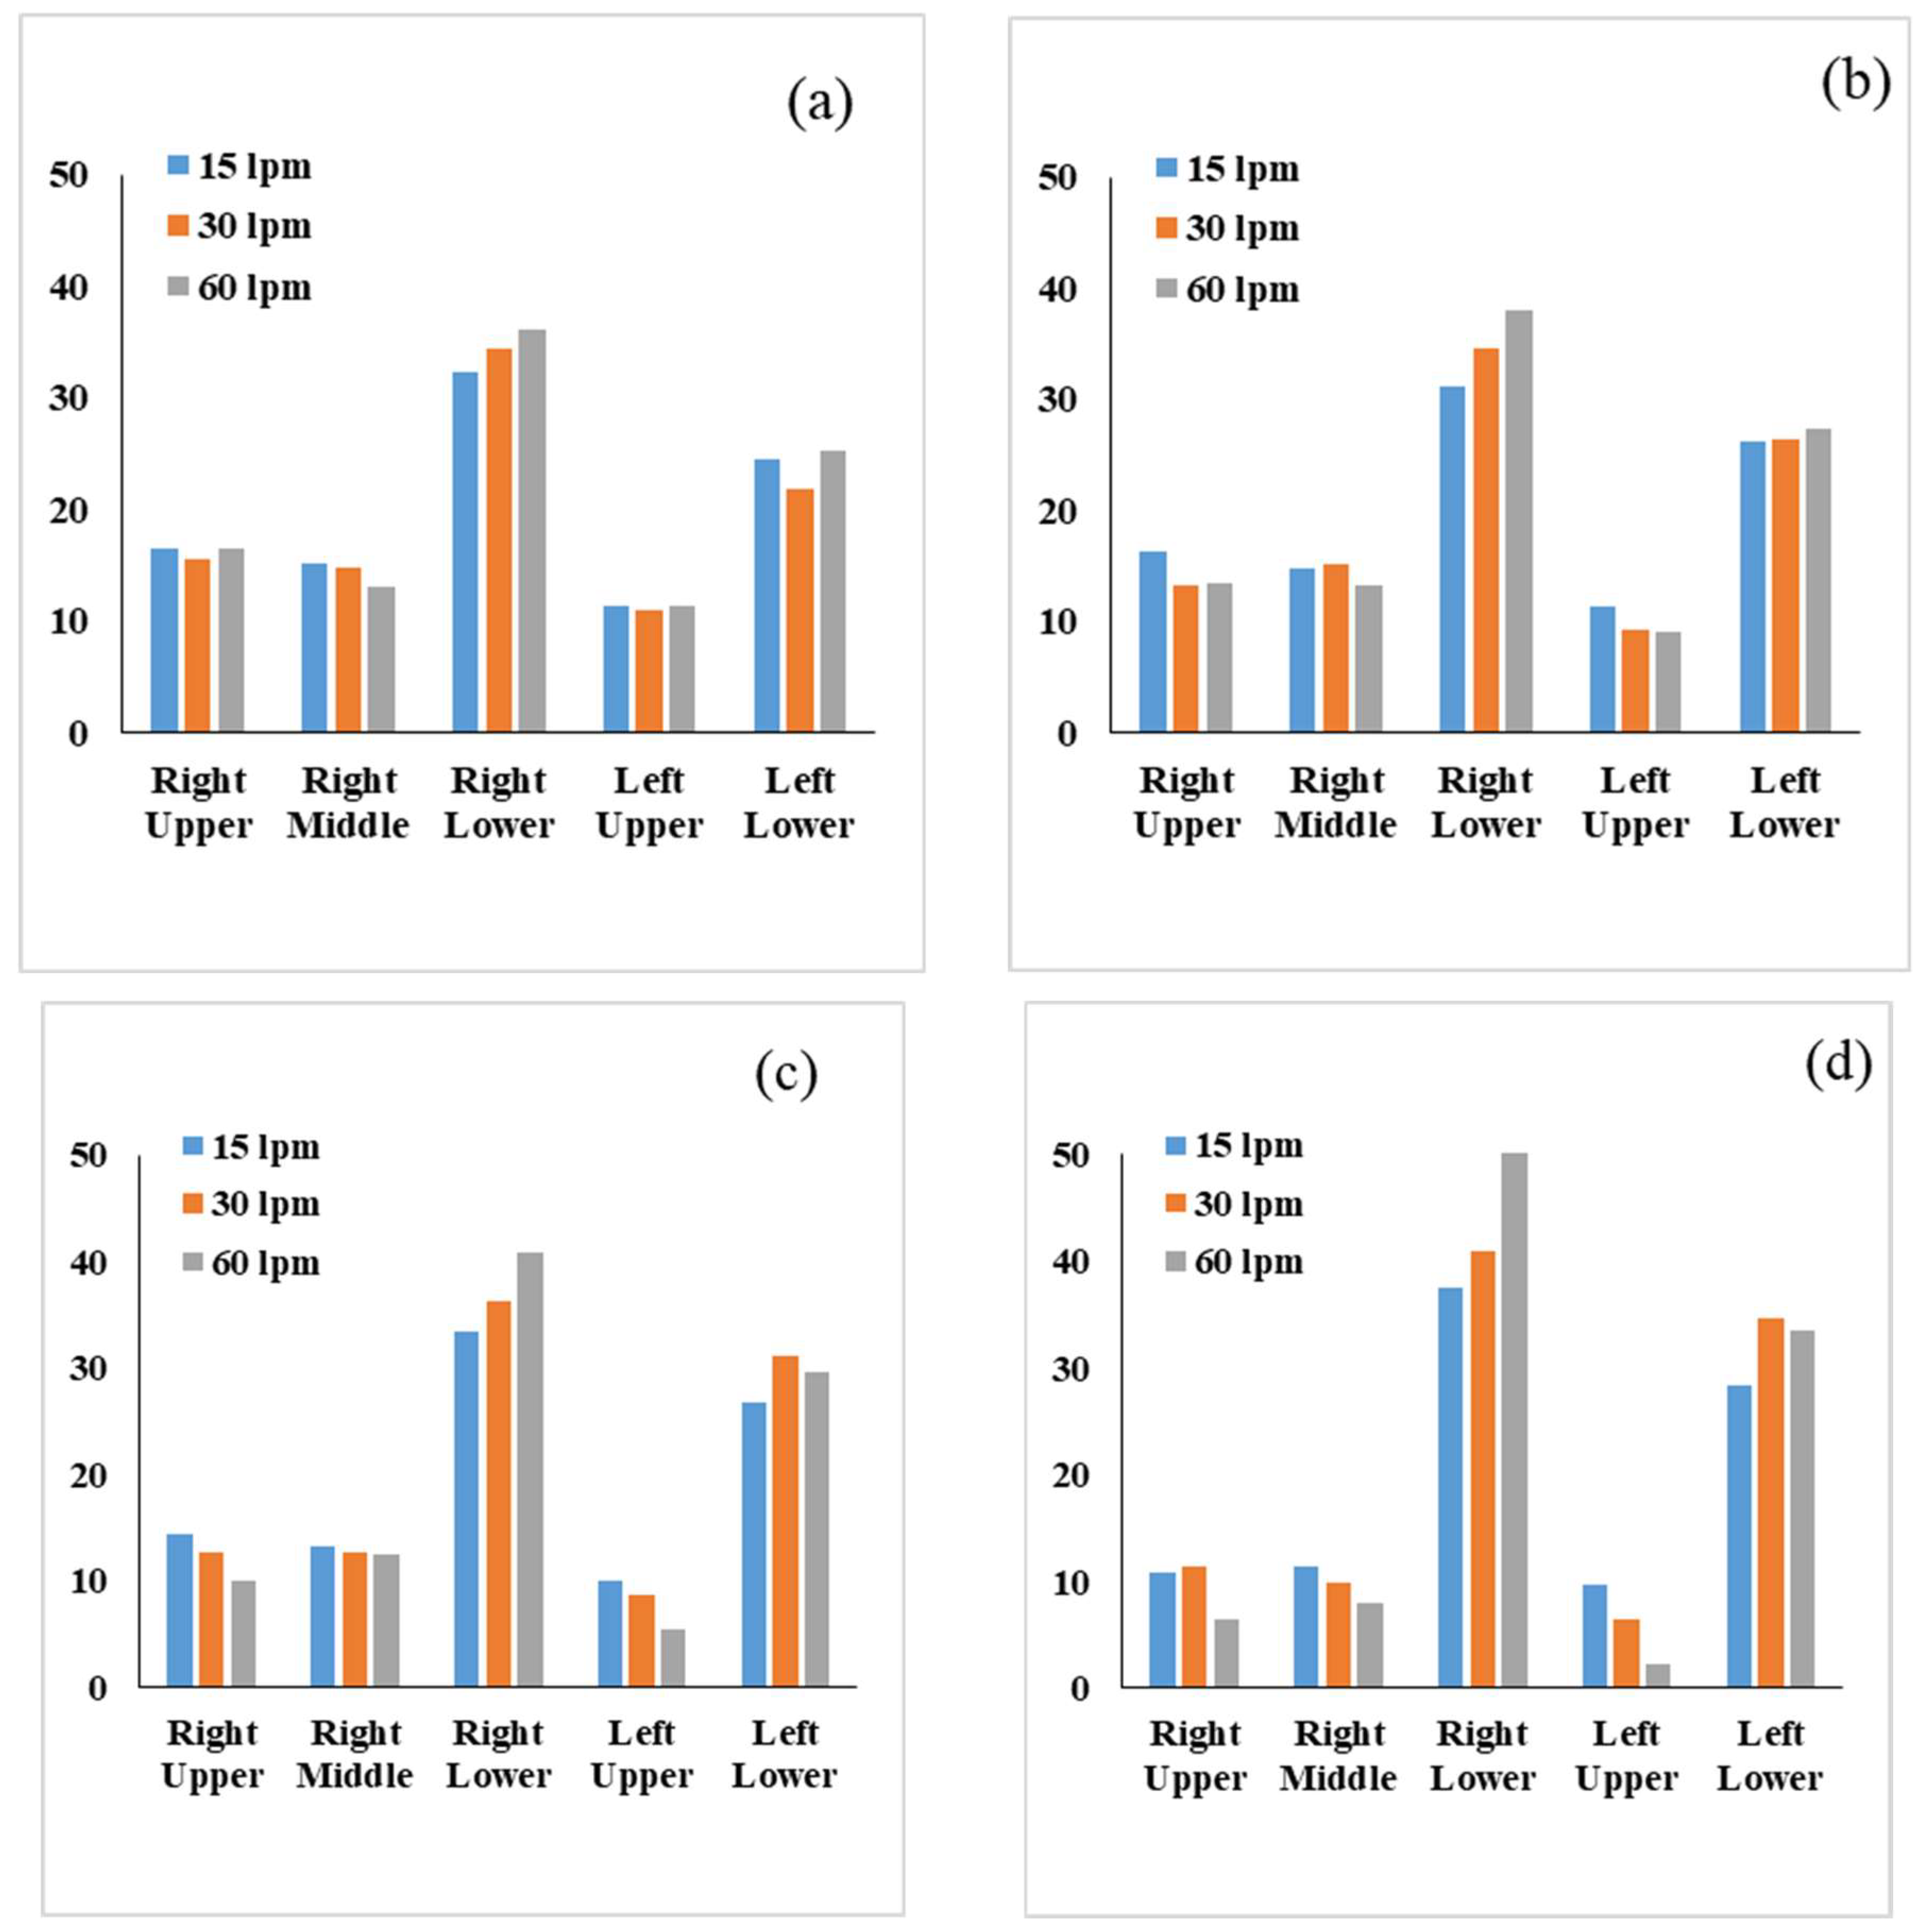
| Right Upper | Right Middle | Right Lower | Left Upper | Left Lower | |
|---|---|---|---|---|---|
| 10-micron | |||||
| 15 lpm | 13.12 | 11.31 | 39.16 | 7.51 | 28.9 |
| 30 lpm | 11.11 | 9.8 | 43.35 | 3.8 | 31.94 |
| 60 lpm | 6.66 | 4.07 | 56.97 | 1.34 | 30.93 |
| 5-micron | |||||
| 15 lpm | 16.54 | 13.78 | 32.16 | 10.87 | 26.65 |
| 30 lpm | 13.32 | 14.72 | 33.12 | 9.5 | 29.3 |
| 60 lpm | 10.96 | 13.61 | 39 | 7.49 | 28.95 |
| 1-micron | |||||
| 15 lpm | 17.49 | 14.39 | 33.15 | 11.11 | 23.86 |
| 30 lpm | 17.19 | 15 | 33.34 | 12.5 | 22.97 |
| 60 lpm | 16.83 | 12.87 | 35.22 | 12.78 | 27.3 |
| S. No. | Statistical Parameter | Equation |
|---|---|---|
| 1. | Correlation coefficient (R) | |
| 2. | Mean Bias Error (MBE) | |
| 3. | Root Mean Square Error (RMSE) | |
| 4. | Mean Percentage Error (MPE) | |
| 5. | Mean Absolute Percentage error (MAPE) | |
| 6. | Maximum Absolute Relative Error (erMAX) | |
| 7. | Mean Absolute Error (MAE) | |
| 8. | Uncertainty at 95% (U95) | |
| 9. | T-Statistics (t-stats) |
| No. | MLAs | Hyper-Parameters | ||
|---|---|---|---|---|
| Category 1 | Category 2 | |||
| 1 | k-NN | No. of Neighbors: | 4 | 12 |
| 2 | RF | No. of estimators: | 4 | 4 |
| 3 | GPR | Kernel type: | DotProduct (sigma = 1) + RBF(length scale = 1), | DotProduct (sigma = 1) + RBF(length scale = 1), |
| No. of restarts optimiser | 2 | 2 | ||
| 4 | MLP | Sizes of hidden layer: | (100,) | (100,) |
| No. of hidden layers: | 1 | 1 | ||
| Max iterations: | 10000 | 10000 | ||
| No. of hidden layers: | 0.001 | 0.001 | ||
| learning rate: |
| MBE | RMSE | MAPE | R | U95 | MAE | t-Stats | erMAX | |
|---|---|---|---|---|---|---|---|---|
| Category 1 | ||||||||
| RF | 0.090 | 5.477 | 0.122 | 0.858 | 25.308 | 4.025 | 0.067 | 11.891 |
| KNN | −1.810 | 7.754 | 0.110 | 0.716 | 30.208 | 3.059 | 0.989 | 29.115 |
| GPR | −0.079 | 3.164 | 0.033 | 0.954 | 27.225 | 1.272 | 0.104 | 11.016 |
| MLP | −0.230 | 1.675 | 0.027 | 0.986 | 27.356 | 0.915 | 0.573 | 6.221 |
| Category 2 | ||||||||
| RF | −0.469 | 2.636 | 0.096 | 0.954 | 23.429 | 1.588 | 1.200 | 8.855 |
| KNN | −0.711 | 4.095 | 0.090 | 0.889 | 24.284 | 1.743 | 1.170 | 13.283 |
| GPR | −0.475 | 2.026 | 0.039 | 0.972 | 23.786 | 0.796 | 1.602 | 7.919 |
| MLP | 0.066 | 1.419 | 0.026 | 0.986 | 24.791 | 0.577 | 0.312 | 7.778 |
| MODEL | MBE | RMS | MAPE | R | U95 | MAE | t-Stat | erMAX | GPI | Rank |
|---|---|---|---|---|---|---|---|---|---|---|
| Category 1 | ||||||||||
| RF | 1.000 | 0.625 | 1.000 | 0.526 | 0.000 | 1.000 | 0.000 | 0.248 | −0.946 | 3 |
| KNN | 0.000 | 1.000 | 0.874 | 0.000 | 1.000 | 0.689 | 1.000 | 1.000 | −3.162 | 4 |
| GPR | 0.911 | 0.245 | 0.063 | 0.881 | 0.391 | 0.115 | 0.040 | 0.209 | 1.308 | 2 |
| MLP | 0.832 | 0.000 | 0.000 | 1.000 | 0.418 | 0.000 | 0.549 | 0.000 | 1.603 | 1 |
| Category 2 | ||||||||||
| RF | 0.311 | 0.455 | 1.000 | 0.670 | 0.000 | 0.867 | 0.688 | 0.196 | −0.652 | 3 |
| KNN | 0.000 | 1.000 | 0.914 | 0.000 | 0.628 | 1.000 | 0.665 | 1.000 | −3.012 | 4 |
| GPR | 0.304 | 0.227 | 0.186 | 0.856 | 0.262 | 0.188 | 1.000 | 0.026 | 0.859 | 2 |
| MLP | 1.000 | 0.000 | 0.000 | 1.000 | 1.000 | 0.000 | 0.000 | 0.000 | 1.195 | 1 |
Publisher’s Note: MDPI stays neutral with regard to jurisdictional claims in published maps and institutional affiliations. |
© 2022 by the authors. Licensee MDPI, Basel, Switzerland. This article is an open access article distributed under the terms and conditions of the Creative Commons Attribution (CC BY) license (https://creativecommons.org/licenses/by/4.0/).
Share and Cite
Islam, M.S.; Husain, S.; Mustafa, J.; Gu, Y. A Novel Machine Learning Prediction Model for Aerosol Transport in Upper 17-Generations of the Human Respiratory Tract. Future Internet 2022, 14, 247. https://doi.org/10.3390/fi14090247
Islam MS, Husain S, Mustafa J, Gu Y. A Novel Machine Learning Prediction Model for Aerosol Transport in Upper 17-Generations of the Human Respiratory Tract. Future Internet. 2022; 14(9):247. https://doi.org/10.3390/fi14090247
Chicago/Turabian StyleIslam, Mohammad S., Shahid Husain, Jawed Mustafa, and Yuantong Gu. 2022. "A Novel Machine Learning Prediction Model for Aerosol Transport in Upper 17-Generations of the Human Respiratory Tract" Future Internet 14, no. 9: 247. https://doi.org/10.3390/fi14090247
APA StyleIslam, M. S., Husain, S., Mustafa, J., & Gu, Y. (2022). A Novel Machine Learning Prediction Model for Aerosol Transport in Upper 17-Generations of the Human Respiratory Tract. Future Internet, 14(9), 247. https://doi.org/10.3390/fi14090247