
A CSI Fingerprint Method for Indoor Pseudolite Positioning Based on RT-ANN

Abstract
:1. Introduction
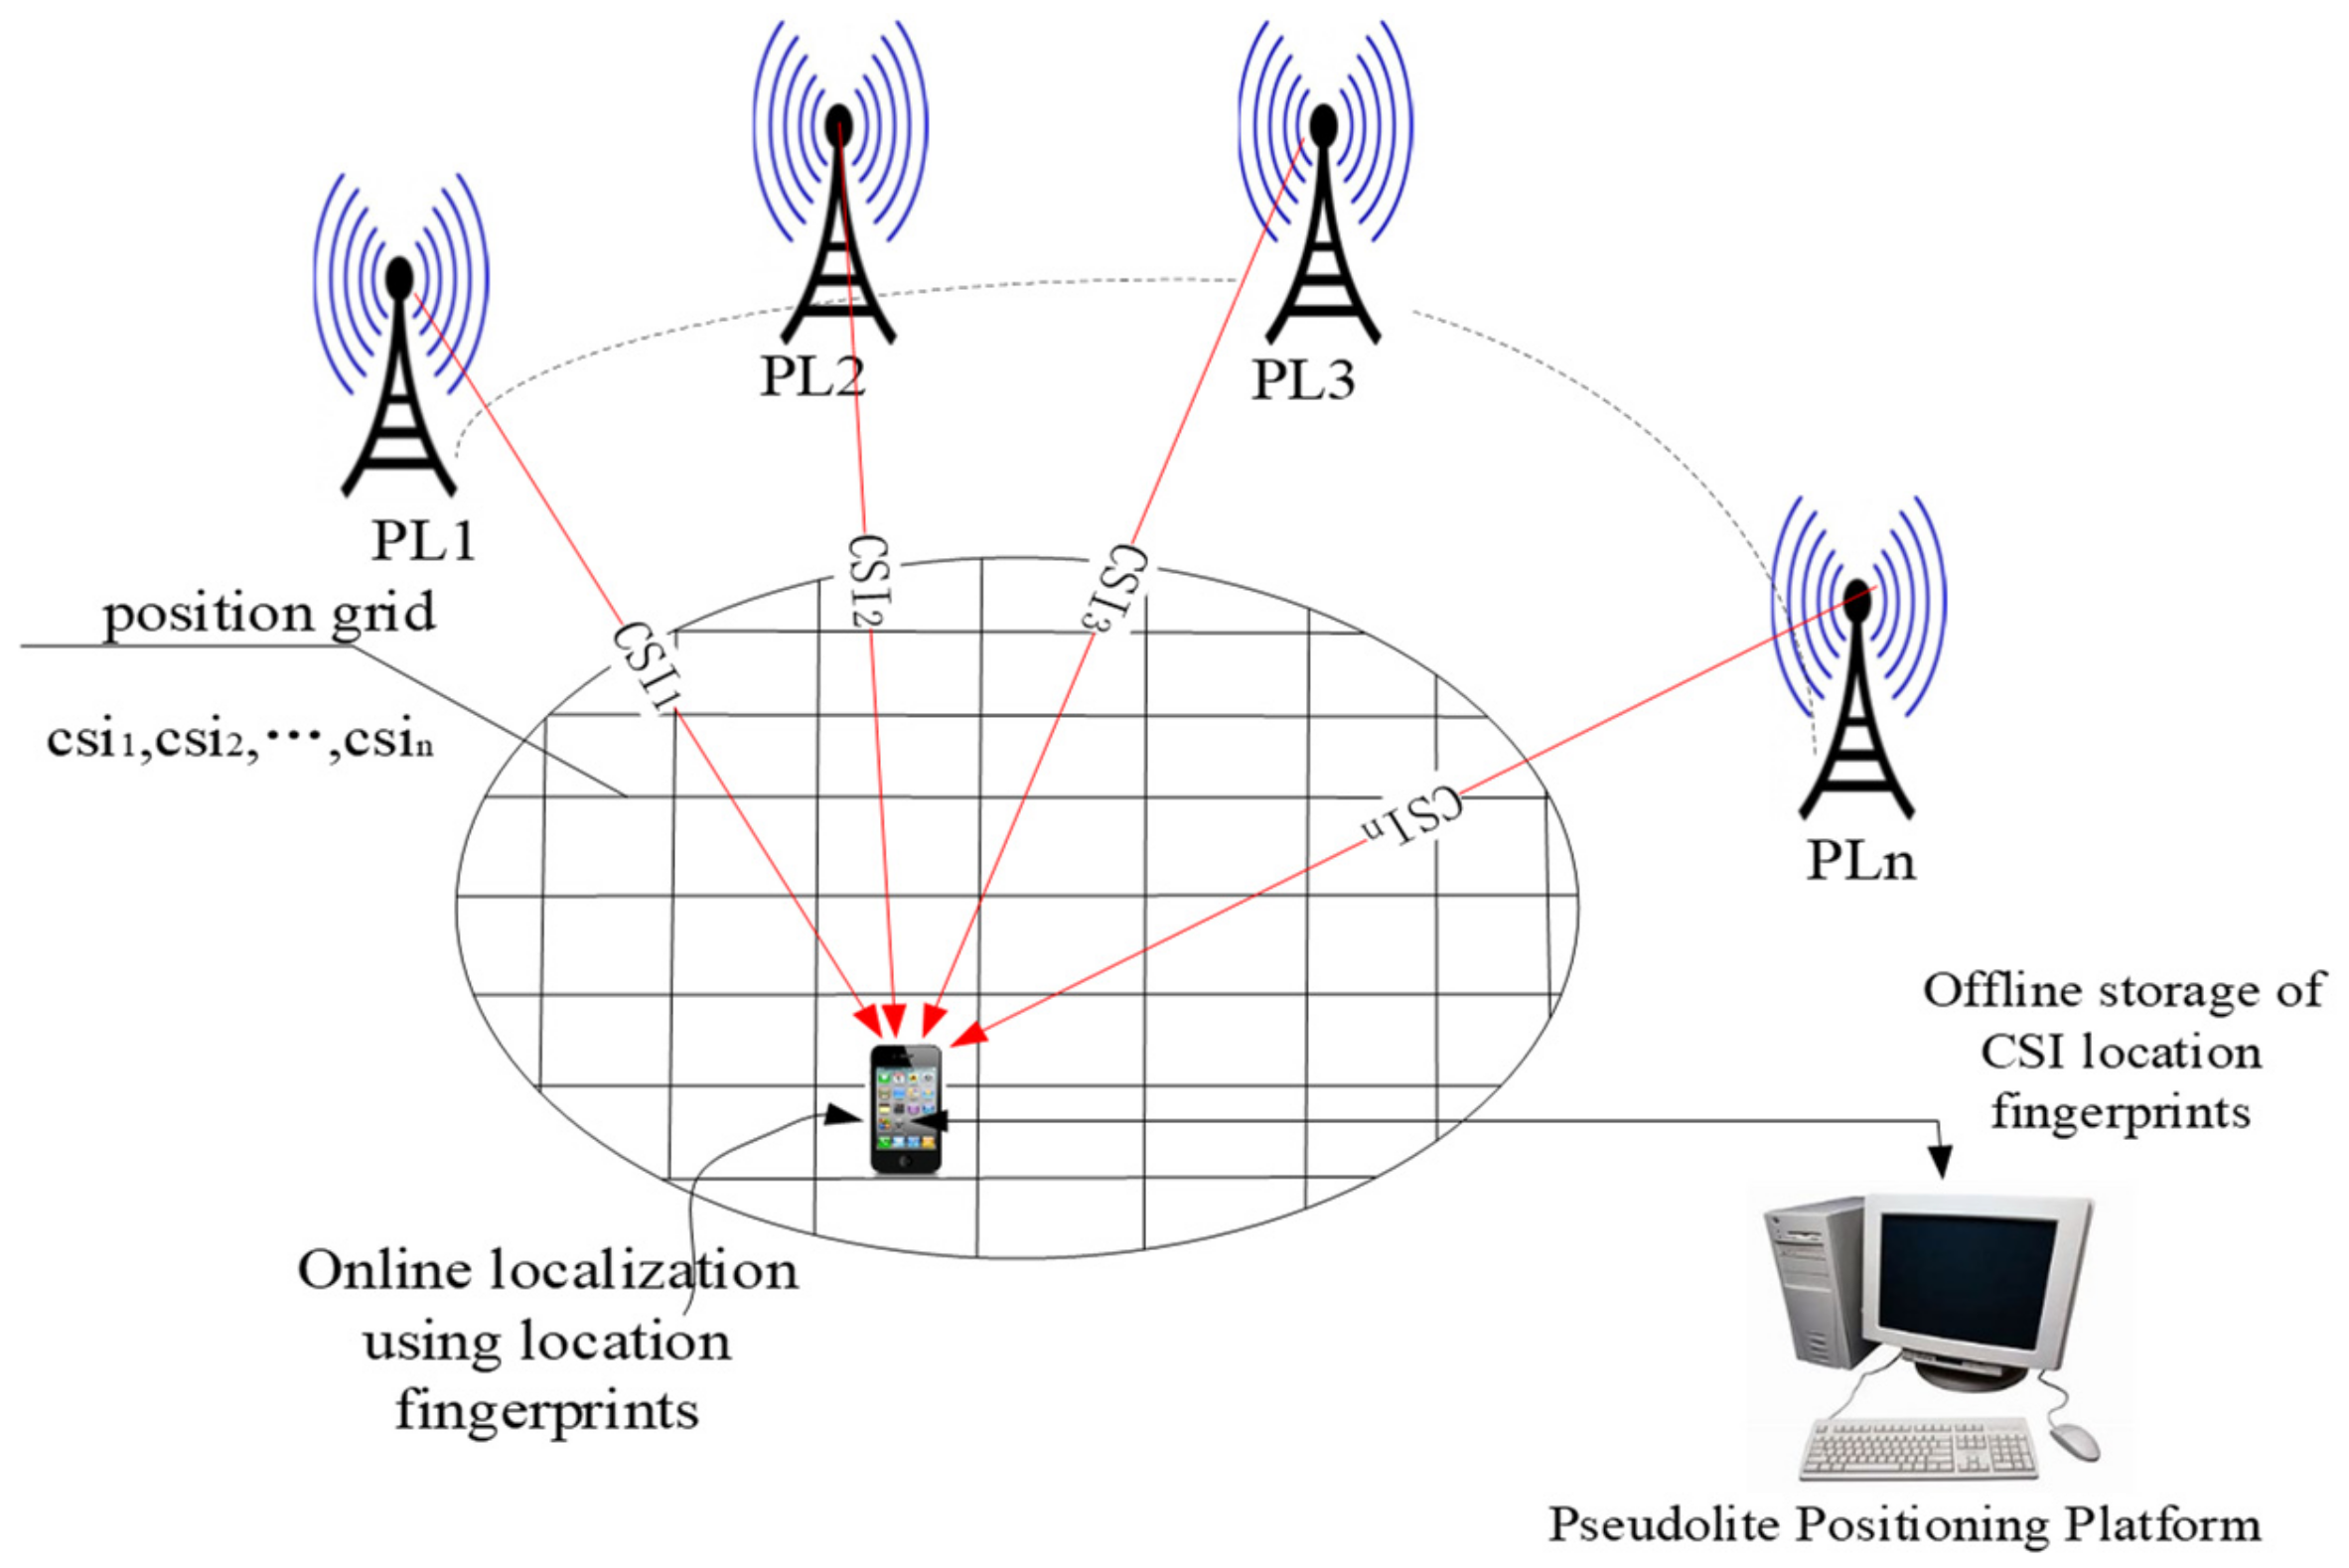
2. Indoor Pseudolite Fingerprint Positioning Method
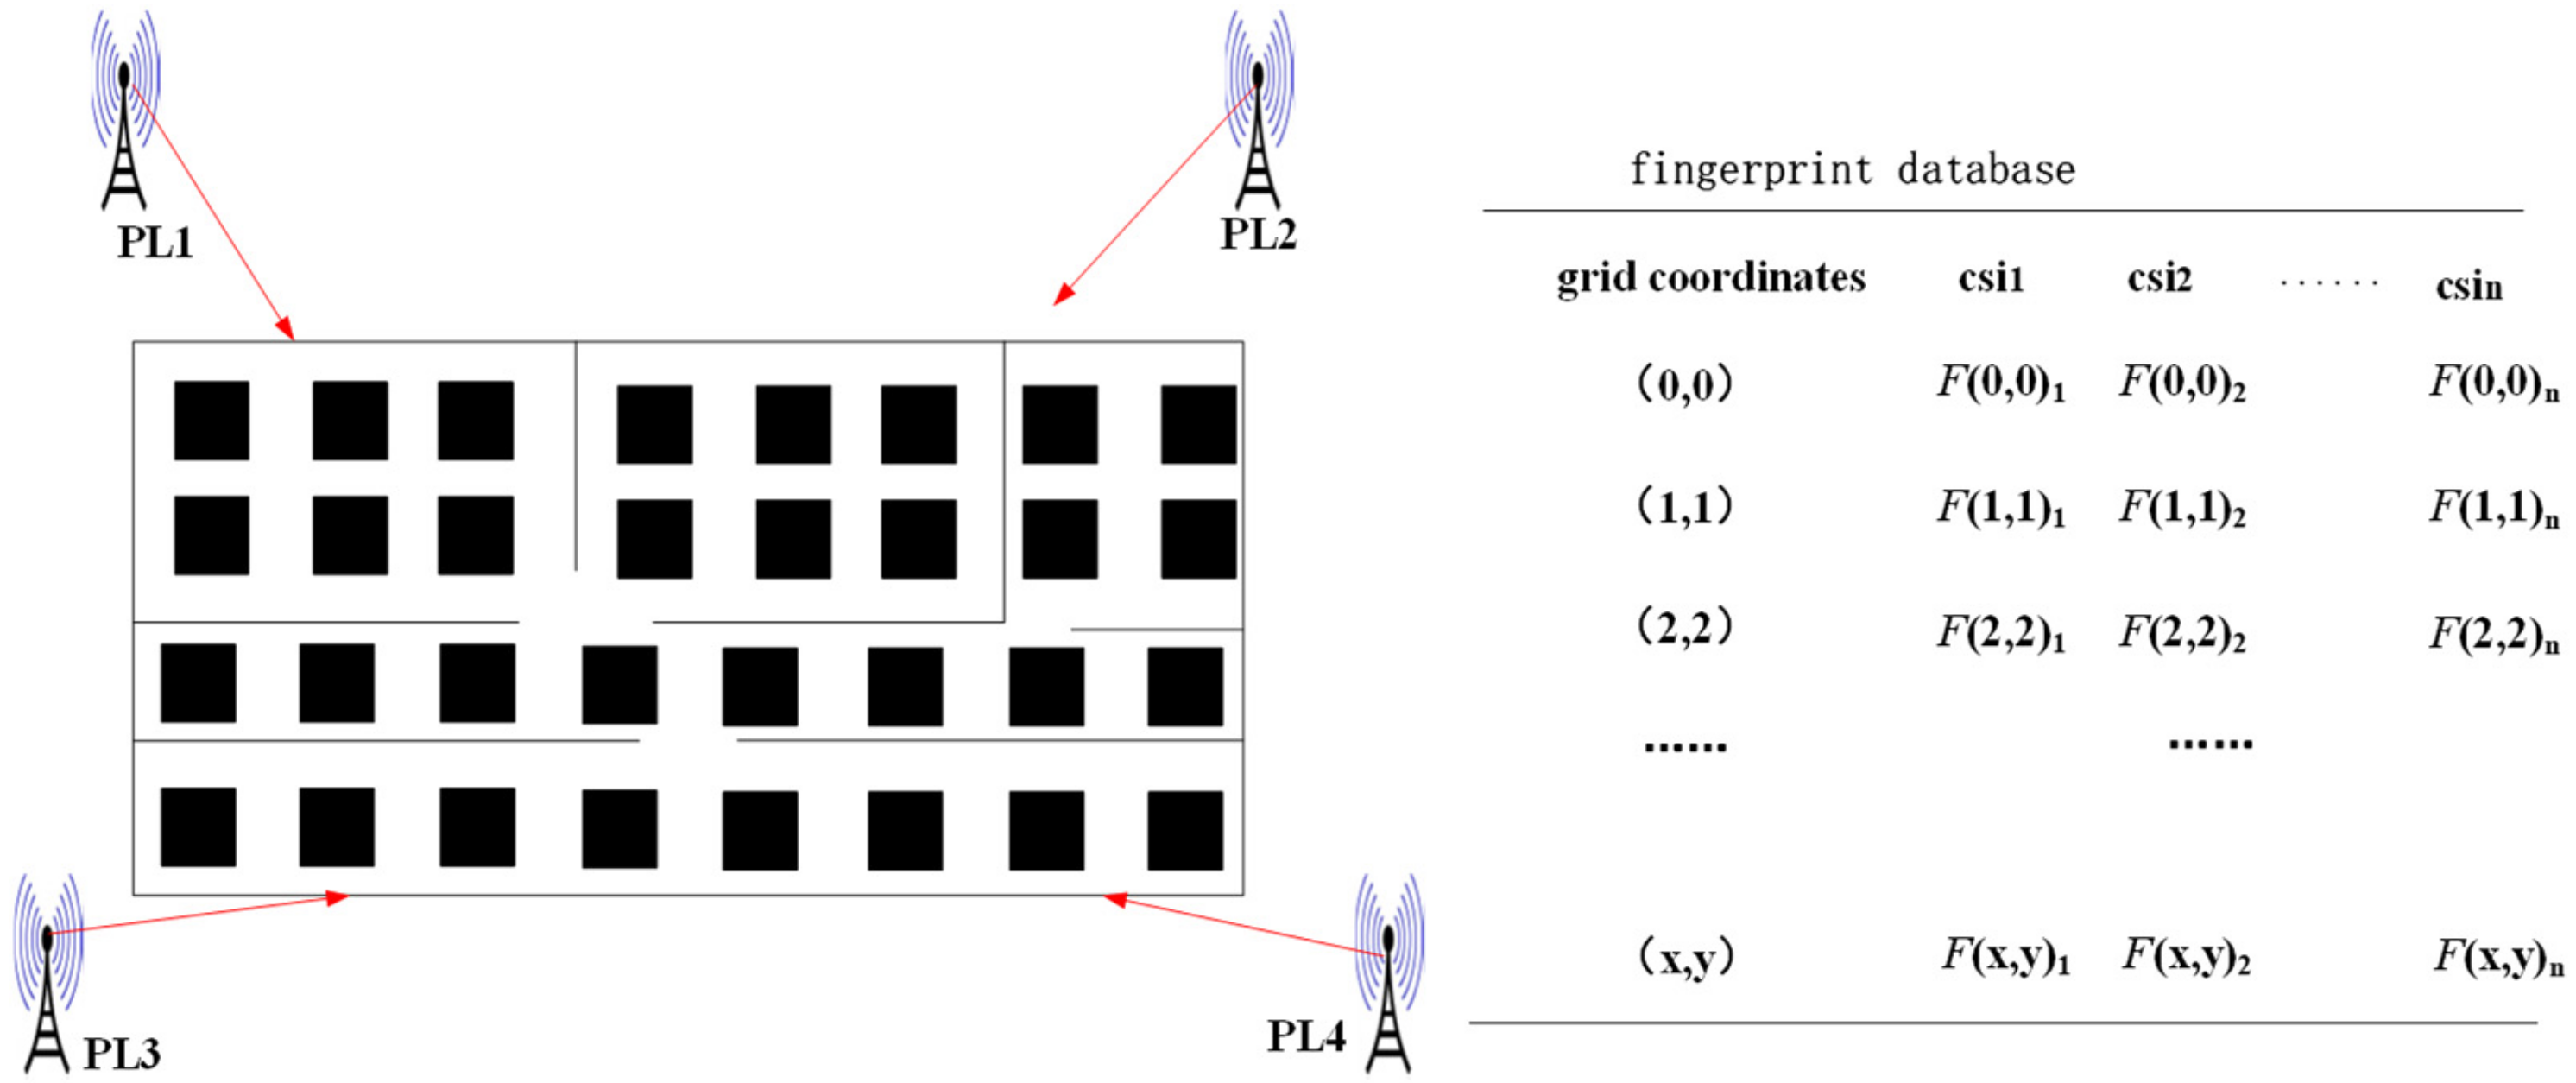
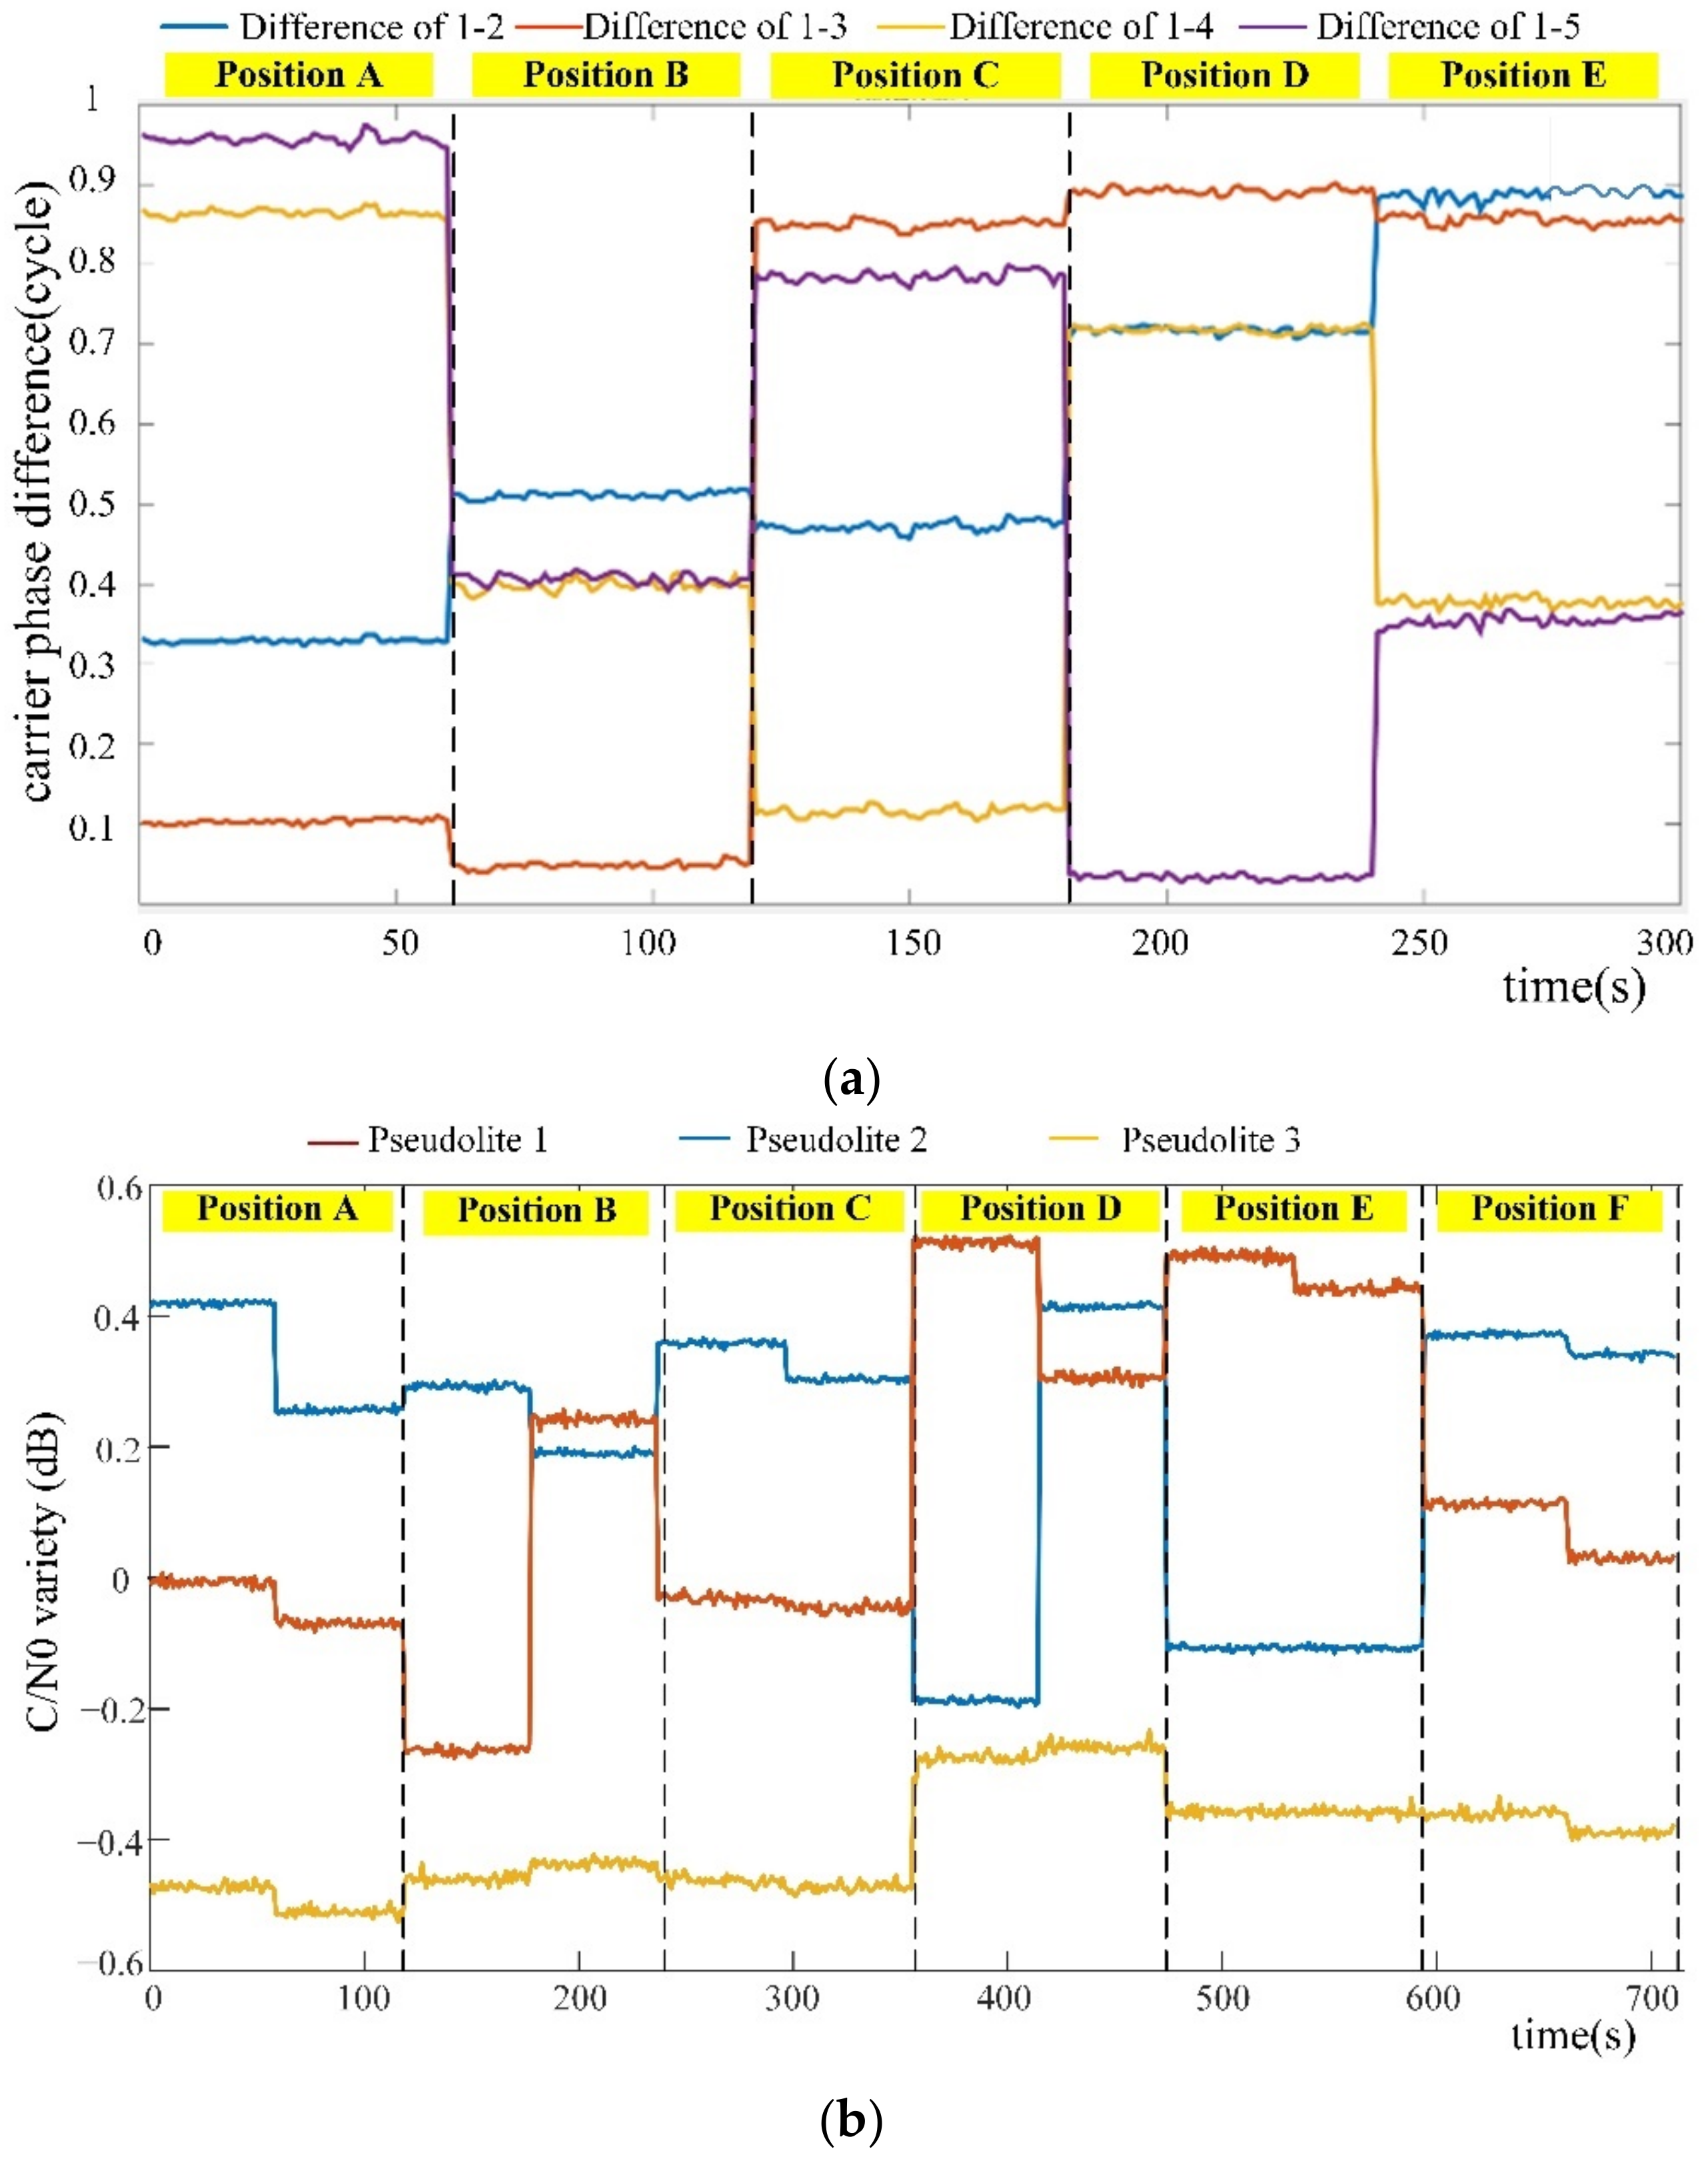
2.1. Selection of Feature Fingerprints for Pseudolite Observations
2.2. Positioning Principle
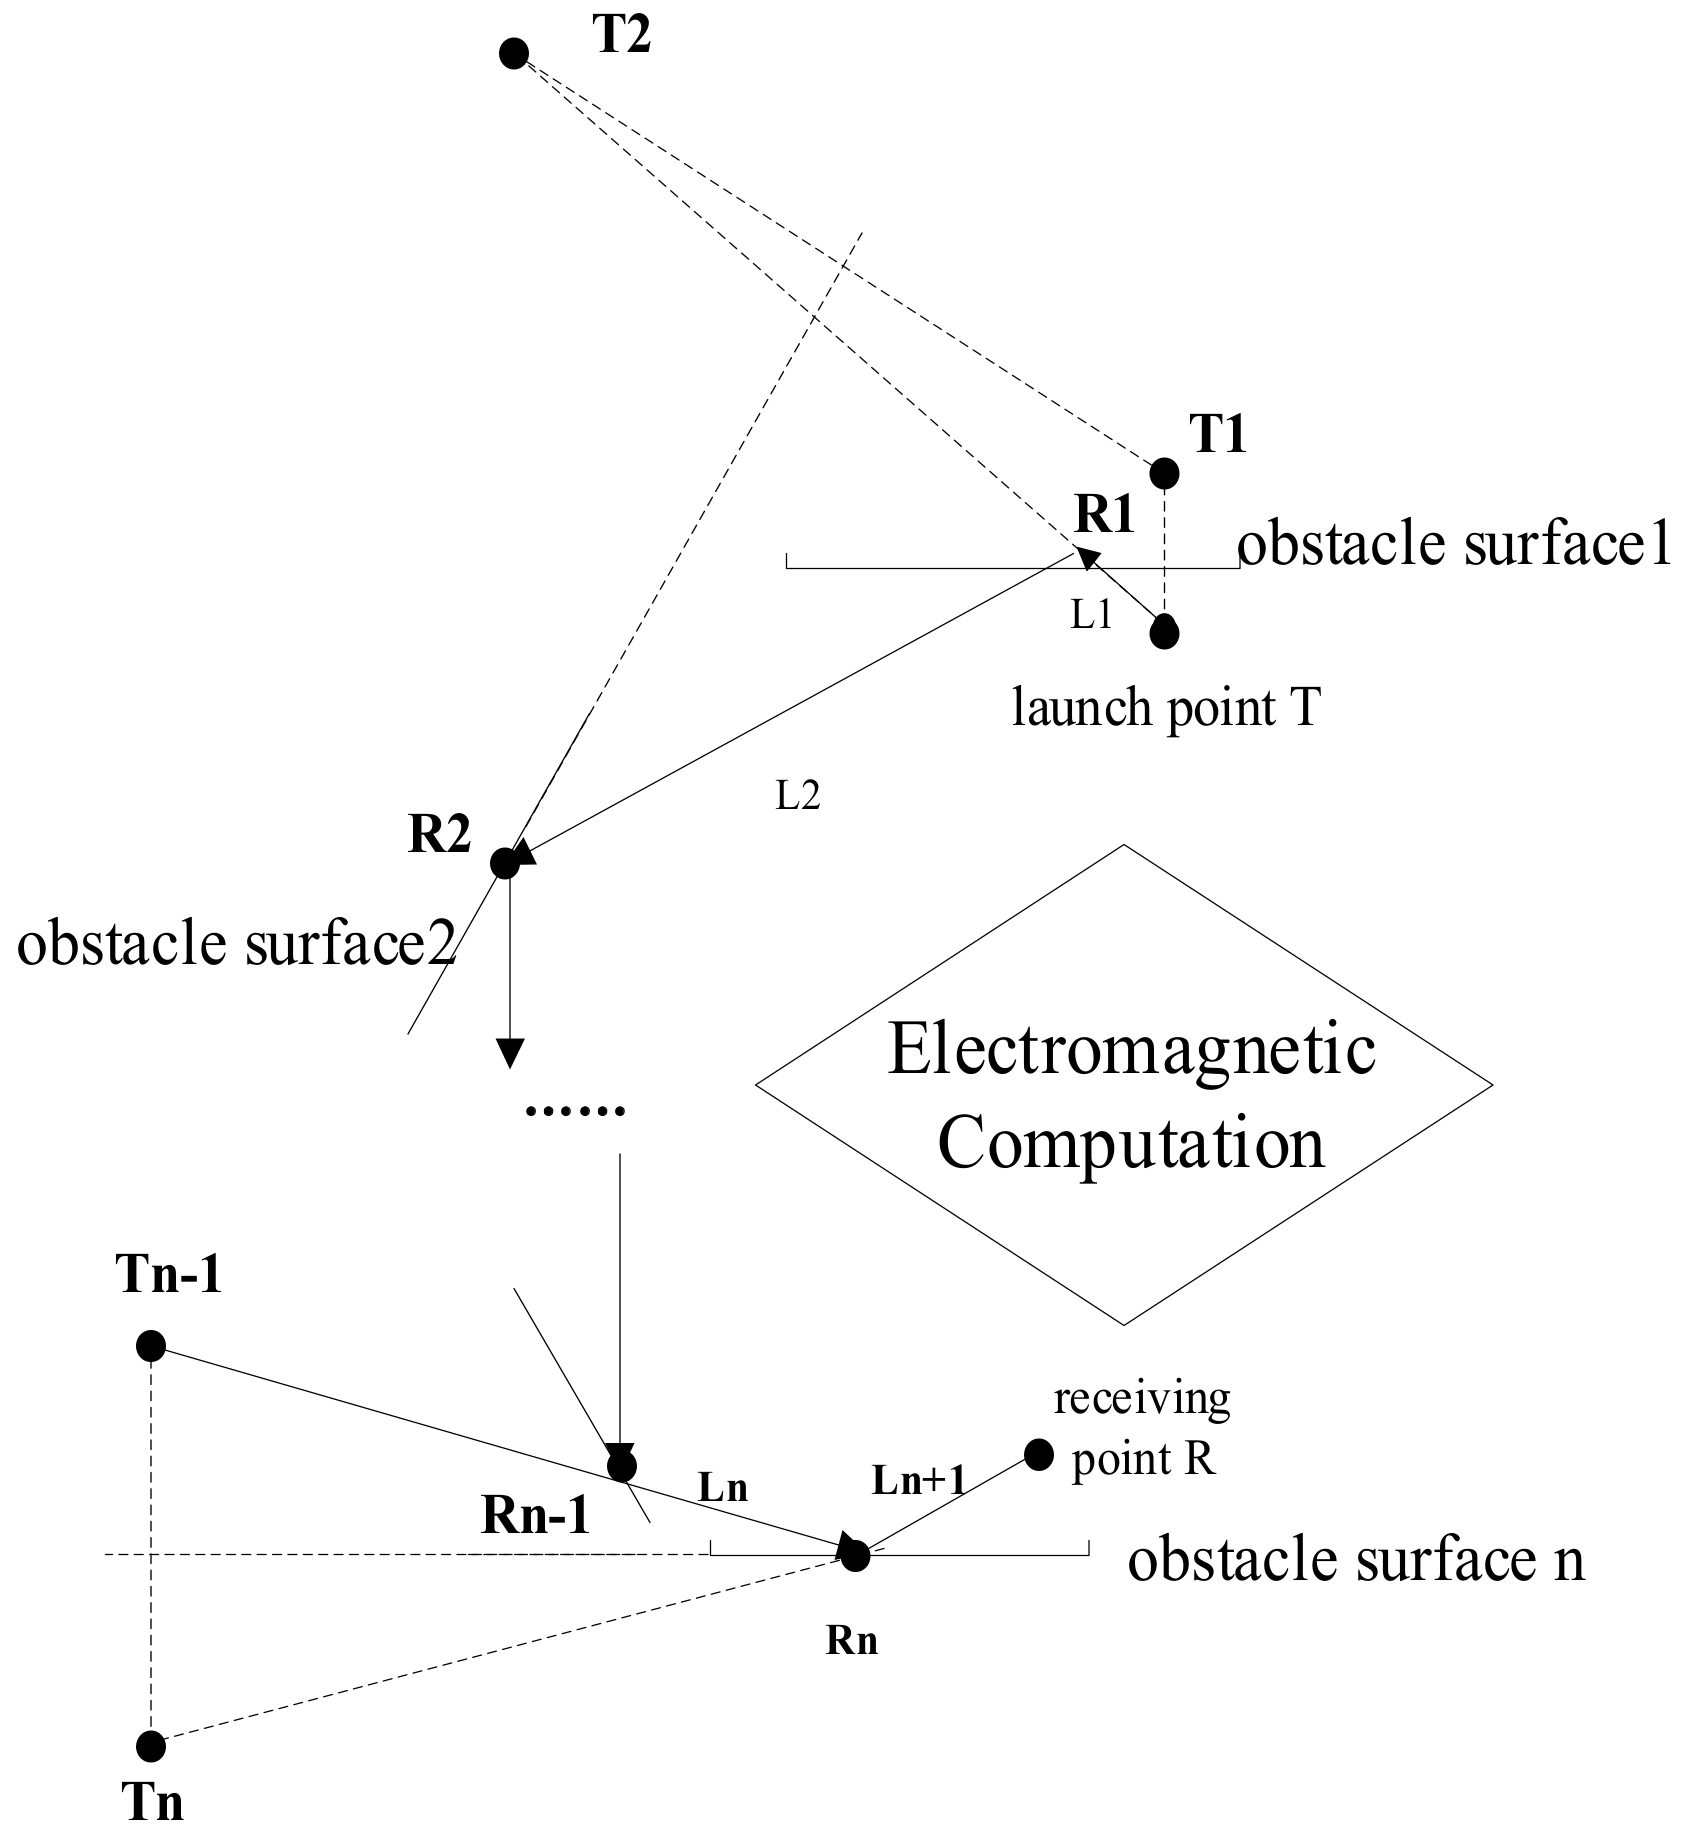
3. Ray Tracing
3.1. Algorithm Principles
3.2. Typical Characteristic Parameters
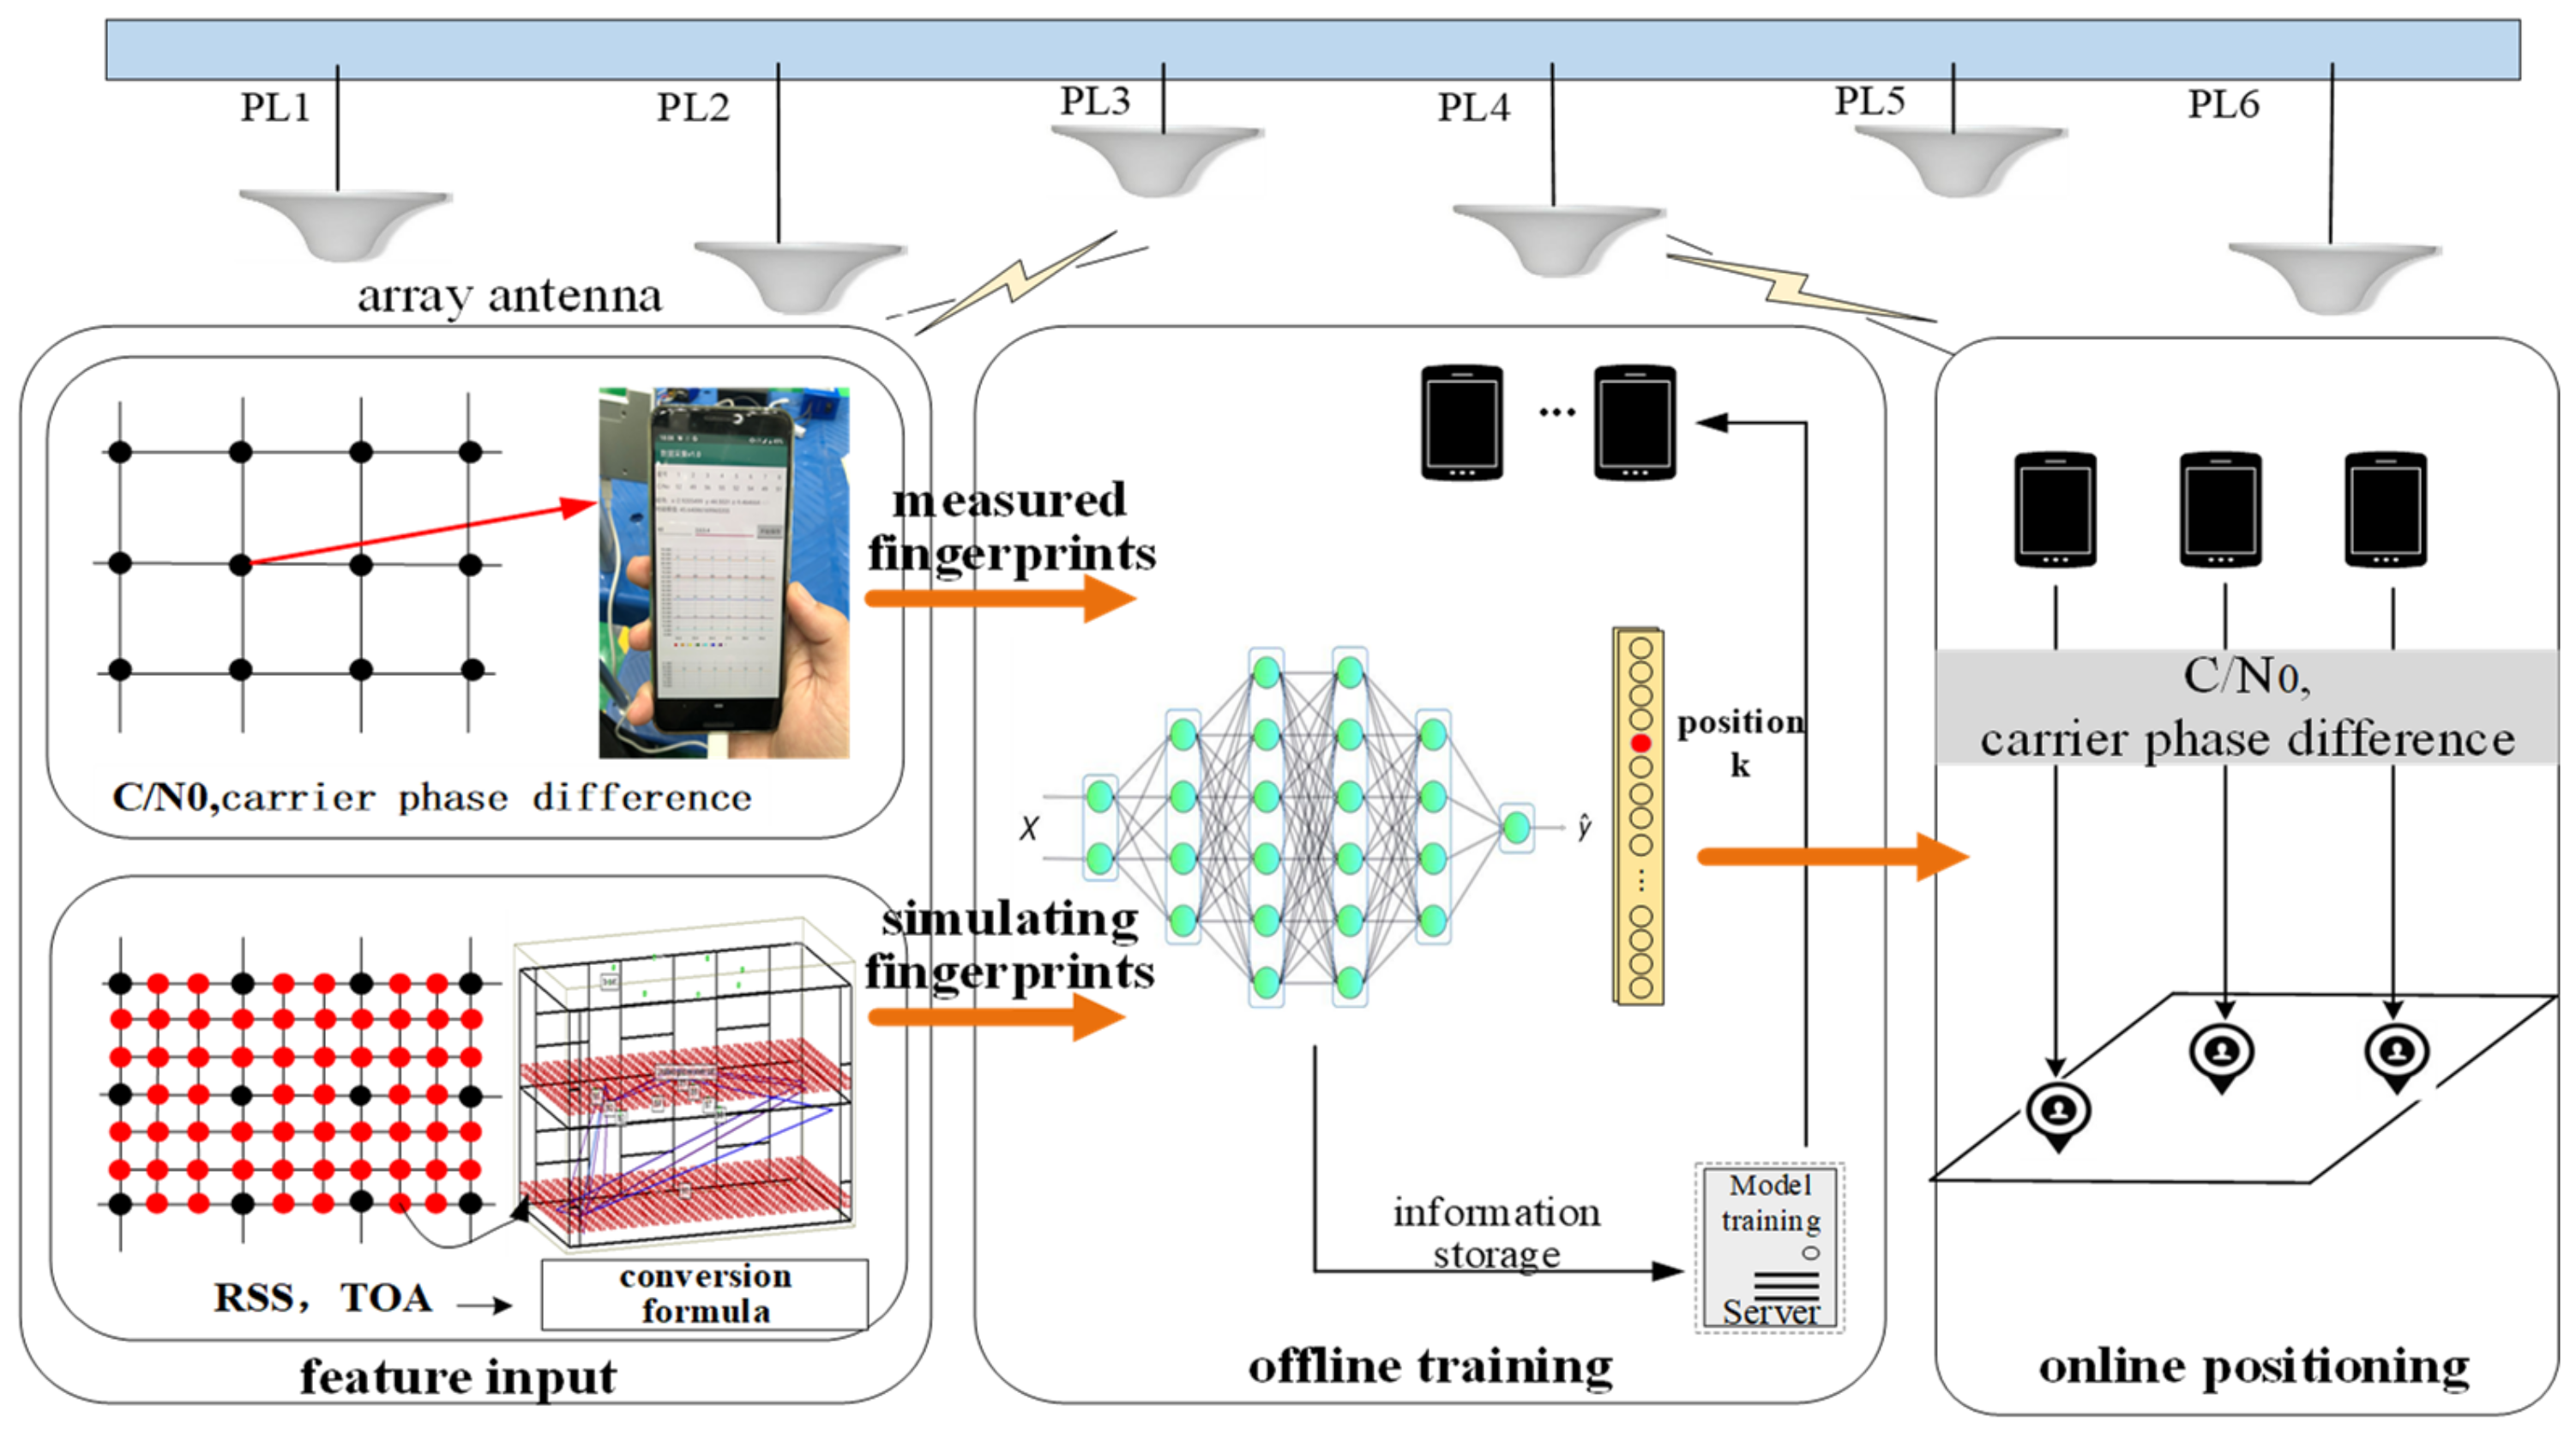
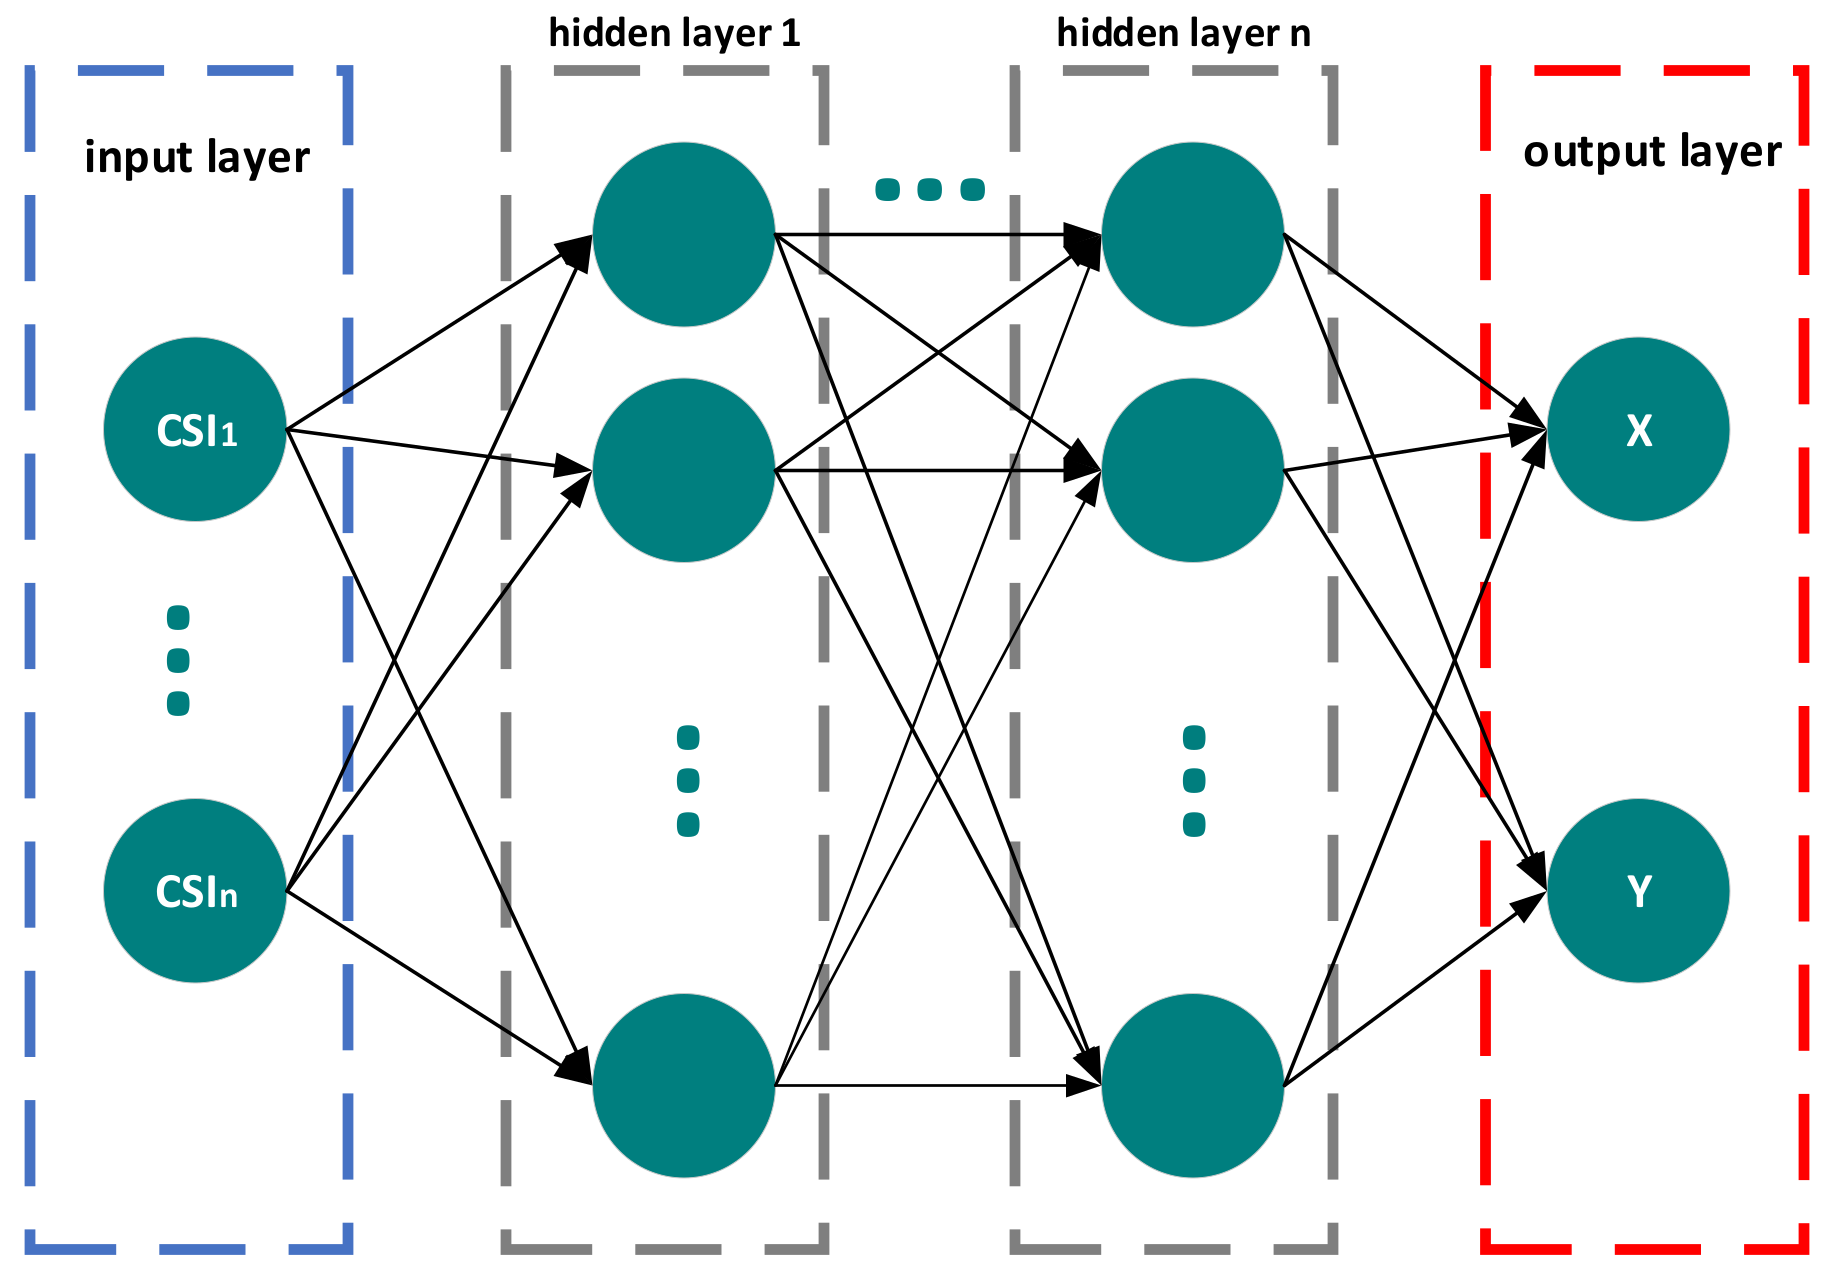
4. Fingerprint Localization Method Based on RT-ANN
| Algorithm 1: Model Training |
| Input: Pseudolite Observation dataset: , Ray Tracing simulation dataset , n is the number of pseudolites. |
| Location label: . |
| Output: Representation: and parameter: ; , Classification model: |
| 1: Initialization Parameters: Number of neurons for all layers; |
| The number of iterations (epochs); |
| 2: while not converged do |
| 3: |
| 4: ; |
| 5: Sampling ; |
| 6: Sampling from the posterior using the flowing |
| Reparameterization trick: ; |
| 7: Calculate the gradient of the variational lower bound (Reconstruction loss and Classification loss and Kullback-Leibler loss); |
| 8: Minimize ; |
| 9: end while |
| 10: while Classification model Training do |
| 11: Fit train Classifier |
| 12: end while |
5. Result
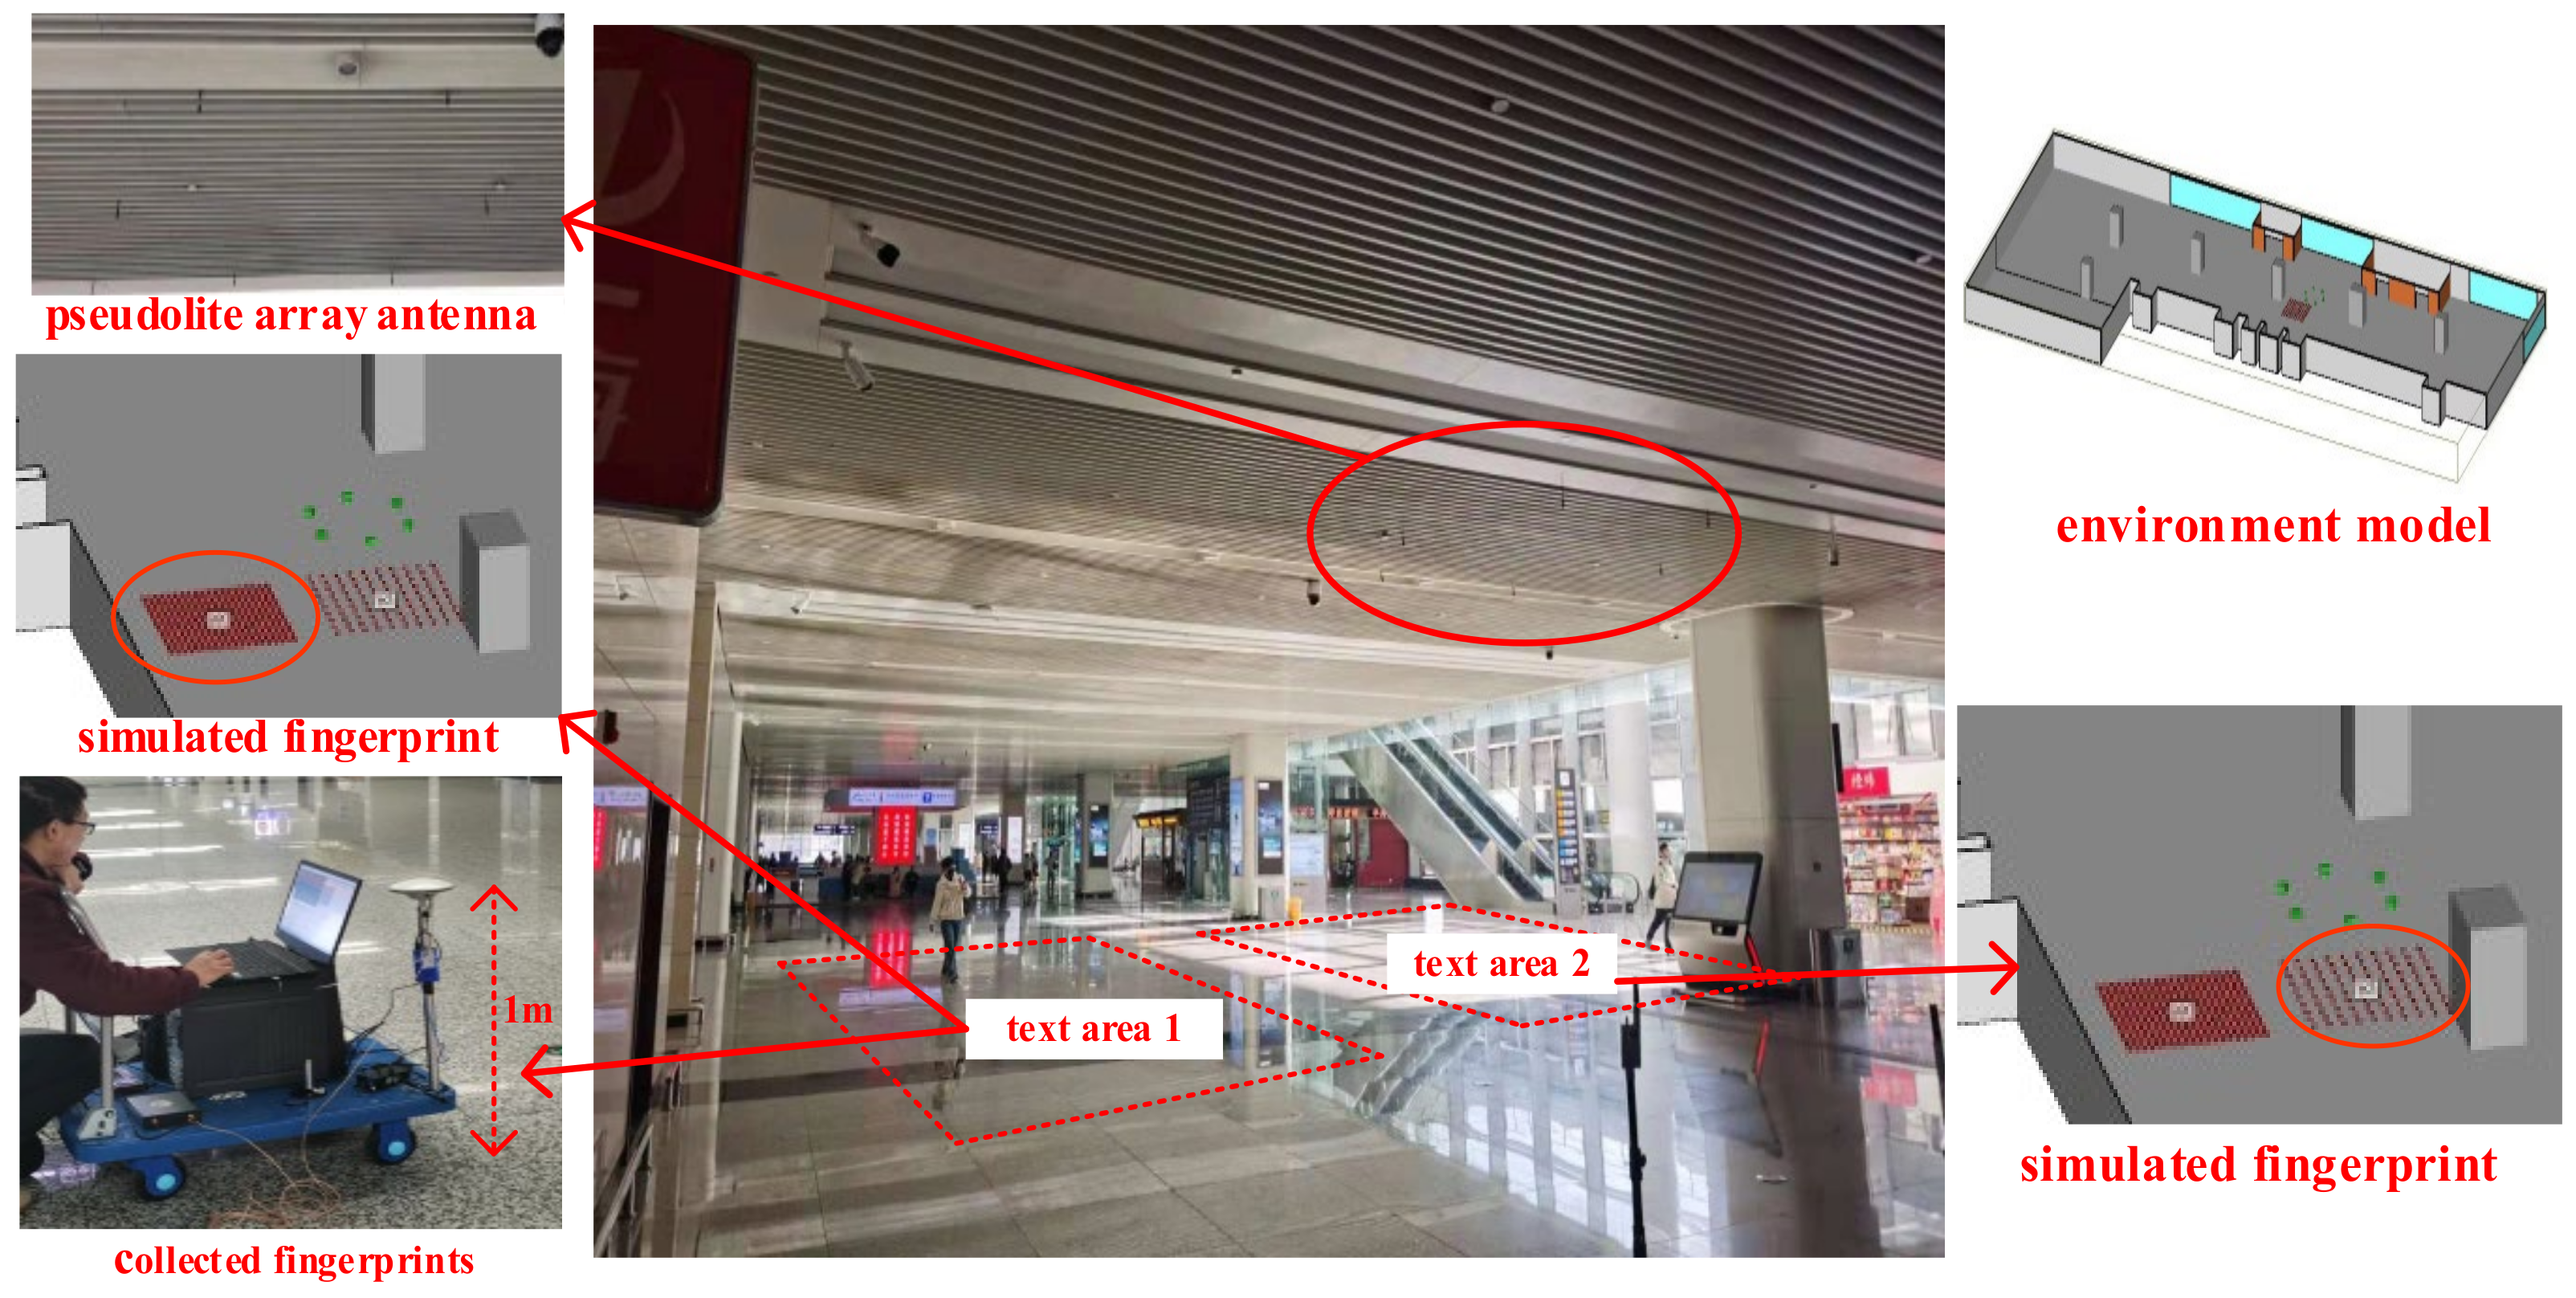
5.1. Environment Modeling
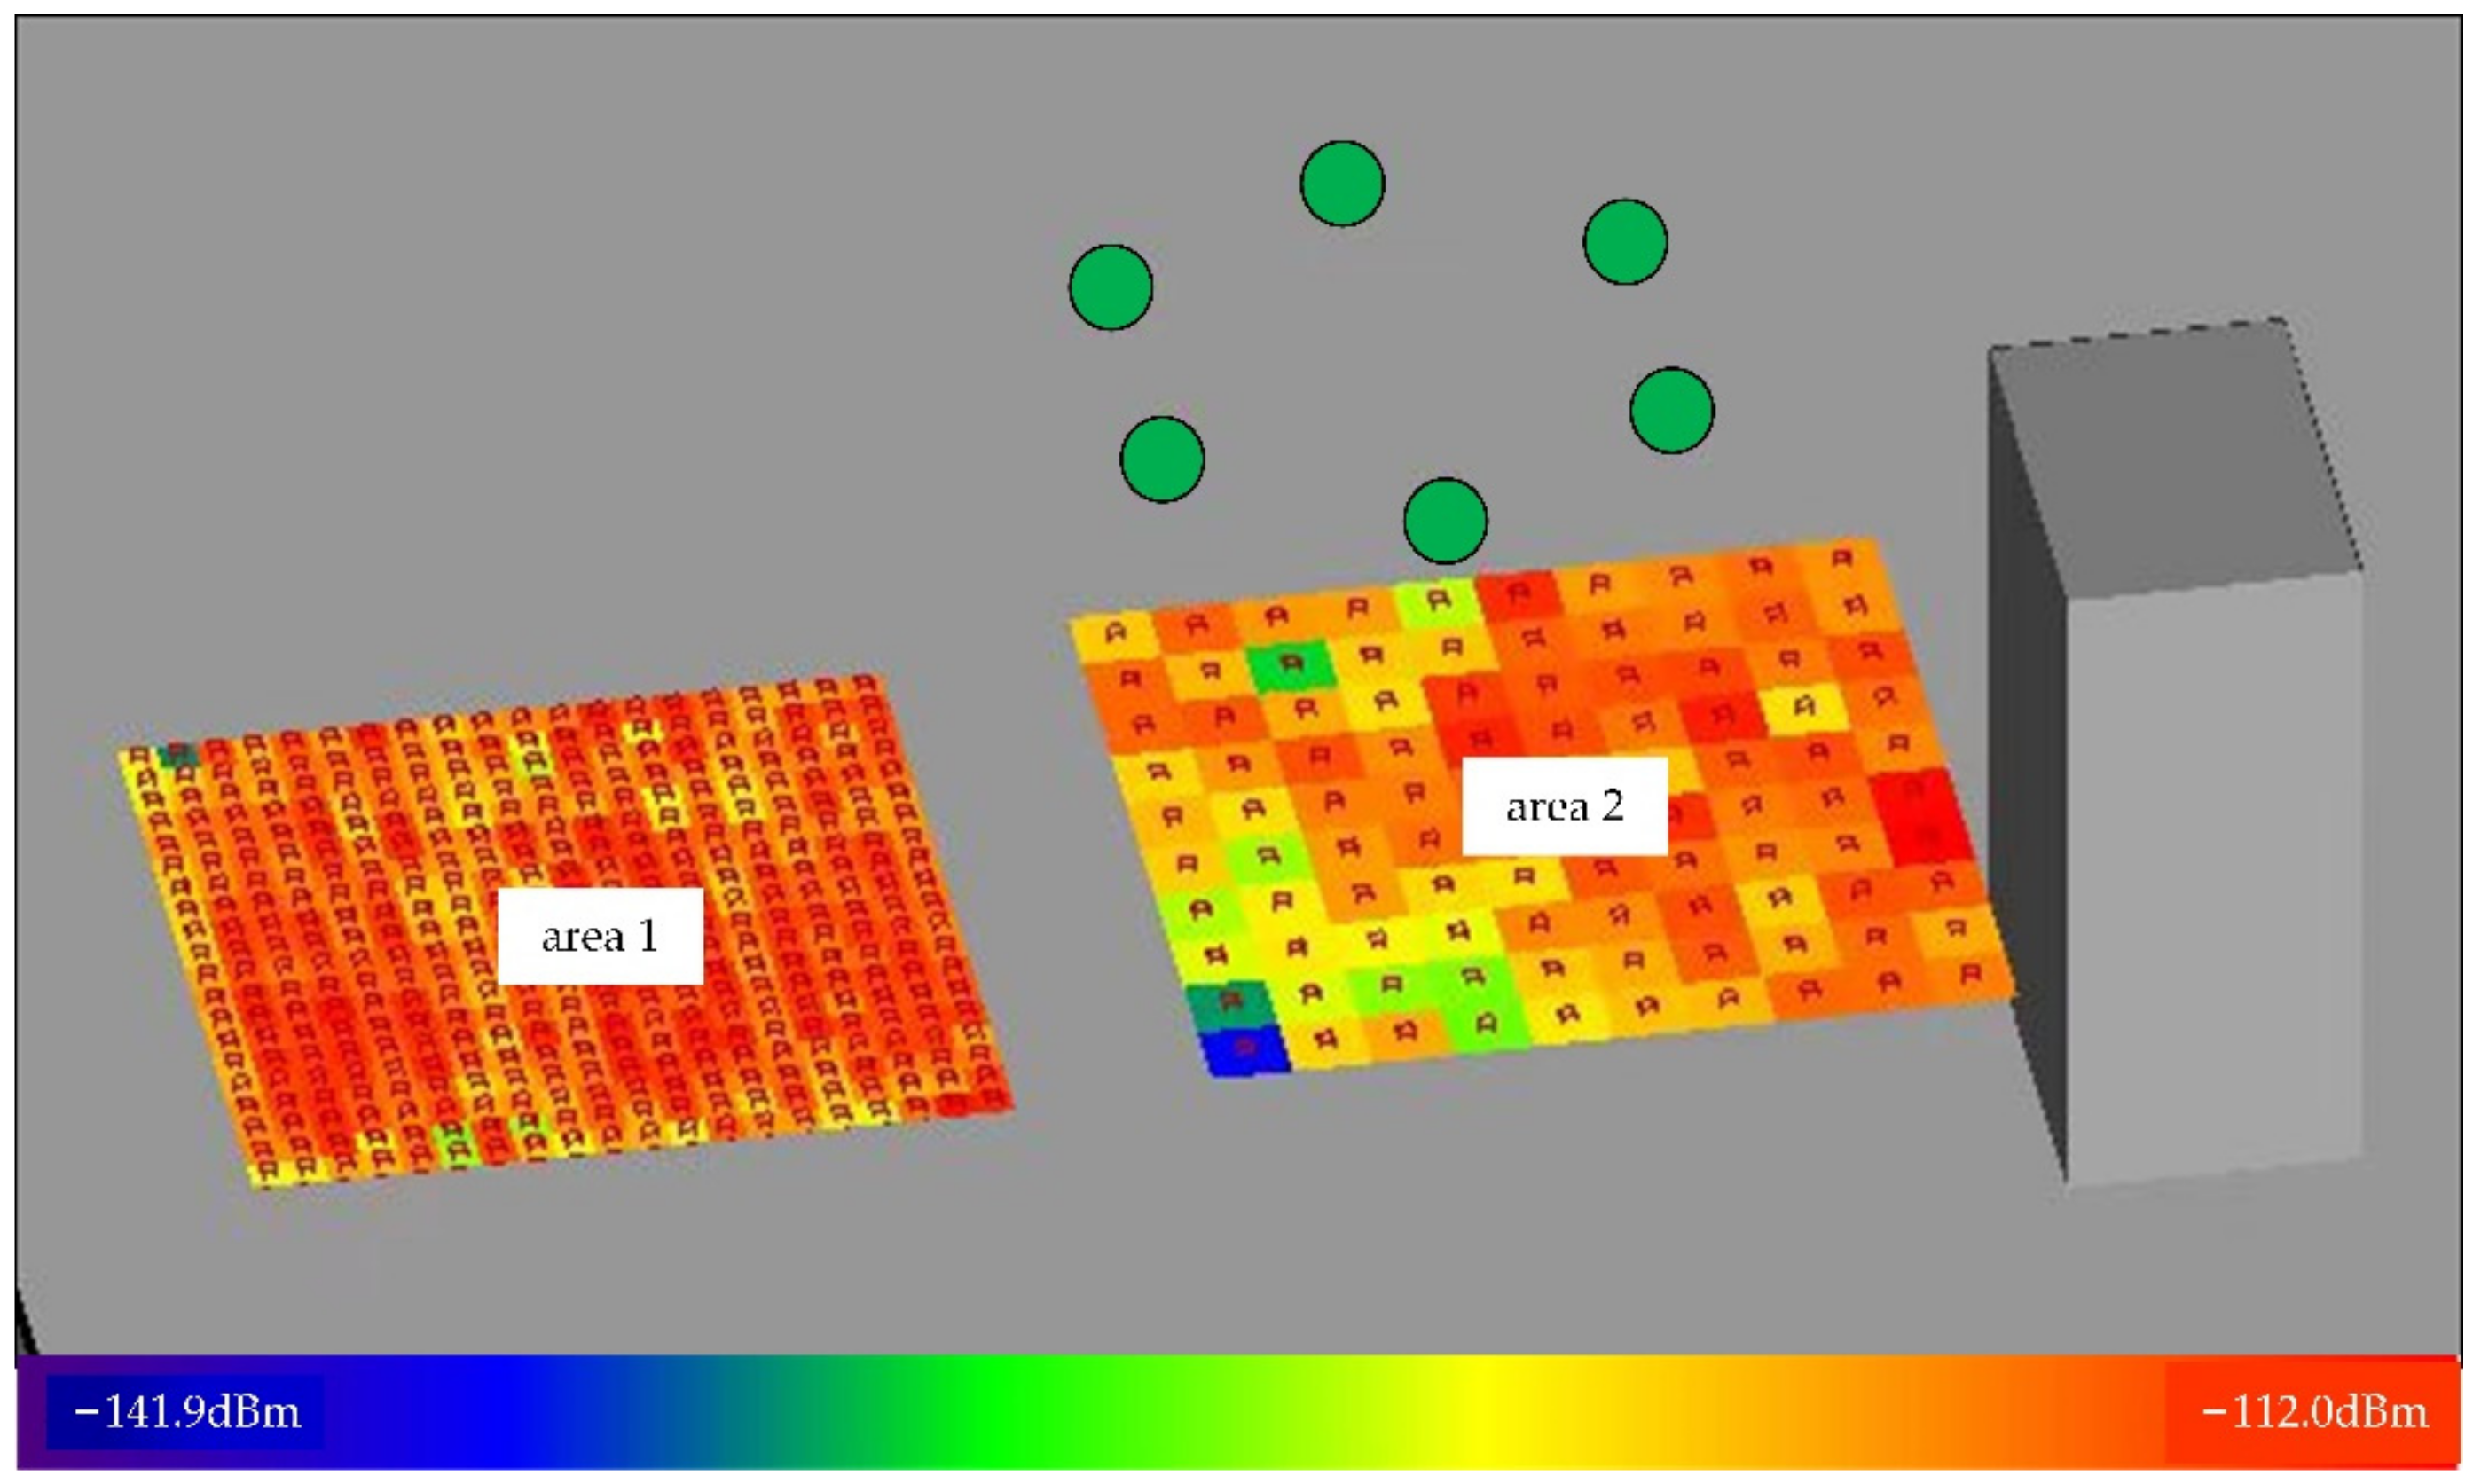
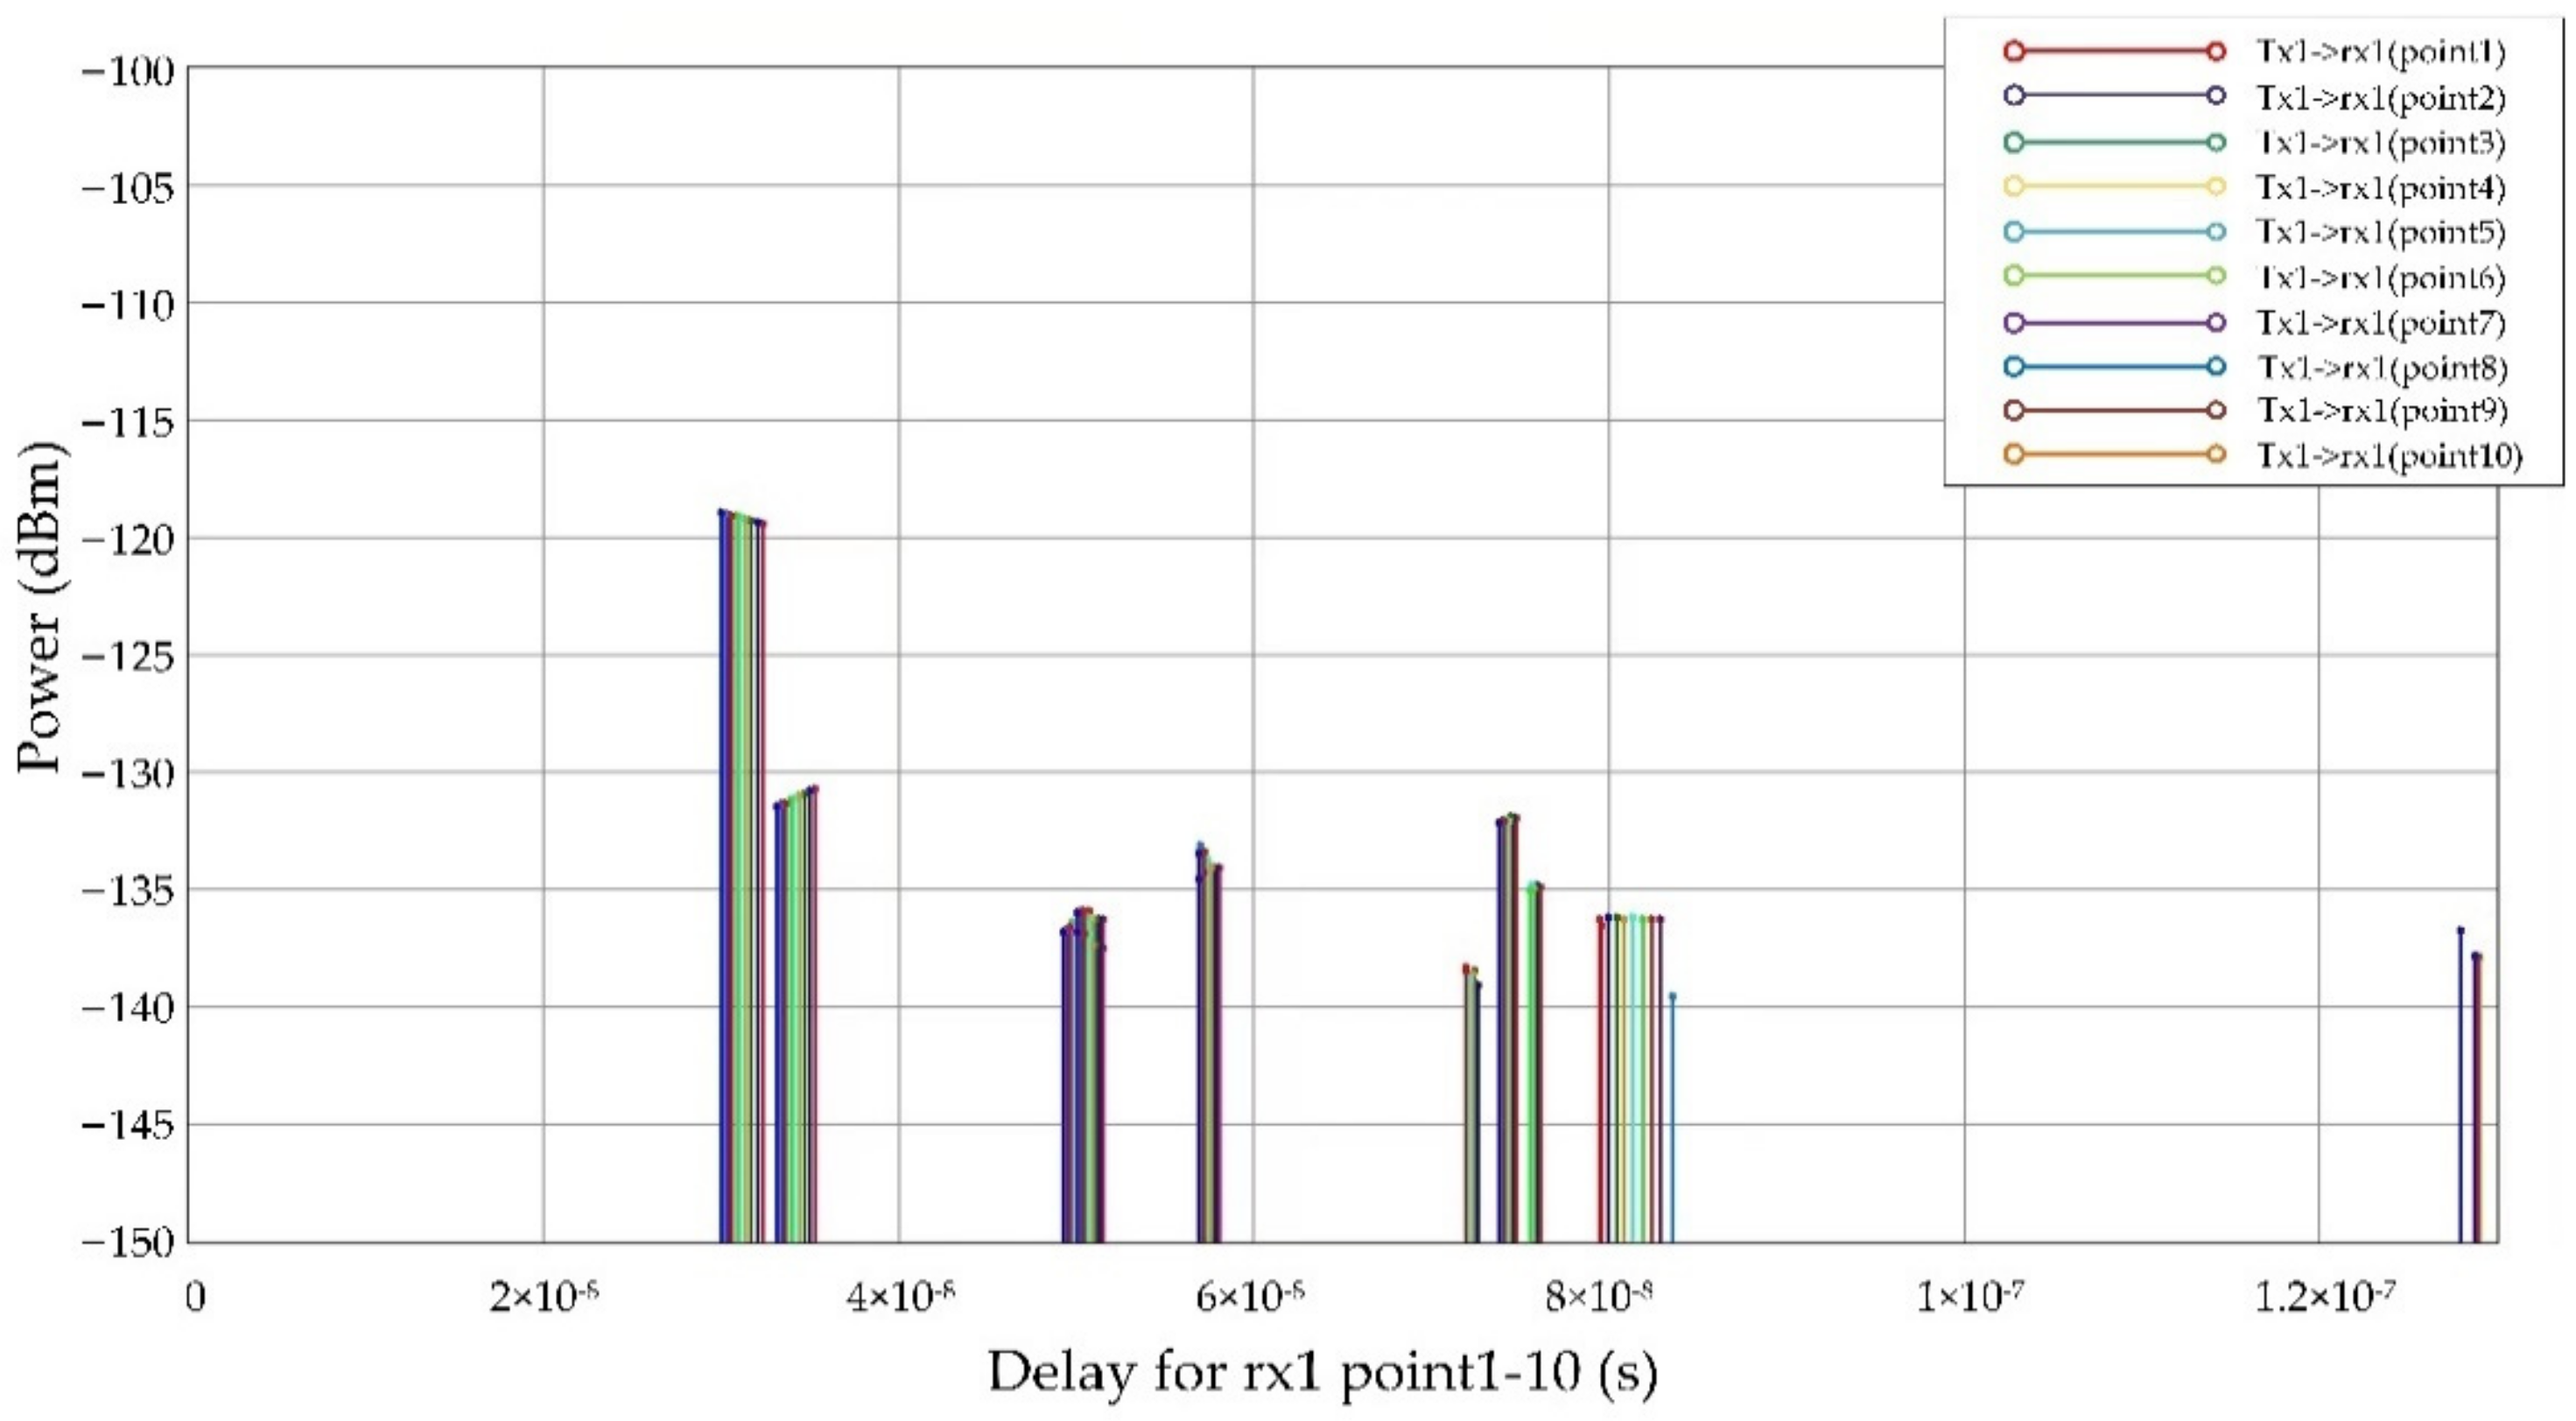
5.2. Fingerprint Data Generation
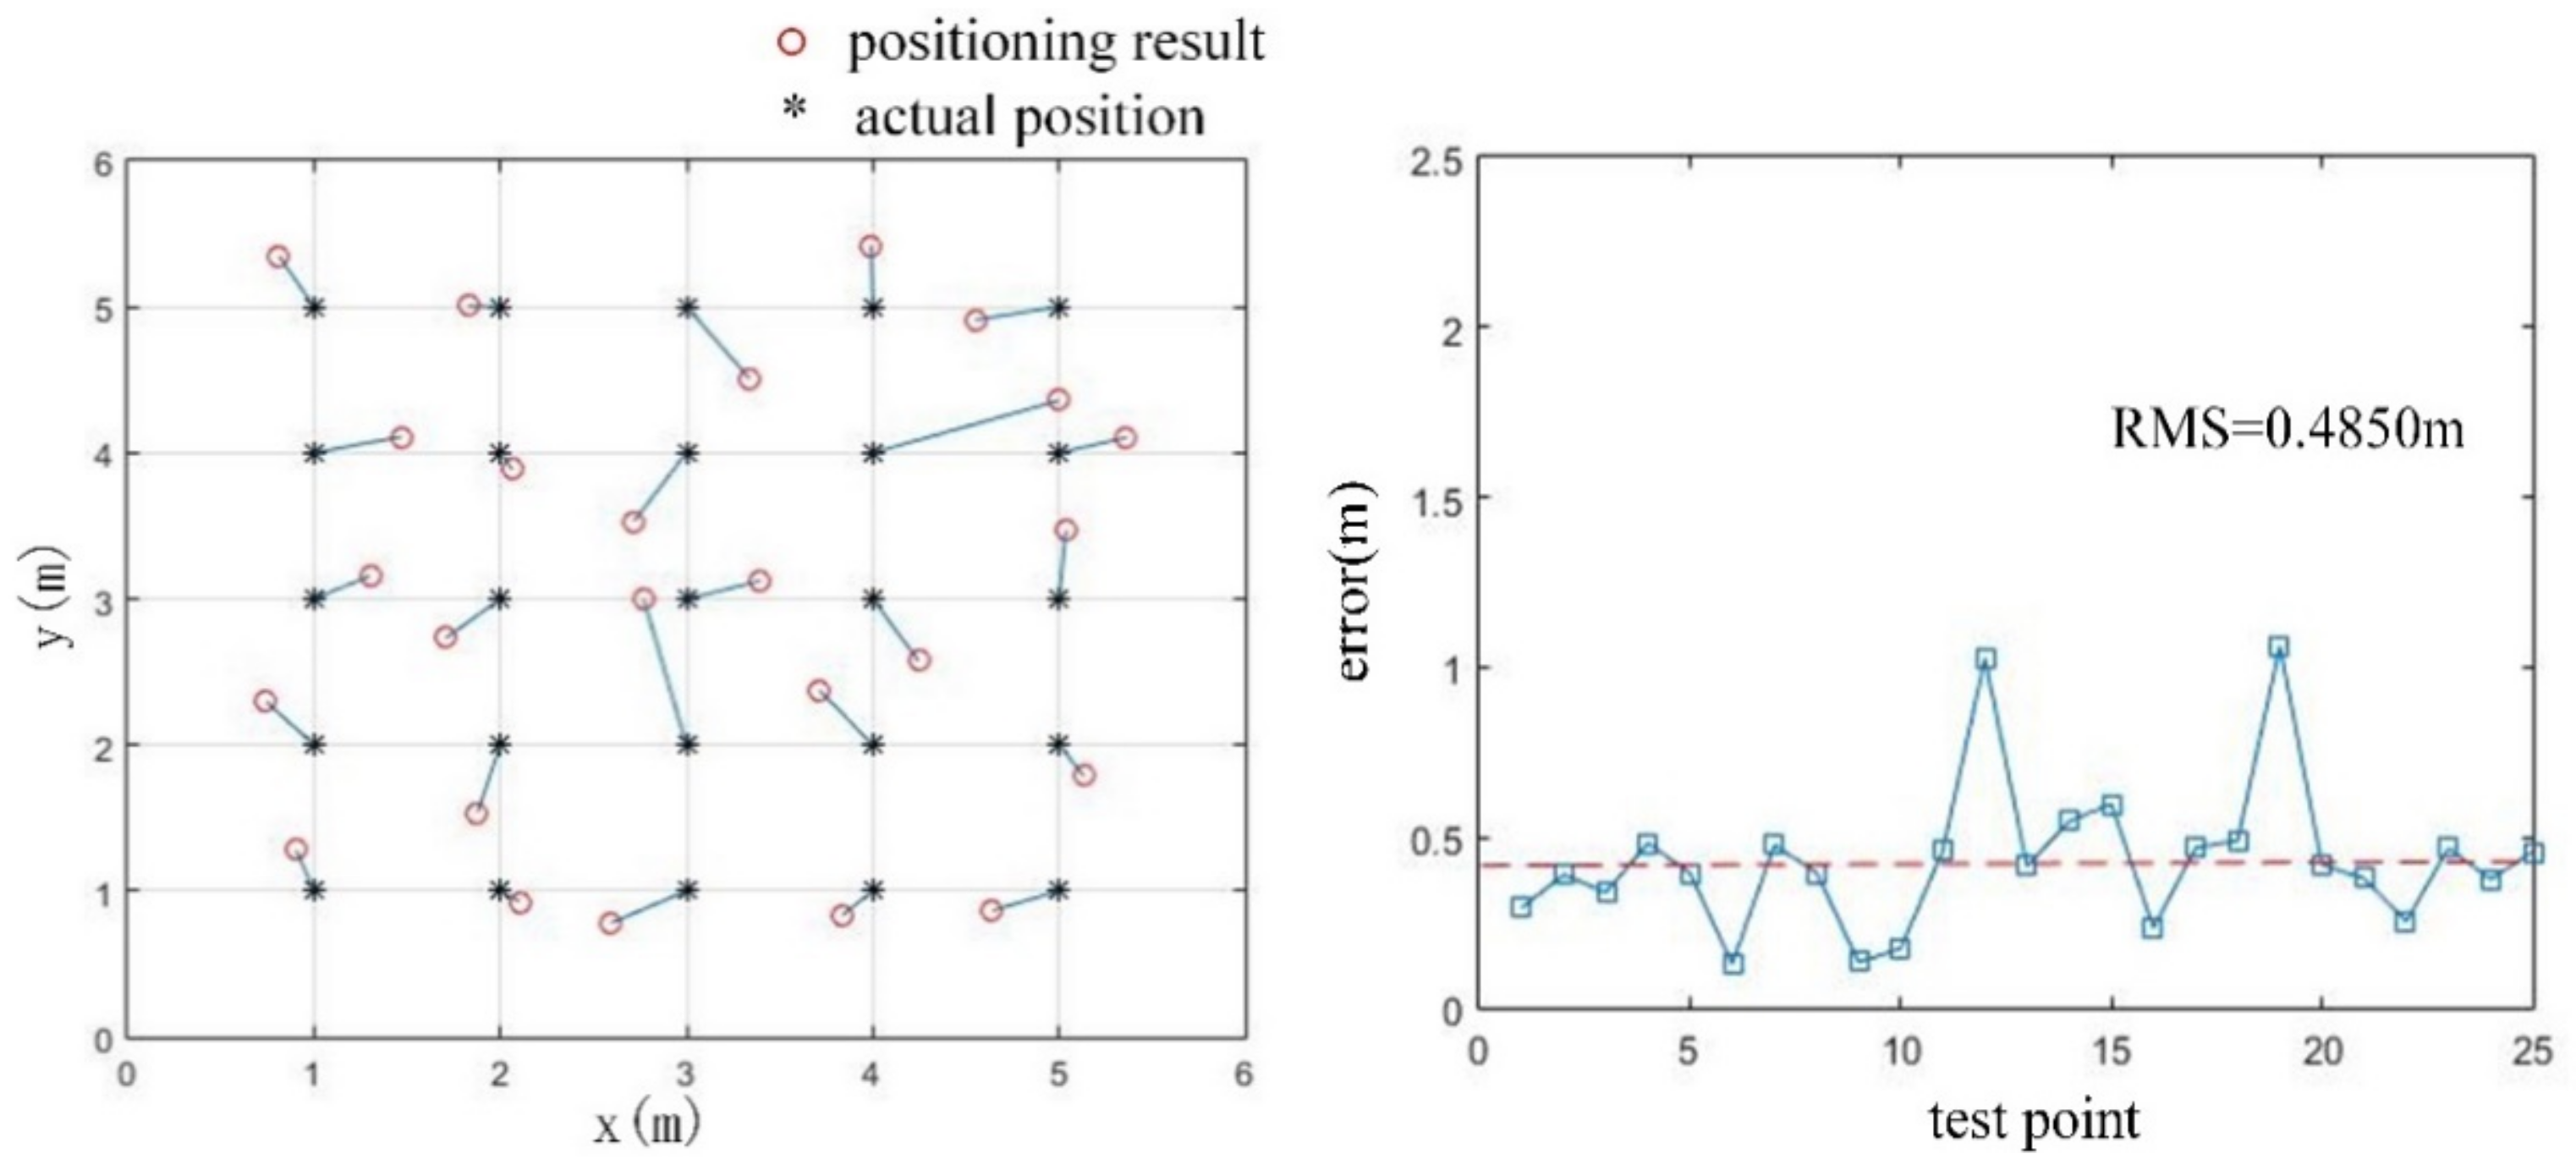
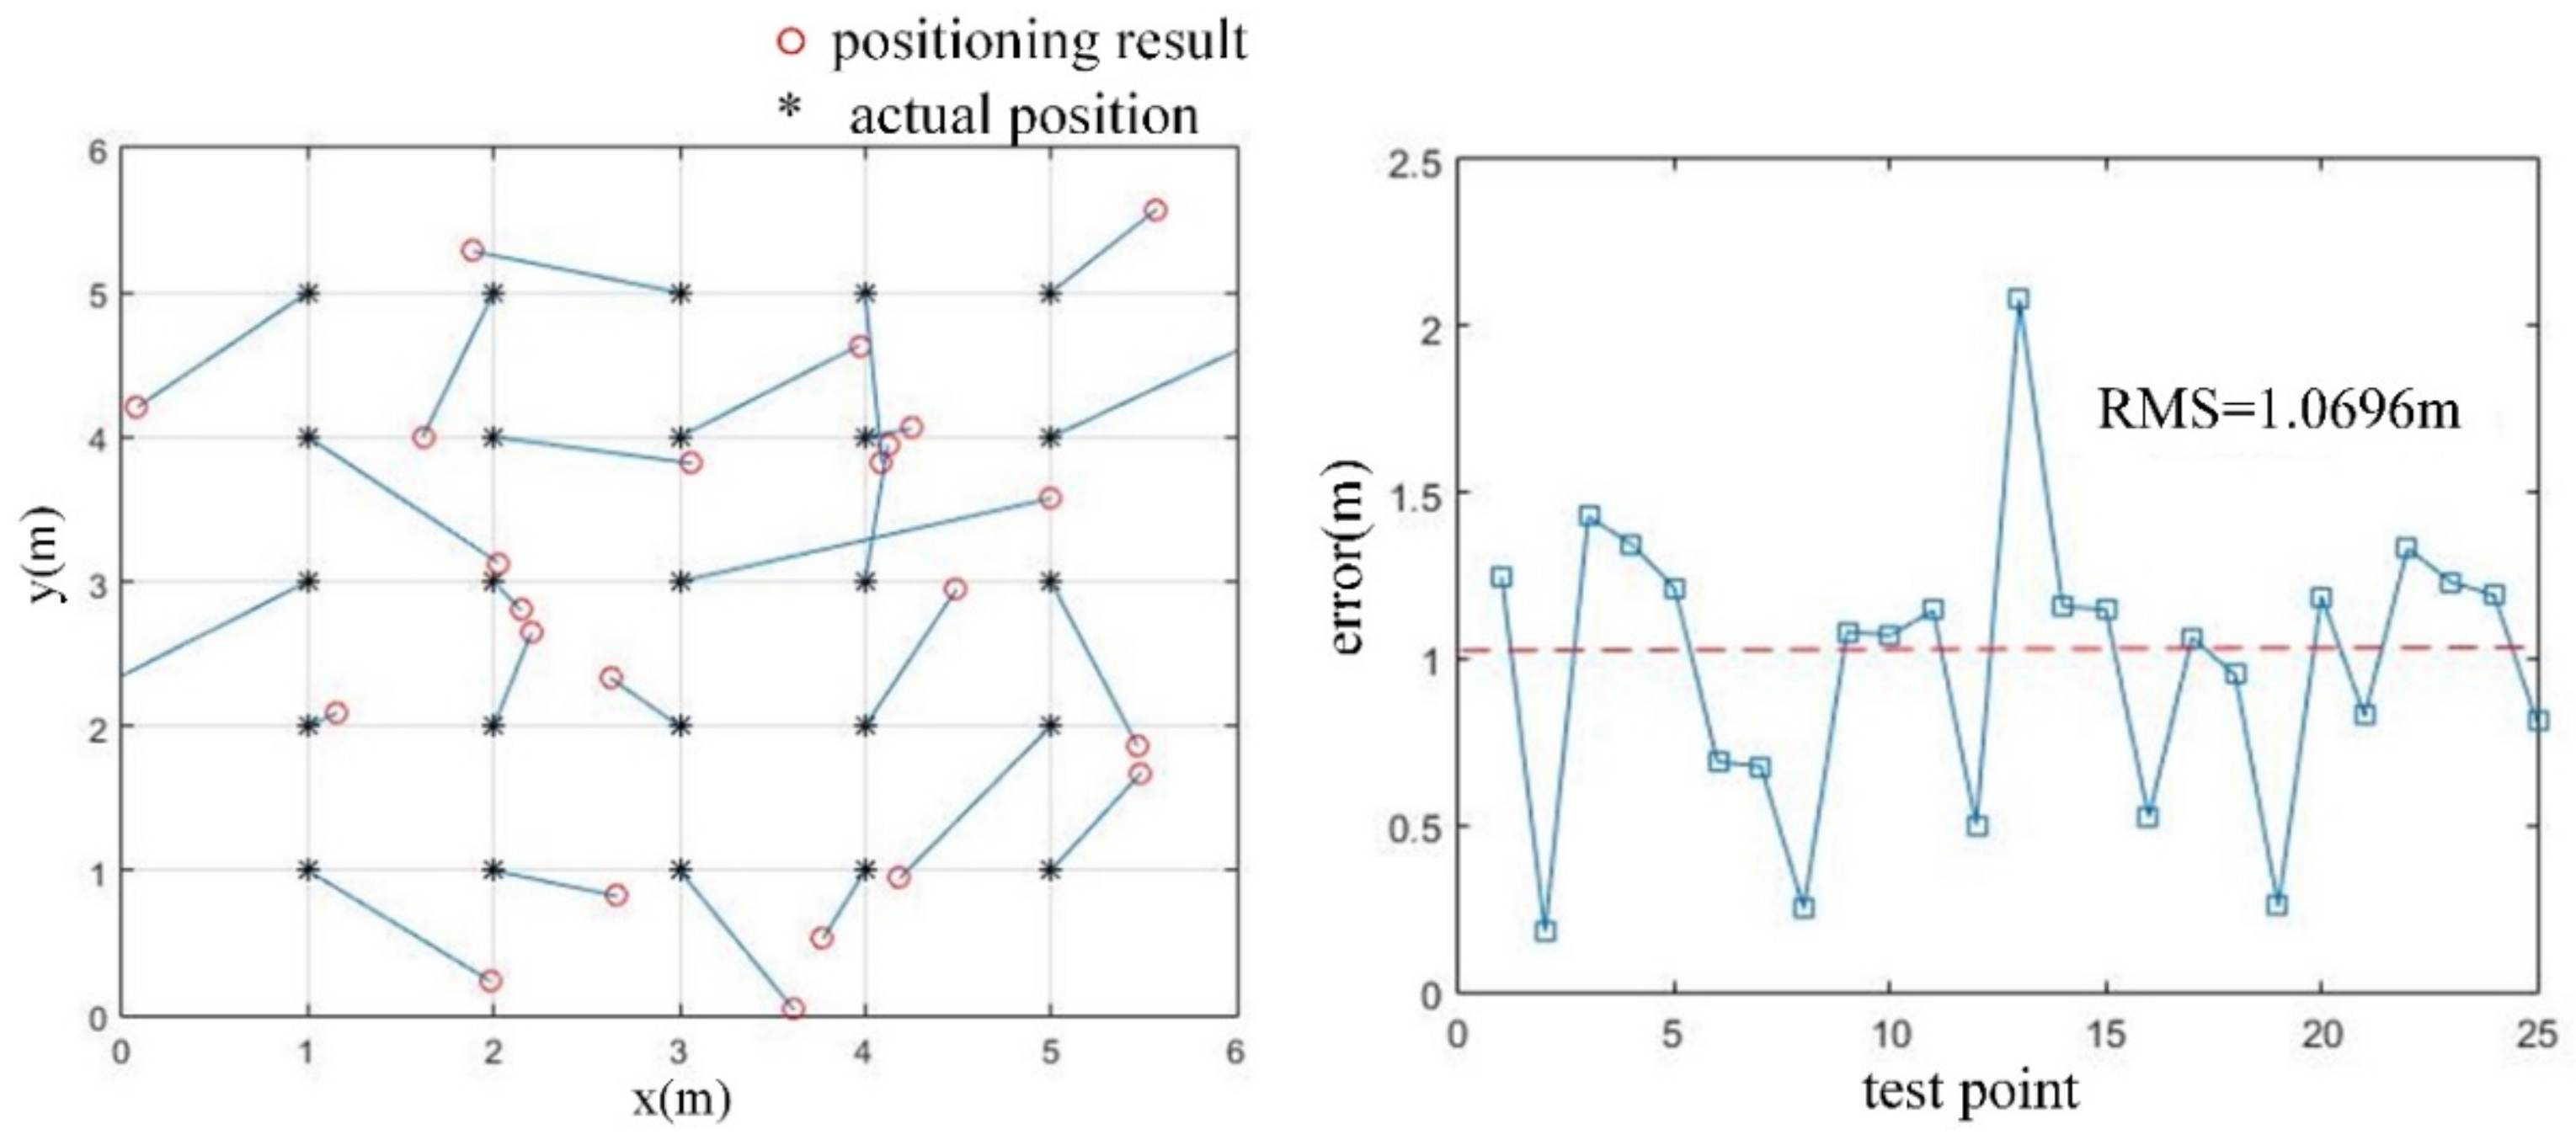
5.3. The Location Result of the Area with Fingerprints Collection
5.4. The Location Result of the Area without Fingerprints Collection
6. Conclusions
Author Contributions
Funding
Data Availability Statement
Conflicts of Interest
References
- Gan, X.; Yu, B.; Wang, X. A New Array Pseudolites Technology for High Precision Indoor Positioning. IEEE Access 2019, 7, 153269–153277. [Google Scholar] [CrossRef]
- Gan, X.; Sheng, C.; Zhang, H.; Huang, L. Combination of Asynchronous Array Pseudolites and GNSS for Outdoor Localization. IEEE Access 2019, 7, 38550–38557. [Google Scholar] [CrossRef]
- Fan, G.; Sheng, C.; Yu, B.; Huang, L.; Rong, Q. An Indoor and Outdoor Multi-Source Elastic Fusion Navigation and Positioning Algorithm Based on Particle Filters. Future Internet 2022, 14, 169. [Google Scholar] [CrossRef]
- Huang, L.; Yu, B.; Li, H.; Li, J.; Jia, H.; Cheng, J.; Li, Y. Pseudolite Fingerprint Positioning Method under GNSS Rejection Environment. Acta Electron. Sin. 2022, 50, 811–822. [Google Scholar]
- Zafari, F.; Gkelias, A.; Leung, K. A Survey of Indoor Localization Systems and Technologies. IEEE Commun. Surv. Tutor. 2019, 21, 2568–2599. [Google Scholar] [CrossRef]
- Ashraf, I.; Hur, S.; Park, Y. Application of Deep Convolutional Neural Networks and Smartphone Sensors for Indoor Localization. Appl. Sci. 2019, 9, 2337. [Google Scholar] [CrossRef]
- Ashraf, I.; Hur, S.; Park, Y. Indoor Positioning on Disparate Commercial Smartphones Using Wi-Fi Access Points Coverage Area. Sensors 2019, 19, 4351. [Google Scholar] [CrossRef]
- Poulose, A.; Kim, J.; Han, D. A Sensor Fusion Framework for Indoor Localization Using Smartphone Sensors and Wi-Fi RSSI Measurements. Appl. Sci. 2019, 9, 4379. [Google Scholar] [CrossRef]
- Khatab, Z.E.; Hajihoseini, A.; Ghorashi, S.A. A Fingerprint Method for Indoor Localization Using Autoencoder Based Deep Extreme Learning Machine. IEEE Sens. Lett. 2018, 2, 1–4. [Google Scholar] [CrossRef]
- Yuan, Z.; Zhang, X.; Zhou, P.; Wang, S. Research on Indoor Position Fingerprint Location Based on Machine Learning combined Particle Filter. In Proceedings of the International Conference on Safety Produce Informatization (IICSPI), Chongqing, China, 28–30 November 2019. [Google Scholar]
- Lin, C.; Chen, L.; Wu, H.; Jin, M.; Chen, G. An Indoor Positioning Algorithm Based on Fingerprint and Mobility Prediction in RSS Fluctuation-Prone WLANs. IEEE Trans. Syst. Man Cybern. 2021, 51, 2926–2936. [Google Scholar] [CrossRef]
- Huang, L.; Gan, X.; Yu, B. An Innovative Fingerprint Location Algorithm for Indoor Positioning Based on Array Pseudolite. Sensors 2019, 19, 4420. [Google Scholar] [CrossRef] [PubMed]
- Zhou, C.; Liu, J.; Sheng, M.; Zheng, Y.; Li, J. Exploiting Fingerprint Correlation for Fingerprint-Based Indoor Localization: A Deep Learning Based Approach. IEEE Trans. Veh. Technol. 2021, 70, 5762–5774. [Google Scholar] [CrossRef]
- Chen, L.; Ahriz, I.; Le Ruyet, D. AoA-Aware Probabilistic Indoor Location Fingerprinting Using Channel State Information. IEEE Internet Things J. 2020, 7, 10868–10883. [Google Scholar] [CrossRef]
- Wang, J.; Park, J.G. A Novel Indoor Ranging Algorithm Based on a Received Signal Strength Indicator and Channel State Information Using an Extended Kalman Filter. Appl. Sci. 2020, 10, 3687. [Google Scholar] [CrossRef]
- Song, Q.; Guo, S.; Liu, X.; Yang, Y. CSI Amplitude Fingerprinting-Based NB-IoT Indoor Localization. IEEE Internet Things J. 2018, 5, 1494–1504. [Google Scholar] [CrossRef]
- Haykin, S. Neural Networks: A Comprehensive Foundation; McMaster University Press: Hamilton, ON, Canada, 1998. [Google Scholar]
- Ilina, O.; Ziyadinov, V.; Klenov, N.; Tereshonok, M. A Survey on Symmetrical Neural Network Architectures and Applications. Symmetry 2022, 14, 1391. [Google Scholar] [CrossRef]
- Ashraf, I.; Hur, S.; Park, S.; Park, Y. DeepLocate: Smartphone Based Indoor Localization with a Deep Neural Network Ensemble Classifier. Sensors 2020, 20, 133. [Google Scholar] [CrossRef] [PubMed]
- Hertz, J.; Krogh, A.; Palmer, R. Introduction to the Theory of Neural Computation; Westview Press: Boulder, CO, USA, 1991. [Google Scholar]
- Wu, L.; He, D.; Ai, B.; Wang, J.; Zhong, Z. Artificial Neural Network Based Path Loss Prediction for Wireless Communication Network. IEEE Access 2020, 8, 199523–199538. [Google Scholar] [CrossRef]
- Morocho-Cayamcela, M.E.; Maier, M.; Lim, W. Breaking Wireless Propagation Environmental Uncertainty with Deep Learning. IEEE Trans. Wirel. Commun. 2020, 19, 5075–5087. [Google Scholar] [CrossRef]
- Yang, Y.; Gao, F.; Zhong, Z.; Ai, B.; Alkhateeb, A. Deep Transfer Learning-Based Downlink Channel Prediction for FDD Massive MIMO Systems. IEEE Trans. Commun. 2020, 68, 7485–7497. [Google Scholar] [CrossRef]
- Xue, W.; Li, Q.; Zhou, B. Virtual AP based indoor localization in area without linear constraints. Acta Geod. Cartogr. Sin. 2021, 50, 569–579. [Google Scholar]
- Mo, Y.; Cai, Y.; Bang, W. A novel indoor localization method based on virtual AP estimation. In Proceedings of the IEEE International Conference on Communications, Ottawa, ON, Canada, 10–15 June 2012. [Google Scholar]
- Wu, S.; Huang, W.; Li, M.; Xu, K. A Novel RSSI Fingerprint Positioning Method Based on Virtual AP and Convolutional Neural Network. IEEE Sens. J. 2022, 22, 6898–6909. [Google Scholar] [CrossRef]
- Xu, F.; Hu, X.; Luo, S. An Efficient Indoor Wi-Fi Positioning Method Using Virtual Location of AP. Int. J. Geo-Inf. 2020, 9, 261. [Google Scholar] [CrossRef]
- Guo, J. Research and Implementation of Indoor Positioning Method Based on Beidou Pseudolite. Master’s Thesis, Shandong Jiaotong University, Qingdao, China, 2021. [Google Scholar]
- Xia, S.; Liu, Y.; Yuan, G.; Zhu, M.; Wang, Z. Indoor Fingerprint Positioning Based on Wi-Fi: An Overview. ISPRS Int. J. Geo-Inf. 2017, 6, 135. [Google Scholar] [CrossRef]
- Kawecki, R.; Hausman, S.; Korbel, P. Performance of Fingerprinting-Based Indoor Positioning with Measured and Simulated RSSI Reference Maps. Remote Sens. 2022, 14, 1992. [Google Scholar] [CrossRef]
- Alshami, I.H.; Ahmad, N.A.; Sahibuddin, S.; Firdaus, F. Adaptive Indoor Positioning Model Based on WLAN-Fingerprinting for Dynamic and Multi-Floor Environments. Sensors 2017, 17, 1789. [Google Scholar] [CrossRef]
- Fuschini, F.; Vitucci, E.M.; Barbiroli, M. Ray tracing propagation modeling for future small-cell and indoor applications: A review of current techniques. Radio Sci. 2015, 50, 469–485. [Google Scholar] [CrossRef]
- Del Corte-Valiente, A.; Gómez-Pulido, J.M.; Gutiérrez-Blanco, O.; Castillo-Sequera, J.L. Localization Approach Based on Ray-Tracing Simulations and Fingerprinting Techniques for Indoor-Outdoor Scenarios. Energies 2019, 12, 2943. [Google Scholar] [CrossRef]
- Hossain, F.; Geok, T.K.; Rahman, T.A.; Hindia, M.N.; Dimyati, K.; Abdaziz, A. Indoor Millimeter-Wave Propagation Prediction by Measurement and Ray Tracing Simulation at 38 GHz. Symmetry 2018, 10, 464. [Google Scholar] [CrossRef]
- Firdaus, F.; Ahmad, N.A.; Sahibuddin, S. Accurate Indoor-Positioning Model Based on People Effect and Ray-Tracing Propagation. Sensors 2019, 19, 5546. [Google Scholar] [CrossRef]
- Hua, Y. Research on Modeling of Indoor Multipath Channel Fading. Master’s Thesis, Shanghai Normal University, Shanghai, China, 2016. [Google Scholar]
- Zhao, X. Study on Propagation Characteristics of Indoor Millimeter Wave Wireless Channel Based on Ray Tracing Method. Master’s Thesis, Nanjing University of Posts and Telecommunications, Nanjing, China, 2020. [Google Scholar]
- Obeidat, H.; Ullah, A.; AlAbdullah, A.; Manan, W.; Obeidat, O.; Shauieb, W.; Dama, Y.; Kara-Zaïtri, C.; Abd-Alhameed, R. Channel Impulse Response at 60 GHz and Impact of Electrical Parameters Properties on Ray Tracing Validations. Electronics 2021, 10, 393. [Google Scholar] [CrossRef]
- Valle, L.; Pérez, J.R.; Torres, R.P. Characterization of Indoor Massive MIMO Channels Using Ray-Tracing: A Case Study in the 3.2–4.0 GHz 5G Band. Electronics 2020, 9, 1250. [Google Scholar] [CrossRef]
- Saito, K.; Fan, Q.; Keerativoranan, N.; Takada, J. Site-Specific Propagation Loss Prediction in 4.9 GHz Band Outdoor-to-Indoor Scenario. Electronics 2019, 8, 1398. [Google Scholar] [CrossRef]
- Kuno, N.; Takatori, Y. Prediction Method by Deep-Learning for Path Loss Characteristics in an Open-Square Environment. In Proceedings of the International Symposium on Antennas and Propagation (ISAP), Busan, Korea, 23–26 October 2018. [Google Scholar]
- Zineb, A.B.; Ayadi, M. A multi-wall and multi-frequency indoor path loss prediction model using artificial neural networks. Arab. J. Sci. Eng. 2016, 41, 987–996. [Google Scholar] [CrossRef]
- Ayadi, M.; Zineb, A.B. Body Shadowing and Furniture Effects for Accuracy Improvement of Indoor Wave Propagation Models. IEEE Trans. Wirel. Commun. 2014, 13, 5999–6006. [Google Scholar] [CrossRef]
- Milijić, M.; Stanković, Z.; Milovanović, I. Hybrid-empirical neural model for indoor/outdoor path loss calculation. In Proceedings of the 10th International Conference on Telecommunication in Modern Satellite Cable and Broadcasting Services (TELSIKS), Nis, Serbia, 5–8 October 2011. [Google Scholar]
- Zhao, X.; Du, F.; Geng, S.; Fu, Z.; Yang, L. Playback of 5G and Beyond Measured MIMO Channels by an ANN-Based Modeling and Simulation Framework. IEEE J. Sel. Areas Commun. 2020, 38, 1945–1954. [Google Scholar] [CrossRef]


| Parameter | Text Area with Fingerprints Collection | Text Area without Fingerprints Collection |
|---|---|---|
| scene model size | ||
| bearing pillar size | ||
| wall material/permittivity/conductivity | concrete/5/0.0015 | concrete/5/0.0015 |
| floor material/permittivity/conductivity | tile marble/6/10−8 | tile marble/6/10−8 |
| signal frequency | 1561.098 MHz | 1561.098 MHz |
| antenna type | omnidirectional | omnidirectional |
| receiving area size | 5 m × 5 m | 5 m × 5 m |
| receiving point interval | 0.25 m | 0.5 m |
| transmitting power | −70 dBm | −70 dBm |
| number of reflections/transmissions/diffractions | 3/1/1 | 3/1/1 |
| ray interval | 0.25 degree | 0.25 degree |
| x | 1 | 2 | 3 | 4 | 5 | |
|---|---|---|---|---|---|---|
| y | ||||||
| 1 | before | (1.9830, 0.2349) | (2.1571, 1.0887) | (1.8036, 0.2219) | (5.0260, 0.1302) | (4.0807, 0.2075) |
| after | (0.9059, 1.2780) | (1.7449, 1.2948) | (3.2997, 1.1568) | (4.4700, 1.1110) | (4.8133, 1.3478) | |
| 2 | before | (1.6671, 1.8230) | (2.2034, 2.6458) | (3.1488, 1.7992) | (5.0661, 1.8178) | (4.6179, 1.0020) |
| after | (1.1044, 1.9267) | (1.8790, 1.5387) | (2.7085, 1.7319) | (4.0649, 1.8837) | (4.8270, 2.0046) | |
| 3 | before | (1.6171, 2.0356) | (1.6278, 3.3335) | (5.0012, 3.5755) | (4.9678, 3.6350) | (3.8882, 3.2848) |
| after | (0.5948, 2.780) | (1.7703, 4.000) | (3.3963, 3.1220) | (3.7177, 2.5306) | (5.3400, 2.5079) | |
| 4 | before | (0.7725, 3.5277) | (2.4902, 4.9436) | (3.1220, 4.9431) | (4.2499, 4.0586) | (5.0921, 2.8164) |
| after | (0.8360, 3.8335) | (1.7156, 4.3727) | (3.2457, 3.5751) | (5.0010, 4.3576) | (4.9925, 4.4191) | |
| 5 | before | (1.4846, 5.6723) | (1.1861, 3.9457) | (3.4669, 3.8620) | (5.0229, 5.6108) | (5.5693, 5.5765) |
| after | (0.6448, 4.8669) | (2.1337, 4.7858) | (3.0364, 5.4668) | (4.3620, 5.1035) | (4.5519, 4.9107) |
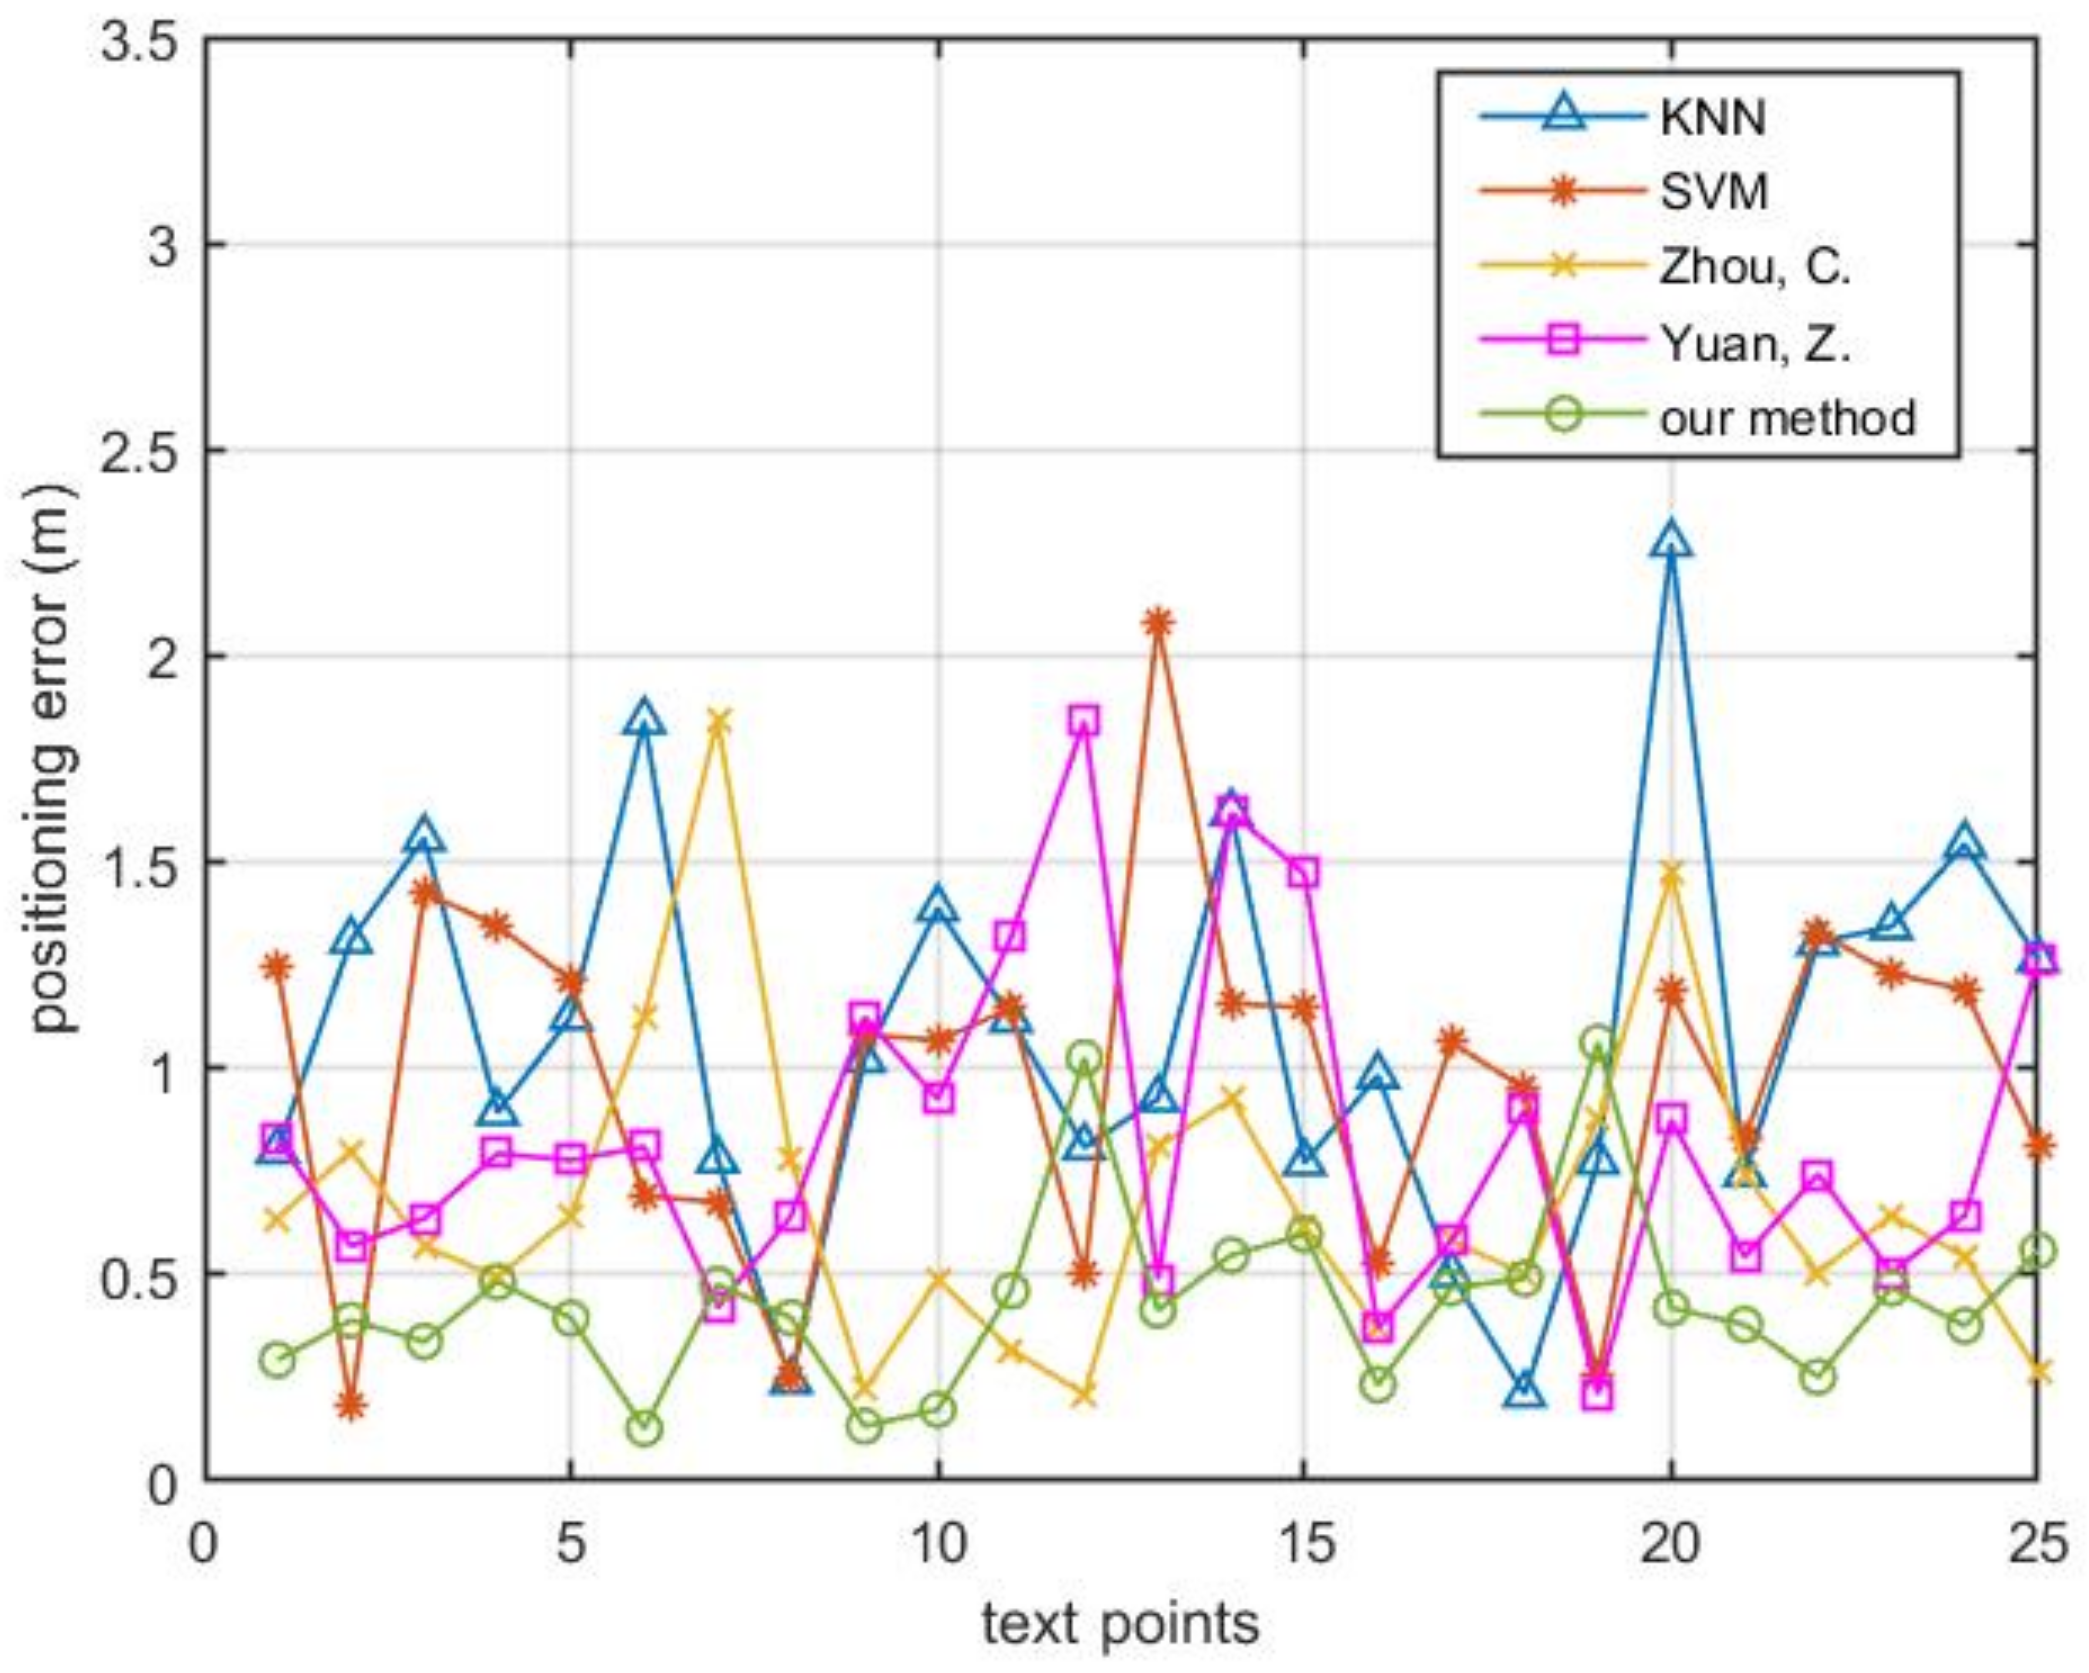
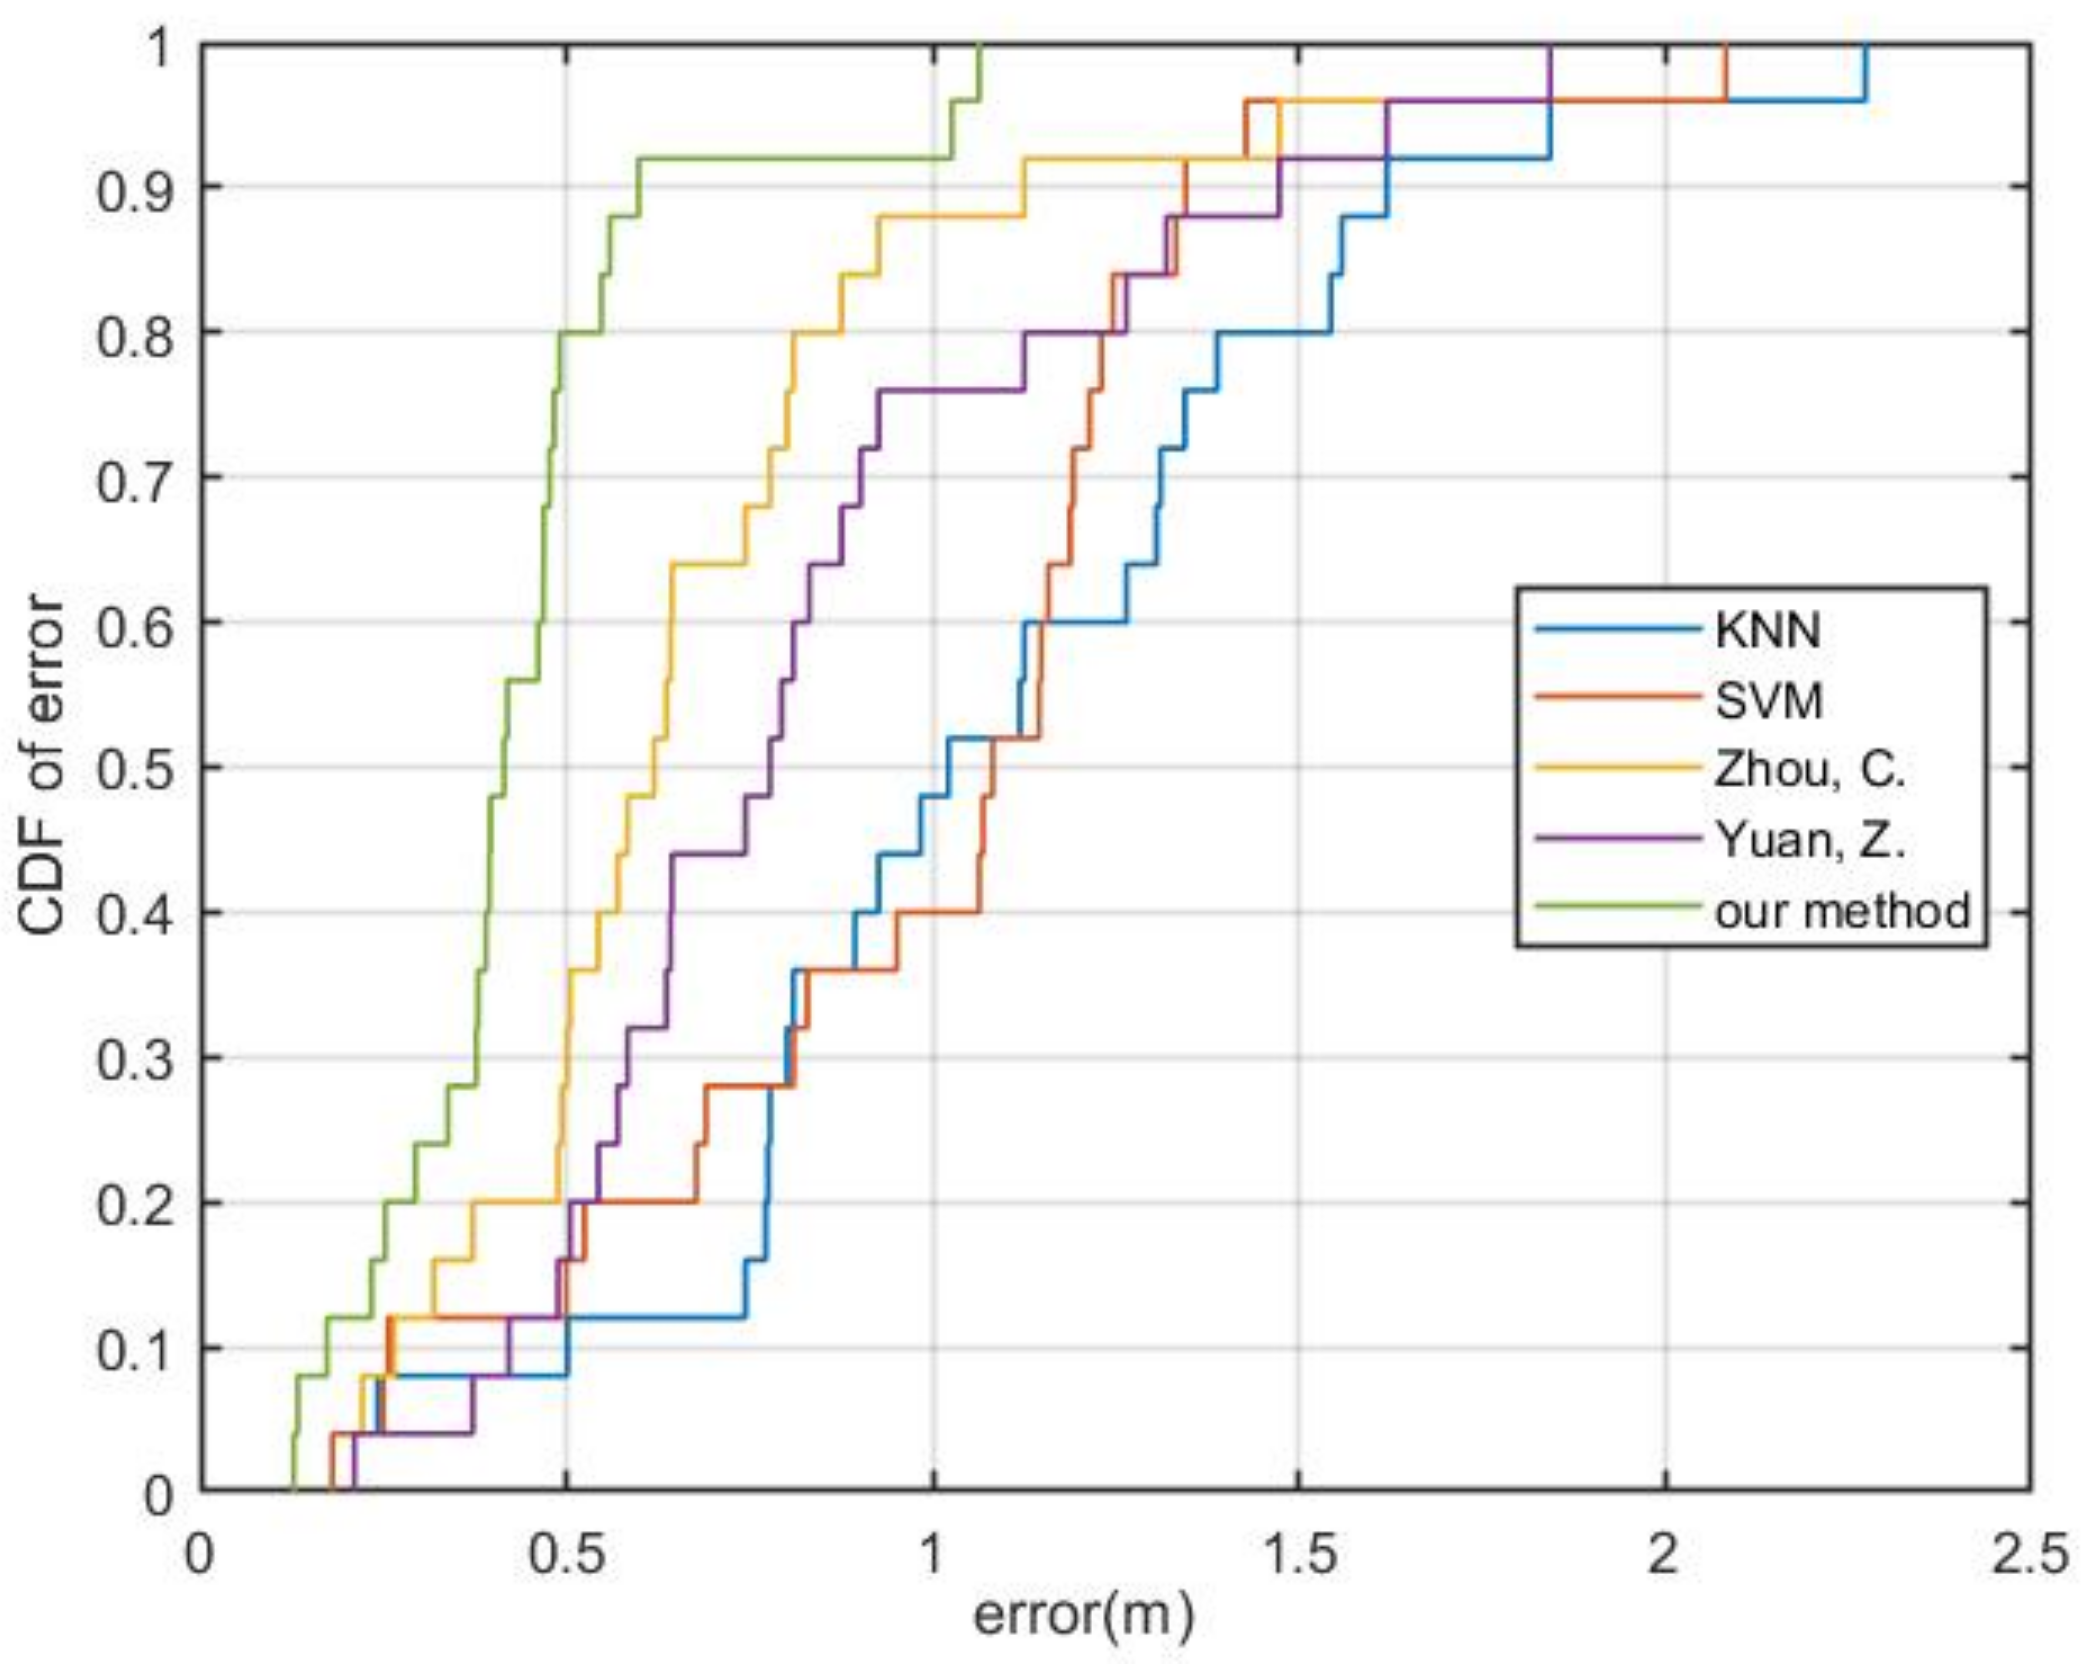
| Algorithm | KNN | SVM | Yuan, Z. [10] | Zhou, C. [13] | Our Method |
|---|---|---|---|---|---|
| RMS error (m) | 1.1821 | 1.0696 | 0.7714 | 0.9253 | 0.4850 |
| 95% error (m) | 2.2727 | 1.8424 | 1.6194 | 1.4727 | 1.026 |
| x | 1 | 2 | 3 | 4 | 5 | |
|---|---|---|---|---|---|---|
| y | ||||||
| 1 | (1.2377, 0.2349) | (0.6923, 1.0887) | (1.6501, 0.2219) | (3.7950, 0.1302) | (5.6715, 1.9023) | |
| 2 | (2.8339, 1.8230) | (1.5664, 2.6458) | (3.0349, 2.2396) | (3.8759, 3.0136) | (3.7925, 1.3151) | |
| 3 | (0.0412, 2.4235) | (2.3426, 3.7335) | (3.7254, 2.4245) | (5.4897, 2.365) | (5.7172, 3.2848) | |
| 4 | (1.8622, 3.5277) | (2.1784, 3.5315) | (2.9369, 3.7992) | (4.4090, 4.6586) | (5.6302, 6.1836) | |
| 5 | (1.3188, 4.3277) | (2.7694, 6.0543) | (3.7147, 3.8620) | (5.4172, 5.6108) | (5.4889, 6.1659) | |
Publisher’s Note: MDPI stays neutral with regard to jurisdictional claims in published maps and institutional affiliations. |
© 2022 by the authors. Licensee MDPI, Basel, Switzerland. This article is an open access article distributed under the terms and conditions of the Creative Commons Attribution (CC BY) license (https://creativecommons.org/licenses/by/4.0/).
Share and Cite
Li, Y.; Li, H.; Yu, B.; Li, J. A CSI Fingerprint Method for Indoor Pseudolite Positioning Based on RT-ANN. Future Internet 2022, 14, 235. https://doi.org/10.3390/fi14080235
Li Y, Li H, Yu B, Li J. A CSI Fingerprint Method for Indoor Pseudolite Positioning Based on RT-ANN. Future Internet. 2022; 14(8):235. https://doi.org/10.3390/fi14080235
Chicago/Turabian StyleLi, Yaning, Hongsheng Li, Baoguo Yu, and Jun Li. 2022. "A CSI Fingerprint Method for Indoor Pseudolite Positioning Based on RT-ANN" Future Internet 14, no. 8: 235. https://doi.org/10.3390/fi14080235
APA StyleLi, Y., Li, H., Yu, B., & Li, J. (2022). A CSI Fingerprint Method for Indoor Pseudolite Positioning Based on RT-ANN. Future Internet, 14(8), 235. https://doi.org/10.3390/fi14080235