1. Introduction
In recent years, Personalised Healthcare (PH) has gone through promising advances with the potential to provide patient-tailored care by applying predictive analytics [
1]. PH relies on data from patients’ health records and measurements to predict unknown health issues that might arise in the near future. For example, PH could help patients forecast their weight gain in the coming two months, considering their daily diet and other lifestyle habits. Daily habits, diets and other lifestyle-related factors can cause someone to get diabetes or dementia earlier than expected. Early prediction of potential health issues can help proactively address them and provide adequate therapy before it worsens. Consequently, PH can help improve the quality of care and decrease related costs.
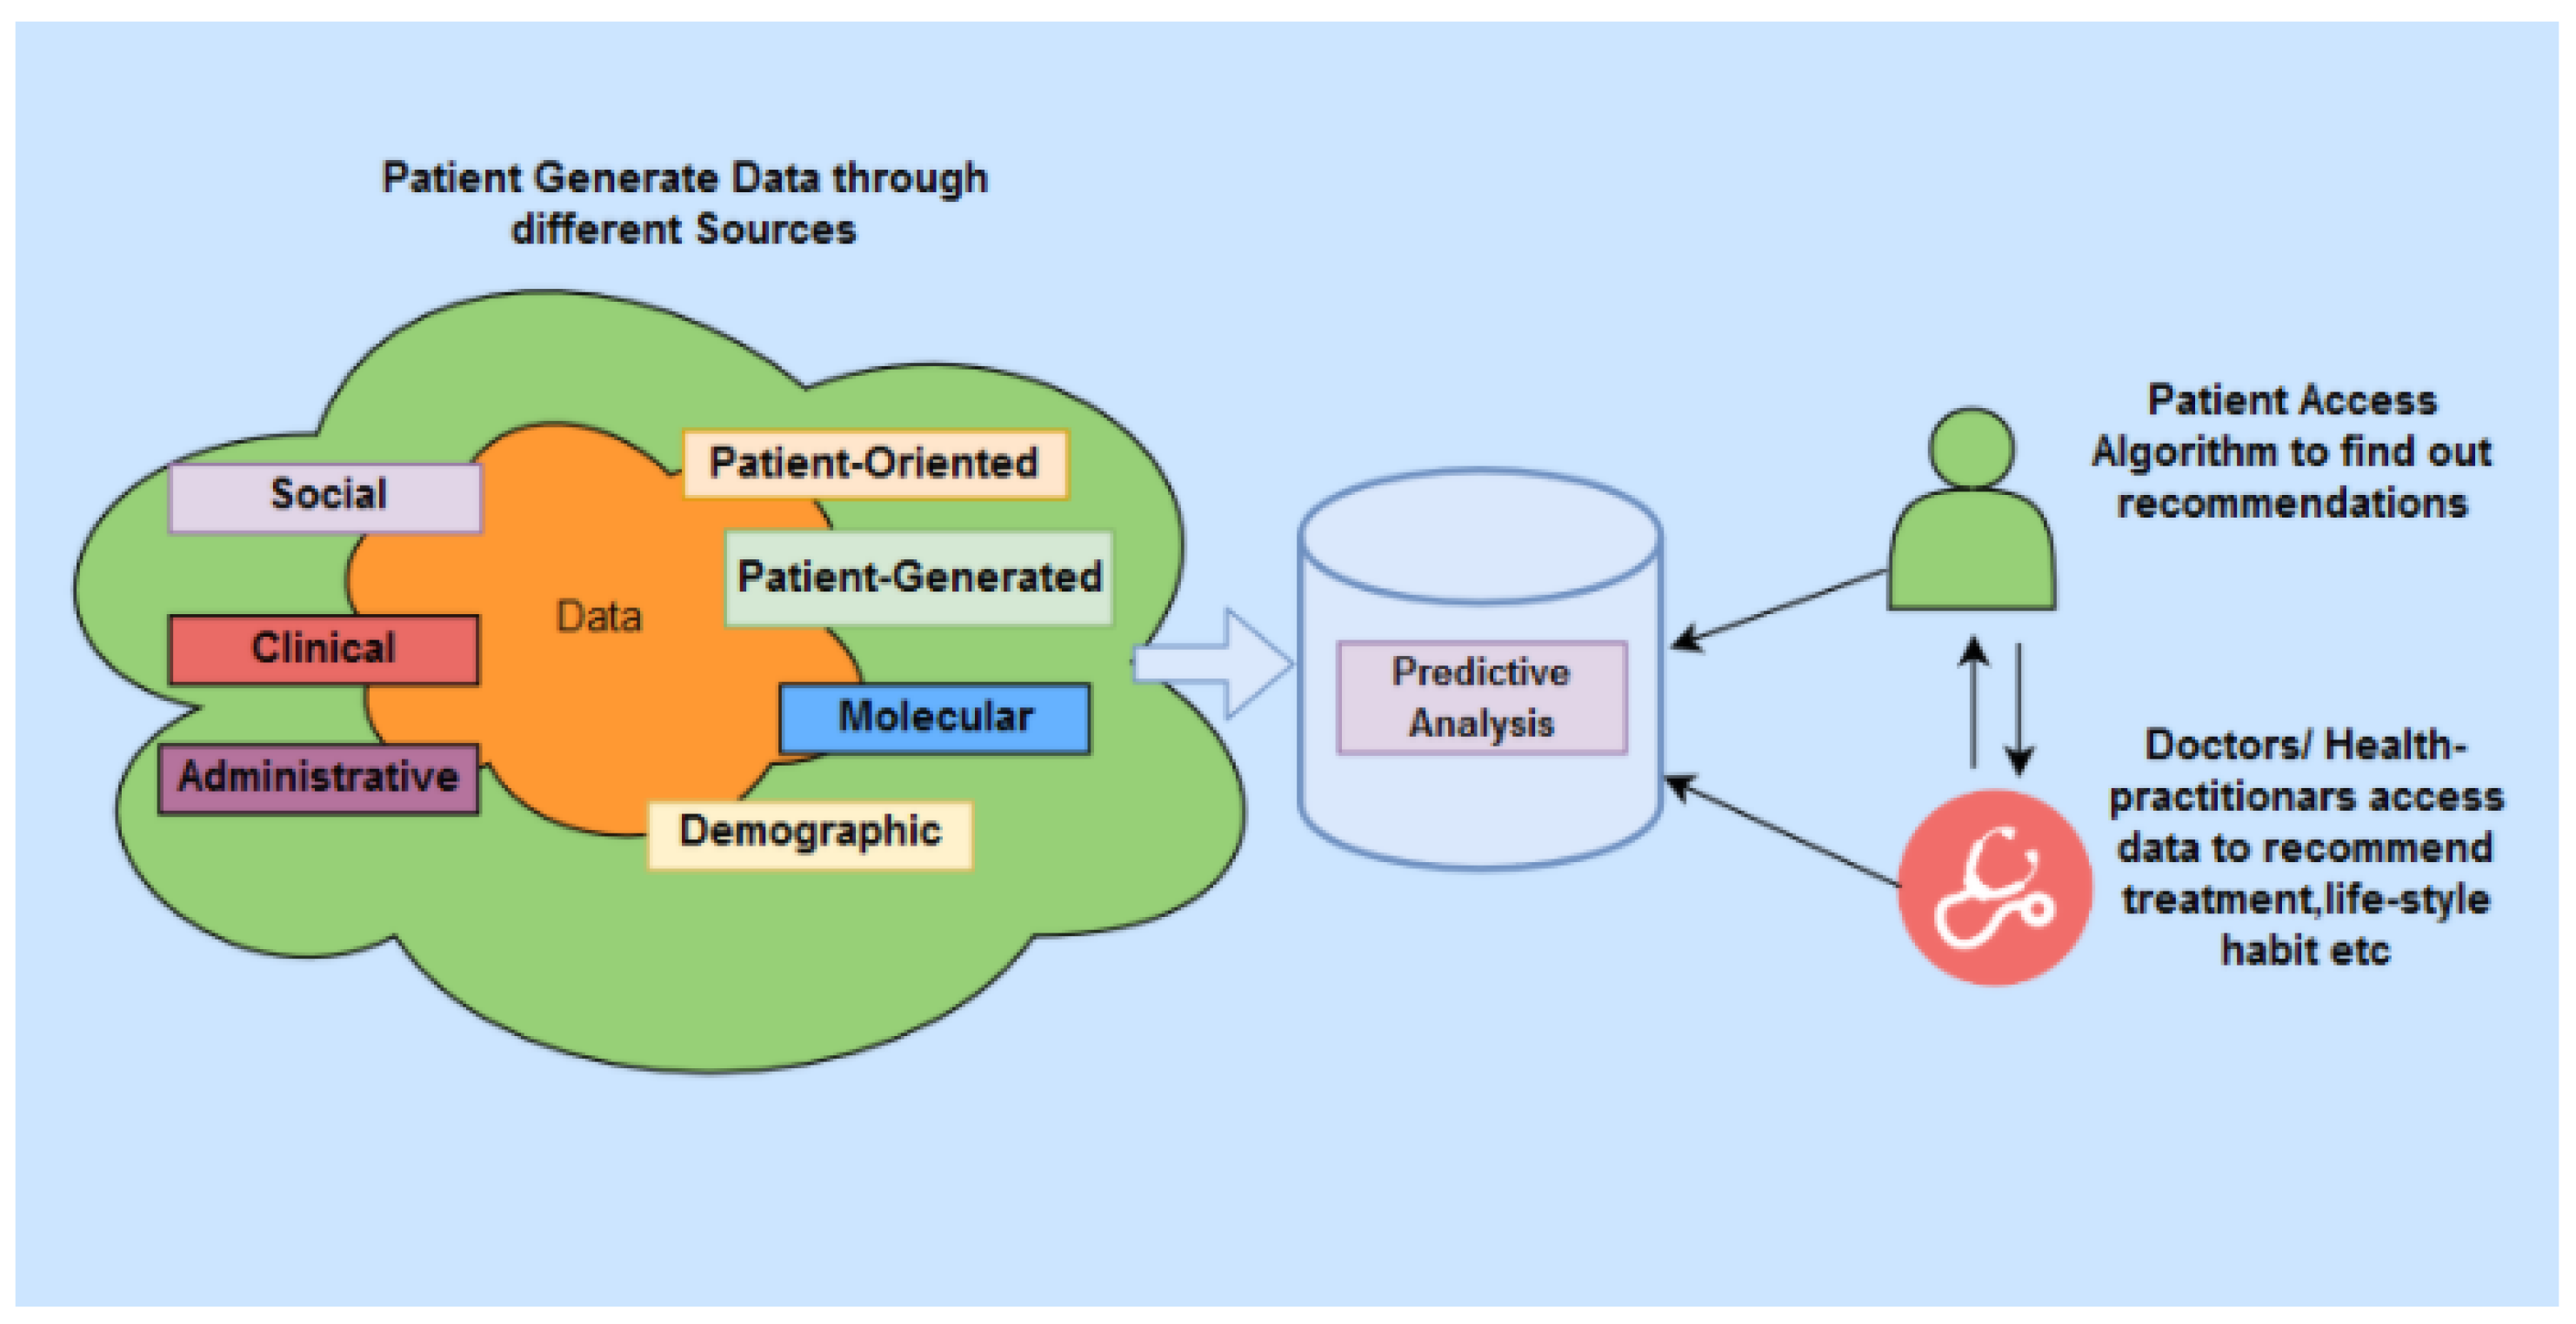
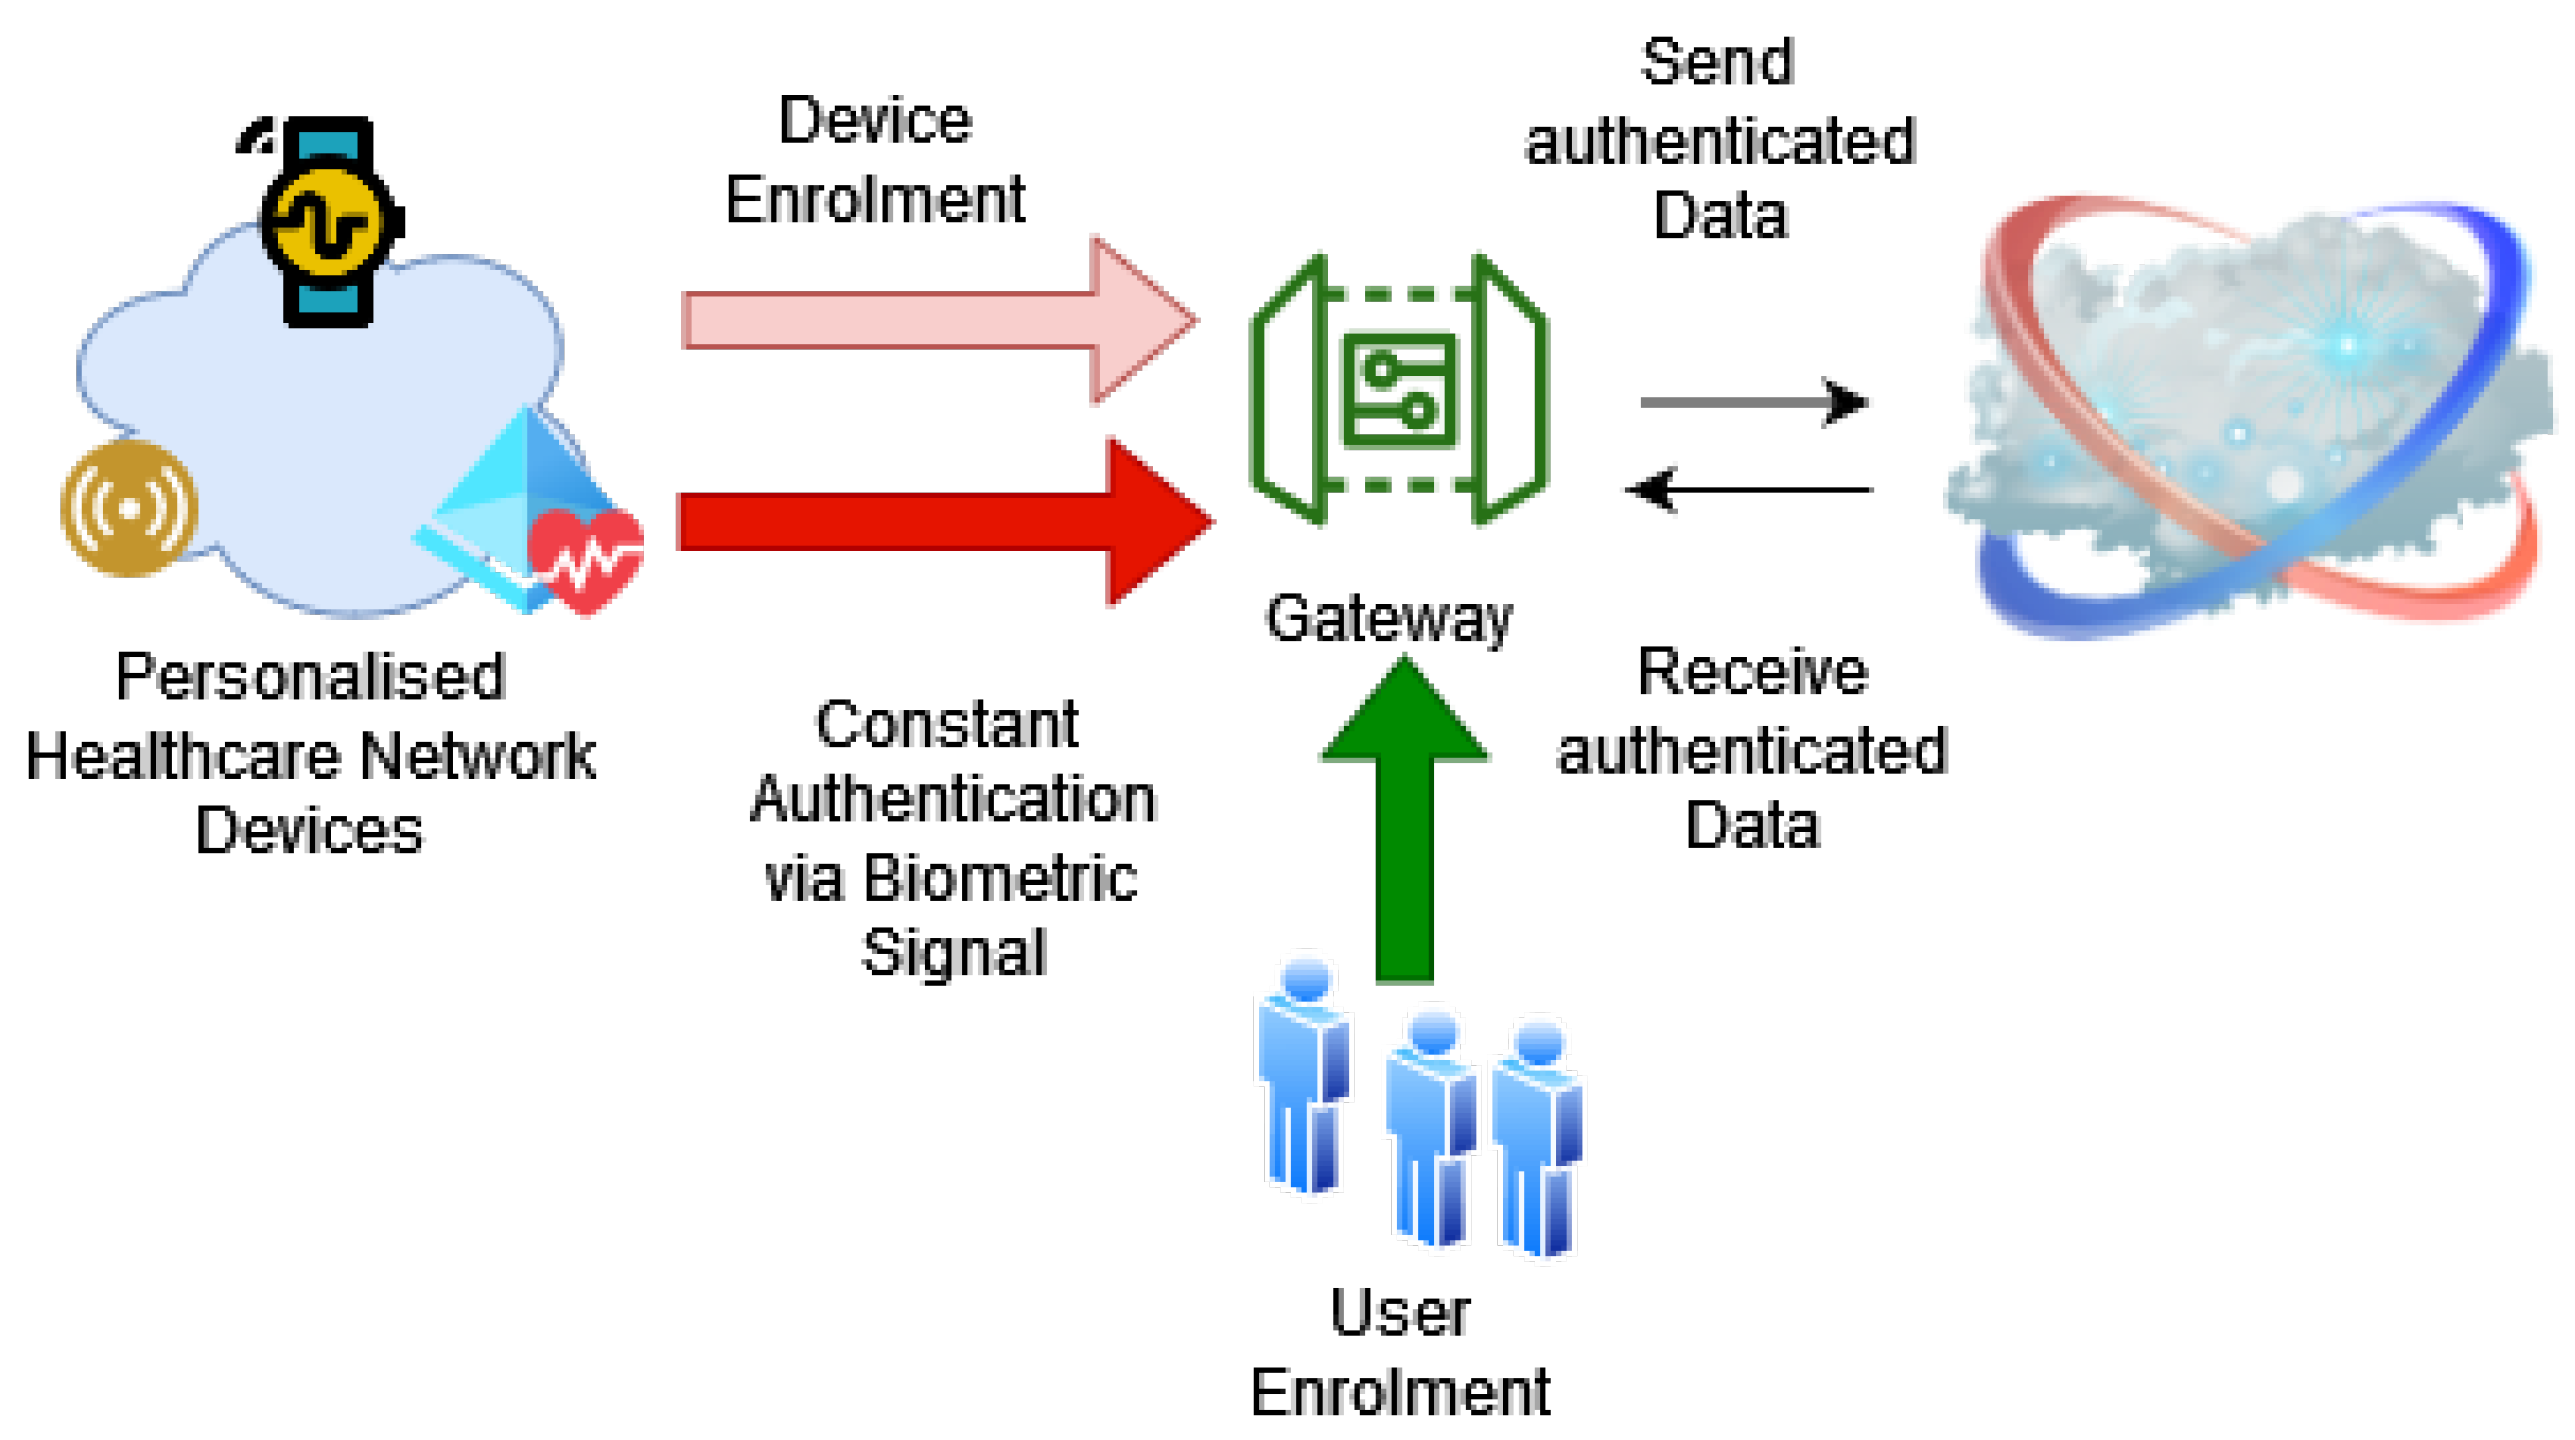
A reliable PH system is comprised of several key components, as shown in
Figure 1. In a PH system, various types of data about a patient are gathered through continuous monitoring of their health. The procedure includes utilising multiple devices, including the Internet of Things (IoT) sensors and smart devices. Patients discharged from hospitals, patients living remotely and the elderly living in residential care can take advantage of such remote health monitoring. By remote monitoring of health status through IoT devices, the patients’ personal health data can be stored in a highly-secured cloud-based data source. The monitoring data can then be used to perform intelligent analysis, often using cloud-based services, to predict potential health issues. In this model, the communication channel needs to be actively and continuously passing the data of the monitored patient to re-enforce the learning by the predictive analysis model. However, security and privacy concerns remain among the significant challenges in PH systems due to the reliance on IoT and cloud-based technologies [
2]. In particular, the authentication challenges of these systems are unique because the IoT-based sensors and smart devices frequently produce a continuous stream of data and, thus, require continuous authentication to ensure that the data belongs to a particular patient. Specifically, the device’s legitimacy needs to be continuously verified in a sensor-based PH network (a network of connected devices and IoT sensors that monitor a patient’s health).
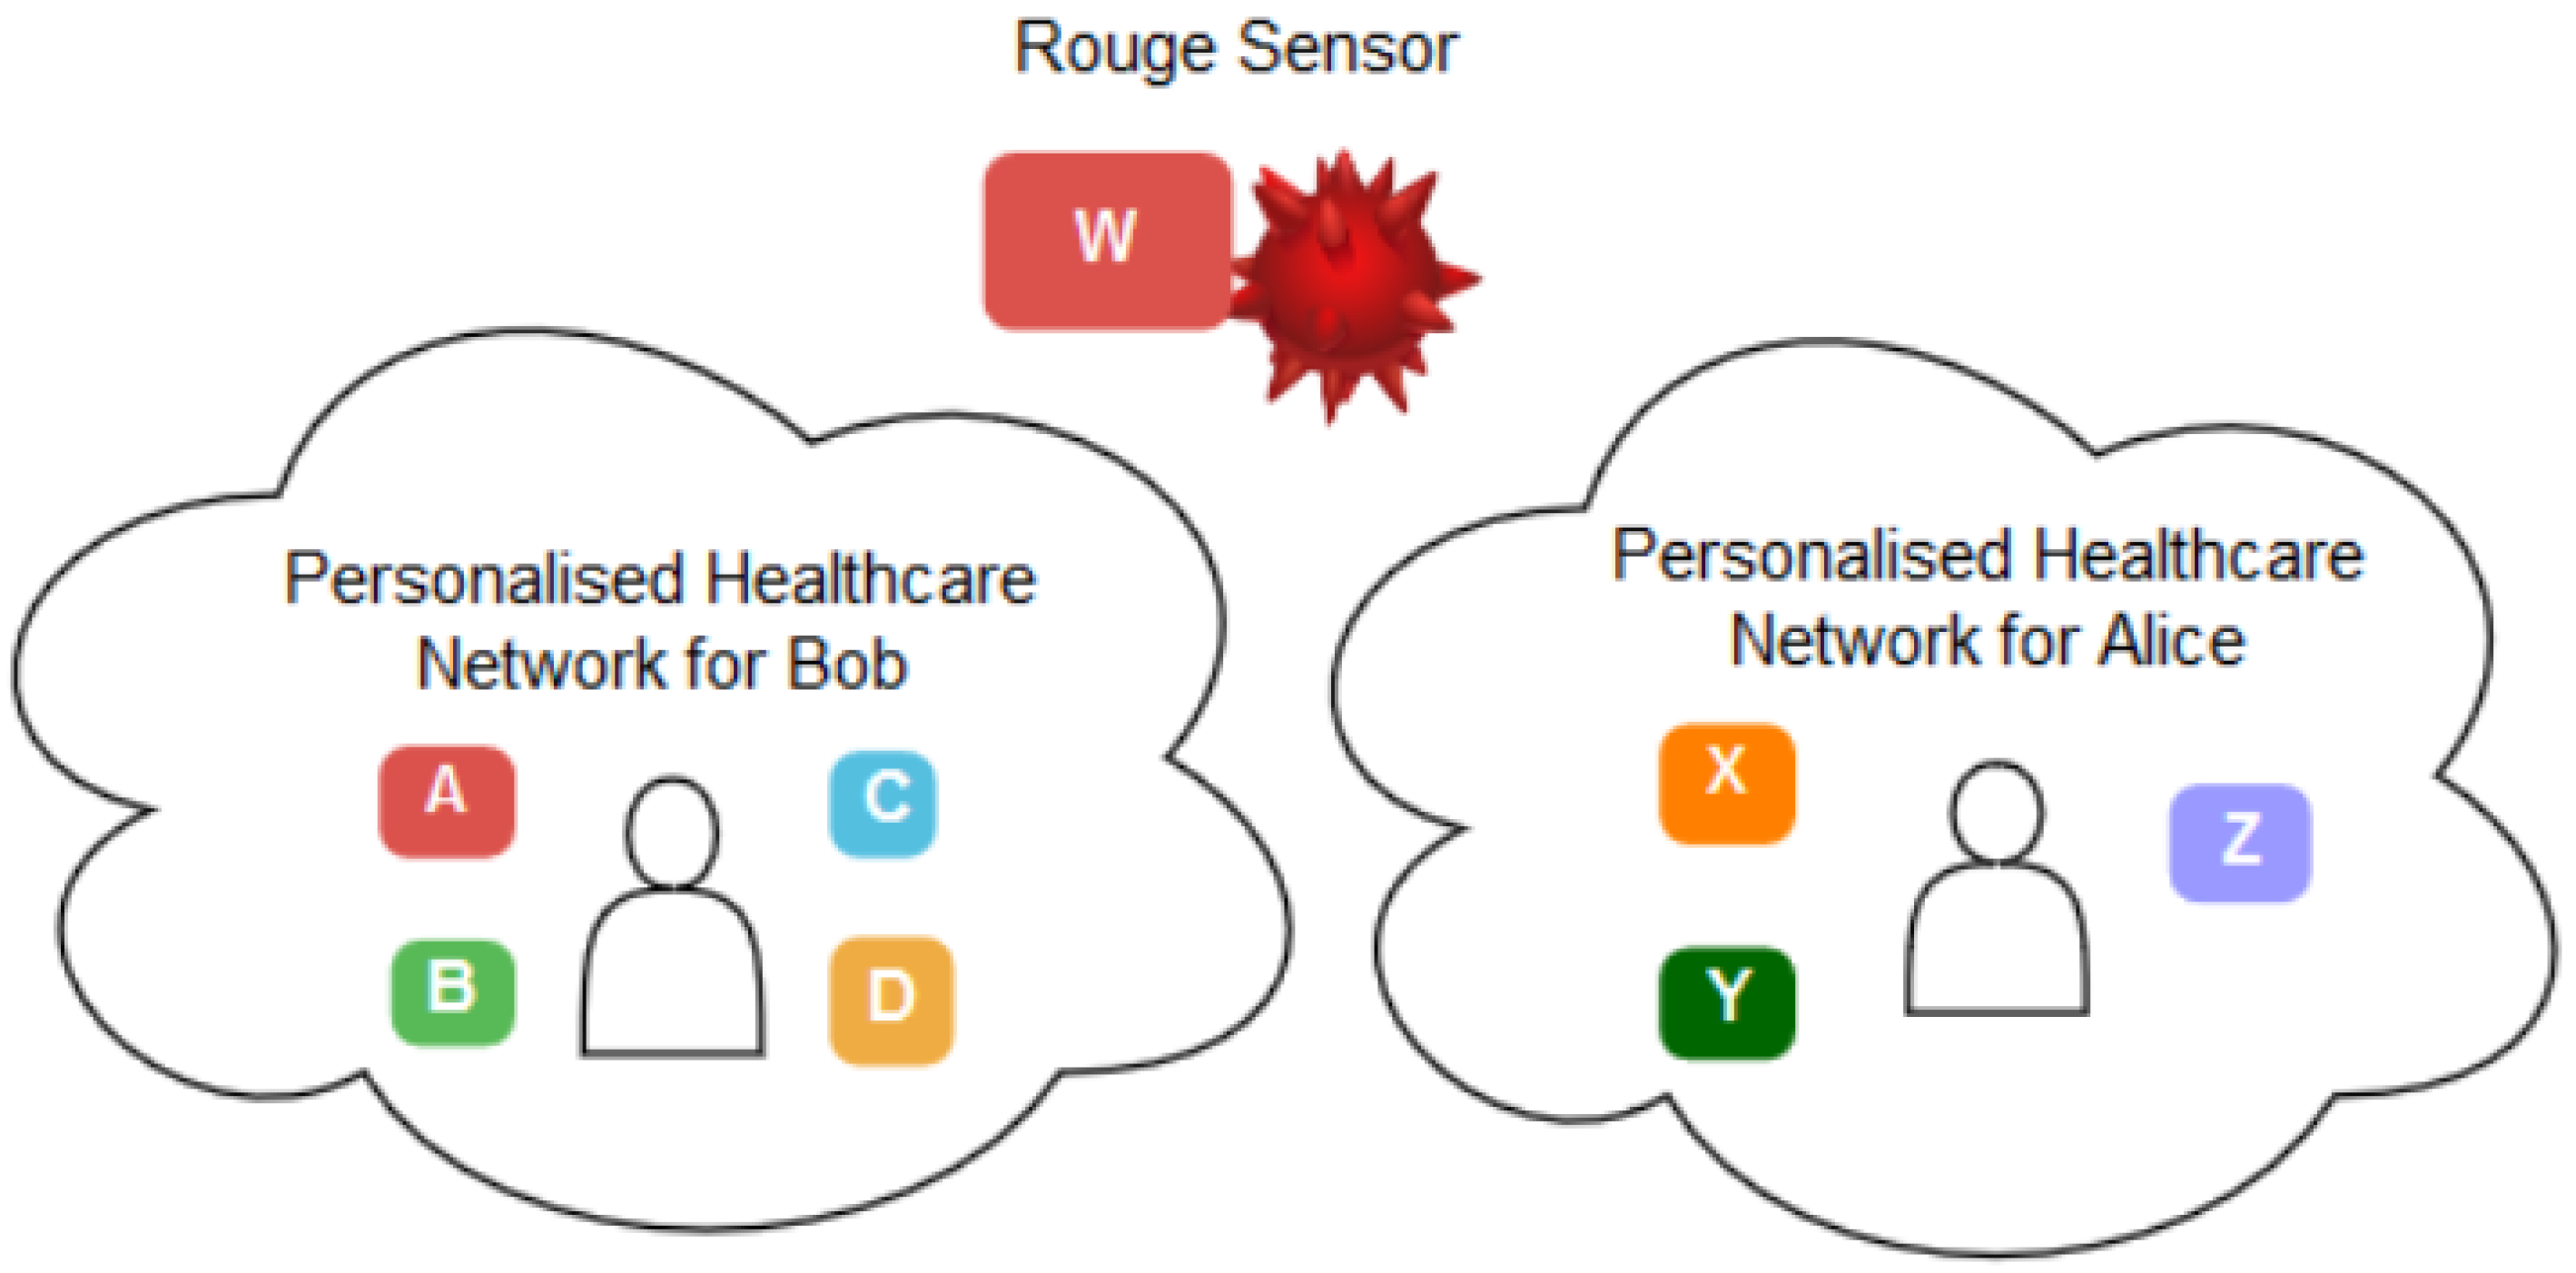
Therefore, in such a context, it becomes challenging to verify that a set of sensors belong to the same PH network and they trust each other in providing and sharing patient data. Let us assume a PH network that belongs to a patient, Bob, and has sensors
A, B, C and
D. Alice, on the other hand, has a PH network with three different sensors,
X, Y and
Z. Assume there is a rogue sensor
W which tries to impersonate Bob or Alice’s network. In this case, the challenge is to employ a reliable method to verify that Bob’s sensors should trust each other in sharing and communicating Bob’s data, not Alice’s and the rogue sensors. Such settings stimulate the need for a
continuous authentication method to verify that a set of sensors belongs to the same patient. Thus, it can trust that the data belongs to the same patient.
Figure 2 depicts this scenario.
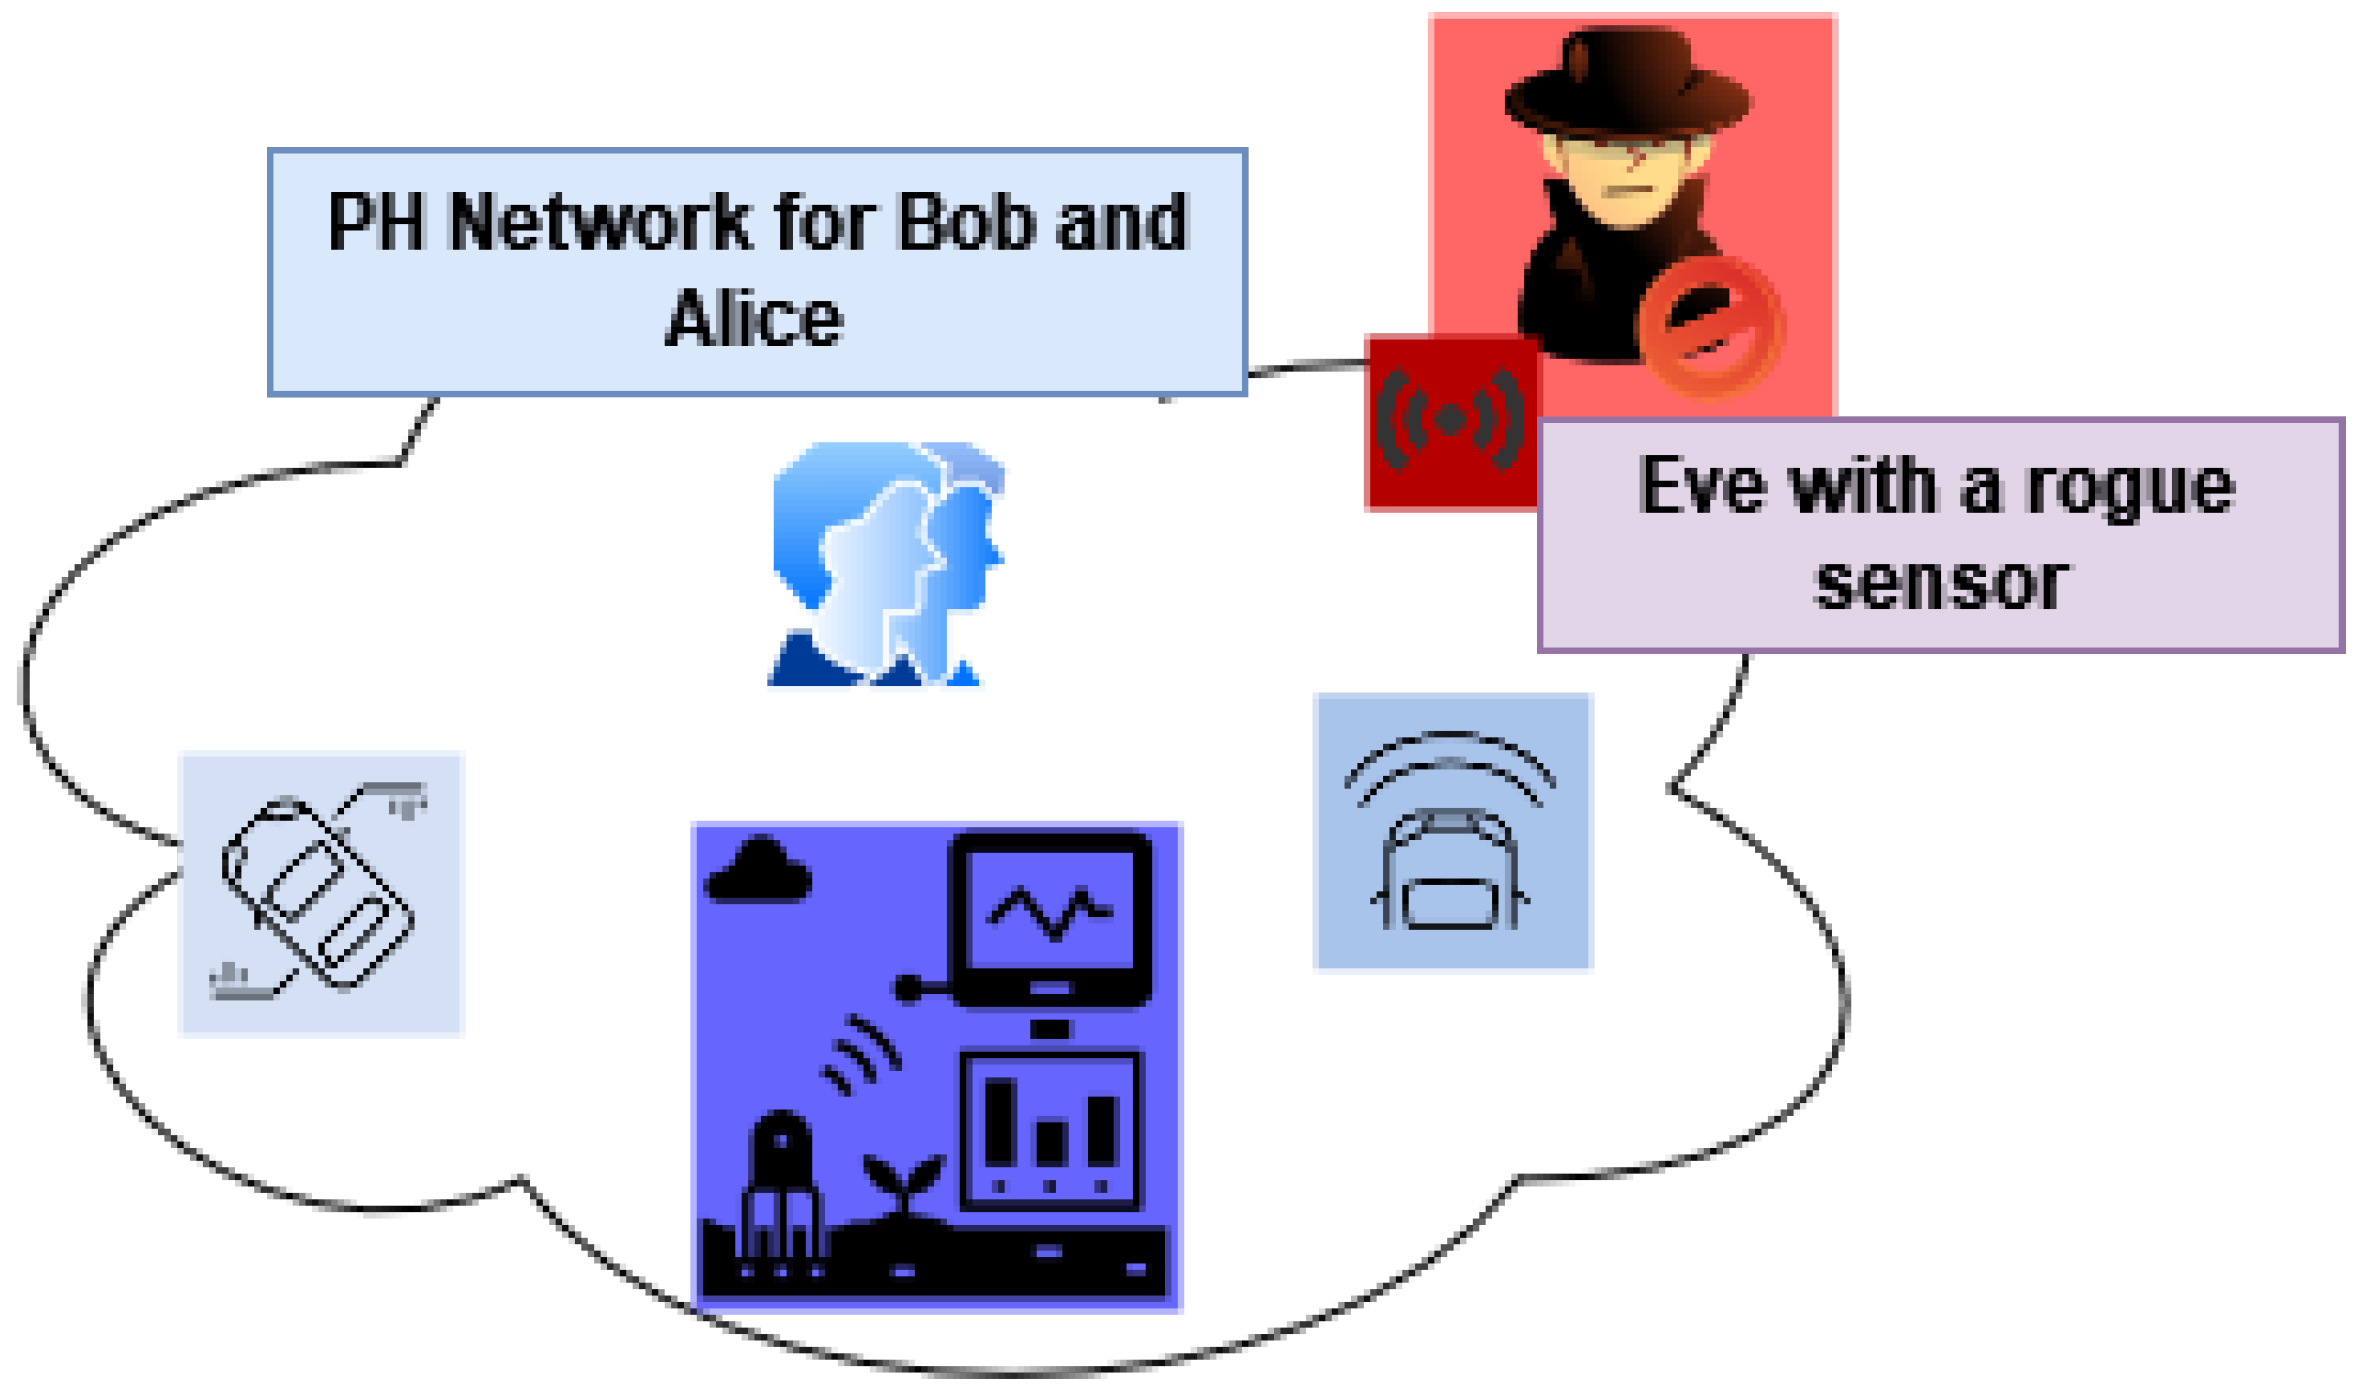
The second type of scenario that instigates such an authentication method involves a PH network that belongs to a group of users instead of a single user. They might be from the same household sharing the same network and sometimes the same devices.
Figure 3 illustrates this scenario. Let us assume that Bob and Alice share the same PH network in this context. The sensors
A, B, C, D adjunct to Bob and Alice. The intruder, Eve, tries to intrude on the network using a rogue sensor
W. In this case, the network should employ a reliable method to continuously authenticate and verify Bob and Alice’s devices and reject Eve’s rogue sensor. Such contexts also advocate for a robust
continuous authentication method to scrutinise a group of persons and their sensors belonging to a specific network.
In this paper, to address the abovementioned challenges, we propose a multimodal biometric-based authentication model that comprises continuous single and group user and device authentication in PH network environments. We utilise a person’s unique physiological characteristics that are continuously monitored using various IoT sensors to classify real users and intruders. Our method aims to overcome the potential security flaws in such sensors by employing a person’s biological features that can be very difficult to borrow, buy or forge. To achieve this, the performance of the multimodal authentication method over a single modal is empirically investigated and analysed. Single modal authentication utilises and considers a user’s single biometric trait (e.g., ECG), which is still feasible to be compromised given the advancement in computation [
3]. Unlike single signal modal, multimodal authentication considers more than one characteristic of the human body while processing a verification process. Such approaches can result in higher accuracy and a higher security level, making spoofing, device impersonation and replay attacks harder to occur [
4]. Therefore, we devise a multimodal individual and group-based biometric authentication, combining features among a few common biometric traits such as ECG and PPG. The systematic approach investigates both user and device authenticity. Furthermore, we employ various machine learning algorithms and empirically evaluate the performance of our proposed method. The objectives and novel contributions of our work are:
We propose the first comprehensive deep learning-based multimodal authentication model applying ECG and PPG signals fusion. Our objective is to prevent user impersonation and device spoofing in the personalised healthcare network, heavily dependent on IoT-based sensors;
Our model incorporates a two-level authentication to detect intruding users and devices. The developed approach first enrols the authorised users using their multiple biometric traits. It then attaches IoT sensors using those traits to an individual. Such methods prevent the impersonation of both users and devices. It can easily detect the presence of an intruder in IoT-based healthcare services;
We have conducted extensive experiments over multiple public datasets, demonstrating the model’s efficiency for biometric authentication purposes, compared to the previous research works that have used most of these datasets for clinical research perspectives;
To the best of the authors’ knowledge, very few works have addressed the device-level authentication and audit mechanisms of IoT-based personal healthcare services.
The rest of this paper is organised as follows. In
Section 2, we present background and motivation for multimodal continuous authentication method. The related works are also described with a concise view. In
Section 3, the overall system architecture and relevant algorithms and models are narrated. In
Section 4, multiple types of attack scenarios are discussed concerning biometric-based authentication. In
Section 5, details of the dataset, experiments and the results are presented, followed by a discussion of the findings in
Section 6. Finally,
Section 7 illustrates the limitation of our work and
Section 8 summarises the objective, outcome, and future direction of this work.
2. Background and Related Works
Biometric authentication has grown in popularity with the effective use and adoption of IoT networks, especially in PH [
2]. Many continuous authentication techniques have recently emerged to offer more reliable solutions to the growing challenges. In continuous authentication, users are monitored frequently to validate their authority for a particular session [
5]. Compared with the traditional authentication process, continuous authentication mechanisms are equipped with a higher level of security and are well-known for enhanced Quality of Experience (QoE) [
6]. Continuous authentication incorporates behavioural and physiological signal-based biometric authentication, which can make the IoT networks more secure, which are prone to impersonation and injection attacks [
7].
The use of IoT sensors in any system poses serious security challenges [
2]. The PH systems which are heavily dependent on such sensors are not exceptional.
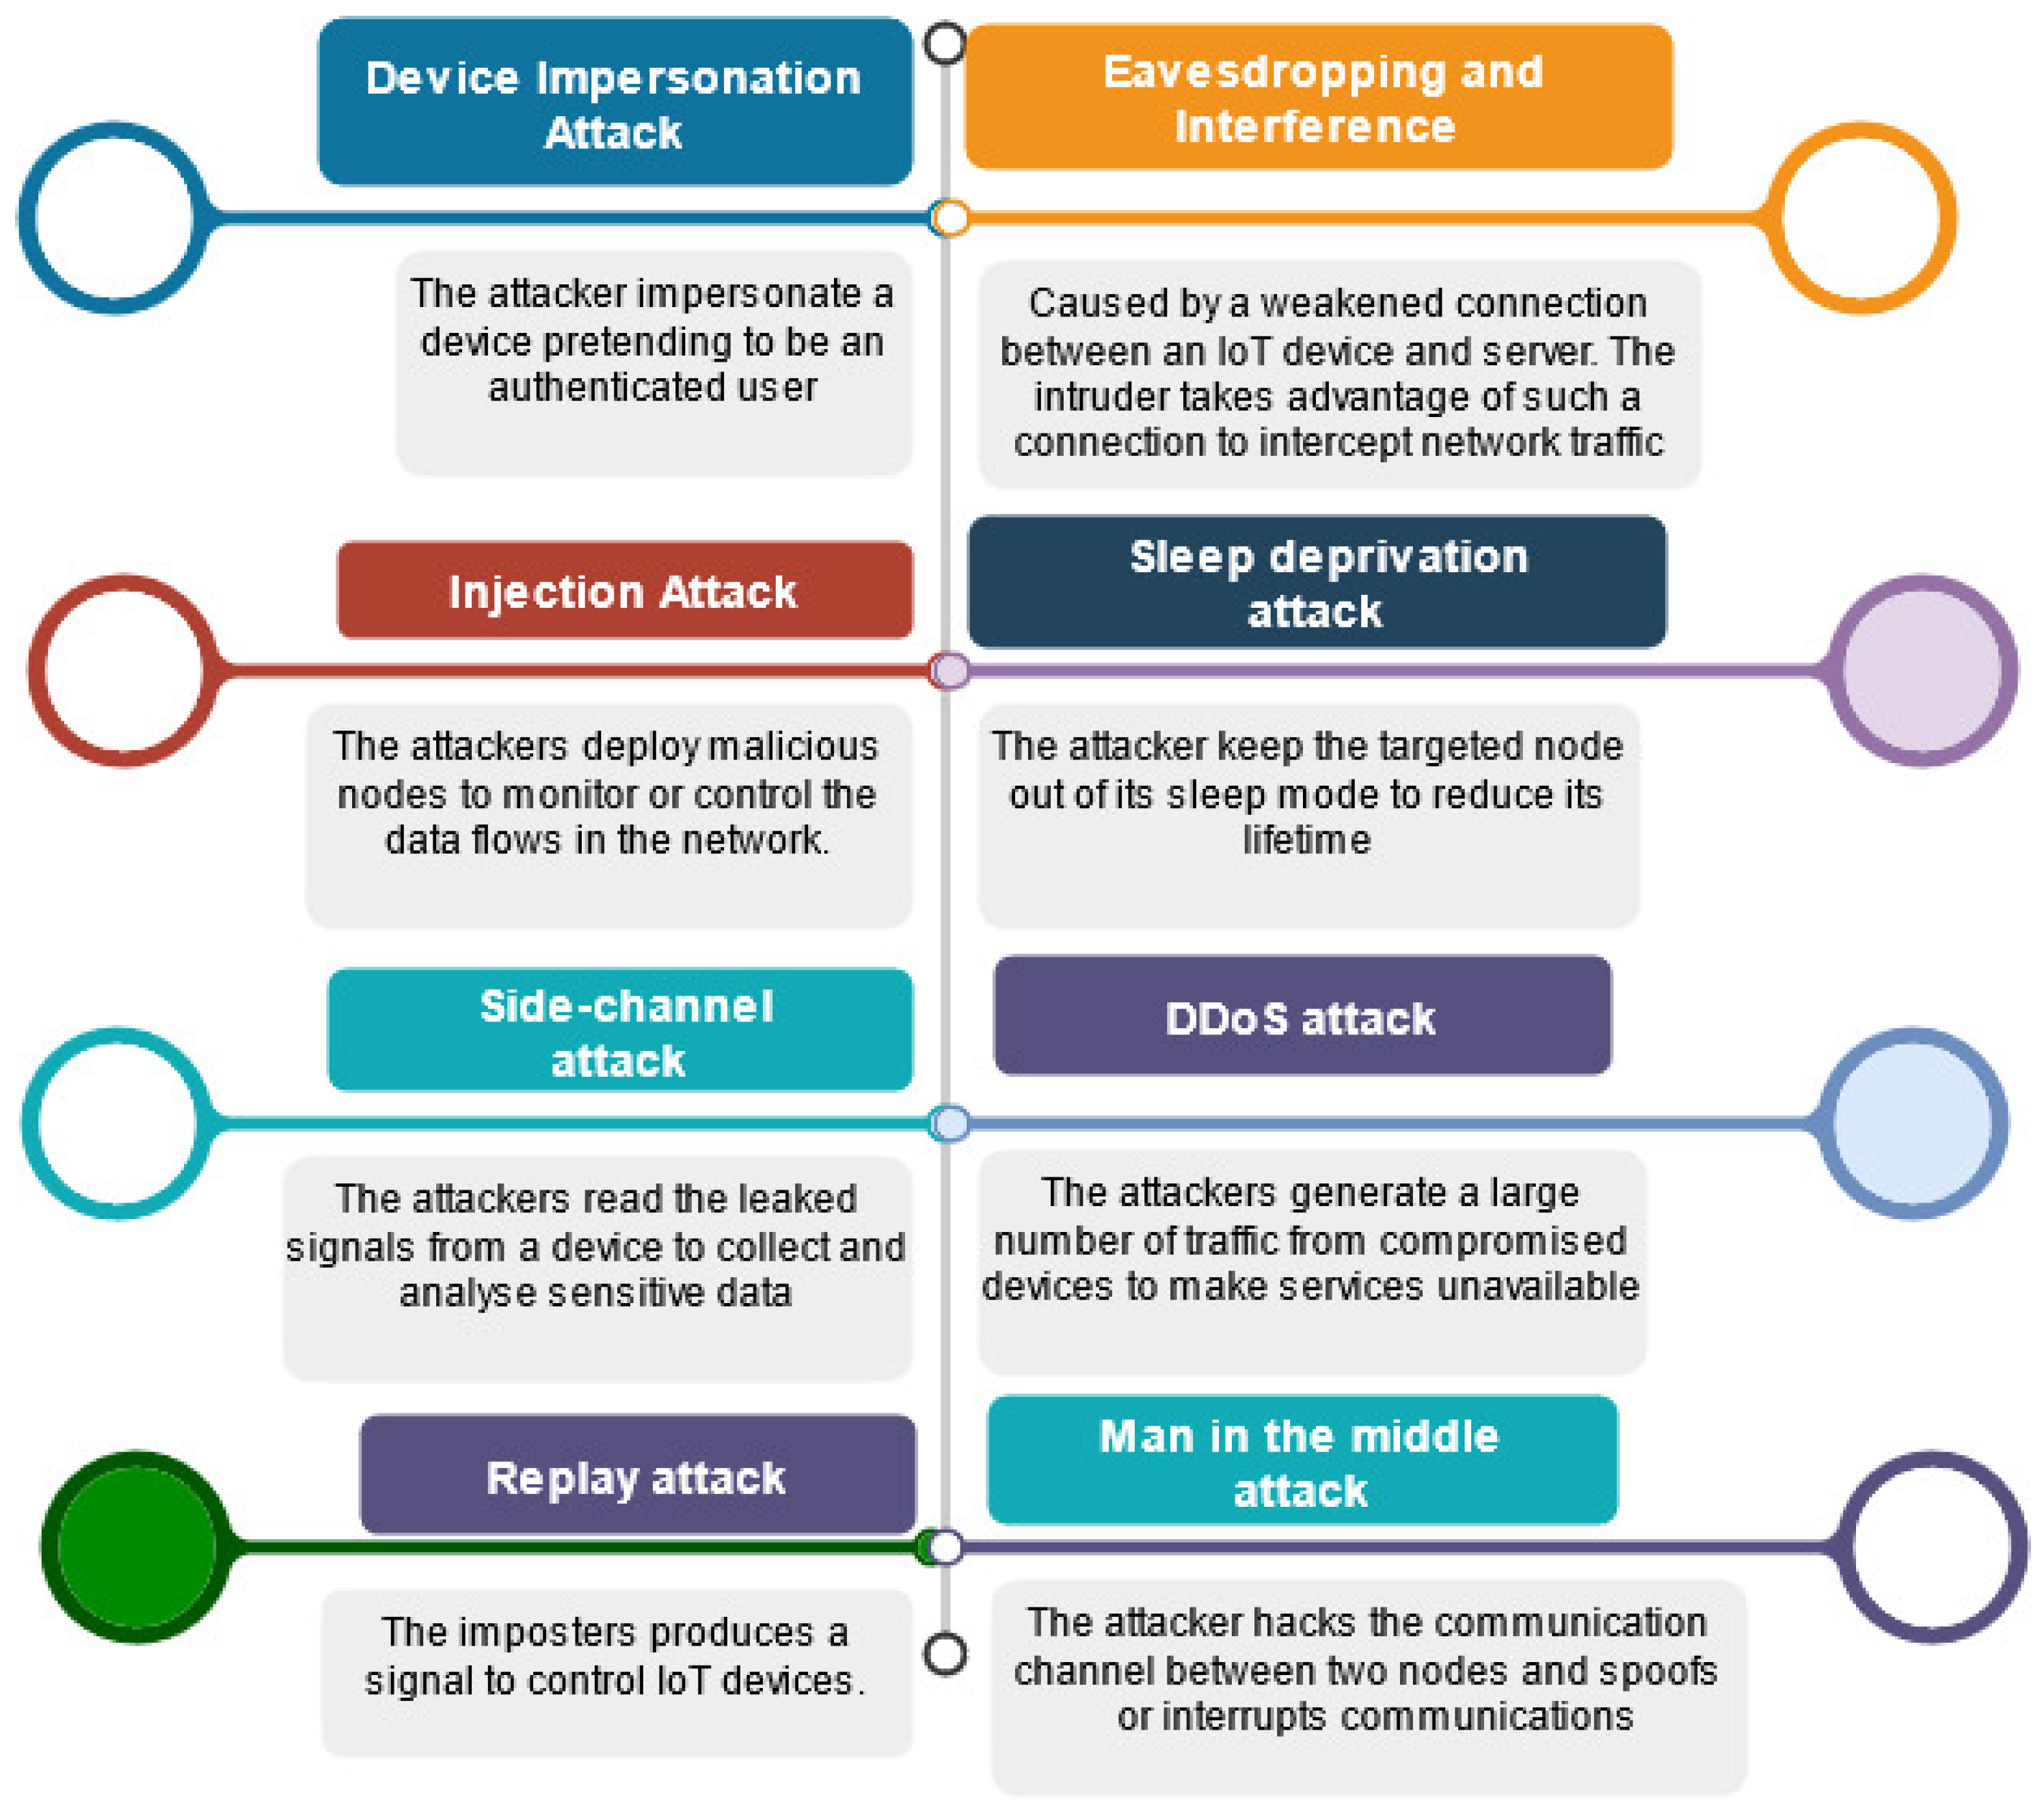
Figure 4 summarises the main security threats that IoT device layer authentication techniques can face in such contexts.
Device impersonation attack: The attacker impersonates a device pretending to be an authenticated user [
8];
Injection attack: The attacker deploys malicious nodes to monitor or control the data flows in the network [
9];
Side-channel attack: The attacker reads the leaked signals from a device to collect and analyse sensitive data [
10];
Eavesdropping and interference: This type of attack is caused by a weakened connection between an IoT device and the server. The intruder takes advantage of such a vulnerable connection to intercept network traffic [
11];
Sleep deprivation attack: The attacker keeps the targeted node out of its sleep mode to reduce its lifetime [
12];
DDoS attack: The attackers generate a large amount of traffic from compromised devices to make services unavailable [
2];
Replay attack: The imposter produces a signal to control IoT devices [
2];
Man in the middle attack: The attacker hacks the communication channel between two nodes and spoofs or interrupts communications [
2].
Many studies have focused on biometric behavioural and physiological authentication in IoT healthcare networks since wearable and inertial sensors are gaining popularity. One of the critical advantages of physiological signals over physiological features is their sense of life [
13]. ECG-based authentication has also gained growing interest, particularly for continuous authentication scenarios [
14]. For instance, the work in [
15] proposed an ECG-based cancelable biometric scheme that mitigates replay attacks. In [
16], the authors proposed a continuous authentication mechanism that incorporates sequential sampling and One-Dimensional Multi-Resolution Local Binary Patterns extraction to identify users over using ECG signals. The work in [
17] defined a unified sparse representation framework that uses joint and specific ECG signal patterns.
ECG-based authentication mechanisms can be further classified based on feature extraction techniques. For instance, studies such as [
1,
18] have applied fiducial feature extraction in their identification algorithms. Many other studies [
19,
20], on the other hand, have used non-fiducial feature extraction techniques. Other studies, such as [
21,
22], have combined the benefits of fiducial and non-fiducial extraction to form a hybrid approach for ECG-based authentication.
Some work, such as [
23] focused on investigating various classification algorithms to identify the best performing one for ECG-based authentication. Out of eight algorithms, the study concluded that linear discriminant analysis (LDA), k-nearest neighbours, and neural networks are best for ECG-based identification. Furthermore, it also concluded that principal components analysis (PCA) has no noticeable impact on the classification process performance but can lead to accuracy reduction.
A few studies have proposed PPG-based authentication methods. For example, In [
13], the authors studied the feasibility of using PPG data for authentication. They concluded that the results heavily depend on the quality of data.
In [
24], the authors combined both behavioural and physiological biometric features for user identification. Specifically, they employed Gait and PPG as the biometric trait. Their experimental results showed that Support Vector Machine (SVM) has a superior performance to KNN and Autoencoder Neural Network, although KNN achieved the fastest performance. Furthermore, they noticed that with sample size increment, the gap between KNN and Linear SVM accuracy becomes smaller.
Besides the above studies, some research work considered multimodal authentication approaches. In [
25], the authors implemented a multimodal biometric authentication method integrating face and iris based on score level fusion. The performance excels the performance of the unimodal biometric identification method and the previous fused face–iris methods.
In [
26], the authors adopted an SVM-based multimodal approach for identification. They applied a score level fusion approach, and k means clustering to classify a multi-SVM machine. A nonlinear classifier allows the SVM to perform a ’two-dimensional’ classification of a set of originally one-dimensional data.
In [
27], a multimodal authentication model is proposed. The work applies a combination of ECG and fingerprint to authenticate the users and reports an EER of 0.1%. However, the ECG-only authentication method denotes a 90% accuracy.
The authors in [
28] designed a PPG-based nonfiducial biometric authentication method. They apply Continuous Wavelet Transform (CWT) and Direct Linear Discriminant Analysis (DLDA) and attained an EER of 0.5–6%.
The study in [
29] uses ECG and finger vein for multimodal authentication. The researchers report an EER of 0.12% and 1.40% with feature and score fusion. They apply Multi-Canonical Correlation Analysis (MCCA) with a range of classifiers, namely: Support Vector Machine (SVM), K-Nearest Neighbours (KNNs), Random Forest (RF), Naive Bayes (NB), and Artificial Neural Network (ANN).
The authors of [
30] propose two multimodal authentication systems, which are sequential and parallel, and use a combination of ECG and Fingerprint. They apply Convolution Neural Network (CNN) and Q-Gaussian multi-support vector machine (QG-MSVM). Using two datasets, they attained an EER of 0.14% and 0.10% for the sequential systems. The parallel system achieves an EER of 0.40% and 0.32% for respective datasets. The heuristics strategies to improve the resiliency of personalised healthcare services are studied in [
31].
Table 1 presents the overview of similar works to our study. Many studies have focused on multimodal biometric authentication. However, only a few studies have comprehensively experimented with ECG and PPG signals. For example, the study [
32] was one of the few to use both ECG and PPG signals to detect spoof detection and authentication. However, the method uses ECG and PPG signals separately. As a result, the processing time for this model is 85.31 ms with an accuracy of 98.9%. The other prominent work in this sense is the one reported in [
28]. The authors denote an EER of 0.05 while combining ECG, PPG and GSR with 25 subjects. However, the EER and detailed results in the case of fused ECG and PPG have not been precisely reported. Additionally, the research did not report the in-depth study of the applied classification algorithms and feature extraction methods. Another recent work that has used ECG and PPG for biometric authentication is [
33]. The study uses ECG and PPG signals separately for authentication. The MATLAB functions applied for feature extraction and classification are not explained explicitly. As a result, it is hard to reproduce the reported results.
Compared to other studies, our work proposes a novel biometric-based continuous model that takes advantage of ECG and PPG fusion. We also consider user impersonation and device spoofing by incorporating continuous authentication with biometric signal fusion. Apart from this, our model also considers single-user and multi-user mode authentication. We converse a series of machine learning and deep learning algorithms such as SVM, KNN, Naive Bays, Ensemble, Generalised Additive Model (GAM), Convolutional Neural Network (CNN), Long Short-Term Memory (LSTM) to address user and device level continuous authentication in PH networks. We test our models with a range of publicly available datasets. We have also made our code publicly available so that the other researchers can reproduce the results and propose further improvements.
2.1. Machine Learning Algorithms
In this part, to brief the readers, we present some concise pieces of background information on the classification and deep learning algorithms used in our work.
2.1.1. SVM
We have used SVM along with other classification algorithms. It constructs a hyperplane in multidimensional space to differentiate different classes [
39]. In this work, we have two classes, AUTH to indicate the data of authenticated users and NAUTH, to indicate the signal data of intruder SVM generates optimal hyperplane in an iterative manner that is used to minimise any error in estimation. The core idea of using SVM is to find a maximum marginal hyperplane that best divides the signal dataset into AUTH and NAUTH classes. The SVM applies a decision function
or
, to separate the input examples into two classes, where
with
d being the dimension. The size of the training set
N can be derived as
, with
as the input part for the
i-th example, and the class label of
. SVM maps
to a higher dimensional feature space that depends on a nonlinear function
, optimising the separated hyperplane through maximisation of the margin with the following quadratic equation:
where
and it will be equal to 0 after optimisation.
C expresses a degree of losing constraint where it is a positive constant that was chosen by the user. This means that having a large value number of
C would result in more accurate classification during the learning phase. If
is the kernel function which is inner a product defined by
, Then the SVM decision function is narrated as:
with a common polynomial kernel that can be defined as follows:
2.1.2. Naive Bayes
Naive Bayes classifiers are one of the most popular families of machine learning algorithms formulated on the simple probabilistic theorem. All Naive Bayes algorithms are based on the principle that all features are independent for any given classes [
40].
Assume that are m feature variables, a test instance t can be represented by a feature vector , where is the value of . Let V represent the class variable and v represent the value.
Assume that all features are fully independent given the class, NB uses the following equation to classify
t:
where
class value of
t, prior probability
and the conditional probability
.
2.1.3. KNN
KNN is a simple supervised algorithm that relies on the assumption that data with similar attributes will most likely have similar outcomes [
41]. In KNN, the decision is taken based on the similarity between a given training and test sets. The training examples are asserted using a number
n of attributes, and each of these attributes denotes a point in n-dimensional space using distinct classes. To predict the unknown dataset, it calculates the closest distance between the K training sets. A given dataset is
, where
D is a matrix of features from a data point, and
L is a class label. KNN then will estimate the conditional distribution of
L given
D and classify a data point to the class with the highest probability. Given a positive integer
k, KNN looks at the
k observations closest to a test data point
and estimates the conditional probability that it belongs to class
c using the following formula:
where
is the set of k-nearest observations and
is an indicator variable that is equal to 1 if a given data point
in
is a member of class
c, and 0 if otherwise. After estimating these probabilities, KNN classifies the data point
under the class in which the previous possibility is the greatest.
2.1.4. Ensemble Bagged Tree
Ensemble methods combine several machine learning methods in a single predictive model to minimise variance and bias or maximise prediction probability. Bootstrap aggregating (Bagging) [
42] is one of the earliest ensemble methods which create and integrate multiple classification modes to solve a specific classification problem. This method has been widely applied in biometric signal processing [
43,
44].
2.1.5. GAM
The generalised additive model applies shape functions to capture the nonlinear relationship between a predictor and the response variable. These are interpretable models that explain class scores using single and bi-variate shape functions of predictors [
45]. The standard GAM uses a univariate shape function for each predictor.
where
y is a response variable that follows the binomial distribution with the probability of success (probability of positive class)
in
n observations.
is a logic link function, and
c is an intercept (constant) term.
is a univariate shape function for the
i-th predictor, which is a boosted tree for a linear term for the predictor (predictor tree).
2.1.6. CNN
CNN is a particular type of neural network that can extract spatial and temporal dependencies from data, and this method is widely applied to digital images. More about CNN can be found here [
46].
2.1.7. LSTM
LSTM is a particular type of deep neural network that can capture repetitive features in the data [
47]. It is widely used for time series data to extract features in the time domain. The T-wave of ECG signals is generally asymmetric for a healthy person, however, T-wave can illustrate symmetry indicating abnormality [
48]. LSTM is well suited to capture repeated features from physiological signals.
2.2. Feature Extraction
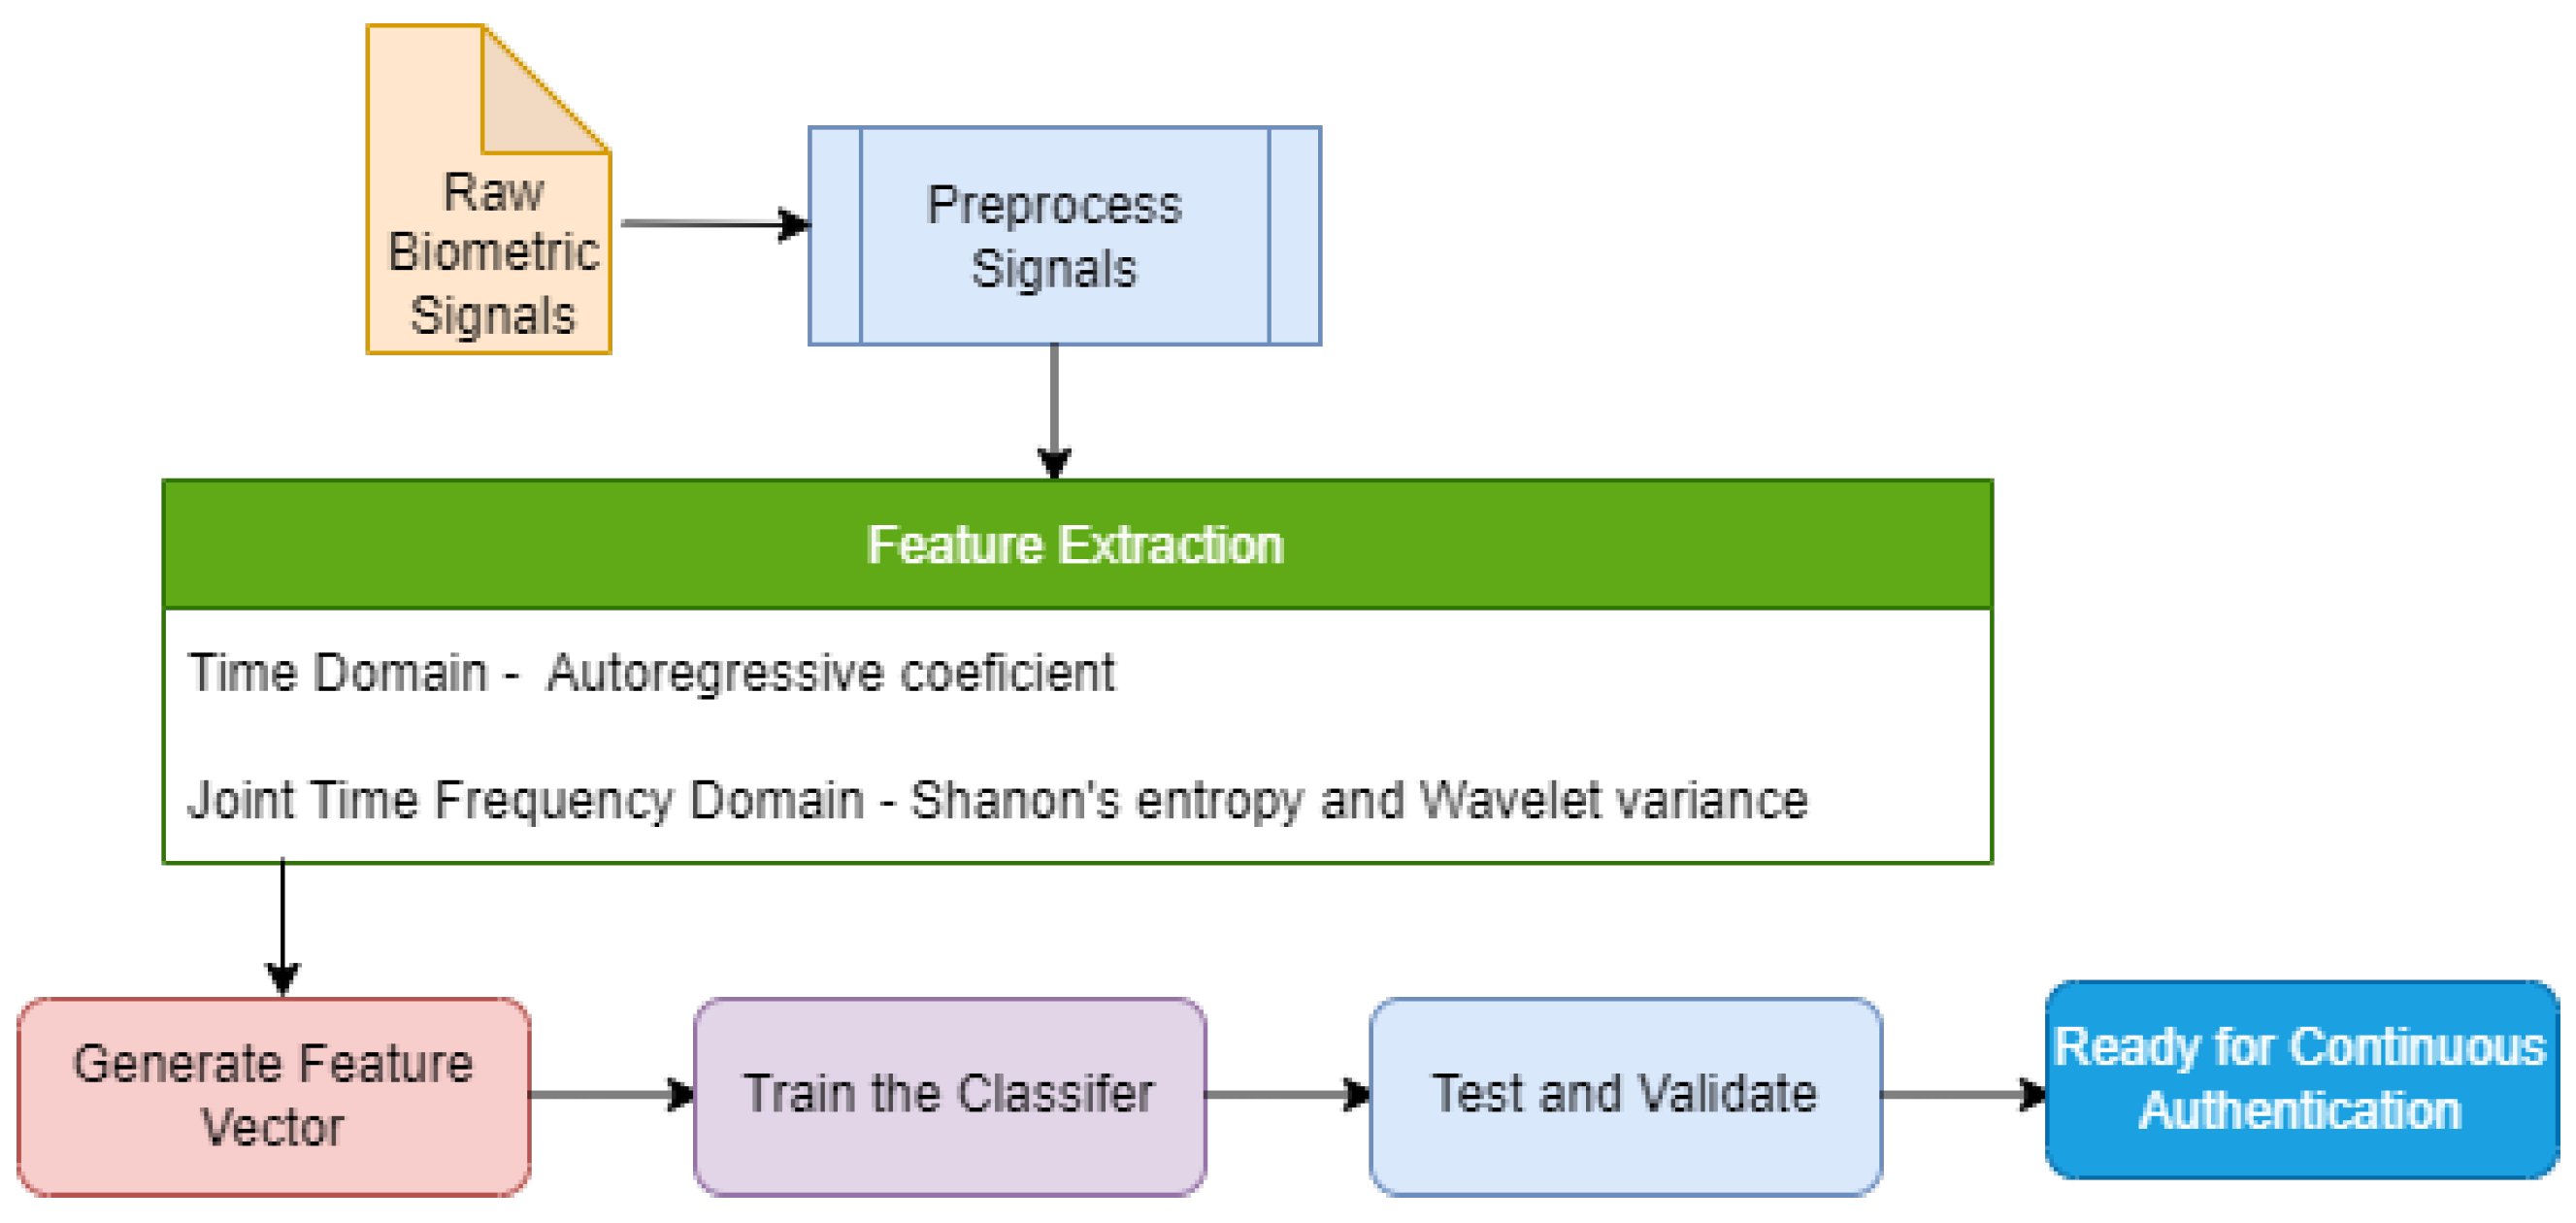
We have applied both time domain and joint time-frequency domain feature extraction methods to the physiological signals in this work. These features improved the accuracy and EER of the ML model from the processed signals. Wavelet Packet Transform (WPT), a joint time-frequency domain method, has been applied with the time-domain extraction method based on the AutoRegressive (AR) model. The justification for using these methods is detailed in the consequent subsections. We extracted Shannon’s Entropy values, Wavelet variances, and AR coefficients from the signals.
Figure 5 depicts the role of feature extraction process in the proposed intrusion detection model.
2.2.1. Wavelet Packet Transform
Wavelet packet transform (WPT) is an extension of wavelet decomposition (WD) [
49]. This method is chosen for its efficiency for non-stationary signal denoising, compression and classification. It also allows the features to have more discrimination power than the features from discrete wavelet transform.
The wavelet packet transform function of a signal
can be defined as [
50]:
where
s is a scale factor.
is the dilation of a basic wavelet
by the scale factor
s.
The scale factor acts as a linear operator and divides the signals into two components: approximation and detail. The approximation then can split itself into another approximation and detail. The process can be repeated till the signal that correlates well with the frequencies required for the classification of the signal is retained in the wavelet coefficients [
51].
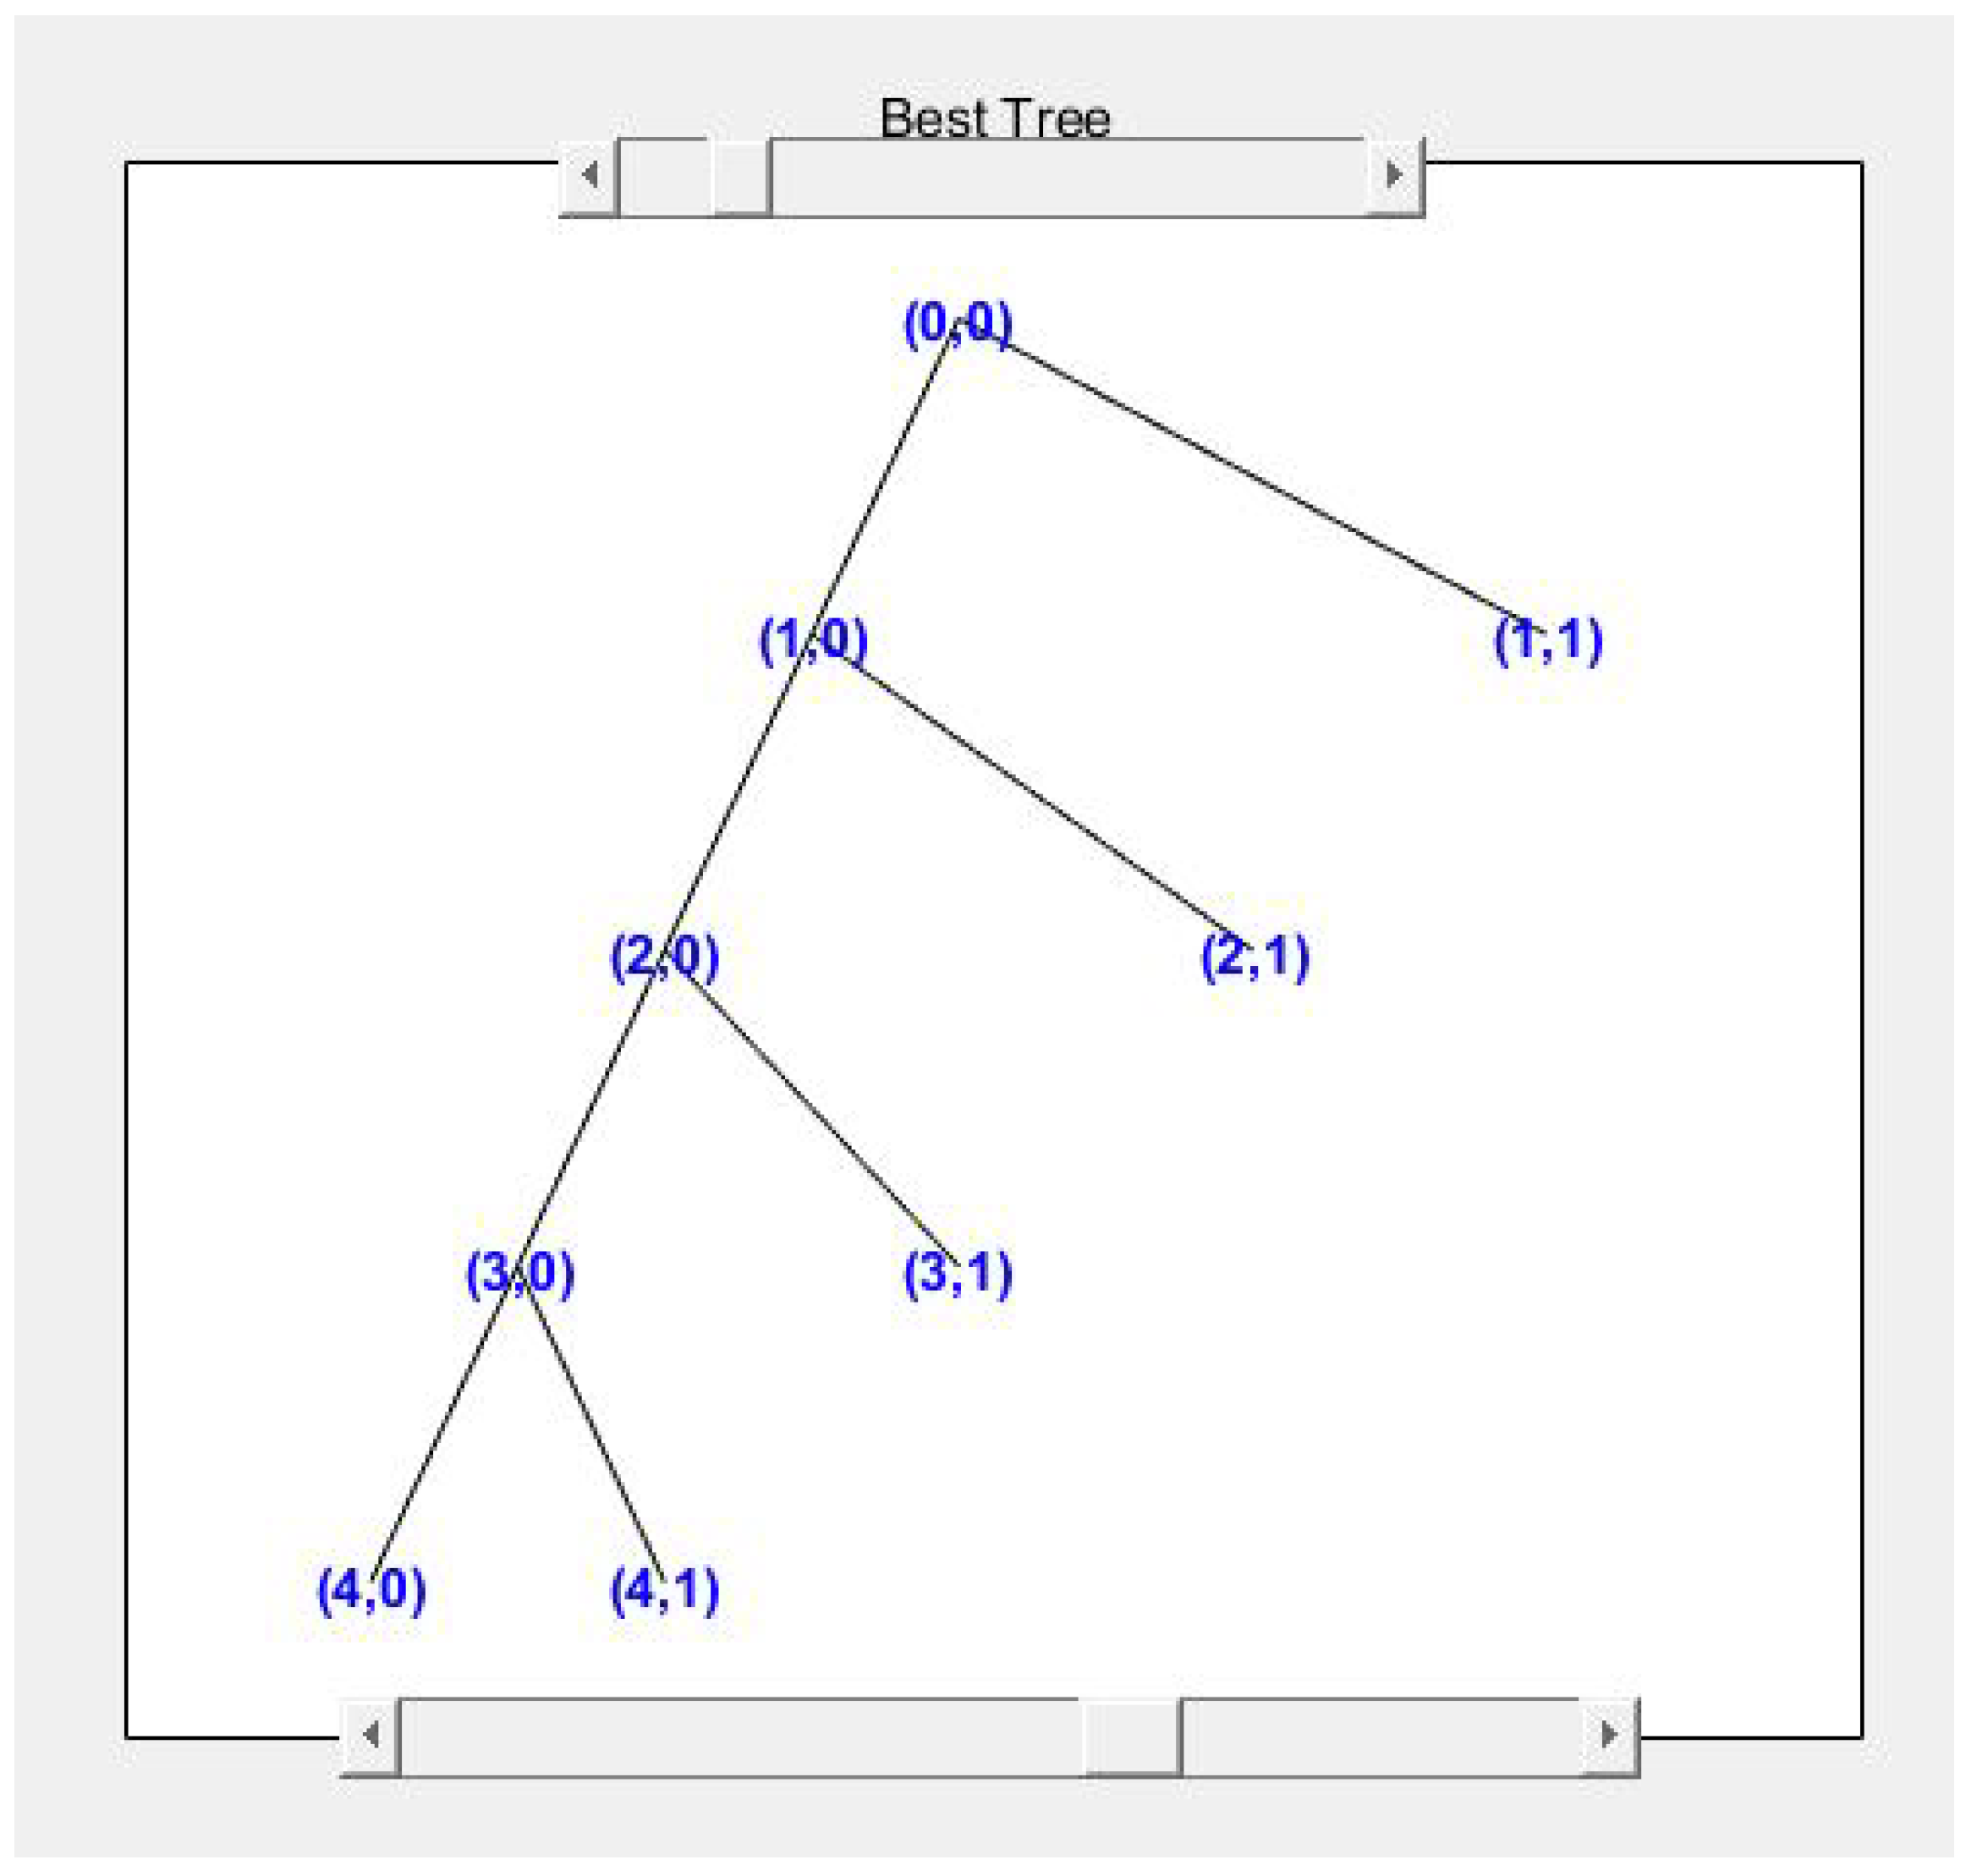
Figure 6 shows the wavelet tree for the ECG signal from one of the datasets.
However, with wavelet packet decomposition, the massive size of the decomposed coefficient can be a hurdle for classification. Entropy has been introduced to tackle such issues in WPD. It is prevalent in measuring the uncertainty of data in signal processing. There are different types of entropy. Some of them are Shannon’s entropy (SE), Log Energy Entropy (LEE), Renyi Entropy (RE), and Tsallis entropy (TE) [
52].
The entropy function is defined is as follows:
where
k is the number of coefficients,
j is the number of nodes and
i is the level on the node. The probability of the coefficients can be calculated as follows:
The entropy can be defined as follows:
where
P represents the probability,
represents the possible outcomes, being:
2.2.2. Autoregressive Model (AR)
The Autoregressive model is a time series model that analyses the values from the previous time steps using a linear combination of past values of the variables to predict future values. Here autoregression refers to a regression of the variable against itself. Implementing the AR model includes some levels of randomness and uncertainty, where future values can be predicted based on the past value. In most cases, the AR Model predicts a trend close to accuracy to be useful for the given problem.
In an AR process of order
p, the signal
with the time instant
t will be represented as a linear combination of
p previous values of the same signal. The AR process is modelled as:
where
represents the white noise with a zero mean, var
represents the
i-th coefficient of the model. It uses the authentication model’s coefficients as the feature input of the classifier. We tune various “AR process order” to tune the accuracy and precision of the best classification model for a scenario.
2.2.3. Instantaneous Frequency (IF)
The IF is a property of a non-stationary signal such as ECG that has a time-varying parameter relating to the average of the frequencies present in the signal as it evolves. Further details regarding the IF can be found in [
53]. The IF features of the ECG and PPG signals are used to train and test the CNN and LSTM models.
2.2.4. Spectral Entropy (SE)
SE is a property of a signal measured from the spectral power distribution. The SE treats the signal’s normalized power distribution in the frequency domain as a probability distribution and calculates its Shannon entropy. Further details of SE can be found in [
54]. The SE feature values of the ECG and PPG signals are used for CNN and LSTM models.
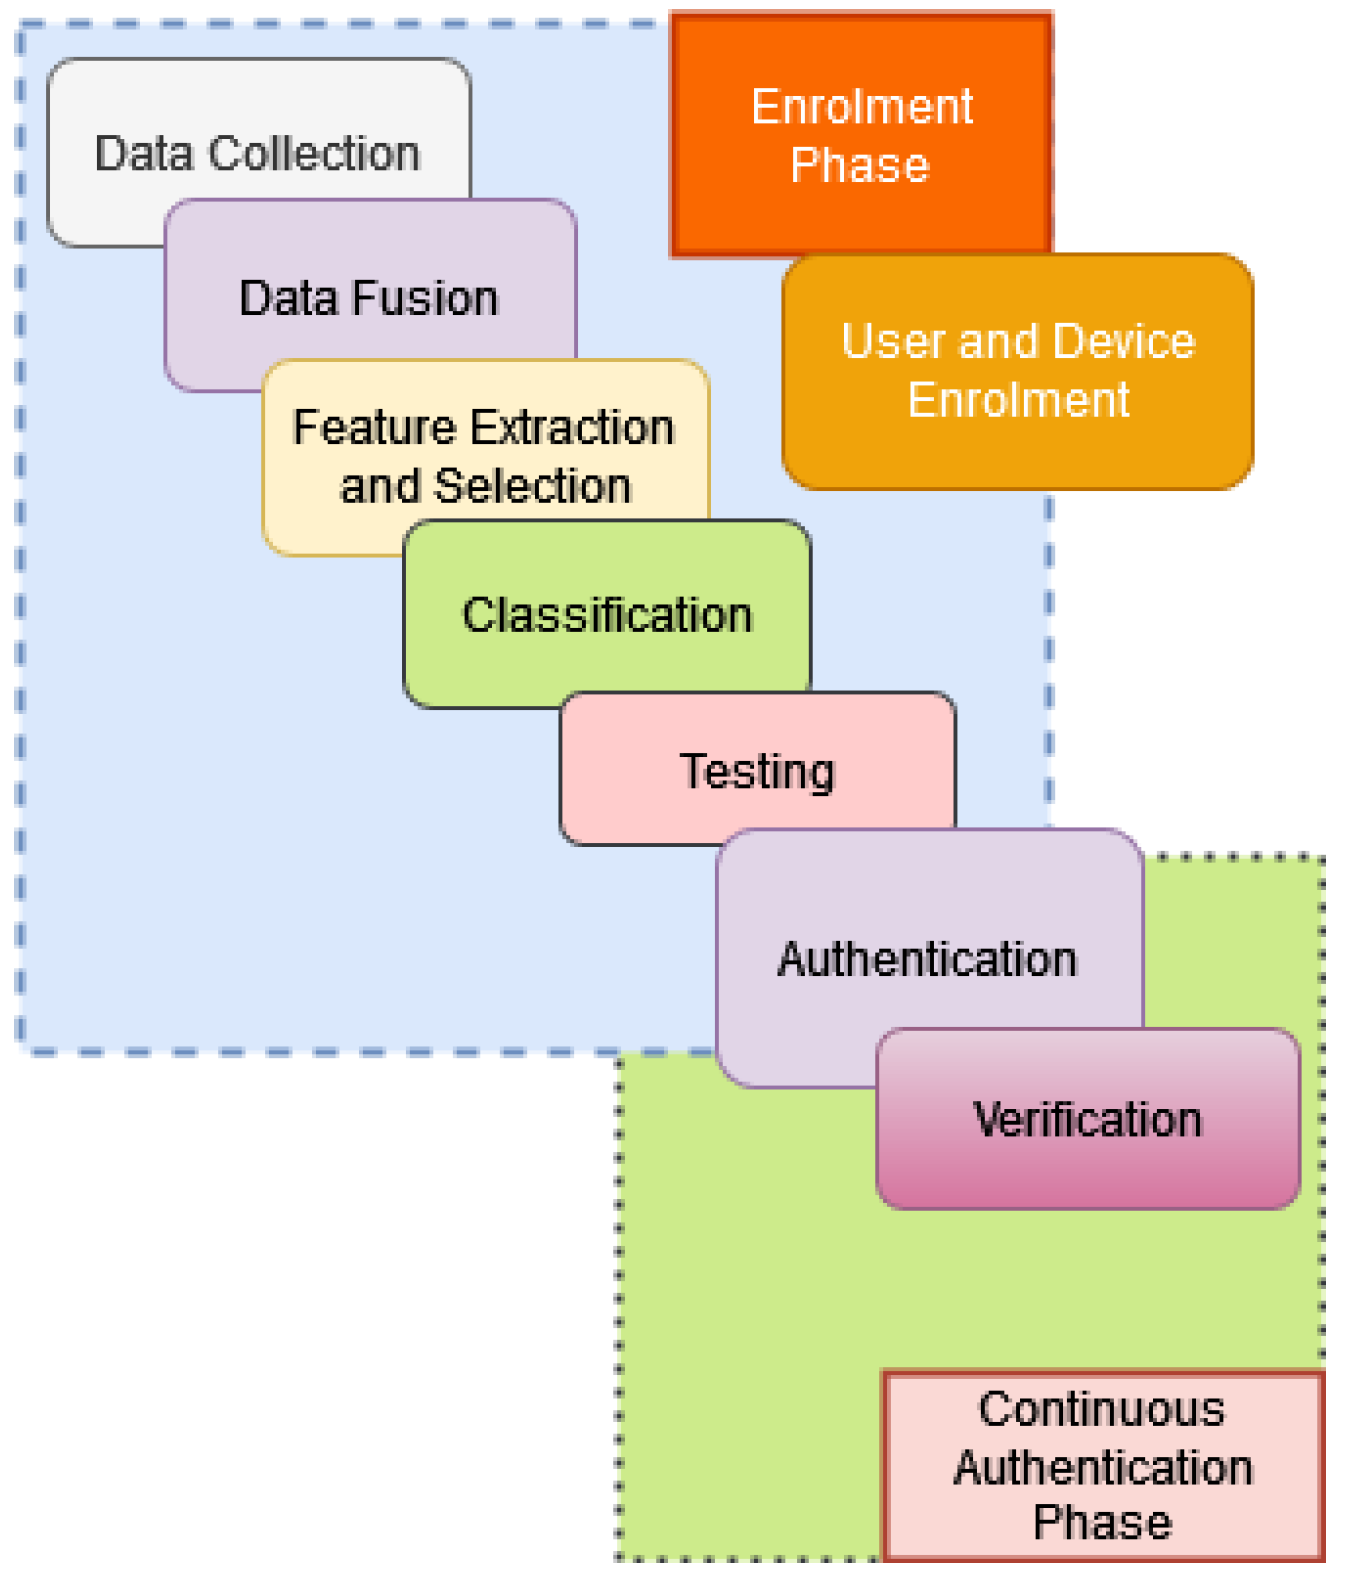
3. System Design
This section elaborates on our designed physiological biometric-based device authentication system based on continuous authentication techniques.
Figure 7 illustrates our system. The system uses two phases to verify a legitimate device—the enrolment phase and the constant authentication phase. The enrolment phase includes both user and device registration. The preliminary step of device registration is user registration.
At first, there is a range of biometric signals , where signifies a series of biometric signals. These are collected from a valid user . The system is trained using a machine learning model to recognise legitimate users. The model has training and testing phases. In the training phase, the manager will use the right signal to make the model recognise the correct user. In the testing phase, the manager uses the reference dataset to test the success rate of the recognition. Algorithm 1 (User Registration) illustrates the pseudocode. User registration has been implemented in the experiment part using machine learning and deep learning algorithms,
Let
be a set of signals from a user
. In our case,
is a set of multiple signals such as
and
.
The signal is collected for a time period
from a user
. A device
is trained with the signal for a time period
. The device is tested with the signal for a time period
. Then horizontal concatenation is performed on the signals to derive a single metric.
| Algorithm 1: User Registration. |
![Futureinternet 14 00222 i001]() |
The system progresses to the device registration after the user registration phase. In this stage, the PH manager instructs the device to send biometric signals such as ECG and PPG for a specific time window from the attached user. The manager then uses the previously created model to authenticate and register the device in the system. Algorithm 2 describes conceptual the process in pseudocode format.
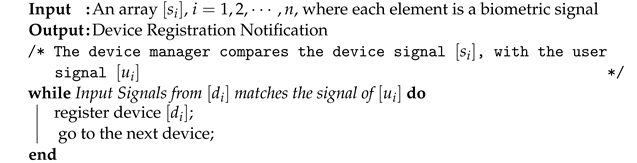
| Algorithm 2: Device Registration. |
![Futureinternet 14 00222 i002]() |
In the authentication phase, a device is asked to log in using the biometric signal of the attached user. If the model can recognise the signal, the device is authenticated. Otherwise, the system will request a higher privilege to reset the sensor or data to be passed or lock the device to prevent further access. The skeleton code for this authentication algorithm is described below. This authentication process is tested later in the experiment section.
| Algorithm 3: Authentication. |
![Futureinternet 14 00222 i003]() |
On the other hand, continuous authentication makes sure that the device is constantly audited. This prevents session impersonation. After the device is authenticated, it will continuously send the biometric signal maintaining a short interval (every 20 s), and the manager will monitor the transmitted data. If the sensor starts to send the wrong data at any point in time, the device will be locked out from the network. The algorithm is depicted as “Continuous Verification”.
| Algorithm 4: Continuous Verification. |
![Futureinternet 14 00222 i004]() |
Data Fusion
We have applied a few early fusion methods to process multimodal signals. This section provides a brief description of each of these methods.
Horizontal concatenation: As part of horizontal concatenation, the data are stored as a form of a matrix at first. As a result, we get two matrices for the ECG and PPG signals consecutively:
The resultant concatenate matrix is as follows:
Root Mean Square (RMS): The RMS denotes the statistical measure of the mean square root of a set of data points. For a set of D number of data points and
data items, the RMS is calculated as:
Geometric Mean (GM): The GM implies a type of mean that calculates the central tendency of a set of numbers. It uses the root of the product of the observed items. For a set of D number of data points and
data points under observation, the GM is expressed as:
Arithmetic Mean (AM): The AM denotes the central tendency of a set of numbers that applies the sum of observed items. For a set of D number of data points and
items under observation, formally the AM can be calculated as:
Harmonic Mean (HM): The harmonic mean denotes the reciprocal of AM of a given set of data points. It inverses each data point in a given set, sums those data points and then the sum is divided by the total number of data points.
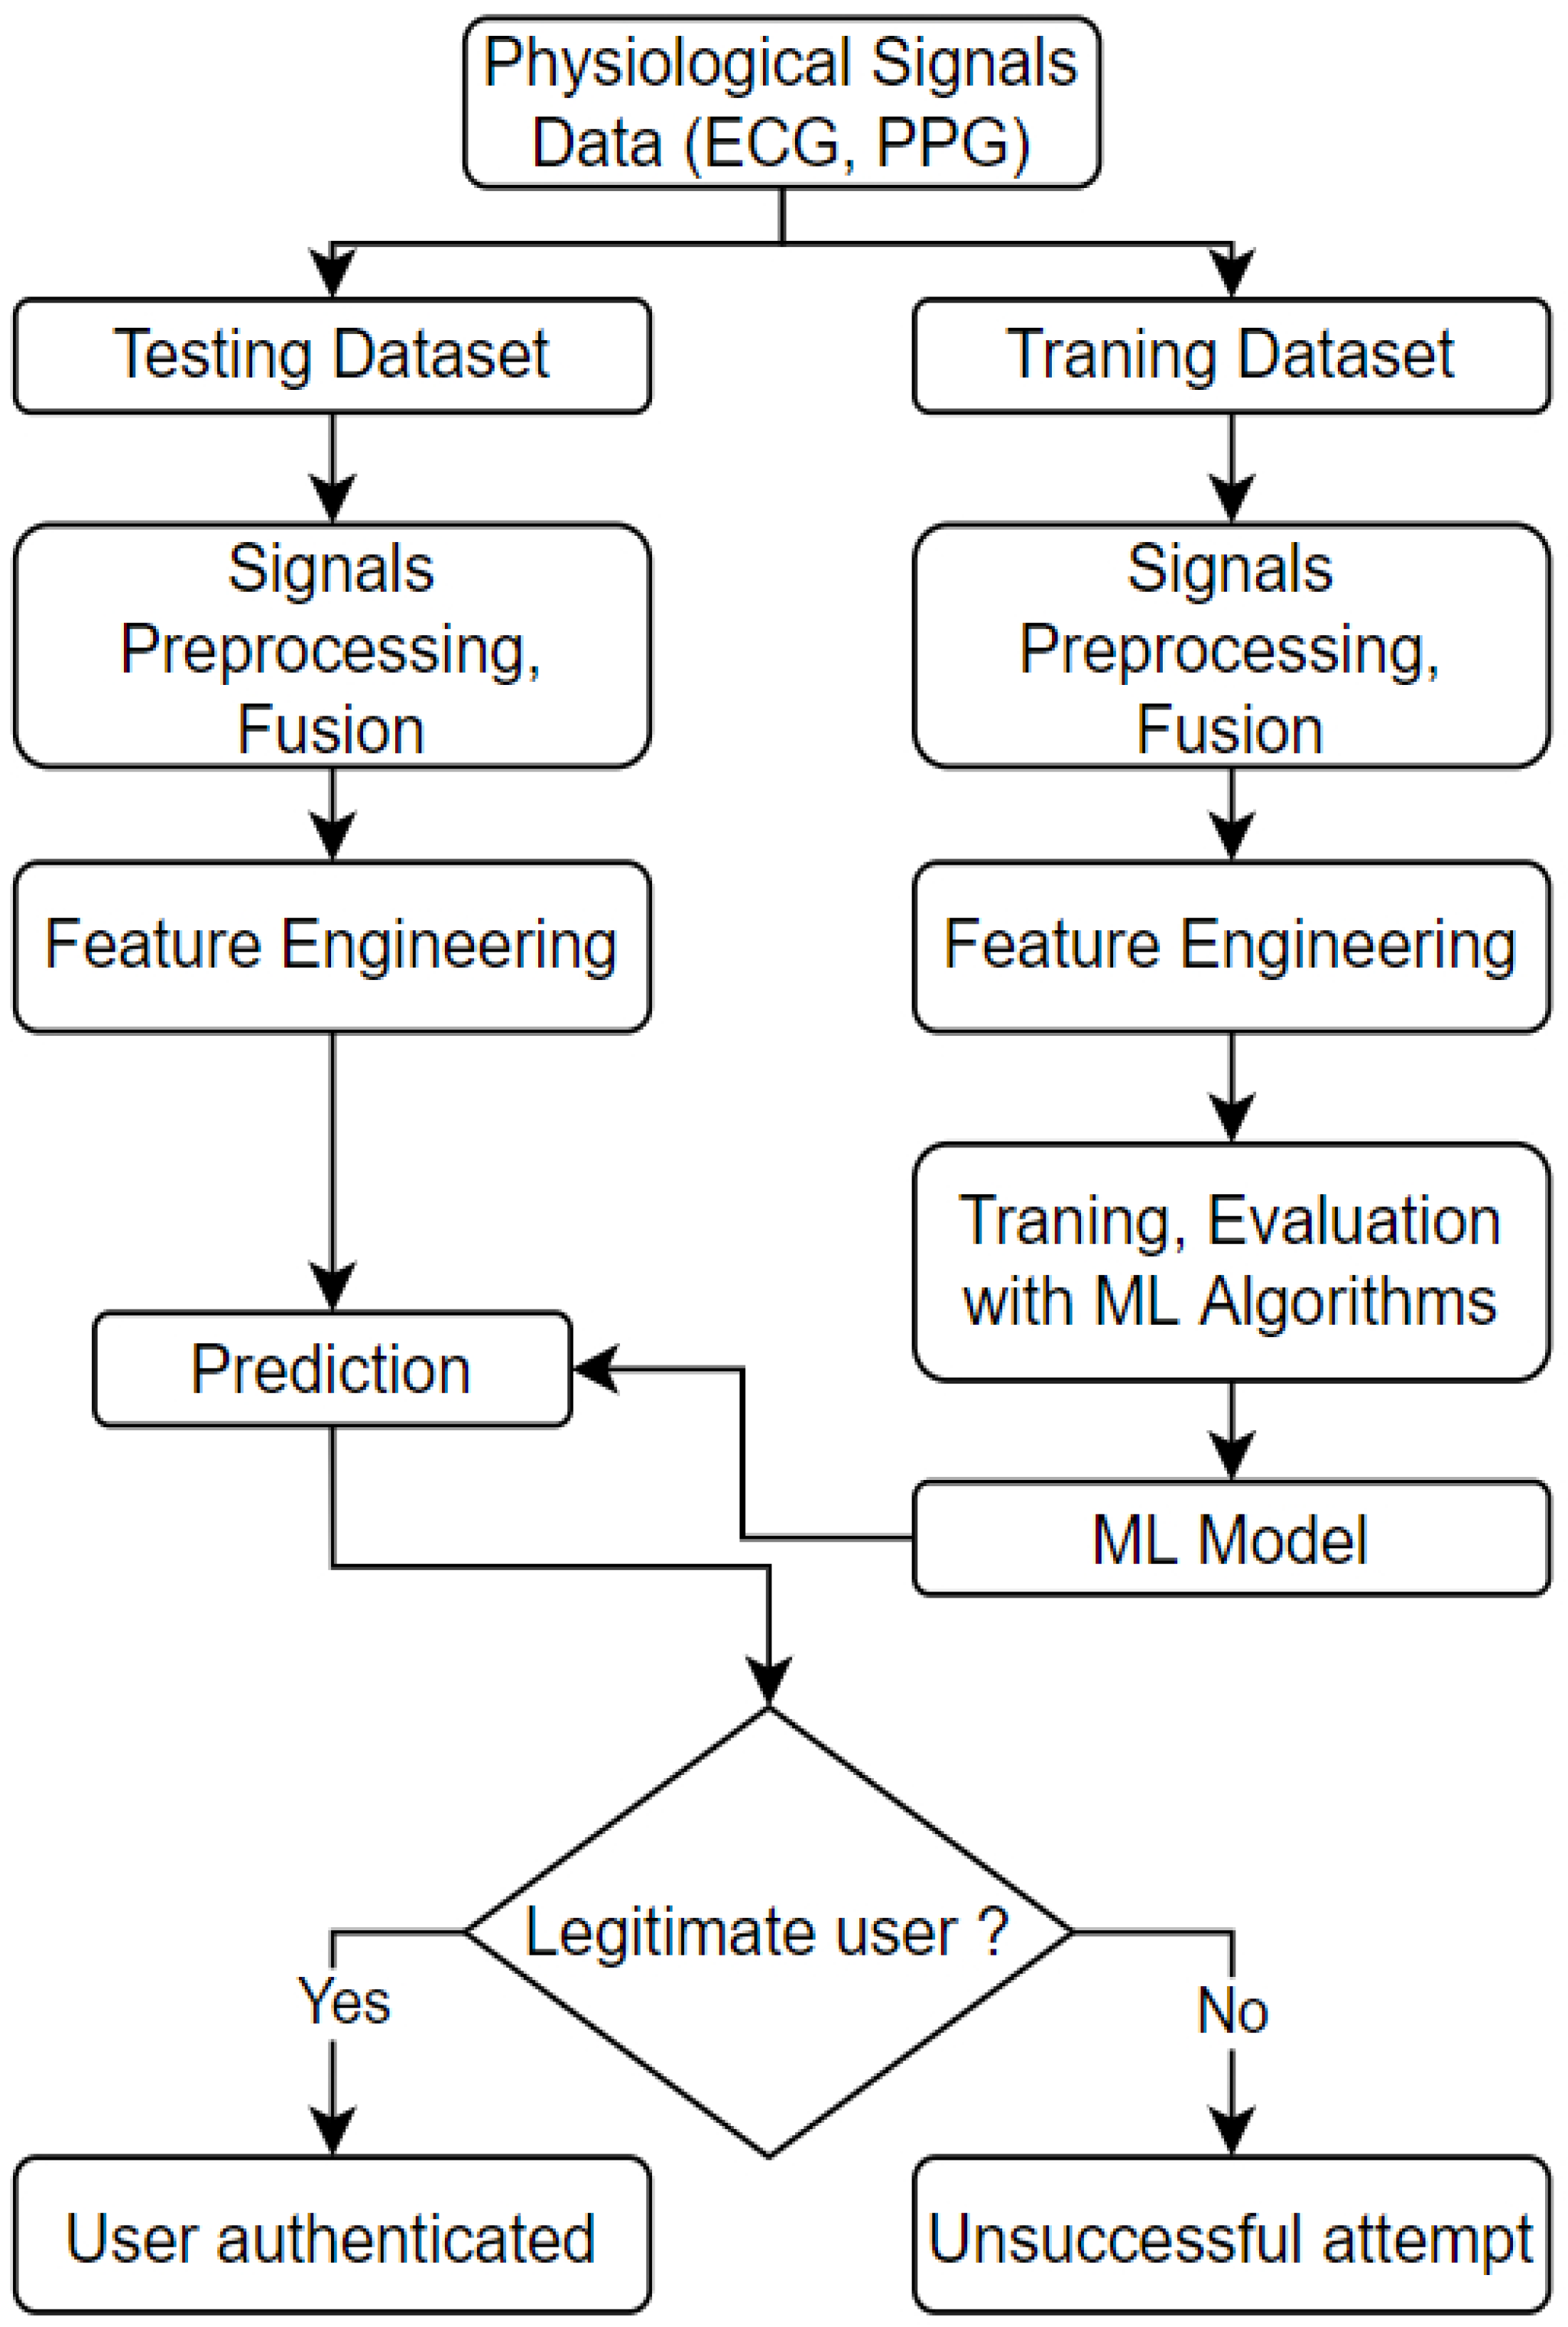
5. Experiment Design and Results Analysis
We have used a few publicly available datasets to experiment with the proposed authentication algorithm detailed in this section. We have implemented our model using MATLAB. The design and implementation are done in a few steps: data acquisition and pre-procession, feature extraction and selection, and finally, classification. The workflow diagram of the authentication ML model is presented in
Figure 9.
The notable elements of the workflow are as follows:
Physiological Signals: The signals are classified as authenticated and non-authenticated signals. As the name suggests, authenticated signals refer to signals registered into the database that are collected from a trusted source. The non-authenticated signals attribute to the signals from an unknown source/user that needs identification/authentication;
Data Preparation: As the physiological data being obtained are mostly raw sensor data, data pre-processing is required. Some of the techniques that are used in this stage are band-pass and noise filtering to remove the noise and artefacts from the collected signal;
Feature Engineering: For single signal experiments, the features are directly extracted using the feature extraction algorithm. For multimodal experiments, we apply early fusion and then extract and select features from the fused signals;
Identification: The unknown signal is processed, and features are extracted from the signal in this stage. Then the authentication algorithm is run to check the authenticity against the stored patterns of the authenticated users.
In this research work, we have used five datasets. All the signals in each dataset have been grouped in a single mat file. The signals are labelled as AUTH for authenticated users and NAUTH for non-authenticated signals.
We use the work from [
55] as a reference point to design our feature extraction part. We extract between 18 and 34 features for each experiment. Then the most important features are selected based on the chi-square test. All derived features are concatenated into a feature vector. The detail of our code is available in GitHub [
56].
The classification algorithms described previously are used to train and test the model. The parameters for each classification algorithm are selected based on the optimal performance. We define this performance benchmark by tuning several parameters and running each experiment at least five times. For example, when using the SVM algorithm, we have chosen the polynomial kernel function for SVM to classify each trial to estimate the misclassification rate and the confusion matrix. We selected the polynomial kernel function since our model is parametric. The polynomial function also works better if the model uses fewer data. Since we are training our model with authenticated user data, we do not expect a lot of data for this type of PH system.
We have used multiple metrics to evaluate our model. Ten-fold cross-validation is used to estimate the misclassification rate and construct the confusion matrix. Then we derived the accuracy precision rate, recall rate, F1 score, model loss and Equal Error Rate (EER) for each of our experiments. Each of these metrics is calculated using True Positive (TP), False Positive (FP), True Negative (TN) and False Negative (FN). We have a range of specific settings for unimodal and multimodal signal experiments. The following subsections detail the experiment settings and results, including the dataset details.
5.1. Dataset Details
Our research work focuses on two different physiological signals: ECG and PPG, to detect any network intruder. Most of the published research works primarily focus on a single physiological signal, ECG being the dominant one. We have used five datasets for our study based on their diversity and vastness.
BIDMC PPG and Respiration Dataset [
57] This dataset is available at Physionet [
58]. The collected data were from the admitted patients to the intensive care unit. The dataset consists of 53 patients’ recordings. Each of the recorded signals is 8 min long in duration. Each recording contains:
ECG and PPG signals, both of these signals are sampled at 125 Hz;
Some of the physiological parameters such as heart rate and respiratory rate and blood oxygen saturation level. These are sampled at 1 Hz.
MIT-BIH Arrhythmia Database [
59] This dataset is also available at Physionet [
58]. It is a clinical dataset of 47 participants of 48 half-hour excerpts of two channels’ ambulatory ECG recordings. Twenty-three recordings were randomly selected from a set of 4000 24 h ambulatory ECG recordings. These recordings are from a mixed population of inpatients and outpatients of the hospital. The rest of the records were picked from the same group to include less common but clinically significant arrhythmia, however, in this experiment, we will use the samples for biometric purposes.
MIT-BIH Normal Sinus Rhythm Database This dataset is extracted from Physionet [
58]. The ECG data were collected at Boston’s Beth Israel Hospital from 18 subjects. The subjects include five males between 26 and 45 years old and 13 females between 20 and 50 years old.
The BIDMC Congestive Heart Failure Database [
60] This database contains ECG recordings from 15 subjects. Each record has 20 h of recording. The dataset details are available at [
58].
Real-World PPG dataset [
61] This dataset contains PPG signals from 35 healthy subjects. Each recording has 300 samples (6 s) with a 50 sample/second sampling rate. Each subject has 50 to 60 recordings. The dataset details are available at [
61].
5.2. Performance Benchmarking
To utilise the secure personalised healthcare network and usable authentication, the performance benchmark of the system needs to be drawn from the following conditions:
Using shorter training data (5 min or less amount of physiological signal) to develop a highly accurate authentication model;
ML and DL model accuracy needs to be close to 100% to prevent intrusive unauthorised access to sensors;
The ML and DL model training and validation should be power and processing efficient and highly accurate.
5.3. Experiments and Results
This section illustrates our experiment design and results. We have conducted three sets of experiments that involve ECG, PPG and fusion signal combining ECG and PPG. We run a series of single and group user authentication involving multiple classification algorithms for each type of signal. A set of experiments focused on single signal mode authentication with selected features, and other sets of experiments used multimodal mode and IF and SE features to address group user authentication. AR coefficients, Shannon’s entropy and wavelet variance features are extracted for all signals. The most optimal parameters are chosen after running each experiment five times.
Table 2 illustrates the parameters we set for our first set of experiments.
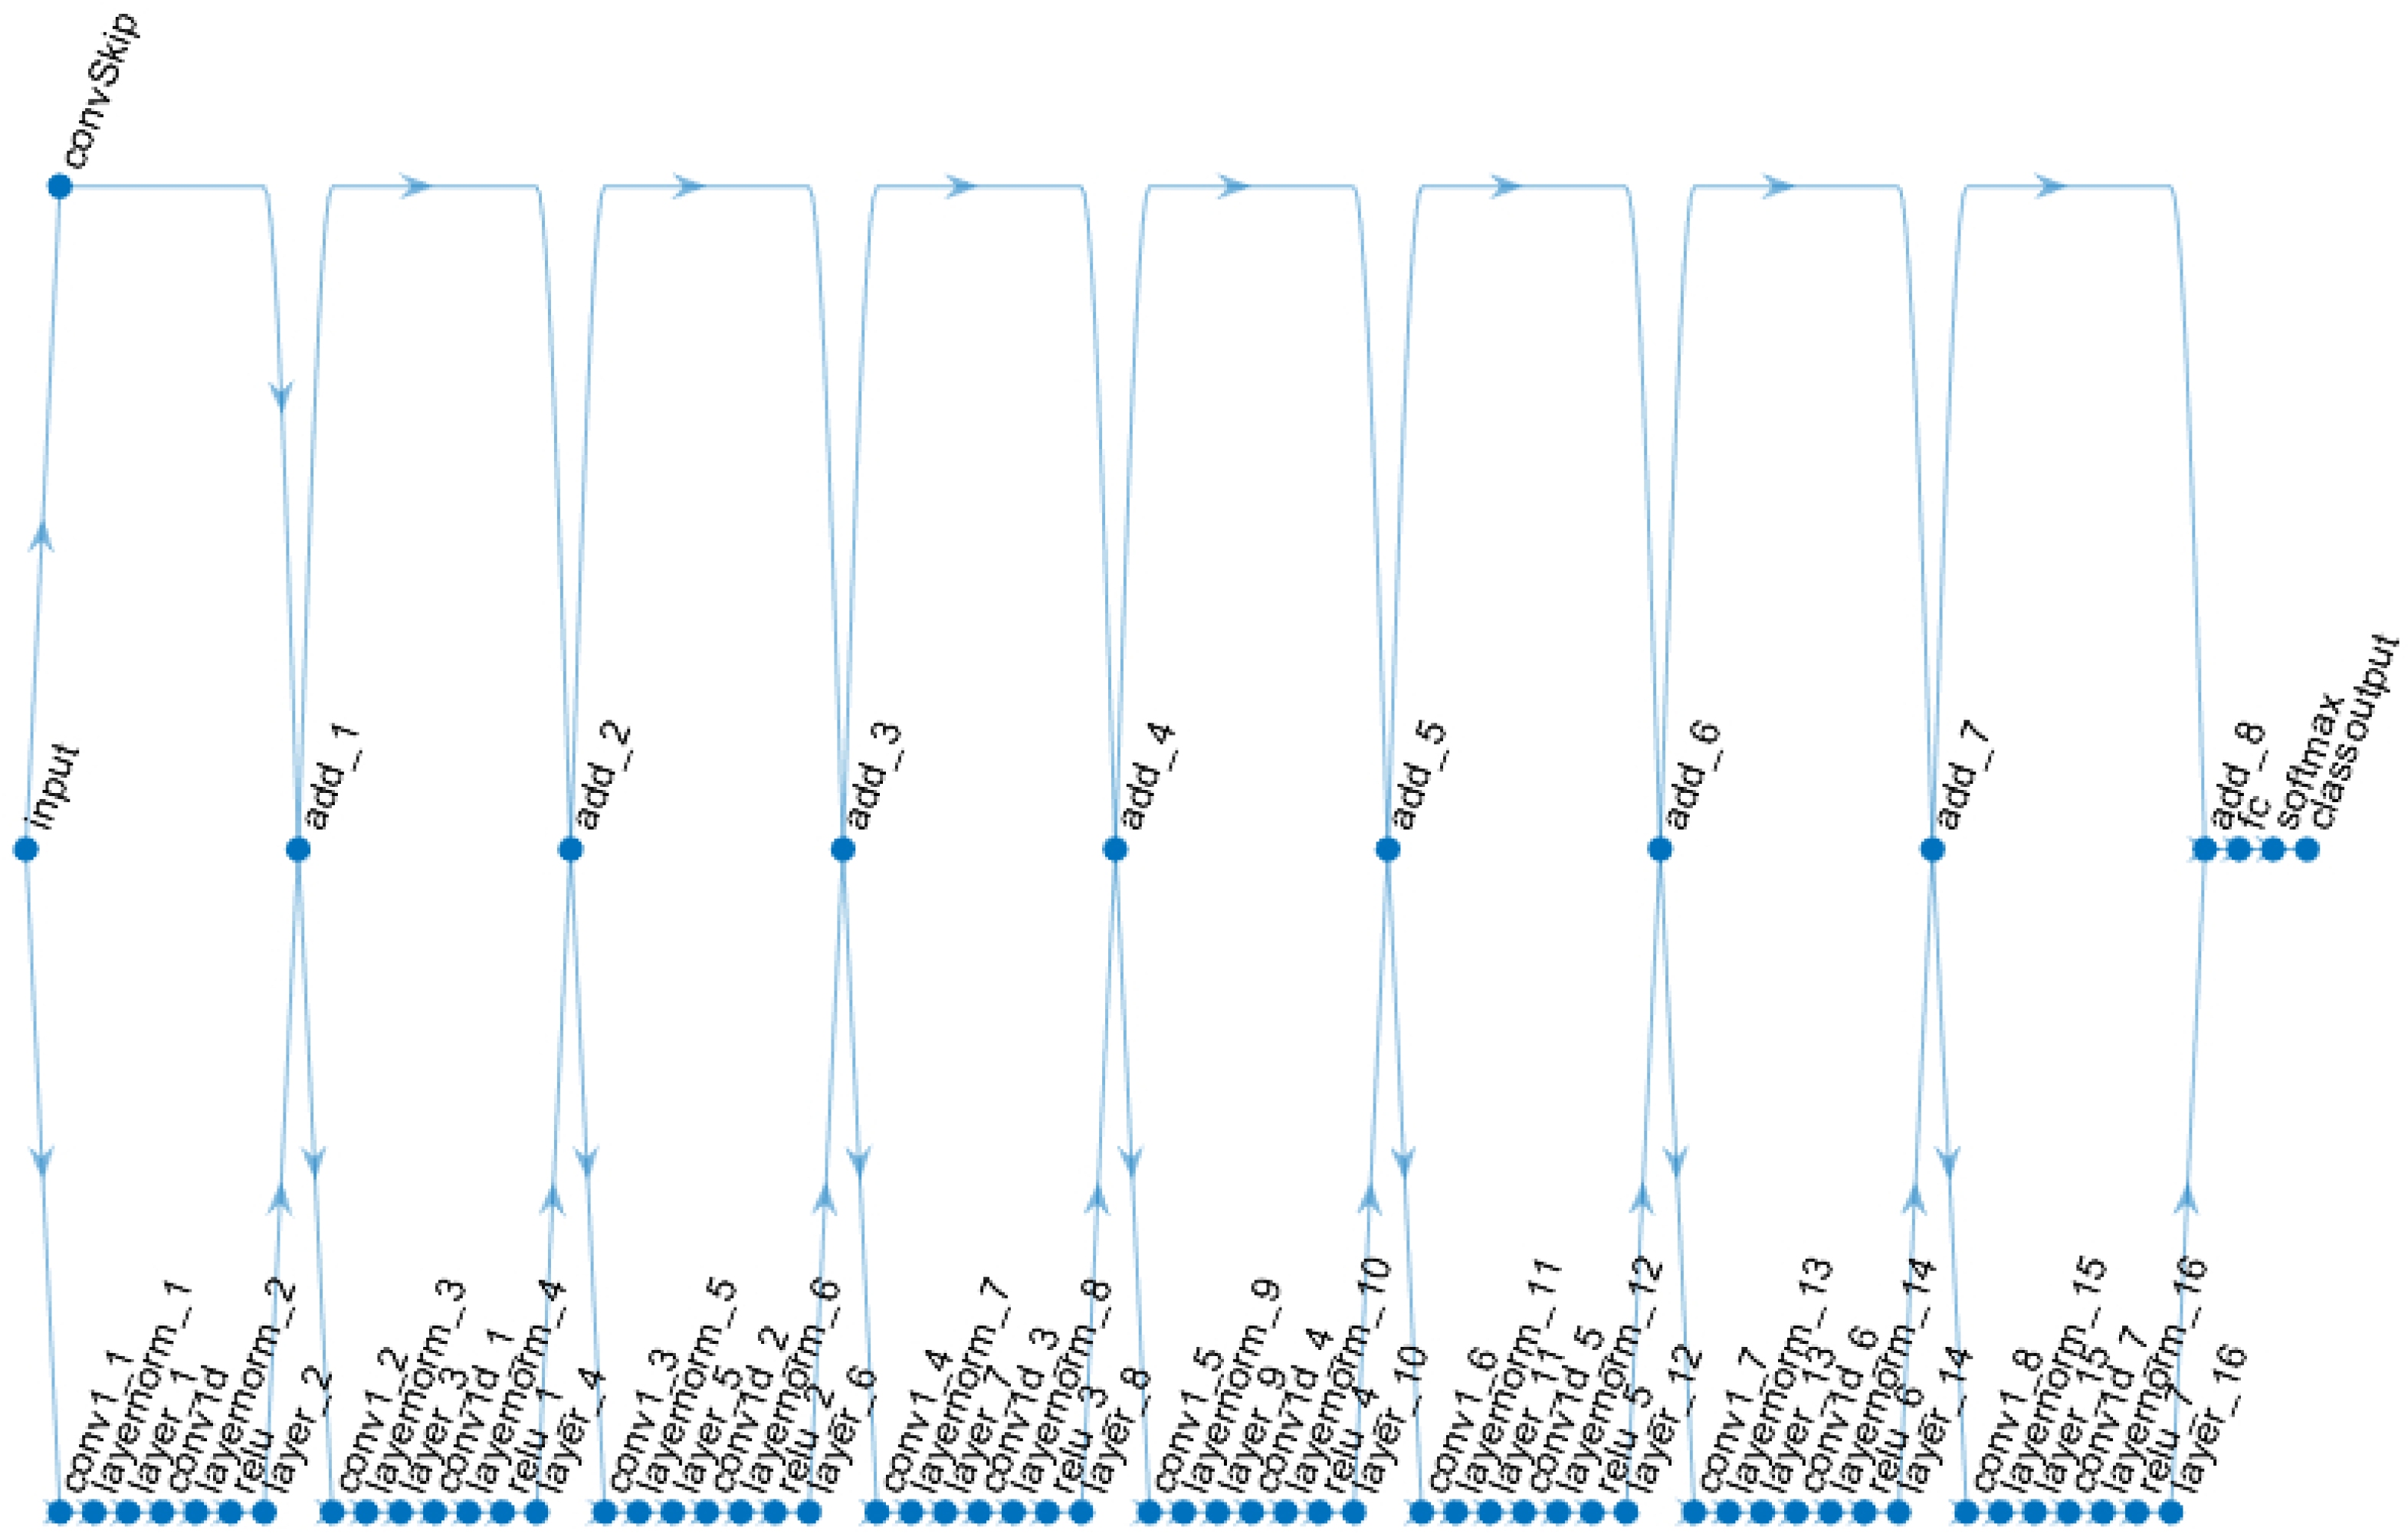
CNN and LSTM deep learning models are introduced for ECG and PPG fusion-based authentication and to compare single user vs group-based authentication. A sample CNN model is presented in
Figure 10.
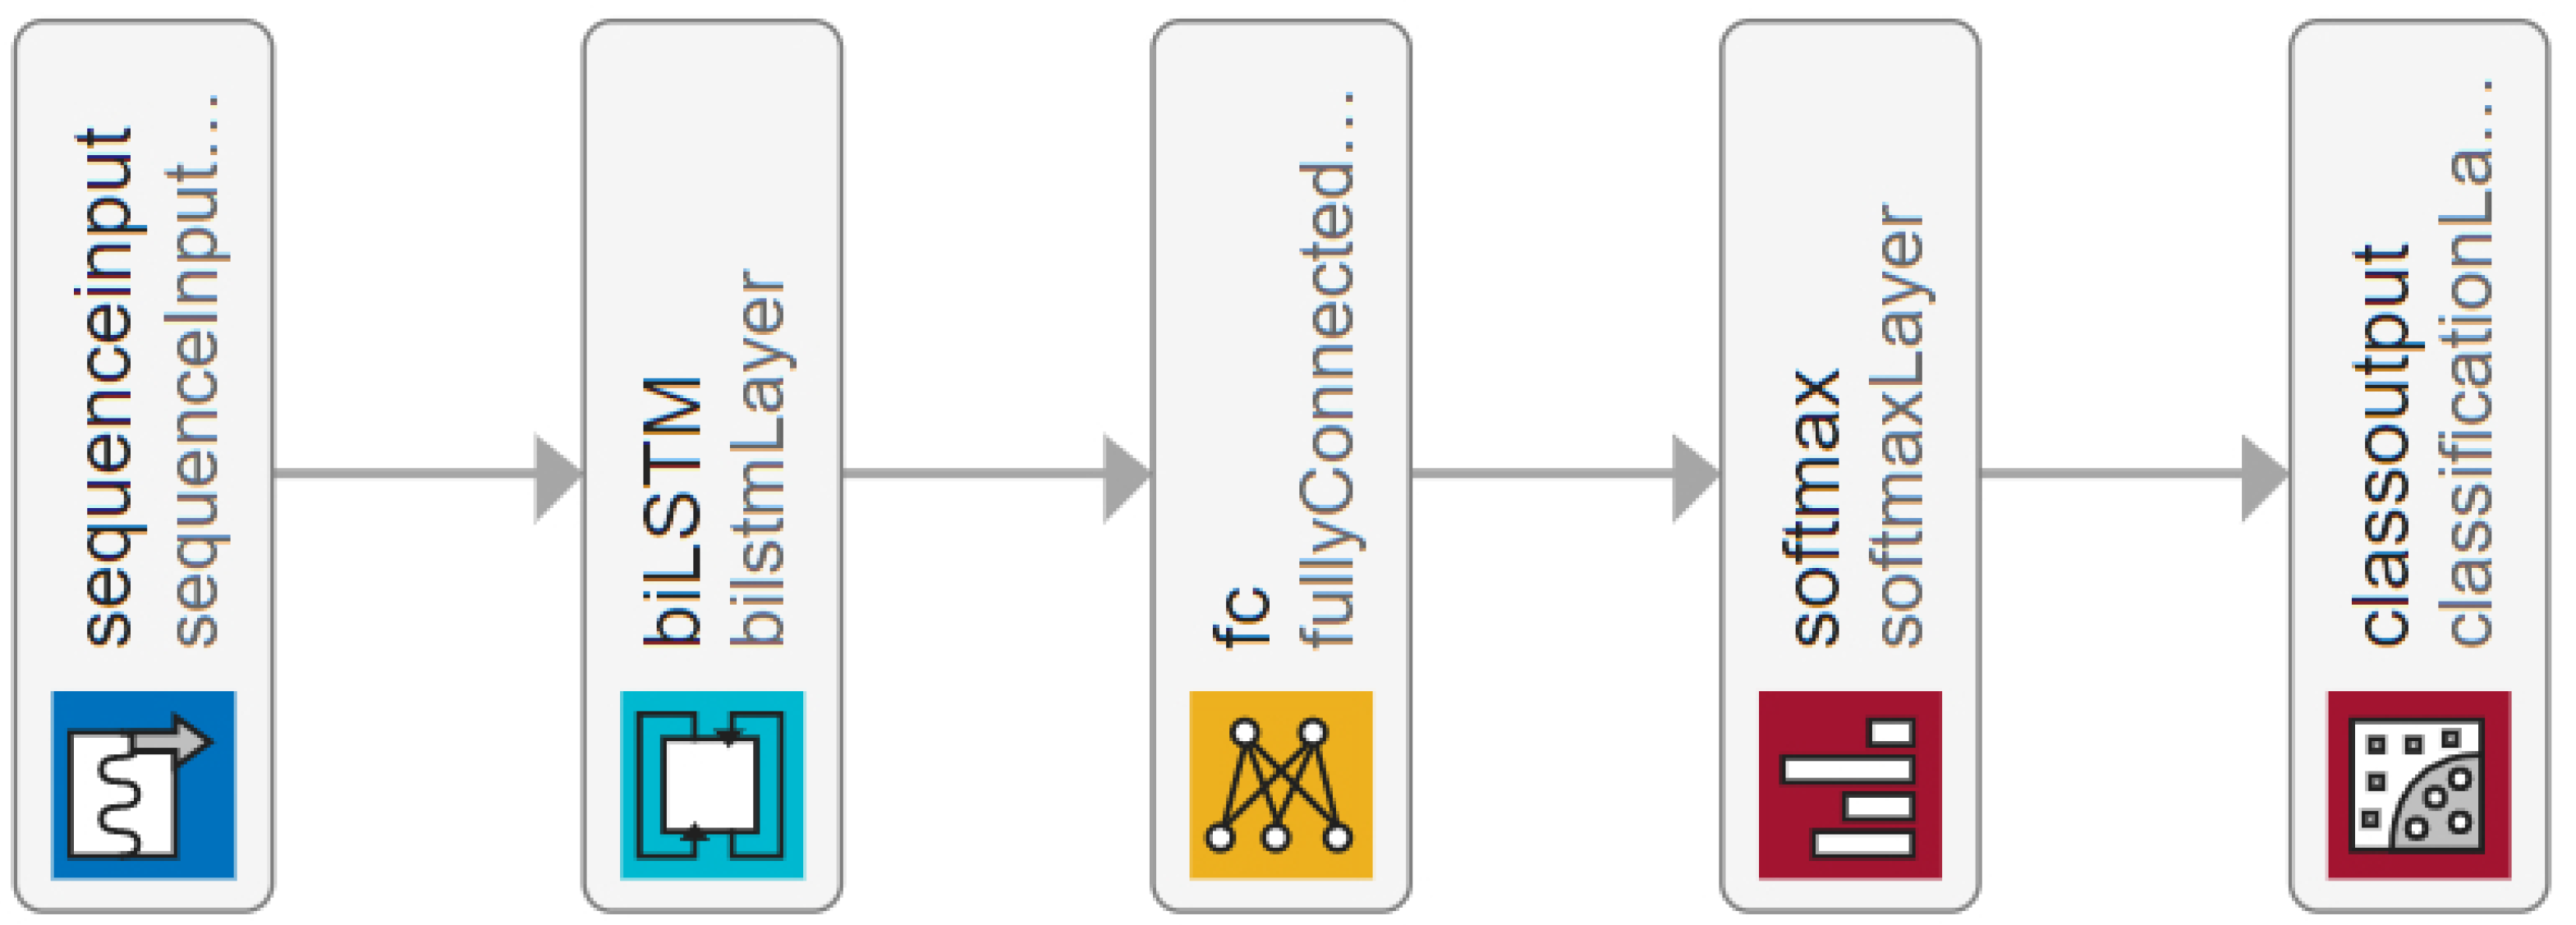
The CNN net has eight connected layers. Each of the connected layers is sequenced as follows: one-dimensional convolution layer, followed by the normalisation layer, then the dropout layer, followed by another one-dimensional convolution layer, then the dropout layer, Rectified Linear Unit (ReLU) layer, the dropout layer, then followed by next additional layer. Finally, the network is connected with a fully connected layer, softmax activation layer and classification output layer. The LSTM model for the experiments is presented in
Figure 11.
The LSTM model consists of a sequence input layer, bi-LSTM layer, fully connected layer and softmax layer followed by a classification output layer. Further details about the models and the source code can be found in [
56].
5.3.1. ECG Signal Based Authentication
The first experiment for ECG signals has been conducted using the ECG signals of 53 users from the BIMDC dataset [
57].
The dataset was initially divided into two portions—“TrainA” and “TestA”. One of the users, “UserA” from “TrainA”, is marked as the authenticated user, and the rest of all the data from “TrainA” and “TestA” are considered intruders. The ECG signal data of “UserA” and other users is about 7 min long. These signals are processed to create multiple instances of an equal length of 9 s. The data of “UserA” was then further partitioned to 33% training and 67% testing data. The training samples of “UserA” are copied multiple times to increase the training instances that will allow overtraining of the authenticated user, and through this overtraining, it will enhance the security of the biometric model to identify the authenticated user.
Additionally, it will improve data balance and symmetry during the training session. The dataset of the remaining users from “TrainA” and the users of “TestA” are also processed to create 9 s length samples. Multiple machine learning classifier algorithms are used and compared to find the best performer within the training set and tested with the test samples. The outcome of the test results of 2533 samples is presented in
Table 3.
To validate the scalability of the biometric model, subsequently, we run the second experiment for the ECG signal, adding the combination of three datasets which are: MIT-BIH Arrhythmia Database [
59], MIT-BIH Normal Sinus Rhythm Database [
58], and BIDMC Congestive Heart Failure Database [
60]. We use the ECG records of 120 users. All these 120 users are regarded as intruders. The result of the test of 10,213 samples is presented in
Table 4.
After performing the single-user authentication for ECG-only signals, we experimented with the ECG-only group authentication. For this experiment, a group of three is created, considering that they belong to the same personal healthcare network. ECG signals from these three users are regarded as authenticated users, and the others are considered intruders. We use the same strategies to process ECG signals, labelling, feature extractions, training and testing as single-user experiments.
Multiple ML algorithms are used to find the best-performing model. Out of these algorithms, the SVM receives the given number of features in the learning phase and performs a grid search optimisation algorithm to find the optimal normalisation resolution factor . Then the machine derives the normalisation resolution factor with the remaining features by comparing them with those being used in the learning phase. The code for our SVM template is as follows:
template = templateSVM (…
’KernelFunction’, ’polynomial’,…
’KernelScale’, ’auto’,…
’BoxConstraint’, 1, …
’Standardize’, true);
model = fitcecoc (…
trainFeatures, …
train_n_test_label, …
’Learners’, template, …
’Coding’, ’onevsone’, …
’ClassNames’, {’AUTH’, ’NAUTH’});
The source codes of all the experiments and related files are available in GitHub [
56].
The model using Naive Bayes did not perform well in the multiuser authentication model. Out of the algorithms used to train the model, GAM performed comparatively better with a precision of 52.6% and EER 0.04. The results are presented in
Table 5.
5.3.2. PPG Signal Based Authentication
We set up the PPG signal based authentication experiment using a similar data preprocessing technique to the ECG experiments. We combined two PPG datasets which are BIMDC [
57], and PPG real-world datasets [
61]. The combined sample user number is 66. We follow similar procedures to create 9 s length sample points for the training and testing portion of the data. Multiple training algorithms are used and compared to find the best performing algorithm to create a model. Then the models are tested with the test samples. Similar parameters as
Table 2 are used to extract features from the signals.
The results of the single-user authentication using PPG are presented in
Table 6.
To validate the group-based multiuser authentication, a group of three is created. PPG from these three users are regarded as authenticated users, and the others are considered as intruders. AR coefficients, Shannon’s entropy and wavelet variance features are extracted. The transform level, the window size of the signal and other settings are already mentioned in
Table 2. The results from the test samples are presented in
Table 7.
5.3.3. ECG-PPG Fusion Signal Based Authentication
Consequently, experiments are conducted with ECG and PPG fused signals from the BIMDC dataset [
57]. This dataset has over 6 min of these two signals for every 53 users. Several fusion techniques were used to validate which fusion signal will provide a better result as described in the data fusion section. At first, we simply add the amplitude of the ECG and PPG signals and apply classifier machine learning algorithms as follows: Firstly, from the fused signal we extract Shannon’s Entropy (SE), Wavelet variances (WV) and AR coefficients. Then we train and test the model to recognise a single authenticated user. The signal data of each user are processed and prepared to create smaller sample data points where each data point contained around 9 s length of signal (worth 11 heartbeats). Training and testing portions of the data are separated in a 70/30 proportion.
Multiple training algorithms are used to train the model. To select the best-performing model, many tests are conducted on the trained model using the testing sample portion of the dataset. The extracted features based on
Table 2 parameters are used to train multiple classifiers. However, the above-mentioned classifiers with time and time-frequency joint features have not achieved a promising result. The model was trained to apply the ten-fold cross-validation method. Additionally, EER and F1 scores were considered in selecting the best model. The best performing classification model trained using GAM achieved a precision of 44.4% and EER of 0.02.
We have tried different fusion methods and extracted some new features to improve the result further. We also create smaller sampling points by reducing the frequency. The preprocessed data are in the proportion of 70/30 for the training and testing. We conduct the fusion using Square Root (SQRT), RMS, GM, AM and HM. A detailed discussion of these metrics has been provided in the data fusion section. All these metrics except HM produce good results for the fusion signal. For further fusion signal based experiments, we use RMS fusion as standard as it provided slightly better F1 scores than the other fusion approaches that were applied. We have extracted IF and SE features as described in [
62]. These features are used in deep learning models: CNN and LSTM. LSTM model is specialized in finding patterns in a time series sequence. In the experiment of single-user authentication, LSTM has demonstrated precision and F1 score rate as 97.1% and EER 0.16. CNN has provided a precision rate of 92.1%, F1 score of 98.5% and EER of 0.21.
Table 8 shows the comparison of the experiment results.
After conducting the single-user experiments, we run the group-based authentication experiments. The data processing and feature extraction method remains the same as in previous experiments. The results of the multiuser ECG-PPG Fusion experiments are presented in
Table 9. Multiple LSTM training configurations are used as mentioned in
Table 9. It is observed that when the user group member size is increased, the accuracy decreases. However, when the window sample size is increased from two heartbeats to 8 heartbeats, the accuracy and EER change rate are changed to a negligible amount. It indicates that the model trained with LSTM and a minimum of two HBs can provide an excellent authentication scheme.
6. Discussion
The objective of the experiments was to find the best continuous authentication model on (1) single signal vs fusion signal based authentication, and (2) single user vs group of user-based authentication, using conventional classifiers and contemporary deep learning algorithms. In
Table 10 the summarised results presented from the experiments. From
Table 10 it is observed that in single authentication mode, among the classifiers, the Naive Bayes model has provided the best result for ECG-only authentication reaching 100% precision and 99.92% accuracy and zero false-positive cases out of 2533 test samples. The Naive Bayes based model demonstrated resiliency against a large number of intrusion attacks during the scalability test. When 10,213 samples were tested in the second experiment, this model experienced zero false-positive cases and reached an EER of 0.024. During the PPG-only authentication experiments, none of the classifiers reached up to a good benchmark, although LSTM provided a comparatively better result [
62]. In the case of ECG and PPG signals based on RMS type fusion, the deep learning LSTM model illustrated good precision and low EER compared to CNN based model, even though we chose to change signal sample length from two heartbeats to 16 heartbeats. It will ensure a multimodal and reliable authentication scheme.
When multiple user groups of three and five are created to verify the group authentication model, overall authentication performance is reduced compared to the ECG-only model when using the classifiers. LSTM deep learning net provided satisfactory accuracy and precision. However, many valid login attempts are declined. Therefore, further research is required to improve the sensitivity and accuracy of group authentication. Based on the benchmark performance defined earlier, our proposed models can achieve high accuracy, especially in single and multiuser authentication, using Naive Bayes, LSTM and CNN, as illustrated in
Table 10.
From our literature review, only a few notable works have reported ECG and PPG together as biometric traits for multimodal authentication systems. We present the comparison in
Table 11.
6.1. The Impact of Signal Fusion
In our work, we run three sets of experiments under a broader theme, which include ECG-only authentication, PPG-only authentication, and the fusion of ECG and PPG signals. Then we branched this out to the single user and group authentication. ECG-only authentication excels PPG and fusion-based authentication for single-user authentication. It has zero false positive cases meaning it is letting no intruders to the systems. On the other hand, PPG single-user authentication has larger false positives which raises some concerns about using it as a single authentication although it is more secure. On the other hand, the fusion signal for a single user shows a promising result with a lower false positive rate which means a lower chance for intruders to enter the system. Considering both usability and security trade-offs, the fusion signal also performs better with a lower false negative rate meaning it is easier for the users to log in to the system. The group authentication outperforms ECG and PPG authentications in terms of accuracy, however, had a greater error rate. Since authenticating a group user involves more complex dynamics, the deep learning models need to be further refined which is included in our future work.
6.2. The Impact of the Fusion Method
We have used different fusion methods to test the ECG and PPG combination. We have applied SQRT, RMS, GM, AM, and HM. Applying RMS has provided a better F1 score (harmonic mean between precision and recall) which is an important improvement for binary classification problems such as our study.
6.3. The Impact of Feature Engineering
For all machine learning algorithms, we have applied both time domain and joint time-frequency domain features as a result features, such as the AR coefficient, Shannon’s Entropy, and Wavelet Variance for all signals are extracted. These features have improved the overall performance of the ML algorithms. For DL algorithms, we have extracted IF and SE features as the LSTM model is specialized in finding patterns in a time series sequence. This has improved the performance of both single and group-based authentication in the case of fused signals.
6.4. Computing Resource Requirement
The model was trained and tested on a computer containing 16 GB of Memory, 2.90 GHz CPU and a GPU (NVIDIA GeForce 930MX) utilised by LSTM and CNN. It took 0.00067 s/sample to extract features from the fusion data of 53 users containing 10 min of the physiological signal. To develop an SVM model for group authentication with three users, the training time was 0.0004 s/sample and the testing time was 0.000066 s/sample. The GAM model training took 0.000517 s/sample and the testing time was 0.000099 s/sample. In single-user authentication mode, the SVM model training time was 0.00035 s/sample and testing time 0.000066 s/sample. The GAM model training took 0.00041 s/sample and the testing time was 0.000077 s/sample. The LSTM model training time was 0.065 s/sample and the testing time was 0.00081 s/sample. Sample feature extraction time and testing time are promising.


 ,
, 


