Abstract
Due to the expansion of the internet, we encounter various types of big data such as web documents or sensing data. Compared to traditional small data such as experimental samples, big data provide more chances to find hidden and novel patterns with big data analysis using statistics and machine learning algorithms. However, as the use of big data increases, problems also occur. One of them is a zero-inflated problem in structured data preprocessed from big data. Most count values are zeros because a specific word is found in only some documents. In particular, since most of the patent data are in the form of a text document, they are more affected by the zero-inflated problem. To solve this problem, we propose a generation of synthetic samples using statistical inference and tree structure. Using patent document and simulation data, we verify the performance and validity of our proposed method. In this paper, we focus on patent keyword analysis as text big data analysis, and we encounter the zero-inflated problem just like other text data.
1. Introduction
In social network services and internet environments, a large part of data are provided in the form of text documents. Since they are text big data, various analysis methods need to be studied. A lot of research has already been done for the analysis of text data, and a significant number of their results have been used in practical domains. However, there are still some problems to be solved in the text big data analysis. One of them is a zero-inflated problem when the preprocessed data contain too many zero values [1,2,3]. If there are too many zero values in the data, the explanatory power of the predictive model would be decreased. It is one of the reasons we should take care of the problem for text document analysis. In this paper, we apply patent data to text big data. The patent data also have the zero-inflated problem as other text data do. Since a patent is a document that contains the results of a developed technology in detail, we could forecast future technologies and make research and development (R&D) planning for management of technology (MOT) from the patent data analysis.
Various studies have been conducted to solve the zero-inflated problem [3,4], and zero-inflated models suggested popular approaches to modeling the data with excess zeros [1]. They used probability distributions such as Poisson and negative binomial distributions for the zero-inflated data modeling and separated given data into two components with zeros and non-zeros [5,6]. However, if there are too many zero values in the data, the performance of the suggested zero-inflated models deteriorates. Since most of the patent data in these studies have too many zero values, they are difficult to analyze [2]. Therefore, other approaches are needed to overcome the zero-inflated problem in the patent data analysis. We try to generate synthetic data from given original patent data using statistical machine learning methods. To verify the improved performance of our method, real patent documents and simulation data are used and experiments are conducted. The experimental results are compared between comparative models to confirm the validity of the proposed method. In the next section, research backgrounds will be illustrated such as patent data analysis and the zero-inflated problems in the text data. The proposed method and experimental results are shown in Section 3 and Section 4, respectively. The contribution and conclusions of our study are provided and possible future works of our research are represented in the last section.
2. Research Background
2.1. Patent Data
Patent documents contain the results of developed technology as some formats of title, abstract, inventors, applied date, claims, drawings, international patent classification (IPC) codes, citations, etc. [7,8]. Since patent data are also typical text documents, we must first perform preprocessing of the patent documents for patent analysis using statistics and machine learning algorithms [9,10]. In general, we use text mining techniques for the preprocessing of the patent document data [11]. We used the R data language and packages for the text mining [12,13,14]. Figure 1 shows structured patent data after the preprocessing of a patent document.
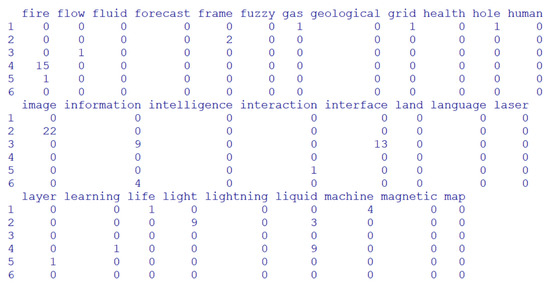
Figure 1.
Part of structured patent data.
In Figure 1, the structured patent data are a patent-word matrix consisting of patent and word in rows and columns, respectively. The elements of the matrix are frequent values of word counts occurring in each patent document. As shown in Figure 1, most elements are zero because the number of words is much larger than the number of patents. This is called the zero-inflated problem [5] when it has too many zero counts. The zero-inflated problem causes a reduction of the performance of predictive models in the patent data analysis. We should overcome this problem to improve model performance.
2.2. Zero-Inflated Problems in Text Data
Various methods related to zero-inflated data analysis have been suggested to model frequency data with excess zeros [1,5,6]. A popular approach to zero-inflated data is to consider a separate component that increases the probability of a zero [1];
where is a base frequency (count) density function and represents the proportion of zeros. We try to reduce the effect on the zero-inflated problem by making smaller as increases. According to probability distributions, there are several types of the zero-inflated models, such as zero-inflated Poisson (ZIP) or zero-inflated negative binomial (ZINB) models. For example, the ZIP model is defined as [1,5,6]:
where is a parameter of the Poisson distribution. That is, it uses the Poisson distribution for base density function in the zero-inflated model (1). In the ZINB model, negative binomial distribution is used for the base density function in Equation (1). The ZIP and ZINB models will be compared to our proposed method based on a synthetic sample generation for the zero-inflated patent data analysis.
3. Methods
In this paper, a new method is proposed to overcome the zero-inflated problem in patent data analysis. The problem mainly occurs during the preprocessing of patent document data. Figure 2 shows a process of patent data preprocessing and analysis.
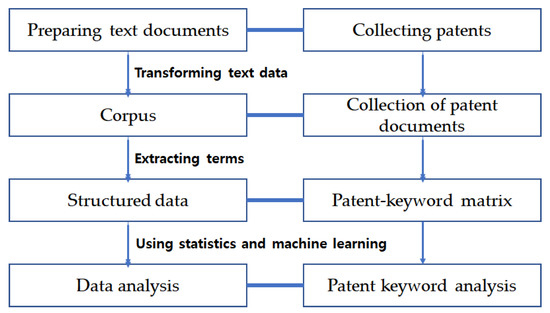
Figure 2.
Patent data preprocessing and analysis.
The left flow chart shows the general text mining process and the corresponding procedure of our patent data preprocessing and analysis is on the right. First, we collected patent data related to target technology such as artificial intelligence (AI) or internet of things (IoT) from various patent databases in the world. Patent is a text document containing the results of developed technology such as title, abstract, claims, international patent classification (IPC) codes, etc. [7,8]. Using the patent title and abstract, we built a corpus that was a collection of patent documents. Next, we extracted terms from the patent corpus and selected patent keywords in the terms. Consequently, we built structured data that are a patent-keyword matrix. Its rows and columns represent the patent and keyword, respectively. Each element of this matrix is an occurring frequent value of a keyword in a patent document. This matrix has been used for the patent keyword analysis by various methods based on statistics and machine learning algorithms.
In general, the number of keywords is much larger than the number of patent documents. Since we might have the zero-inflated problem in the matrix, we propose a method to overcome the problem in the patent-keyword matrix. We provide an approach to the management and analysis of zero-inflated data using synthetic sample generation. The synthetic data have been used to create data that mimic the characteristics of original data while protecting personal information in medical data [15]. In our research, we provide a method of synthetic sample generation for zero-inflated data analysis. There are diverse methods to generate synthetic data. Variational autoencoder (VAE) and generative adversarial network (GAN) are popular deep learning algorithms for generating synthetic data [16]. Since the VAE and GAN have been mainly used to generate the synthetic data in a field of imaging, these methods are hardly applied to synthetic data generation for patent keyword analysis. In particular, because image data consist of pixel values ranging from 0 to 255, most of the data are not zero values. In contrast, since most values of patent keyword data are zeros, data learning of VAE or GAN may be distorted by zero values. If we use VAE or GAN to generate synthetic data from patent keyword data, we need an additional effort to solve the problem of the distortion of data learning by zero value. Therefore, we consider another method for generating synthetic data rather than the VAE and GAN. Figure 3 shows our proposed method for the analysis of zero-inflated data as a whole.

Figure 3.
Proposed method for zero-inflated data analysis.
In Figure 3, patent documents are transformed to a patent-keyword matrix by the text mining techniques. The matrix could be zero-inflated data because most of its elements are zeros. We generate synthetic data from the matrix to overcome the zero-inflated problem. Synthetic data generation is performed by two approaches, parametric and nonparametric models [15]. The parametric models generate synthetic data by considering all variables at the same time. We have difficulties in generating synthetic data using the parametric models because the number of keywords used as variables in the patent data is very large. Moreover, in the parametric method, it is necessary to obtain the posterior distribution that generates the synthetic data, but in some cases, it is difficult to obtain the posterior distribution. Because of this problem, recently, research on a nonparametric method is being conducted. So, we also study a nonparametric model for synthetic data generation. A classification and regression trees (CART) model is a nonparametric method to generate synthetic data. Since it has the strength to minimize information loss in the process of synthesis [15,17,18,19,20,21], the CART is used efficiently for generating synthetic samples. CART is a decision tree method for predictive modeling tools in data analysis for regression and classification [22]. It partitions the input space recursively and defines regions of divided input space by the objects included in each region [23,24]. A synthetic sample of count data (frequency of keyword occurred in patent) is generated using regression and classification costs for patent keywords. First, the regression cost is computed as Equation (3) [23];
where is the mean of the response keyword and m is data in tree node. Second, the classification cost is defined as Equation (4) [23].
where is the probability of data objects in nodes belonging to class . This classification cost could be determined as the Gini index [23]. The cost functions are used to generate synthetic samples using CART and the synthesizer is used based on CART to generate the synthetic data from the patent-keyword matrix. The data consist of n sample units;
where is unchanged patent data and is a synthesized data that is matrix with p keywords. The row size of the original data and the synthetic data are set to be same. Patent-keyword matrix is assumed as a sample from a population with parameters estimated by synthesizer, . The synthesizer is sampled from g where g is a probability distribution function and is a parameter vector. We defined the joint distribution as a sequence of conditional distributions. Figure 4 shows the sequential modeling of the CART method to generate synthetic patent data.
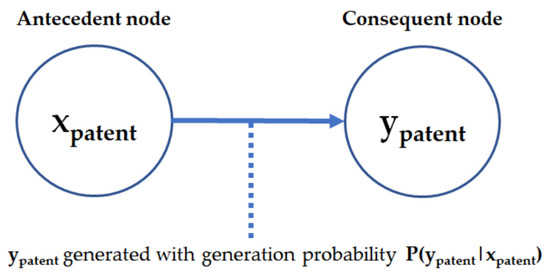
Figure 4.
Sequential modeling of CART method to generate synthetic patent data.
In Figure 4, a selected keyword is distributed by the conditional probability density and estimated by . The distributions of the next selected keywords are estimated by conditional distribution given by and the previous keywords of . Each patent of synthetic samples is generated from the distribution conditional on . The parameters of the conditional distribution are the synthesized values of the previous keywords of . In another way, the synthetic values are generated from the posterior distribution of the parameters. Figure 5 illustrates our proposed methods for generating synthetic samples.
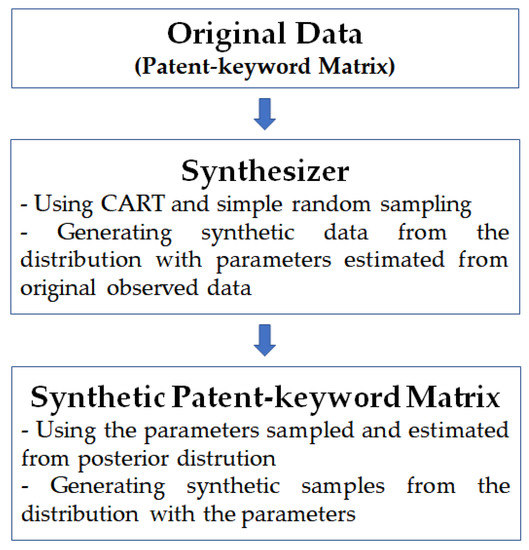
Figure 5.
Generating synthetic samples from patent-keyword matrix.
In Figure 5, the synthesizer generates a synthetic patent-keyword matrix from original patent-keyword matrix using CART and simple random sampling. Additionally, the synthetic samples are generated by the parameters sampled and estimated from posterior distribution. To evaluate the model performance of zero-inflated data analysis, four popular tests are commonly performed. They are the boundary likelihood ratio test, Vuong test, Bayesian information criterion (BIC), and Akaike information criterion (AIC) [1,5,6]. We used AIC to compare synthetic sample generation to other methods because AIC is based on a log-likelihood function to evaluate the output of statistical models [1,5,6]. The AIC is shown as [22,23,25]:
where is a log-likelihood and is the number of parameters from a given model. The smaller AIC represents the better model performance. In the next section, we will use AIC to compare the method of synthetic sample generation to others.
4. Results
4.1. Experimental Result Using Patent Big Data
To show the performance and validity of our method, we conducted experiments using the text data of patent documents related to disaster prevention technology. We retrieved the patent data from the patent databases of the United States Patent and Trademark Office (USPTO) and the Korea Intellectual Property Rights Information Service (KIPRIS) [26,27]. We accessed the databases and retrieved the patent documents issued from 2000 to 2020. We mainly collected patent documents from KIPRIS and supplemented the collection results of KIPRIS using the USPTO search results. We used the R data language and its various packages for data preprocessing and analysis [12,13,14]. We obtained 16,875 patents through the valid patent selection process. Using the text mining techniques we extracted 162 keywords from the valid patent documents. For the experiment, we selected four keywords, fire, temperature, wind and pressure, among all keywords. Therefore, the data have 16,875 patents and the four keywords as a matrix format. We found that the sparsity of this matrix is 0.9369. That is, 95% of all elements of this matrix are zero values. The descriptive statistics of four keywords are shown in Table 1.

Table 1.
Descriptive statistics of four keywords.
The minimum and median of all keywords are both zero. The statistics in Table 1 and the sparsity of the data matrix show the zero-inflated problem. We applied various analysis methods including synthetic sample generation to the patent data that had the zero-inflated problem. In this experiment, we considered the following linear model:
Table 2 shows the performance evaluation results between the compared models. It has parameter estimates and their standard errors of each explanatory keyword. The AIC in Equation (6) of each method is shown in the last column. We applied six methods to analyze the zero-inflated patent data.
Table 2.
Performance evaluation between comparative methods (patent keyword data).
Our first approach is to apply the linear model in Equation (7) to the original data having the zero-inflated problem. Next, we illustrate the analysis results of datasets with some noise added. The noise addition model has the following linear model structure,
where X and Y are patent keywords, is added noise having a normal distribution with mean = 0 and variance = , and is an error term normally distributed with mean = 0 and variance = . In our experiment, the noises were generated with the standard deviation (SD) = 0.1, 0.5 or 1. There are almost no differences among the parameter estimations for the three datasets with the noises, and also no significant difference in the AICs. The ZIP and ZINB models were carried out for the data analyses as well. They are the most common zero-inflated models and they were introduced to analyze zero-inflated data in previous research [2,28]. Lastly, we used the synthetic samples by generating synthetic data of the original dataset. Since the model using synthetic samples is the smallest AIC, it is the best method for analyzing the zero-inflated data among the comparative models.
4.2. Simulation Study with Zero-Inflated Data
We obtained our simulation data by generating random numbers from multivariate Poisson distribution. The process for the generation of multivariate generalized Poisson data consists of two steps as follows [14,29,30,31,32,33]:
(Step1)
(Step2)
where is the probability function of the Poisson distribution with mean = . In our simulation study, we generated four variables () by Steps 1 and 2. In this simulation study, we used the R data language and a package provided by R for simulation data generation [14,31]. We performed two simulations with different means and correlation structures. Table 3 shows the parameter settings.
Table 3.
Correlation structure for simulation data.
The data size of each simulation is 20,000. The correlation coefficients in simulation 1 are larger than those in simulation 2. In addition, the mean values of two simulation data are different. Table 4 illustrates the descriptive statistics of simulation data.
Table 4.
Descriptive statistics of simulation data.
Table 4 represents descriptive statistics of the variables with variances and correlation coefficients from each simulation datapoint. It shows the difference of statistics between two simulation data such as the parameter settings. Next, we illustrate the results of performance evaluation between comparative methods using simulation datasets. Table 5 shows the simulation result using the highly correlated simulation data 1.
Table 5.
Performance evaluation between comparative methods (simulation data 1 with high correlation).
In our simulation study, we used four variables () to build a linear model as:
The is a response variable and the others are explanatory variables in the simulation model. As in Table 2, Table 5 shows the parameter estimations of each explanatory variable with their standard errors and AIC for each method as well. We knew the AIC of the zero-inflated models are smaller than that of models with original and noise-added data from Table 2. In addition, the synthetic sample had the smallest AIC among the comparative models. It is confirmed that the model by synthetic samples also has the best performance in all zero-inflated text data analyses by the simulations. Table 6 represents the performance evaluation result of simulation data 2 with the lower correlations.
Table 6.
Performance evaluation between comparative methods (simulation data 2 with low correlation).
We also found that the AIC of the synthetic sample is the smallest in all comparative methods. Therefore, we could confirm the good performance of the proposed method using synthetic samples.
5. Conclusions
A new method is studied to solve the zero-inflated problem in the patent data analysis. We considered an approach based on synthetic data generation to zero-inflated data analysis. In particular, we focused on the patent data analysis with the zero-inflated problem. Using text mining techniques, the patent documents are preprocessed to a patent-keyword matrix for patent analysis based on statistics and machine learning algorithms. Each element of this matrix represents the frequency value of a keyword occurring in each patent document. In general, many elements are zeros because the number of keywords is much larger than that of patents. This is the zero-inflated problem. If there are too many zero values in the given data, the performance of the predictive model deteriorates. To solve this problem, we proposed a method of synthetic sample generation from an original given patent-keyword matrix. We compared the proposed method with other common methods such as zero-inflated Poisson and negative binomial models using the AIC as a criterion of performance evaluation between comparative methods. We conducted experiments using the patent documents related to disaster prevention technology and zero-inflated data simulated from multivariate Poisson distribution. From the experimental results, we found that our proposed method has an improved performance and validity, comparing the AICs among the comparison models. The zero-inflated problem appears in various big data analysis fields, and it causes performance degradation of predictive models based on statistics and machine learning algorithms. In our research, we applied the synthetic data generation by CART and random sampling and confirmed the improved performance of this method using real patent documents and simulation data. Furthermore, we can consider more advanced approaches to synthetic data generation using generative deep learning algorithms such as VAE or GAN. However, most previous applications of VAE and GAN focused on image data rather than count data.
The practical advantage of our proposed method is that we propose a new method to solve the zero-inflated problem that occurs in the patent keyword analysis process. Using the proposed method, a technology analysis model with improved explanatory power can be built, and the analysis results will be used for technology management such as R&D planning and technology roadmapping. In this paper, we analyzed the patent keywords for technology analysis. We can also consider the technological phrases as well as patent keywords for technology analysis. We think this is an important task related to our research. So, we will consider a study on developing an analytical model of phrase data using diverse methods such as a topic model. We have added this study to our future works. We will also study the modification of VAE and GAN methods for overcoming the zero-inflated problem in text big data analysis as well as patent keyword data analysis.
Author Contributions
D.U. designed this research and collected the dataset for the experiment. S.J. analyzed the data to show the validity of this paper and wrote the paper and performed all the research steps. In addition, all authors have cooperated with each other in revising the paper. All authors have read and agreed to the published version of the manuscript.
Funding
This research received no external funding.
Institutional Review Board Statement
Not applicable.
Informed Consent Statement
Not applicable.
Data Availability Statement
Not applicable.
Conflicts of Interest
The authors declare no conflict of interest.
References
- Cameron, A.C.; Trivedi, P.K. Regression Analysis of Count Data, 2nd ed.; Cambridge University Press: New York, NY, USA, 2013. [Google Scholar]
- Kim, J.M.; Jun, S. Zero-Inflated Poisson and Negative Binomial Regressions for Technology Analysis. Int. J. Softw. Eng. Appl. 2016, 10, 431–448. [Google Scholar] [CrossRef]
- Feng, C.X. A comparison of zero-inflated and hurdle models for modeling zero-inflated count data. J. Stat. Distrib. Appl. 2021, 8, 8. [Google Scholar] [CrossRef]
- Carvalho, F.J.; de Santana, D.G.; Sampaio, M.V. Modeling overdispersion, autocorrelation, and zero-inflated count data via generalized additive models and Bayesian statistics in an Aphid population study. Neotrop. Entomol. 2020, 49, 40–51. [Google Scholar] [CrossRef]
- Hilbe, J.M. Negative Binomial Regression, 2nd ed.; Cambridge University Press: Cambridge, UK, 2011. [Google Scholar]
- Hilbe, J.M. Modeling Count Data; Cambridge University Press: New York, NY, USA, 2014. [Google Scholar]
- Hunt, D.; Nguyen, L.; Rodgers, M. Patent Searching Tools & Techniques; Wiley: Hoboken, NJ, USA, 2007. [Google Scholar]
- Roper, A.T.; Cunningham, S.W.; Porter, A.L.; Mason, T.W.; Rossini, F.A.; Banks, J. Forecasting and Management of Technology; John Wiley & Sons: Hoboken, NJ, USA, 2011. [Google Scholar]
- Kim, S.; Yoon, B. Patent infringement analysis using a text mining technique based on SAO structure. Comput. Ind. 2021, 125, 103379. [Google Scholar] [CrossRef]
- Wang, H.C.; Chi, Y.C.; Hsin, P.L. Constructing patent maps using text mining to sustainably detect potential technological opportunities. Sustainability 2018, 10, 3729. [Google Scholar] [CrossRef] [Green Version]
- Feng, X.; Fuhai, L. Patent Text Mining and Informetric-based Patent Technology Morphological Analysis: An Empirical Study. Technol. Anal. Strateg. Manag. 2021, 24, 467–479. [Google Scholar] [CrossRef]
- Feinerer, I.; Hornik, K.; Meyer, D. Text mining infrastructure in R. J. Stat. Softw. 2008, 25, 1–54. [Google Scholar] [CrossRef] [Green Version]
- Feinerer, I.; Hornik, K. Package ‘tm’ Ver. 0.7–8, Text Mining Package. Available online: https://cran.microsoft.com/web/packages/tm/tm.pdf (accessed on 1 March 2022).
- R Development Core Team. R: A Language and Environment for Statistical Computing, R Foundation for Statistical Computing. Available online: http://www.R-project.org (accessed on 1 March 2022).
- Nowok, B.; Raab, G.M.; Dibben, C. synthpop: Bespoke Creation of Synthetic Data in R. J. Stat. Softw. 2016, 74, 1–26. [Google Scholar] [CrossRef] [Green Version]
- Goodfellow, I.; Bengio, Y.; Courville, A. Deep Learning; MIT Press: Cambridge, MA, USA, 2016. [Google Scholar]
- Han, J.; Kamber, M.; Pei, J. Data Mining: Concepts and Techniques, 3rd ed.; Morgan Kaufmann: Waltham, MA, USA, 2012. [Google Scholar]
- Nowok, B.; Raab, G.M.; Snoke, J.; Dibben, C.; Nowok, M.B. Package ‘synthpop’ Ver. 1.7–0, Generating Synthetic Versions of Sensitive Microdata for Statistical Disclosure Control. Available online: https://cran.r-project.org/web/packages/synthpop/synthpop.pdf (accessed on 1 March 2022).
- Raab, G.M.; Nowok, B.; Dibben, C. Practical Data Synthesis for Large Samples. J. Priv. Confid. 2018, 7, 67–97. [Google Scholar] [CrossRef] [Green Version]
- Reiter, J.P. Using CART to Generate Partially Synthetic Public Use Microdata. J. Off. Stat. 2005, 21, 441–462. [Google Scholar]
- Snoke, J.; Raab, G.M.; Nowok, B.; Dibben, C.; Slavkovic, A. General and specific utility measures for synthetic data. J. R. Stat. Soc. Ser. A 2018, 181, 663–688. [Google Scholar] [CrossRef] [Green Version]
- Bruce, P.; Bruce, A.; Gedeck, P. Practical Statistics for Data Scientists; O’Reilly Media: Sebastopol, CA, USA, 2020. [Google Scholar]
- Murphy, K.P. Machine Learning: A Probabilistic Perspective; MIT Press: Cambridge, MA, USA, 2012. [Google Scholar]
- Theodoridis, S. Machine Learning A Bayesian and Optimization Perspective; Elsevier: London, UK, 2015. [Google Scholar]
- Montgomery, D.C.; Peck, E.A.; Vining, G.G. Introduction to Linear Regression Analysis; John Wiley & Sons: Hoboken, NJ, USA, 2012. [Google Scholar]
- USPTO, The United States Patent and Trademark Office. Available online: http://www.uspto.gov (accessed on 1 March 2022).
- KIPRIS, Korea Intellectual Property Rights Information Service. Available online: www.kipris.or.kr (accessed on 1 March 2022).
- Jun, S.; Park, S.; Jang, D. Document Clustering Method Using Dimension Reduction and Support Vector Clustering to Overcome Sparseness. Expert Syst. Appl. 2014, 41, 3204–3212. [Google Scholar] [CrossRef]
- Amatya, A.; Demirtas, H. Simultaneous generation of multivariate mixed data with Poisson and normal marginals. J. Stat. Comput. Simul. 2015, 85, 3129–3139. [Google Scholar] [CrossRef]
- Amatya, A.; Demirtas, H. PoisNor: An R package for generation of multivariate data with Poisson and normal marginals. Commun. Stat. Simul. Comput. 2017, 46, 2241–2253. [Google Scholar] [CrossRef]
- Li, H.; Demirtas, H.; Chen, R. RNGforGPD: An R Package for Generation of Univariate and Multivariate Generalized Poisson Data. R J. 2020, 12, 173–188. [Google Scholar] [CrossRef]
- Li, H.; Chen, R.; Nguyen, H.; Chung, Y.; Gao, R.; Demirtas, H. Package ‘RNGforGPD’ Ver. 1.1.0, Random Number Generation for Generalized Poisson Distribution. Available online: https://cran.r-project.org/web/packages/RNGforGPD/RNGforGPD.pdf (accessed on 1 March 2022).
- Vernic, R. A multivariate generalization of the generalized Poisson distribution. ASTIN Bulletin. J. Int. Actuar. Assoc. 2000, 30, 57–67. [Google Scholar]
Publisher’s Note: MDPI stays neutral with regard to jurisdictional claims in published maps and institutional affiliations. |
© 2022 by the authors. Licensee MDPI, Basel, Switzerland. This article is an open access article distributed under the terms and conditions of the Creative Commons Attribution (CC BY) license (https://creativecommons.org/licenses/by/4.0/).