1. Introduction
This study aims to investigate the associations between the paintings of Renaissance art that have been uploaded to the Europeana database. Towards this end, we are making use of Europeana’s Search API and EuropeanaR package, a package that was created in order to provide an interface between Europeana and the R language, which is the language used to extract, manage and handle datasets from a statistical and machine learning perspective. The basis for our study is the Europeana’s database and the paintings that have been uploaded and have a description in the English language and were created between the 14th and the 17th centuries, which is the time period that in general is well-known as the European Renaissance. For our study, we also included post-Byzantine art as an integral part of the Renaissance and not a separate movement that took place at the same time in different countries.
Since the Renaissance was a broad movement in many aspects of life, it is difficult to define its exact limits. There is widespread agreement that the term Renaissance refers to a substantial and persistent change in art, culture, politics and society between 1400 and 1600 [
1]. Art historians typically consider the Renaissance to have begun in the 13th century with the work of Giotto and Cimabue and to have ended in the late 16th century with Michelangelo and Venetian painters such as Titian. On the other hand, literary academics in the Anglo-American world view the growth of vernacular English literature in the 16th and 17th centuries through the poetry and drama of Spenser, Shakespeare and Milton from a totally different angle. Again taking a different approach, historians designate the period c. 1500–1700 as “early modern” as opposed to “Renaissance” [
1]. Although there is substantial controversy concerning the real beginnings of the Renaissance, it is usually regarded to have begun in Italy during the 14th century, after the end of the Middle Ages, and reached its height in the 15th century. Throughout the rest of Europe, it expanded in the 16th and 17th centuries [
2]. For our study, we are using the 14th to the 17th century, which covers the extensive span of all periods under consideration.
In this study, we investigate the application of topic modeling and particularly Latent Dirichlet Allocation (LDA) to collections of cultural heritage descriptions in order to aid cultural heritage research. Yang et al. [
3] also performed similar research on historical newspapers. Our study focuses on metadata related to cultural heritage. Chen and his team [
4] present techniques for analyzing and visualizing document information in order to provide insights into the evolution of collaborations utilizing topic modeling.
This paper consists of four distinct sections. The section that follows performs a literature review on the basic notions of the paper such as: Europeana, Linked Open Data, Semantic Web, Knowledge Graph and the Renaissance.
Section 3 details the methodology of our study and
Section 4 presents the results of the study. The paper concludes with a general discussion about the findings and our next steps.
2. Literature Review
Despite the difficulty in defining its chronological borders, it is undeniable that the Renaissance has long been acknowledged as a dazzling period in the evolution of Western culture [
5]. As a movement, the Renaissance affected many fields such as art, science, philosophy, literature, music and even politics and religion. Although it was an attempt to break away from classical art and to affiliate art with more emotion, it still did not diverge thematically from religion, but in fact quite the opposite. Many masterpieces of the period are closely related to religion and were patronized by art. In fact, in the field of philosophy during this period, God-related themes flourished in a variety of forms. Each of these methods merits a thorough diachronic presentation [
6]. We also notice that there was religious discord and debate during the Renaissance, which is made obvious even in some painting details. For instance, in Hans Holbein’s painting, The Ambassadors, at the left right corner we can see behind the curtain a silver crucifix, a detail implying this debate [
1].
The change in aesthetic thought between 1400 and 1600 occurs initially as a collection of a few grand ideas about mimesis, composition, mental labor and the social status of the artist that are formed in a few great thinkers in fourteenth-century Florence and then slowly diffused, diluted and reworked by other minds elsewhere and later [
7]. Hulse [
7] also notes that what we need to take into account is that the transition between the medieval ages and the Renaissance did not just happen overnight. As the act of painting and the painters’ habits were changing, the painting treatise had to adopt a new, humanist shape [
7]. The Renaissance is an era in which cultural, scientific and technological thinking advanced, but at the same time, religious intolerance, political ignorance and inequalities increased [
1].
The European Renaissance, though, coincides chronologically with post-Byzantine art: Orthodox art that came to the foreground after the fall of Constantinople in 1453 [
8]. Although scholars usually think of European Renaissance and post-Byzantine art as two different movements, Lymperopoulou and Lemos [
8] suggest that post-Byzantine art is an integral part of the European Renaissance. In fact, Italian painting of the 13th and 14th century embraced an element of Byzantine art, which was the way religious images were depicted, in order to offer more empathy [
8]. Setton [
9] also notes the impact the Byzantine background had on the Renaissance, since it played a major role in humanism, a basic aspect of the Renaissance.
As a consequence of the broad time span the Renaissance includes, there are many art and cultural heritage artefacts associated with it. Many of them are gathered and exhibited in well-known and highly esteemed museums, not only in physical form but also online. Many museums are sharing their content online, but there are also digital libraries, combining data from different institutions. One such library is Europeana that offers access to more than 58 million cultural heritage items from approximately 4000 institutions across Europe [
10]. Europeana contributes to a culturally transformed Europe, one that leverages technology to create an “inclusive digital society” that provides economic and social benefits for Europe [
10]. Europeana utilizes Linked Open Data (LOD), to make its content available and accessible to everyone.
The web, as a medium of worldwide communication and information sharing, has undergone continual development since its birth [
11]. As the web expanded and information became vast but also predominant, a necessity for machines to be able to understand the data emerged in the form of the Semantic Web. The Semantic Web is a form of web content that has a meaning for computers and not only to humans [
12]. According to its visionaries, people will realize Semantic Web’s real potential when they create numerous programs that collect Web content from various sources, process the information and exchange the results with other programs [
12]. The Semantic Web consists of formal ontologies and annotations. Formal ontologies provide domain-specific background knowledge as a shared vocabulary that describes abstract object classes, predicate classes and their interdependencies via formalized logical statements. Annotations of web resources with statements that can be read and interpreted by machines using common ontological knowledge present instantiated real-world observations [
13]. The Semantic Web promotes and supports the utilization of web-accessible data [
14]. In other words, the Semantic Web is a web of data. The World-Wide Web has produced a sharing and dissemination of data on an unparalleled scale [
15]. In order to make the Web of Data a reality, it is essential that the vast amount of data on the web should be accessible and controllable by Semantic Web technologies in a consistent format. For establishing a Web of Data, not only must the Semantic Web have access to data, but also the associations between data must be made accessible. This collection of interconnected datasets on the internet is also known as Linked Data.
The term Linked Data was coined by Tim Berners-Lee [
16]. It refers to a method of publishing and interlinking structured data on the web, and Linked Data aspire to make it as easy to share structured data on the Web as it is to exchange documents today. Tim Berners-Lee [
8] asserts, “Similar to the hypertext web, the web of data is composed of web documents. However, unlike the web of hypertext where links are anchors for relationships in hypertext texts expressed in HTML, for data they are links between arbitrarily defined items”. Similar to Linked Data, we also have Linked Open Data [
11]. The difference is that the latter have open license. Khusro et al. [
14] also give emphasis to the fact that not all Linked Data are open and not all Open Data are linked. A better and more versatile way to make structured data accessible on the Web is through a Web API, which provides straightforward HTTP query access to structured data [
14].
Linked Open Data have been used in the past as a basis for knowledge extraction. Vila-Suero et al. [
17] proposed a method for extracting topics from the lexical contexts of a set of ontologies and annotating them with external senses connected to the Linked Open Data cloud. The combination of Linked Open Data and topic modeling has been employed in recommendation frameworks for expanding the user query [
18] or the user film choices [
19] with similar or related items from the same topic.
The web is given additional structure by its hyperlinks; the network of these links is a rich source of hidden information [
15]. Metadata implementation and harvesting are essential to the success of the Semantic Web [
20]. Metadata can be defined as the “data about data” [
21]. If, for instance, an image is a piece of a data collection, details about the time it was shot, the camera that was used and the settings are the images metadata. Gartner et al. [
21] divide metadata into three types: descriptive, administrative and structural. Descriptive metadata are the ones we are more familiar with and they refer to these metadata that describe and help us discover the data. Administrative metadata are essential in order to keep a system running. These metadata ensure that a piece of data is stored, maintained and accessed. Structural metadata are the information that creates connections between little pieces of data in order to assemble a more complex item. For instance, in an e-book system, it is the information that “orders” the book to read page one, before page two and this before page three [
21]. Europeana is a valuable source of mainly descriptive metadata, since it includes a number of details about each piece of data. Hence, for instance, for a painting we can find details such as the year of creation, its creator, etc.
According to Fensel et al. [
22], a graph is a structure consisting of a collection of objects in which some pairwise relationships exist. Since the same object can syntactically and semantically occur multiple times in our graph, this definition must be somewhat modified to accommodate multi-sets. The term knowledge graph has been widely used in research and business, typically in conjunction with Semantic Web technologies, Linked Data, large-scale data analytics and the cloud [
23], but there is no common definition on what forms a knowledge graph [
24]. Paulheim [
25] argues that a knowledge graph primarily describes real-world entities and their interrelations organized in a graph that defines possible classes and relations of entities in a schema, allows for potentially interrelating arbitrary entities with each other, and covers a variety of topical domains. A knowledge graph acquires and integrates data into an ontology, then applies a reasoner to derive new knowledge [
23].
In the context of modern data representation, graph-like structures stand out because they enable the integration of data from multiple sources. In addition, clustering algorithms are applied on top of graphs to group data based on their pertinent qualities and disclose important information [
24]. Clustering is a field of research that identifies and reveals known and unknown clusters in datasets. It seeks to partition a dataset into distinct groups of similar entities based on the qualities of the entities [
24]. Han et al. [
26] describe cluster analysis, or clustering, as the process of dividing a collection of data items into subsets. Each subset constitutes a cluster, with objects inside a cluster being similar to one another but dissimilar to those in other clusters. Given that the Europeana Collections are a rich informative source, with much metadata and many descriptions of art objects, it is possible to take advantage of this information and provide a meaningful way to organize digital objects and their associated metadata. For this purpose, we rely solely on the textual description provided by a Europeana collection and apply a topic modeling approach, which results in a list of topics covered by associated words. These words can then be used to retrieve the respective digital objects and create clusters following the topics created by topic modeling.
Our study focuses on Europeana datasets related to painting during the 14th, 15th, 16th and 17th centuries.
The study focuses on answering two central research questions:
Is it feasible to data mine and statistically analyze information from Europeana on a large scale using automation; what are the challenges of such an endeavor and what tools can be used to achieve this?
Do associations between paintings of the 14th–17th centuries available in the Europeana Collections exist and to what extent? What conclusions can be drawn based on these associations as identified through data analysis?
The advanced methodology presented in detail in the following section and used to aggregate and analyze information available in the Europeana platform is a major contribution of this research. Beyond this, the study presents an example of using this methodology to study the landscape of associations between the various paintings of the Renaissance era discovered in Europeana through data analysis.
3. Methodology
For our research we conducted topic modeling, using the R language in order to collect and analyze data from the Europeana Search API. R is a programming language and environment for statistical computing and data visualization. It is a GNU project similar to the S language and environment that was developed by John Chambers and colleagues at Bell Laboratories [
27]. R has excellent facilities to interact with Europeana APIs such as the EuropeanaR package [
28].
Our research was conducted in three stages. During the first stage, we utilized the Search API to find paintings from the 14th, 15th, 16th and 17th centuries. In the second stage, we proceeded to perform data mining, using the R language, and in the third and last stage, we concluded with learning a topic model from the collection. Topic modelling is a machine learning technique that discovers automatically latent semantic patterns (i.e., subjects made of a set of words) in a collection of documents. This is known as unsupervised machine learning because no categories are predefined or observed (topics). Topic models hold enormous potential as a method for extracting meaningful insights from the text databases that are currently accessible to social scientists [
29].
For our study we used the Latent Dirichlet Allocation (LDA), one of the most common algorithms for topic modelling, which has been widely utilized for text mining in numerous industries (Albuquerque, P., do Valle, D.R., & Li, D. Bayesian LDA for mixed-membership clustering analysis: the Rlda package). It is a three-level hierarchical Bayesian model, a generative probabilistic model for discrete data collections, such as text corpora [
30]. In this model, each item of a collection is modeled as a finite mixture across an underlying set of topics [
30]. In turn, each topic is modeled as an infinite mixture over a collection of topic probabilities. The topic probabilities give an explicit representation of a document in the context of text modeling [
30]. LDA is implemented by an easy application of de Finetti’s representation theorem because it is based on a simple exchangeability assumption for the words and themes within a document [
30]. According to de Finetti’s theorem, the probability of a sequence of words and topics must have the following form:
LDA was used for our research as a probabilistic method that discovers a set of underlying topics in an automatic way, represented by word distributions, in texts. Thus, texts are viewed as a distribution across topics. In an LDA model, words can be represented as a vector of topic contributions. Latent Semantic Analysis (LSA), a fully automated method that extracts meaning representations in the form of latent concepts, was also considered. In a semantic space derived from the LSA, words are represented as vectors. The dimensions of this space are concepts that are latent. Vector algebra is used to compute the similarity of individual words and texts [
29]. LDA has a conceptual benefit over LSA in that it directly expresses many meanings of a term, whereas LSA does not [
31]. Another model under consideration was word vectors that vectorize each word, but we preferred to focus on topic modeling.
Europeana’s Search API allows the user to search for key-words, using either simple or more advanced queries. The user can choose to include or filter out results, or to choose results from a certain language. For our data gathering, we used R version 4.1.3 and the library EuropeanaR, a package that was created specifically for this project and aims to provide tools to access Europeana’s Linked Open Data [
28]. With this package, we have the ability to interact with all Europeana’s APIs. The interaction with the package is taking place using HTTR in the backend to harvest and collect data [
32].
The query used to download the data was:
query <- "(when:17 OR when:16 OR when:15 OR when:14)"
res_bulk <- tidy_cursored_search(query, qf = "what:painting", max_items = Inf)
The objective of the query is to filter the Europeana content first by period (14th to 17th century) and then to identify painting objects in these results.
The data were collected by utilizing Europeana’s Search API in a hierarchical structure in JSON format, and using EuropeanaR facilities we transformed them into a tidy format [
33]. For the transformation from JSON to an R object we used jsonlite, an R package that consistently maps JSON data structures into R objects [
34]. Since our study included only data that are public, we did not need explicit permission from the institutions that uploaded the metadata and furthermore, due to the fact that our study does not handle or reproduce the actual data (i.e., we do not modify the images of paintings and we do not post them to a different site), but focuses only on the metadata, which we process as explained in the following, copyrights are not of importance. As mentioned above, the Renaissance is a broad movement including many sectors and fields. Our study focuses on paintings in order for our topics to have a common place of reference. However, since it is difficult to limit search results if you do not include specific search terms (e.g., artists’ names), we also included post-Byzantine art as part of the European Renaissance. Furthermore, since a topic modeling analysis would have grouped words from different languages to different clusters and thus topic detection would be based on language and not on actual themes, we decided to include only the paintings that have been uploaded in the English language. Indeed, during our initial testing, it was made apparent that the resulting topics when multilingual descriptions are employed were completely different.
After concluding with data collection and extraction of textual descriptions, we proceeded to the application of topic modeling to the collected textual data. Topic modeling is an unsupervised machine learning technique that takes as input a set of documents and learns a statistical model from it. Its primary objective is to identify clusters or groups of comparable subjects (i.e., words) within texts. It is considered as one of the most effective text mining techniques for data mining, discovery of latent data, and the identification of correlations between data and text documents [
35]. For this study, as mentioned above, we utilized the Latent Dirichlet Allocation (LDA). LDA is an unsupervised machine learning technique that analyzes document collections and creates themes based on patterns [
36]. Unsupervised machine learning techniques are descriptive tools that can help researchers to better understand the dataset at hand, by extracting frequent or repetitive patterns. In the case of text collections, unsupervised machine learning techniques such as document clustering or text extraction, can be used to create groups of highly similar documents or textual summaries for long documents or group of documents, respectively. LDA aims at finding concise descriptions of a collection’s elements, usually consisting of words extracted from the descriptions. This technique allows for efficient processing of large collections while preserving the essential statistical relationships that are useful for fundamental tasks, such as classification, novelty detection, summarization, similarity and relevance judgments [
30].
Our search returned approximately 17,000 results to us. This was the bulk download. Since we wanted only the English language descriptions, we used the CLD2 to filter out non-English languages and this also had the benefit of filtering out noisy results that would have otherwise been classified as NA. CLD2 is an R wrapper for Google’s Compact Language Detector [
37]. This resulted in the corpus of 5000 results. From this, we constructed a vocabulary of unique words contained in the results.
The first step was to remove stop-words using a lookup table. Stop-words are words that are used often but they do not offer any valuable meaning (e.g., “the”, “and”, etc.). For this we used “stopwords”, which is an R package providing stop-word lists for multiple languages and sources [
38]. After removing the stop-words and the non-English results, we ended up limiting our results to approximately one third of the initial number, which is also a remarkable sample.
After collecting the final results, we used LDA to find the emergent topics and to check how distinct the topics are. For LDA we used the package text2vec, a package for R that provides an effective framework and clear API for text analysis and natural language processing (NLP) [
39]. The implementation of text2vec is based on the cutting-edge WarpLDA sampling algorithm. It has sampling complexity of O(1), therefore execution time is independent of the number of topics [
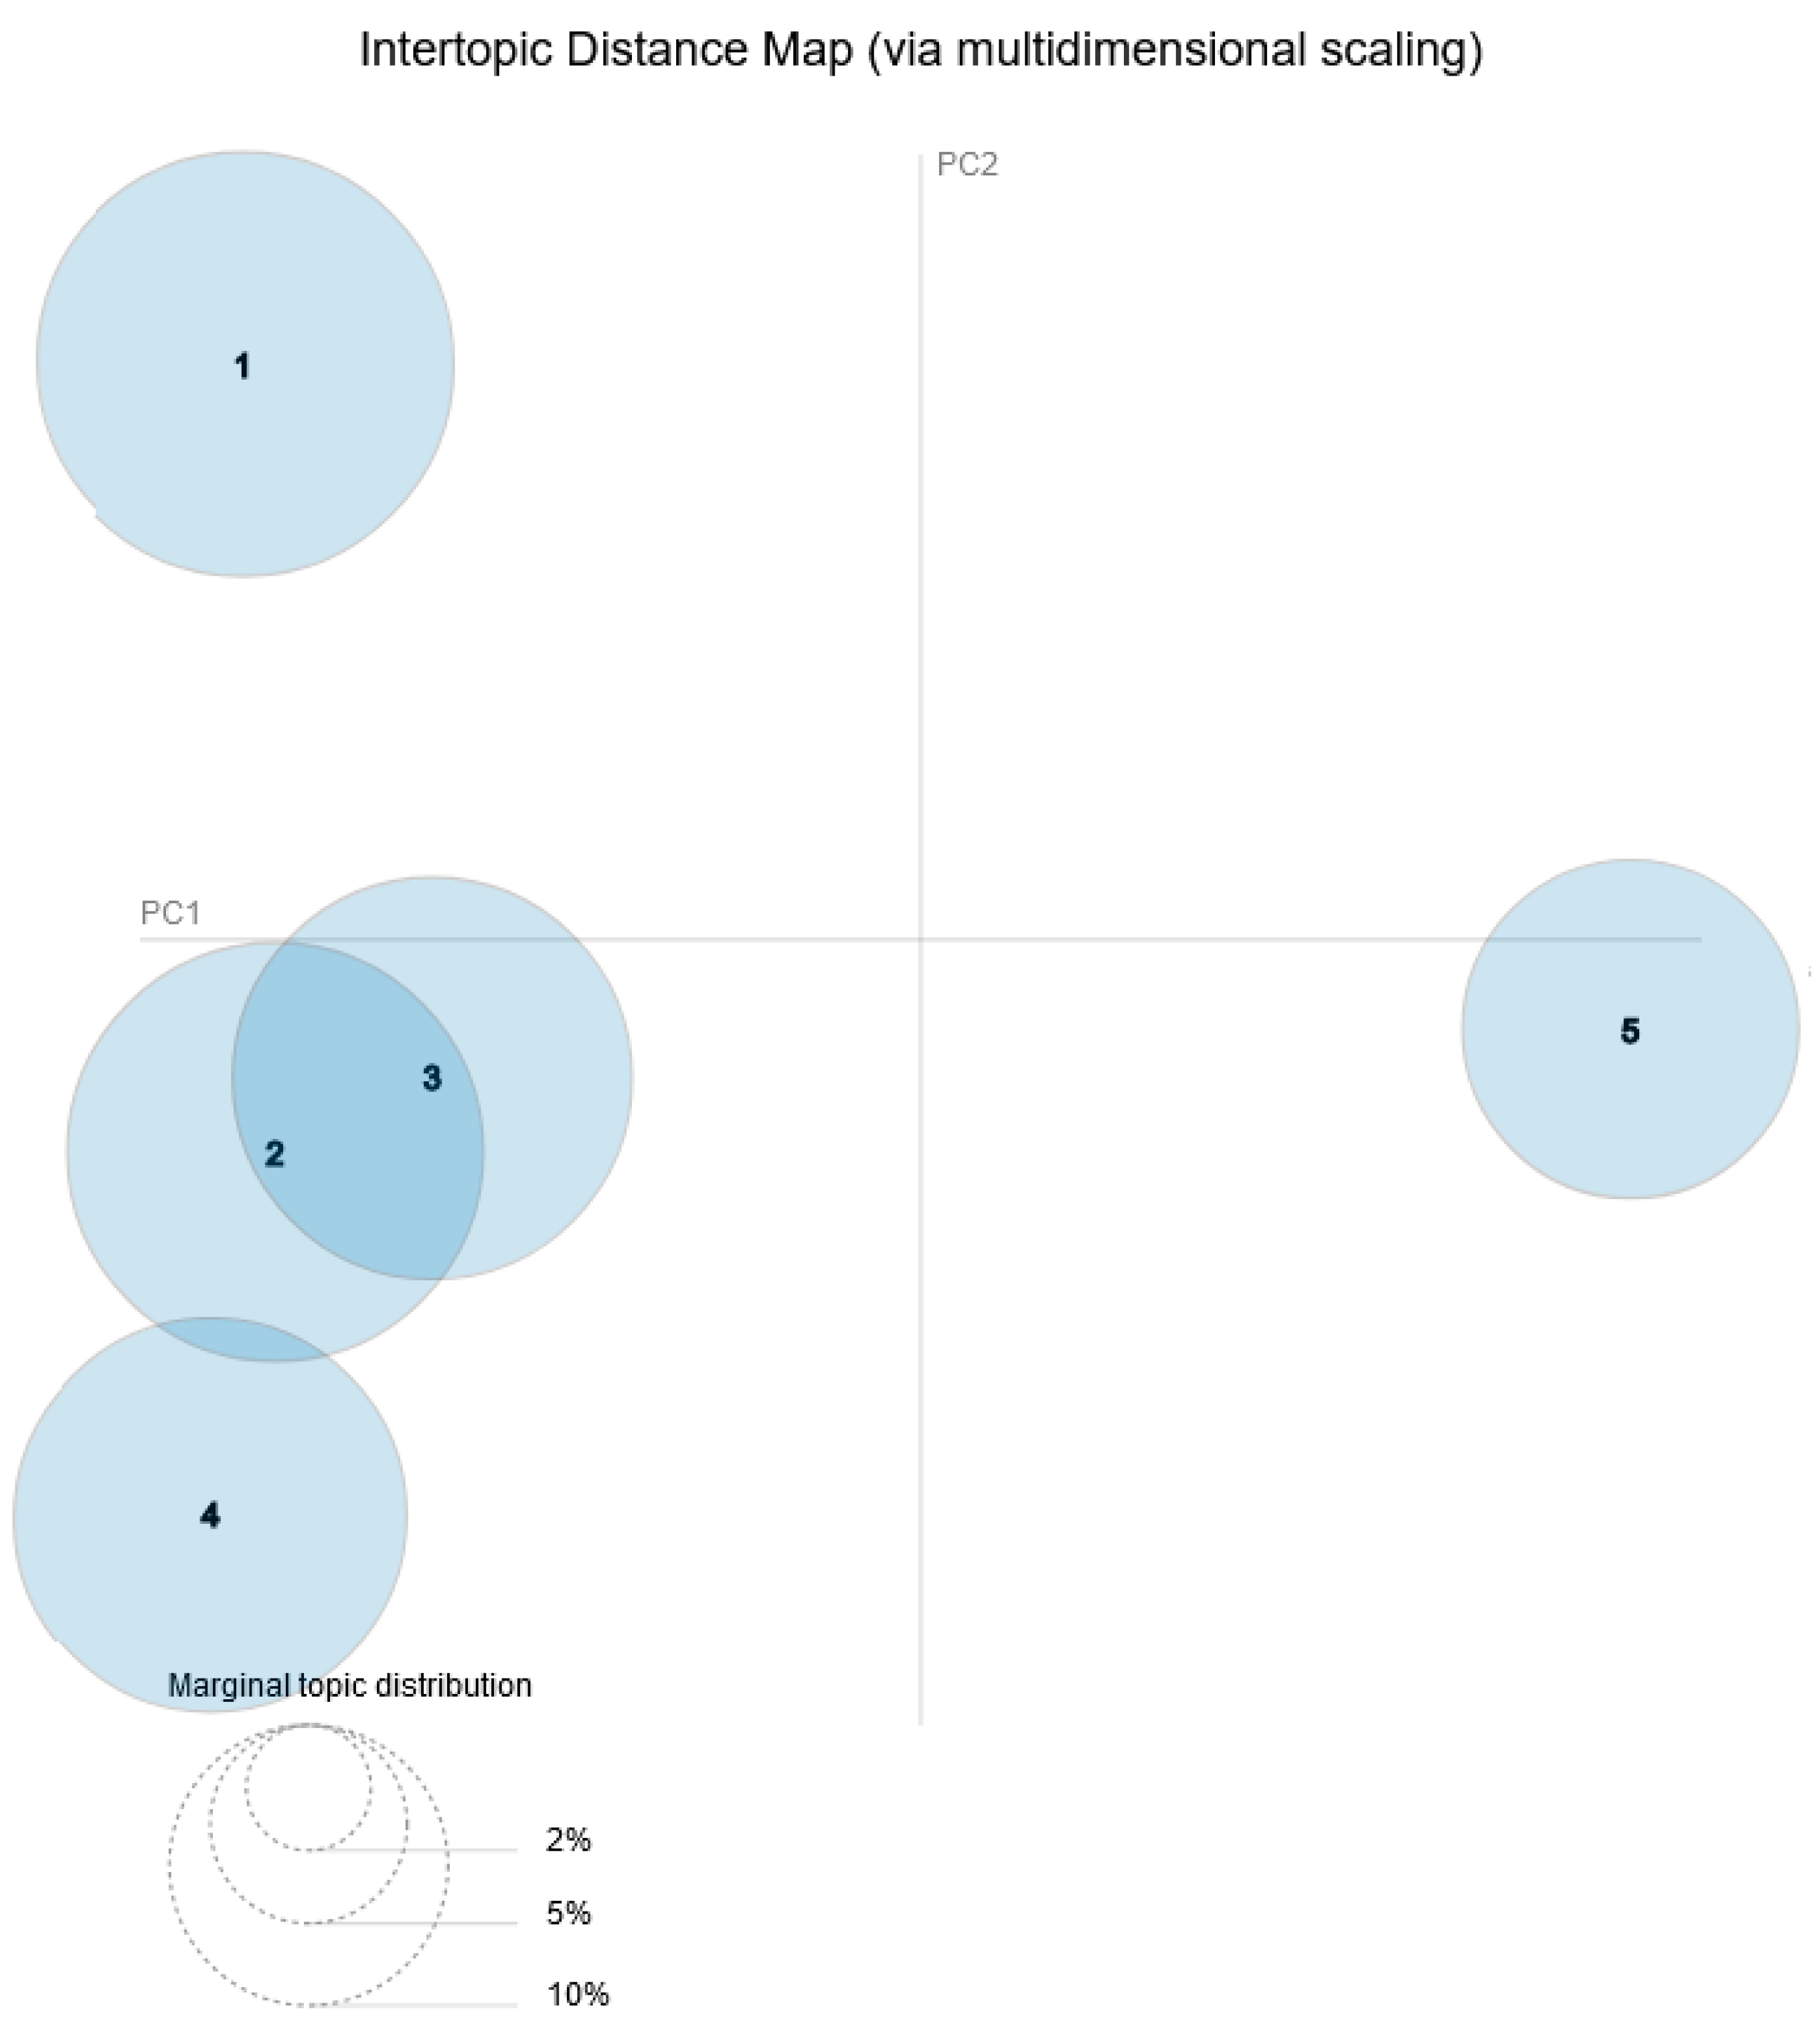
39]. We used LDAvis to interpret data and visualize the distances between them. The LDAvis is composed of two major components, an intertopic distance map and a bar chart. The intertopic distance map is a two-dimensional representation of the topics. The area of these topic circles is proportionate to the number of words in the dictionary that belong to each topic. The circles are produced using a multidimensional scaling technique depending on the words they contain, such that topics with more words in common are closer together. By default, the bar chart displays the 30 most salient terms. The bars represent the total occurrences of the word in the whole corpus. Salient is a specific measure that may be viewed as a metric used to determine the most informative or valuable words for identifying subjects in a collection of texts. A term with a higher saliency value is more beneficial for identifying a specific topic [
40].
We used the following parameters as presented by the package’s specifications [
41]:
n_topics: 5 “integer desired number of latent topics. Also knows as K”;
doc_topic_prior: 0.1 “numeric prior for document-topic multinomial distribution. Also knows as alpha”.
topic_word_prior: 0.01 “numeric prior for topic-word multinomial distribution. Also knows as eta”.
Additionally, we used Principal Component Analysis (PCA) to check how distinct the topics are. Principal Component Analysis of a data matrix extracts the primary patterns in the matrix in regards to “a complementary set of score and loading plots” [
42]. It is a standard technique in contemporary data analysis, with applications ranging from neurology to computer graphics, since it provides a simple, non-parametric technique for extracting useful information from complex data sets [
43].
4. Results
Using PCA, we suggest five distinct topics as a test case to find themes in Renaissance era paintings in Europeana. In topic modeling, when we refer to themes, subjects or topics, we do not use the traditional sense of the words; rather we mean documents that statistically incorporate similar information based on keywords with common patterns. For instance, before removing stop-words, these were grouped in a group by themselves, since they presented a common pattern of frequency in documents. The less common the patterns or words between each topic, the more distinguished they are. In
Figure 1, which depicts an Intertopic Distance Map (via multidimensional scaling) we can see that there is some overlapping between the topics.
In general, having a look at the topics, we can see that the majority are centered on religion. In terms of art form, we see a prevalence of paintings, murals, portraits and landscapes with the majority of them having a religious theme, followed by seascape and battle depictions. When it comes to places, we can see Greece, Bulgaria and the Netherlands being represented, while there is also a focus on Greek and Bulgarian towns. It must be noted that if other languages besides English were also included, there would not be major differences in the results with regards to the identified topics, but in that case more countries would have become prevalent.
Table 1 presents the most relevant terms for each topic.
In order to select descriptive words for the topics and evaluate the relevance of each word to the topic, we used the following two criteria, which are very popular in topic modeling: (i) saliency that characterizes the informativeness of a word for identifying topics in the document collection; and (ii) relevance that weights the frequency of a word by a factor that captures how much the word is shared across topics. The saliency of a word
w in the dataset [
44] can be formally defined as:
where
t denotes the different topics,
p (
t|
w) the probability of documents containing word
w to belong in topic
t, and the sum corresponds to the distinctiveness of the word. Respectively, the relevance of the word
w with respect to the topic
t [
40] is defined as:
where
λ is a parameter (0 ≤
λ ≤ 1) that determines the weight given to the probability of term
w under topic
t relative to its lift.
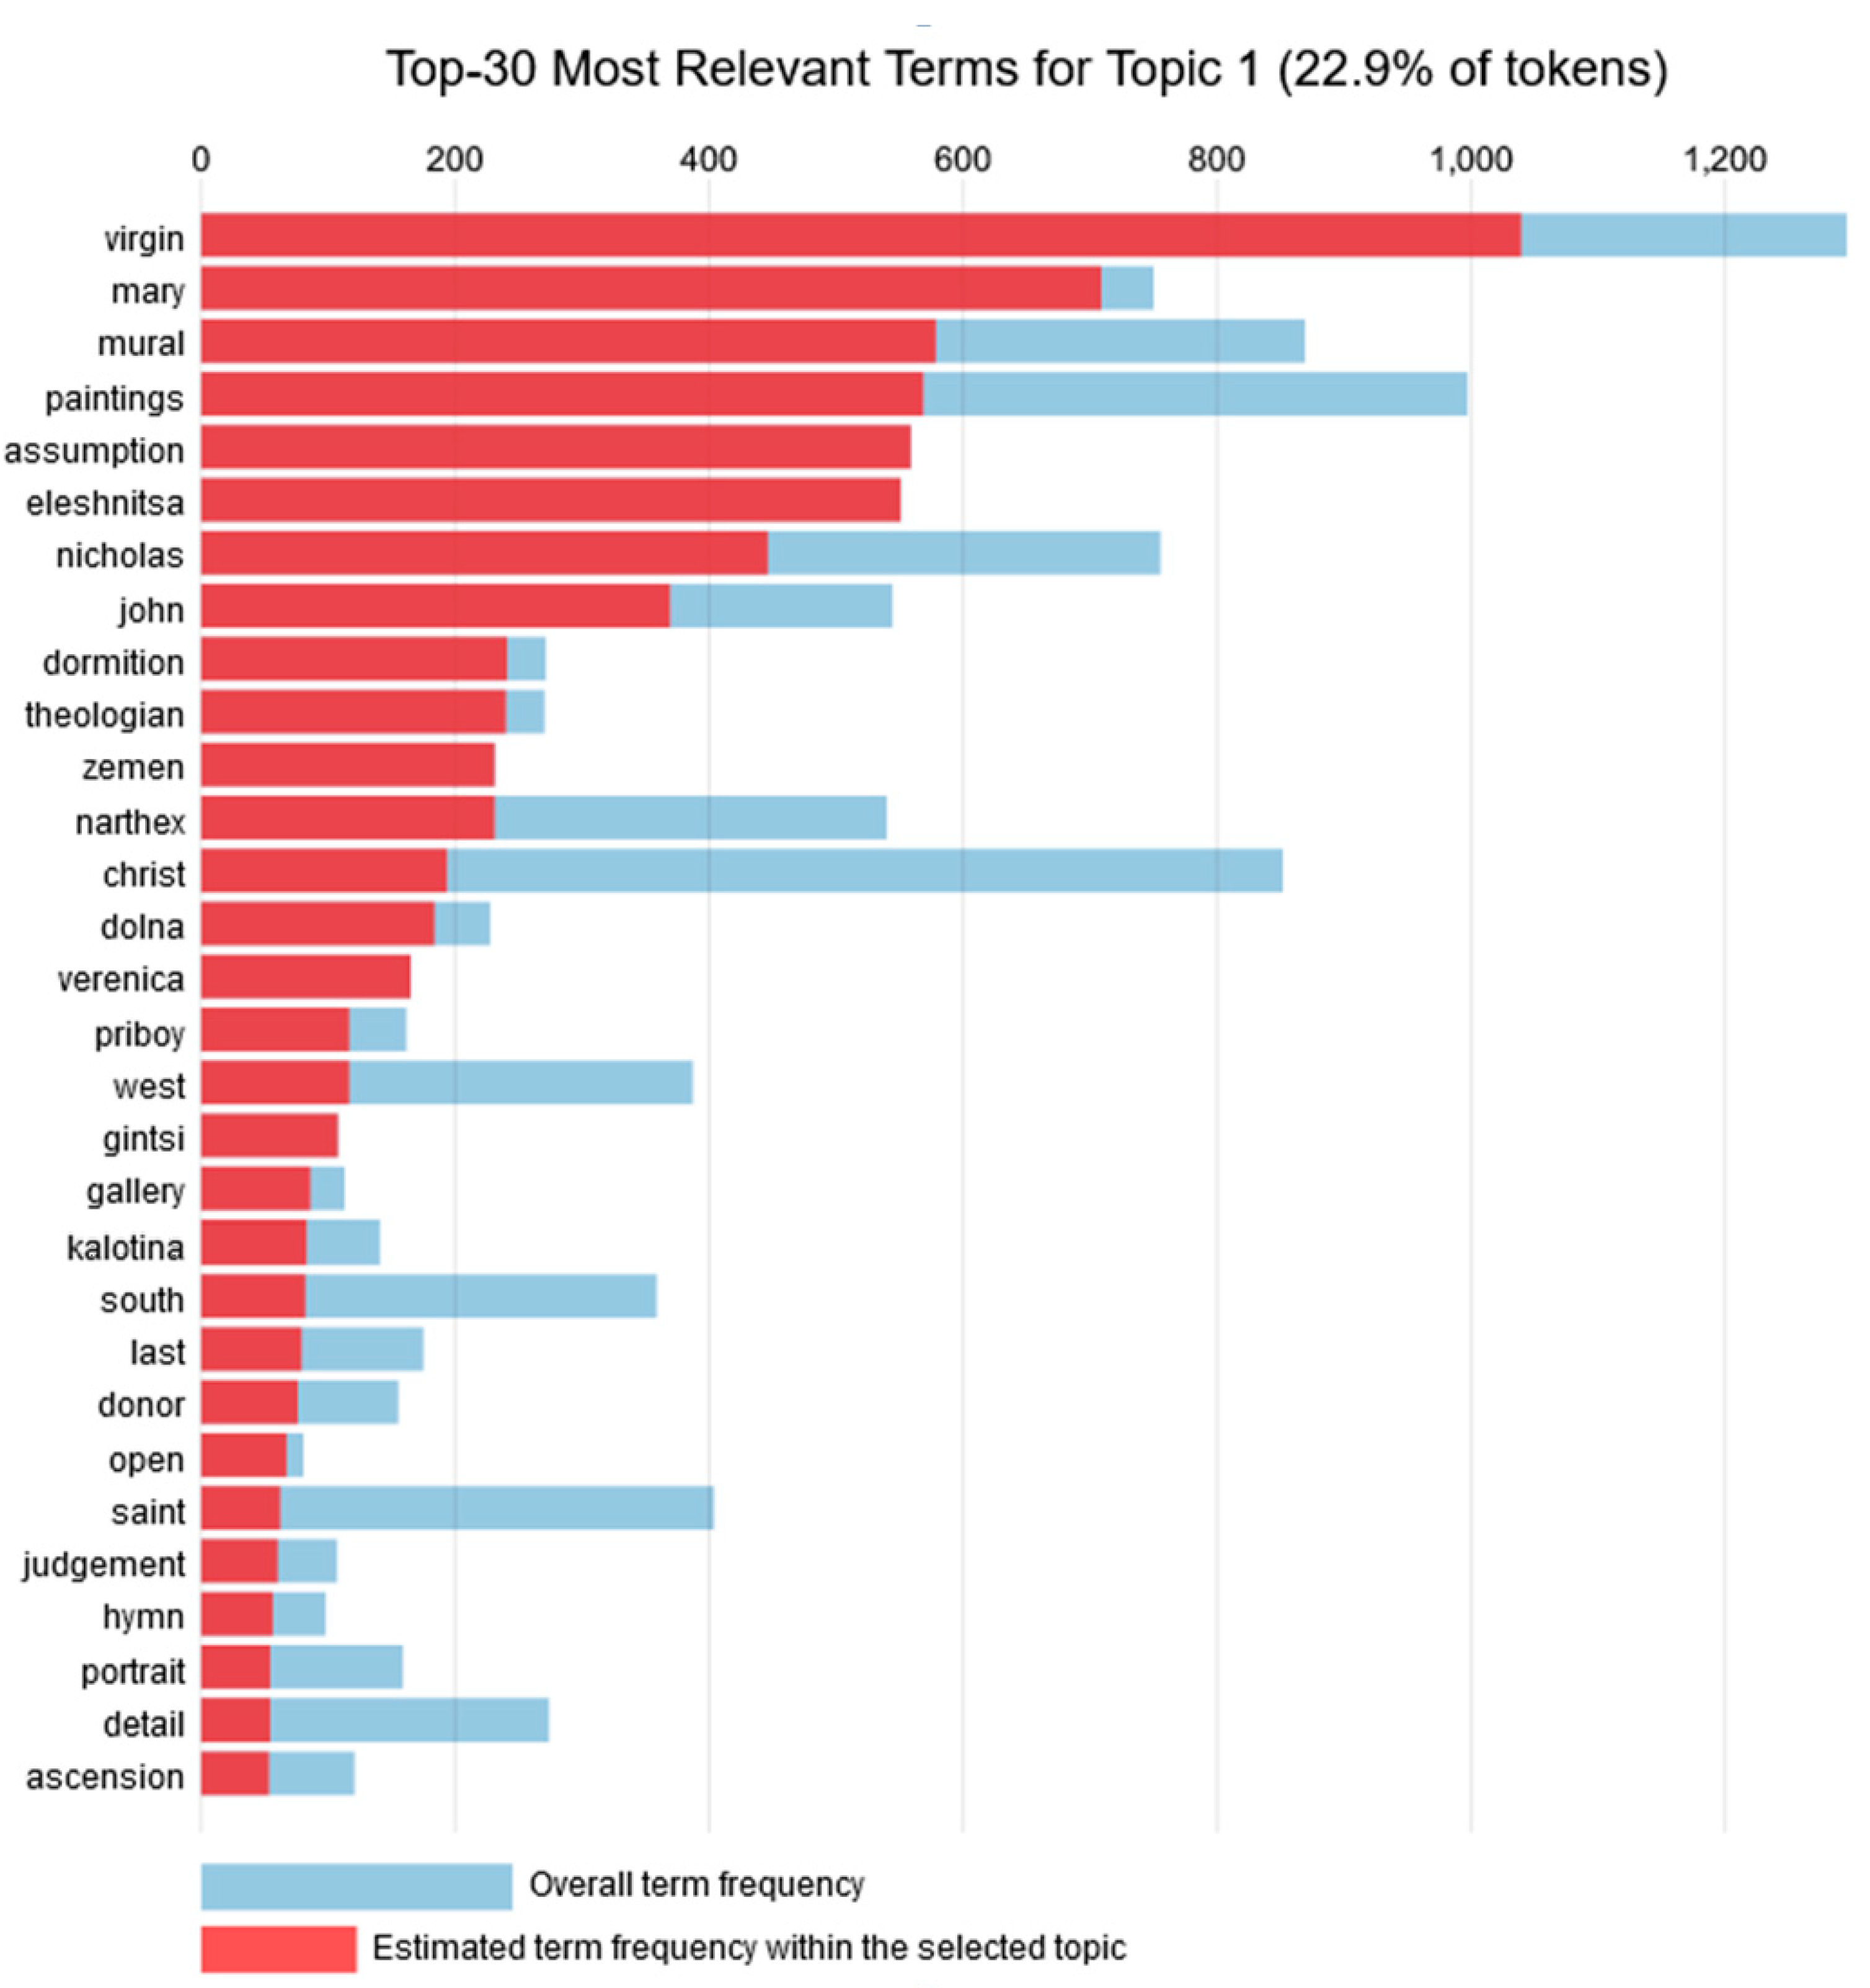
4.1. Topic 1
Topic 1 consisted of 22.9% of the tokens, with the most frequent being “virgin” and “mary”. In fact, the word “virgin” has the highest overall frequency, and also the highest estimated frequency in this topic. The next two words with the highest frequency within the topic are “mural” and “paintings”. Hence, the 30 most common words for Topic 1 are depicted in
Figure 2 and are related to the Virgin Mary’s paintings. Regarding types of painting, this topic focuses on murals and to a lesser extent on portraits. As far as religion is concerned, the theme of the Virgin Mary and assumption appear high in this list, implying that there are either a number of murals of the Virgin Mary or Virgin Mary’s Assumption. For instance, there might be related to the Eleshnitsa monastery “Assumption of the Virgin Mary” that was established in the 14th and 15th century. A plot with the most common words for Topic 1 is presented in
Figure 2. The plot contains the overall term frequency and the respective estimated frequency within the specific topic.
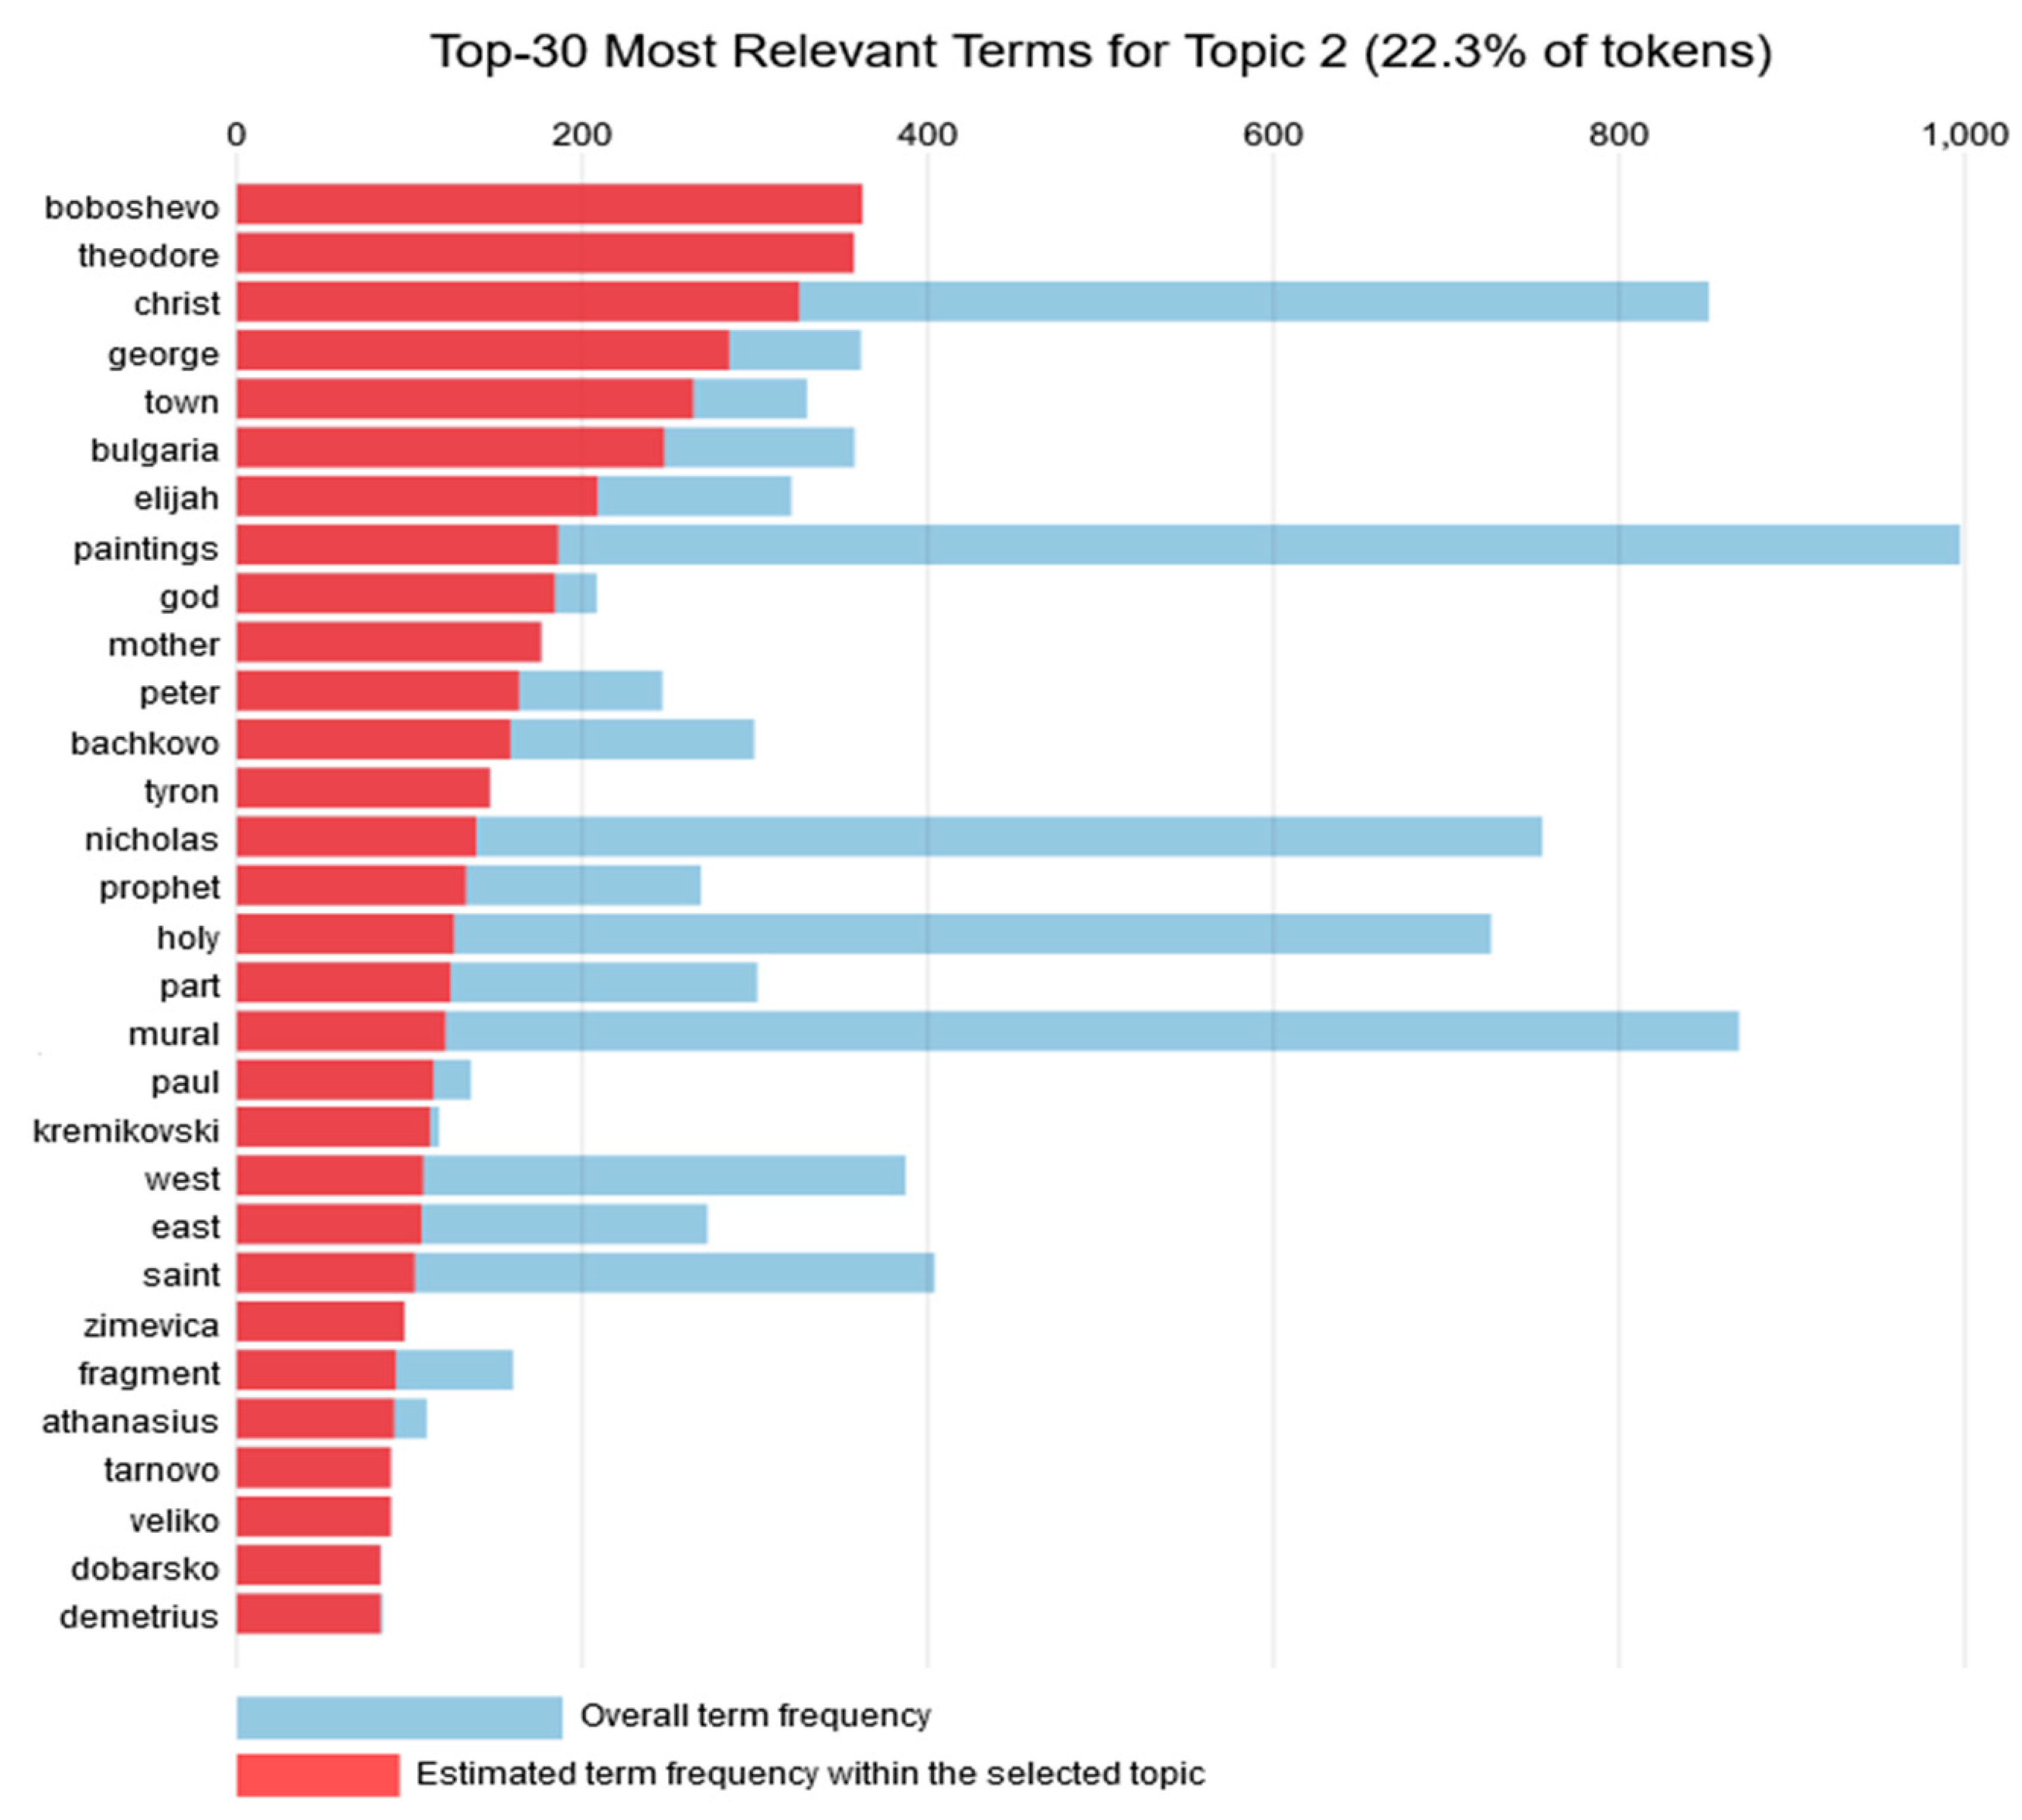
4.2. Topic 2
Topic 2 is composed of 22.3% of the tokens with the most frequent terms related to cities and names. Overall, the 30 most relevant words in Topic 2 are listed in
Figure 3 and comprise church names that have paintings of Jesus Christ. As in Topic 1, we see again Bulgarian cities, which probably host the churches, but the most prevalent form of art is paintings. In terms of the religious theme, we see that this topic focuses on Christ and different saints or prophets (such as Theodore, Nicholas and Elijah). Since the metadata are taken from descriptions, there is a high chance that the names of the saints are also church names. For instance, in Boboshevo (Bulgaria) the church of Theodore Tyron is located while Kremikovski is a monastery near Sofia. A graph with the most common words for Topic 2 is presented in
Figure 3.
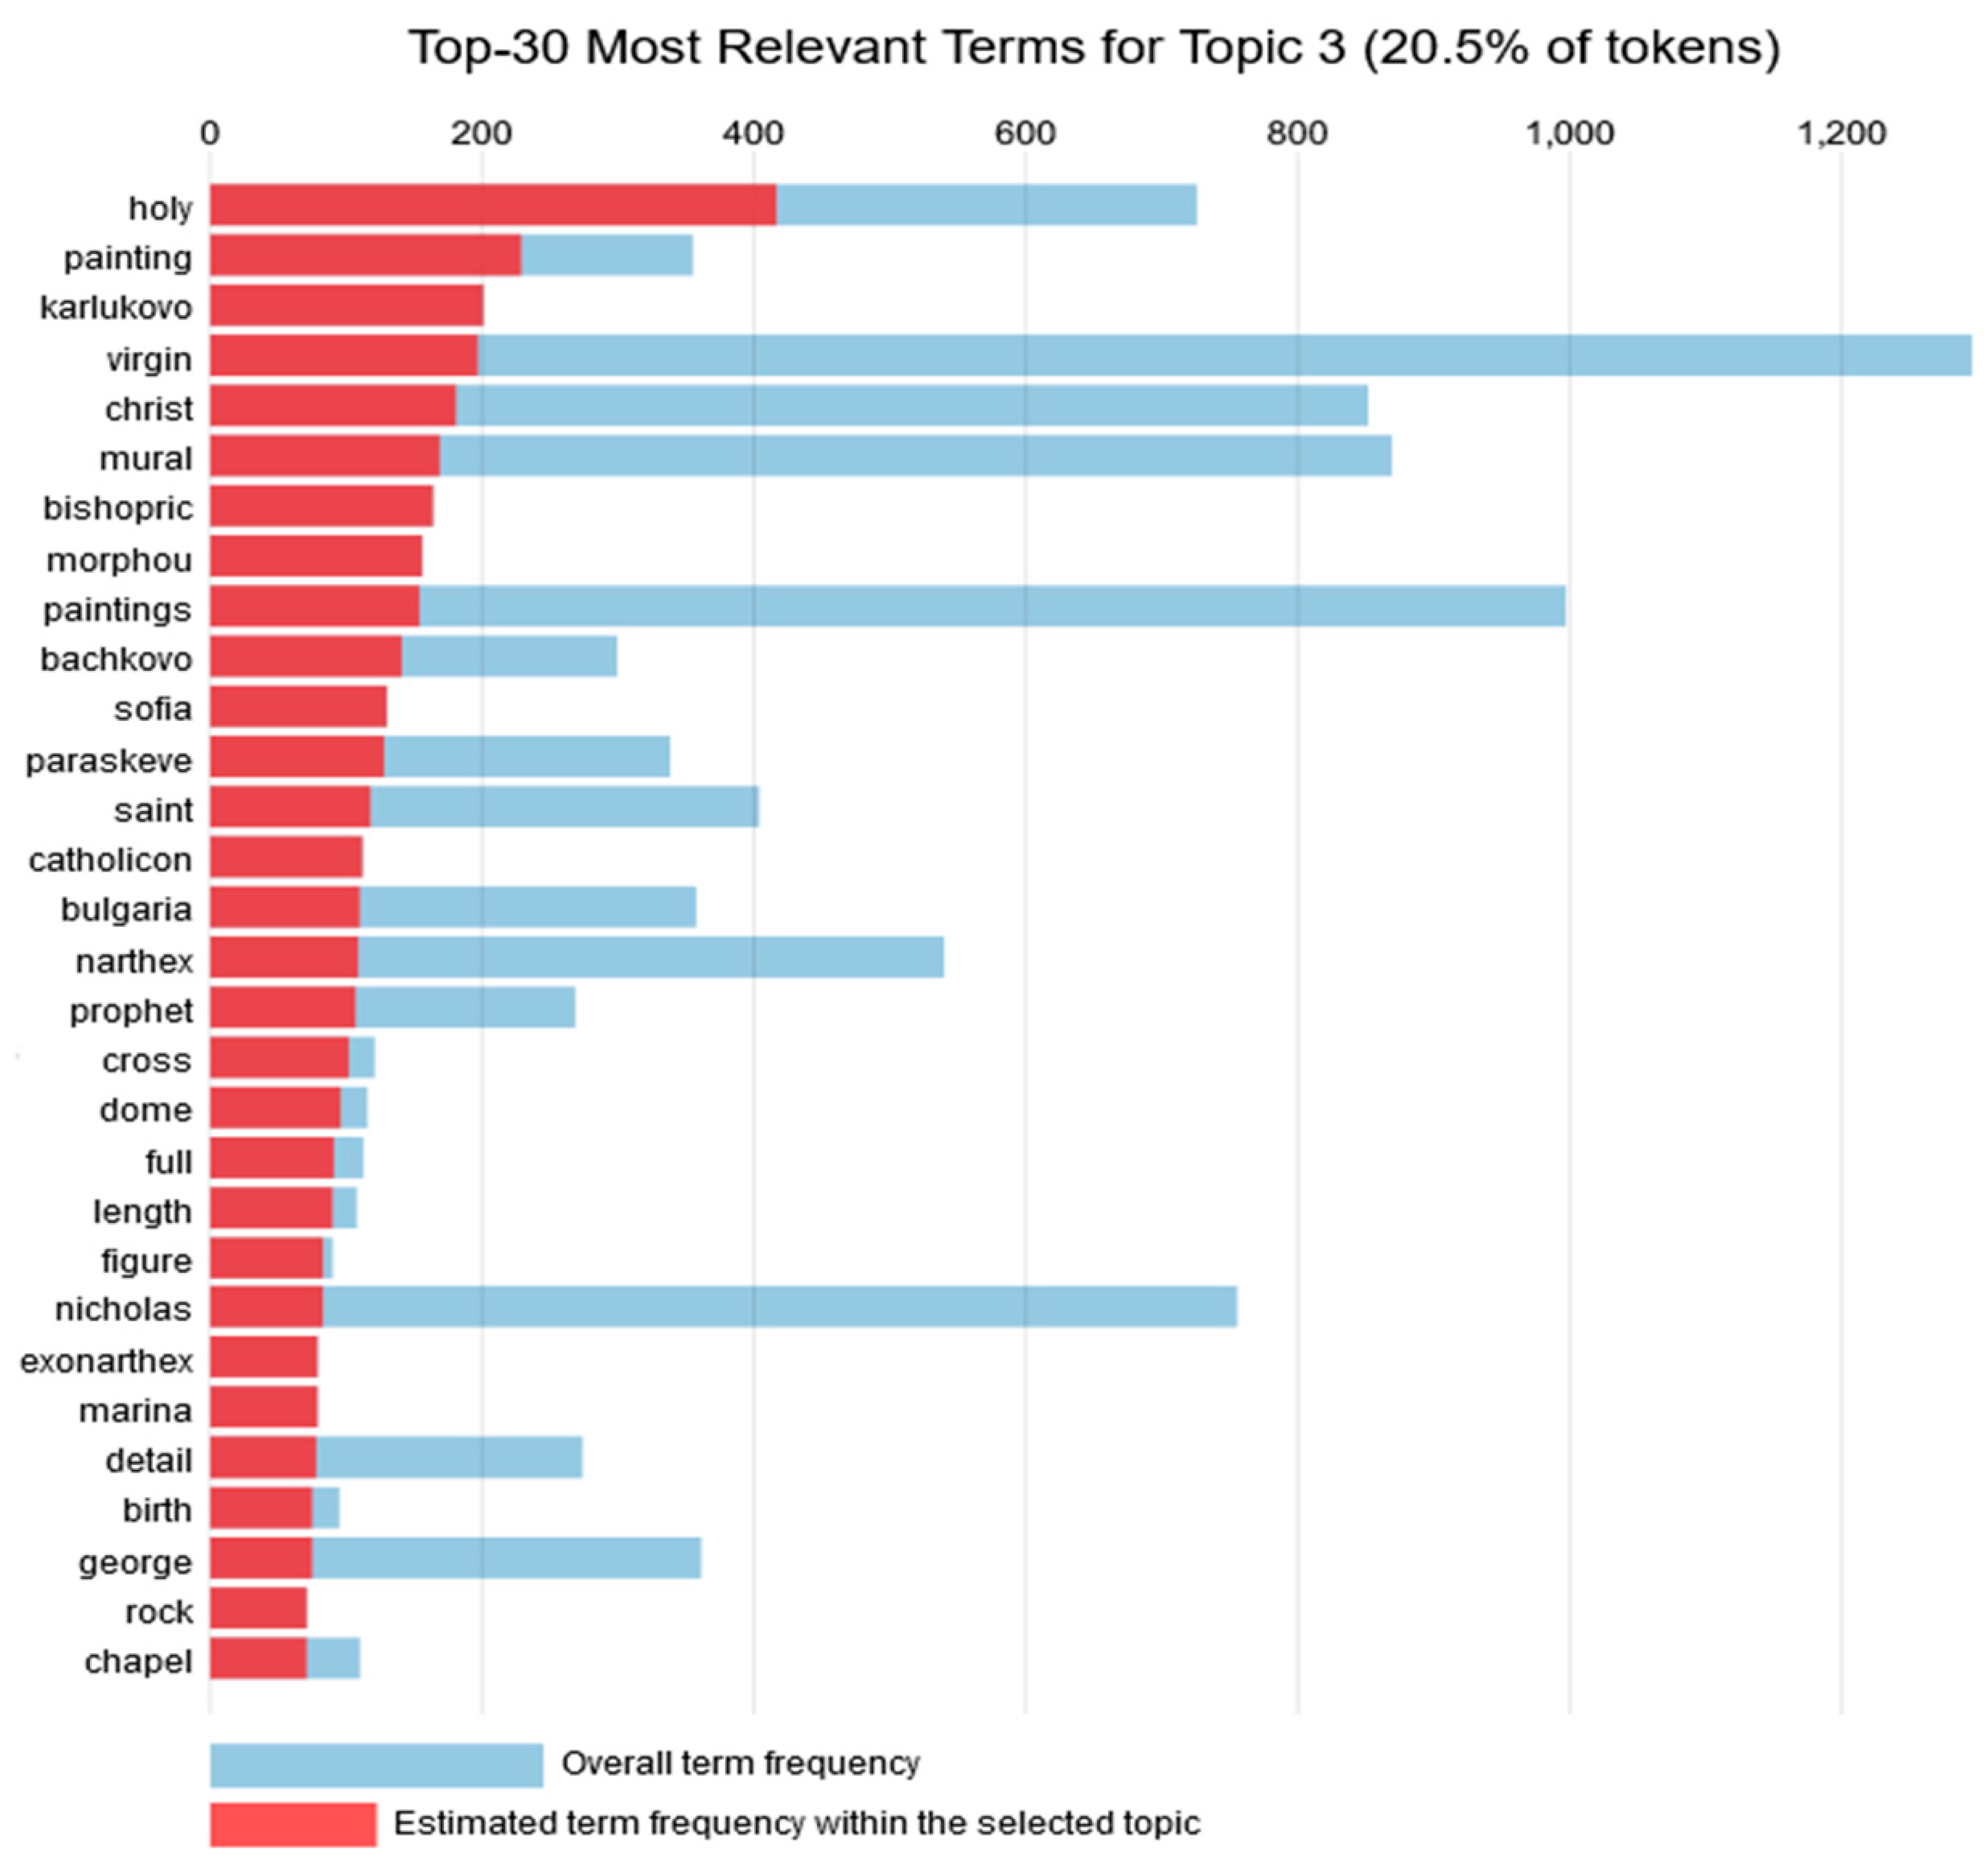
4.3. Topic 3
Topic 3 consisted of 20.3% of the tokens. For Topic 3, the 30 most relevant words depicted in
Figure 4 comprise places in Bulgaria that host murals and other interesting architectural elements. Concerning the art form, paintings are also prevalent in this topic as well, followed by murals and architectural elements, while the religious theme seems to be centered on bishoprics and chapels. Once again, the prevalent country is Bulgaria. A graph with the most common words for Topic 3 is presented in
Figure 4.
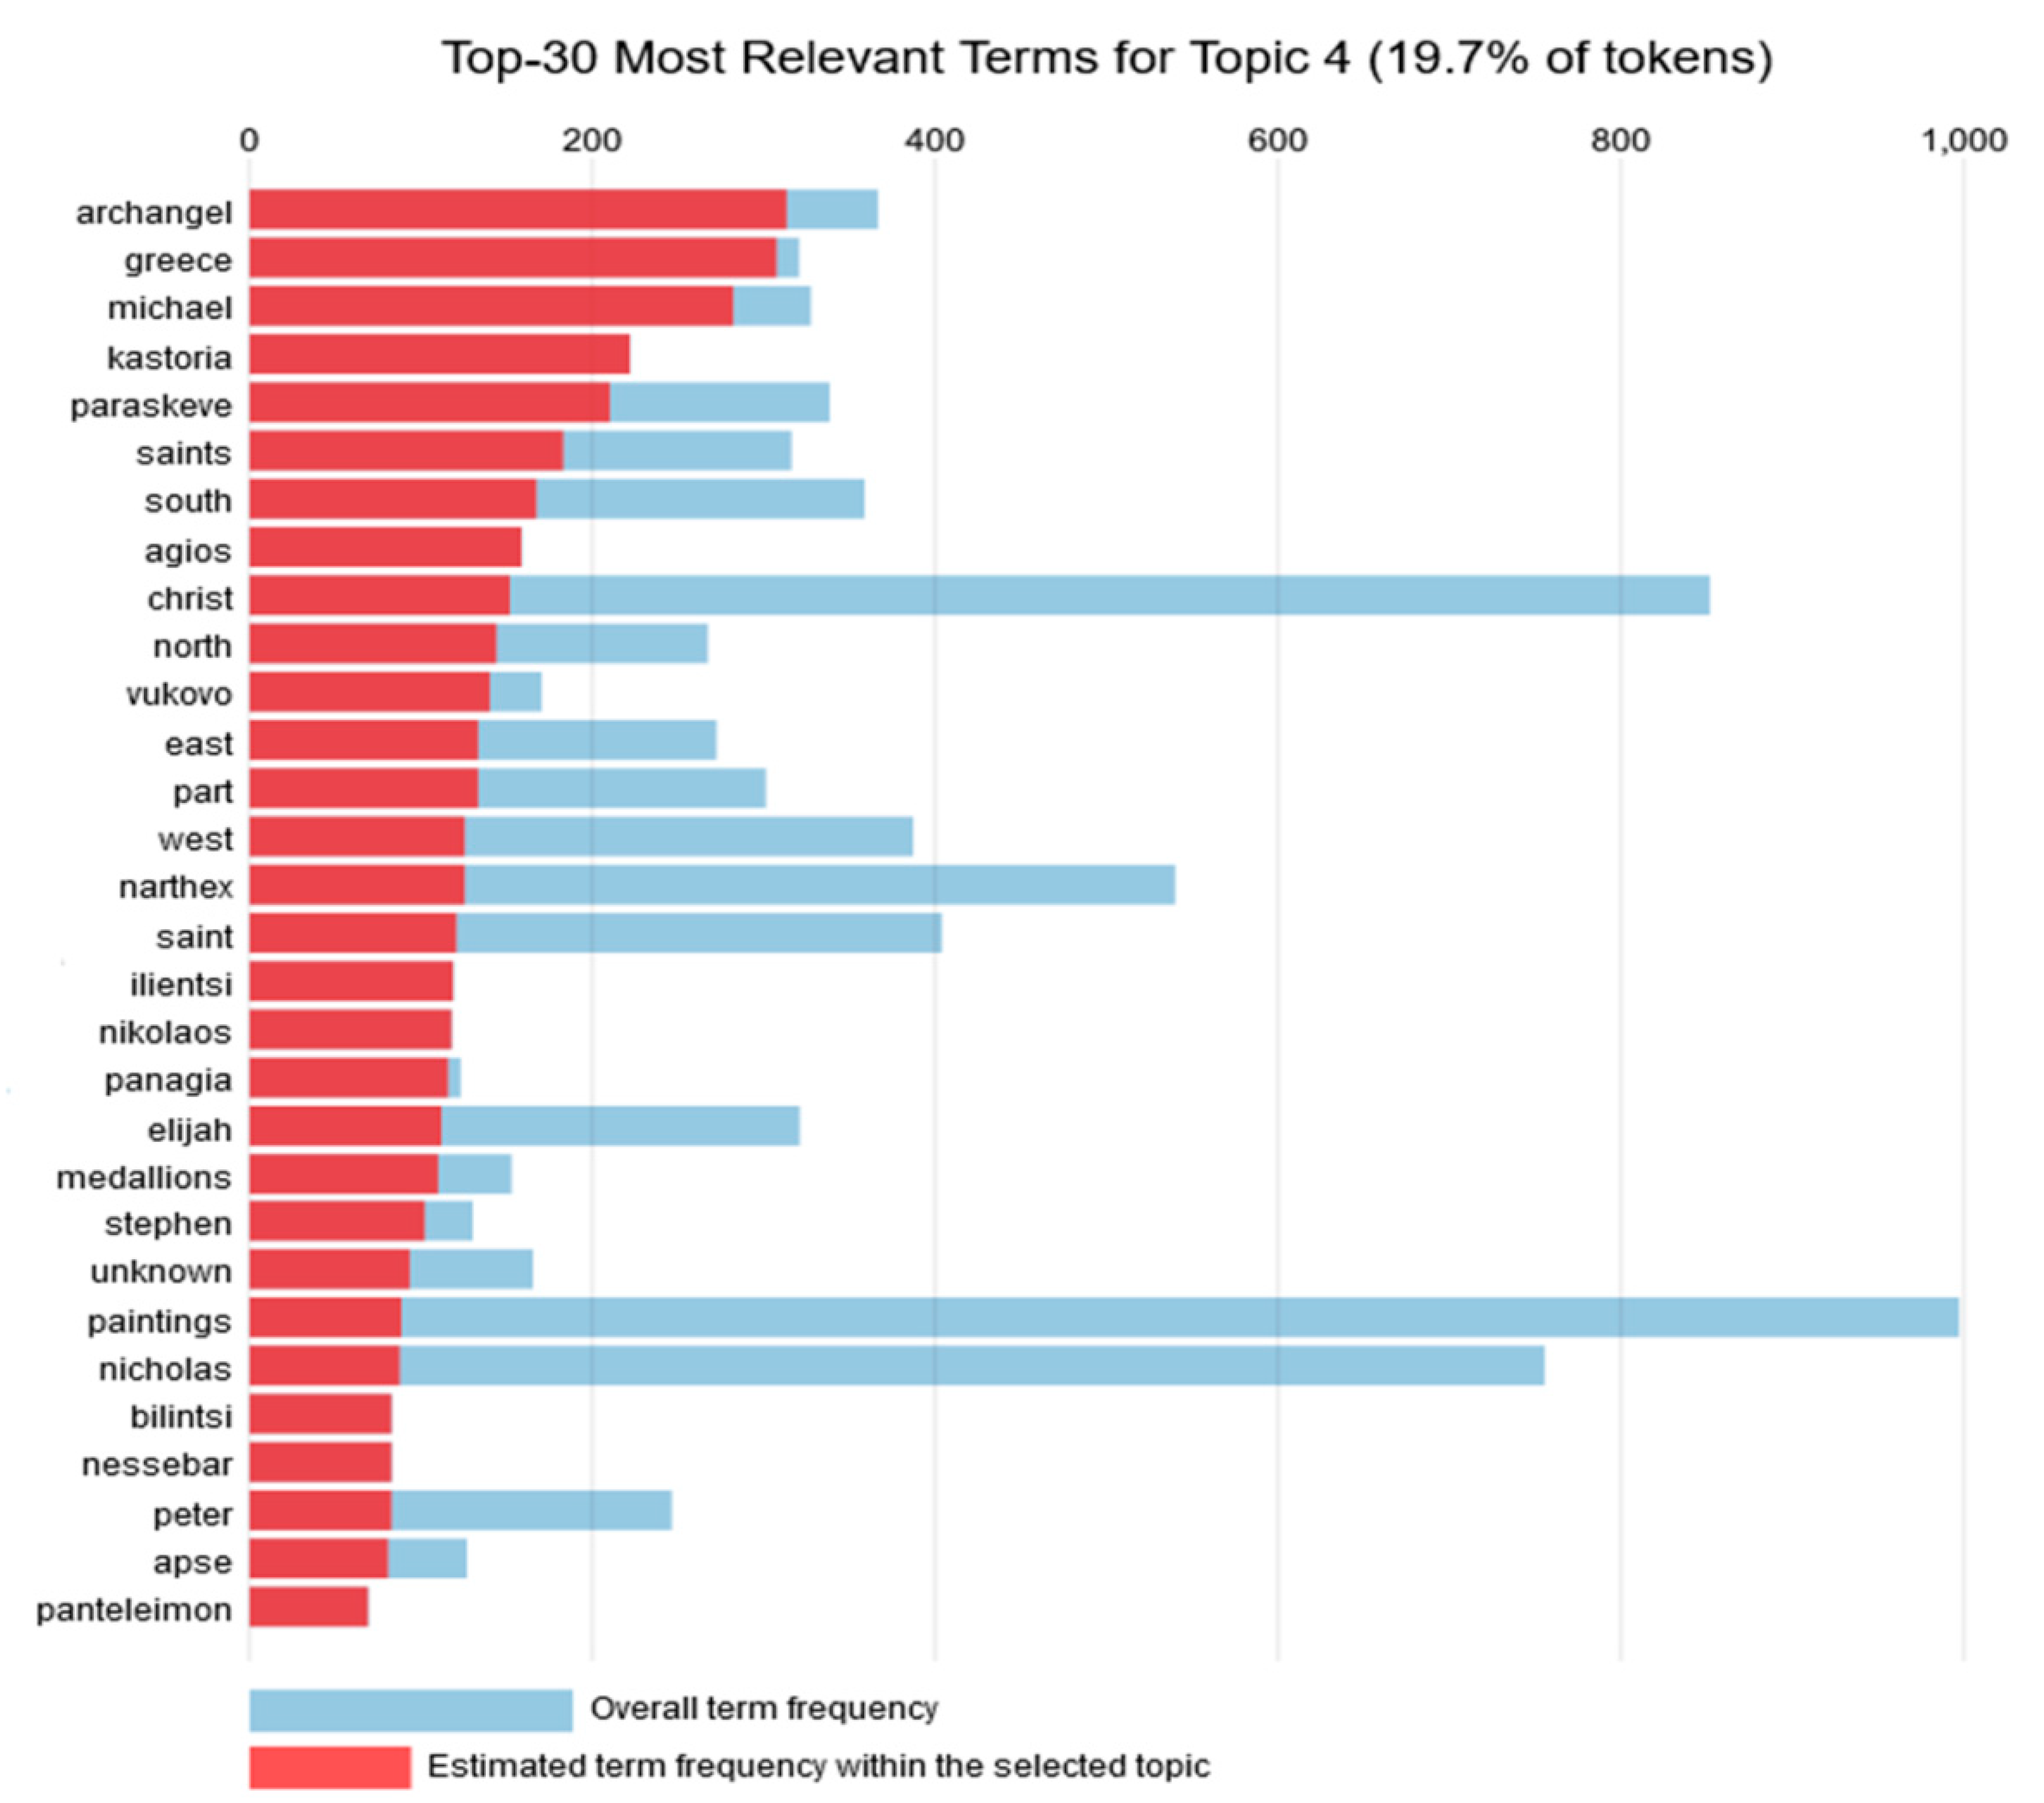
4.4. Topic 4
This topic includes 19.7% of the tokens. The 30 most relevant words for this topic as listed in
Figure 5 comprise Greek points of religious interest. The change of country from Bulgaria to Greece is accompanied by a change to the religious theme, which is now focused on angels (archangel Michael) and saints. The form of art is paintings. A graph with the most common words for Topic 4 is presented in
Figure 5.
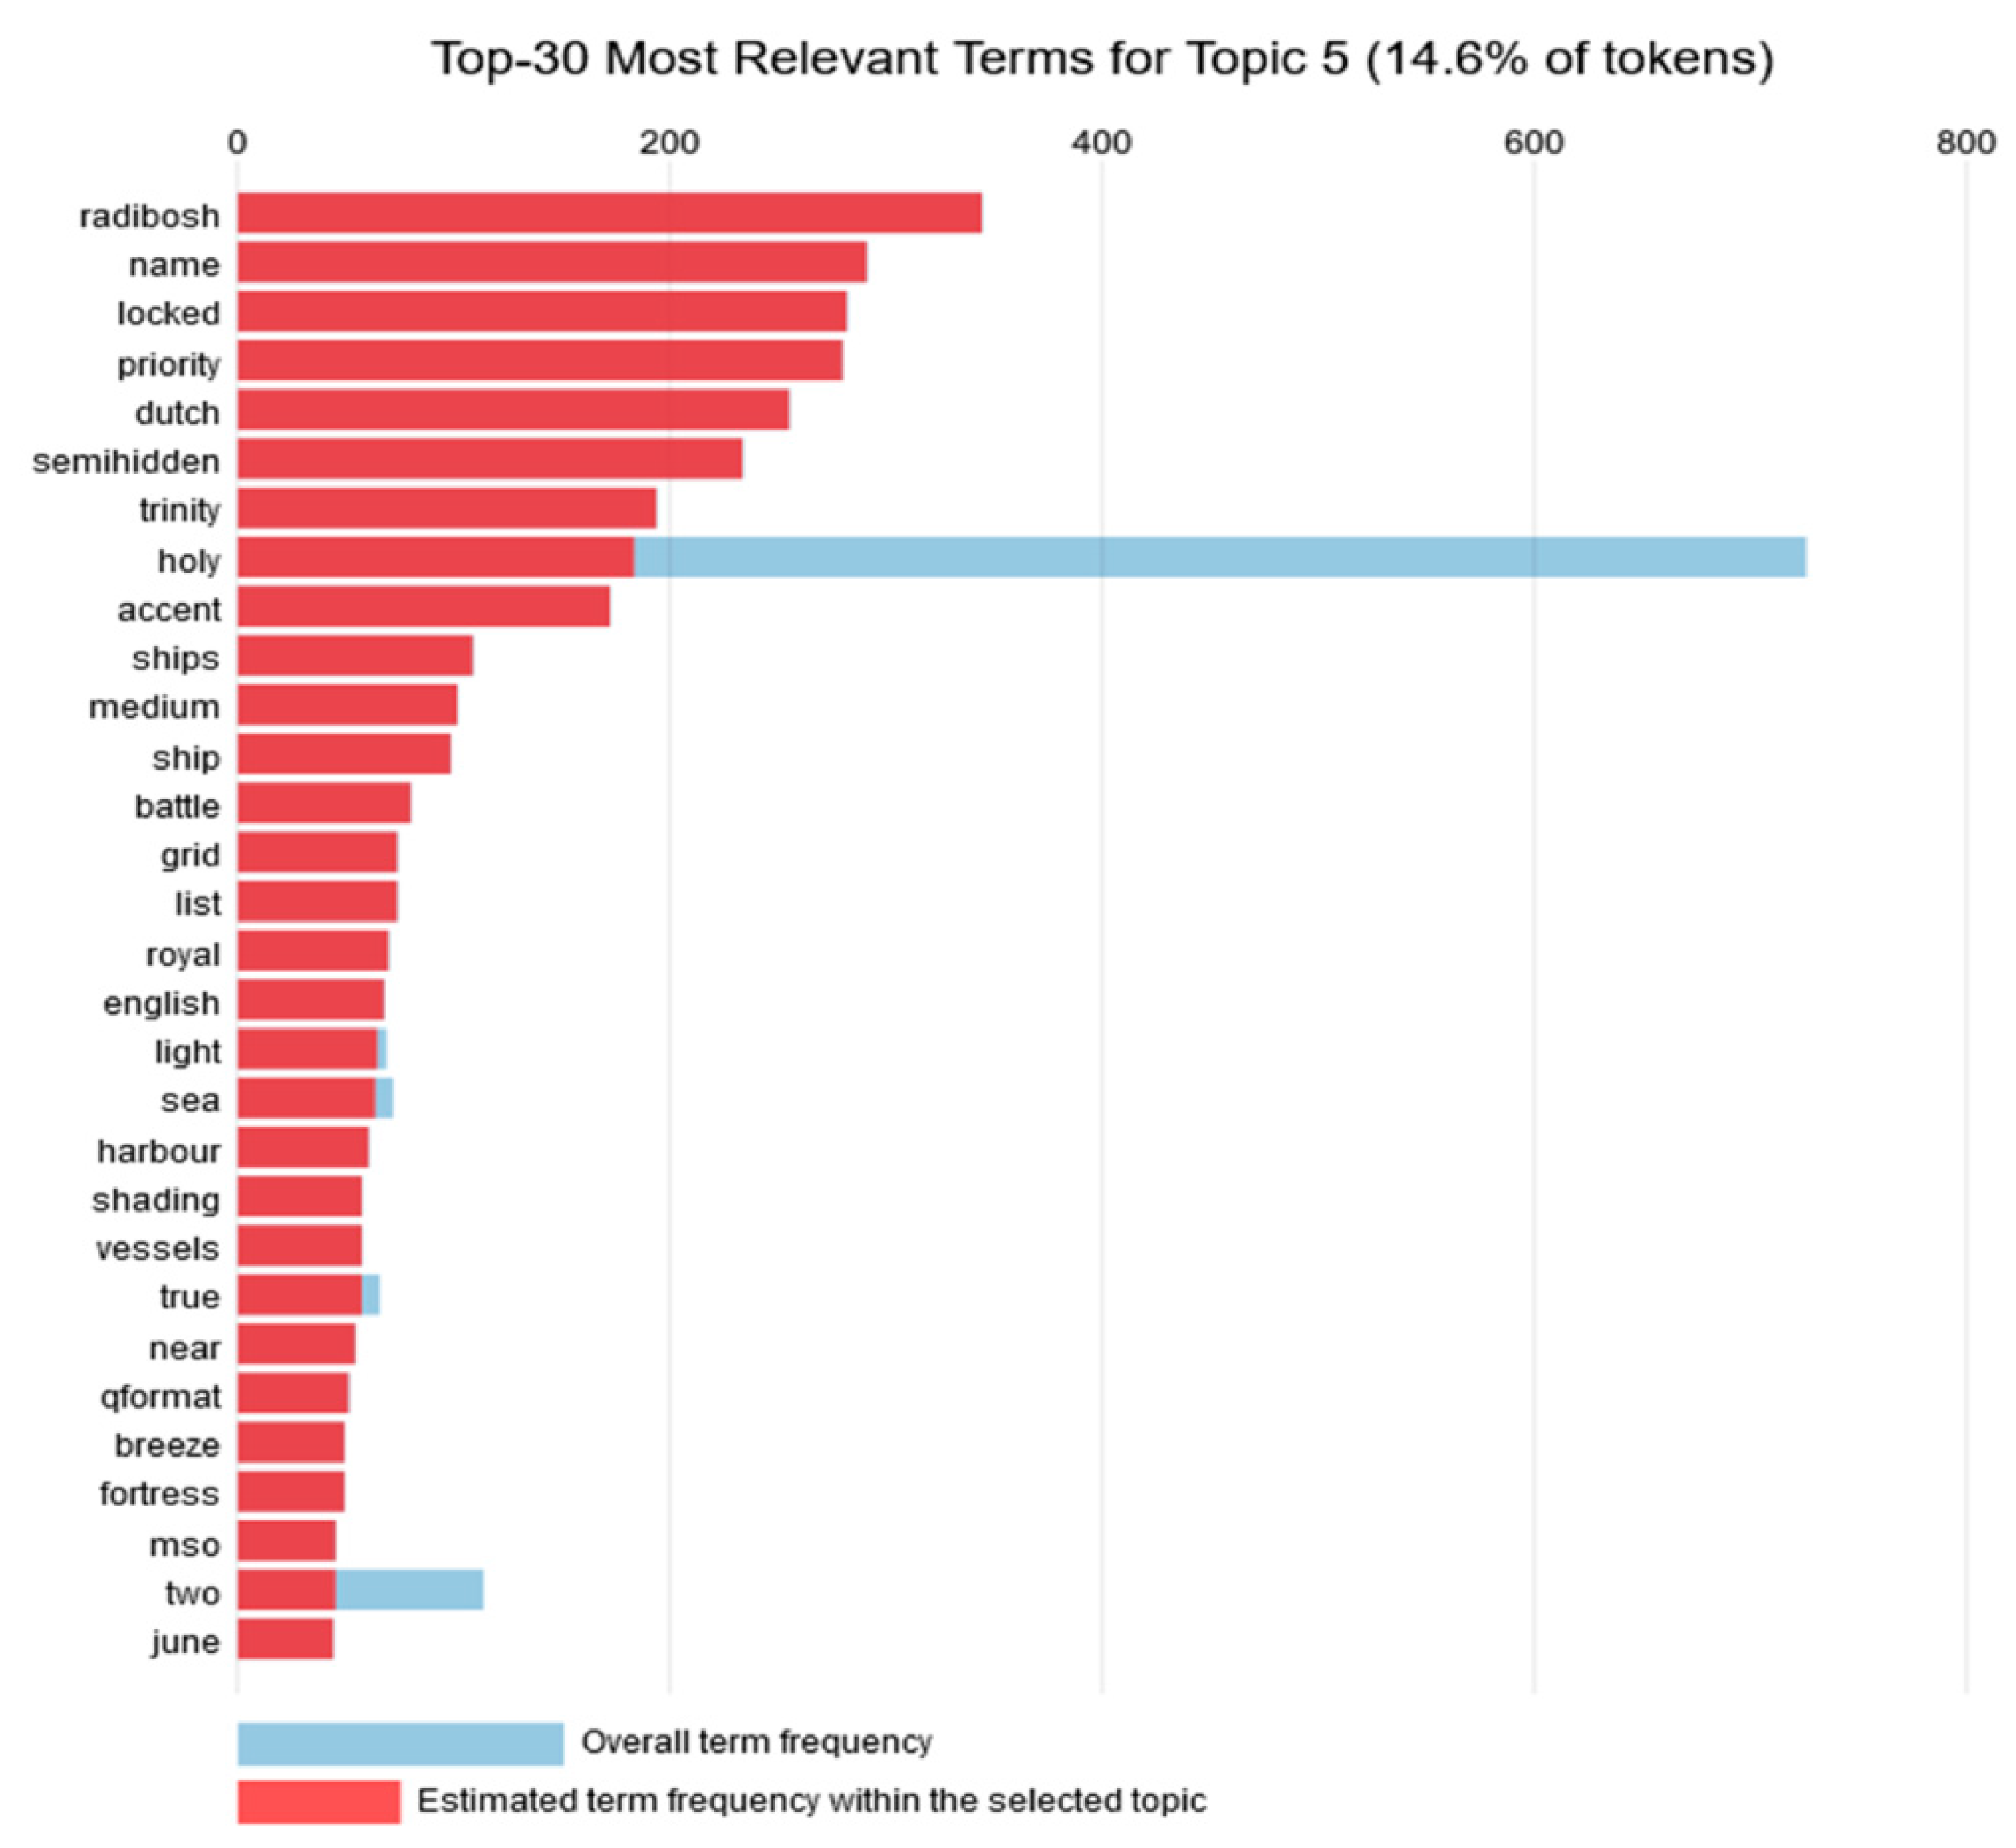
4.5. Topic 5
Topic 5 consisted of 14.6% of the tokens. For this topic, the 30 most relevant words as presented in
Figure 6 refer to religious themes from multiple countries. It is the first topic that makes reference to a non-Balkan culture, since we meet the words: dutch and english. Furthermore, it is also the first and the only topic that does not focus only on religious and theological themes, but also contains other themes such as seascape (sea, ships, ship, vessels, harbour) and battle (battle, fortress). A graph with the most common words for Topic 5 is presented in
Figure 6.
4.6. Countries
In
Table 2, the countries that have provided the various data instances are presented. As we can see, the majority of them have been tagged by the original data providers as simply “Europe” instead of a more specific country. Taking into account the topics, though, we know that there are more artefacts from Greece and perhaps the Netherlands, as implied by Topic 4 and Topic 5, respectively.
5. Discussion
Through making use of the R language and its capabilities as they were capitalized on the EuropeanaR package, we were successful in harnessing a vast amount of information provided by the Europeana Collections. By utilizing LDA and PCA, we were able to transform the information of this database into a dynamic digital knowledge representation graph. The methodology as described above can be applied to study a vast array of different use-cases. By formulating an alternative initial query, different data from Europeana can be obtained and then studied following the same steps. This method can be used, for example, to examine the architectural elements of a specific time period, or the body of work of a specific artistic style, or many other similar subjects, as long as they can be expressed through an appropriate query for the Europeana Collections search API.
In this case, we found that the majority of cultural objects in Europeana between the 14th and the 17th century, which use English as their language in the description, are centered on religion. This implies that the art objects, which are paintings and have been uploaded in Europeana in the English language, are focused on religion, followed by a minority of portraits and landscapes depicting sea and battles. This does not mean that in the Renaissance only the religious theme was prevalent, rather than that in Europeana, the majority of paintings representing this era have religion at their core. Furthermore, it becomes evident that Bulgaria, Greece and the Netherlands—to some extent—appear in the Europeana collections, but the Renaissance was most prevalent in France and Italy. A possible explanation for this might be that more institutions from the aforementioned countries chose to upload in the English language. This is an inherent limitation of this research: using Europeana as the sole content provider may limit the actual objects of cultural heritage studied and thus skew our understanding. That being said, Europeana already boasts millions of objects from thousands of partners and is constantly expanding further.
Moreover, the religious related findings also suggest that a majority of objects are related to post-Byzantine art. This division between the Balkans and the rest of the European Renaissance confirms Lymperopoulou’s argument [
8]. We know that the two movements—post-Byzantine art and European Renaissance art—coincided chronologically. Although religious themes were prominent in Renaissance paintings, the spread of printing and consequently new ideas, sparked instability. At the same time, the majority of the painting objects found in Europeana for this specific period seem to be more traditionally religious artefacts, related to monasteries and temples in the area. However, since political intolerance increased during these ages [
1], it is only natural that religious artefacts will be more prevalent in religious related areas such as the Balkans.
Furthermore, our study implies that during the Renaissance, Balkan countries were focusing on religious themes, as far as painting is concerned, while in other countries, such as the Netherlands, there seems to be a preference towards seascapes. Towards this, a future study could examine the trends around different European countries or could use different languages. However, this requires more content from Europeana, originating from different countries and institutions. At the same time, with Linked Open Data and the Semantic Web, we could utilize different databases and ultimately the entire web. Our study also shows that sometimes there might be discrepancies when it comes to Linked Open Data but despite that, they posed a very valuable asset for studying cultural heritage artefacts.
Last but not least, our study used only Europeana as the content provider. This choice has its limitations, but it was an initial approach to draw up useful conclusions before expanding to different art databases across Europe or worldwide. At the same time, although we chose English as the language to perform topic modeling, we can expand our work in the future to a multilingual setting.


 ,
, 


