Article

A BLE-Connected Piezoresistive and Inertial Chest Band for Remote Monitoring of the Respiratory Activity by an Android Application: Hardware Design and Software Optimization

by
Roberto De Fazio
1,
Massimo De Vittorio
1,2 and
Paolo Visconti
1,*
1
Department of Innovation Engineering, University of Salento, 73100 Lecce, Italy
2
Center for Biomolecular Nanotechnologies, Italian Technology Institute IIT, 73010 Arnesano, Italy
*
Author to whom correspondence should be addressed.
Future Internet 2022, 14(6), 183; https://doi.org/10.3390/fi14060183
Submission received: 9 May 2022 / Revised: 3 June 2022 / Accepted: 7 June 2022 / Published: 11 June 2022

Abstract

:
Breathing is essential for human life. Issues related to respiration can be an indicator of problems related to the cardiorespiratory system; thus, accurate breathing monitoring is fundamental for establishing the patient’s condition. This paper presents a ready-to-use and discreet chest band for monitoring the respiratory parameters based on the piezoresistive transduction mechanism. In detail, it relies on a strain sensor realized with a pressure-sensitive fabric (EeonTex LTT-SLPA-20K) for monitoring the chest movements induced by respiration. In addition, the band includes an Inertial Measurement Unit (IMU), which is used to remove the motion artefacts from the acquired signal, thereby improving the measurement reliability. Moreover, the band comprises a low-power conditioning and acquisition section that processes the signal from sensors, providing a reliable measurement of the respiration rate (RR), in addition to other breathing parameters, such as inhalation (TI) and exhalation (TE) times, inhalation-to-exhalation ratio (IER), and flow rate (V). The device wirelessly transmits the extracted parameters to a host device, where a custom mobile application displays them. Different test campaigns were carried out to evaluate the performance of the designed chest band in measuring the RR, by comparing the measurements provided by the chest band with those obtained by breath count. In detail, six users, of different genders, ages, and physical constitutions, were involved in the tests. The obtained results demonstrated the effectiveness of the proposed approach in detecting the RR. The achieved performance was in line with that of other RR monitoring systems based on piezoresistive textiles, but which use more powerful acquisition systems or have low wearability. In particular, the inertia-assisted piezoresistive chest band obtained a Pearson correlation coefficient with respect to the measurements based on breath count of 0.96 when the user was seated. Finally, Bland–Altman analysis demonstrated that the developed system obtained 0.68 Breaths Per Minute (BrPM) mean difference (MD), and Limits of Agreement (LoAs) of +3.20 and −1.75 BrPM when the user was seated.

1. Introduction

The respiratory rate is an important parameter when assessing a person’s health condition. The systems currently available for measuring it are expensive, cumbersome, and often uncomfortable for the patient [1]. Therefore, it is not surprising that scientific research is moving towards developing alternatives to the methods currently used. The applications of this type of research are manifold: for example, in health monitoring, performance tracking during sports activity, and patients suffering from sleep disorders (e.g., sleep apnea) [2,3]. A sensor capable of detecting the absence of breath and triggering an alarm to a doctor or caregiver could make the difference between life and death.
Various breathing-related phenomena can be used to estimate the breathing frequency: the flow of air emitted by the subject, the sound produced during breathing, the temperature or humidity of the air emitted, and the concentration of various chemical components, up to and including the modulation of the heart rate [4,5]. Photoplethysmography can be employed to detect multiple breathing and cardiac parameters by exploiting changes in blood light absorption due to physical mechanisms (i.e., heat and breathing activities) [6]. However, all these methods involve expensive sensors, and the resulting devices are often limiting or even intrusive for the patient. In breathing parameter monitoring, wearable devices can be applied for accurate, local, and non-obtrusive detection of patient parameters, and were widely applied to limit the spread of the COVID-19 pandemic [7,8,9]. Wearable devices enable the collection of large amounts of data that represent many aspects of a person’s health. Analysis of Big Data allows the detection of certain patterns and signatures that can aid in disease prediction and prevention [10]. Nevertheless, using these technologies in healthcare presents several challenges, including data munging and wrangling, robustness, and security.
The main characteristic of breathing is the inflow and outflow of air from the lungs, caused by the contraction and expansion of the lungs. Increasing and decreasing their volume consequently causes a movement of the ribcage, which can be detected through various technologies in a simple and non-intrusive way. Chest strain can be measured using resistive, capacitive, inductive, or fiber-optic sensors, in addition to bioimpedance techniques [11,12]; more simply, chest movements can be measured using inertial sensors [13,14]. The strength of these sensors lies in their versatility and non-obtrusiveness, making them ideal for various applications, and representing a reliable and inexpensive way of collecting users’ motion data. However, the inertia-based methods for detecting body movements are also highly susceptibility to motion artefacts.
This paper presents the development of a chest band for monitoring respiratory activity based on the piezoresistive transduction mechanism, which is widely employed for detecting biophysical parameters [15,16]. The device uses a novel piezoresistive strain sensor for patient breath monitoring applications based on the EeonTex (model LTT-SLPA-20K, manufactured by Eeonyx Inc., Pinole, CA, USA) smart textile and low power conditioning, processing, and communication sections. The device can be applied to the chest by an elastic band, making it comfortable given its shape and dimensions. It detects chest movements by a custom flexible piezoresistive sensor, extracting the breathing vibrations from the resistance variations induced by the variable stress applied to the smart textile. The output respiratory signal is amplified using a low power amplifier circuit; then, a lowpass filter properly eliminates the noise from the environment and body movements. After, the data are acquired and processed by a SAMD21G18A (manufactured by Microchip Inc., Chandler, AZ, USA) microcontroller board to extract the breathing parameters (respiration rate (RR), inhalation and exhalation times, inhalation-to-exhalation ratio (IER), flow rate (V)). The acceleration data provided by a MEMS (MicroElectroMechanical System) IMU (Inertial Measurement Unit) (model MPU-6050, manufactured by Invensense Inc., San Jose, CA, USA), integrated into the chest band, are used to delete the motion artefacts. Any movement of the patient’s body unrelated to breathing may induce some effects on the acquired signal, leading to errors in measuring the parameters of interest. Even when the user is sitting or lying down, the body’s movements due to bending or twisting of the trunk can affect the signal provided by the strain sensor [17]. The chest band integrates a BLE transceiver for transmitting the derived breathing parameters to a host device, allowing the remote monitoring of breathing data through a custom mobile application. The main contributions of the proposed scientific work are:
  • Hardware and firmware development of a piezoresistive chest band to detect the breathing parameters using a custom textile-based strain sensor;
  • Design of a custom mobile application for displaying the breathing parameters wirelessly transmitted by the chest band.
  • Comprehensive characterization of the developed device in measuring the RR in different operative conditions of the user (seated, standing, walking).
We believe that band devices offer better performance in terms of ease and stability of the application than systems placed on or glued to the body, or applied on the face [18,19]. Unlike other similar systems, the proposed wearable device is fully wearable, compact, and non-interfering, and does not require any external devices to acquire and process the data from the integrated sensors, while nevertheless providing comparable performance. Therefore, it offers a ready-to-use solution for remotely monitoring the patients’ health conditions.
The remainder of the paper is organized as follows: the next section presents a brief overview of related works on wearable devices that employ piezoresistive and inertial sensors to monitor respiratory parameters. Section 2 introduces the architecture of the developed chest bands, describing the features and specifications of the components and materials used. In addition, the firmware development supporting the chest band’s operation is introduced. Moreover, the mobile application used to monitor the breathing parameters transmitted by the chest band is described. Section 3 presents the characterization results of the chest band for different operative conditions. Section 4 discusses the obtained results, presenting the chest band’s performance in measuring other breathing parameters and comparing them with a spirometer. In addition, the test results on patients with different characteristics (gender, age, physical constitution) are reported. Finally, a comparative analysis of the presented chest band with similar devices is presented, highlighting the strengths and shortcomings.

Overview of Wearable Sensing Systems for Breathing Monitoring Based on Piezoresistive and Piezoelectric Sensors

Strain sensors can be integrated into wearable devices that exploit diaphragm contraction and relaxation to measure cardiovascular data. Specifically, piezoresistive or piezoelectric sensors can be included in belts, and thus deformed by the chest expansion resulting from breathing, providing a voltage variation proportional to the movement [20]. In particular, in [21], the authors presented a chest band for monitoring the RR comprising a piezoresistive sensor integrated into a 3D-printed case enabling converting the breathing-related tensile force into a compressive force. However, the main constraints of wearable systems relate to their lightness, small dimension, and flexibility, so that the user’s movements are not hindered [22]. For these reasons, several solutions are reported in the literature exploiting strain-sensitive textiles [23,24,25] and polymer-based materials [26,27]. In particular, in [24], the authors presented a KTC respiration monitoring system based on a piezoresistive sensing element integrated into Velcro support and a low-power electronic conditioning and acquisition section. In addition, the chest band integrates a Bluetooth transceiver to wirelessly transmit the gathered data. Similarly, in [25], C. Massironi et al. presented a wearable device for monitoring respiratory activity, relying on six piezoresistive sensors distributed on the ribcage. They used a piezoresistive textile, realizing a conductive area by knitting silver threads into the fabric. N. Molinaro et al. developed a wearable device to monitor breathing based on a piezoresistive smart textile comprising 89% silver nylon and 11% elastane [28]. In addition, the band includes a Wheatstone bridge, a voltage buffer, and an acquisition board. The tests conducted on six volunteers demonstrated that the developed device featured 0.11 V%−1 sensitivity and a maximum detectable RR of 36 BrPM, although it showed non-negligible hysteresis. M. Chu et al. introduced a novel wearable device to monitor the RR and HR; it uses two strain sensors placed on the ribcage and abdomen to detect the deformations induced by breathing and heartbeat [29]. Moreover, the integration of a piezoresistive layer can be an immediate solution for functionalizing common fabric. In [30], the authors developed an e-textile by incorporating an embroidered sensor based on a Velostat pressure-sensitive layer and conductive threads. The resulting sensors were used to develop a monitoring unit to detect vital parameters in infants, such as the RR and electrogardiogram (ECG). The sensor’s signal was acquired by a microcontroller section and processed to extract the interest parameters using properly tuned digital filters.
Moreover, in [26], the authors integrated four ERBs based on conductive silicone tubes into a T-shirt to detect chest and abdomen movements. The ERB’s signals were properly conditioned and acquired to monitor the tidal volume with a precision of ±10%. Similarly, T. Jayarathna et al. proposed VitalCore, a wearable device for measuring respiratory, cardiac, and actigraphy data using electroresistive polymer and inertial sensors [27]. Properly conditioned and acquired sensor signals were used to extract the breathing pattern, cardiac activity, and body movements.
In addition, piezoelectric materials are commonly used to develop wearable devices, exploiting their intrinsic capability of generating an electric signal without needing a polarization voltage. In [31], the authors presented an active breathing monitoring sensor based on a piezoelectric transducer-gated thin-film transistor (PTGTFT) for measuring the chest movements related to respiration, enabling high sensitivity and reliability. In [32], the authors developed a chest band integrating a polyvinylidene fluoride (PVDF) sensor for acquiring respiratory movements, the seismocardiogram (SCG), and heart tones. The output signals from the piezoelectric sensor and ECG are gathered simultaneously by a microcontroller-based section which filters them for extracting the information of interest. Specifically, the sensor output signal is amplified and acquired by a microcontroller that samples and filters to extract different information. Another way to record the heart’s activity and breathing movements is forcecardiography (FCG), which employs force sensors instead of accelerometers classically used for the seismocardiogram [33,34]. The two techniques were compared by simultaneously recording the output signals from an FCG sensor and an accelerometer (SCG) mounted on the same electronic board. The signals were amplified, sampled (sampling freq. = 10 kHz, ADC resolution = 14-bit), and filtered to separate the information content at low and high frequencies. The FCG signal shows two distinct components; the first at low frequency (1 Hz range, LF-FCG) and the second at high frequency (10 Hz range, HF-FCG). Two bandpass filters (with frequency ranges 0.5–5 Hz and 10–20 Hz, respectively) were used to extract the low- and high-frequency components of FCG and SCG, respectively.
Similarly, in [35], the authors presented a novel piezoelectric sensor capable of simultaneously recording heart vibrations and respiratory signals. A lead-zirconate-titanate (PZT) piezoelectric disk was employed for FCG measurement. The signals from the ECG and electro-resistive respiration band (ERB) were recorded simultaneously on six healthy volunteers and used as a reference. The respiratory component, identified as forcerespirography (FRG), was extracted from the raw signals using a third-order Savitzky–Golay filter with a window length of about 1.5 s, and afterwards subtracted from the raw signal to isolate the FCG component. The same processing was adapted with the signal provided by the ERB. Finally, the FCG signals produced by the two sensors were extremely similar, demonstrating that the innovative PZT sensor can be useful for monitoring both heart and breathing activities.
Artefacts induced by body movements represent the main limitation of approaches based on strain sensors for detecting biosignals. The inertial data can be properly combined with those provided by other sensors to remove the motion artefacts [36,37].
For instance, A-spiro, a wearable sensing technology that estimates respiratory flow and volume, in addition to the respiratory rate, is presented in [38]. It consists of a chest band equipped with a capacitive strain or stretch sensor that measures the chest’s expansion and contraction and an inertial sensor. The body and breathing motions were discerned using the Hilbert–Huang Transform (HHT), overcoming the limitations provided by Fourier analysis and comparable techniques. Moreover, the signal was decomposed into a finite and small number of single oscillatory modes, due to the Empirical Mode Decomposition technique. After isolating the breathing cycles, the RR was determined, by counting the number of breaths per minute. A-spiro was tested on 20 people of diverse ethnicities and ages, determining the respiratory rate, tidal flow, and minute ventilation estimates. A-spiro’s model demonstrated 93% accuracy across six activities compared to a spirometer. Finally, information from strain and inertial sensors can be jointly processed to improve the detection of breathing parameters or dangerous conditions. In [39], N. Wolf et al. presented a new sensor for detecting breathing patterns related to sudden infant death incidents. The chest band combines a strain sensor realized by conductive fabric and an inertial unit; the collected data are employed to train a multi-layer neural network (12 neurons in the hidden layers). The test results demonstrated that the proposed system reached an 89.9% overall classification rate, 89.3% true positive rate (TPR), 91.5% true negative rate (TNR), 1.7% false positive rate (FNR), and 8.5% false negative rate (FNR). In Table 1, a summary of the strengths and limitations of the devices presented in the previous scientific works is presented. Compared to the presented devices, the proposed chest band is characterized by a small size and absence of moving parts, making it discreet and unobtrusive. In addition, the proposed device performs the conditioning, acquisition, and processing of data directly onboard without the need for an external processing unit. Unlike many devices based on piezoresistive and piezoelectric sensors, the presented device reduces the effects of artefacts induced by body motions by combining the strain sensor data with inertial data provided by an onboard accelerometer. Other functional and performance comparisons are reported in Section 4.2.

2. Materials and Methods

This section introduces the architecture of the developed chest band for breathing monitoring; first, the developed piezoresistive chest band is presented, which uses a custom strain sensor based on piezoresistive textiles. Then, the firmware implemented by the chest band to derive the breathing parameters is presented. Finally, the mobile application used to wirelessly monitor the data transmitted from the chest band is introduced.

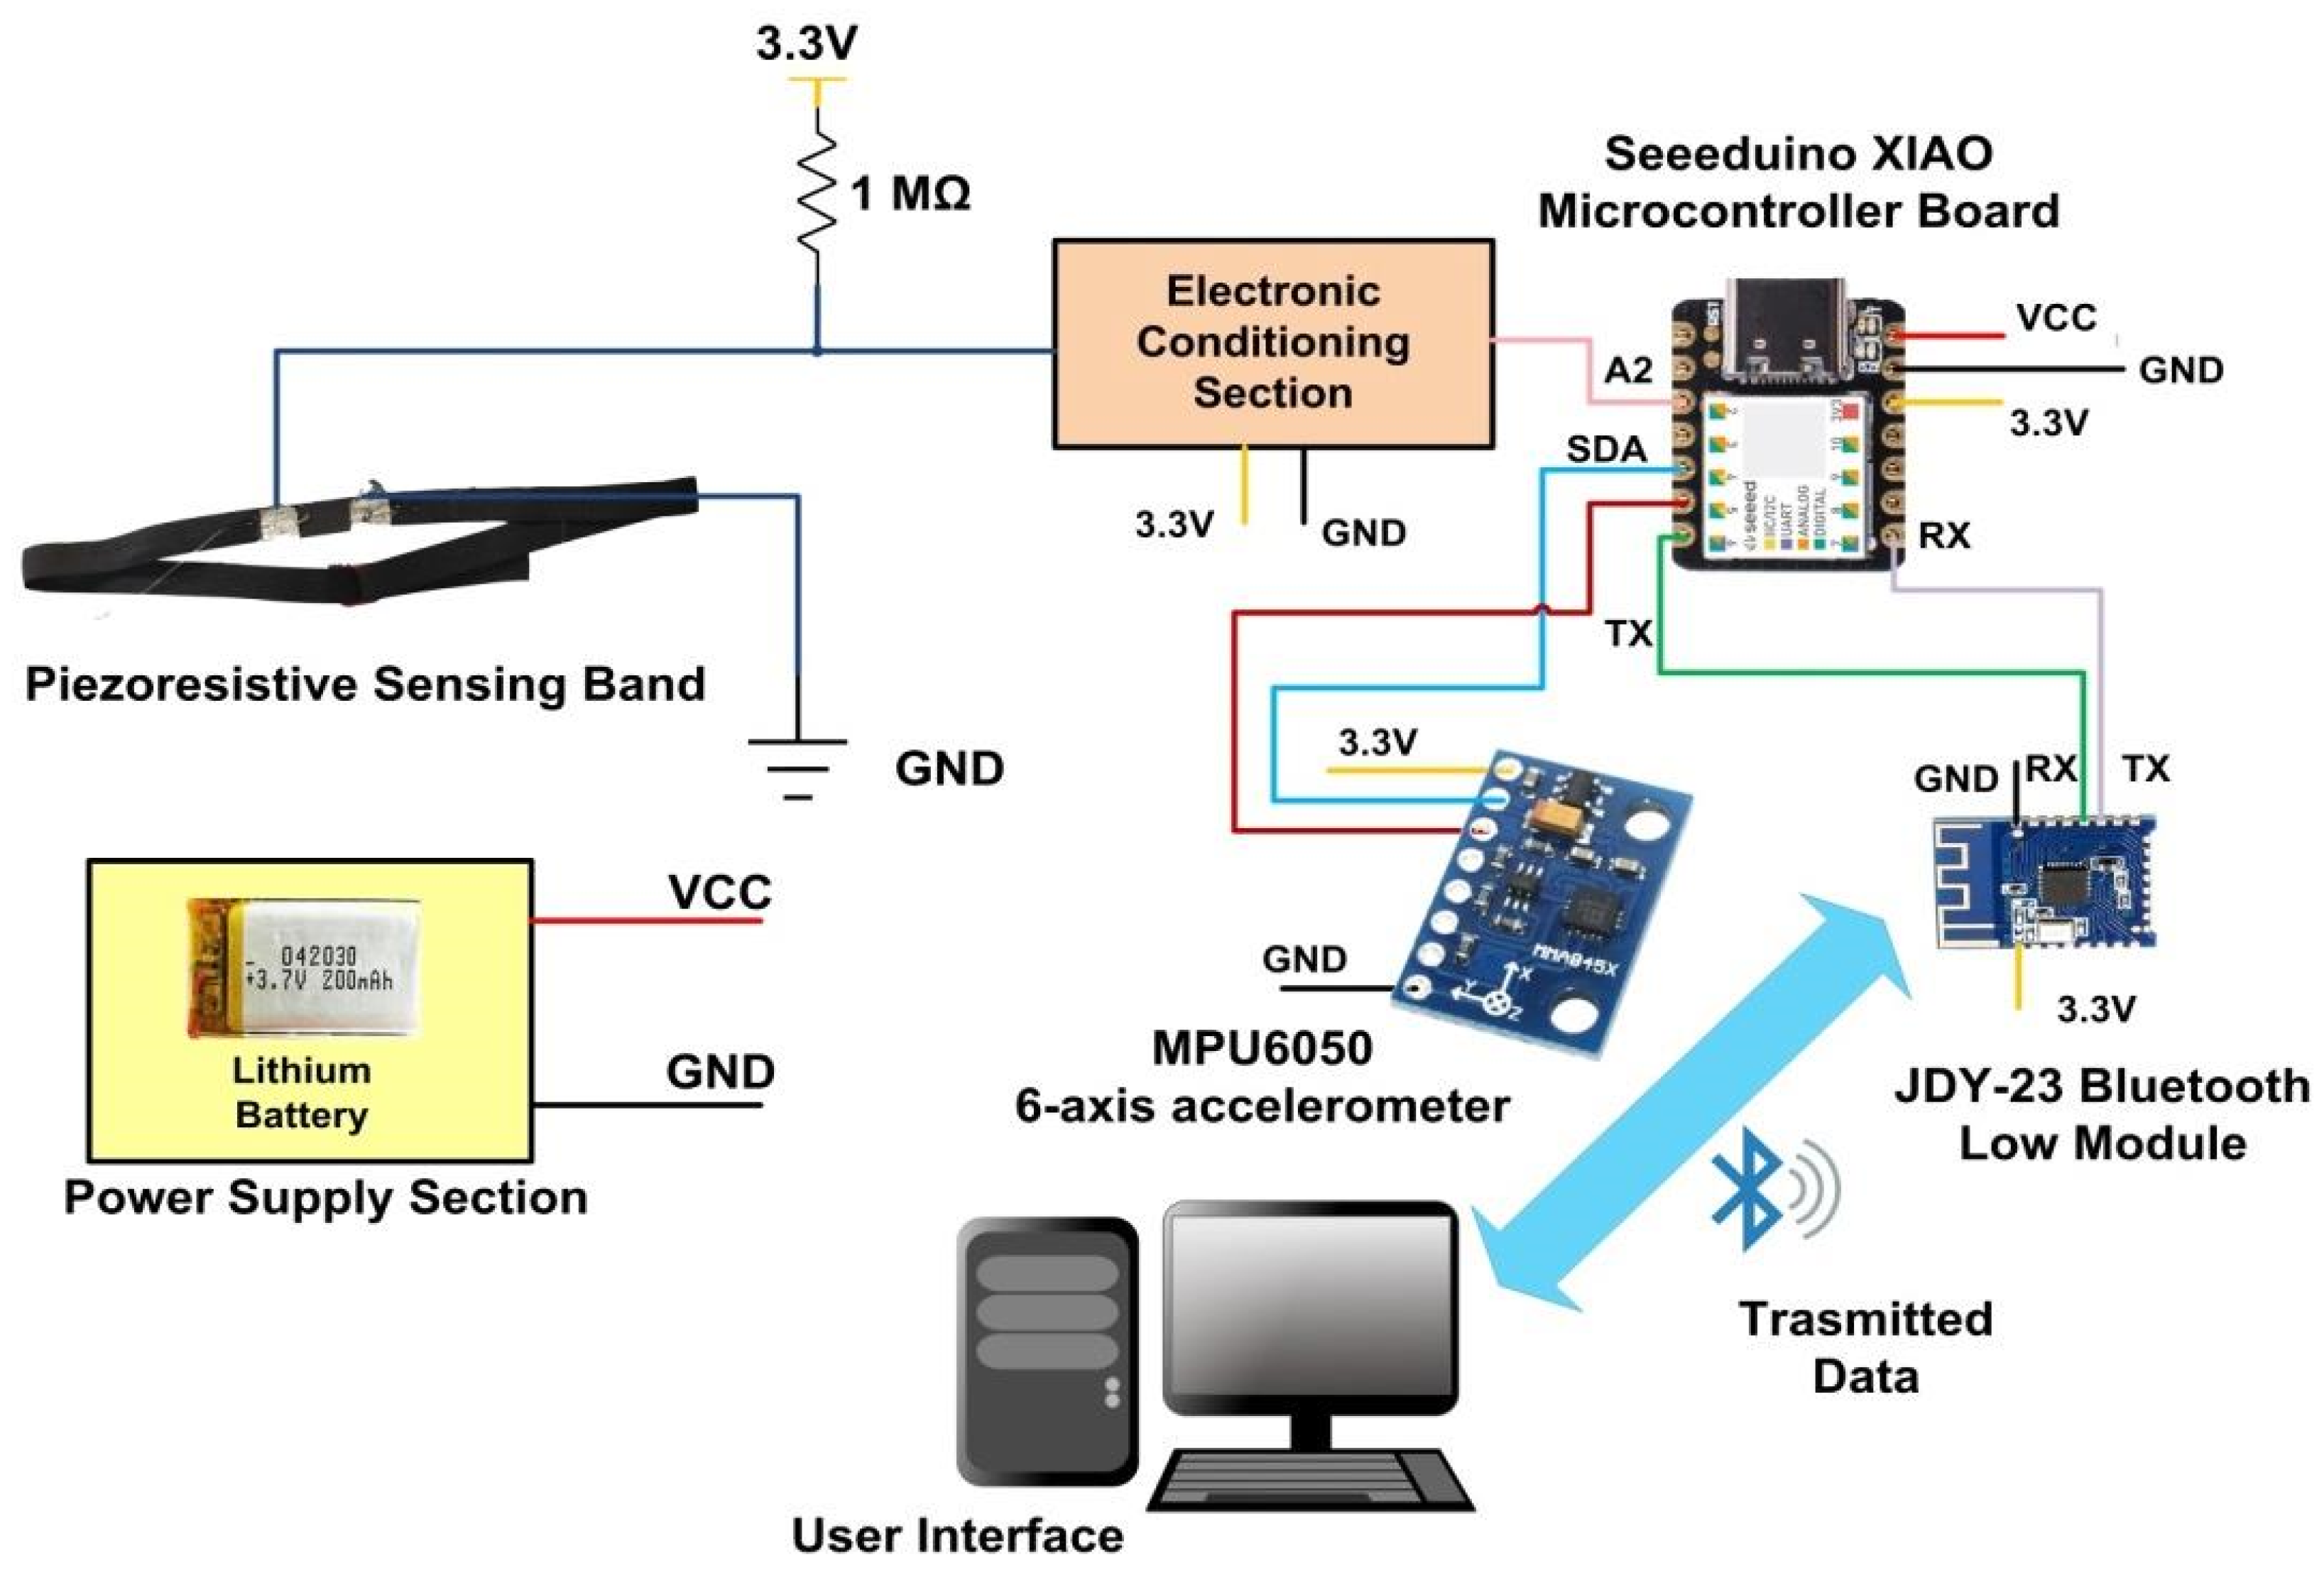
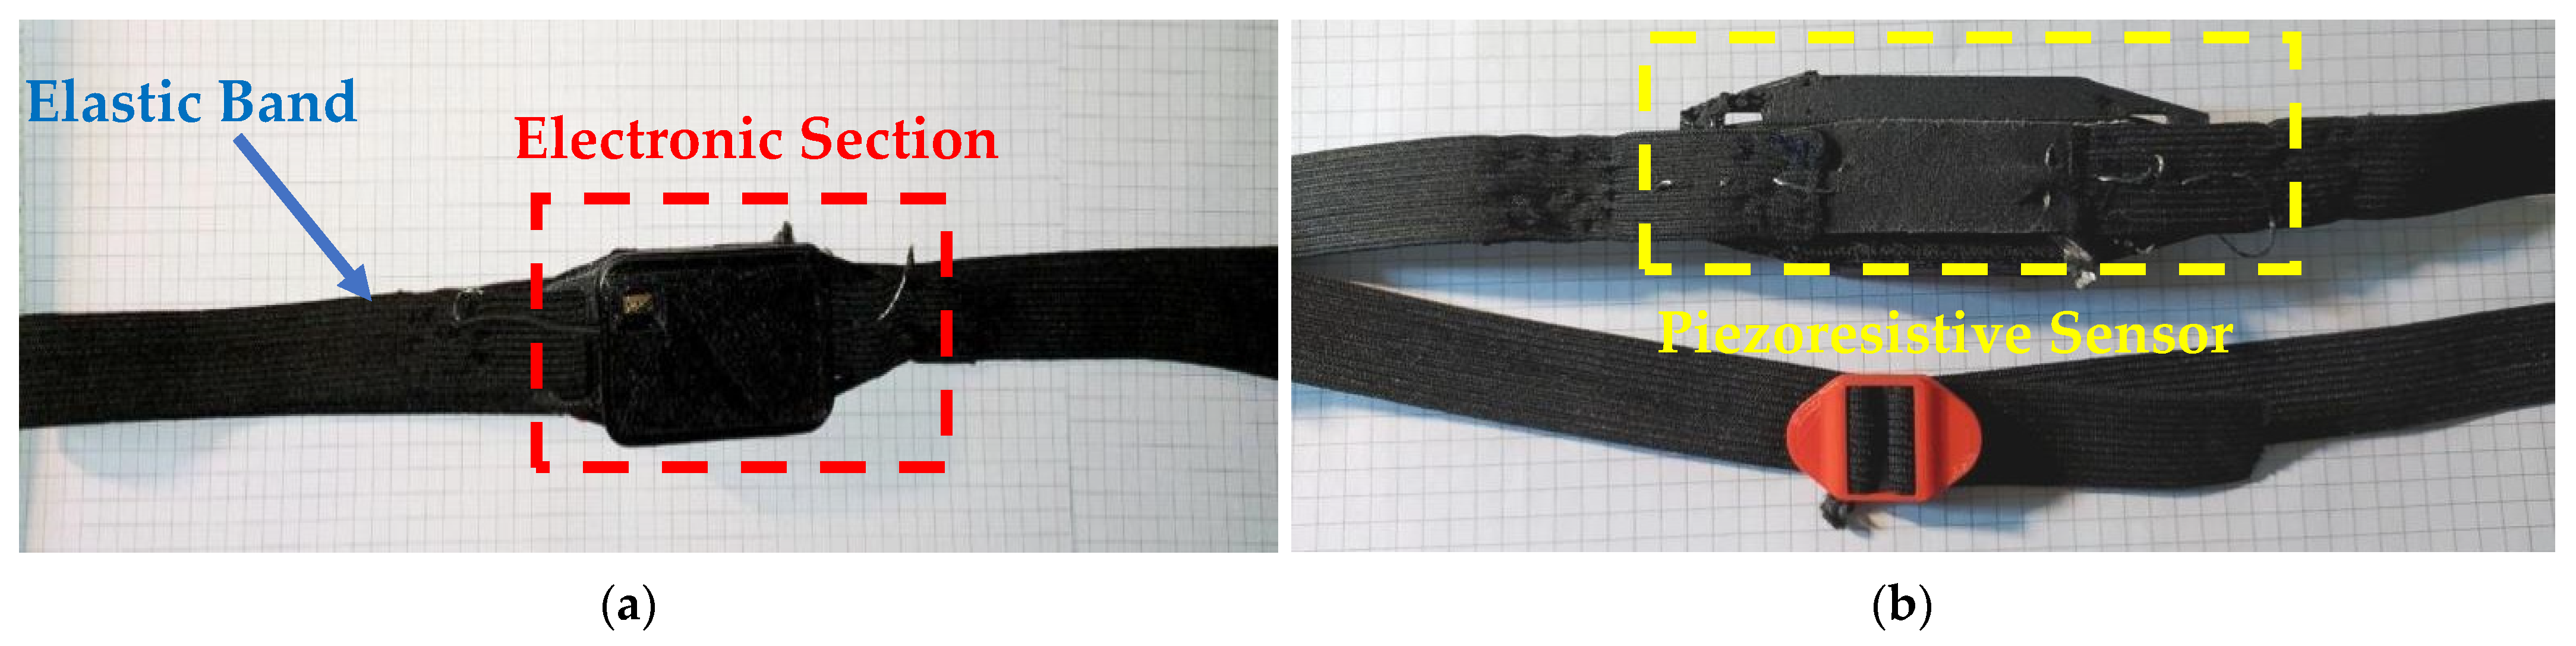
2.1. Architecture of Piezoresistive Chest Band Based on Strain-Sensitive Textile

In this subsection, the architecture of the designed inertia-assisted piezoresistive chest band is reported, dealing with its different parts and phases: the piezoresistive chest band, electronic conditioning and processing section, and prototype assembly.

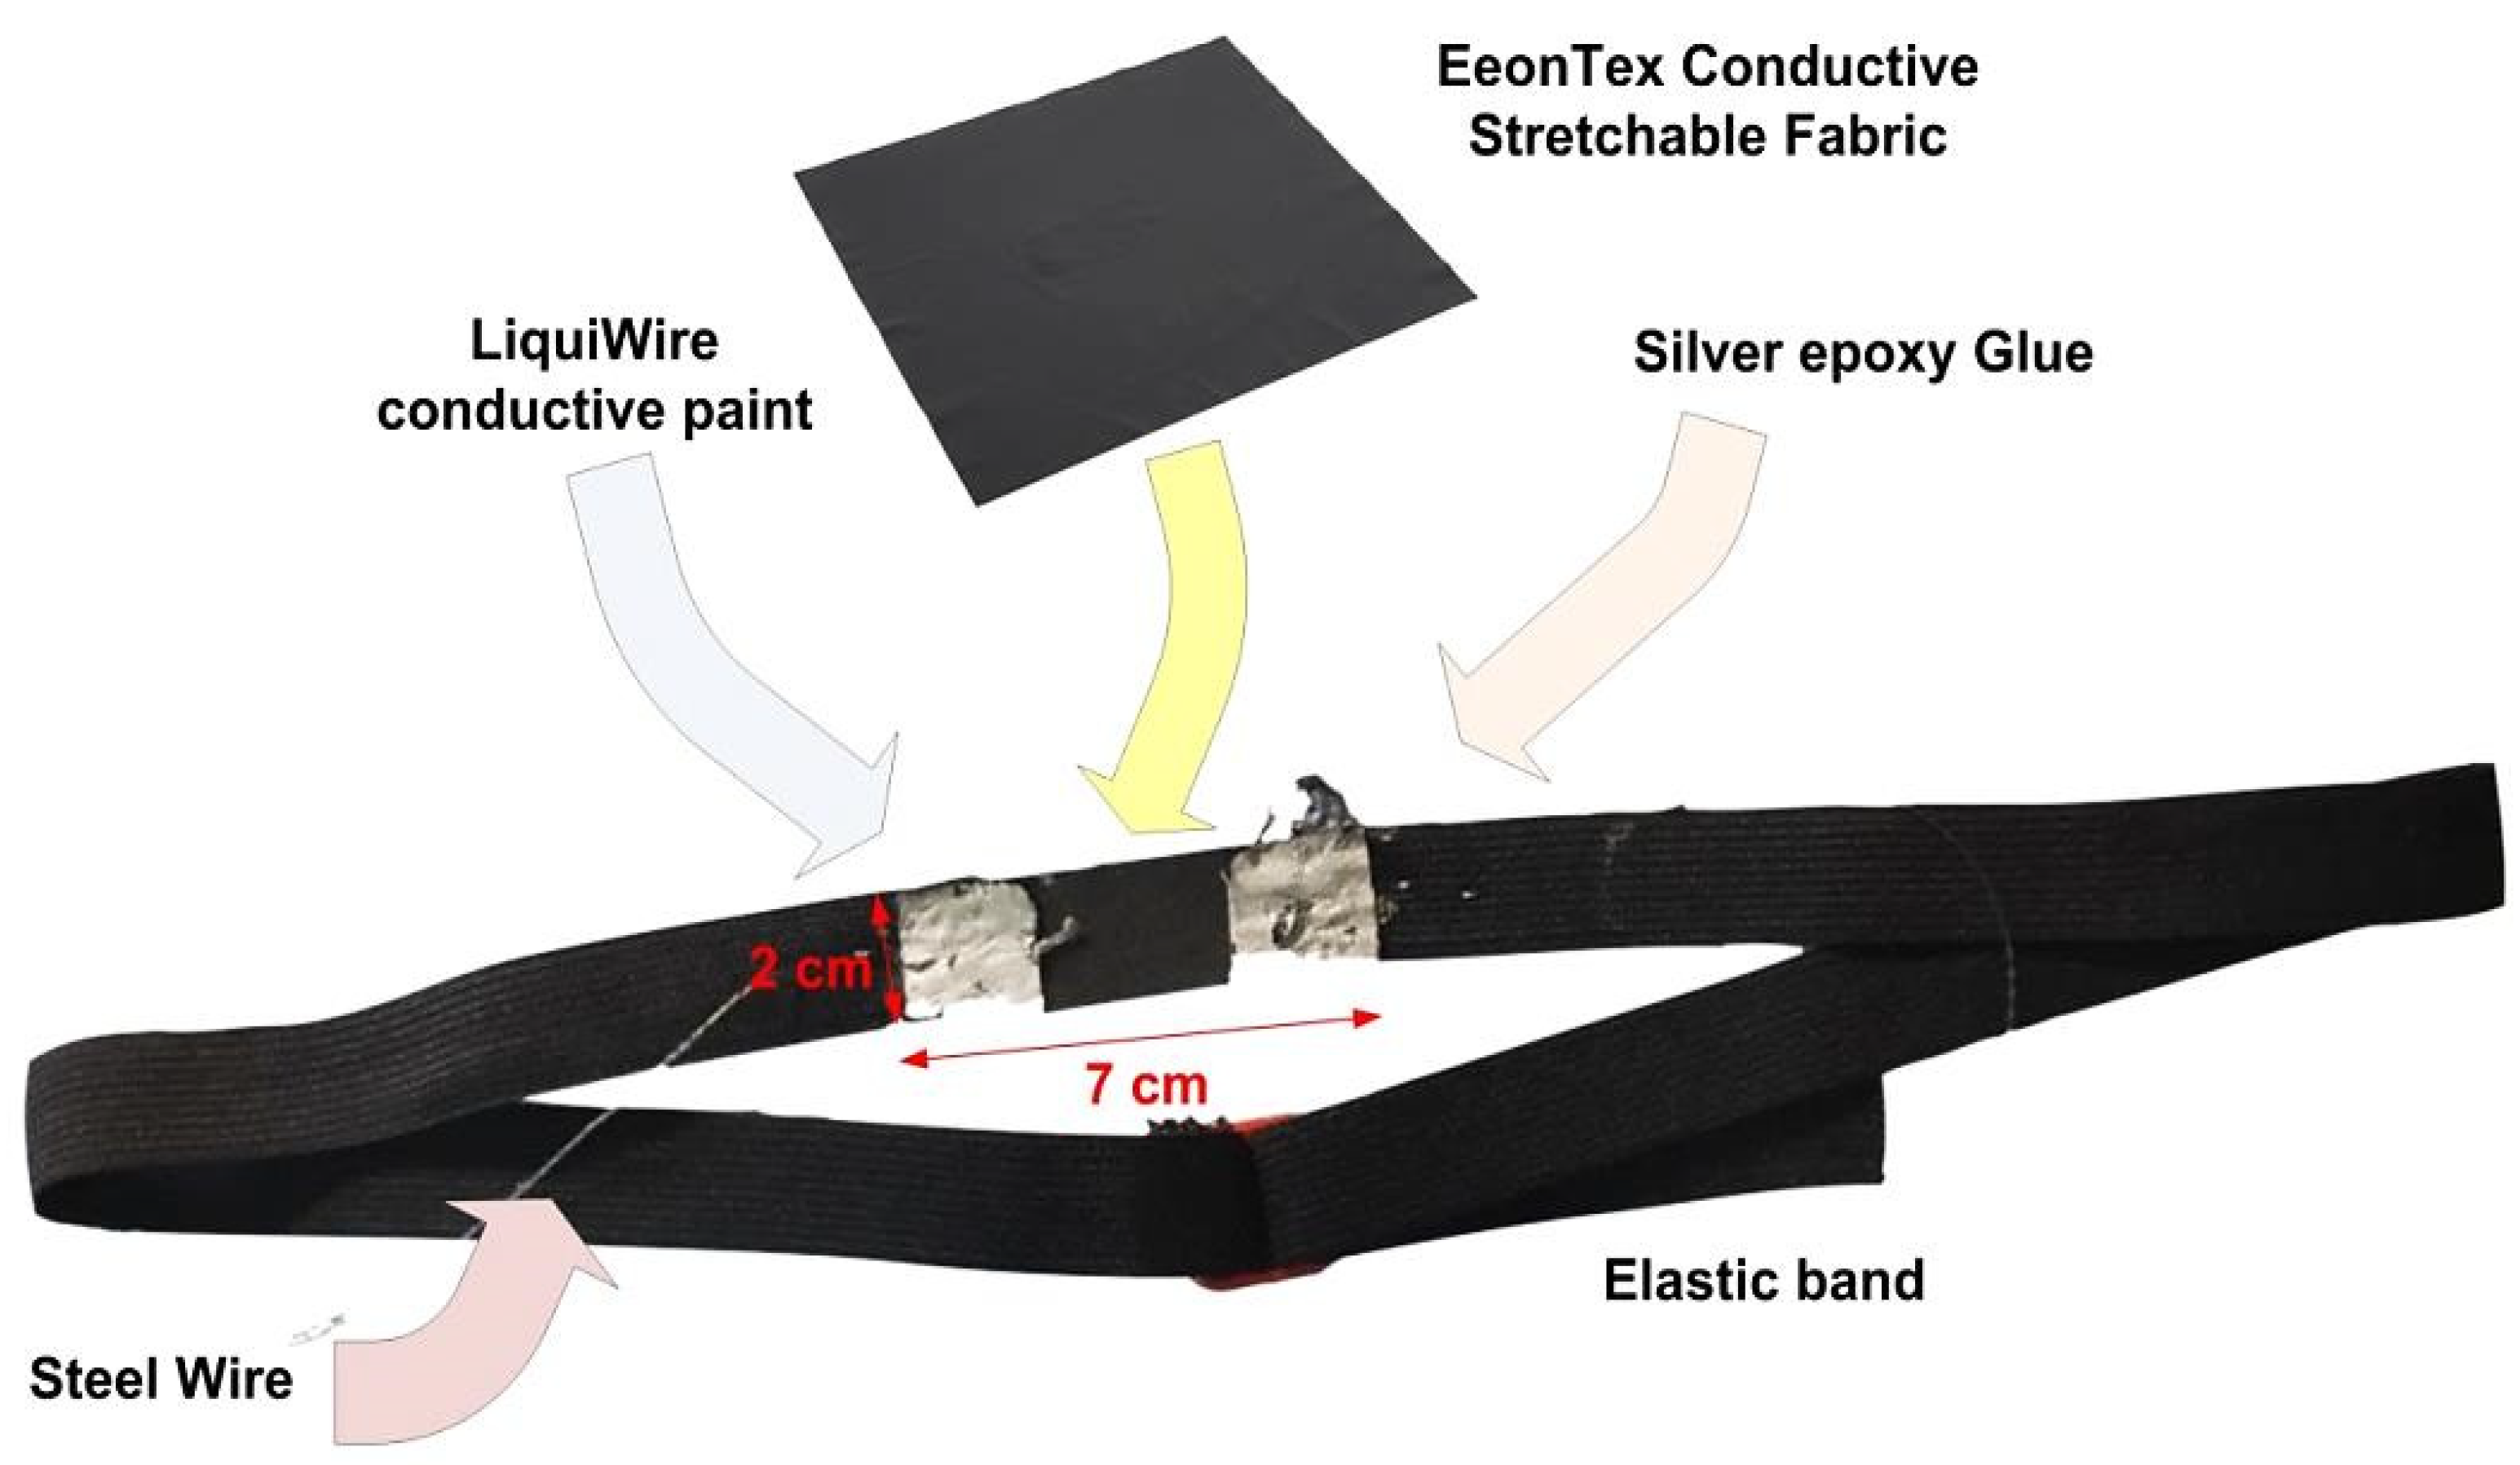
2.1.1. Development of the Piezoresistive Sensor Band

The breathing sensor consists of a piezoresistive sensing band that changes its electrical resistance when stretched or released, connected to an electronic conditioning and acquisition section. The piezoresistive sensing band is realized with an elastic band, including a custom piezoresistive strain sensor based on the EeonTex fabric (model LTT-SLPA-20K, Figure 1).
The sensor comprises a layer of EeonTex conductive stretchable fabric having dimensions 7 × 2 cm. Two flexible electrodes are realized on the layer’s edges by covering two squares of 2 × 0.5 cm with silver-loaded conductive glue (model 8331, manufactured by MG Chemicals), which fixes the piezoresistive layer and improves the overall conductivity [40]. Underneath the electrode areas, the piezoresistive layer is impregnated with LiquiWire® conductive paint to enhance its conductivity, thus obtaining two thin and flexible electrodes (Figure 1) [41]. This band is supposed to be worn by the user, exploiting the piezoresistive behavior of the EeonTex material (model LTT-SLPA-20K) to detect the abdominal and chest movements related to the respiratory activity. Highly flexible, thin stainless steel threads connect the sensor electrodes to the conditioning section, which are sown directly onto the elastic band. In particular, the thread’s material is SUS316L steel, which is characterized by low resistance, good electrical conductivity, and extreme resistance to heat (up to 1300 °C) and corrosion, in addition to providing an electromagnetic shield.
The EeonTex fabric is a bidirectionally stretchy nylon/spandex elastic fabric having a long-lasting conductive composition. This material is used for pressure and strain sensor applications. EeonTex fabric has a tunable surface resistivity from 104 to 107 Ω/square (Ohm/square), a mass per unit area of 4.8 oz/sq.yd, and a warp in the range 198–248 yarns/inch with an 85% warp recovery, making it highly flexible. In particular, the selected model is the LTT-SLPA-20K, featuring 20 KΩ/square surface resistivity, which decreases by 1/2 when stretched [42]. The material is washable, demonstrating no significant increase in resistivity after 30 wash cycles. The main specifications of the EeonTex LTT-SLPA fabric are:
  • Composition: nylon 72%/spandex 28%;
  • Mass per unit area: 4.8 ounces/square yard;
  • Surface resistivity: 20 KΩ/ square;
  • Thickness: ~15 mils (0.38 mm);
  • Elongation: warp 198–248 yarns/inch, warp recovery 85%;
  • Dynamic range: 5 g–150 kg.
However, it must be mentioned that the EeonTex stretchable fabric has a reduced non-linearity of the resistance vs. strain characteristic (0.0479 RMSE/ R ¯ ) and wide linearity strain range (20–70%), as demonstrated in [43]. In addition, the material presents a low hysteresis (at most 7%) and fast responsivity, making it suitable for dynamic movement tracking. Moreover, the EeonTex fabric decreases its resistance when subjected to several stretching and relaxation cycles [43]. Considering the performance above, the EeonTex fabric was deemed suitable for the presented application.
The resulting sensing band is compact (2 cm width) and light (5 g weight), and requires no moving parts. In addition, its positioning only on the lower part of the chest makes it discreet and non-obstructive.

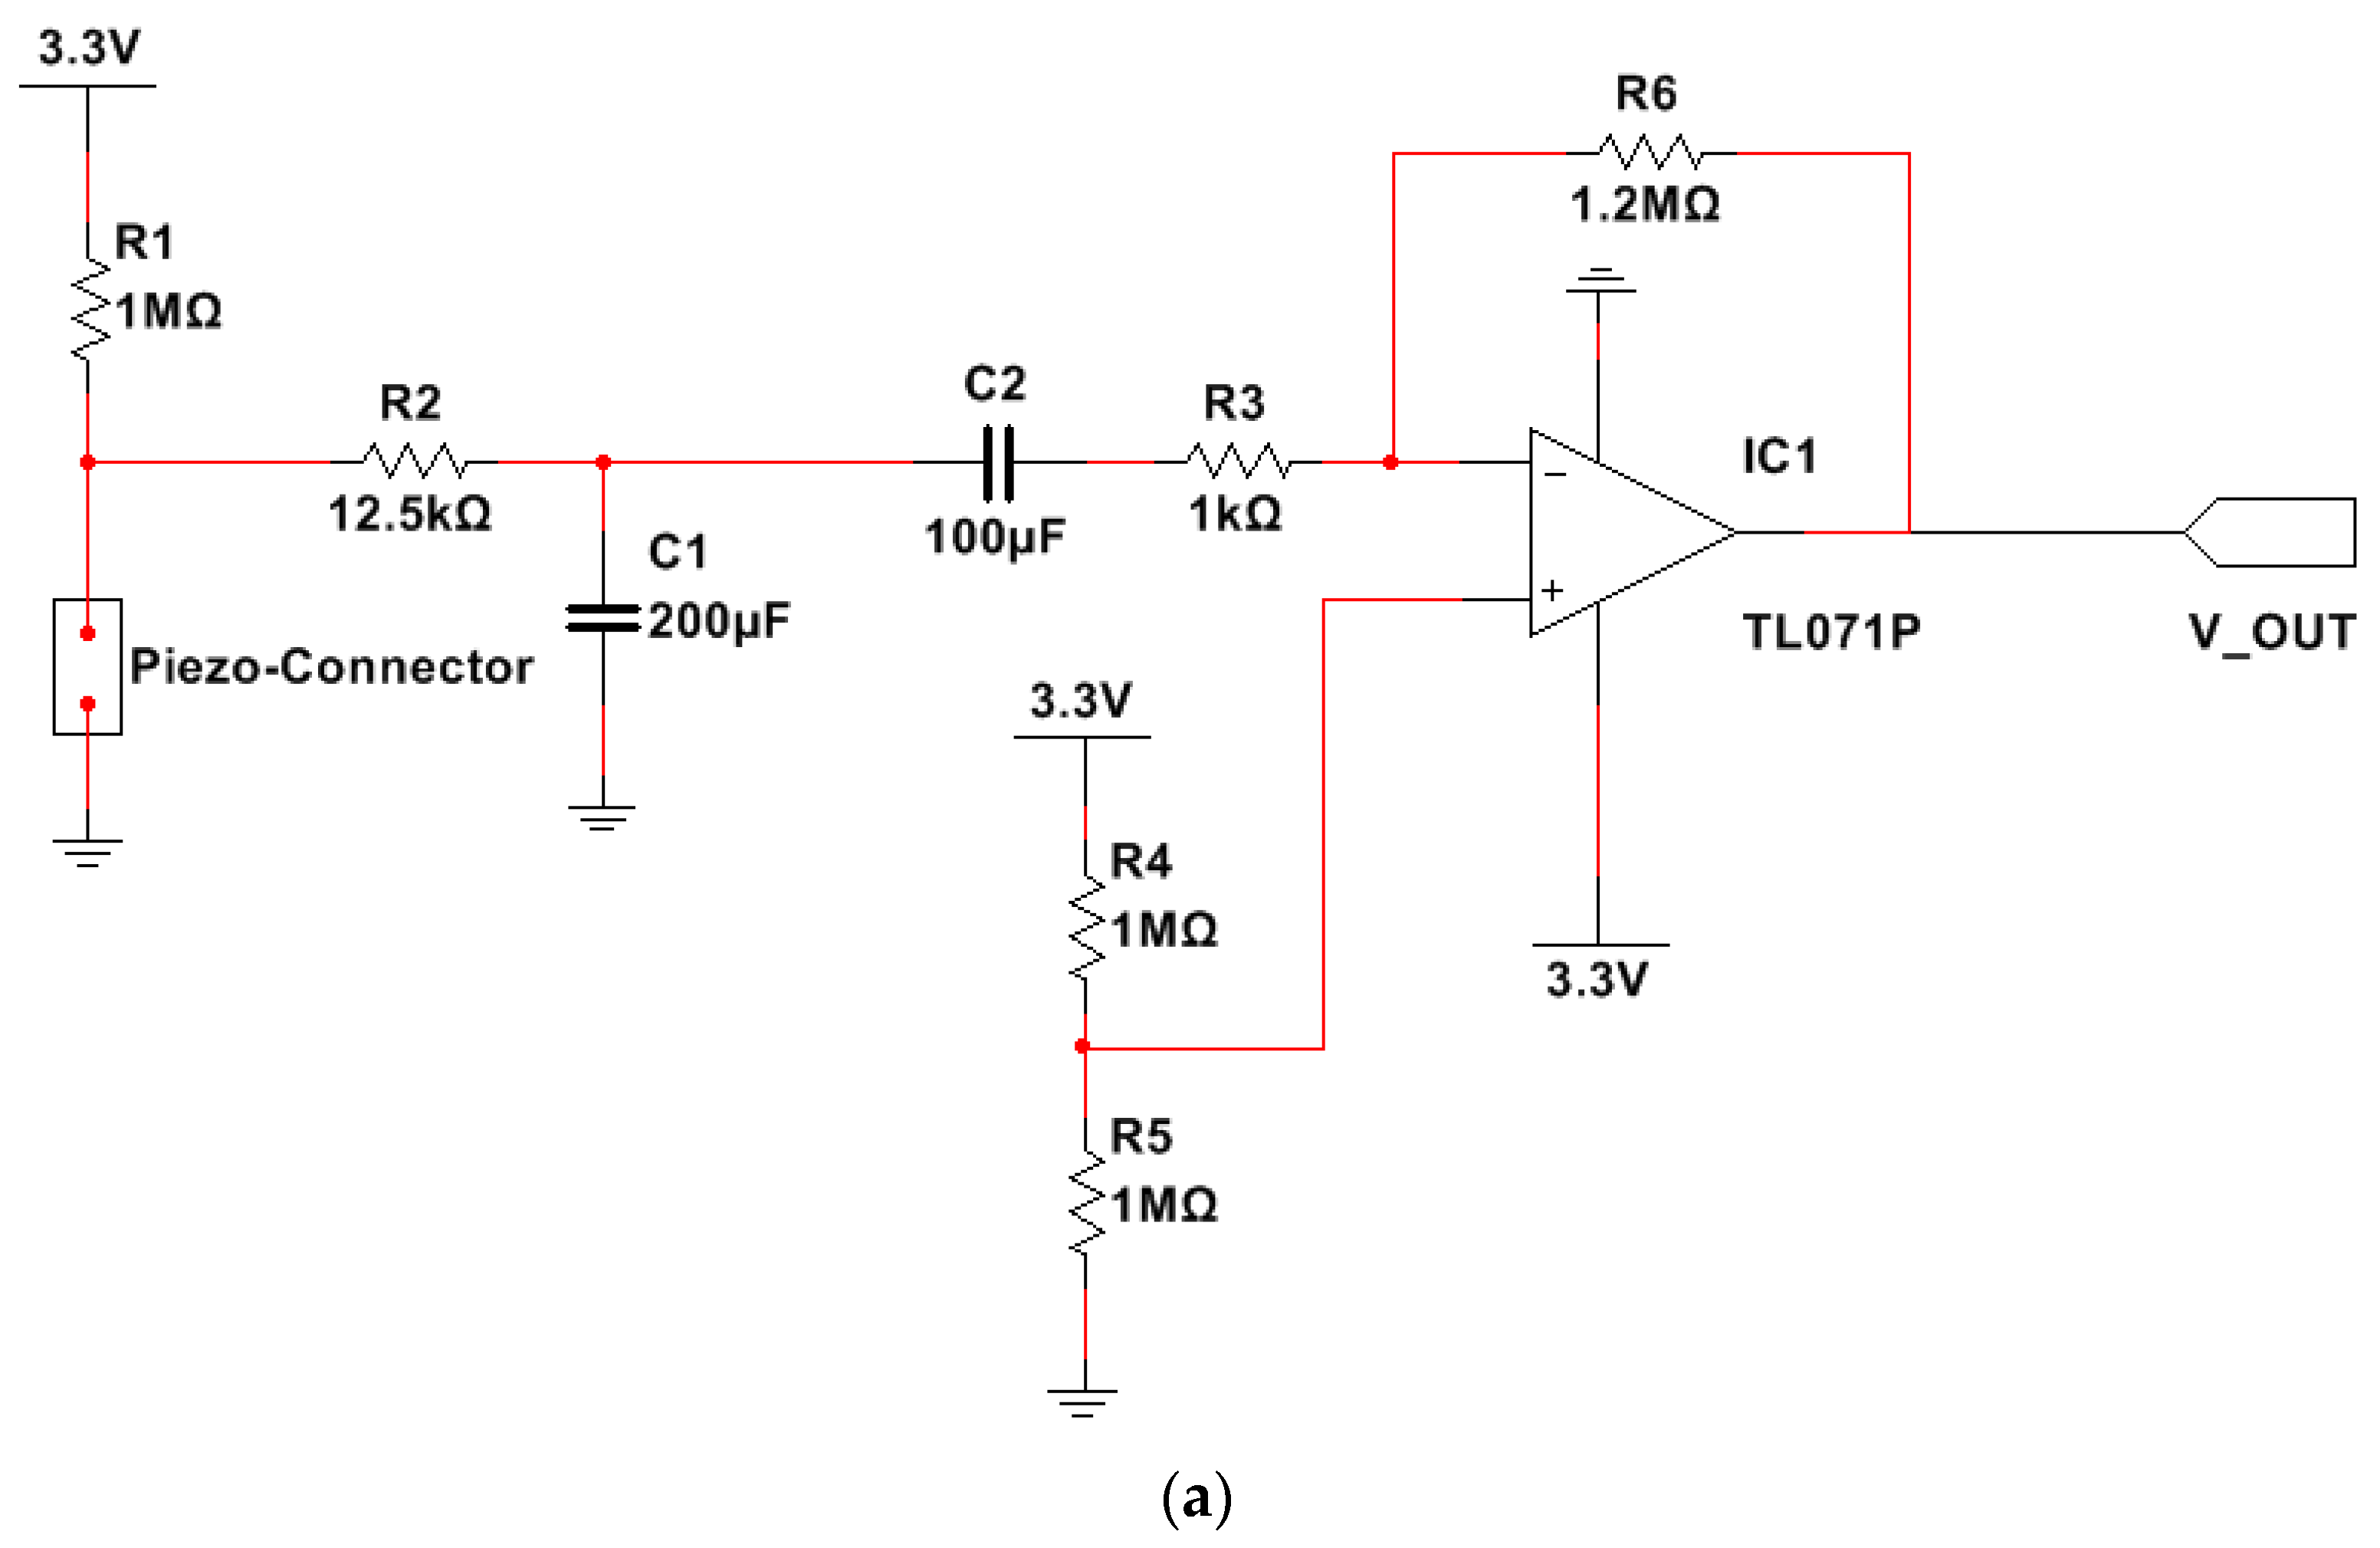
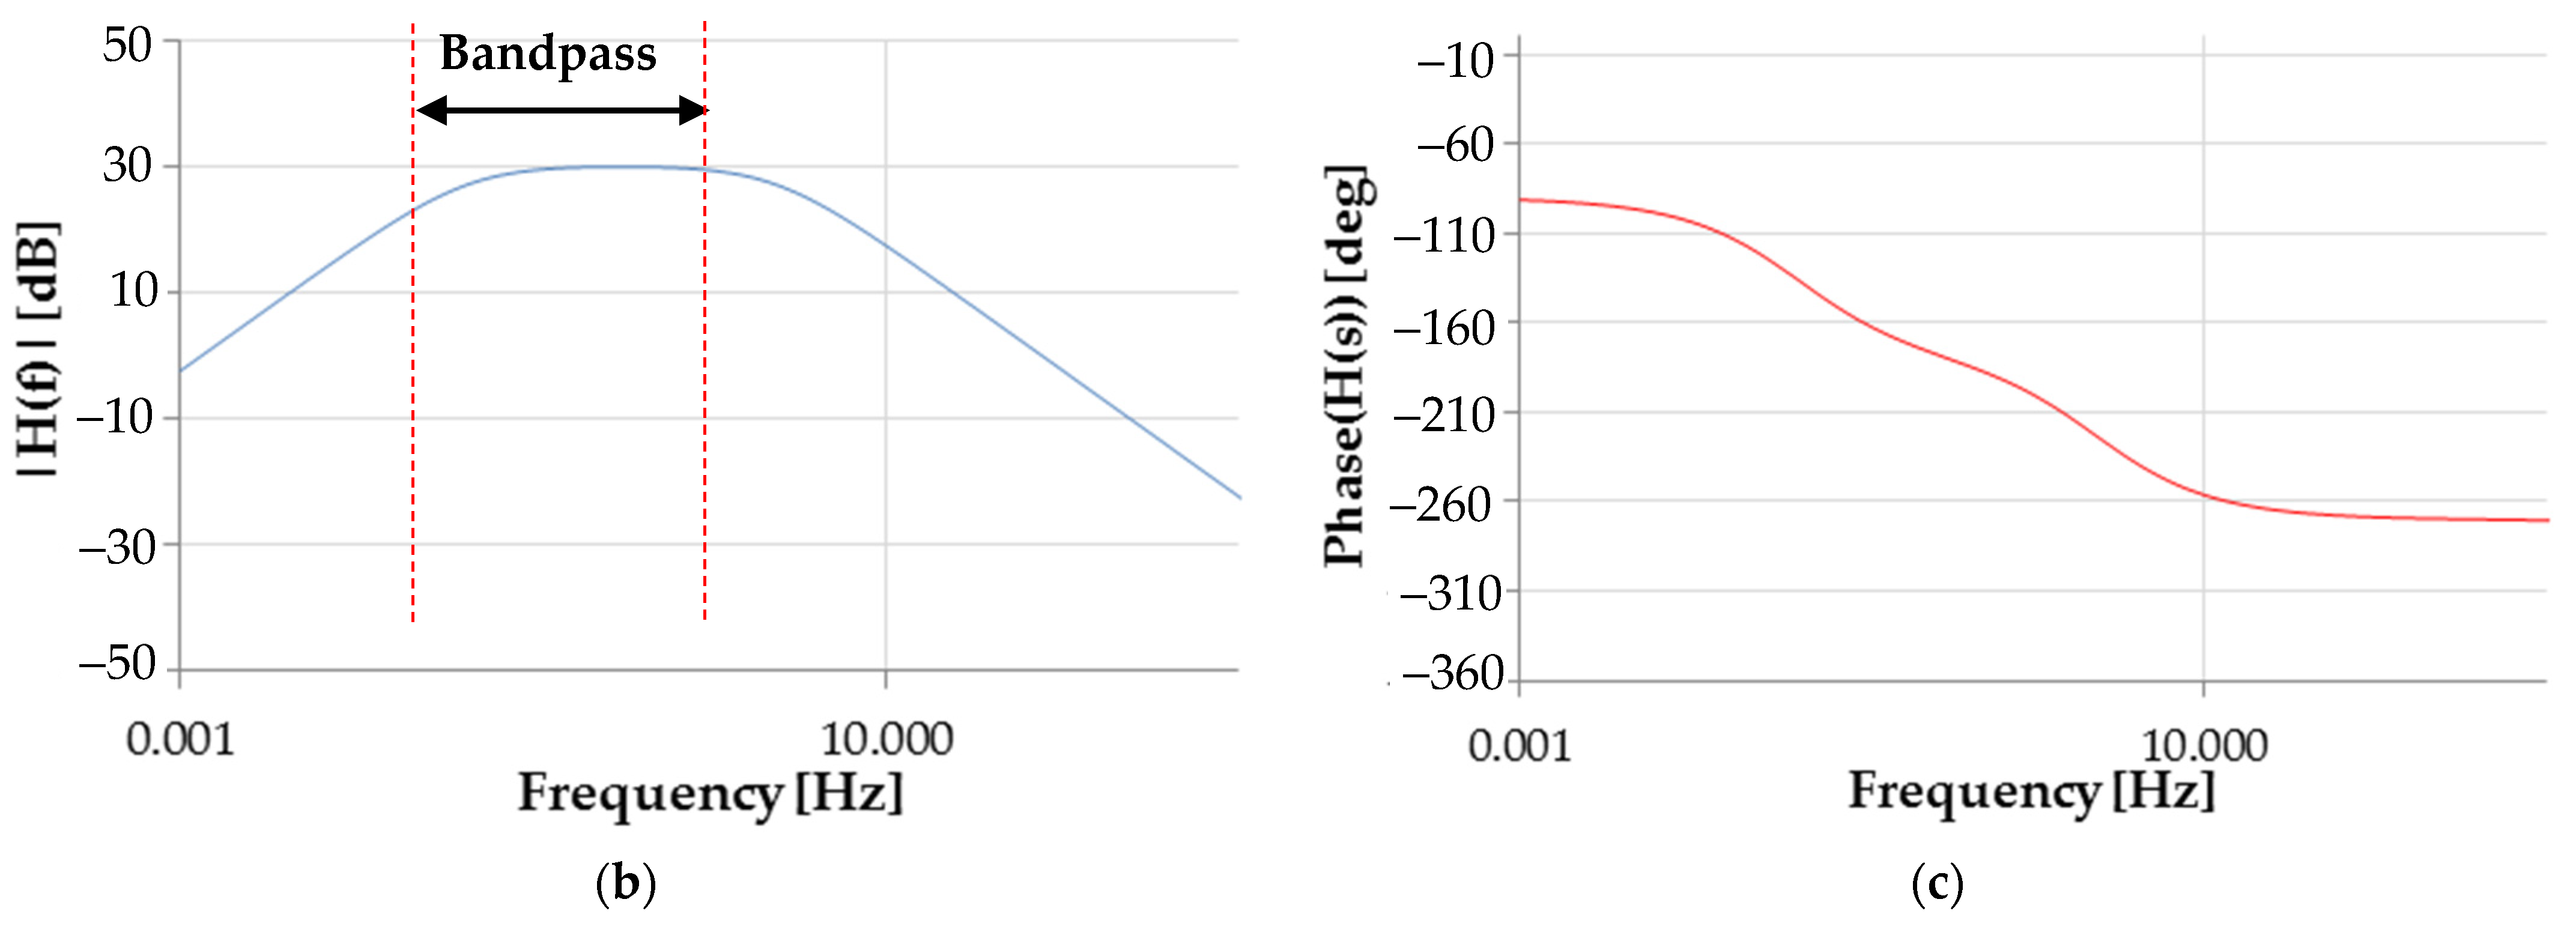
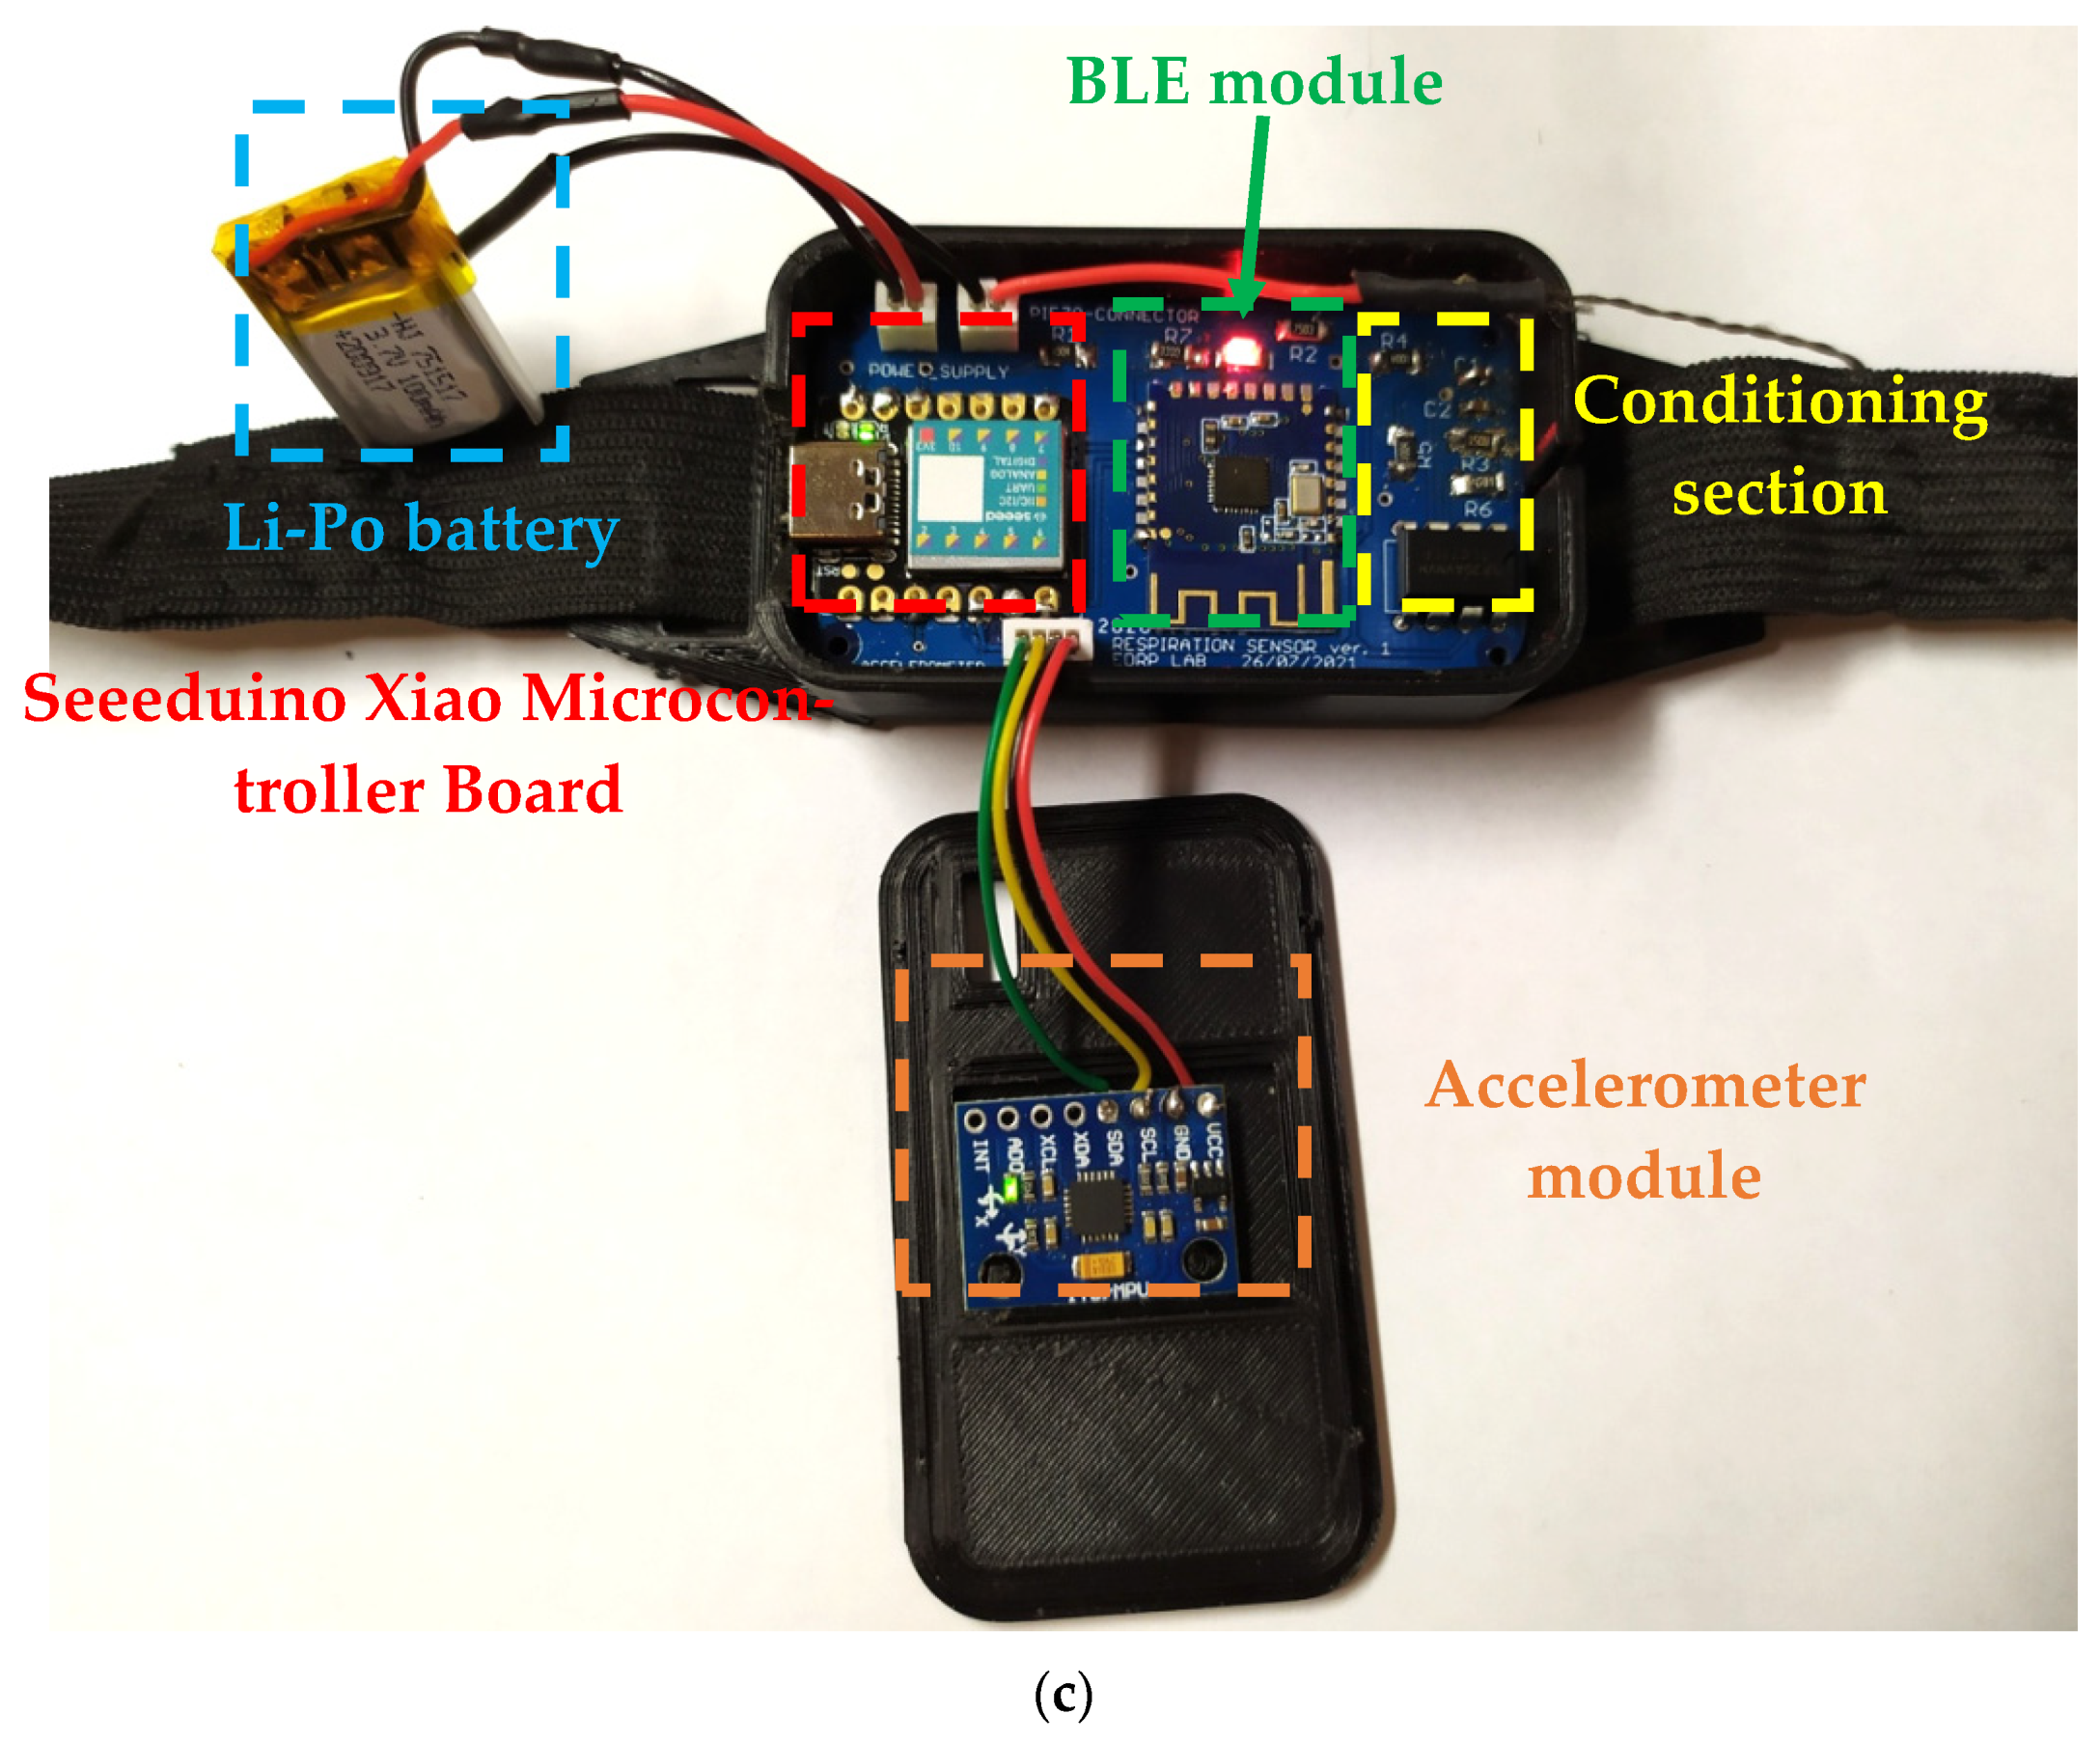
2.1.2. Electronic Conditioning and Processing Section of the Developed Chest Band

The piezoresistive strain sensor is configured in a voltage divider with a 1 MΩ pull-up high-precision resistor to convert the resistance changes due to mechanical strain into a voltage signal. The voltage divider is supplied by 3.3 V, from the piezoresistive elastic band; thus, the output voltage Vout is expressed by the following equation:
V out = R piezores R piezores + 1   M Ω   ×   3.3   V
During breathing, the chest is subject to undulatory movements related to the inhalation and exhalation phases; therefore, the piezoresistive sensor undergoes alternate tensile stress corresponding to a resistance change ( R piezores ) acquired by an analog channel of the SAMD21G18 microcontroller (Seeeduino Xiao board) integrated into the onboard electronic section. Before the acquisition, the voltage signal is conditioned by an active bandpass filter (Figure 2a), realized with TL071 opamp (manufactured by Texas Instruments, San Jose, TX, USA), characterized by [44]:
  • Cut-off frequencies equal to about 41 mHz ( f L ) and 2.5 Hz, respectively;
  • Band gain ( | G | equal to 30 dB (31.62 in linear scale).
This stage is used to remove the DC component from the signal provided by the piezoresistive band; in addition, the filter removes noise and signal components that fall in its stopband, leaving signal components in the passband (from 41.5 mHz and 2.5 Hz). This frequency range allows amplification of the signal related to the respiratory component, featured by a frequency between 0.2 and 0.75 Hz (medium respiration rate).
The TL071P is a low-noise operational amplifier [44]; it is characterized by low offset (1 mV, typical) and bias current (±1 pA), and high slew rate (20 V/μs), and common-mode input to the positive supply. The device was chosen for the considered application since it presents low noise ( V n = 18 nV Hz , @ f = 1   Hz ) and power consumption (940 µA).
Since the operational amplifier was fed with a unipolar power supply, a DC component equal to half of the supply voltage was added to the information signal. This voltage was derived with a voltage divider realized with two 1 MΩ resistors and applied to the opamp non-inverting input.
The strength of the proposed system is precisely its ability to perform conditioning, acquisition, and processing onboard the chest band without the need for an external processing unit. Specifically, the resulting signal is acquired by the 12-bit ADC integrated into the SAMD21G18 microcontroller; the latter preprocesses the raw data by a real-time lowpass digital filter. Specifically, a second-order lowpass Butterworth digital filter with a 0.5 Hz cut-off frequency is employed to extract the respiratory signal, thus removing all of the components due to voluntary and involuntary movements. Then, the microcontroller processes the filtered data to determine the breathing parameters, as described in Section 2.2. The acquired data are wirelessly sent in real time to a PC using an onboard BLE transceiver (model JDY-23, manufactured by Jindouyun Electronic Technology Co., Ltd., Shenzhen, China), allowing remote patient monitoring. A primary concern related to medical device communication on the BLE protocol is a man-in-the-middle (MITM) attack, which can occur when a third entity is able to emulate both the wearable and host devices, and thus sniff sensitive data. BLE employs a secure method for exchanging the encryption data, based on the Elliptic Curve Diffie–Hellman (ECDH) algorithm, in addition to AES-CCM, for protecting the communication against MITM attacks [45].
Unlike many piezoresistive and piezoelectric sensor-based systems, the proposed device decreases the impact of artefacts caused by body movements by integrating strain sensor data with inertial data provided by an onboard accelerometer. Indeed, the device comprises a 3-axis accelerometer and 3-axis gyroscope, model MPU-6050, to support the detection algorithm and remove the motion artefacts, as detailed in Section 2.2. The electronic section is powered by a 100 mAh Lithium-Polymer battery (model HJ751517, manufactured by Hongjie Electronic Co. Ltd., Guangdong, China). The supply voltage for feeding the other components included in the proposed device is provided by the 3.3 VDC output of the Seeduino Xiao board, derived by the onboard XC6206P332MR (manufactured by Torex Semiconductor Co., Ltd., San Jose, CA, USA). The schematic representation of the developed RR monitoring system is depicted in Figure 3.

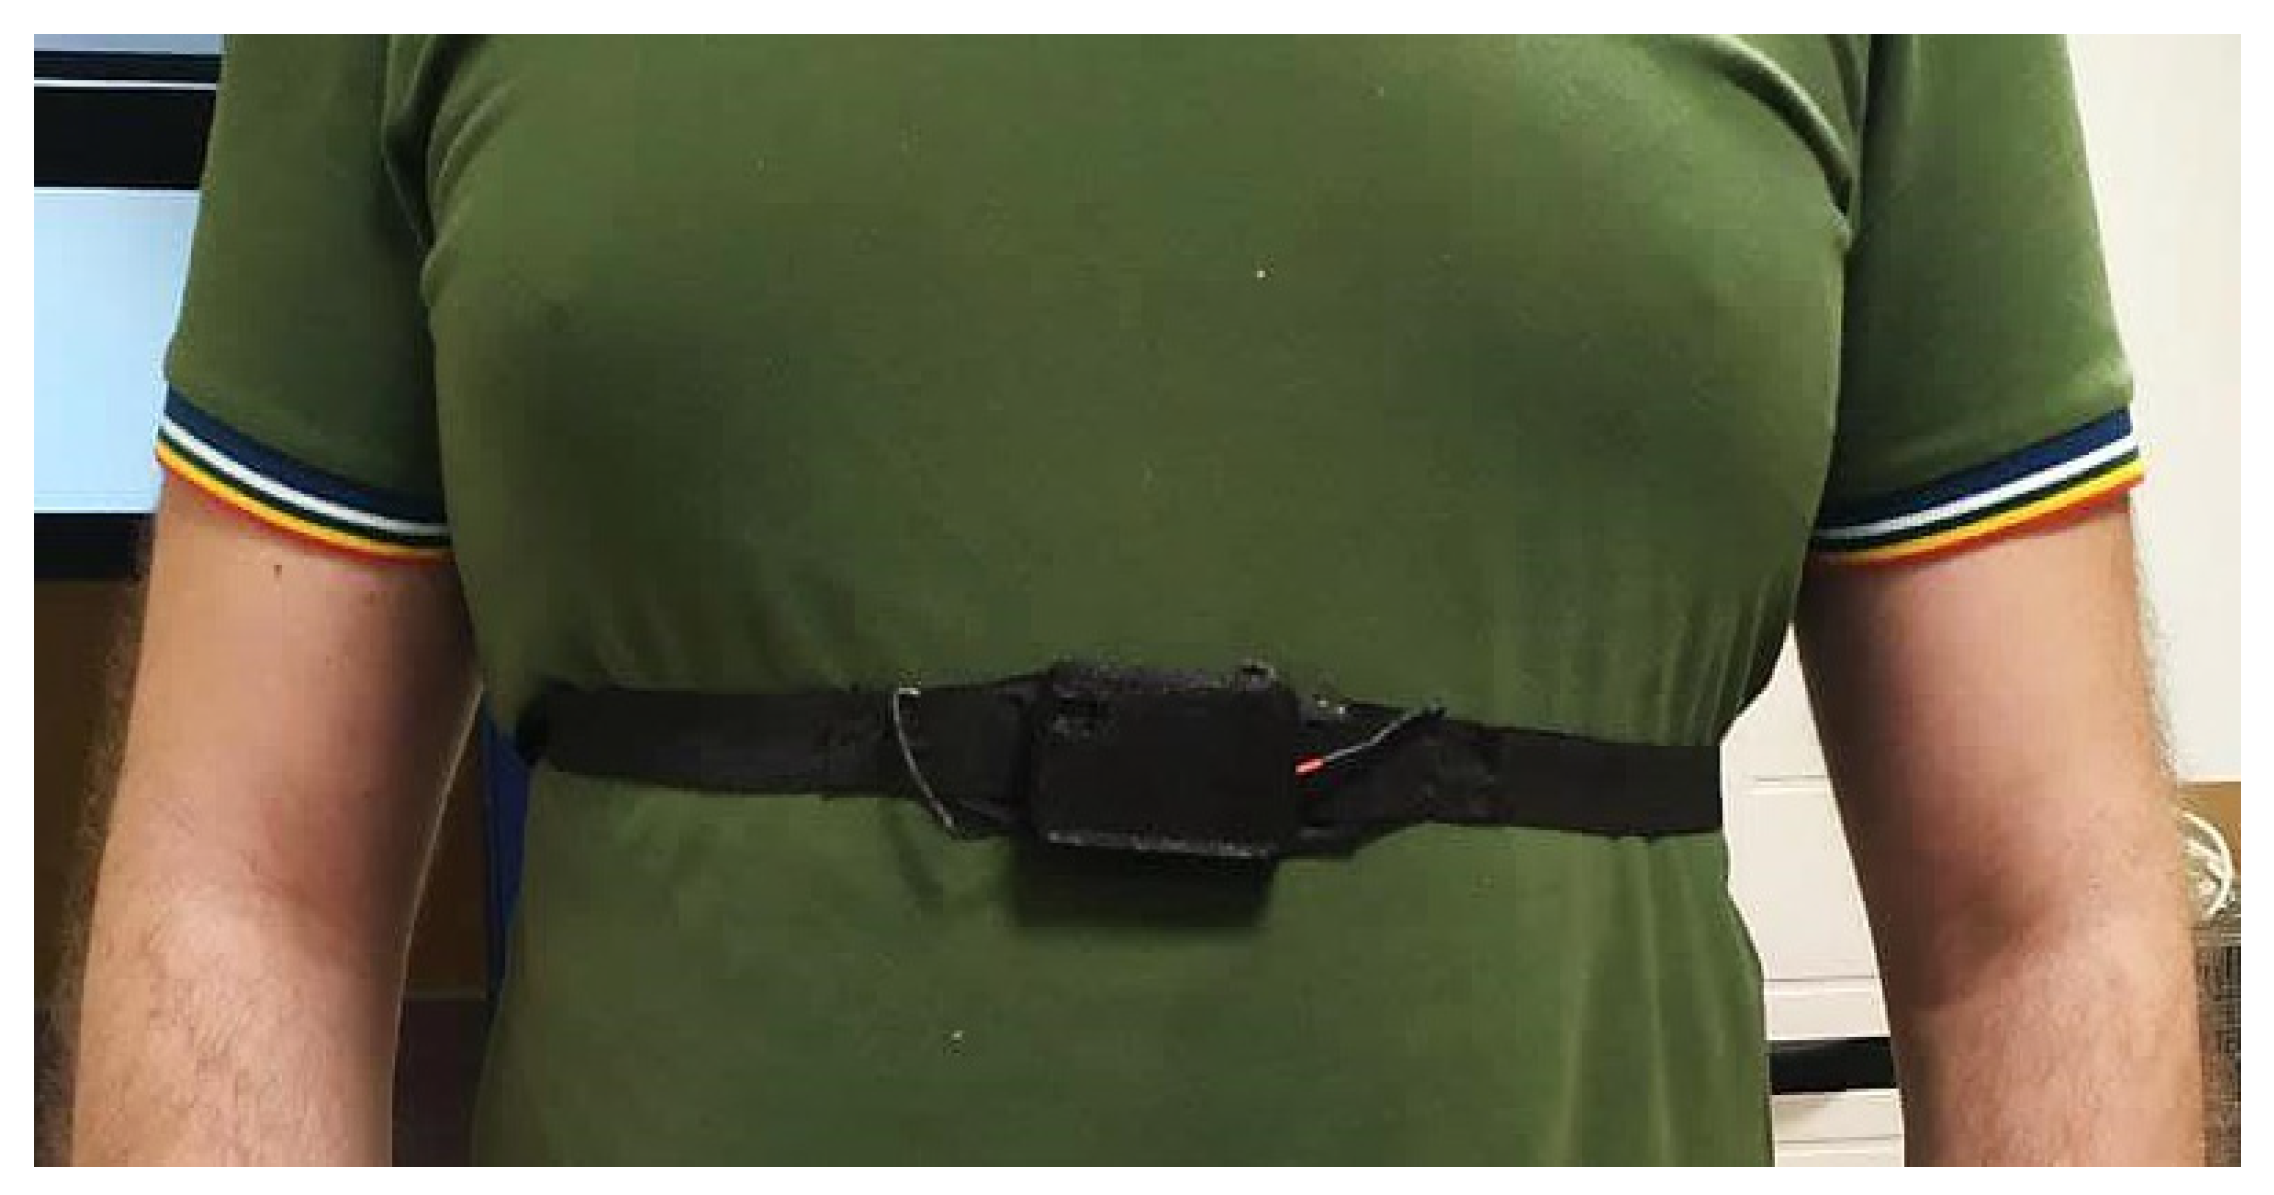
2.1.3. Assembly of the Chest Band Prototype

The electronic conditioning and acquisition section’s printed circuit board (PCB) was developed; then, the piezoresistive chest band prototype was assembled starting from a plain elastic band using a piezoresistive sensor (Figure 4a). On the elastic band and above the piezoresistive sensor a 3D-printed plastic case (having size 7 × 3 × 1.5 cm) is installed. This case houses the electronic section, and was properly designed to be comfortable and wide enough to host the board and not conflict with the piezoresistive sensor (Figure 4b). In particular, the case is fixed through two slots to a secondary elastic band sewn over the piezoresistive sensor to avoid sensor extension due to the hindering of chest wall movements by the case. Furthermore, a 3-axis accelerometer and 3-axis gyroscope (MPU-6050) is installed under the plastic case’s cover (Figure 4c).

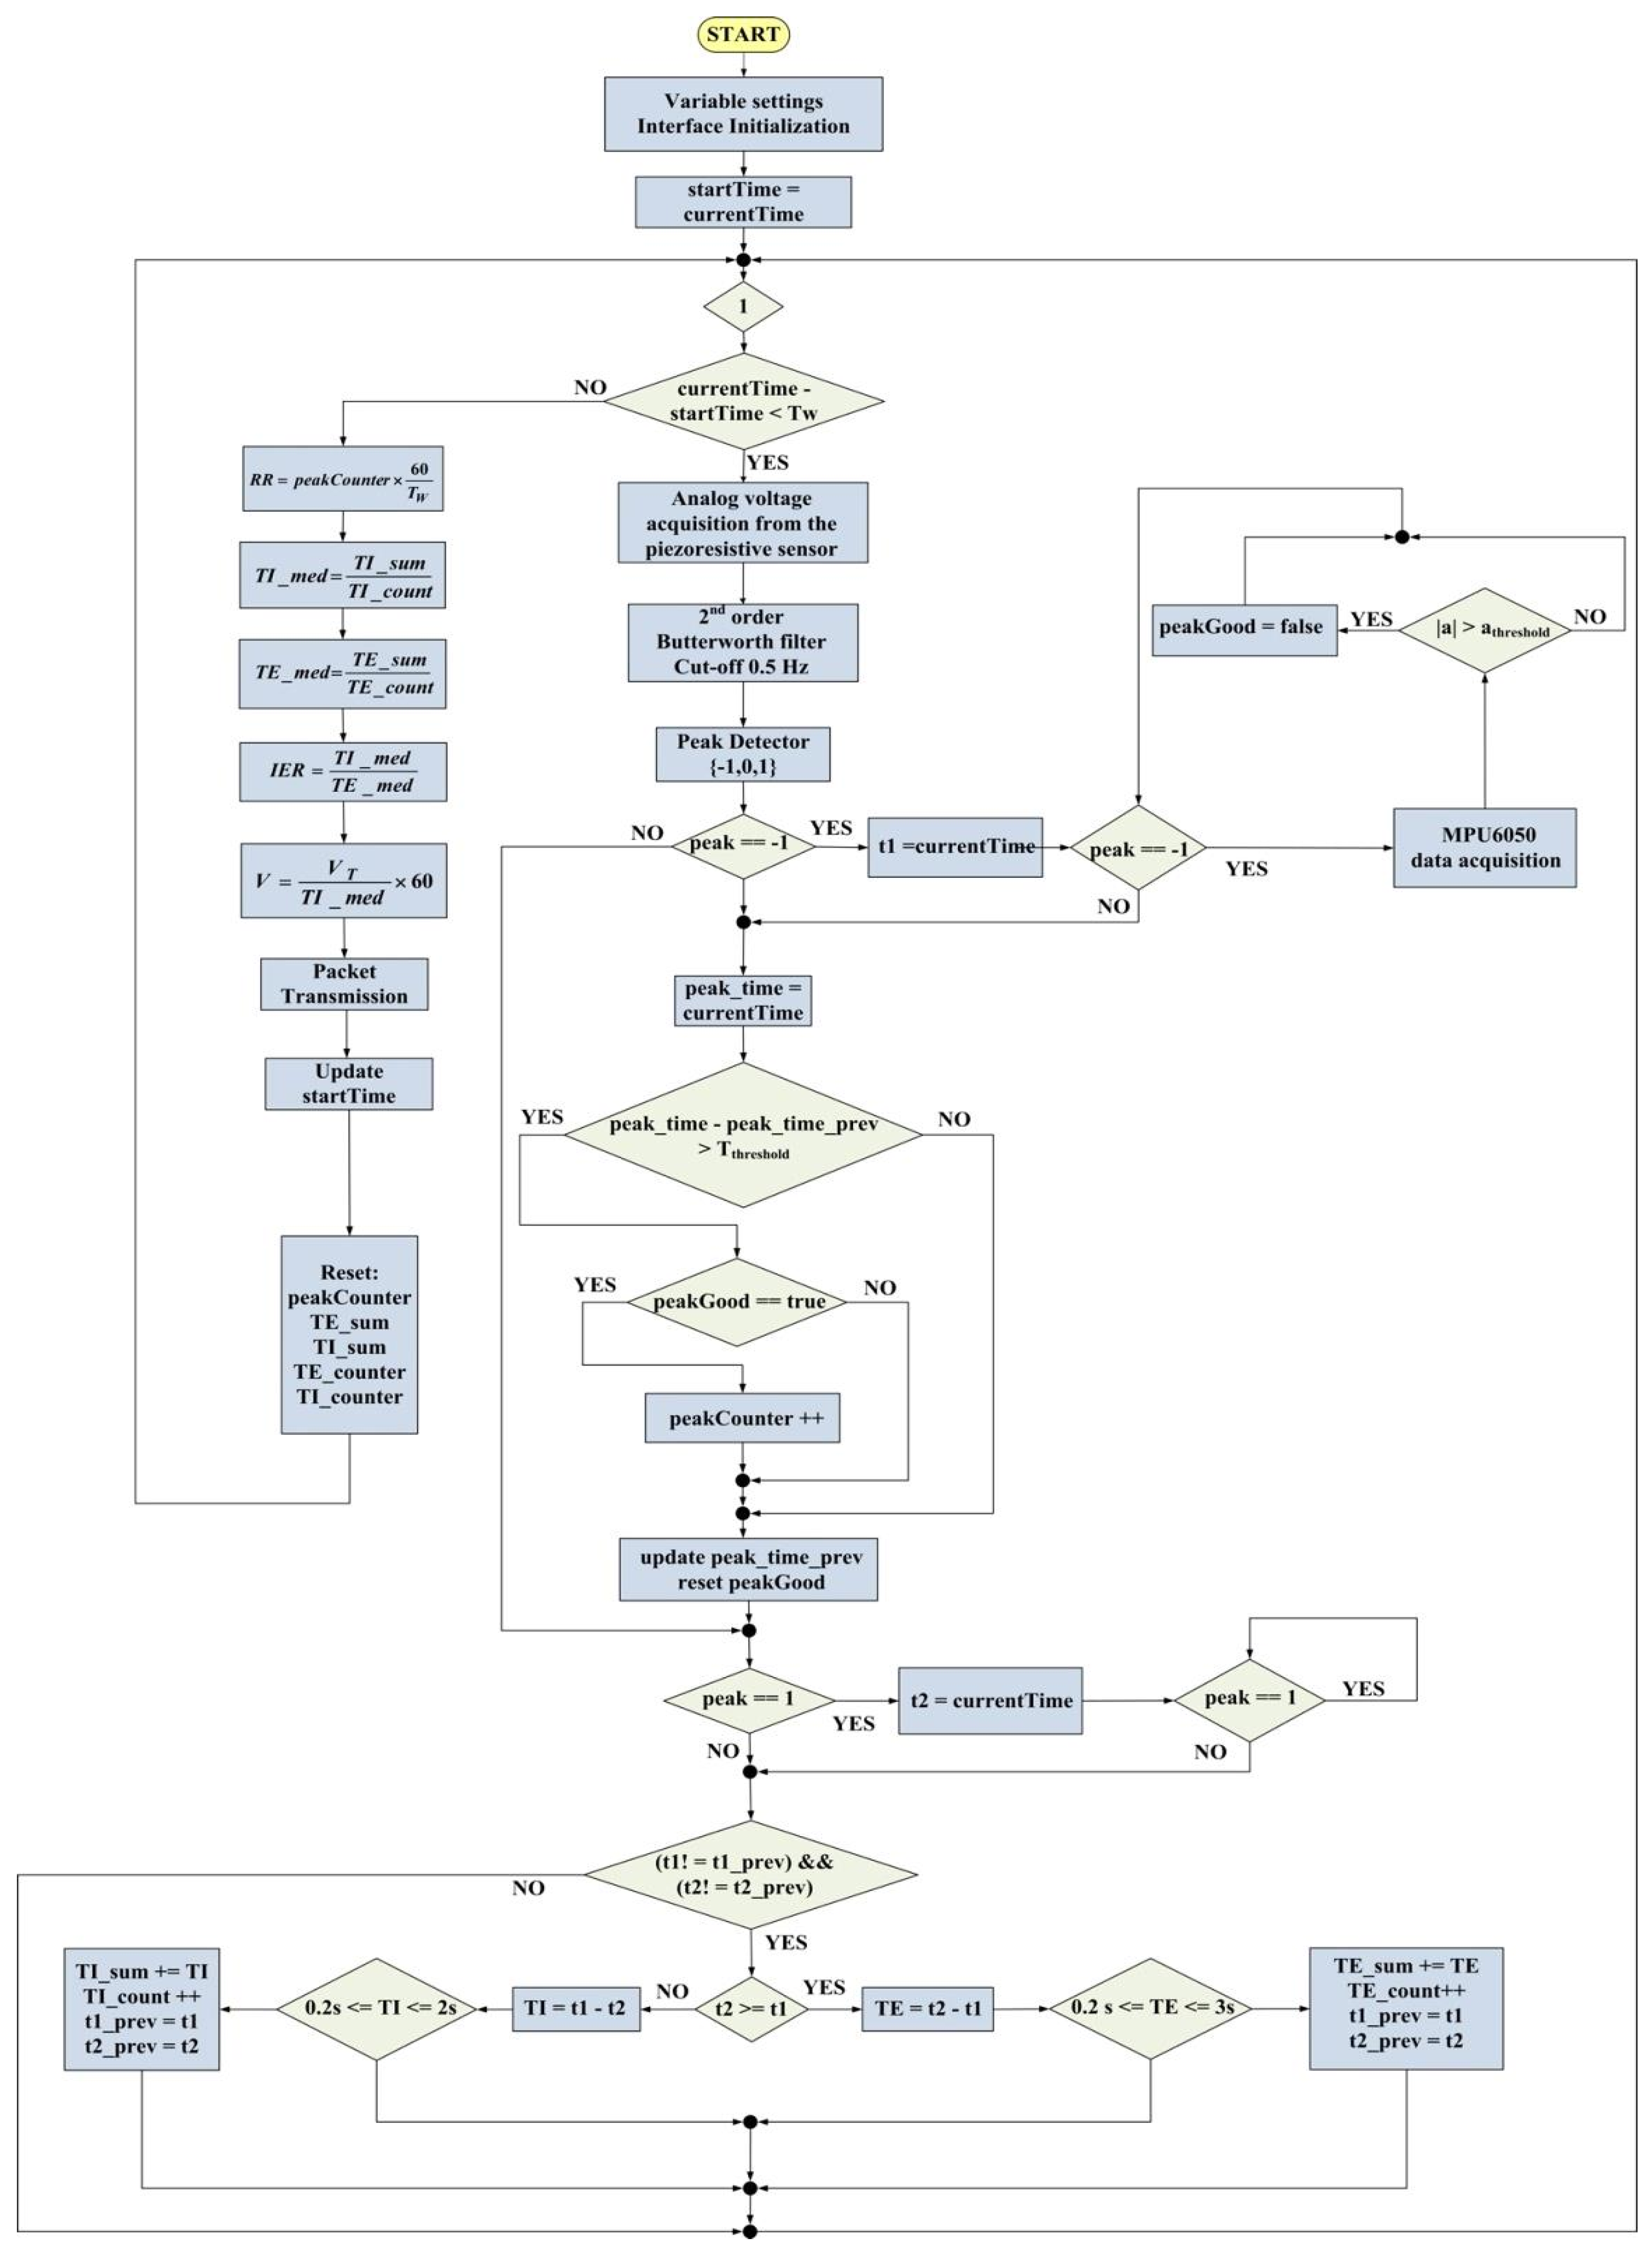
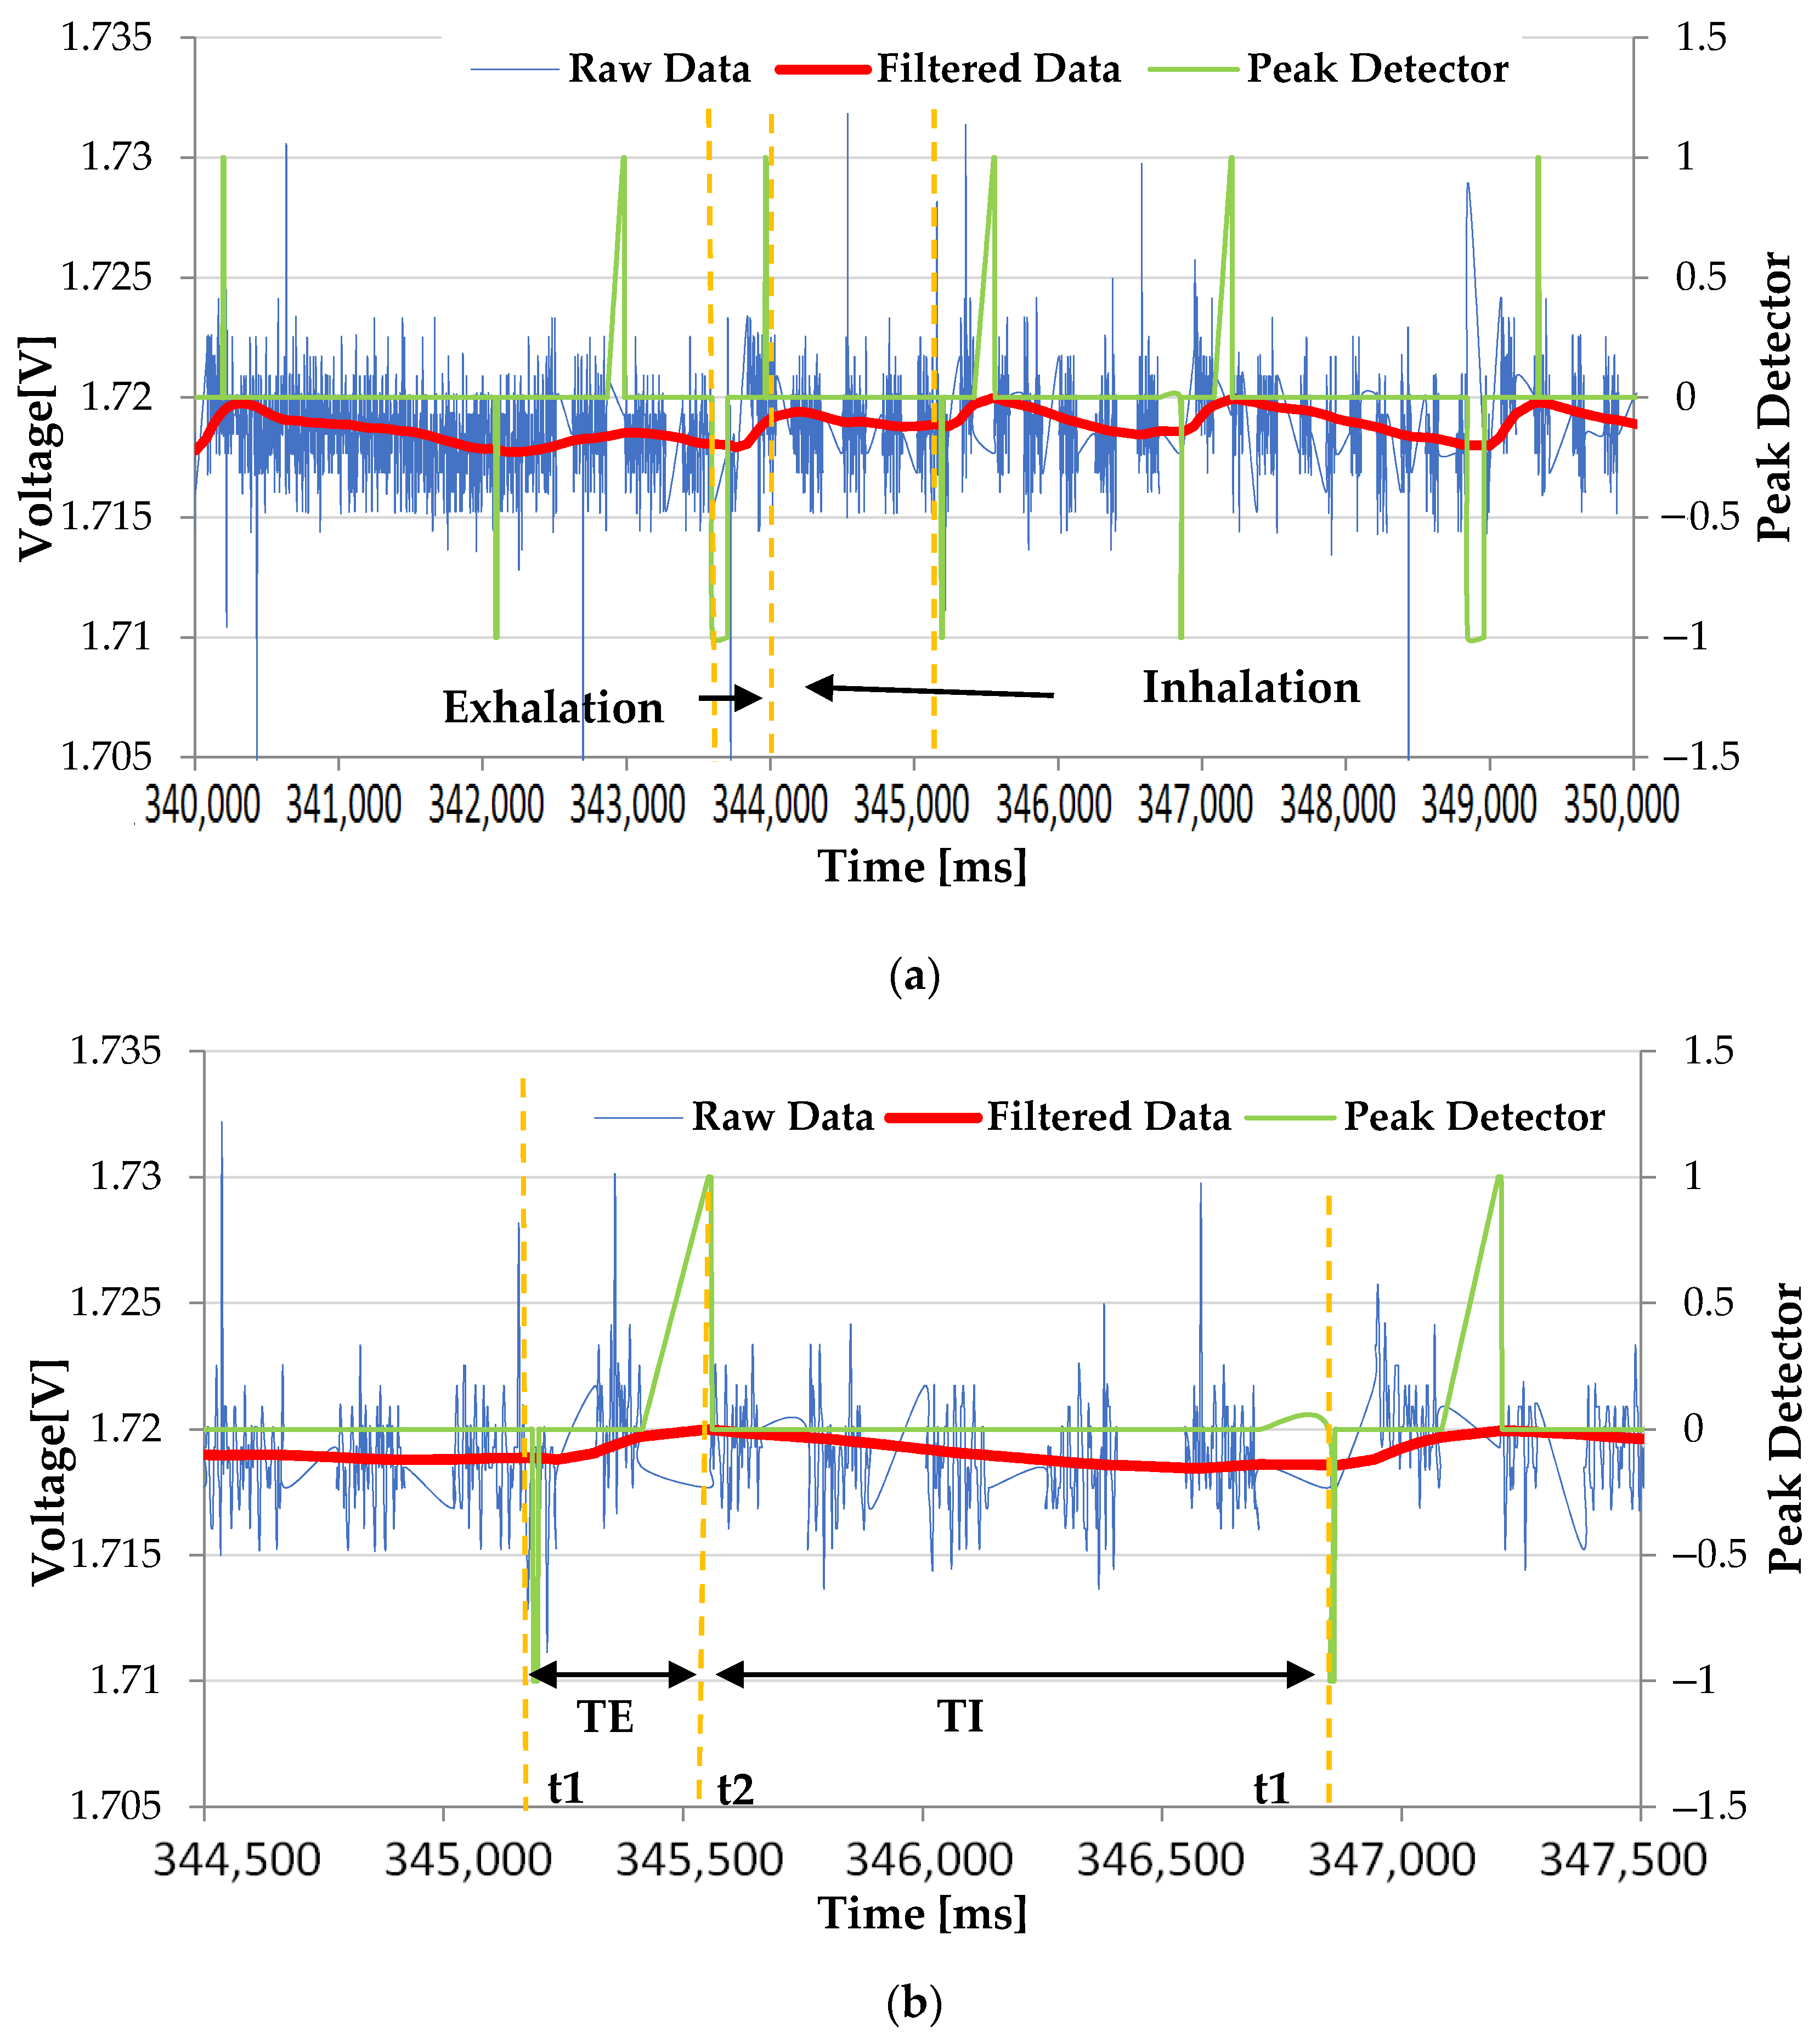
2.2. Chest Band’s Firmware for Measuring the Breathing Parameters

In this section, the operational modalities of developed firmware are discussed; these modalities are managed by the SAMD21G18A microcontroller board, the core section of the designed wearable system. Figure 5 shows the flowchart of the algorithm developed to extract the breathing parameters.
The first step consists in declaring all variables and initializing the various communication interfaces (UARTs, I2C interfaces). A variable called startTime, initialized with current_time, is used to store the time the wearable device is activated. The peakGood value indicates whether the peak detected by the piezoresistive sensor is due to respiration (set to 1 in this case) or other movements; Tw is the time window for RR estimation, set to 30 s. peakCounter is the variable used to count the number of negative peaks in the time window, and is initially set to 0.
At this point, the program enters an infinite loop to acquire the raw data; if less than 30 s have passed since the cycle start, the analog voltage is acquired from the piezoresistive sensor and digitally filtered by a second-order Butterworth filter with a 0.5 Hz cut-off frequency. Afterwards, the peak detector function analyzes the acquired signal and assigns them a value (−1, 0, 1) depending on the signal value deviating from the moving average of more than a given z-score. If peak = −1, current_time is marked with t1. The firmware flow enters into a cycle until the peak value is −1, during which the data are acquired from the MPU-6050Q IMU. In particular, we assumed that a relatively high acceleration value characterizes peaks attributable to body movements extraneous to breathing. Thus, the peaks provided by the peak detector algorithm are classified according to simultaneous acceleration values. Peaks recorded by the acceleration module ( | a | ) higher than a threshold are discarded from the counting of the inhalations. If | a | > a T , the peakGood flag is set false, where   a T is the threshold on the acceleration module, which attributes the peak to extraneous body movements and not to breathing.
Then, peak_time is stored and compared with peak_time_prev (previous peak time). If the following condition is met:
peak_timepeak_time_prev > ΔTthreshold
Then it means that peakGood is verified, and if true, the peakCounter is increased; this check is added to discard double negative peaks that may be detected in the breathing signal due to extraneous body movements. The above-mentioned time threshold was set to 1.6 s (empirically established value).
The mean inhalation (TImed) and exhalation (TEmed) times over the 30 s time window are calculated by measuring inhalation (TI) and exhalation (TE) times breath-by-breath. Particularly, these latter are evaluated by marking the starting instants of inspiration (t1) and expiration (t2), signaled with negative (−1) and positive (+1) peaks at the output of the peak detector algorithm and calculating the corresponding time difference. The inhalation time is calculated as the difference between the starting instants of inhalation (t1) and exhalation (t2); on the contrary, the difference between the starting instants of exhalation (t2) and inhalation (t1) gives the exhalation time.
If peak = 1, current_time is marked with t2; then, the firmware verifies that t1 and t2 have been updated (compares them with t1_prev and t2_prev values to avoid acquiring the same peak twice). If t2 is greater than t1, TE is calculated as t2 − t1; else, TI is calculated as t1 − t2. Then, the obtained inhalation and exhalation times are checked, verifying if they belong to admissibility ranges fixed according to physiological reasons. Specifically, TE must be between 0.2 and 3 s, whereas TI must be between 0.2 and 2 s. If the related condition is verified, instantaneous TE and TI values are added to the respective cumulative variables (i.e., TE_sum, TI_sum) used to calculate the average value at the end of the TW time window. For this purpose, the corresponding counting variables (i.e., TI_count, TE_count) are increased, and t1_prev and t2_prev are updated. When the 30 s time window Tw ends, the breathing parameters are calculated using the following equations:
RR = peakCounter ×   60 T w
TI med = TI sum TI count
TE med = TE sum TE count
IER =   TI med TE med
V =   V t TI med × 60
The respiratory rate is measured by counting the number of inspirations that occur in the time window (e.g., 30 s) and calculating it using Equation (3); therefore, it must be intended as a mean value in the observation interval. The obtained measurements are compared with the inspiratory count taken during the time window, as reported in Section 3. The tidal volume ( V t ) is estimated starting from the user’s height and calculating the ideal body weight (IBW) [46]. The tidal volume is calculated from the IBW by Equation (10).
I B W = 50   K g + 0.91 × ( h [ c m ] 152.4   c m ) ( for   men )
I B W = 45.5   K g + 0.91 × ( h [ c m ] 152.4   c m ) ( for   women )
V t = 7   mL / K g × I B W
The flow rate (V, expressed in LPM) is calculated as the ratio of the air volume moved in each respiratory cycle (Vt, expressed in liters) and the inhalation time (TI, expressed in minutes). Then, the packet containing the determined parameters is transmitted to the host device through the BLE module, all the variables are reset, and another time window starts. The RR in adult patients ranges from 12 to 20 BrPM, depending on the physical effort and sleep. In ill patients, an increase in RR can be attributable to hypoxia, cardiac insufficiency, pain, or metabolic disorders. In contrast, an RR reduction can signal neurologic depression or severe hypoxia cases [47]. In particular, several clinical studies demonstrated that RR is a significant indicator of cardiopulmonary arrest and imbalances, in addition to gastrointestinal and renal diseases [48]. In addition, monitoring respiratory parameters during sleep can be used to support the diagnosis of sleep disorders such as apnea or hypopnea.
Moreover, monitoring inhalation and exhalation times and their ratio (i.e., IER) are essential as they are correlated to the heart rate variability and physical and psychological relaxation. In [49], the authors demonstrated that IER is a crucial parameter affecting the self-reported effects on relaxation resulting from controlled breathing exercises. Specifically, an IER lower than 0.46 positively affects self-perceived stress, relaxation, and mindfulness. Similarly, in [50], the authors demonstrated that respiratory patterns with lower IER induce a higher cardiac vagal activity (CVA).
Finally, the flow rate is the volume of air inhaled by a patient. An inspiratory flow rate of 20–30 liters per minute (LPM) is typical at rest during tidal breathing. It is a measure of the lung capacity, and of the ability of the respiratory system to cover the body’s need for air [51]. In patients affected by chronic obtrusive pulmonary disease (COPD), a peak inspiratory flow rate lower than 60 LPM indicates a worsening of the pathology [52].

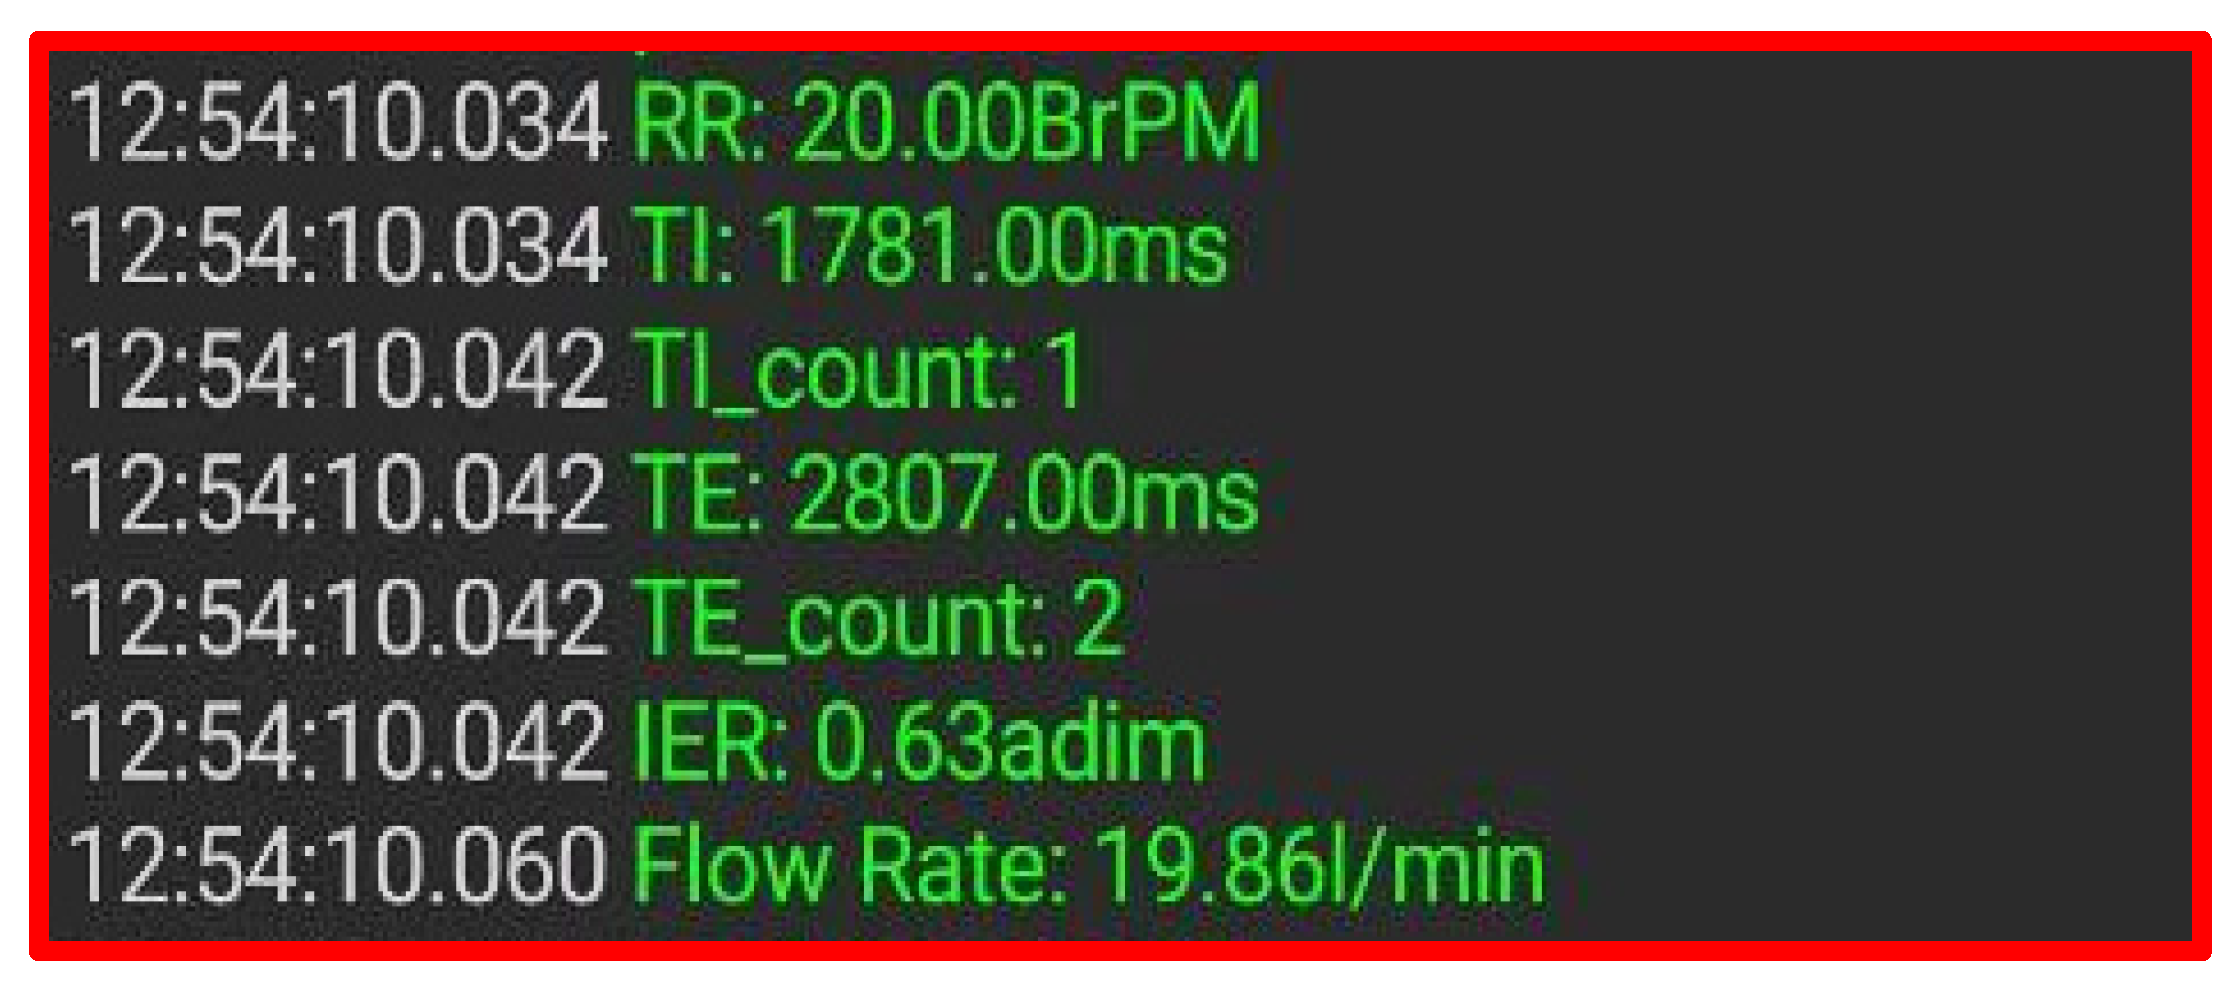
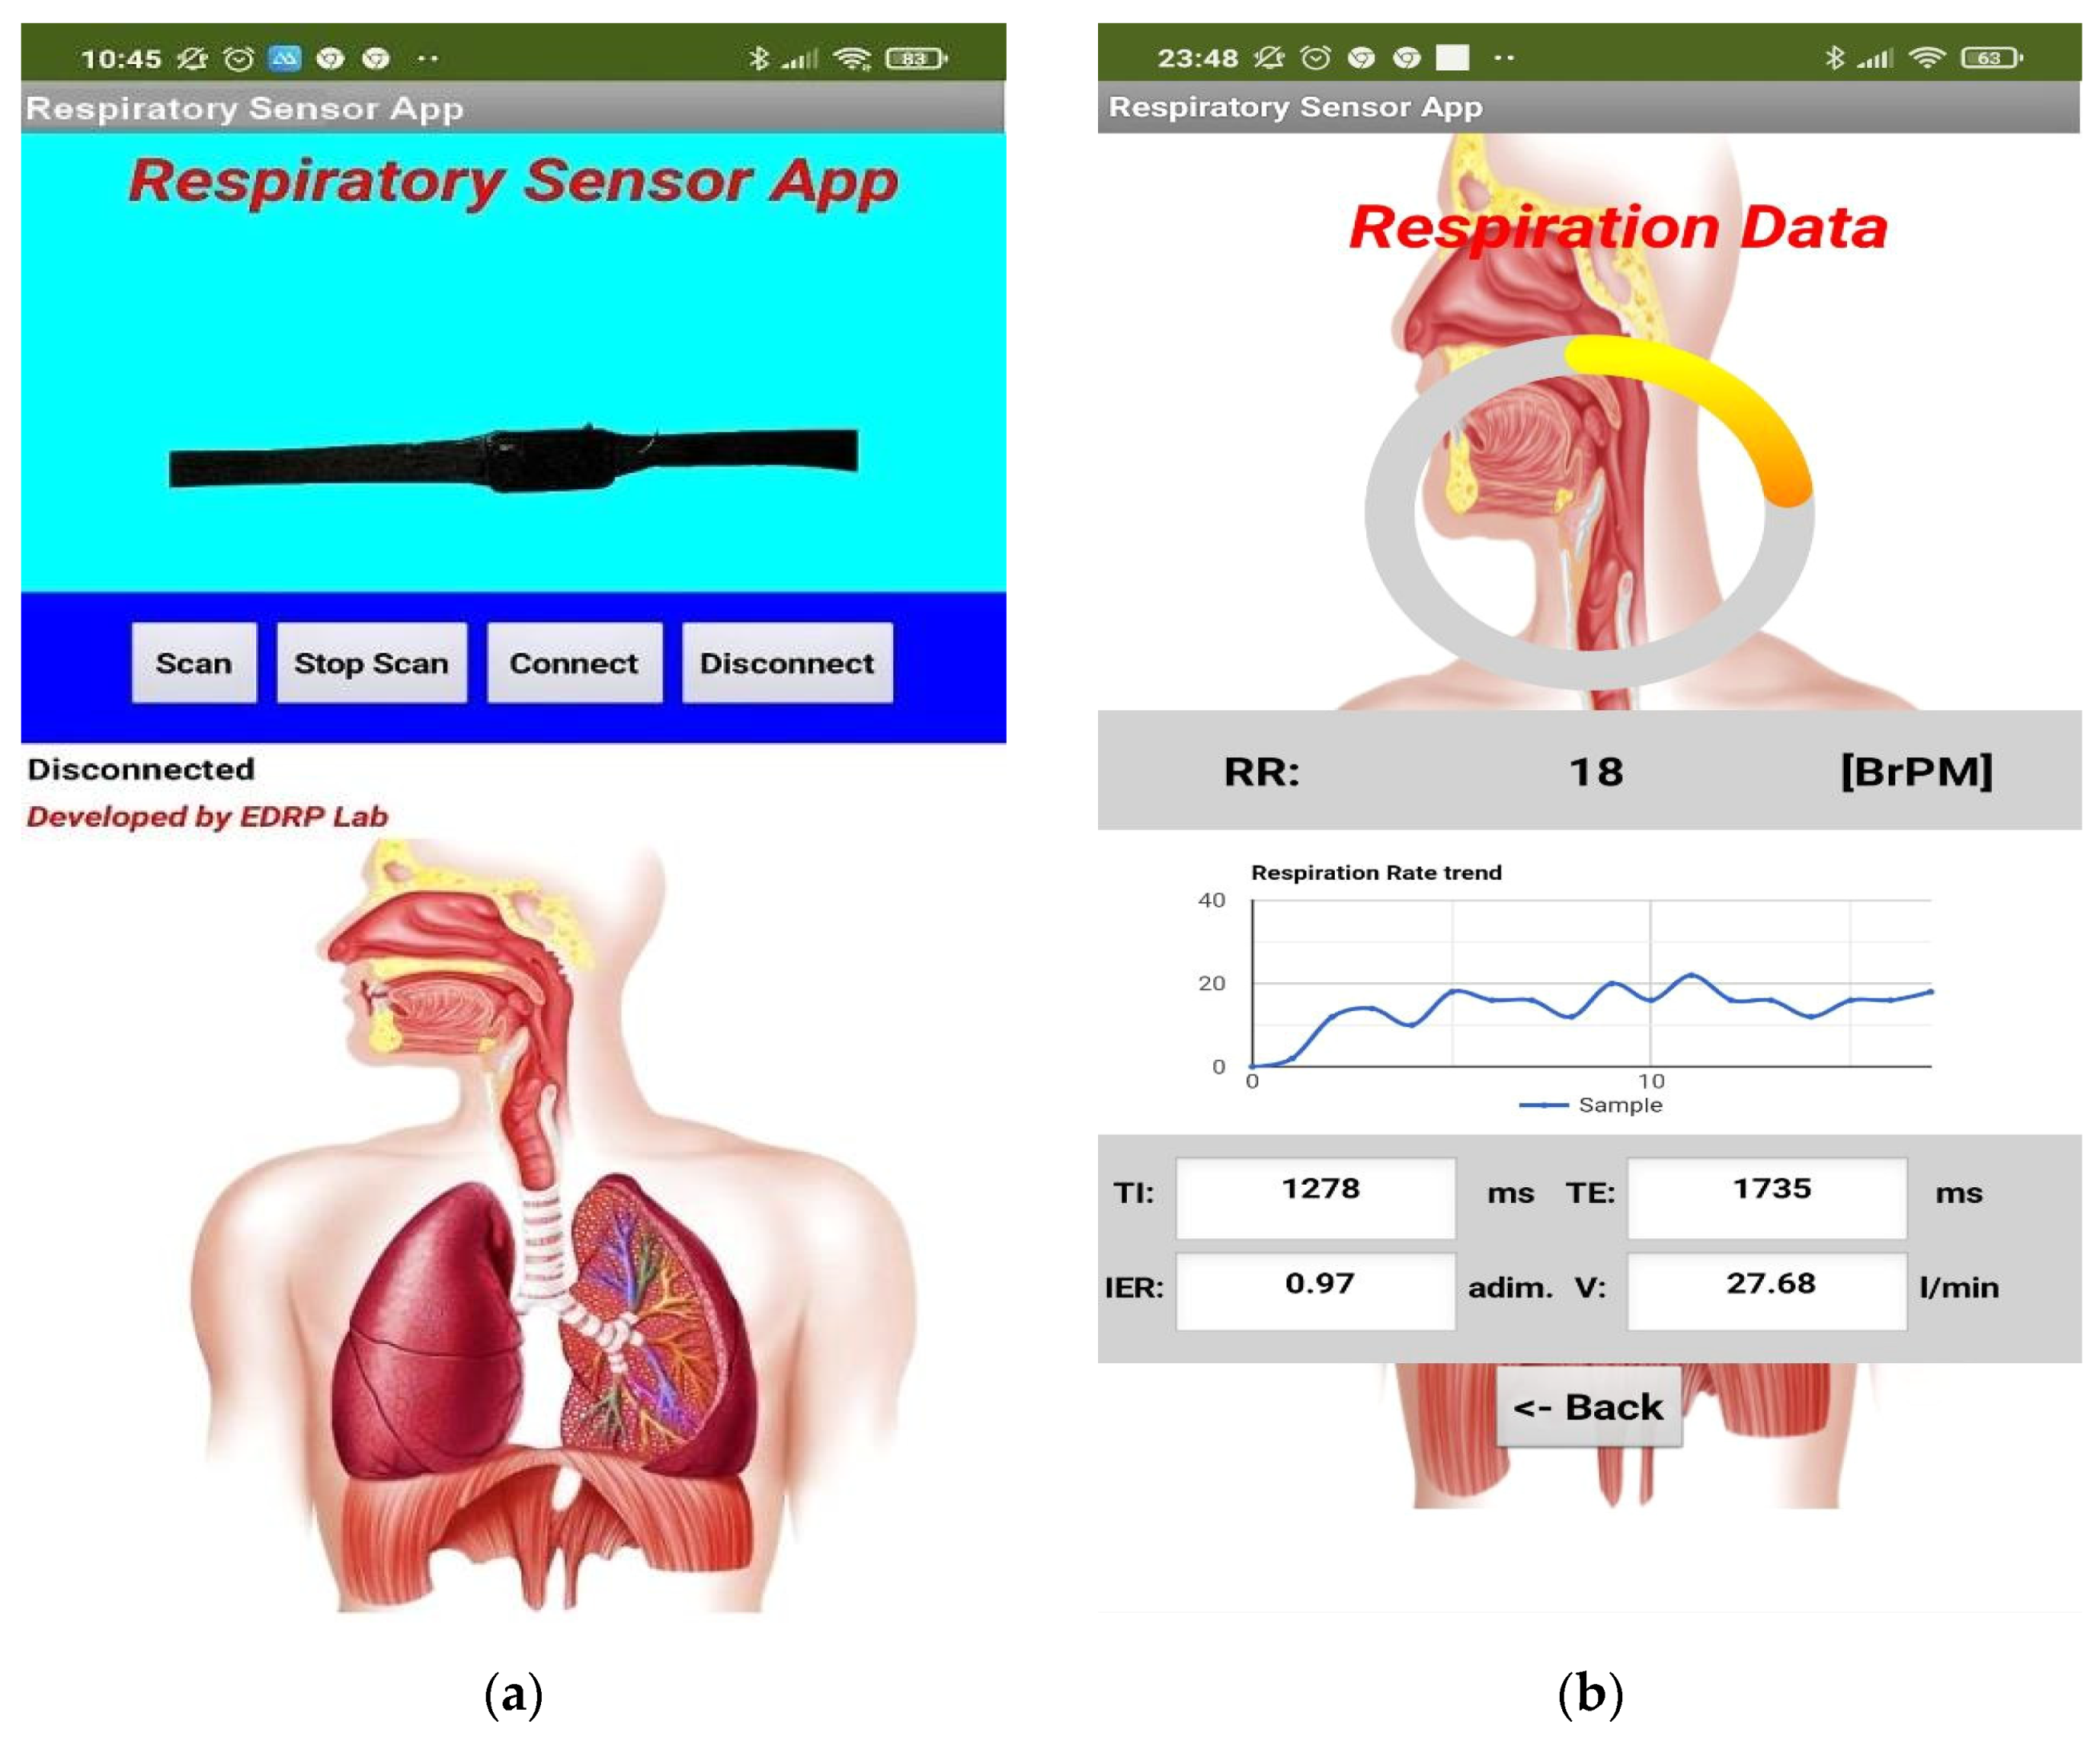
2.3. Mobile Application to Monitor the Data Transmitted by the Chest Band
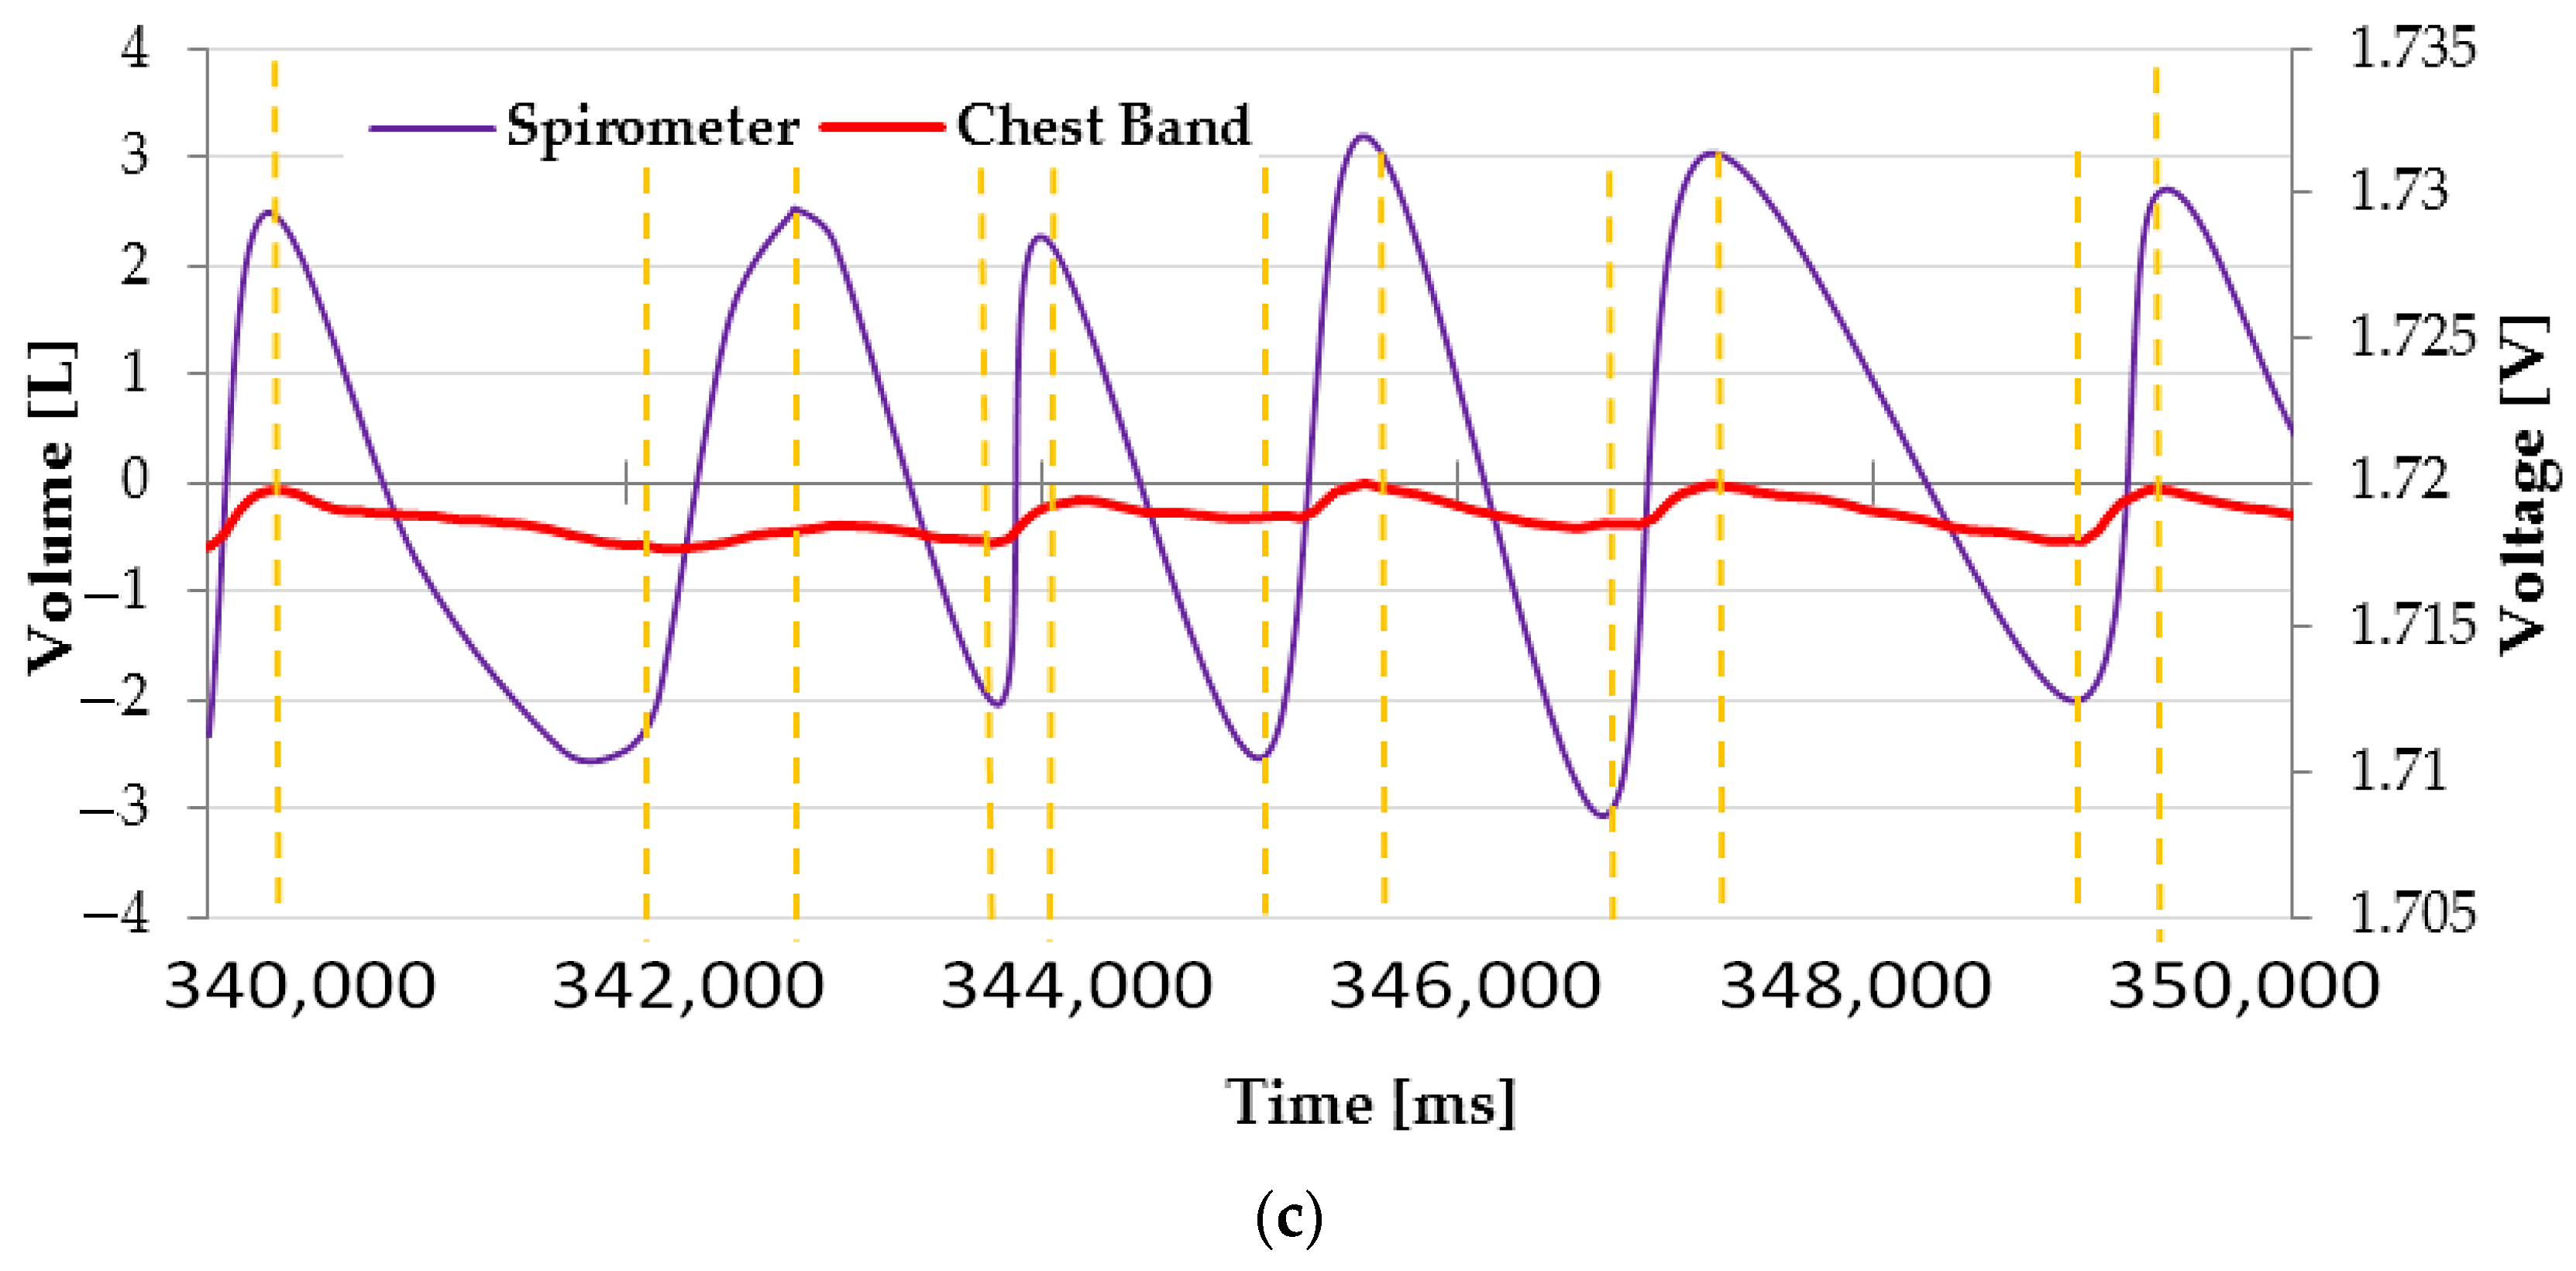
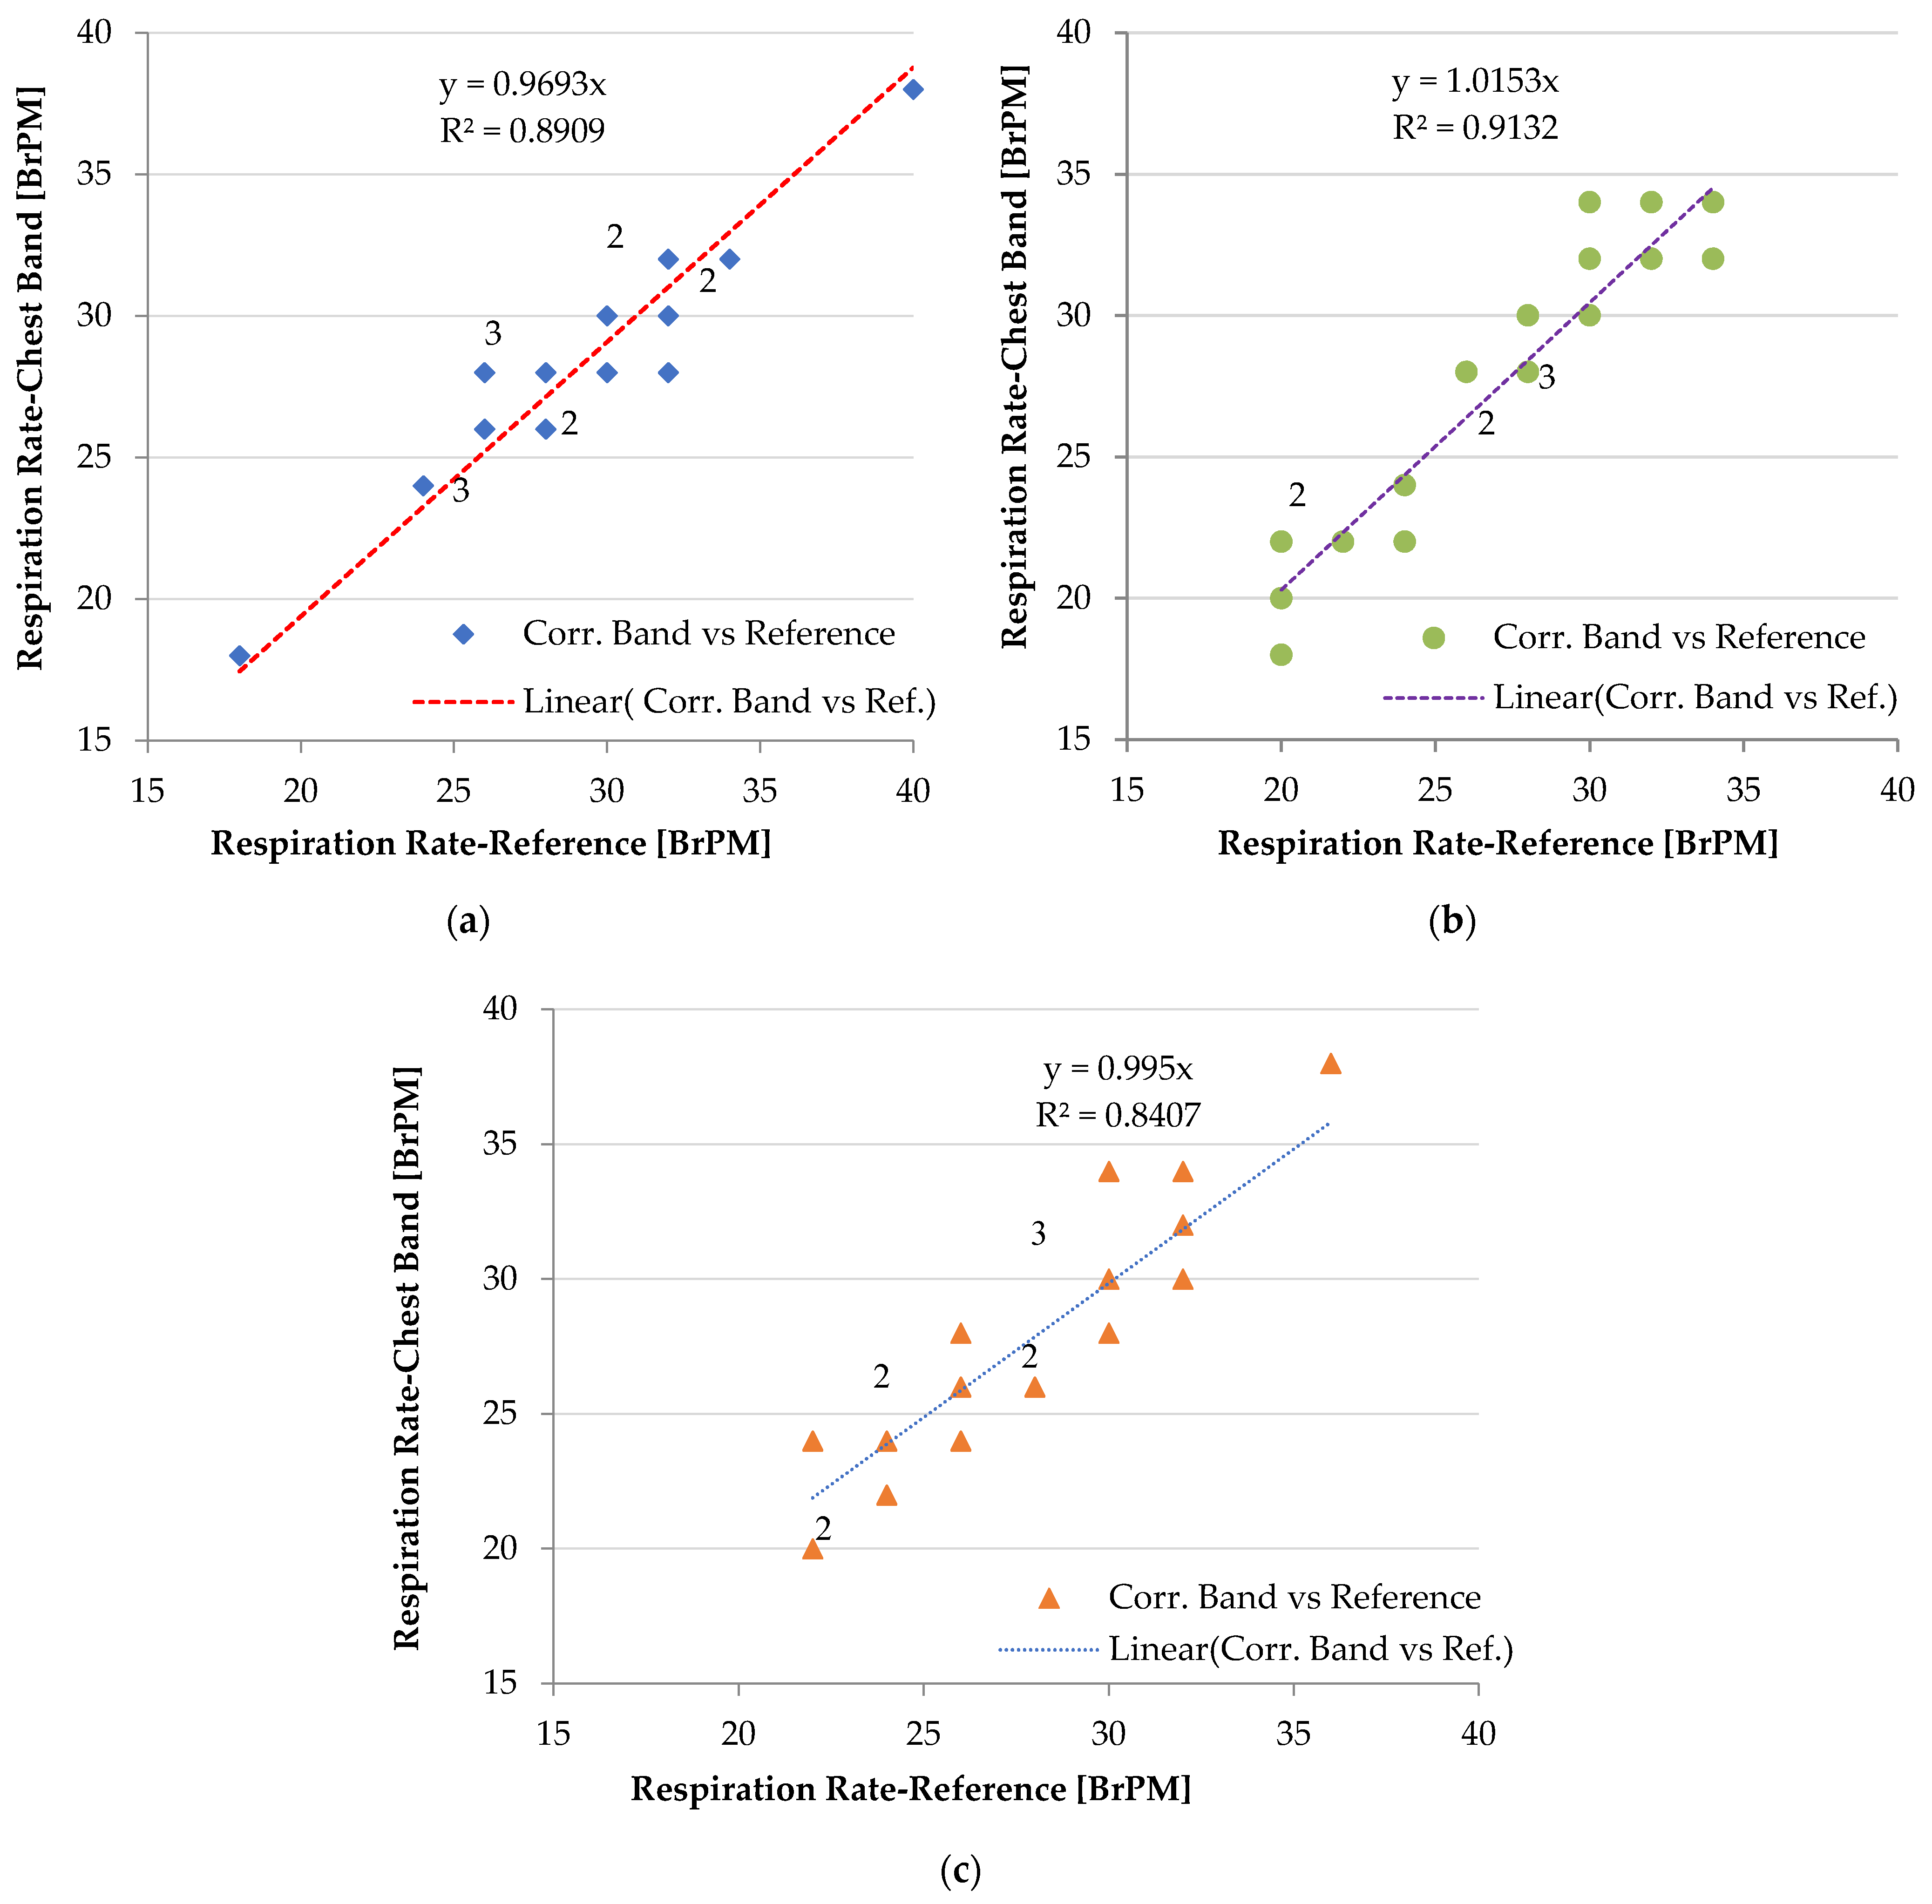
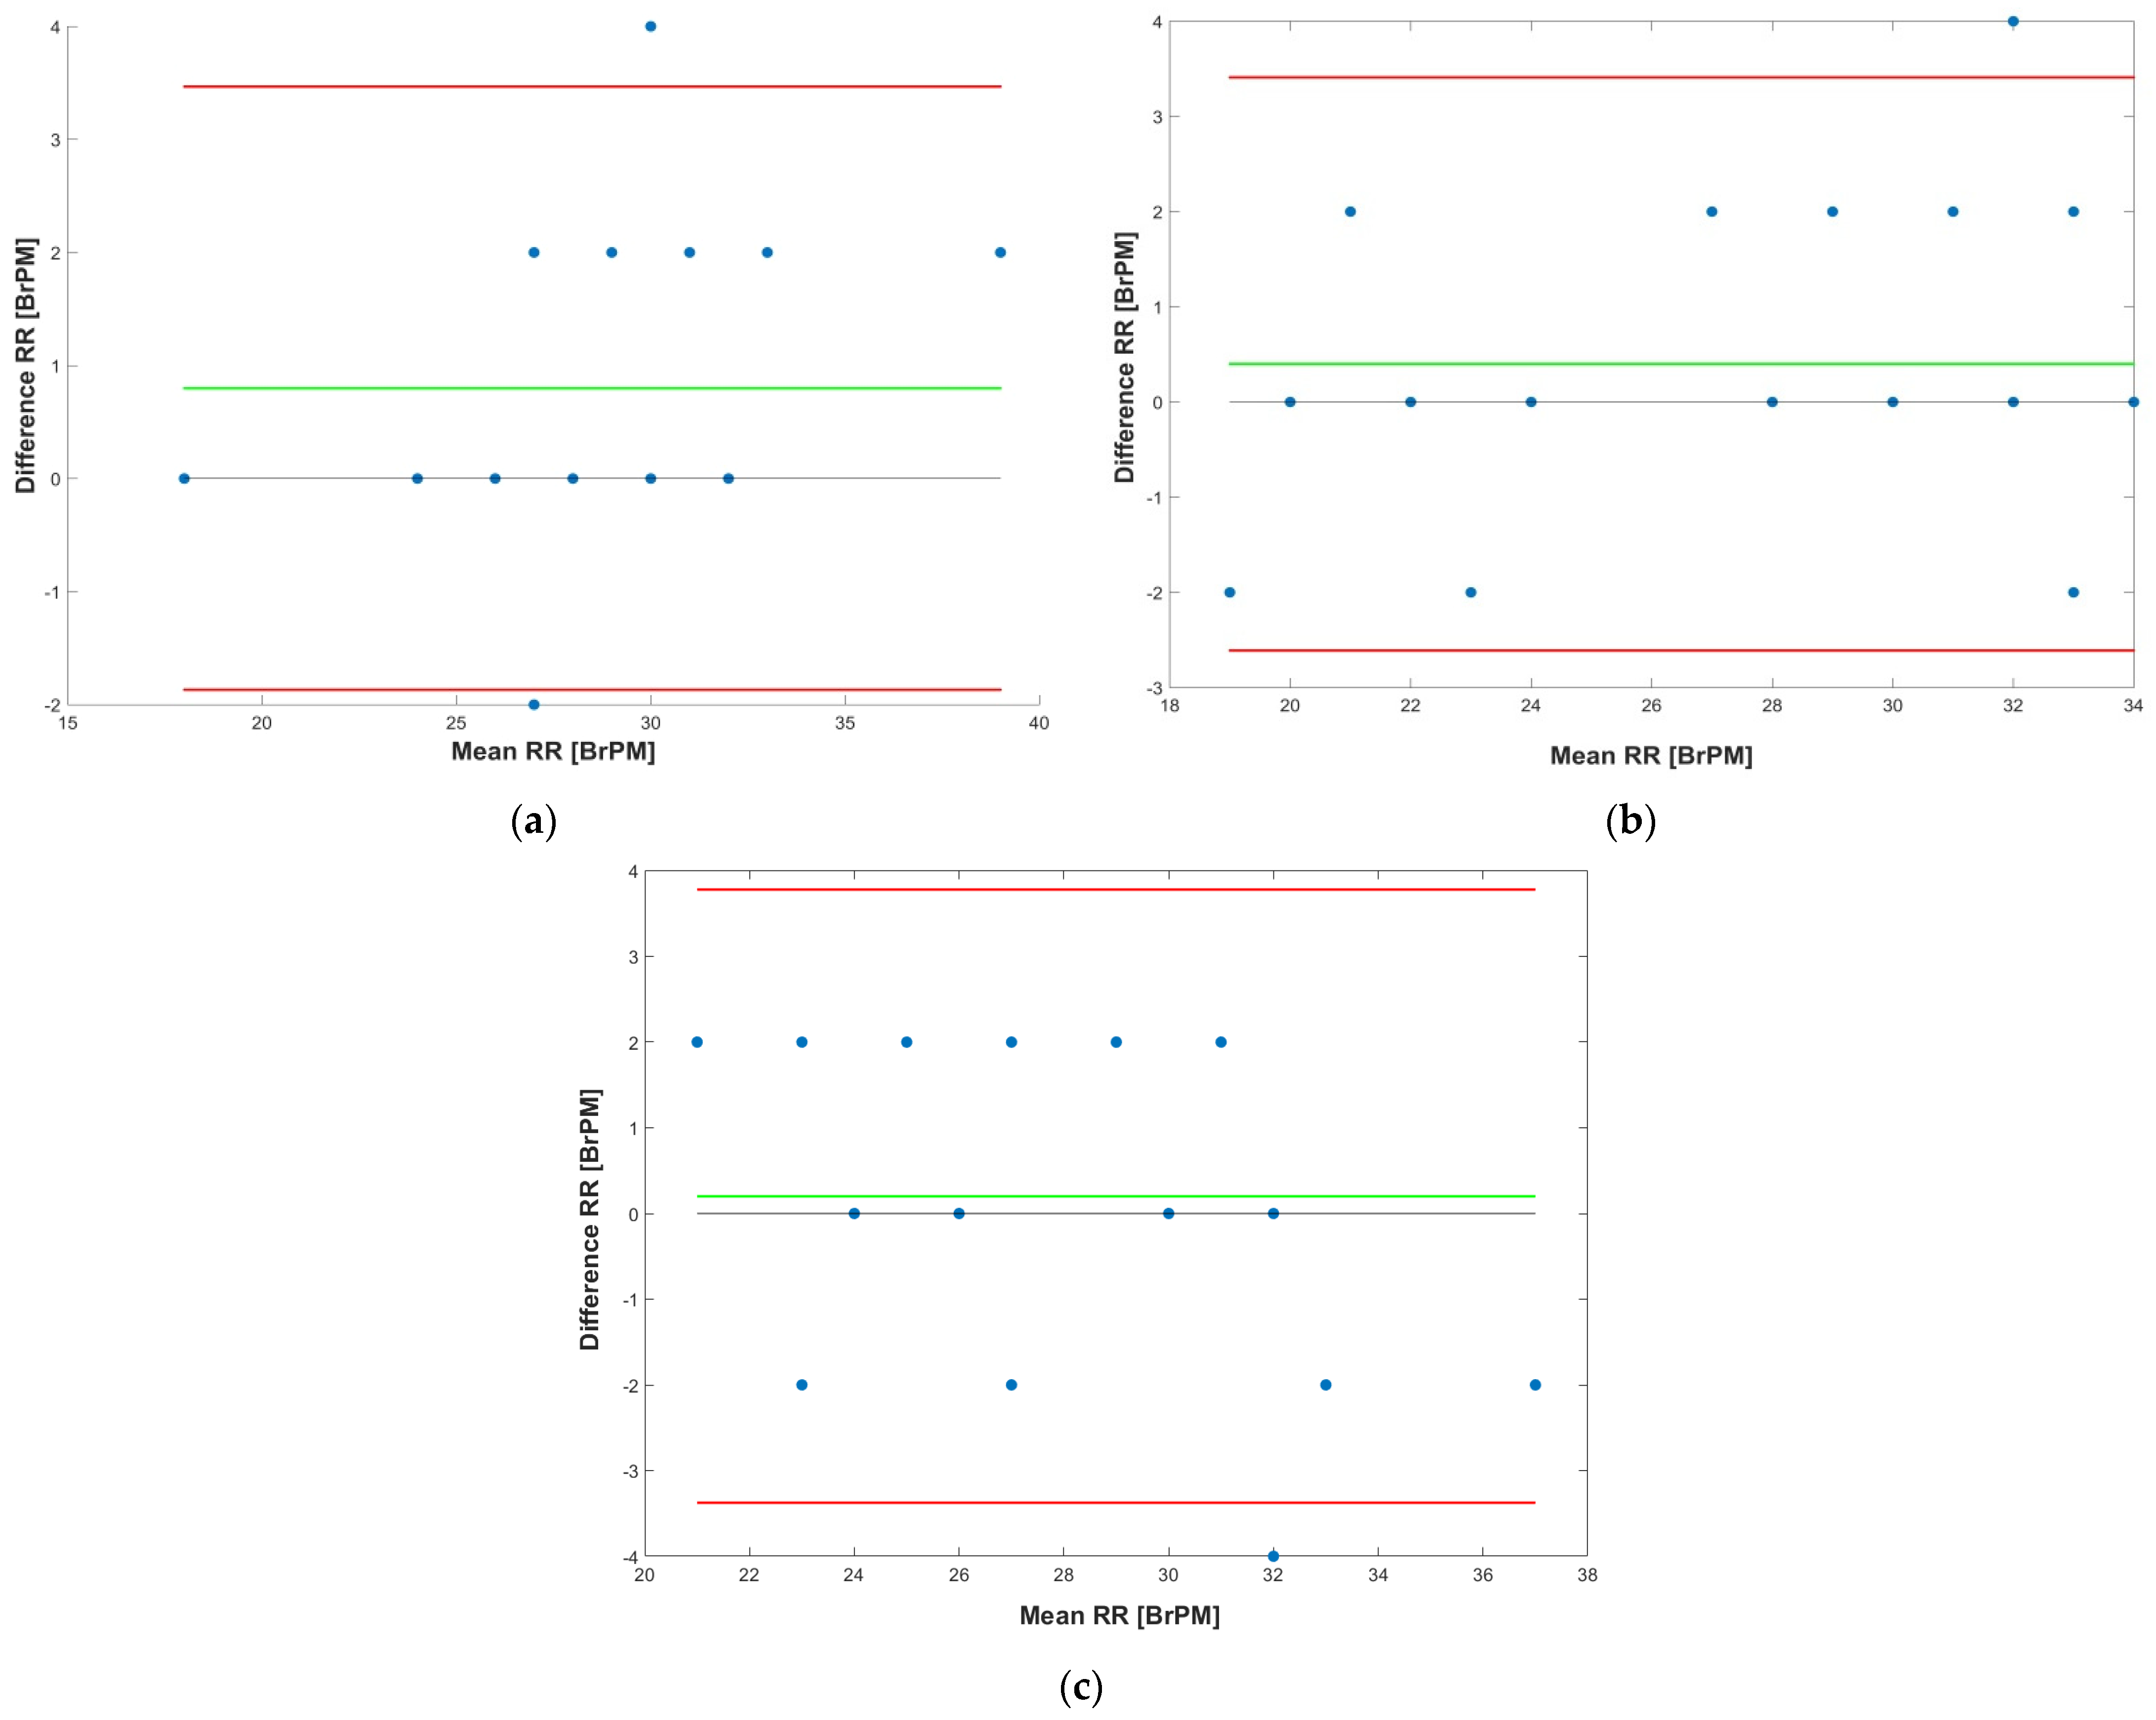
The breathing parameters may be consulted on the patient’s smartphone by a custom Android application. As described above, the chest band integrates a BLE module that transmits the acquired parameters to a host device (smartphone or tablet) to allow remote data monitoring. Figure 6 shows a screen from a Bluetooth serial monitor with the data transmitted by the chest band.
The latter comprises two screens: a Connection screen where the user can choose the device to be connected and a Monitoring screen where the user can track the data acquired from the wearable device. The first step is to connect the device to the RR sensor by Bluetooth connection: on the application’s main page, the user must push the Scan button to begin the Bluetooth device’s scan (Figure 7a). The scanning results are shown on a listview window, sorted according to the signal strength.
Afterwards, the user selects the band (JDY-23) and clicks on the Connect button to establish the connection. Once the connection is established, a second page is loaded and displays the respiration rate data received. Specifically, the last acquired value is displayed by a doughnut chart; in addition, the time trend of the acquired values is depicted by a line graph on the screen’s lower section (Figure 7b). In the lower section of the Monitoring screen, a tabular array with four textboxes is placed, reporting the last received TI, TE, IER, and V values. Finally, a Back button can be used to terminate the connection, leading the application to the Connection screen.
In this case, the security of the link between the chest band and smartphone is of primary importance for preserving the exchanged data. The BLE link is exposed to several threats (e.g., MITM, eavesdropping, denial of service (DoS), Bluesnarfing, Bluejacking) [53]. Among the layers of the BLE stack, the Security Manager manages the security of communication links, including the generation and management of encryption keys, verification of the authenticity of other BLE devices, and obscuring the device’s personal information. In [53], M. Langone et al. performed vulnerability analyses in three study cases involving commercial wearable devices communicating through BLE links.

3. Results

In this section, the hardware and firmware of the developed piezoresistive respiratory sensor were tested by six different patients having different genders, physical constitutions, and ages, as detailed in Section 4.1. For each user, the band was worn on the upper abdomen, and the elastic band was adjusted to ensure the correct fitting of the piezoresistive and inertial sensors on the body, depending on the physical constitution of the user (Figure 8). As soon as the band is worn, the firmware carries out an initial test to check the correct positioning of the chest band on the user’s body while the patient is walking or sitting. Specifically, the algorithm verifies that the signal amplitude from the piezoresistive sensor has an adequate value, and the IMU signal does not show an excessive variance. This control mechanism enables the chest band to be worn by users of different constitutions and genders, while maintaining the device’s performance. Specifically, referring to this preliminary step before actual use, the chest band was tested on the same six users of different genders (three males and three females), ages (25.5 ± 2.9 years), and weights (73.0 ± 7.3 kg) (detailed features are reported below in Section 4.1); a correct calibration was obtained in all cases. Different waveforms were acquired to test the correct firmware operation, directly verifying the corresponding feedback on the user’s body.
Figure 9 shows the waveforms acquired along the processing chain implemented by the developed chest band. The blue trace represents the raw voltage signal taken by the piezoresistive strain sensor, whereas the red trace is the signal filtered by the second-order Butterworth filter used to eliminate all the high-frequency components caused by external factors, such as electromagnetic noise or body movements as precordial motion. Notably, a periodic signal is obtained at the filter output, characterized by a frequency range from 0.2 to 0.6 Hz, due to the abdomen movements induced by the inflation and deflation of the lungs during the breathing cycle (Figure 9a) [54]. During the abdomen expansion due to air inspiration, the piezoresistive sensor undergoes tensile stress, leading to a reduction in its electric resistance and thus of the detected signal. Conversely, the signal increases during the expiration; due to the abdomen’s shrinkage, the stress on the piezoresistive sensor is released, increasing the sensor resistance and thus the output signal (Figure 9a). In addition, the band was tested over light clothing (T-shirts), and no significant variation of the signal amplitude from the piezoresistive sensor was observed. In addition, since the peak detection algorithm is based on statistical data analysis, and evaluates the deviation in the points from the moving average, the processing chain is relatively insensitive to slight reductions in the signal amplitude, thereby ensuring the correct operation of the device. Finally, the green trace is the output of the peak detector algorithm operating according to the dispersion principle; specifically, it indicates the exhalation and inhalation instants used by the firmware to derive the respiratory parameters. The peak detection algorithm records each data point based on a set number of standard deviations from the moving average (called the z-score). Since this algorithm works on the moving average of the recorded data points, and detects the deviation of the signal from the moving average, it automatically adapts to changes in the amplitude of the acquired signals. This mechanism ensures the correct operation of the chest band for different levels of band tightness on the user’s chest. The graph reveals the voltage fluctuations produced by the piezoresistive signal that are attributable to the expansion and contraction of the chest (Figure 9a).
Furthermore, a detailed view of the acquired waveforms is shown in Figure 9b, where the characteristic time instants of the respiratory signal are highlighted, with the corresponding time duration. Through these data, the developed algorithm calculates the instantaneous TE and TI, and then the corresponding average values, the IER, and the flow rate in a time window of 30 s.
In addition, the time trend of air volume inhaled and exhaled was acquired by a portable spirometer (model SP10, manufactured by Contec Medical Systems Co., Ltd., Qinhuangdao, China) and compared with the signal collected simultaneously and provided by the chest band (Figure 9c). As is evident, the two signals follow the same trend, showing peaks and troughs in the same instants, thus indicating the correct operation of the developed system in detecting the breathing movements.
Next, the developed piezoresistive chest band was characterized in different operative conditions, namely, when the user was sitting, standing, and walking. Twenty tests were carried out for each operating condition, in which the RR measurements provided by the piezoresistive band were compared with those obtained from the counting of breaths over a 30 s observation interval ( T W ). To carry out the measurements, a mobile application (Clickr, developed by RDQ-Smart Productivity Tools, Czech Republic) was used to track the inspirations, and assigned a timestamp to every counted event and ensured that they belonged to the considered 30 s time window. Moreover, the beginning of the count and the time window considered by the chest band were synchronized. The mean breathing frequency over the 30 s time window was calculated by multiplying the number of counted events (Equation (3)) by two. Given the reduced frequency characterizing the breathing, the proposed methodology can be considered to be reliable enough for a comparison with the measurements acquired by the chest band.
In Figure 10, the correlation diagrams of the measurements provided by the chest band and those obtained by breath counting are reported for one of the six patients, specifically, an adult male (age 30 years, weight 81 kg), as an example. A summary table is also presented later with the performance of the chest band for the six patients. The tests were repeated in different physiological states (rest and under stress) to cover a larger RR range; in the graphs, the multiplicity of each data point is reported.
Pearson correlation coefficients were calculated between the RR measurements obtained with the developed chest band and those measured by counting breaths (Equation (11)):
r = n ( RR Band RR Man )     ( RR Band ) ( RR Man ) [ n RR 2 Band ( RR Band ) 2 ] [ n RR 2 Man ( RR Man ) 2 ]
Furthermore, the Bland–Altman graphs of the measurements obtained by the piezoresistive chest band and those obtained by counting breaths are depicted in Figure 11 for different operative conditions (i.e., seated, standing, and walking). This graph allows evaluation of the agreement between two quantitative measures using the mean difference to determine the agreement limit [55].

4. Discussion

In this section, the experimental results reported previously are analyzed and discussed to evaluate the performance of the developed wearable device. Then, a performance comparison with similar systems presented in the literature is presented.
Considering the seated user, the correlation coefficient was equal to 0.958, whereas it was 0.956 when standing and 0.923 when the user walks (Figure 10). The high value of the Pearson coefficient indicates that the measurements of the chest band are strongly correlated with the corresponding measurements obtained by counting breaths, which are used as a reference.
However, considering the measurements for walking users (r = 0.923), a slight degradation of the sensor accuracy was observed compared to stationary users (r = 0.958—seated user, and r = 0.956—standing user). The discrepancy between measurements is caused by false peaks induced by the body movements, which were not removed by analyzing the inertial data acquired by the onboard accelerometer. However, the device performance can be enhanced by optimizing the acceleration threshold involved in the detection algorithm and the cut-off frequency of the digital lowpass frequency; in contrast, no difference in performance was observed when a seated or standing user wore the chest band.
Analyzing the Bland–Altman plots of the measurements obtained in the three operative conditions, different information related to the data concordance between the chest band and reference measurements can be inferred. Specifically, the test results indicated a mean difference (MD) of 0.8 Breaths Per Minute (BrPM) and an LoA (Limit of Agreement) equal to +3.47 and −1.87 BrPM when the user was seated (Figure 11a). On the contrary, the chest band resulted in an MD of 0.4 BrPM and LoA equal to +3.40 and −2.61 BrPM when the user was standing (Figure 11b). Finally, an MD of 0.2 BrPM and LoA equal to +3.77 and −3.37 BrPM was achieved when the user walked (Figure 11c).
The results show that the piezoresistive chest band shows a lower bias component (MD) when the user is walking, compared to when they are steady. However, a higher LoA indicates a higher possible error in RR measurement. In addition, for all test conditions, the measurement points appear uniformly distributed as the mean value varies, indicating that the error between the two methods is uniform as a function of the measurement value. Finally, the obtained results demonstrate that the developed respiratory sensor is reliable, and provided a good estimation of the respiration rate in daily life conditions.
Observing the signal acquired by the chest band, reported in Figure 9, it is evident that this covers a limited number of quantization steps, thus limiting the resolution of the acquired signal. As a future development, an increase in the amplifier stage’s gain would further improve the performance of the chest band in detecting the breathing movements (inhalation and exhalation), and thus the corresponding parameters.
Next, preliminary tests were performed to establish the performance of the developed device in measuring the other breathing parameters (TI, TE, IER, and V). As a reference, the measurements provided by the portable spirometer (Contec SP10) were acquired concurrently with those provided by the chest band. Specifically, the TI and TE values related to a single breath were considered, in addition to the corresponding flow rate. Table 2 summarizes the results of the measurements obtained by the chest band and the spirometer (used as a reference), and the corresponding errors.
The obtained results indicate an optimal agreement between the measurements of the chest band and the reference values, with an error of less than 8% on all acquired parameters, thus confirming the correct operation of the developed device.
Finally, the influence of the accelerometer on the detection of the RR was evaluated by removing, from the band’s firmware, the mechanism for discarding peaks induced by body movements in the strain sensor signal. Twenty tests were carried out with the user walking at 1 ms−1 and comparing the measurement obtained from the chest band with those derived by breath counting. The experimental results indicated that the MD increases to 0.25 BrPM (0.2 BrPM with inertia-based correction); in contrast, the resulting LoA was +4.32 BrPM and −3.72 BrPM, respectively (+3.77 BrPM and −3.37 BrPM with the inertia-based correction). These results show that the combination of strain and inertial data improves the chest band’s performance, especially when the user is moving.

4.1. Performance of the Chest Band on Heterogeneous Patients

Next, the performance of the chest band in measuring the RR was evaluated on six patients, to verify its eventual dependency on user characteristics (gender, physical constitution, and age). Table 3 summarizes the characteristics of the patients involved in the characterization of the proposed device.
The operative modalities for performing tests are the same as those employed for the previous patient (patient 1); similarly, the measurements obtained by breath counting are used as a reference. Table 4 reports the results of the performance of the chest band on the six patients, in terms of MD, LoA, and mean percentage error (ME), in different patient conditions (seated, standing, and walking).
The test results show that the chest band confirms the performance obtained for patient 1, and show no significant correlation with the patient’s characteristics (gender, constitution, and age). In addition, in this analysis, an increase in LoA was observed when the user was moving due to artefacts induced on the acquired signal, that were not removed by the inertia-based mechanism described above. The best performance was obtained when the user was seated, resulting in a mean Pearson correlation coefficient ( r ¯ ) of 0.959, a mean MD ( MD ¯ ) of 0.68 BrPM, a mean LoA ( LoA ¯ ) of +3.2 BrPM and −1.75 BrPM, and a mean ME ( ME ¯ ) of 3.13%.

4.2. Comparative Analysis of the Proposed Piezoresistive Chest Band with Similar Devices

This section reports a comparative analysis of the proposed piezoresistive chest band with similar devices for monitoring breathing activity to highlight the main contributions and the performance of the developed wearable system. Table 5 summarizes some wearable piezoresistive RR devices, comparing them with the proposed chest band from the point of view of the used sensing device, processing unit, sampling rate, availability of wireless communication, and wearability.
The sensing systems in [59,60] offer excellent performance in terms of minimum detection limit but lack wearability since they are designed for fixed or portable instruments. Moreover, the solutions proposed in [60,61,62] show good reliability but are obtrusive for the users since they require a large band on the upper part of the human body. The proposed chest band relies on a custom strain sensor realized with pressure-sensitive textile (model LTT-SLPA-20K, manufactured EeonTex) and flexible electrodes. The design and realization of the strain sensor are considered to be an advantage of the proposed activity compared to other similar works using commercial strain/pressure sensors [8]. Compared to similar systems [21,24], the developed chest band combines piezoresistive and inertial sensors for removing the body artefacts induced by body movements, thus improving the detection of the breathing parameters, as presented in [29]. Furthermore, the chest band integrates a BLE module, which is an energy-efficient communication protocol that significantly reduces the power consumption compared to other systems employing other communication technologies (Classic Bluetooth, WiFi) [21,25,29,56,63].
Finally, the presented chest band is less intrusive than the device in [26], which uses six piezoresistive sensors distributed on the abdomen, unlike the designed device, which uses a single sensor applied on the chest.
In conclusion, a performance comparison of the realized RR monitoring device with other similar systems based on the piezoresistive sensors is presented in Table 6.
As is evident from Table 6, the performance of the developed chest band is in line with that provided by similar RR monitoring systems based on piezoresistive textiles. The system proposed in [65] employs yarn-based sensors to improve the sensing characteristics. The experimental results demonstrated that the proposed RR monitoring system obtained the lowest mean error (as shown in Table 6), which was obtained with the use of a high-resolution acquisition board (16-bit NI PCI-6024 A/D card) followed by an offline post-process through a PC. Similarly, the system presented in [29] achieves slightly better performance (2% mean error) than the presented chest band due to the employment of a 16-bit acquisition stage (i.e., NI-USB6003), thus enabling it to detect quick and small movements related to breathing. In addition, the device in [29] uses two strain sensors placed at strategic points (abdomen and ribcage), enabling more reliable detection of respiratory activity.
However, the presented chest band employs a 12-bit Successive Approximation Register (SAR) ADC of the SAMD21 microcontroller, thus explain the reduced performance of our system compared to the aforementioned systems [23,65]. Nonetheless, as stated below, a system upgrade involving a high-resolution ADC will significantly improve overall system performance, thus improving the performance of the proposed device to that of the best-performing systems described above. The presented chest monitor represents a ready-to-use, discreet, and complete solution for monitoring breathing parameters, unlike the other wearable systems reported in the literature, which comprise only the sensing and conditioning sections, and leave the acquisition to an external data acquisition (DAQ) board and the processing to a PC [23,65]. In addition, the system in [66] uses two sensors realized with EeonTex fabric similar to that employed in this work (EeonTex LG-SLPA), placed on the chest and abdomen, resulting in a more intrusive solution than the proposed approach. From the performance point of view, our chest band obtains better performance when the user is standing than that presented in [66] (3.13% vs. 3.49% mean percentage error); nevertheless, the latter offers better performance when the user is seated.
Considering the wearability of the designed device, it is very compact and light, and does not hinder the user’s movements. In fact, it includes an electronic section with dimensions of 7 × 3 cm and a very narrow (2 cm width) and light (just 5 g) piezoelectric sensor band. In addition, the device does not require any external electronic section, meaning the device is more practical and easier to use compared to the devices previously discussed [23,24,65,66].
In conclusion, the presented chest band offers significant scope for reducing the mean error, thus enabling higher reliability in breathing activity monitoring. Specifically, the optimization of the integrated piezoresistive sensor, namely, its geometry and position, and the shape of the electrodes, can improve the respiratory movement detection and overall system performance. In addition, firmware optimization, mainly related to the involved parameters, can reduce the presence of artefacts in the respiratory signal, and thus improve the detection of breathing activity.
The developed chest band represents an optimal trade-off in terms of performance, complexity, and completeness. In actual test conditions, the proposed device obtained performance (mean error) comparable with that of similar systems that, however, use more performant and complex hardware solutions (i.e., a larger number of sensors, higher-resolution ADC, etc.) [29], or rely on an external data processing unit (i.e., PC) [23,65]. That is, the obtained results indicate that our system should achieve higher performance than those of competitor systems using comparable hardware. Indeed, a preliminary study was carried out with the developed sensing band employing an acquisition section based on an MSP430FG479 microcontroller equipped with a 16-bit Σ-Δ ADC, which achieved a mean error of 1.25% when the user was seated. From these results, the potential of the presented solution can be inferred; that is, performance can be obtained that is comparable to, or an improvement of, that of the other solutions already presented in the literature [66]. In addition, unlike other systems, our chest band has the advantage of carrying out real-time data processing directly onboard, and provides the final parameters to the host device only for viewing.

5. Conclusions

Monitoring breathing parameters is fundamental for the prevention or early diagnosis of cardiovascular diseases; thus, accurate and continuous detection of respiratory data can aid medical staff in following the patient’s condition during the rehabilitation phase. Wearable devices represent a powerful tool for detecting biophysical parameters, thereby providing a complete and accurate overview of the user’s status in a local and non-obtrusive manner. This paper proposes a novel chest band for monitoring the respiratory parameters (i.e., RR, inhalation and exhalation time, IER, flow rate). This design uses a custom strain sensor realized with a piezoresistive textile (EeonTex LTT-SLPA-20K) and a low-power electronic conditioning and acquisition section. The microcontroller unit (SAMD21G18A) acquires, filters, and processes the gathered data to extract the breathing parameters. Moreover, the MPU-6050 inertial sensor data support the extraction of breathing parameters, and the removal of signal components due to body movements that are extraneous to breathing. The onboard BLE module transmits the collected breathing parameters to a custom mobile application, allowing remote data monitoring. Test campaigns were carried out in different operative conditions (seated, standing, and walking) to establish the performance of the developed chest band. Correlation analysis of RR measurements obtained by the chest band, compared to those from counting breaths, demonstrated the proper operation of the wearable system, which achieved a Pearson correlation coefficient of 0.958 when the user was seated. Bland–Altman analysis indicated an MD of 0.8 BrPM, and an LoA of +3.47 and −1.87 BrPM, when the user was seated.
Furthermore, preliminary tests were carried out to establish the performance of the developed device in measuring the other breathing parameters (TI, TE, IER, V) using the data provided by a spirometer as a reference. The obtained results confirm that the developed chest band accurately estimates these parameters, demonstrating a measurement error below 8% for all parameters.
However, a more in-depth analysis will be performed in the future to provide a more complete and extended characterization of the device’s performance.

Author Contributions

Conceptualization, R.D.F. and P.V.; methodology, R.D.F., P.V. and M.D.V.; software, R.D.F.; validation, R.D.F. and P.V.; data curation, R.D.F., M.D.V. and P.V.; writing—original draft preparation, R.D.F. and P.V.; writing—review and editing, P.V., R.D.F. and M.D.V.; supervision, M.D.V. and R.D.F. All authors have read and agreed to the published version of the manuscript.

Funding

This research received no external funding.

Institutional Review Board Statement

Not applicable.

Informed Consent Statement

Informed consent was obtained from all subjects involved in the study.

Data Availability Statement

Data of our study are available upon request.

Conflicts of Interest

The authors declare no conflict of interest.

References

  1. Aliverti, A. Wearable Technology: Role in Respiratory Health and Disease. Breathe 2017, 13, e27–e36. [Google Scholar] [CrossRef] [PubMed]
  2. Tipparaju, V.V.; Xian, X.; Bridgeman, D.; Wang, D.; Tsow, F.; Forzani, E.; Tao, N. Reliable Breathing Tracking with Wearable Mask Device. IEEE Sens. J. 2020, 20, 5510–5518. [Google Scholar] [CrossRef] [PubMed]
  3. Perez, A.J.; Zeadally, S. Recent Advances in Wearable Sensing Technologies. Sensors 2021, 21, 6828. [Google Scholar] [CrossRef] [PubMed]
  4. Singh, O.P.; Howe, T.A.; Malarvili, M.B. Real-Time Human Respiration Carbon Dioxide Measurement Device for Cardiorespiratory Assessment. J. Breath Res. 2018, 12, 026003. [Google Scholar] [CrossRef] [PubMed]
  5. Kano, S.; Yamamoto, A.; Ishikawa, A.; Fujii, M. Respiratory Rate on Exercise Measured by Nanoparticle-Based Humidity Sensor. Annu. Int. Conf. IEEE Eng. Med. Biol. Soc. 2019, 2019, 3567–3570. [Google Scholar] [CrossRef] [PubMed]
  6. Longmore, S.K.; Lui, G.Y.; Naik, G.; Breen, P.P.; Jalaludin, B.; Gargiulo, G.D. A Comparison of Reflective Photoplethysmography for Detection of Heart Rate, Blood Oxygen Saturation, and Respiration Rate at Various Anatomical Locations. Sensors 2019, 19, 1874. [Google Scholar] [CrossRef]
  7. De Fazio, R.; Sponziello, A.; Cafagna, D.; Velazquez, R.; Visconti, P. An Overview on Technologies and Devices against COVID-19 Pandemic Diffusion: Virus Detection and Monitoring Solutions. Int. J. Smart Sens. Intell. Syst. 2021, 14, 1–28. [Google Scholar] [CrossRef]
  8. De Fazio, R.; De Vittorio, M.; Visconti, P. Innovative IoT Solutions and Wearable Sensing Systems for Monitoring Human Biophysical Parameters: A Review. Electronics 2021, 10, 1660. [Google Scholar] [CrossRef]
  9. Soon, S.; Svavarsdottir, H.; Downey, C.; Jayne, D.G. Wearable Devices for Remote Vital Signs Monitoring in the Outpatient Setting: An Overview of the Field. BMJ Innov. 2020, 6, 55–71. [Google Scholar] [CrossRef]
  10. Hahanov, V.; Miz, V. Big Data Driven Healthcare Services and Wearables. In Proceedings of the Experience of Designing and Application of CAD Systems in Microelectronics, Lviv, Ukraine, 24–27 February 2015; IEEE: Lviv, Ukraine, 2015; pp. 310–312. [Google Scholar]
  11. Blanco-Almazán, D.; Groenendaal, W.; Catthoor, F.; Jané, R. Chest Movement and Respiratory Volume Both Contribute to Thoracic Bioimpedance during Loaded Breathing. Sci. Rep. 2019, 9, 20232. [Google Scholar] [CrossRef]
  12. Zhong, J.; Li, C.; Zhu, W.; Zhou, H.; Liu, Y.; Han, X. Wearable Respiratory Strain Monitoring System Based on Textile-Based Capacitive Strain Sensor. J. Phys. Conf. Ser. 2020, 1570, 012033. [Google Scholar] [CrossRef]
  13. De Fazio, R.; Stabile, M.; De Vittorio, M.; Velázquez, R.; Visconti, P. An Overview of Wearable Piezoresistive and Inertial Sensors for Respiration Rate Monitoring. Electronics 2021, 10, 2178. [Google Scholar] [CrossRef]
  14. Rahmani, M.H.; Berkvens, R.; Weyn, M. Chest-Worn Inertial Sensors: A Survey of Applications and Methods. Sensors 2021, 21, 2875. [Google Scholar] [CrossRef] [PubMed]
  15. De Fazio, R.; Perrone, E.; Velázquez, R.; De Vittorio, M.; Visconti, P. Development of a Self-Powered Piezo-Resistive Smart Insole Equipped with Low-Power BLE Connectivity for Remote Gait Monitoring. Sensors 2021, 21, 4539. [Google Scholar] [CrossRef]
  16. Quy, V.N.; Duy, D.T.X.; Kien, D.T.; Tu, V.H.; Sun, Q.; Roy, V.A.L.; Pham, V.; Dao, T.T. Wearable Device for Monitoring Heart Rate Based on Low-Cost Piezoresistive Sensor. In Proceedings of the 2019 8th International Conference on Modern Circuits and Systems Technologies (MOCAST), Thessaloniki, Greece, 13–15 May 2019; pp. 1–4. [Google Scholar]
  17. Lanatà, A.; Scilingo, E.P.; Nardini, E.; Loriga, G.; Paradiso, R.; De-Rossi, D. Comparative Evaluation of Susceptibility to Motion Artifact in Different Wearable Systems for Monitoring Respiratory Rate. IEEE Trans. Inf. Technol. Biomed. 2010, 14, 378–386. [Google Scholar] [CrossRef]
  18. Yang, W.; Li, N.-W.; Zhao, S.; Yuan, Z.; Wang, J.; Du, X.; Wang, B.; Cao, R.; Li, X.; Xu, W.; et al. A Breathable and Screen-Printed Pressure Sensor Based on Nanofiber Membranes for Electronic Skins. Adv. Mater. Technol. 2018, 3, 1700241. [Google Scholar] [CrossRef]
  19. Massaroni, C.; Nicolò, A.; Lo Presti, D.; Sacchetti, M.; Silvestri, S.; Schena, E. Contact-Based Methods for Measuring Respiratory Rate. Sensors 2019, 19, 908. [Google Scholar] [CrossRef]
  20. Reinvuo, T.; Hannula, M.; Sorvoja, H.; Alasaarela, E.; Myllyla, R. Measurement of Respiratory Rate with High-Resolution Accelerometer and Emfit Pressure Sensor. In Proceedings of the 2006 IEEE Sensors Applications Symposium, Houston, TX, USA, 7–9 February 2006; pp. 192–195. [Google Scholar]
  21. Vanegas, E.; Igual, R.; Plaza, I. Piezoresistive Breathing Sensing System with 3D Printed Wearable Casing. J. Sens. 2019, 2019, 2431731. [Google Scholar] [CrossRef]
  22. Francés-Morcillo, L.; Morer-Camo, P.; Rodríguez-Ferradas, M.I.; Cazón-Martín, A. Wearable Design Requirements Identification and Evaluation. Sensors 2020, 20, 2599. [Google Scholar] [CrossRef]
  23. Zheng, Q.; Liu, X.; Xu, H.; Cheung, M.-S.; Choi, Y.-W.; Huang, H.-C.; Lei, H.-Y.; Shen, X.; Wang, Z.; Wu, Y.; et al. Sliced Graphene Foam Films for Dual-Functional Wearable Strain Sensors and Switches. Nanoscale Horiz. 2018, 3, 35–44. [Google Scholar] [CrossRef]
  24. Raji, R.K.; Miao, X.; Wan, A.; Niu, L.; Li, Y.; Boakye, A. Knitted Piezoresistive Smart Chest Band and Its Application for Respiration Patterns Assessment. J. Eng. Fibers Fabr. 2019, 14, 1558925019868474. [Google Scholar] [CrossRef]
  25. Massaroni, C.; Di Tocco, J.; Lo Presti, D.; Longo, U.G.; Miccinilli, S.; Sterzi, S.; Formica, D.; Saccomandi, P.; Schena, E. Smart Textile Based on Piezoresistive Sensing Elements for Respiratory Monitoring. IEEE Sens. J. 2019, 19, 7718–7725. [Google Scholar] [CrossRef]
  26. Gargiulo, G.D.; O’Loughlin, A.; Breen, P.P. Electro-Resistive Bands for Non-Invasive Cardiac and Respiration Monitoring, a Feasibility Study. Physiol. Meas. 2015, 36, N35–N49. [Google Scholar] [CrossRef] [PubMed]
  27. Jayarathna, T.; Gargiulo, G.D.; Breen, P.P. Polymer Sensor Embedded, IOT Enabled t-Shirt for Long-Term Monitoring of Sleep Disordered Breathing. In Proceedings of the 2019 IEEE 5th World Forum on Internet of Things (WF-IoT), Limerick, Ireland, 15–18 April 2019; pp. 139–143. [Google Scholar]
  28. Molinaro, N.; Massaroni, C.; Lo Presti, D.; Saccomandi, P.; Di Tomaso, G.; Zollo, L.; Perego, P.; Andreoni, G.; Schena, E. Wearable Textile Based on Silver Plated Knitted Sensor for Respiratory Rate Monitoring. In Proceedings of the 2018 40th Annual International Conference of the IEEE Engineering in Medicine and Biology Society (EMBC), Honolulu, HI, USA, 18–21 July 2018; pp. 2865–2868. [Google Scholar]
  29. Chu, M.; Nguyen, T.; Pandey, V.; Zhou, Y.; Pham, H.N.; Bar-Yoseph, R.; Radom-Aizik, S.; Jain, R.; Cooper, D.M.; Khine, M. Respiration Rate and Volume Measurements Using Wearable Strain Sensors. npj Digit. Med. 2019, 2, 8. [Google Scholar] [CrossRef]
  30. Cay, G.; Ravichandran, V.; Saikia, M.J.; Hoffman, L.; Laptook, A.; Padbury, J.; Salisbury, A.L.; Gitelson-Kahn, A.; Venkatasubramanian, K.; Shahriari, Y.; et al. An E-Textile Respiration Sensing System for NICU Monitoring: Design and Validation. J. Sign. Process. Syst. 2021, 1–15. [Google Scholar] [CrossRef]
  31. Rasheed, A.; Iranmanesh, E.; Li, W.; Xu, Y.; Zhou, Q.; Ou, H.; Wang, K. An Active Self-Driven Piezoelectric Sensor Enabling Real-Time Respiration Monitoring. Sensors 2019, 19, 3241. [Google Scholar] [CrossRef]
  32. Zanetti, J.M.; Tavakolian, K. Seismocardiography: Past, Present and Future. In Proceedings of the 2013 35th Annual International Conference of the IEEE Engineering in Medicine and Biology Society (EMBC), Osaka, Japan, 3–7 July 2013; pp. 7004–7007. [Google Scholar]
  33. Andreozzi, E.; Fratini, A.; Esposito, D.; Naik, G.; Polley, C.; Gargiulo, G.D.; Bifulco, P. Forcecardiography: A Novel Technique to Measure Heart Mechanical Vibrations onto the Chest Wall. Sensors 2020, 20, 3885. [Google Scholar] [CrossRef]
  34. Andreozzi, E.; Centracchio, J.; Punzo, V.; Esposito, D.; Polley, C.; Gargiulo, G.D.; Bifulco, P. Respiration Monitoring via Forcecardiography Sensors. Sensors 2021, 21, 3996. [Google Scholar] [CrossRef]
  35. Andreozzi, E.; Gargiulo, G.D.; Esposito, D.; Bifulco, P. A Novel Broadband Forcecardiography Sensor for Simultaneous Monitoring of Respiration, Infrasonic Cardiac Vibrations and Heart Sounds. Front. Physiol. 2021, 12, 725716. [Google Scholar] [CrossRef]
  36. Lee, J.; Kim, M.; Park, H.-K.; Kim, I.Y. Motion Artifact Reduction in Wearable Photoplethysmography Based on Multi-Channel Sensors with Multiple Wavelengths. Sensors 2020, 20, 1493. [Google Scholar] [CrossRef]
  37. Piuzzi, E.; Capuano, A.; Pisa, S.; Cappa, P.; Patané, F.; Rossi, S.; Giaquinto, N.; D’Aucelli, G.M. Impedance Plethysmography System with Inertial Measurement Units for Motion Artefact Reduction: Application to Continuous Breath Activity Monitoring. In Proceedings of the 2015 IEEE International Symposium on Medical Measurements and Applications (MeMeA), Turin, Italy, 7–9 July 2015. [Google Scholar] [CrossRef]
  38. Whitlock, J.; Sill, J.; Jain, S. A-Spiro: Towards Continuous Respiration Monitoring. Smart Health 2020, 15, 100105. [Google Scholar] [CrossRef]
  39. Munz, M.; Wolf, N. Simulation of Breathing Patterns and Classification of Sensor Data for the Early Detection of Impending Sudden Infant Death. Curr. Dir. Biomed. Eng. 2019, 5, 401–403. [Google Scholar] [CrossRef]
  40. MG Chemicals Silver Conductive Epoxy Adhesive 8221 Technical Datasheet. Available online: https://www.alliedelec.com/m/d/7989ddf713cf916cf8c8b6db80c7c854.pdf (accessed on 13 July 2021).
  41. LiquiwireTM Elettricamente Conducendo Vernice per PCB Circuito Elettrico & Riparazione. Available online: https://www.ebay.it/itm/223704549098 (accessed on 12 July 2021).
  42. EeonTex Conductive Stretchable Fabric—COM-14112—SparkFun Electronics. Available online: https://www.sparkfun.com/products/retired/14112 (accessed on 12 July 2021).
  43. Liang, A.; Stewart, R.; Bryan-Kinns, N. Analysis of Sensitivity, Linearity, Hysteresis, Responsiveness, and Fatigue of Textile Knit Stretch Sensors. Sensors 2019, 19, 3618. [Google Scholar] [CrossRef] [PubMed]
  44. Texas Instruments TL071 Datasheet. Available online: https://www.ti.com/product/TL071 (accessed on 13 July 2021).
  45. Wirth, A.; Gates, C.; Smith, J. Medical Device Cybersecurity for Engineers and Manufacturers; Artech House: Norwood, MA, USA, 2020; ISBN 978-1-63081-816-6. [Google Scholar]
  46. McCarron, M.M.; Devine, B.J. Clinical Pharmacy: Case Studies: Case Number 25 Gentamicin Therapy. Drug Intell. Clin. Pharm. 1974, 8, 650–655. [Google Scholar] [CrossRef]
  47. Scott, J.B.; Kaur, R. Monitoring Breathing Frequency, Pattern, and Effort. Respir. Care 2020, 65, 793–806. [Google Scholar] [CrossRef]
  48. Fieselmann, J.F.; Hendryx, M.S.; Helms, C.M.; Wakefield, D.S. Respiratory Rate Predicts Cardiopulmonary Arrest for Internal Medicine Inpatients. J. Gen. Intern. Med. 1993, 8, 354–360. [Google Scholar] [CrossRef]
  49. Van Diest, I.; Verstappen, K.; Aubert, A.E.; Widjaja, D.; Vansteenwegen, D.; Vlemincx, E. Inhalation/Exhalation Ratio Modulates the Effect of Slow Breathing on Heart Rate Variability and Relaxation. Appl. Psychophysiol. Biofeedback 2014, 39, 171–180. [Google Scholar] [CrossRef]
  50. Laborde, S.; Iskra, M.; Zammit, N.; Borges, U.; You, M.; Sevoz-Couche, C.; Dosseville, F. Slow-Paced Breathing: Influence of Inhalation/Exhalation Ratio and of Respiratory Pauses on Cardiac Vagal Activity. Sustainability 2021, 13, 7775. [Google Scholar] [CrossRef]
  51. Pleil, J.D.; Wallace, M.A.G.; Davis, M.D.; Matty, C.M. The Physics of Human Breathing: Flow, Timing, Volume, and Pressure Parameters for Normal, on-Demand, and Ventilator Respiration. J. Breath Res. 2021, 15, 042002. [Google Scholar] [CrossRef]
  52. Samarghandi, A.; Ioachimescu, O.C.; Qayyum, R. Association between Peak Inspiratory Flow Rate and Hand Grip Muscle Strength in Hospitalized Patients with Acute Exacerbation of Chronic Obstructive Pulmonary Disease. PLoS ONE 2020, 15, e0227737. [Google Scholar] [CrossRef]
  53. Langone, M.; Setola, R.; Lopez, J. Cybersecurity of Wearable Devices: An Experimental Analysis and a Vulnerability Assessment Method. In Proceedings of the 2017 IEEE 41st Annual Computer Software and Applications Conference (COMPSAC), Turin, Italy, 4–8 July 2017; Volume 2, pp. 304–309. [Google Scholar]
  54. Beattie, Z.T.; Jacobs, P.G.; Riley, T.C.; Hagen, C.C. A Time-Frequency Respiration Tracking System Using Non-Contact Bed Sensors with Harmonic Artifact Rejection. In Proceedings of the 2015 37th Annual International Conference of the IEEE Engineering in Medicine and Biology Society (EMBC), Milan, Italy, 25–29 August 2015; Volume 2015, pp. 8111–8114. [Google Scholar] [CrossRef]
  55. Giavarina, D. Understanding Bland Altman Analysis. Biochem. Med. 2015, 25, 141–151. [Google Scholar] [CrossRef] [PubMed]
  56. Saha, U.; Kamat, A.; Sengupta, D.; Jayawardhana, B.; Kottapalli, A.G.P. A Low-Cost Lung Monitoring Point-of-Care Device Based on a Flexible Piezoresistive Flow Sensor. In Proceedings of the 2020 IEEE Sensors, Rotterdam, The Netherlands, 25 October 2020; pp. 1–4. [Google Scholar]
  57. Nguyen, T.-V.; Ichiki, M. MEMS-Based Sensor for Simultaneous Measurement of Pulse Wave and Respiration Rate. Sensors 2019, 19, 4942. [Google Scholar] [CrossRef] [PubMed]
  58. Abbasnejad, B.; Thorby, W.; Razmjou, A.; Jin, D.; Asadnia, M.; Ebrahimi Warkiani, M. MEMS Piezoresistive Flow Sensors for Sleep Apnea Therapy. Sens. Actuators A Phys. 2018, 279, 577–585. [Google Scholar] [CrossRef]
  59. Capineri, L. Resistive Sensors with Smart Textiles for Wearable Technology: From Fabrication Processes to Integration with Electronics. Procedia Eng. 2014, 87, 724–727. [Google Scholar] [CrossRef]
  60. Liu, G.-Z.; Guo, Y.-W.; Zhu, Q.-S.; Huang, B.-Y.; Wang, L. Estimation of Respiration Rate from Three-Dimensional Acceleration Data Based on Body Sensor Network. Telemed. e-Health 2011, 17, 705–711. [Google Scholar] [CrossRef] [PubMed]
  61. Siam, A.I.; El-Bahnasawy, N.A.; Banby, G.M.E.; Elazm, A.A.; El-Samie, F.E.A.; El-Samie, F.E.A. Efficient Video-Based Breathing Pattern and Respiration Rate Monitoring for Remote Health Monitoring. J. Opt. Soc. Am. A JOSAA 2020, 37, 118–124. [Google Scholar] [CrossRef]
  62. Ali, M.; Elsayed, A.; Mendez, A.; Savaria, Y.; Sawan, M. Contact and Remote Breathing Rate Monitoring Techniques: A Review. IEEE Sens. J. 2021, 21, 14569–14586. [Google Scholar] [CrossRef]
  63. Tachiquin, R.; Velázquez, R.; Del-Valle-Soto, C.; Gutiérrez, C.A.; Carrasco, M.; De Fazio, R.; Trujillo-León, A.; Visconti, P.; Vidal-Verdú, F. Wearable Urban Mobility Assistive Device for Visually Impaired Pedestrians using a Smartphone and a Tactile-Foot Interface. Sensors 2021, 21, 5274. [Google Scholar] [CrossRef]
  64. Jeong, J.-W.; Jang, Y.; Lee, I.; Shin, S.; Kim, S.-B. Wearable Respiratory Rate Monitoring Using Piezo-Resistive Fabric Sensor. In Proceedings of the 2009 World Congress on Medical Physics and Biomedical Engineering, Munich, Germany, 7–12 September 2009; Springer: Munich, Germany, 2009; pp. 282–284. [Google Scholar] [CrossRef]
  65. Huang, C.-T.; Shen, C.-L.; Tang, C.-F.; Chang, S.-H. A Wearable Yarn-Based Piezo-Resistive Sensor. Sens. Actuators A. Phys. 2008, 2, 396–403. [Google Scholar] [CrossRef]
  66. Di Tocco, J.; Raiano, L.; Sabbadini, R.; Massaroni, C.; Formica, D.; Schena, E. A Wearable System with Embedded Conductive Textiles and an IMU for Unobtrusive Cardio-Respiratory Monitoring. Sensors 2021, 21, 3018. [Google Scholar] [CrossRef]
Figure 1. Structure of the developed piezoresistive band for RR detection.
Futureinternet 14 00183 g001
Figure 2. Circuit scheme of the electronic conditioning section (a). Bode plot of the realized active filter: magnitude (b) and phase (c).
Futureinternet 14 00183 g002aFutureinternet 14 00183 g002b
Figure 3. Architecture of developed piezoresistive chest band.
Futureinternet 14 00183 g003
Figure 4. Front (a) and back (b) views of the developed piezoresistive band. Electronic sensing and conditioning with highlighting of the main components and modules (c).
Futureinternet 14 00183 g004aFutureinternet 14 00183 g004b
Figure 5. Flowchart of the breathing rate sensor’s firmware.
Futureinternet 14 00183 g005
Figure 6. Breathing parameters measured by the chest band shown by the Bluetooth serial monitor application.
Futureinternet 14 00183 g006
Figure 7. Screenshots of the developed Android application used to visualize the data transmitted by the developed piezoresistive band: Connection screen (a) and Monitoring screen (b).
Futureinternet 14 00183 g007
Figure 8. Breathing rate sensor worn on the user’s chest.
Futureinternet 14 00183 g008
Figure 9. Serial plotter showing the raw data (blue trace), filtered data (red trace), and peak detector output (green trace): wide (a) and detailed (b) views, highlighting the inspiration and expiration phases. Reference volume vs. time trend acquired by a spirometer (c).
Futureinternet 14 00183 g009aFutureinternet 14 00183 g009b
Figure 10. Correlation diagrams of RR measurements obtained by the developed piezoresistive chest band and counting the number of breaths, considering three different operating conditions: seated user (a), standing user (b), and user walking at 1 ms−1 (c). The multiplicity of the data points is indicated in the graph.
Futureinternet 14 00183 g010
Figure 11. Bland–Altman graphs of the measurements obtained by the developed chest band and those obtained by breath counting when the user is: seated (a), standing (b), and walking (c).
Futureinternet 14 00183 g011
Table 1. Summarizing table with the reported advantages and disadvantages of the discussed works.
WorkTransduction MechanismAdvantagesDisadvantages
E. Vanegas et al.
[21]
PiezoresistiveLightness, Small dimension, and FlexibilityMoving mechanical parts
No compensation for motion artefacts
R.K. Raji et al.
[24]
PiezoresistiveFlexibility, Easy to wear, LightnessCumbersome electronic section
No compensation for motion artefacts
C. Massironi et al.
[25]
PiezoresistiveFlexibility,
Lightness,
High Accuracy
Obstructive
(bulky connections)
No compensation for motion artefacts
G.D. Gargiulo et al.
[26]
PiezoresistiveFlexibility,
Lightness,
Easy to wear
Obstructive
(covers chest and abdomen)
No compensation for motion artefacts
N. Molinaro et al.
[28]
PiezoresistiveFlexibility,
Lightness
High hysteresis
M. Chu et al.
[29]
PiezoresistiveHigh Accuracy, Lightness,
Flexibility
Obstructive
(application on the skin)
A. Rasheed et al.
[31]
PiezoelectricHigh sensitivity and reliability
Lightness,
Flexibility
No compensation for motion artefacts
E. Andreozzi et al.
[35]
PiezoelectricHigh Accuracy,
Lightness,
Obstructive
(application on the skin)
J. Whitlock et al.
[38]
CapacitiveLightness, Small dimension, and FlexibilityCumbersome electronic section
Processing unit not on board
Table 2. Comparison of the measurements of TI, TE, IER, and V with the reference values provided by a spirometer.
Chest BandSpirometer
TI [ms]TE [ms]IER [adim]V [l\min]TI [ms]TE [ms]IER [adim]V [l\min]ETI [%]ETE [%]EIER [%]EV [%]
18957501.239.58507601.141.6−5.31.3−6.75.0
211218601.331.611808801.330.05.02.32.8−5.3
312108621.429.211208101.431.6−8.0−6.4−1.57.4
412207511.629.011807501.630.0−3.4−0.1−3.33.3
513178741.526.913608501.626.03.2−2.85.8−3.3
614239631.524.914509501.524.41.9−1.43.2−1.9
714529791.524.415109801.523.43.80.13.7−4.0
815109651.623.415809501.722.44.4−1.65.9−4.6
915289821.623.115609801.622.72.1−0.22.3−2.1
10165310241.621.4162010501.521.8−2.02.5−4.62.0
Table 3. Summary table reporting the information related to the patients involved in the chest band tests.
PatientGenderAgeWeight [kg]
1Male3081
2Male2478
3Male2280
4Female2562
5Female2465
6Femal2872
Table 4. Summary table reporting the performance of the chest band in measuring RR for different conditions (seated, standing, walking).
SeatedStandingWalking
Patientr
[adim]
MD
[BrPM]
LoA
[BrPM]
ME
[%]
r
[adim]
MD
[BrPM]
LoA
[BrPM]
ME
[%]
r
[adim]
MD
[BrPM]
LoA
[BrPM]
ME
[%]
10.9580.8+3.47/−1.87+3.390.9560.4+3.40/−2.61+3.760.9230.2+3.77/−3.37+5.10
20.9610.7+3.21/−1.64+3.120.9630.5+3.25/−2.34+3.420.9310.3+3.62/−2.56+4.12
30.9620.6+2.83/−1.89+2.980.9520.3+3.01/−2.56+3.120.9270.2+3.54/−2.89+4.32
40.9510.7+2.99/−1.98+3.240.9490.4+3.42/−2.52+3.670.9340.1+3.62/−3.67+4.76
50.9570.6+3.25/−1.67+2.820.9470.3+3.39/−2.56+3.780.9210.3+3.56/−3.54+4.65
60.9680.7+3.45/−1.45+3.250.9560.5+3.56/−2.78+3.620.9320.3+3.78/−3.65+4.78
Table 5. Table summarizing the piezoresistive RR sensors from the point of view of the used sensing device, processing unit, sampling rate, availability of wireless communication, and wearability.
WorkSensing
Device
Processing UnitSampling Frequency [Hz]Availability of Wireless CommunicationWearability
E. Venegas et al. [21]A201 FlexiForce sensorArduino Pro Mini
(ATMega32U)
50Bluetooth (HC-05)Medium
U. Saha et al. [56]PDMS/Graphene sensorArduino Uno
(ATMega328p)
1000WiFi (ESP8266)Low
T.V. Nguyen et al. [57]MEMS pressure sensorDL850 Acquisition board/PC1000NoHigh
R. K. Raji et al. [24]piezoresistive fabricSTM32F401RCT61000BLE (HC-08)Medium
B. Abbasnejad et al. [58]MEMS LCP pressure sensorNI-USB6003 board/PC2000NoLow
M. Chu et al. [29]Strain sensorNI-USB6003 board/PC1000BluetoothHigh
C. Massironi et al. [25]Silver conductive yarnsPIC18F46J5060Bluetooth
(SPBT2632C2A)
Medium
Proposed Chest BandLTT-SLPA-20K
Piezoresistive fabric
SAMD21G181000BLE (JDY-23)High
Table 6. Performance comparison of the developed RR monitoring device with other similar systems presented in the scientific literature.
WorkNumber of SensorsMean Error
Proposed Chest Band13.13% a
E. Venegas et al. [21]13.53%/3.99%
J. Jeong et al. [64]12.99%
M Chu et al. [29]22%
C. T. Huang et al. [65]10.5%
G. Cay et al. [30]22.06%
C. Massironi et al. [66]21.45% b −3.49 a −9.51% c
a Standing; b Sitted; c Supine.
Publisher’s Note: MDPI stays neutral with regard to jurisdictional claims in published maps and institutional affiliations.

