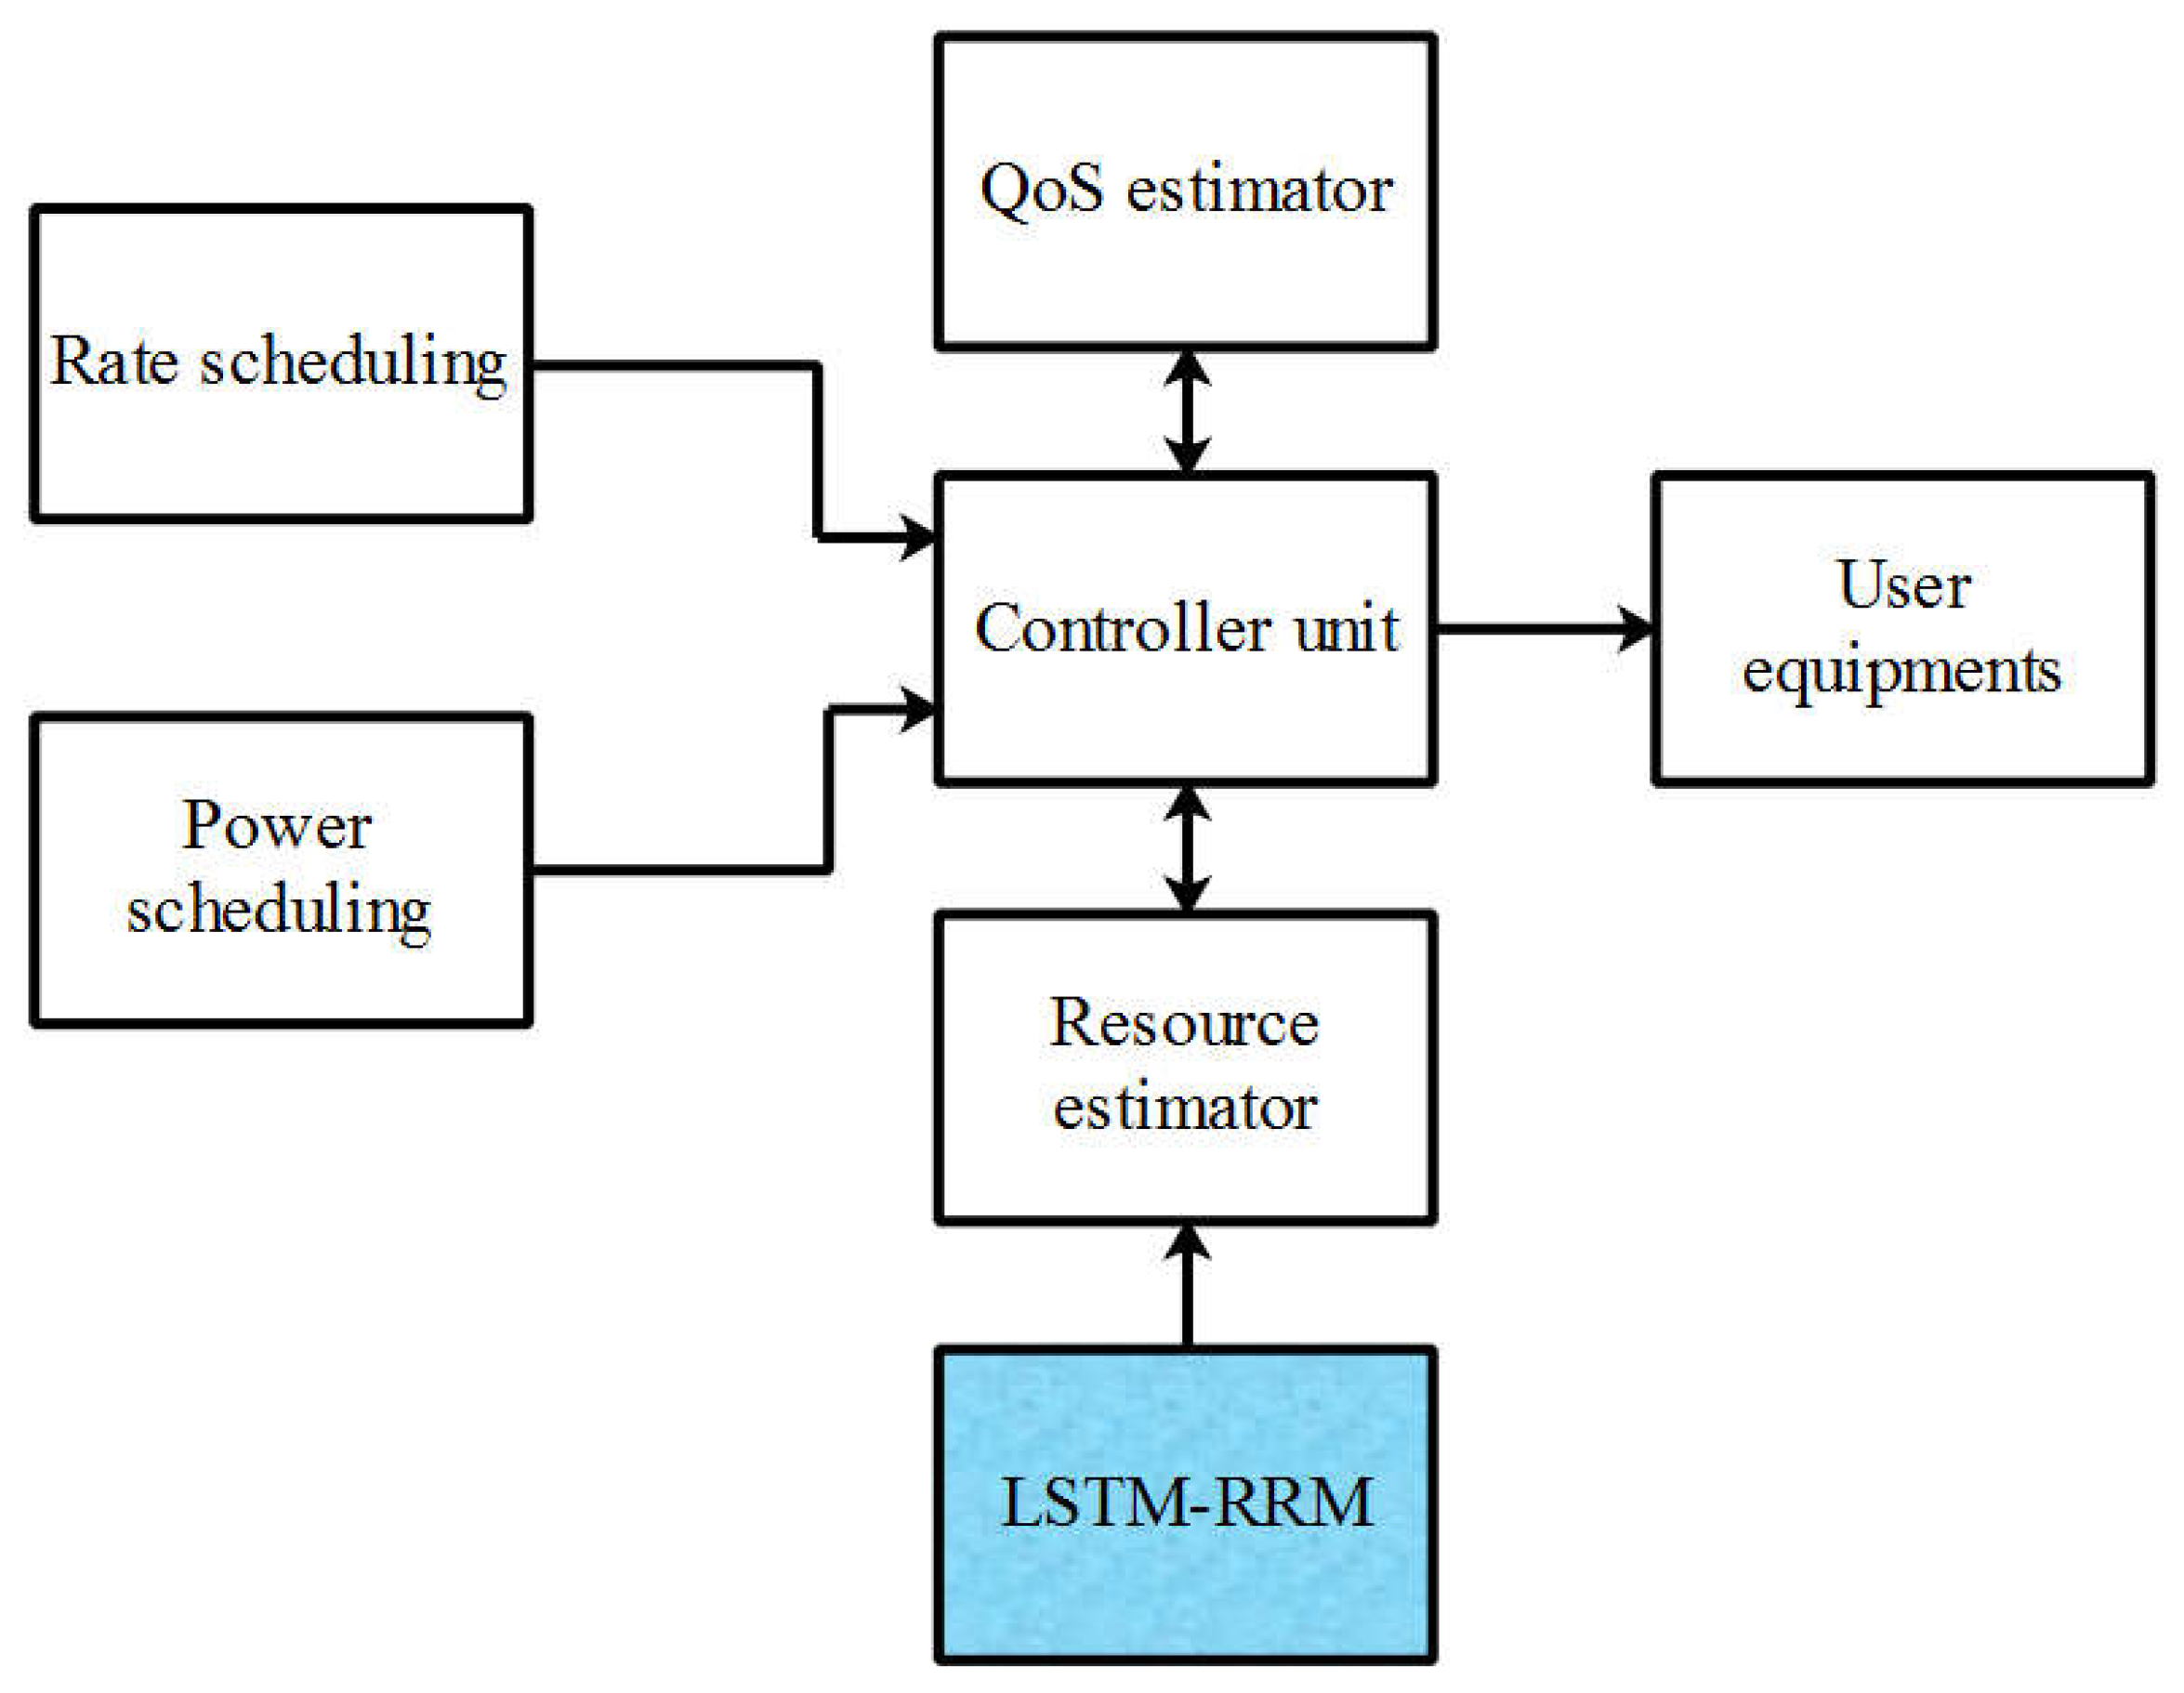
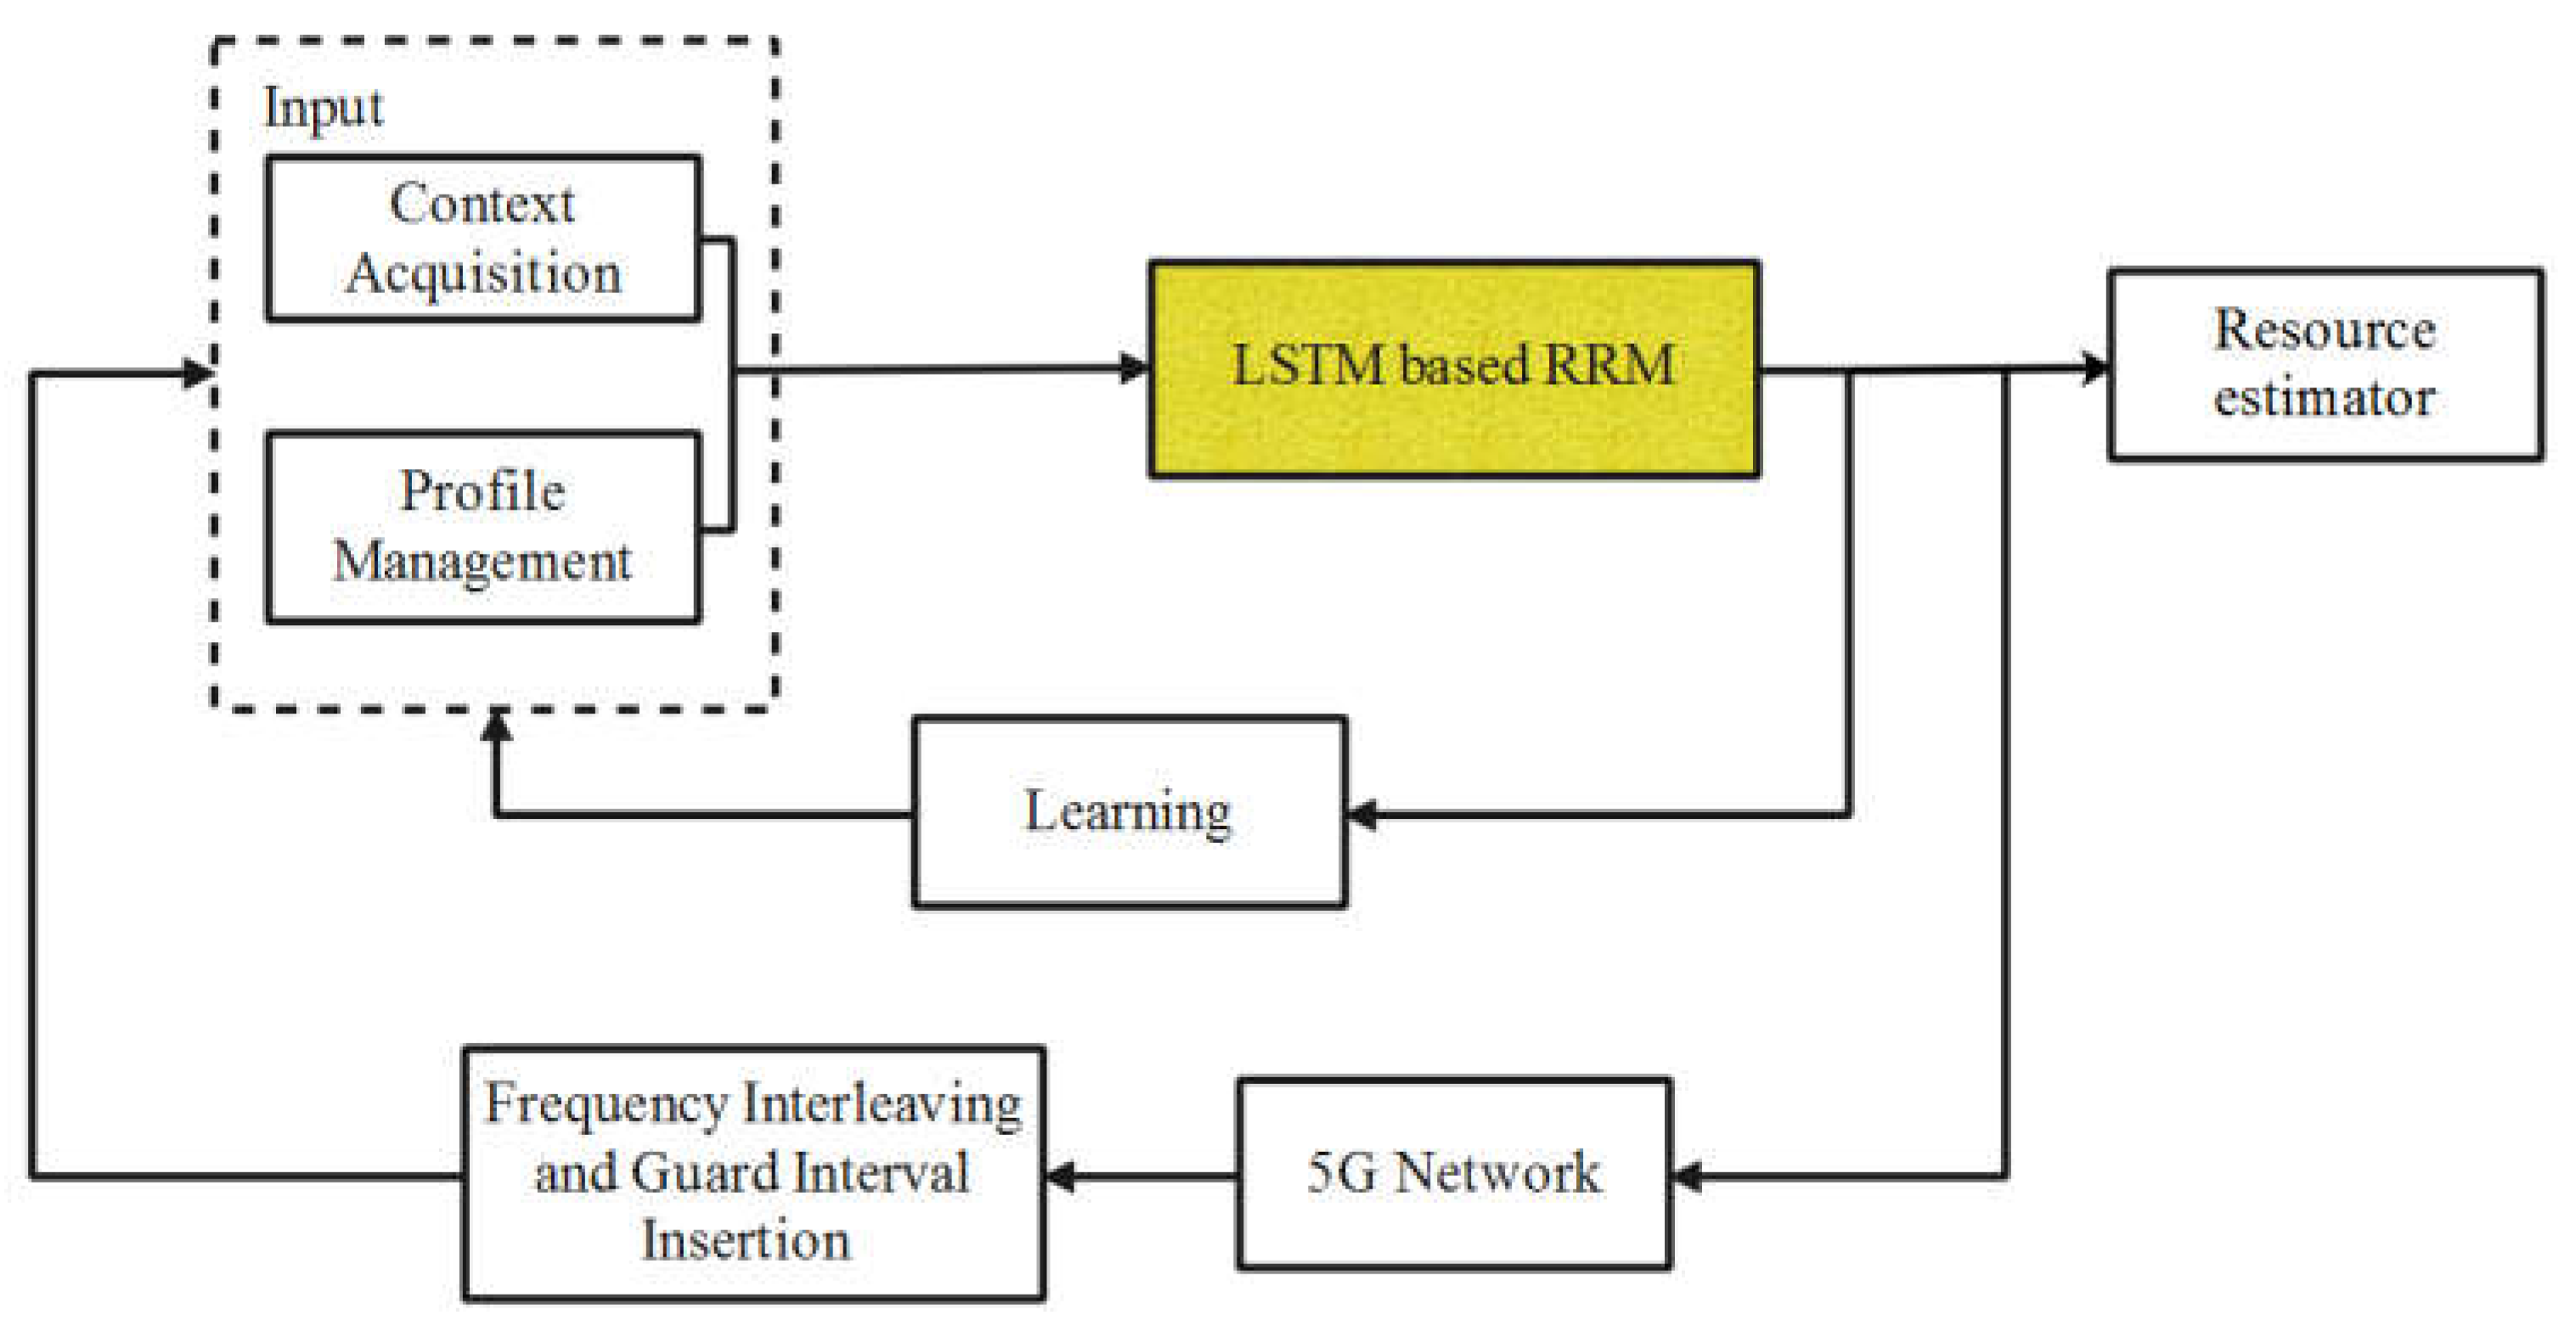
The results and discussion of the LSTM-RRM method are clearly described in this section. The implementation and simulation of the LSTM-RRM method was carried out in Network Simulator-3, which runs on a Windows 8 operating system with Intel core i3 processor and 4GB RAM. In this LSTM-RRM method, losses in the 5G environment are minimized by using frequency interleaving and guard interval insertion. Subsequently, the LSTM-based RRM is accomplished to allocate adequate resources for the desired UEs. The height of the BS considered for this LSTM-RRM method is 10 m, and the system bandwidth is 100 MHz. The specifications considered for the LSTM-RRM method are shown in
Table 2.
4.1. Performance Comparison between LSTM-RRM and DRRM
Here, the performance of the LSTM-RRM method is analyzed in terms of throughput, outage, Jain’s index, and dual connectivity. These performances are compared with DRRM [
20] to show the effectiveness of the LSTM-RRM method. The DRRM [
20] was also implemented and simulated in NS-3 to evaluate the LSTM-RRM method.
Figure 5 and
Table 3 show the comparison of UE throughput between DRRM [
20] and LSTM-RRM. Here, the comparison is made by varying the number of UEs from 5 to 30. From the analysis, it is concluded that the LSTM-RRM achieves higher UE throughput than the DRRM [
20]. For example, the UE throughput of the LSTM-RRM varies from 15 Mbps to 63 Mbps, whilst DRRM’s [
20] UE throughput varies from 10 Mbps to 61 Mbps. Specifically, the UE throughput of LSTM-RRM for 30 UE is improved up to 50% when compared to the DRRM [
20]. The LSTM-RRM achieves higher UE throughput because it mitigates the burst errors by using frequency interleaving, and ISI is minimized by using guard level insertion.
The comparison of 50 percentile UE throughput between DRRM [
20] and LSTM-RRM is shown in
Figure 6 and
Table 4. Here, the 50th percentile UE throughput is analyzed by varying the UE from 5 to 30. From the analysis, it is can be seen that the 50 percentile UE throughput of LSTM-RRM is higher than the DRRM [
20]. For the instance, the 50 percentile UE throughput of LSTM-RRM is in the range from 65 Mbps to 125 Mbps, whereas the DRRM [
20] is in the range from 40 Mbps to 95 Mbps. an effective resource allocation over the 5G network is used to increase the throughput of the LSTM-RRM. The 50 percentile UE throughput of LSTM-RRM for 30 UE is improved up to 62.5% when compared to the DRRM [
20].
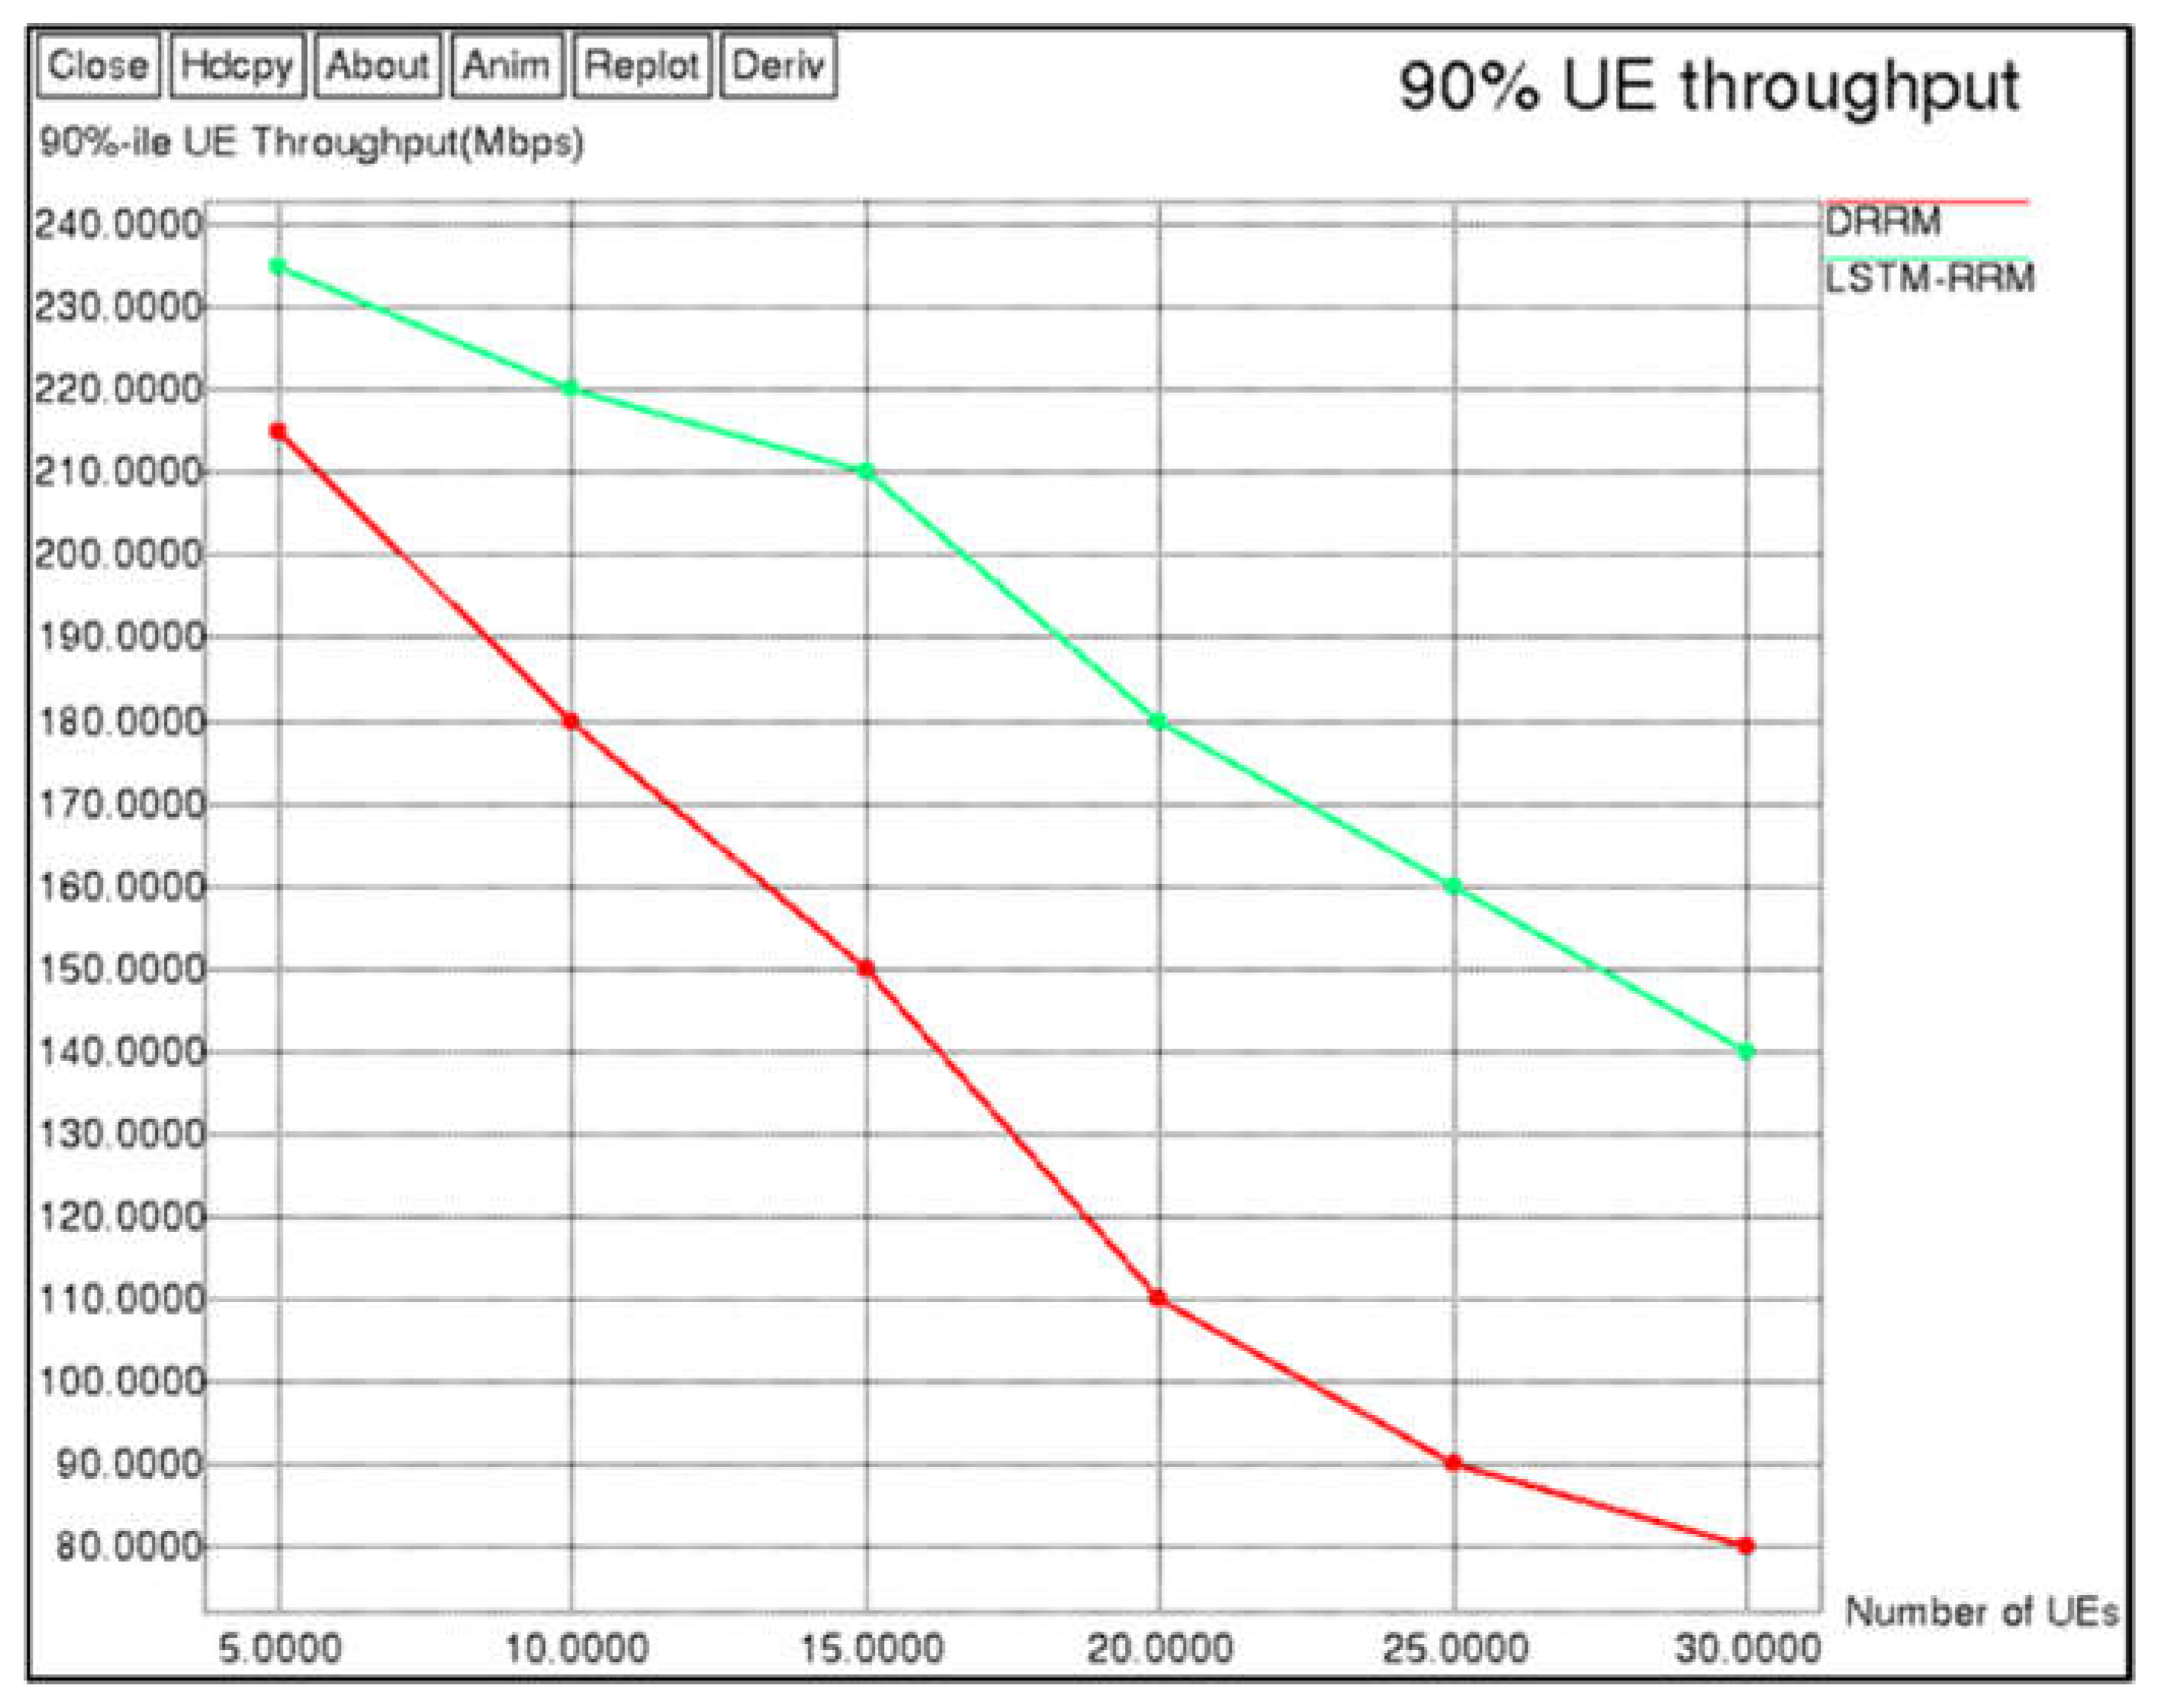
The throughput comparison of 90% UE is shown in
Figure 7 and
Table 5. Here, the variation of the throughput is analyzed for different numbers of user equipment: 5, 10, 15, 20, 25, and 30. From
Figure 7 and
Table 5, it can be seen that the LSTM-RRM method obtains higher throughput than the DRRM [
20]. For example, the 90% UE throughput of the LSTM-RRM varies from 140 Mbps to 235 Mbps, whilst DRRM [
20]’s UE throughput varies from 80 Mbps to 215 Mbps. Specifically, the 90% UE throughput of LSTM-RRM for 30 UE is improved up to 75% when compared to the DRRM [
20]. The LSTM-RRM method obtains higher throughput due to the optimal power and bandwidth allocation to the desired UE. Moreover, the losses through the 5G environment are minimized by using frequency interleaving and guard interval insertion. Therefore, the amount of packets received by the BS is increased during the communication.
The comparison of outage percentage between the LSTM-RRM method and DRRM [
20] is shown in
Figure 8 and
Table 6, determined by varying the UE from the 5 to 30. This outage analysis shows that the LSTM-RRM method achieves higher outage than the existing DRRM [
20]. For example, the outage percentage of LSTM-RRM varies from 87% to 98%, whereas the outage percentage of DRRM [
20] varies from 83% to 96%. The outage of the DRRM [
20] is less than the LSTM-RRM method due to its complexity. However, the optimal resource allocation of the LSTM-RRM method leads to an increase in outage through the 5G system.
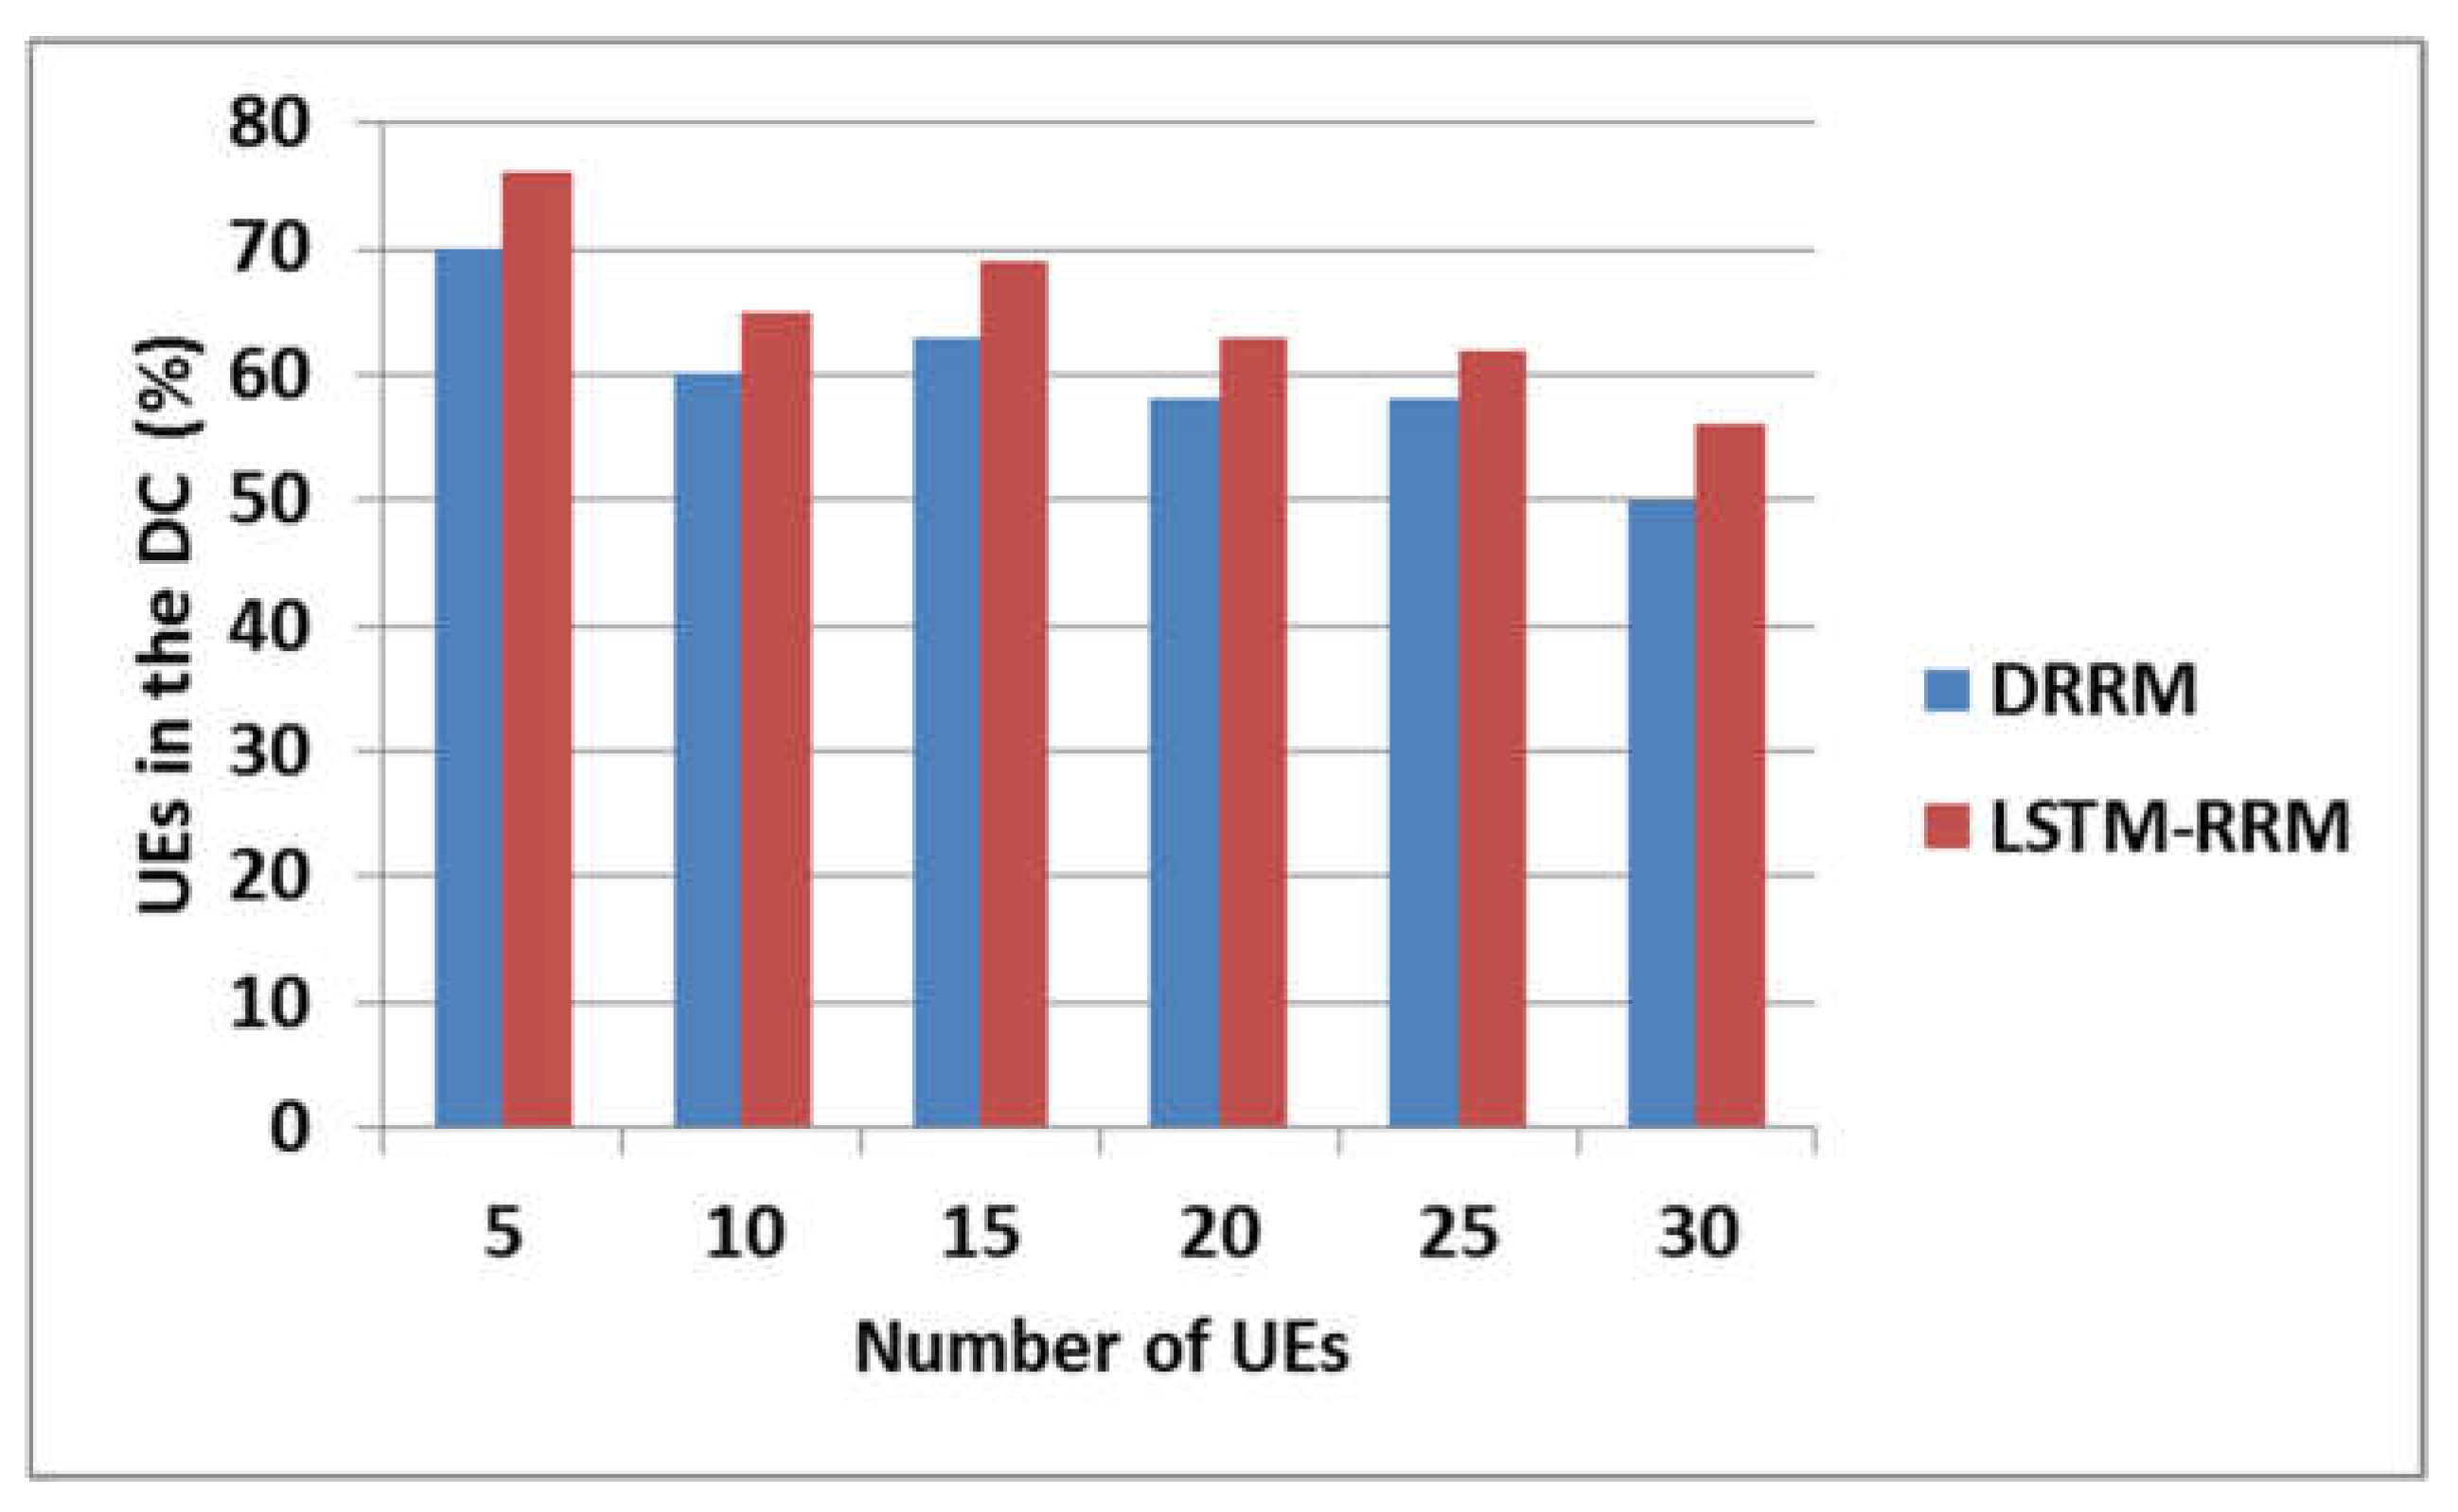
Figure 9 and
Table 7 show the dual connectivity comparison between the LSTM-RRM method and DRRM [
20]. Dual Connectivity (DC) specifies the capacity of connecting the different BSs in the same radio access technology. Specifically,
Figure 9 and
Table 7 illustrate the percentage of connected UE in dual connectivity with respect to the amount of UEs in the system. The LSTM-RRM method has higher dual connectivity than the DRRM [
20] because of its effective RRM between the UEs. The dual connectivity of LSTM-RRM for 30 UE is improved up to 12% when compared to the DRRM [
20]. The optimal power and bandwidth allocation using LSTM is used to improve the connectivity in the 5G system.
4.2. Performance Comparison between LSTM-RRM and QOC-RRM
Here, the performance of the LSTM-RRM is analyzed with the QOC-RRM [
21] in terms of different QOS parameters such as sum rate, threshold guaranteed rate, indoor guaranteed rate, and outdoor guaranteed rate. The aforementioned performances are analyzed by varying the number of users and distance in the 5G environment. This performance comparison for QOS parameters is described as follows:
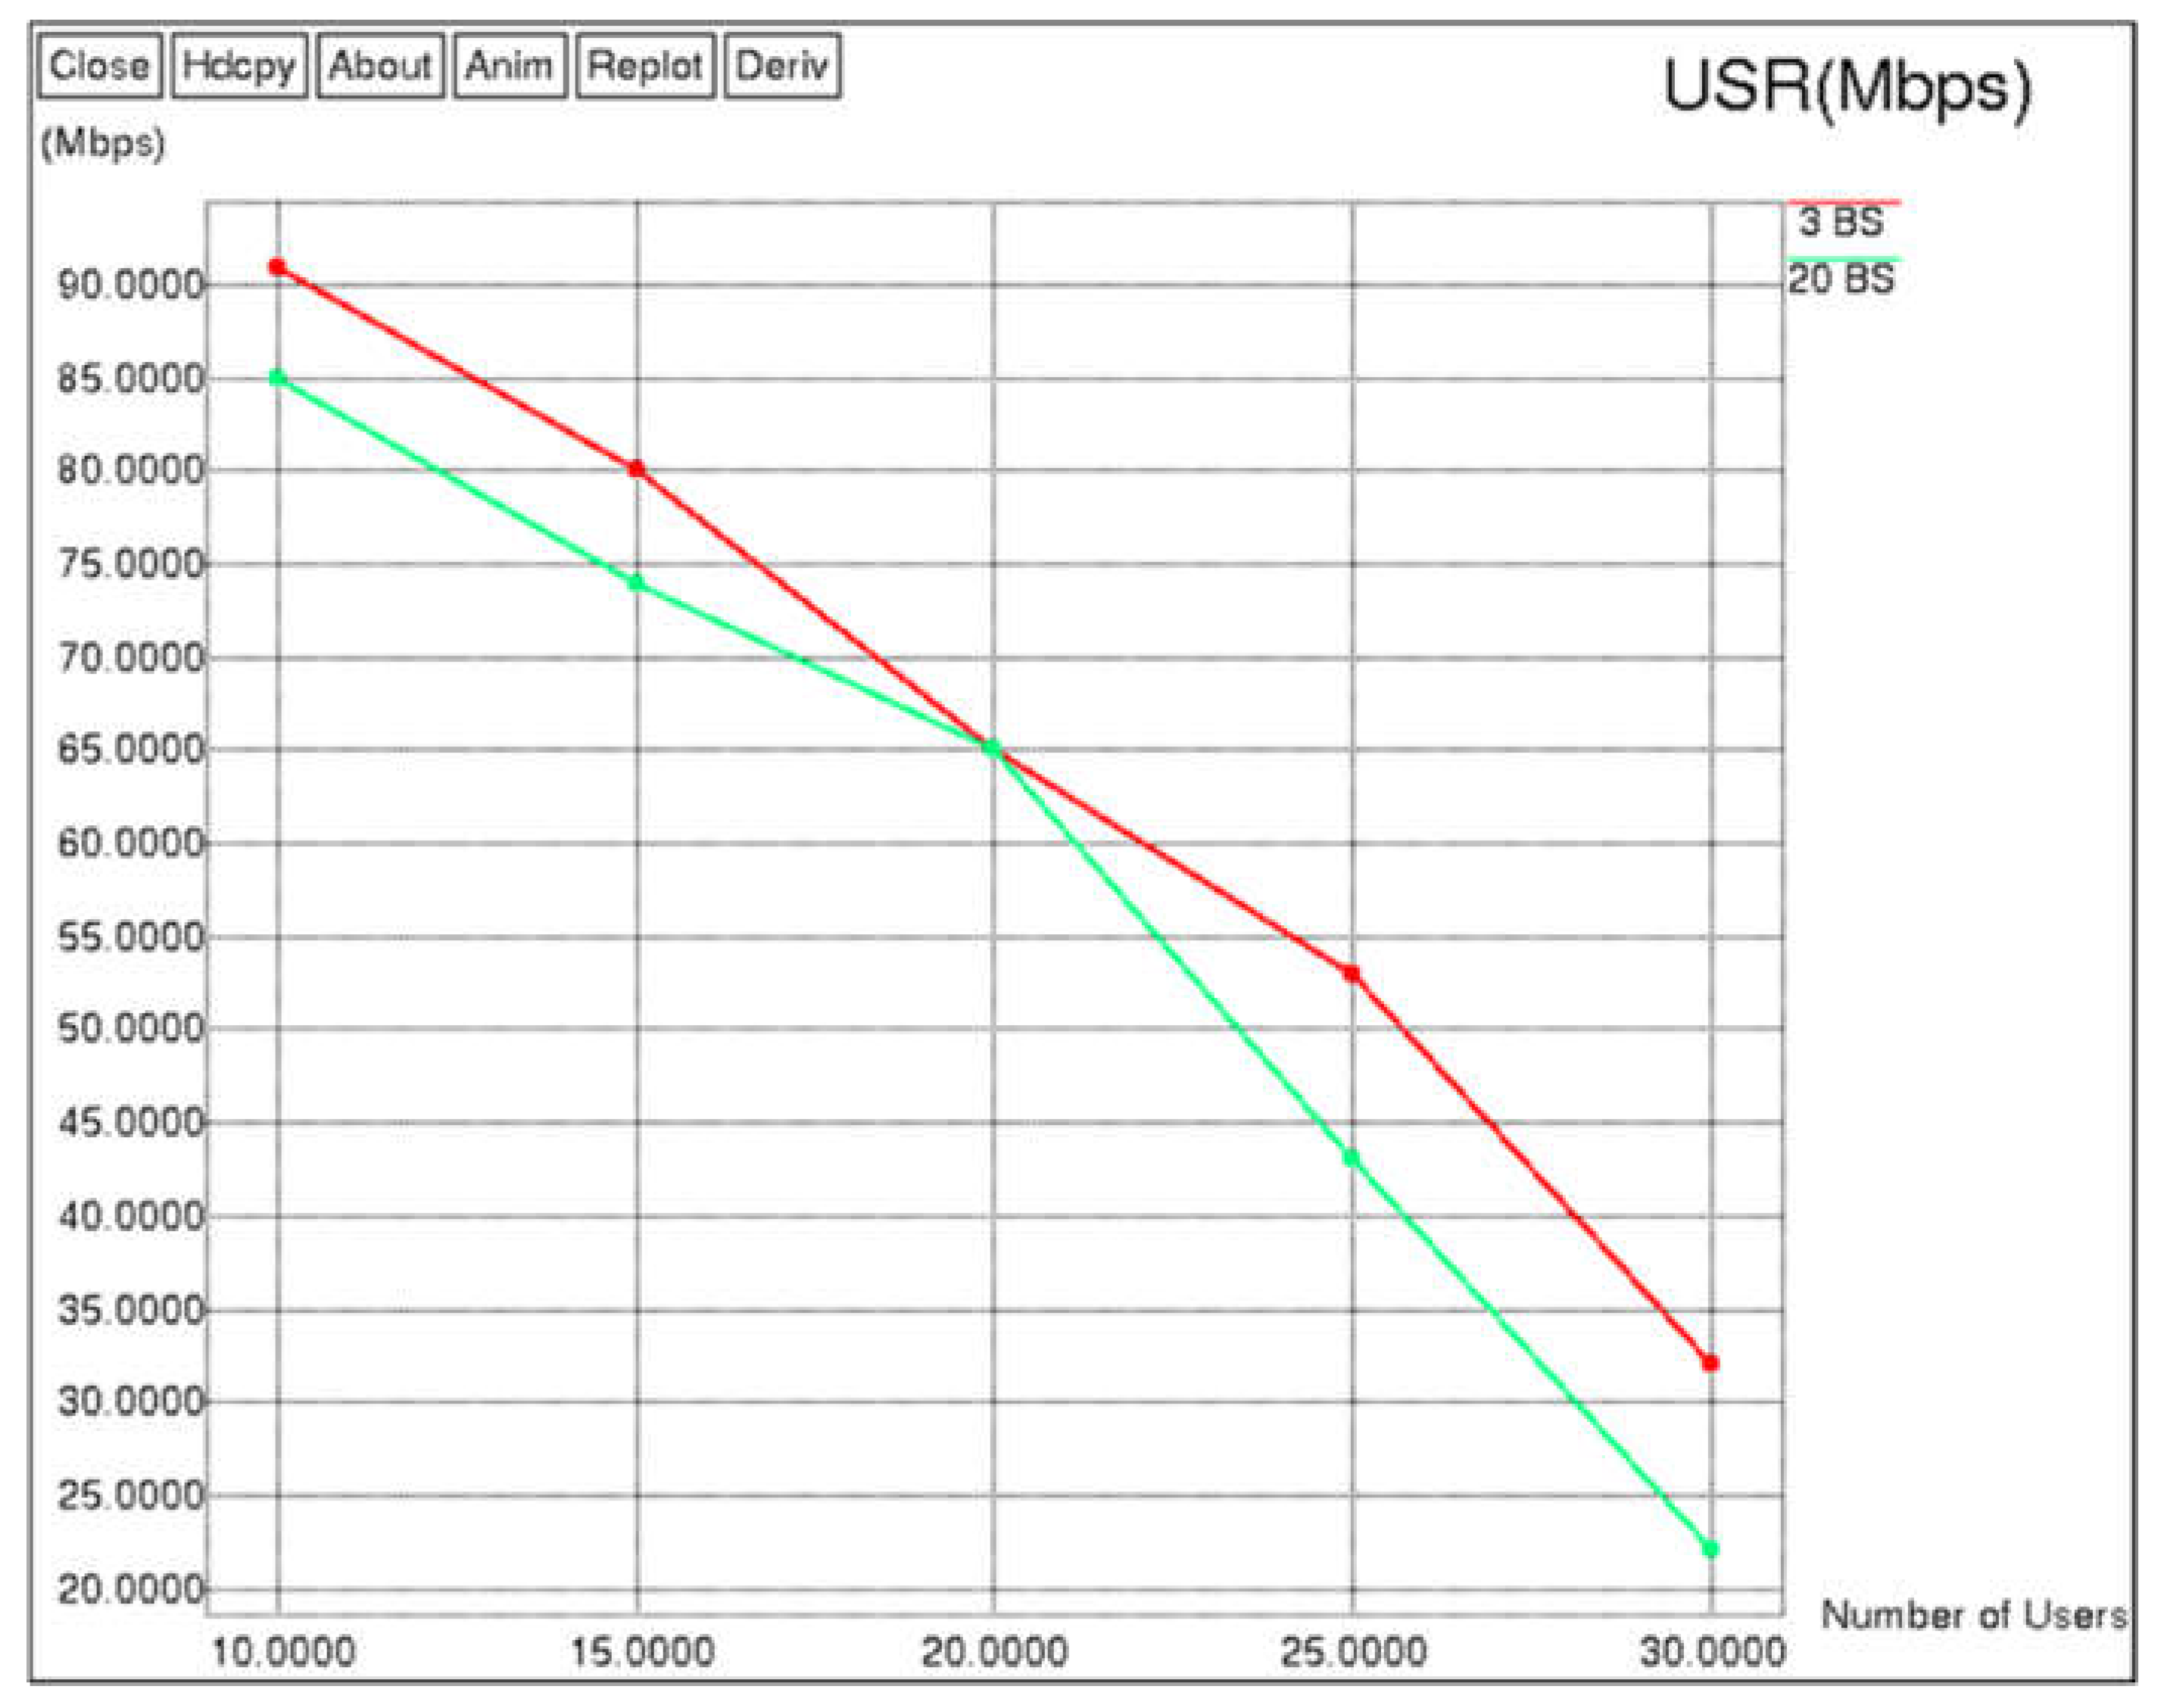
The analysis of USR for the LSTM-RRM for 3 Base Stations (BSs) and 20 BSs is shown in
Figure 10 and
Table 8. Here, the USR is analyzed by varying the users from 10 to 30. From the analysis, it is identified that the LSTM-RRM with the 3 BSs achieves higher USR than the LSTM-RRM with 20 BSs. For example, the LSTM-RRM with 3 BSs achieves USR in the range from 32 Mbps to 91 Mbps, whereas the LSTM-RRM with 20 BSs achieves USR in the range from 22 Mbps to 85 Mbps. The LSTM-RRM with 3 BSs provides significant improvement in USR due to less traffic. The comparison of USR between the LSTM-RRM with EPAS [
30] is given in
Table 9. Here, the EPAS [
30] is taken for comparison because this EPAS [
30] also used to allocate the power to the multiple users while broadcasting the data. From the comparison, it can be seen that the proposed LSTM-RRM achieves higher USR than the EPAS [
30] due to its optimal power allocation according to the bandwidth, power, and data rate.
Figure 11 and
Table 10 show the TSR comparison between LSTM-RRM with 3 BS and with 20 BS. Here, the comparison is made by varying the number of users from 10 to 30. From the analysis, it can be seen that the LSTM-RRM with 3 BS achieves higher TSR than the LSTM-RRM with 20 BS. For example, the TSR of the LSTM-RRM with 3 BS varies from 31 Mbps to 89 Mbps, whilst the TSR of the LSTM-RRM with 20 BS varies from 23 Mbps to 83 Mbps. Similar to the USR analysis, the LSTM-RRM with 3 BS achieves higher TSR due to less traffic.
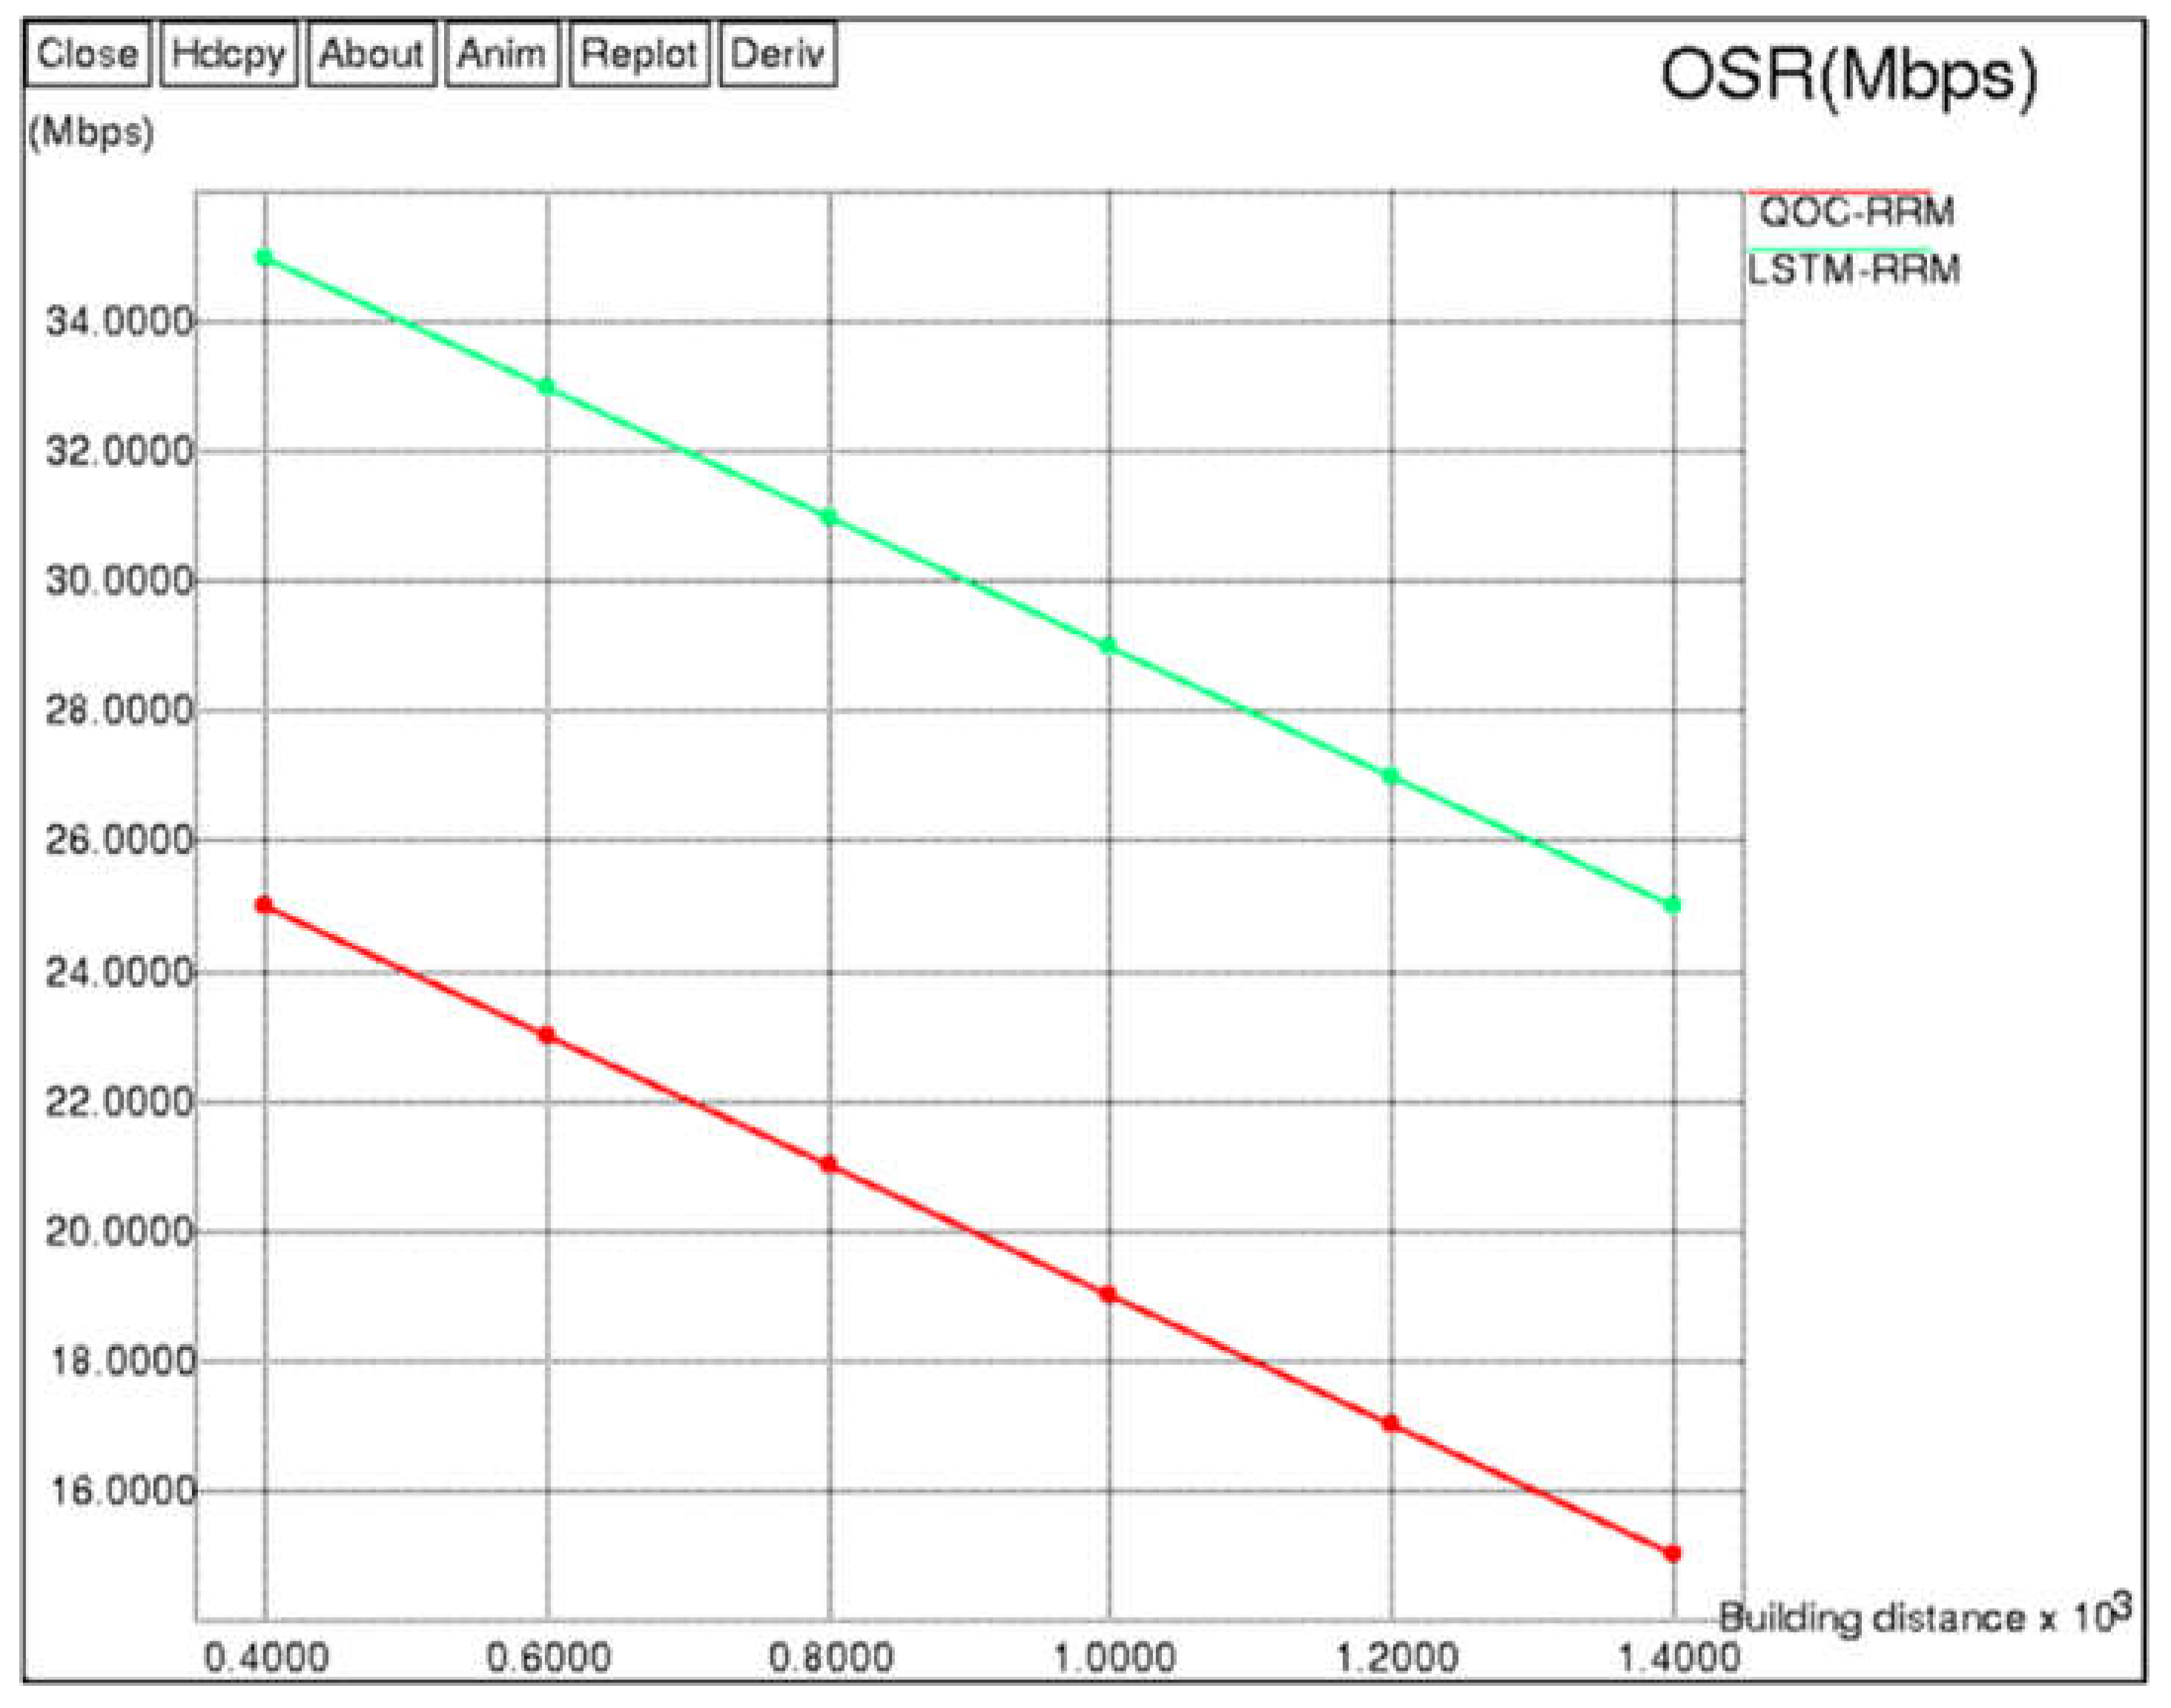
The comparison of OSR between the LSTM-RRM and QOC-RRM [
21] is shown in
Figure 12 and
Table 11. Here, the OSR is analyzed by varying the building distance from 400 to 1400. From the analysis, it can be seen that the LSTM-RRM achieves higher OSR than the QOC-RRM [
21]. For example, the LSTM-RRM achieves OSR in the range from 25 Mbps to 35 Mbps, whereas the QOC-RRM [
21] achieves OSR in the range from 15 Mbps to 25 Mbps. Specifically, the OSR of LSTM-RRM for building distance of 1400 m is improved up to 66.67% when compared to the QOC-RRM [
21]. The OSR of LSTM-RRM is increased in the 5G network because of an LSTM-based resource allocation to the required users. Moreover, the interferences and errors are also avoided in the LSTM-RRM by using guard level insertion and frequency interleaving in the 5G network.
Figure 13 and
Table 12 show the guaranteed capacity comparison between LSTM-RRM with 4 BS and with 15 BS. Here, the comparison is made by varying the threshold from 10 to 30. From the analysis, it can be seen that the LSTM-RRM with 4 BS achieves higher guaranteed capacity than the LSTM-RRM with 15 BS. For example, the guaranteed capacity of the LSTM-RRM with 4 BS varies from 550 kbps to 835 kbps, whereas the guaranteed capacity of the LSTM-RRM with 15 BS varies from 280 kbps to 600 kbps.
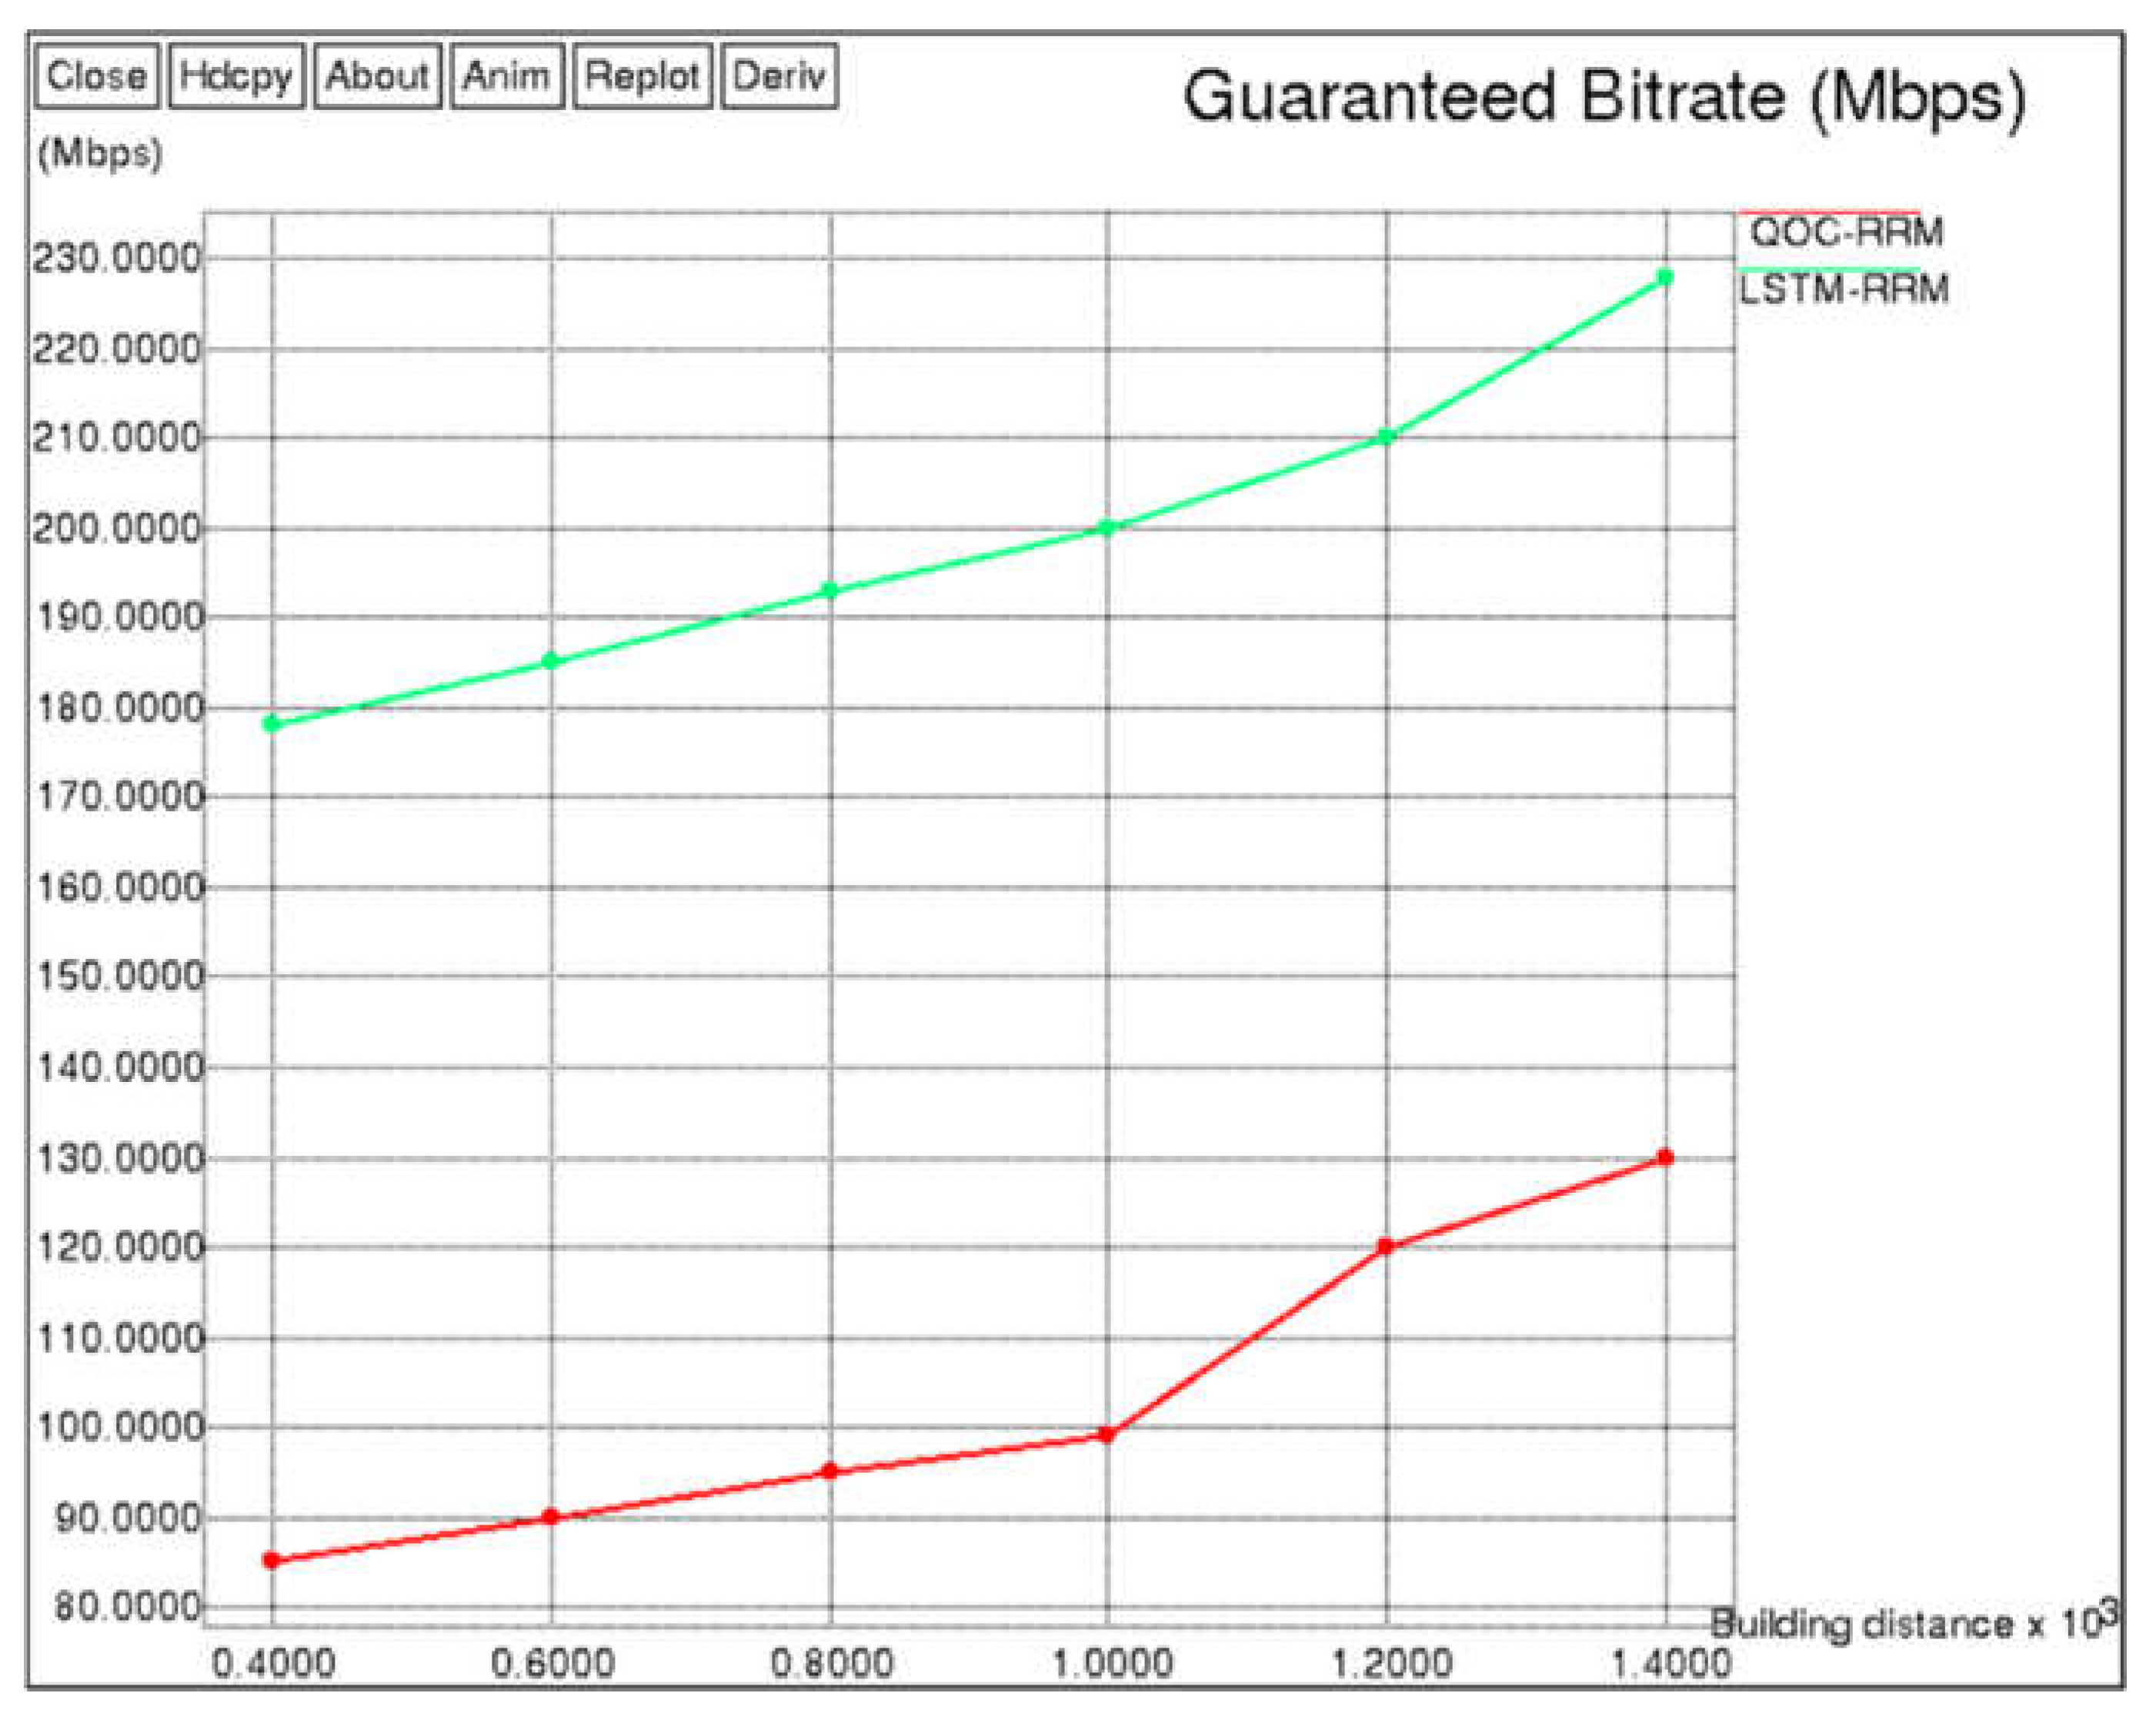
The comparison of indoor guaranteed rate between LSTM-RRM and QOC-RRM [
21] is shown in
Figure 14 and
Table 13. Here, the indoor guaranteed rate is analyzed by varying the building distance from 400 m to 1400 m. From the analysis, it can be seen that the LSTM-RRM achieves a higher indoor guaranteed rate than the QOC-RRM [
21]. For example, the LSTM-RRM achieves an indoor guaranteed rate in the range from 178 Mbps to 228 Mbps, whereas the QOC-RRM [
21] achieves an indoor guaranteed rate in the range from 85 Mbps to 130 Mbps. The indoor guaranteed bitrate of LSTM-RRM for a building distance of 1400 m is improved up to 75.38% when compared to the QOC-RRM [
21]. The indoor guaranteed rate of LSTM-RRM is increased by reducing the interferences occurring during the communication.
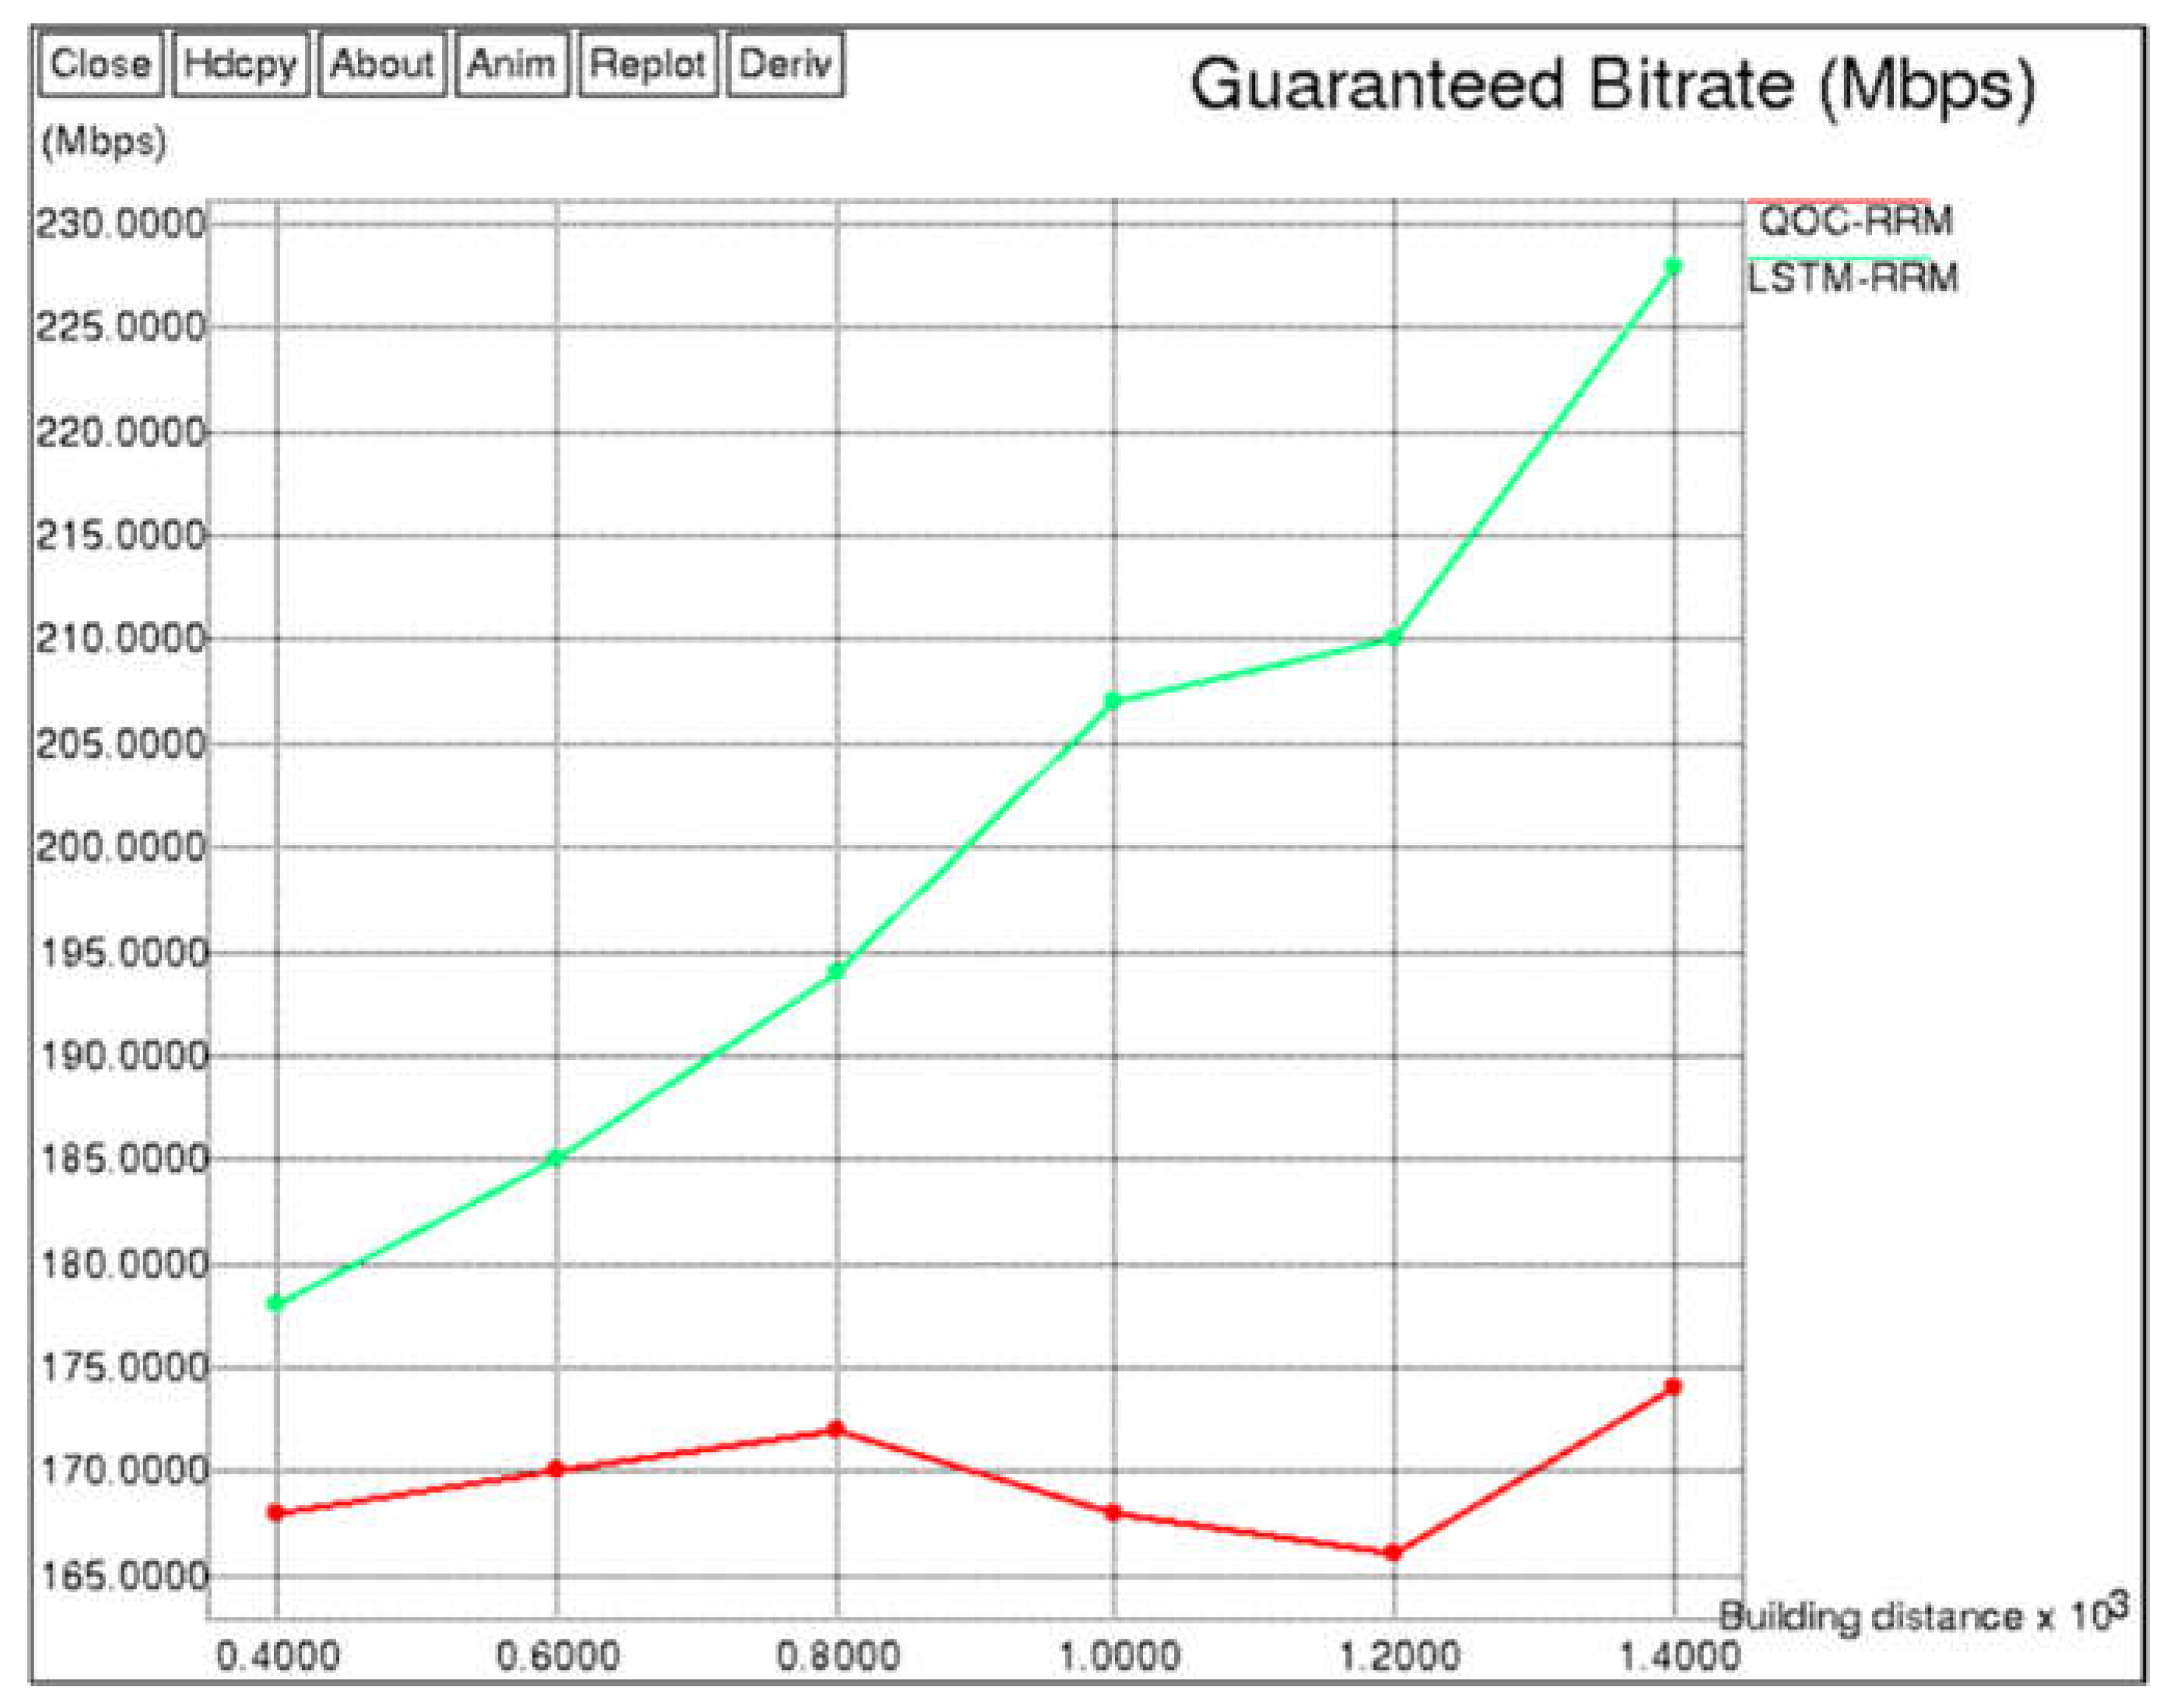
Figure 15 and
Table 14 show the outdoor guaranteed rate comparison between QOC-RRM [
21] and LSTM-RRM. Here, the comparison is made by varying the building distance from 400 m to 1400 m. From the analysis, it can be seen that the LSTM-RRM achieves a higher outdoor guaranteed rate than the QOC-RRM [
21]. For example, the outdoor guaranteed rate of the LSTM-RRM varies from 178 Mbps to 228 Mbps, whereas the outdoor guaranteed rate of the QOC-RRM [
21] varies from 168 Mbps to 174 Mbps. Specifically, the outdoor guaranteed bitrate of LSTM-RRM for a building distance of 1400 m is improved up to 31.03% when compared to the QOC-RRM [
21].
From the analysis, it can be concluded that the LSTM-based RRM provides better performance than the DRRM [
20], QOC-RRM [
21], and EPAS [
30], individually. The QOS parameters of the LSTM-based RRM are high due to its optimal bandwidth and power allocation to the user equipment of the 5G network. Moreover, the LSTM provides optimal results during the RRM because of the hyperparameters identified from GSO. Here, a queue-based RRM is used to minimize the traffic during data transmission. Moreover, the ISI caused in the network is reduced via guard level insertion in the data. Hence, the sum rate and guaranteed rate are increased while transmitting the data packets under burst errors.
