Article

Forecasting Students Dropout: A UTAD University Study

by
Diogo E. Moreira da Silva
1,
Eduardo J. Solteiro Pires
1,2,
Arsénio Reis
1,2,*,
Paulo B. de Moura Oliveira
1,2 and
João Barroso
1,2
1
ECT–UTAD Escola de Ciências e Tecnologia, Universidade de Trás-os-Montes e Alto Douro, 5000-811 Vila Real, Portugal
2
INESC TEC—INESC Technology and Science (UTAD Pole), 5001-801 Vila Real, Portugal
*
Author to whom correspondence should be addressed.
Future Internet 2022, 14(3), 76; https://doi.org/10.3390/fi14030076
Submission received: 18 January 2022 / Revised: 22 February 2022 / Accepted: 27 February 2022 / Published: 28 February 2022
(This article belongs to the Special Issue Smart Objects and Technologies for Social Good)

Abstract

:
In Portugal, the dropout rate of university courses is around 29%. Understanding the reasons behind such a high desertion rate can drastically improve the success of students and universities. This work applies existing data mining techniques to predict the academic dropout mainly using the academic grades. Four different machine learning techniques are presented and analyzed. The dataset consists of 331 students who were previously enrolled in the Computer Engineering degree at the Universidade de Trás-os-Montes e Alto Douro (UTAD). The study aims to detect students who may prematurely drop out using existing methods. The most relevant data features were identified using the Permutation Feature Importance technique. In the second phase, several methods to predict the dropouts were applied. Then, each machine learning technique’s results were displayed and compared to select the best approach to predict academic dropout. The methods used achieved good results, reaching an F1-Score of 81% in the final test set, concluding that students’ marks somehow incorporate their living conditions.

1. Introduction

According to statistics reported by Direção-Geral de Estatística da Educação e Ciência (DGEEC) [1] the dropout rate in Portuguese universities is around 29%, and 14% of the remaining students do not complete the course in the stipulated time. These high rates are a matter of immense concern for educational institutions, not only in Portugal, but worldwide. In the case of university education, different traditional actions can be taken by educational institutions to reduce academic dropout rates. These include personalized monitoring of students at risk, requiring an enormous designation of human resources and time, or restructuring the course syllabus. Nonetheless, early identification of and understanding the reasons for university dropout become essential for any methodology used to decrease failure rates. Therefore, the correct prediction of school dropout has become a priority [2].
Recent policies in Portugal towards improving academic success conduct educational institutions to monitor students’ progress and prevent students from dropping out of university. In this sense, educational institutions have been developing efforts to analyze and predict these situations to deploy preventive actions. For many years, institutions collected only the data necessary for the registration and functioning of the student’s academic data. Thus, the lack of socioeconomic data creates constraints for institutions to carry out reliable studies on this matter. In this sense, some institutions are limited to make this type of analysis.
The advent of artificial intelligence (AI), new areas such as data science, combined with the current deluge of data, tools for its fast analysis, and the ability to store them in large quantities, has allowed an accurate prediction of academic success to become increasingly feasible.
In this work, several machine learning models were studied and applied to a dataset containing students’ information provided by UTAD university. This study considers only academic data due to the lack of students’ social-economic data. Therefore, the papers’ goal is to build analytical models that can accurately predict school dropouts using only academic marks and the age of students. Some of the models will integrate UTAD’s educational support infrastructure.
The rest of this paper is organized as follows: background theory and literature review (Section 2); data and methods (Section 3); results and discussion (Section 4); conclusion and future work (Section 5).

2. Background Theory and Literature Review
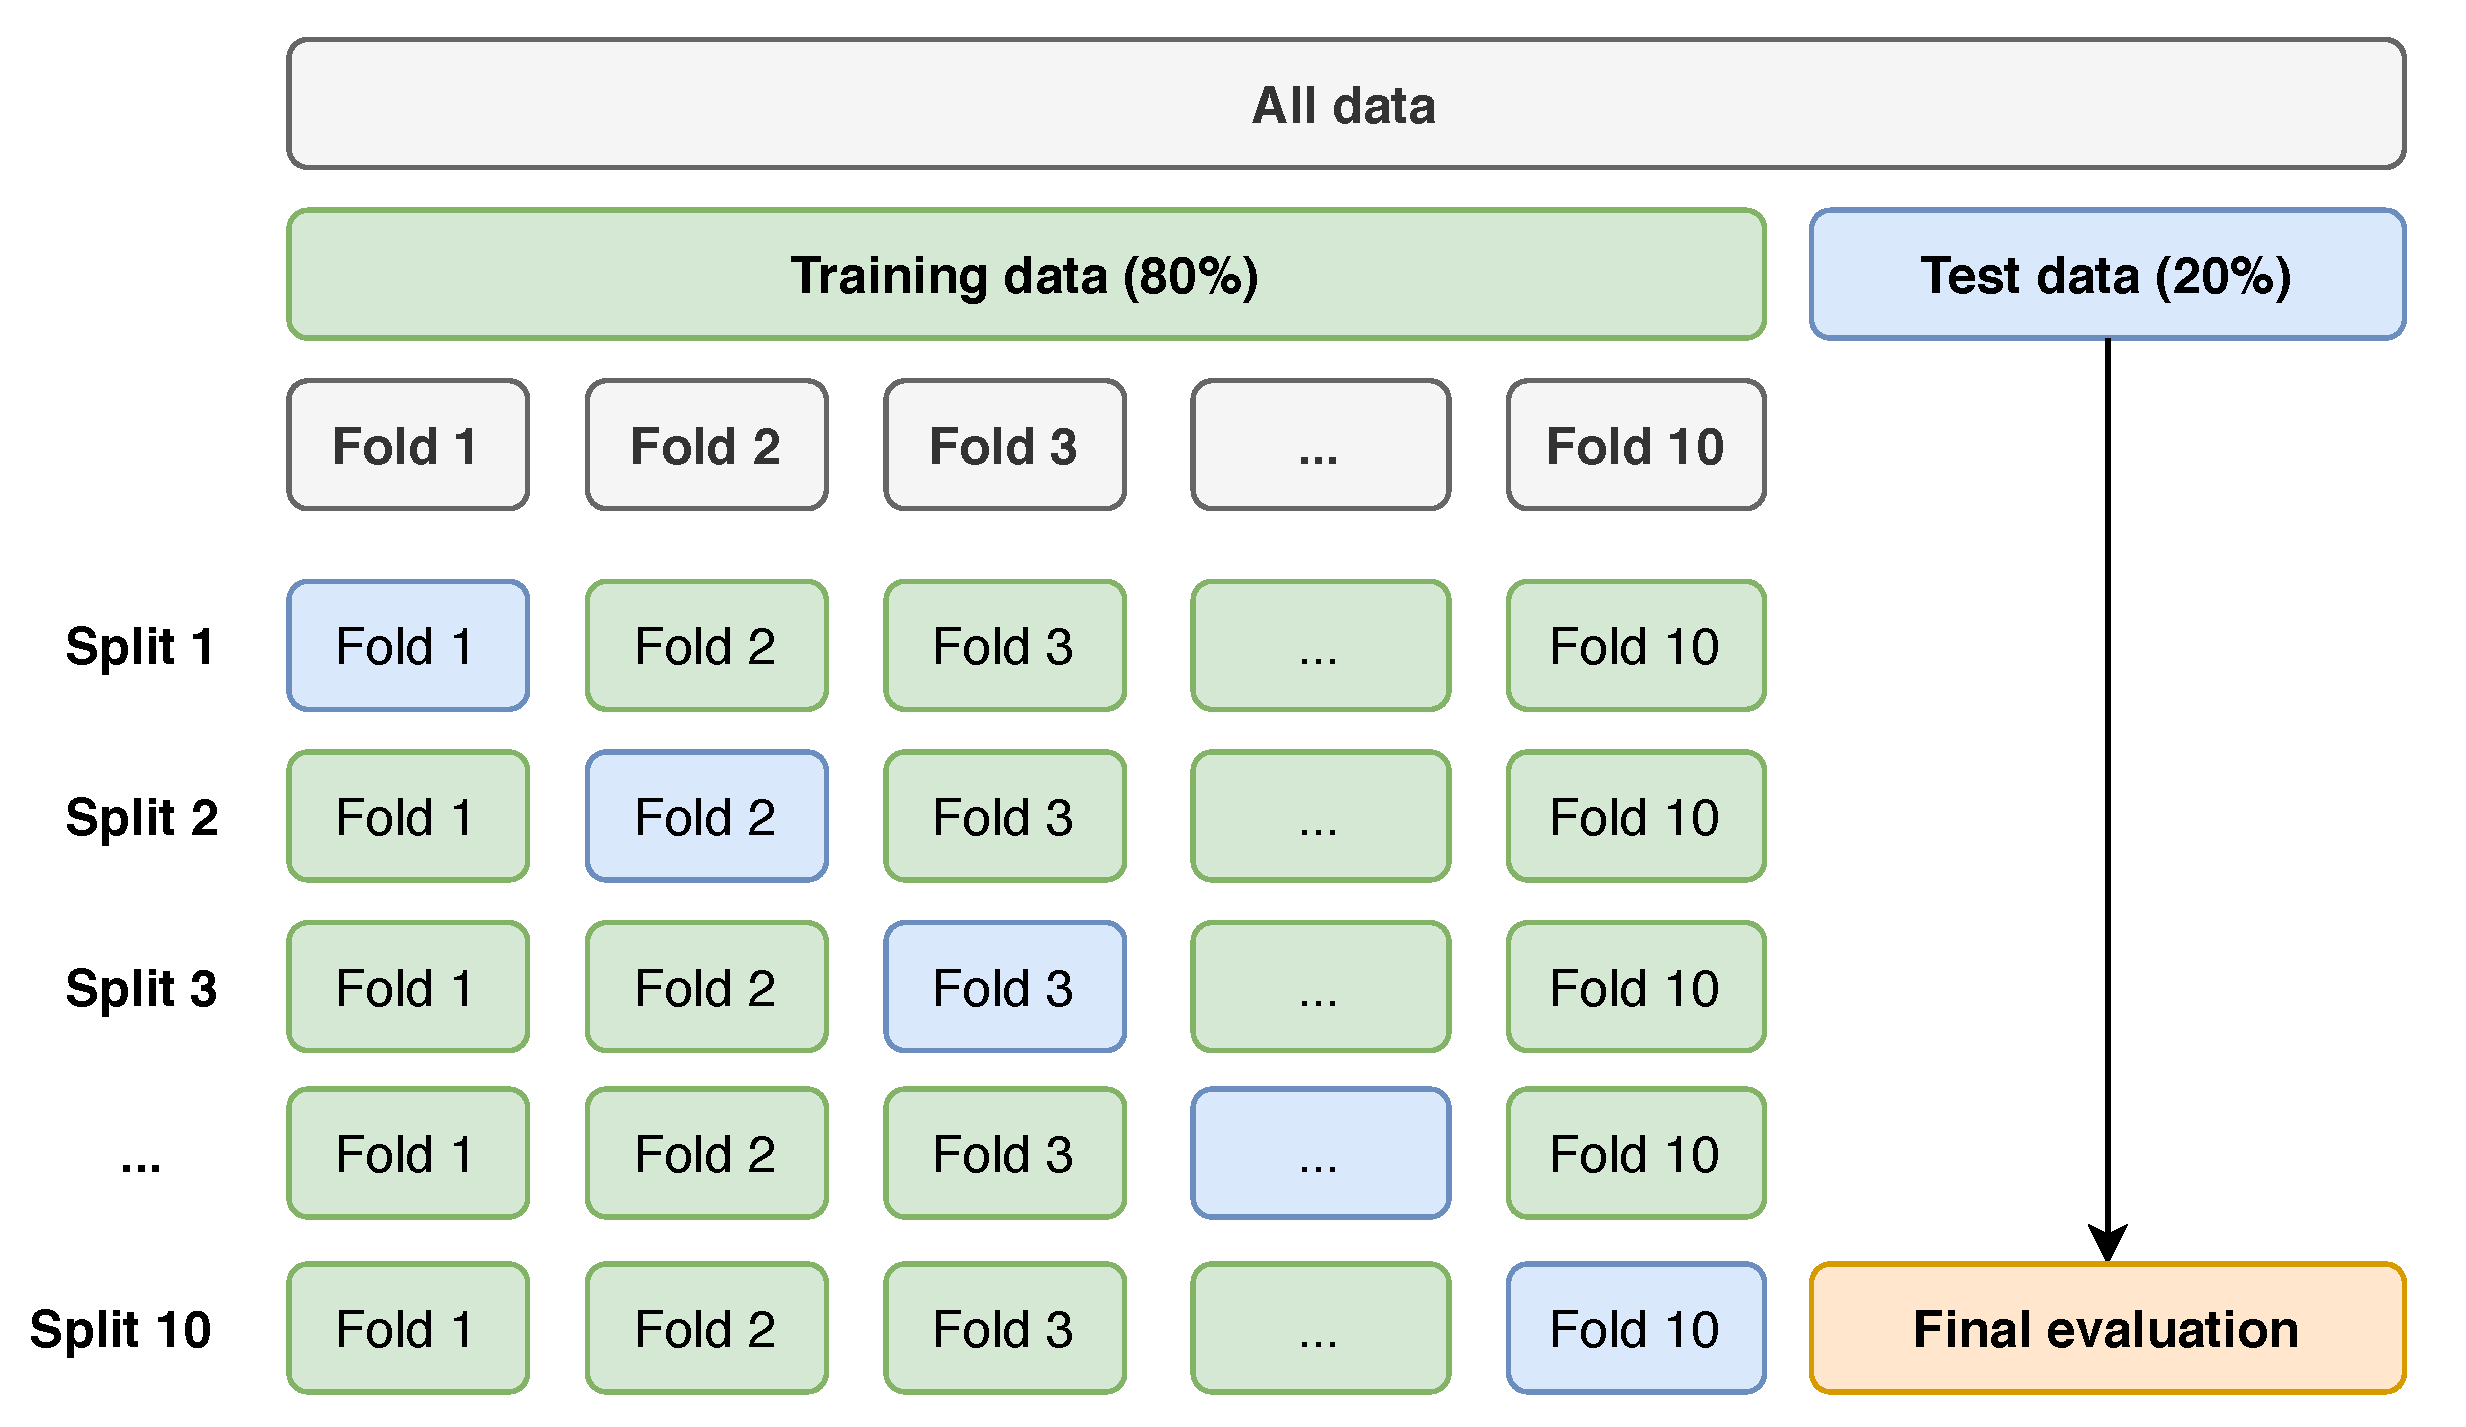
Some publications regarding data mining (DM) on predicting academic success focus on distance learning platforms and tutoring systems driven by AI [3,4,5]. Queiroga et al. [3] developed a solution using only students’ interactions with the virtual learning environment and its derivative features for early prediction of at-risk students in a Brazilian distance technical high school course. They use an elitist genetic algorithm (GA) for tuning the hyperparameters of machine learning algorithms. The population is formed by several classifiers: decision tree (DT), random forest (RF), multilayer perceptron (MLP), logistic regression (LG), and the meta-algorithm AdaBoost (ADA) with different hyperparameters. The approach obtains an AUC medium value of 0.845. Other work, proposed by Mubarak et al. [4] used a Convolutional Neural Networks (CNN) and Long Short-Term Memory (LSTM), called CONV-LSTM, to automatically extract features from Massive Open Online Courses raw data and predict whether students will drop out. They used a cost-sensitive technique in the loss function, which considers the various misclassification costs for false negatives and false positives. They claim that the proposed model is better when compared to baseline methods. The dataset stores activity students’ records about which course they are enrolled in. Dass et al. [5] presented a model to predict the student dropout in online courses considering features of daily learning progress. They used a Random Forest Model, obtaining 87.5% as the F1-score.
In the traditional educational system, several approaches were found using many classifier systems. The use of Artificial Neural Networks (ANNs) was demonstrated and considered promising by Alban and Mauricio [6]. Their study was carried out with data obtained from 2670 students, from the Public University of Ecuador, over three years (2014–2017). Two types of algorithms were used: multilayer neural networks and radial basis function network (ANN that uses radial basis functions as activation functions, RNN), with both presenting very high dropout forecast rates of 96.3% and 96.8%, respectively. In another study, Plagge [7] concluded that, with the use of ANNs, the forecast rate was relatively high when using two semesters of data, decreasing dramatically when using only one.
Chung and Lee [8] used an RF to predict students at risk of dropping out. They used 165,715 high school students’ data from Korea’s National Education Information System of the year 2014. They obtained an accuracy of 95% binary classification.
Pereira and Zambrano [9] used decision trees (DT) to identify patterns of student dropout from socioeconomic, academic, disciplinary, and institutional data of students from undergraduate programs at the University of Nariño. They used three datasets and obtained a confidence threshold greater than 80%.
Fernádez-García et al. [10] defined several models from enrollment up to the fourth semester using mainly academic data. The approach considered the output of previous stages, i.e., each step assumed the prior knowledge generated. The model goal consisted of identifying engineering students with a high probability of dropping out to design and apply dropout prevention policies effectively. The predictive model could identify 72% of the students that will dropout. At the end of the fourth semester, the results could reach 91.5%.
Hutagaol et al. [11] considered three singles classifiers: K-Nearest Neighbor (KNN), Naïve Bayes (NB), and Decision Tree (DT), to identify the best in predicting students’ dropout at a private university in Jakarta. They use demographic indicators and academic performance to predict student dropout. Their model reached 79.12% of accuracy.
Kiss et al. [12] identified students at risk of dropping out at a large Hungarian technical university using predictive analytical tools. They use data of 10,196 students who finished their undergraduate studies (either by graduation or dropping out) between 2013 and 2018. They modeled the problem using 3 ML methods: Gradient Boosted Tree (GB), XGB, and ANN, obtaining accuracy in the range 68.0% to 85.8%.
Studies using “external” features could also be found. Dharmawan et al. [13] used a model with non-academic features. They concluded that the number of family members, interest in further studies, and the relationship with lectures are features that influenced the dropout. Hasbun et al. [14] studied the importance of extracurricular activities to predict dropout in students from two Bachelor of Science degrees (Engineering and Business), showing that extracurricular activities are excellent dropout predictors.
The following works revisions the students’ dropout prediction. Mduma et al. [15] revised machine learning algorithms to predict academic dropout in developing countries. They conclude that many researchers ignore data that is unbalanced, leading to improper results. On the other hand, their main focus is providing early prediction instead, including ranking and forecasting mechanisms on addressing the dropout student’s problem. De Oliveira et al. [16] searched scientific indexed publications in higher education to analyze the retention and dropout of higher education students. They identified the data and techniques used and proposed a classifier using several categories considering several student and external features.
Table 1 sums up the models, features, metrics used, and the results obtained. Column 1 identifies the work, and column 2 indicates the features used. The “Marks” feature means that the work uses the curricular units marks. The academic feature indicates the use of academic data like attendance, GPA, and marks. The “socioeconomic” feature indicates the use of social and economic data, the “Institutional” refers to data related to the study plan and the university, “Personal” refers to personal data like address, age, and gender, “Demography” indicates the inhabitant number of a residential area and other demographic data, “Motivation” refers to the driving force behind students actions and other psychological phenomena. “Sports” indicates that students practice sports activities. “High School” comprises data related to the student’s high school and their marks obtained. “Activity” is the data obtained through interaction with computer learning systems, e.g., time spent by a student for a day. “Attendance” is the school attendance. “Knowledge” is the knowledge degree that the students have. Finally, “Volunteer” indicates if the students practice volunteering. The column methods enumerate the methods used in the works. The “Result” column indicates the respective metric value (e.g., ACC: accuracy, AUC: area under the curve).

3. Data and Methods

This section describes the dataset and methods used for this work.

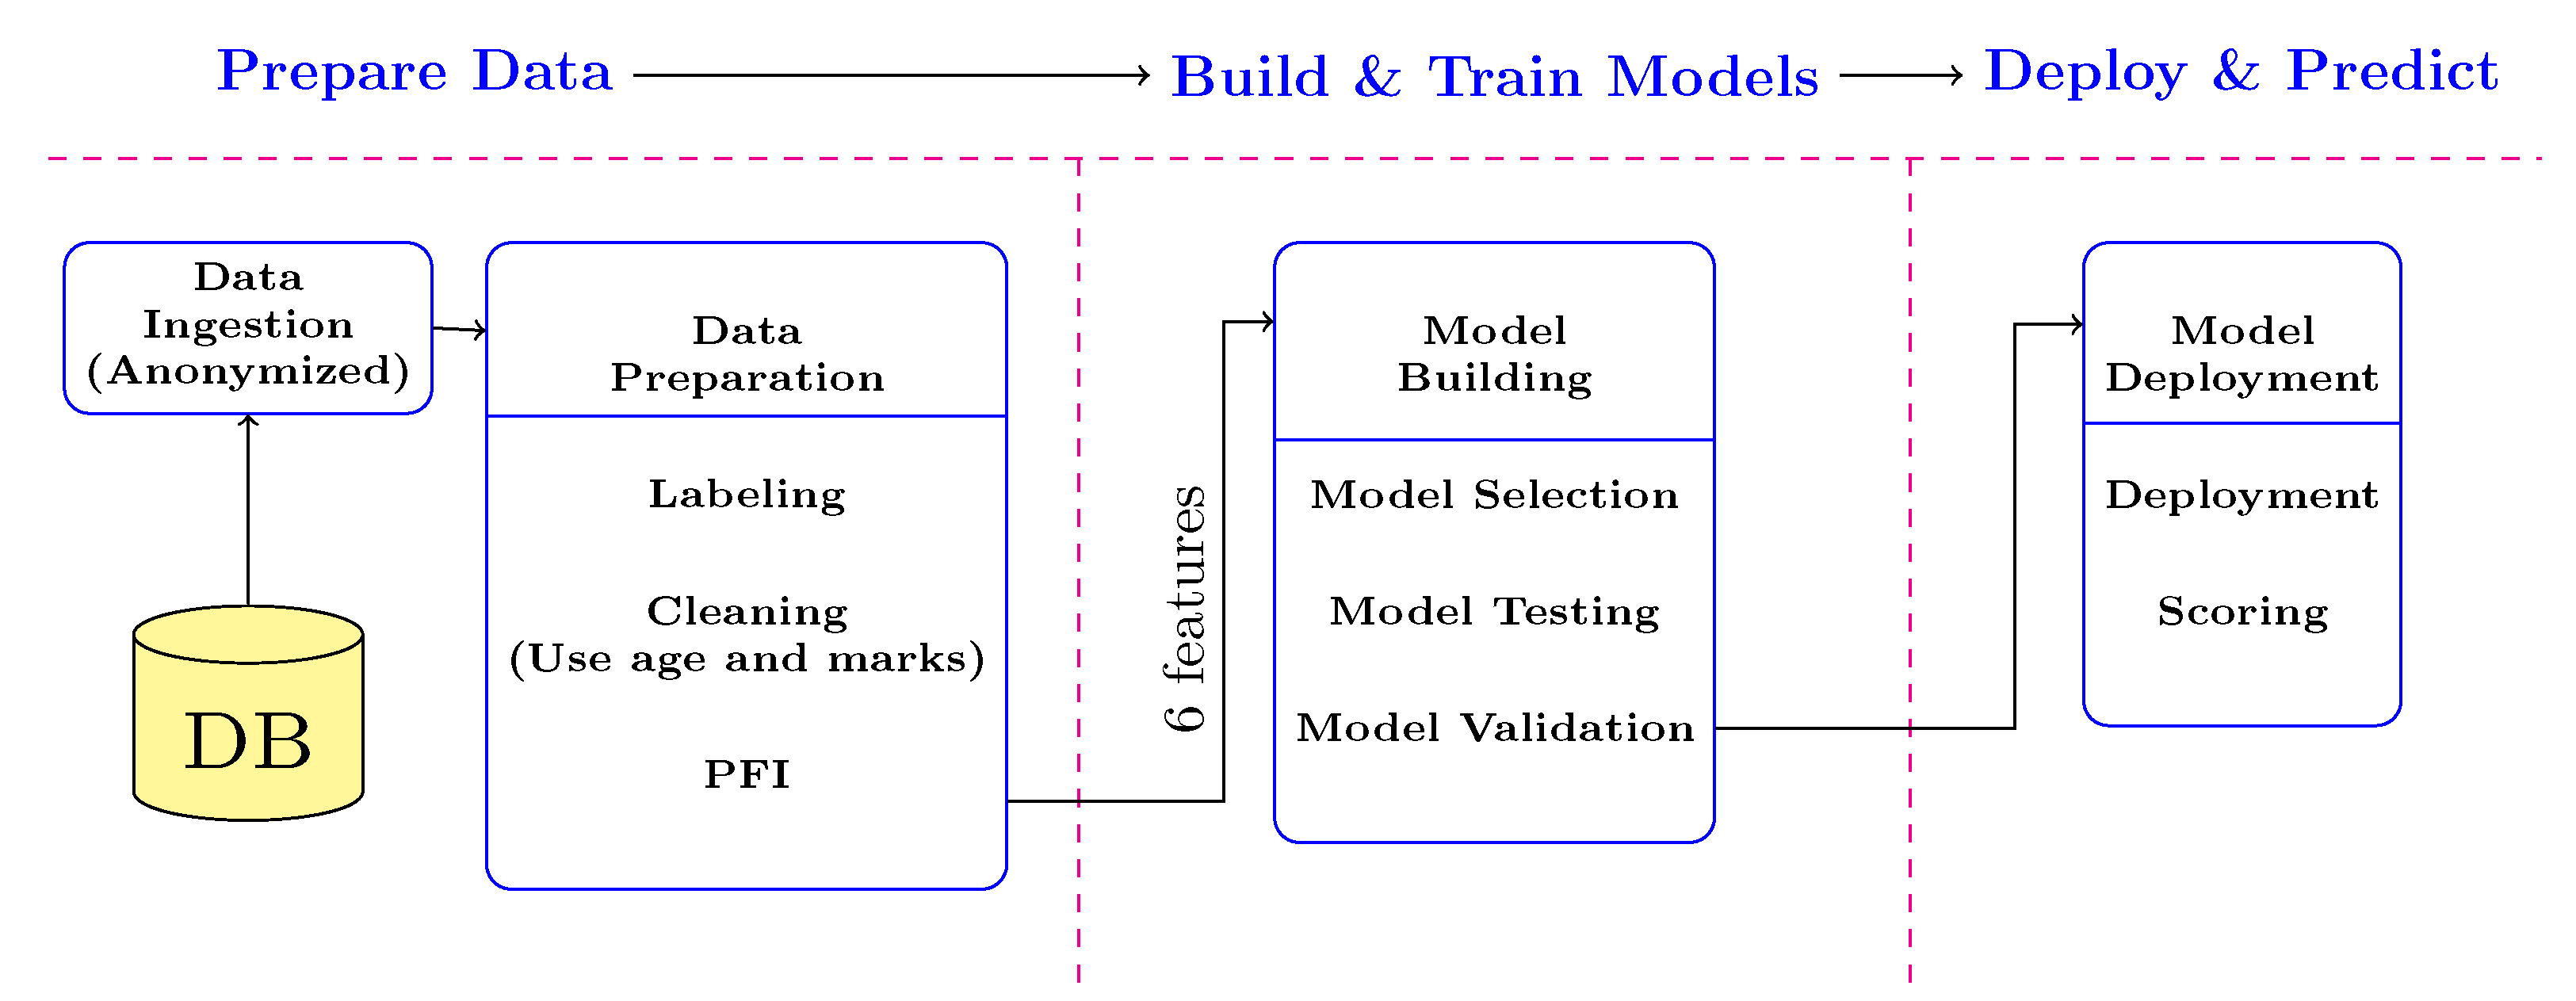
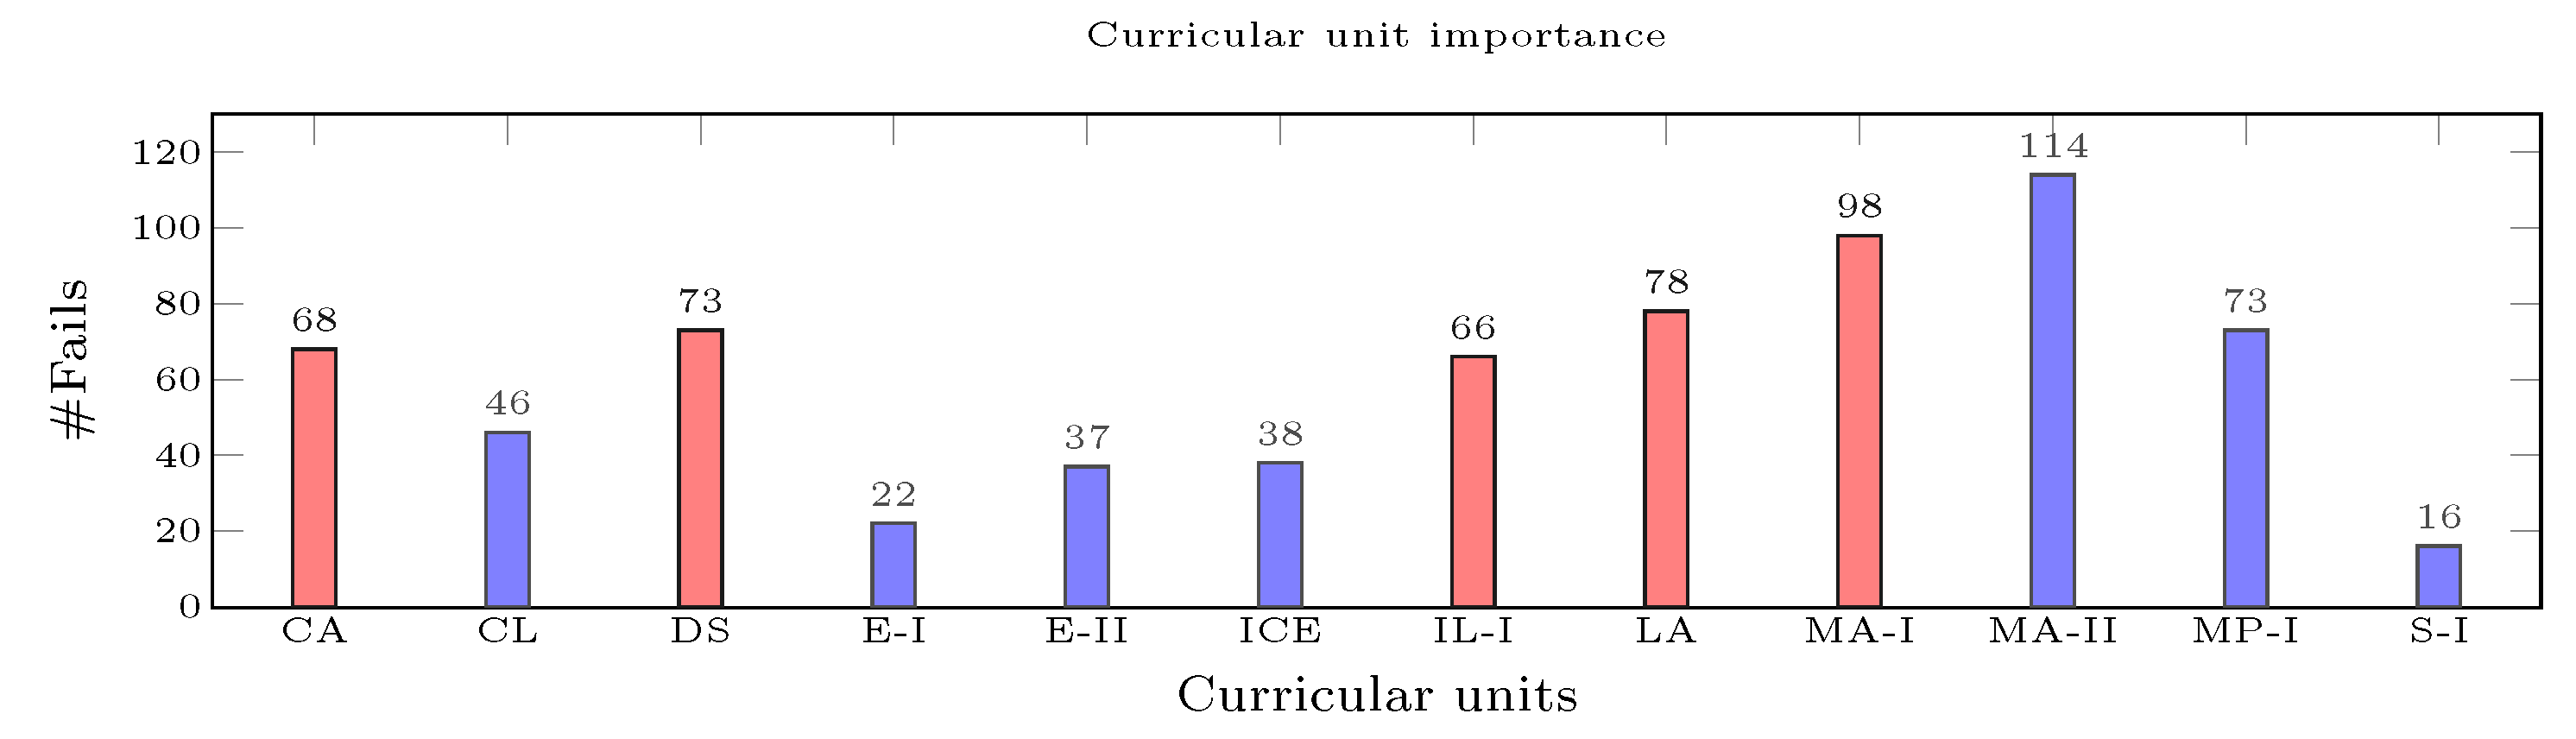
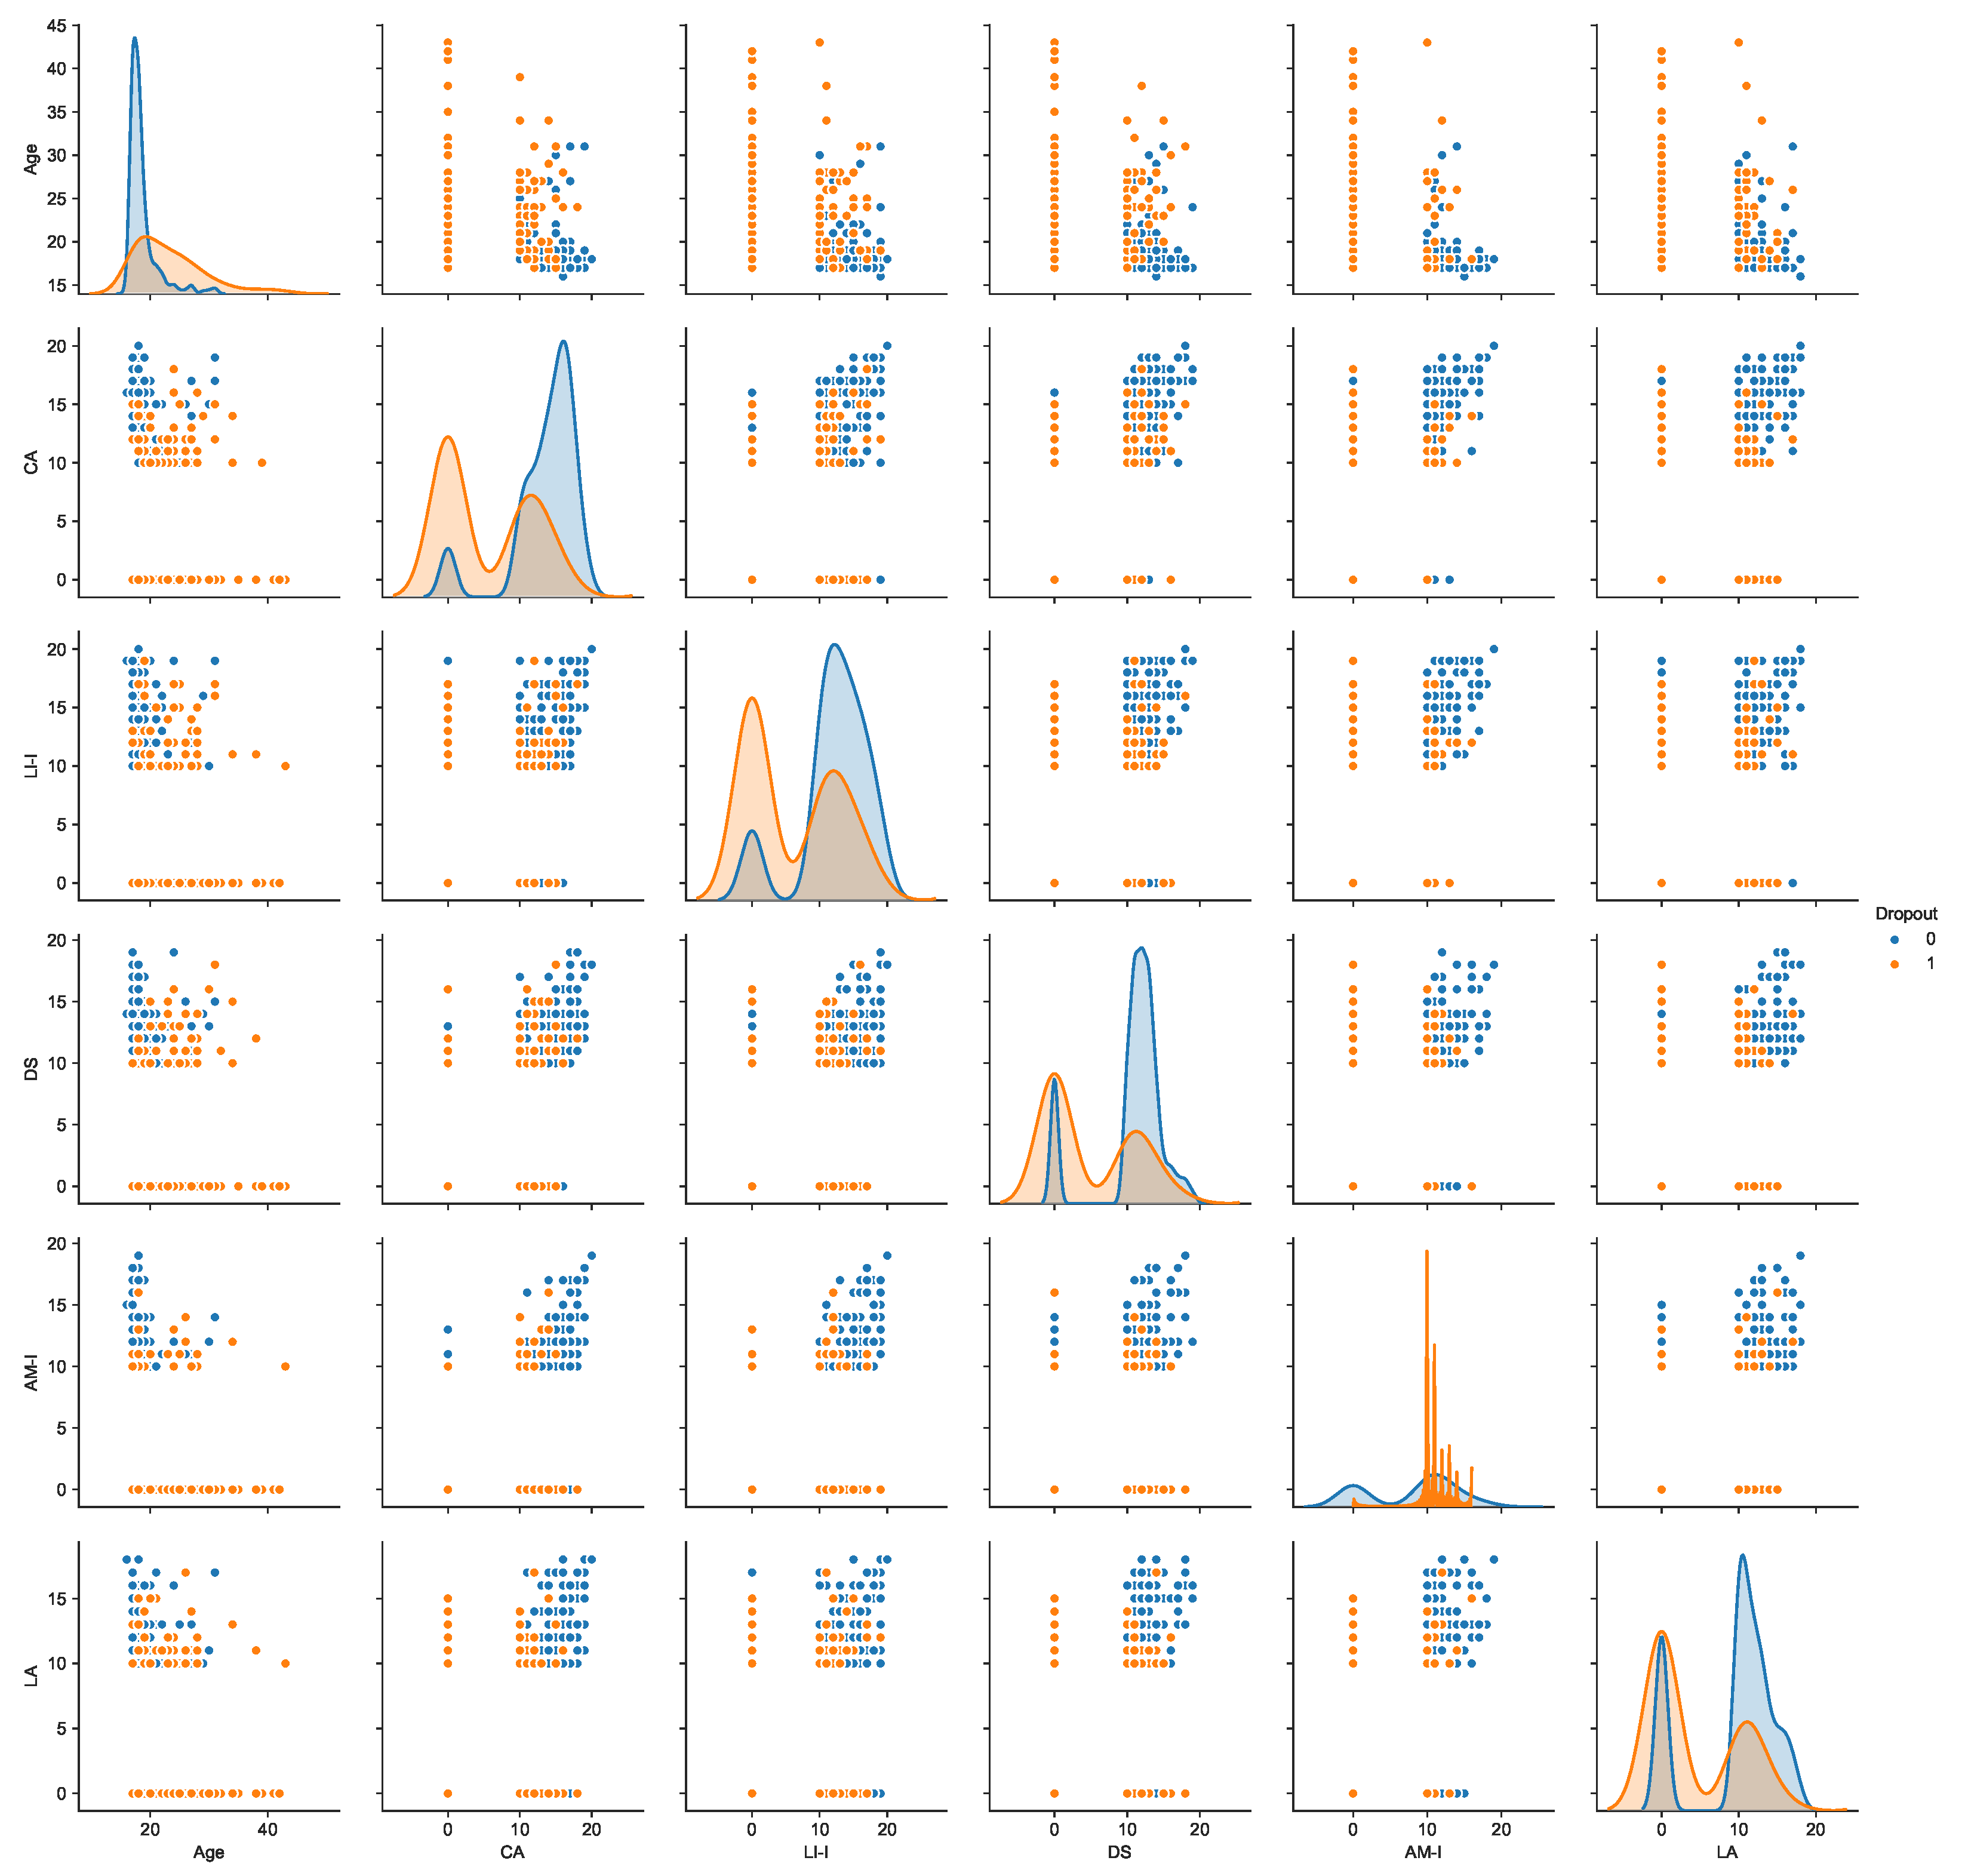
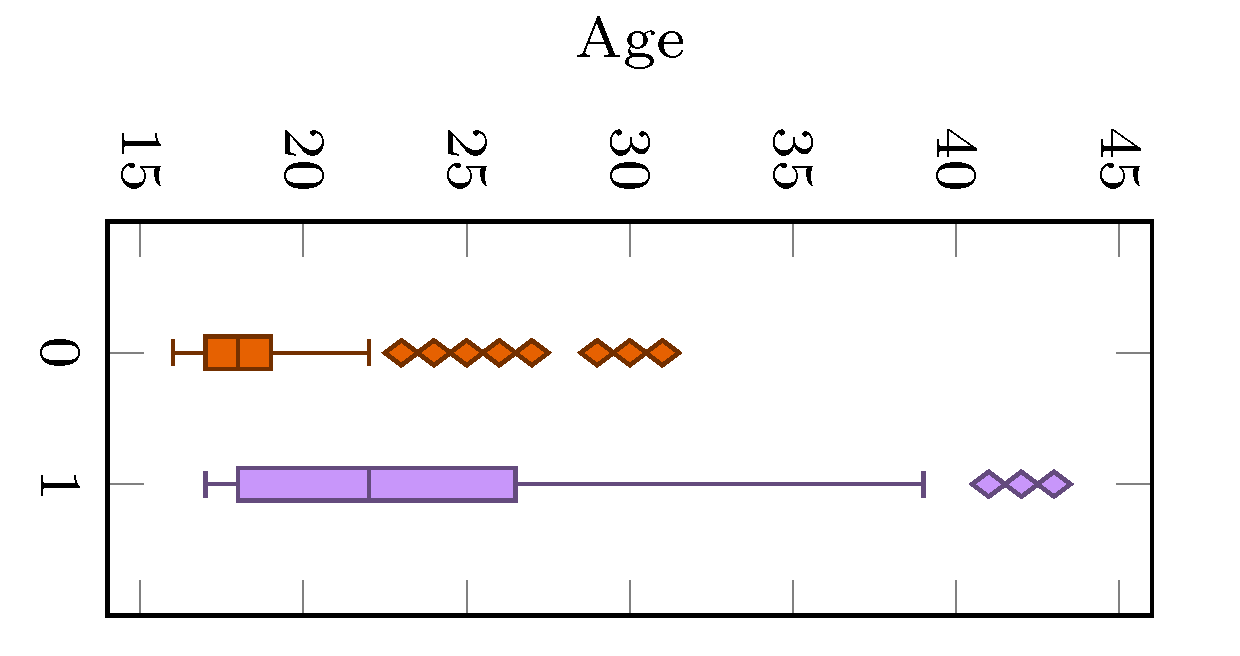
3.1. Data Collection

The UTAD database was designed to store data from students enrolled in the Computer Engineering degree at the UTAD University, obtained in the period ranging from 2011 to 2019. It contains demographic information, their parents’ profession, education, and the academic record of each student. Table 2 exhibits these features, with their corresponding name, acronym, and scale. However, UTAD’s staff usually fill out the students’ names, marks, and ages. Therefore, the working dataset contains just the age and the marks features.
However, in general, the database only contains data about the students’ marks and age. Usually, the other data was not registered by UTAD’s Staff. Therefore, the working dataset curricular units (courses) are identified with the acronym CU in Table 2 and its marks ranges [10, 20] if the students succeeds or 0 if fails.
Figure 1 plots the pairwise relationships between the most important curricular units obtained in Section 3.6. A grid divides the figure, where each feature will be shared across the y-axes and x-axes. The diagonal plots are the marginal feature univariate distribution in each column.

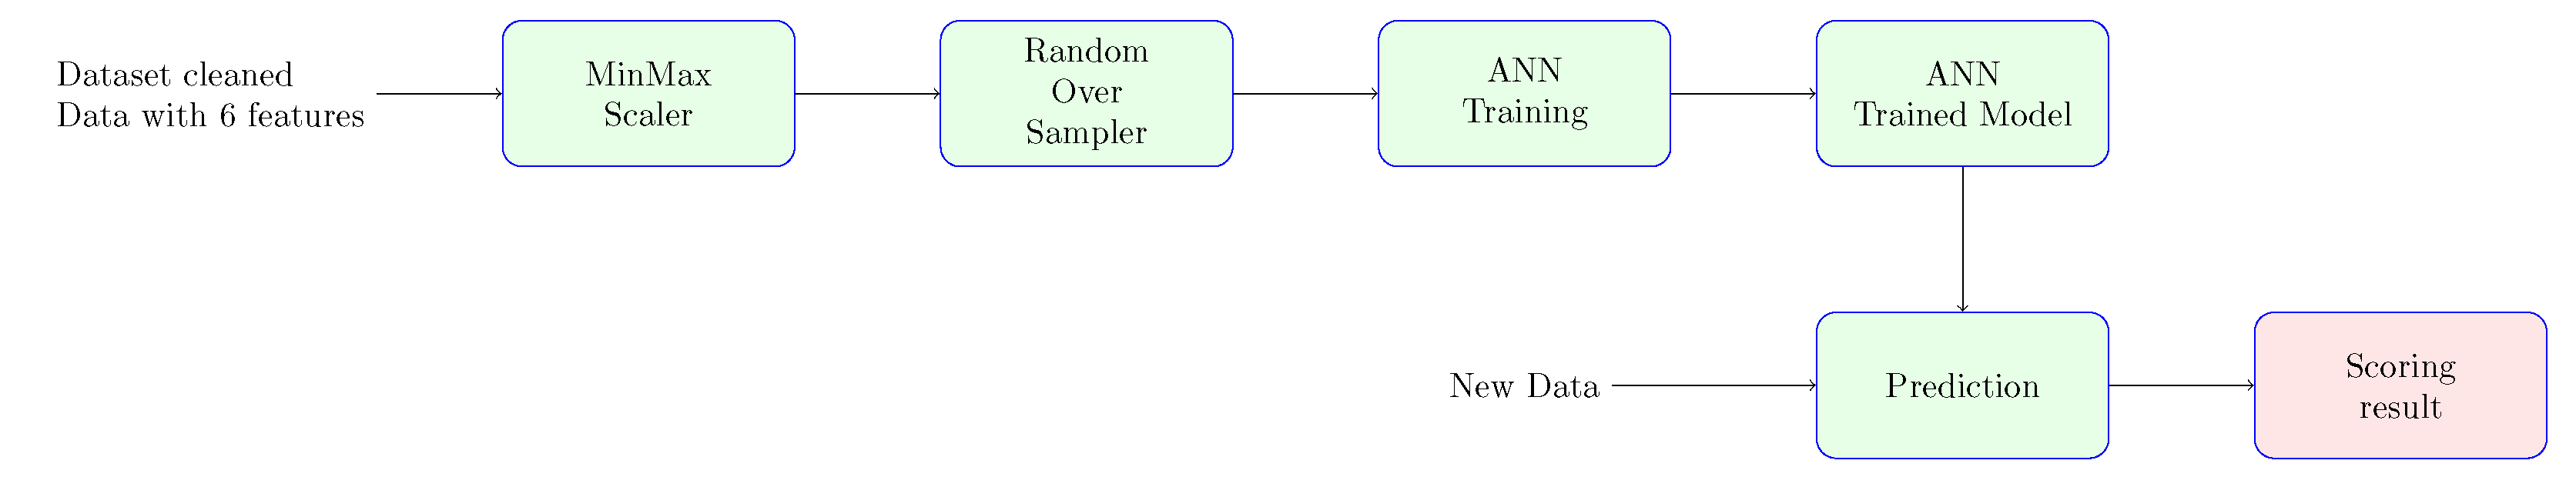
3.2. Artificial Neural Networks

ANNs are mathematical models, inspired by the neurons present in biological brains for data processing, allowing computers to learn and thus make generalizations when there is a considerable number of solutions to study instances of problems [17]. Biological neurons are nothing more than simple interconnected processing units, but their behavior gives rise to intricate matters [17]. In a computational version, the concept is to take primary information, and through the connection of several nodes, it is possible to give rise to a type of emergent behavior, which translates into high cognitive level decisions and classifications.

3.3. Ensemble Methods

Ensemble Methods (EMs) are a machine learning technique that consist of combining several base models to produce a high accuracy classifier. Usually, all EMs share the same two steps. First, a finite number of learners are produced. Then, the base learners are aggregated into a single model [18]. As each machine learning method tends to have some bias, noise, and variance, an EM helps to minimize this problem, as it is proven that it can “outperform any single classifier within the ensemble” [19].

3.3.1. Random Forests

Decision Trees (DTs) are a predictive model used in machine learning. DTs are designated as classification trees when the output variable takes on a discrete range of values. These are defined by Brodley and Friedl [20], as a “classification procedure that recursively partitions a data set into smaller subdivisions on the basis of a set of tests defined at each branch.” DTs have a hierarchical structure, formed by a root node, a collection of internal nodes, and the end nodes, which are called leaves. The leaves represent class labels, and each branch represents a combination of features that lead to these labels.
The use of DTs has several advantages, such as the fact that they require low data pre-processing since they can handle both quantitative and qualitative data. One of the most prominent benefits of this model is that they are considered a white box model, unlike ANN, as they are easy to understand and interpret. However, this model holds some limitations, offering low robustness, meaning that a small change in the data can produce a substantial shift in the results. DTs are also prone to suffer from overfitting, since generated trees might be overly intricate, with the inadequate capability to generalize to new data.
Random Forests (RFs) are an ensemble of many decision trees. In RFs, each tree is trained independently by using a random sample of the training data. Each tree then makes its prediction, and the class with the most votes is considered the final prediction. The fundamental principle of this model consists of the wisdom of the crowd, where the aggregation of independent solutions outperforms individual solutions [21].

3.3.2. Gradient Boosting

Gradient Boosting (GB) is an ensemble technique that builds a sequence of weak learners, usually decision trees. GB creates trees individually, where the subsequent tree tries to correct errors made by the previously trained tree. In every distinct iteration, a new, weak base-learner model is trained, concerning the error of the entire ensemble learned up to that point [22]. In short, this algorithm optimizes an arbitrary loss function by sequentially choosing a function that points in the negative gradient direction. In this paper, two variants of this algorithm are used, namely: XGBoost [23] and CatBoost [24].

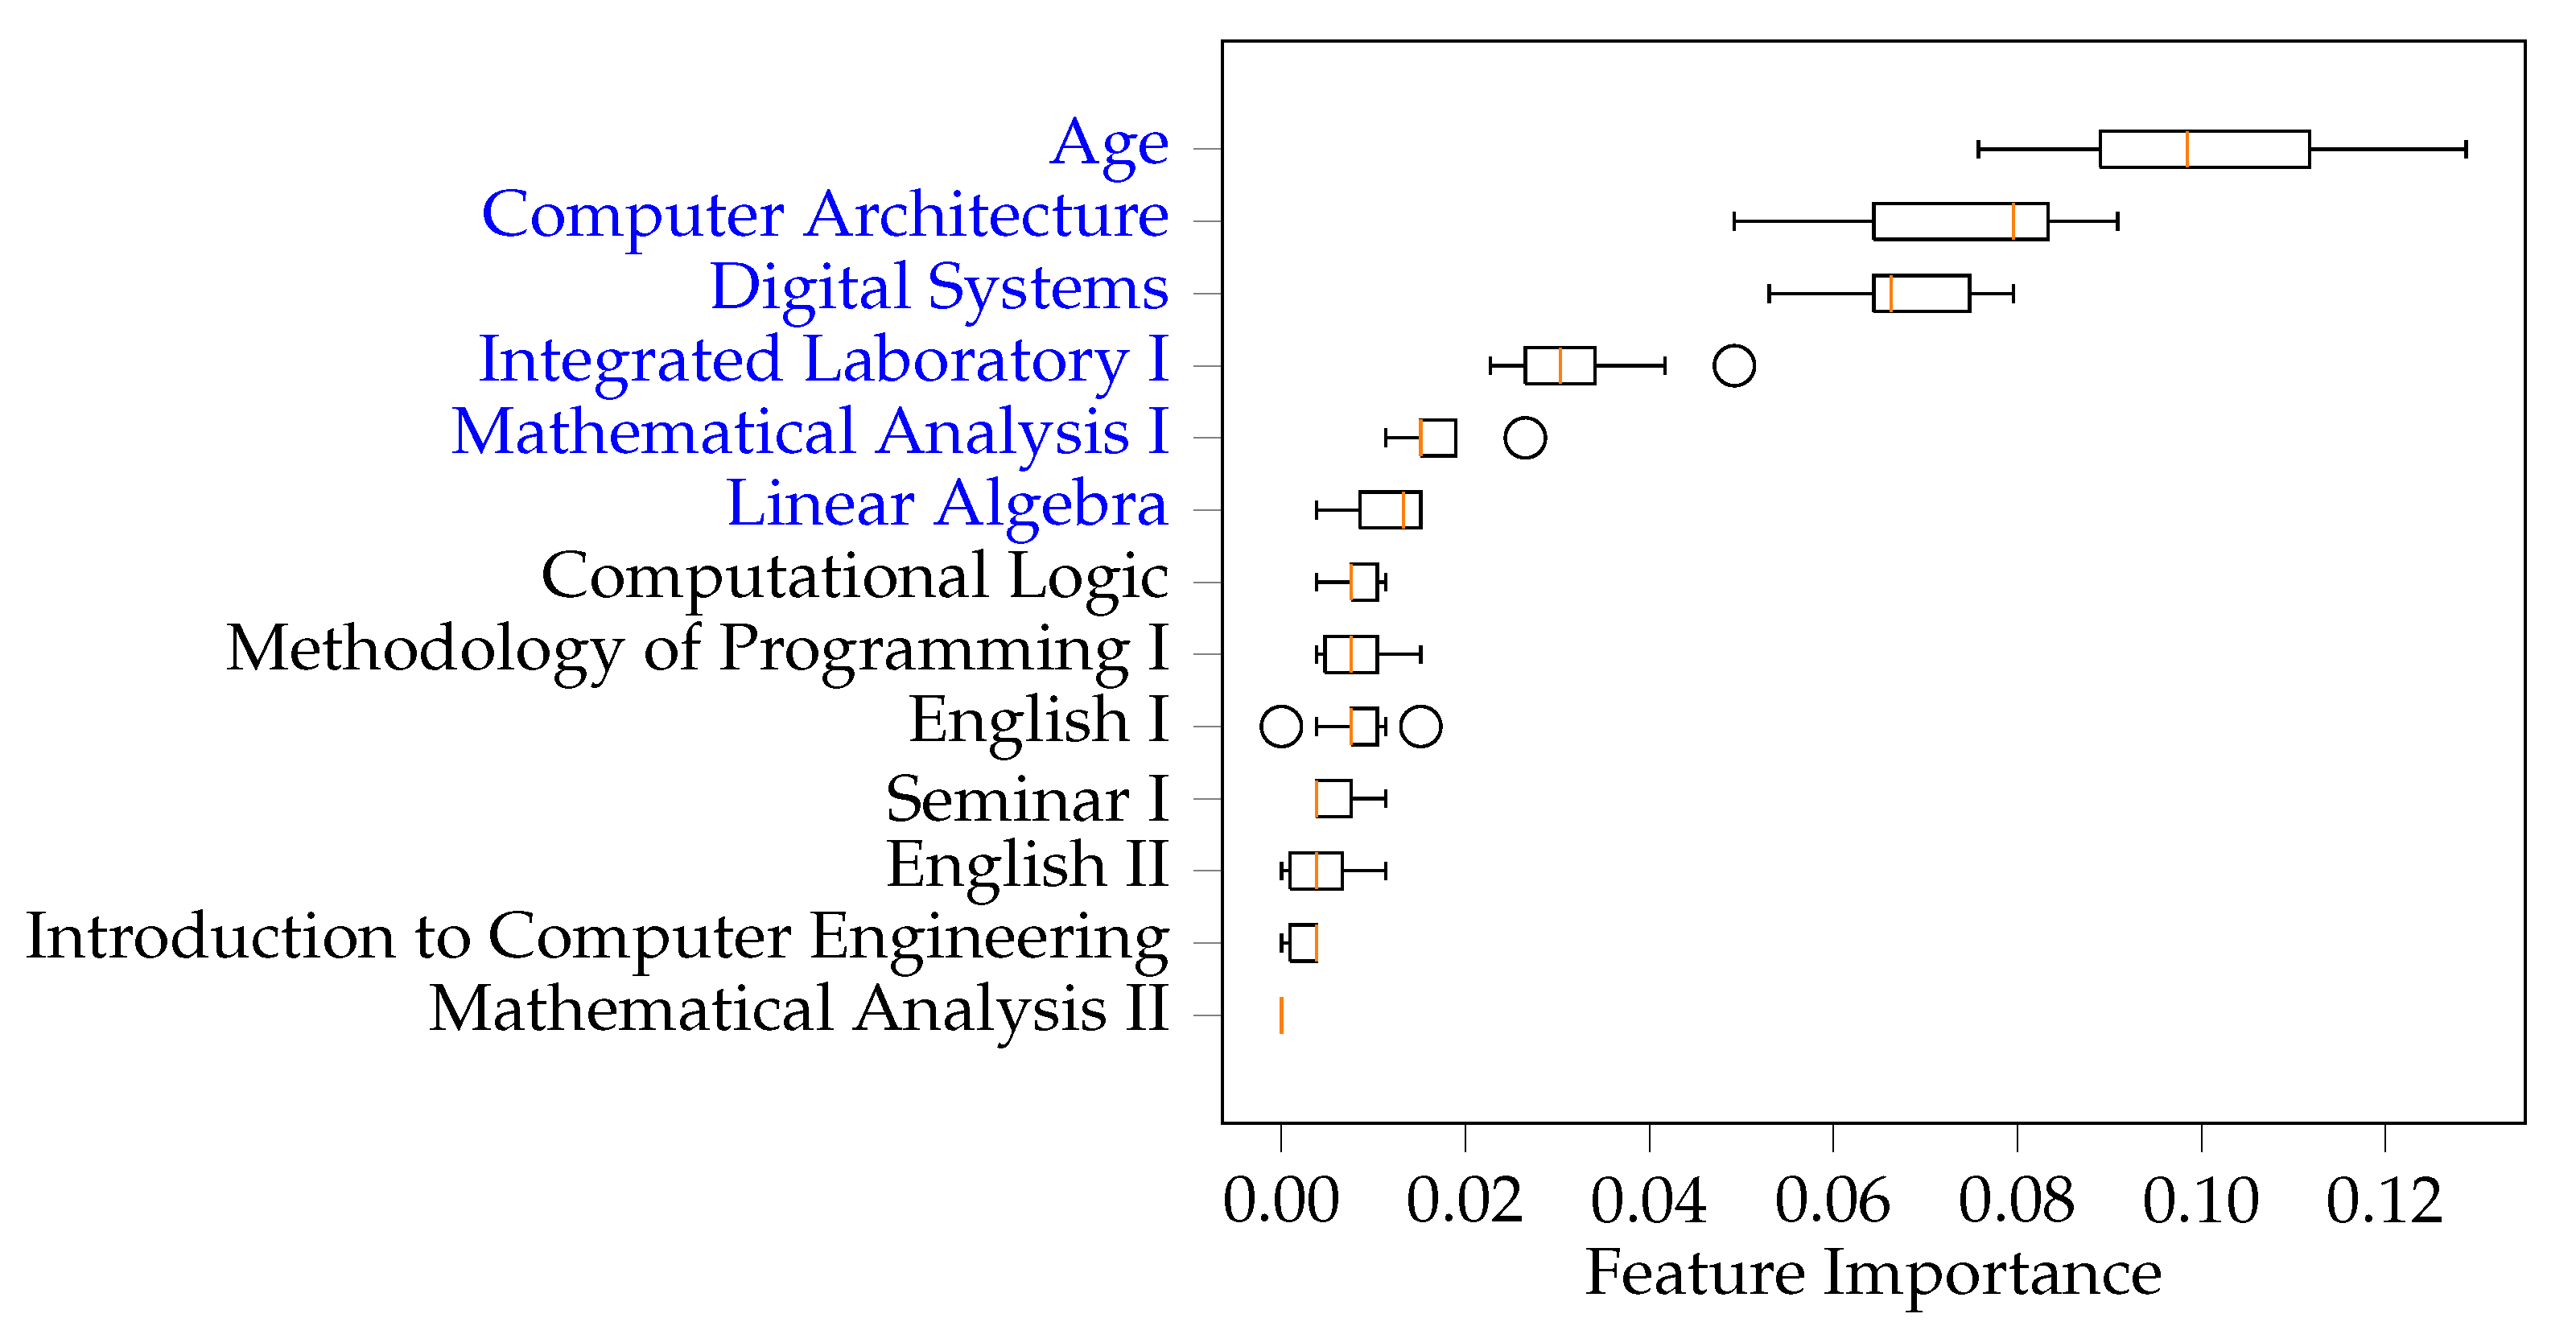
3.4. Permutation Feature Importance

The Permutation Feature Importance (PFI) technique was introduced by Breiman [25] for RFs. It is defined as the decrease in a model score when a single feature value becomes randomly permuted. This procedure breaks the correlation between a feature and the correct output. A feature has low importance when randomly shifting its values, as it does not provoke a meaningful decline in the model’s score. Contrarily, when the model’s score shows a notable drop, it implies that the model depended on the feature to predict the correct output.

3.5. Random Over-Sampling

The number of instances in a class is usually uneven concerning another class or classes. One way to address this problem is to perform the class distribution balance in the pre-processing phase. Random Over-Sampling (ROS) [26] is a technique which generates new samples in the under-represented classes. ROS does this by randomly sampling with replacement of the currently available samples.

3.6. Data Pre-Processing

Figure 2 illustrates the pipeline used in this work. In the first step, Prepare data, the data is ingested, and some cleaning is done, before using the PFI technique. However, when the ANN model is used, some additional data manipulation is done (see Section 4). The second step regards model construction, training, and validation. In the last step, the model is implemented, used to predict new samples, and monitored. In this section, the first step is described.
The data considered in this study were previously anonymized before pre-processing to comply with the current data protection regulation. The original dataset contained academic information for each student on a single line. Therefore, the first-year grades were extracted per column. Then, only the academic record of each student was kept, as well as their age. This was done due to the fact that the other features contained several empty fields, which would not contribute to the correct prediction. Additionally, ll students who are still completing the course and those who dropped out shortly after joining university (students with a zero score, in all subjects) were excluded from the dataset. A new binary variable was created, indicating whether the student dropped out or not, which was to be used as the output variable. It led to a new, cleaned data set with information from 331 students. There is some significant data imbalance in the present study, with 124 cases of school dropout and 207 cases of students that finished the study plan successfully.
The extraction of the most relevant features was carried out using the PFI technique (Section 3.4). The results are presented in Figure 3. The top six features (highlighted in blue) were selected, as it was found that these cause a more significant drop in the accuracy.
In this analysis, the younger students demonstrate more resilience in completing the study plan, which showed that age is an essential factor in academic dropout. Figure 4 reveals the age importance in academic dropout study. The third quartile of students’ dropout has almost the same value as the median of students that are successful. On the other hand, the success of the most demanding curricular units is also decisive in the continuity of students’ studies. Figure 5 illustrates the number of fails per curricular unit. The curricular units in red are used in the model as important features, and the curricular units in blue are discarded. In general, the model used the curricular units with more fails as the most important features. The exception to the rule is Mathematical Analysis II. In this case, the number of fails is also significant in students who are successful in the course. Thus, the model cannot discriminate well students who drop out using this feature.
The applied data division strategy is exhibited in Figure 6. A stratified split was applied to the data set, keeping 80% for training and 20% as a test set to perform final evaluations. In the training portion, a stratified cross-validation technique was used, dividing it into 10-folds. Models were later trained in 9-folds and validated in the remaining fold. Thus, eliminating the need to divide the data into three distinct datasets, which would drastically reduce the number of learning samples, given that the amount of available data is low.

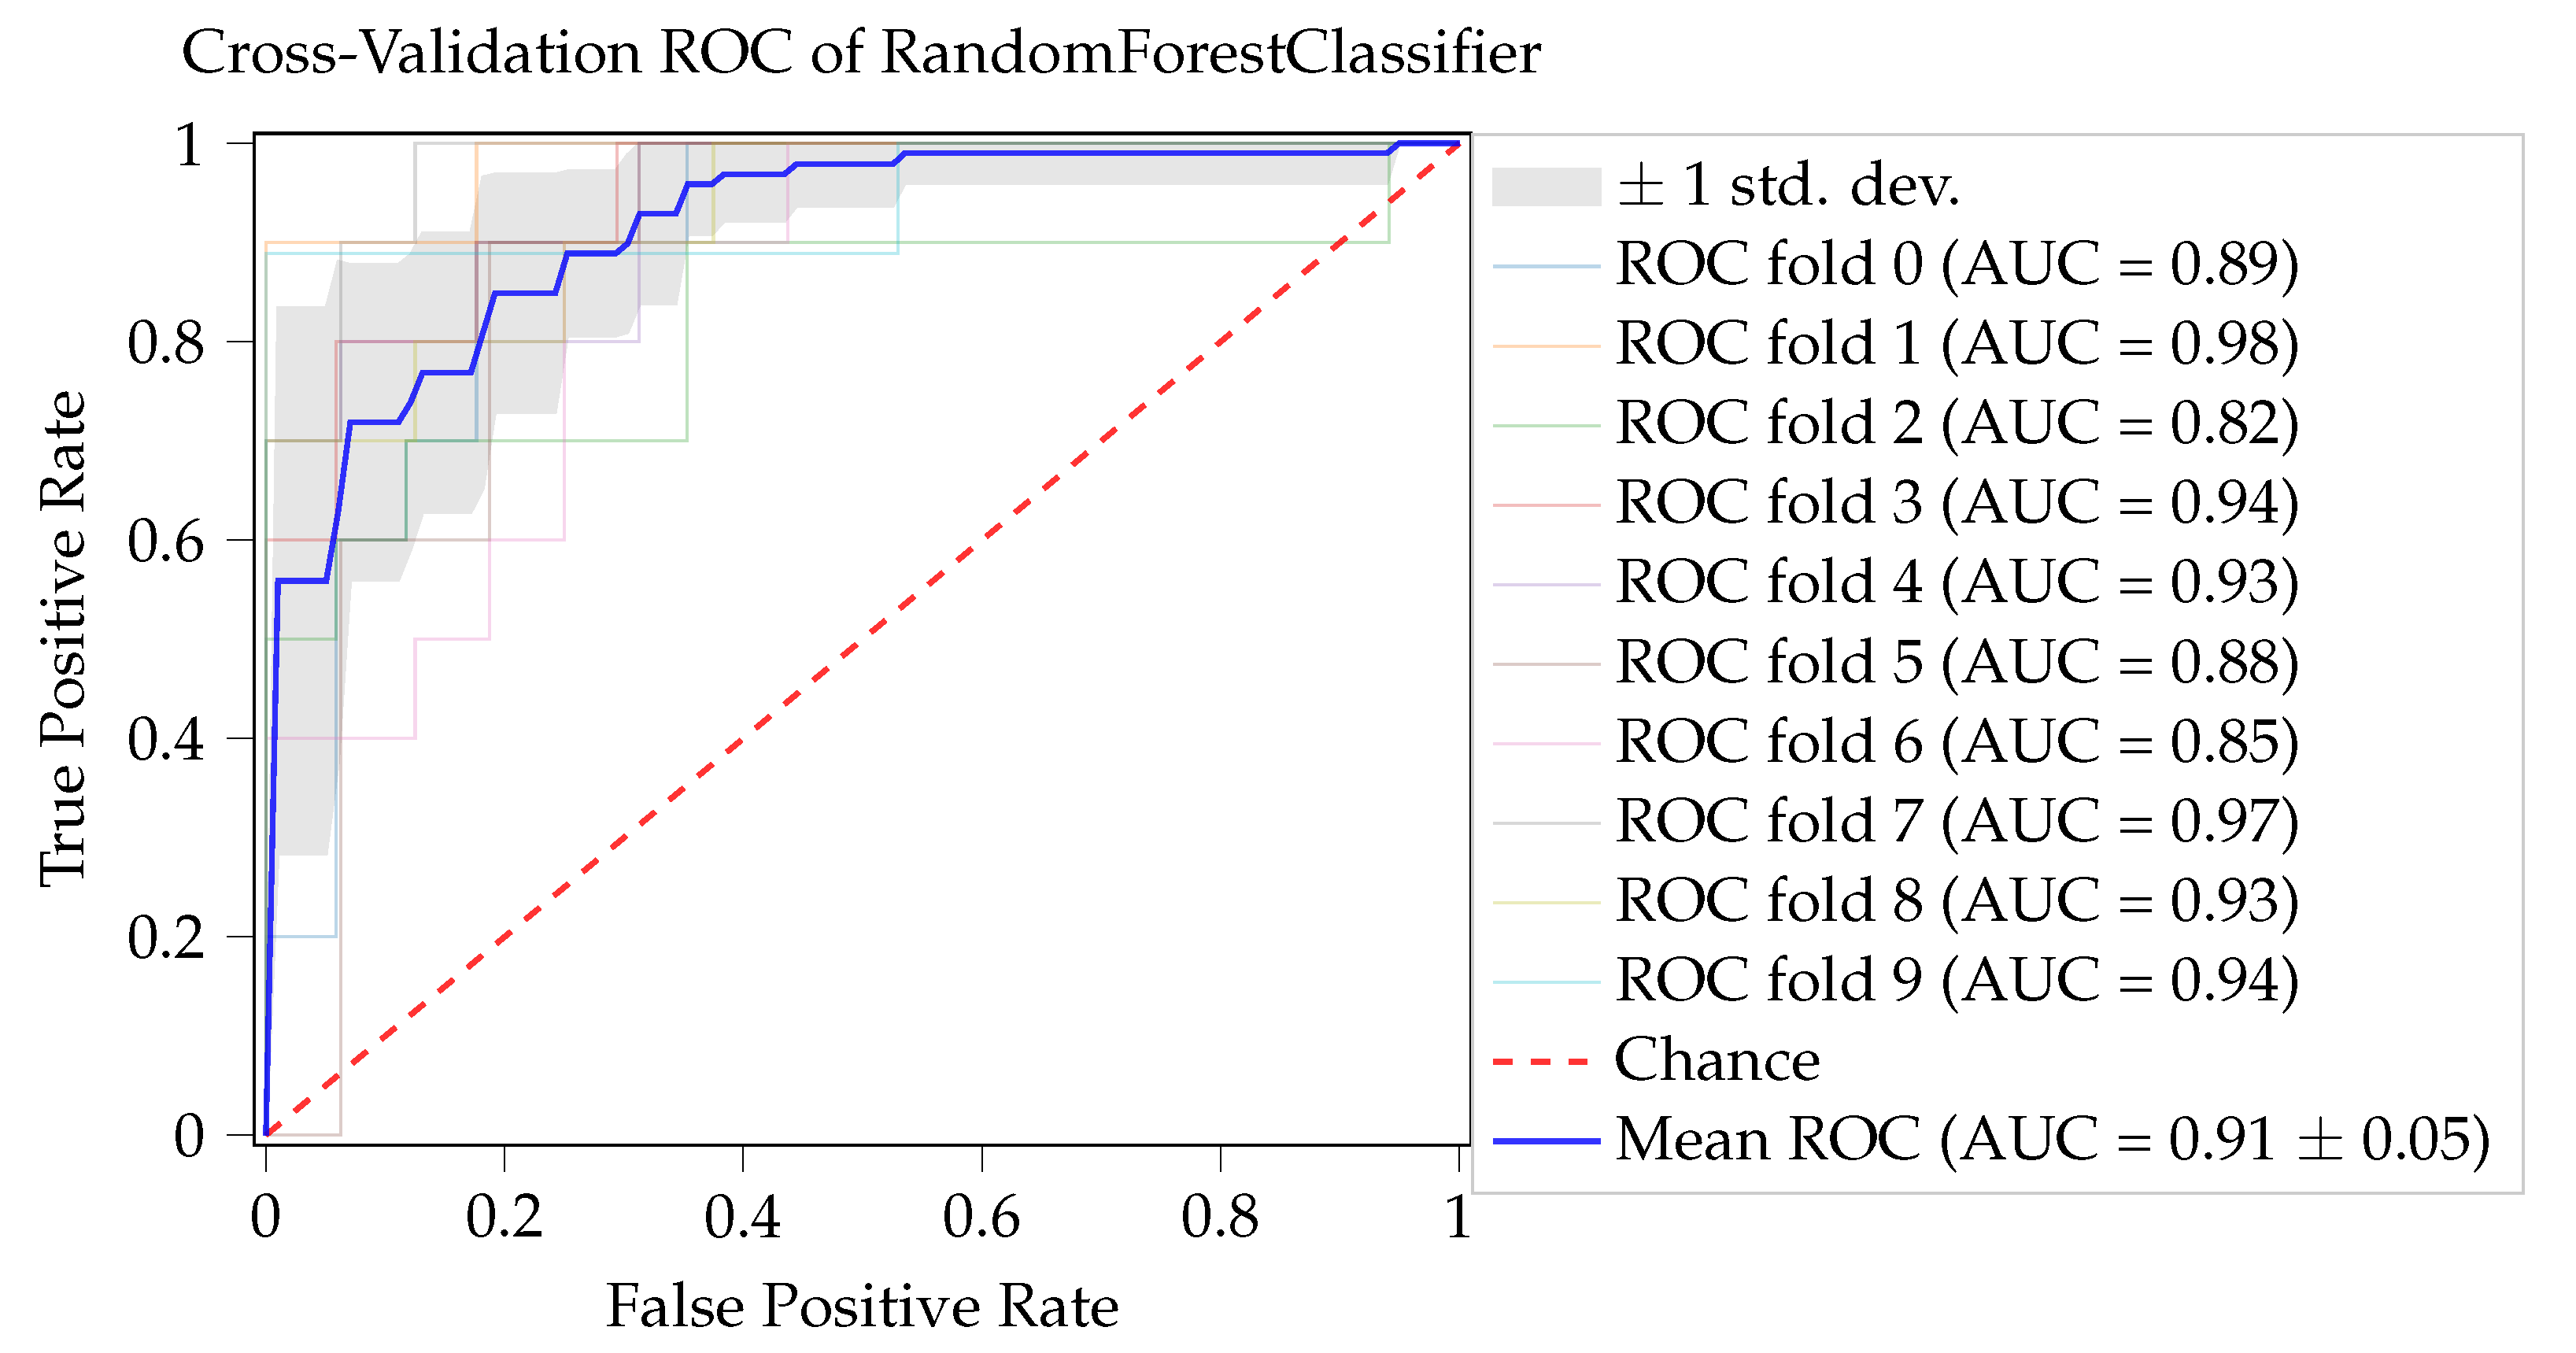
4. Results and Discussion

Four different models (CatBoost; Random Forest; XGBoost; ANN) were built. Since all models, except ANN, are tree-based, they do not benefit from feature scaling. Therefore, the ANN model was implemented into a pipeline (Figure 7), which applies additional data pre-processing before it gets fitted into the model. First, the features were scaled between zero and one. The data was then balanced using the ROS technique (Section 3.5), as it provided more reliable results then unbalanced data.
Every model was then submitted to the stratified 10-fold cross-validation test, described before. During this test, the tuning of each model’s hyperparameters was executed, as these have a significant impact on the model’s prediction performance. The hyperparameters used for each model are illustrated in Table 3.
Every model was then submitted to the stratified 10-fold cross-validation test. This technique allowed to estimate the performance of each model on unseen data. The results are displayed in Table 4. As noticeable, RF provided the best overall metrics [27], only losing in recall to XGBoost.
One important metric is AUROC, which defines how accurately each model discriminates between classes. It is one of the most commonly adopted metrics to measure the model’s performance in classification problems. The obtained ROC curves, for RF, on the previous test, are displayed in Figure 8. With a mean value of 0.91 and a standard deviation of 0.05, this model can very precisely and consistently distinguish a dropout student from a non-dropout.
RF also presented an F1-Score of 0.81 with a standard deviation of 0.22, being the best across all models. This metric represents the harmonic mean between recall and precision, being a good measure of the model’s performance. The final validation data (unseen data) was then fitted into each model, as a last sanity test for their generalization capability. The results are displayed in Table 5. In this test, XGBoost showed the best results. However, it is expected that the RF will present a more stable performance, due to the slightly more reliable results obtained in the cross-validation.
Most of the articles reviewed make the prediction considering several characteristics external to the academic context. These models are good when there is data to feed them. At UTAD, the recorded features were scarce, and it was necessary to use models with existing data. In this context, models considering only academic marks and the age of students were used to predict school dropout, achieving good results (F1-score of 0.87). Some of the papers reviewed showed that non-academic data, in particular socioeconomic data, also influence the academic results. As the proposed model presents promising results, it can be concluded that the grades obtained by the students somehow also incorporate their social extract and way of life.

5. Conclusions and Future Work

In the present study, the prediction of academic dropout was considered. Although school dropout depends on several factors, like economic, social, parental training, and institutional conditions, this study was conducted with data referring to the success of the curricular units as a source. With the results achieved, it is concluded that this analysis is possible even when the students’ data are scarce. In fact, all the methods considered in this paper show promising results in predicting academic dropout, emphasizing RF and XGBoost, which demonstrated an accuracy of 88% and 90% in the final test set, respectively. This prediction is possible because students’ grades somehow already incorporate their living conditions. On the other hand, the study of the importance of the characteristics revealed that the successful completion of the course depends on the maturity of the students (age) and the success in more demanding curricular units.
As a future study, these new data mining techniques will be applied to other study plans, which would allow for the deployment of the most suitable models. Therefore, one classifier will be incorporated in the UTAD’s information system to support academic staff in predicting students dropout. On the other hand, students’ personal information, like economic and personal data, will be considered when UTAD collects a significant amount of data.

Author Contributions

Conceptualization, E.J.S.P., P.B.d.M.O., A.R. and J.B.; methodology, D.E.M.d.S.; software, D.E.M.d.S.; validation, D.E.M.d.S.; formal analysis, D.E.M.d.S.; investigation, D.E.M.d.S.; resources, A.R. and J.B.; data curation, D.E.M.d.S.; writing—original draft preparation, D.E.M.d.S.; writing—review and editing, D.E.M.d.S., E.J.S.P., P.B.d.M.O., A.R. and J.B.; visualization, D.E.M.d.S.; supervision, E.J.S.P., P.B.d.M.O., A.R. and J.B.; project administration, E.J.S.P., P.B.d.M.O., A.R. and J.B.; funding acquisition, A.R. and J.B. All authors have read and agreed to the published version of the manuscript.

Funding

This work was supported by Project “SAMA EDU.IA”, operation number: POCI-05-5762-FSE-000199, financed by the Program COMPETE 2020, Portugal 2020.

Data Availability Statement

Not Applicable, the study does not report any data.

Conflicts of Interest

The authors declare no conflict of interest.

Abbreviations

The following abbreviations are used in this manuscript:
ACCAccuracy
ADAADABoost
AgeAge
ANNArtificial Neural Network
AUCArea Under the Curve
CAComputer Architecture (CU)
CLComputational Logic (CU)
CNNConvolutional Neural Networks
CUCurricular Unit
DGEECDireção Geral de Estatística a Educação e Ciência
DSDigital Systems (CU)
DTDecision Tree
E-IEnglish I (CU)
E-IIEnglish II (CU)
GAGenetic Algorithm
GBGradient Boosted Tree
ICEIntroduction to Computer Engineering (CU)
IL-IIntegrated Laboratory I (CU)
KNNK-Nearest Neighbor
LALinear Algebra (CU)
LGlogistic regression
LSTMLong Short-Time Memory
MA-IMathematical Analysis I (CU)
MA-IIMathematical Analysis II (CU)
MLMachine Learning
MLPMultiLayer Percepton
MP-IMethodology of Programming I (CU)
NBNaïve Bayes
RFRandom Forest
ROCOperating Characteristic Curve
S-ISeminar I (CU)
SVMSuppor Vector Machine
UTADUniversidade de Trás-os-Montes e Alto Douro
XGBExtra Boosted Tree

References

  1. Engrácia, P.; Oliveira, J.; DGEEC. Percursos no Ensino Superior 2018. Available online: https://www.dgeec.mec.pt/np4/292/%7B$clientServletPath%7D/?newsId=516&fileName=DGEEC_SituacaoApos4AnosLicenciaturas.pdf (accessed on 17 January 2022).
  2. Siri, A. Predicting Students’ Dropout at University Using Artificial Neural Networks. Ital. J. Sociol. Educ. 2015, 7, 225–247. [Google Scholar]
  3. Queiroga, E.M.; Lopes, J.L.; Kappel, K.; Aguiar, M.; Araújo, R.M.; Munoz, R.; Villarroel, R.; Cechinel, C. A Learning Analytics Approach to Identify Students at Risk of Dropout: A Case Study with a Technical Distance Education Course. Appl. Sci. 2020, 10, 3998. [Google Scholar] [CrossRef]
  4. Mubarak, A.A.; Cao, H.; Hezam, I.M. Deep analytic model for student dropout prediction in massive open online courses. Comput. Electr. Eng. 2021, 93, 107271. [Google Scholar] [CrossRef]
  5. Dass, S.; Gary, K.; Cunningham, J. Predicting Student Dropout in Self-Paced MOOC Course Using Random Forest Model. Information 2021, 12, 476. [Google Scholar] [CrossRef]
  6. Alban, M.; Mauricio, D. Neural networks to predict dropout at the universities. Int. J. Mach. Learn. Comput. 2019, 9, 149–153. [Google Scholar] [CrossRef] [Green Version]
  7. Plagge, M. Using Artificial Neural Networks to predict first-year traditional students second year retention rates. In Proceedings of the Annual Southeast Conference, Savannah, GA, USA, 4–6 April 2013; ACM Press: New York, NY, USA, 2013; p. 1. [Google Scholar] [CrossRef]
  8. Chung, J.Y.; Lee, S. Dropout early warning systems for high school students using machine learning. Child. Youth Serv. Rev. 2019, 96, 346–353. [Google Scholar] [CrossRef]
  9. Pereira, R.T.; Zambrano, J.C. Application of decision trees for detection of student dropout profiles. In Proceedings of the 2017 16th IEEE International Conference on Machine Learning and Applications (ICMLA), Cancun, Mexico, 18–21 December 2017; pp. 528–531. [Google Scholar]
  10. Fernández-García, A.J.; Preciado, J.C.; Melchor, F.; Rodriguez-Echeverria, R.; Conejero, J.M.; Sánchez-Figueroa, F. A real-life machine learning experience for predicting university dropout at different stages using academic data. IEEE Access 2021, 9, 133076–133090. [Google Scholar] [CrossRef]
  11. Hutagaol, N.; Suharjito, S. Predictive modelling of student dropout using ensemble classifier method in higher education. Adv. Sci. Technol. Eng. Syst. J. 2019, 4, 206–211. [Google Scholar] [CrossRef] [Green Version]
  12. Kiss, B.; Nagy, M.; Molontay, R.; Csabay, B. Predicting dropout using high school and first-semester academic achievement measures. In Proceedings of the 2019 17th International Conference on Emerging eLearning Technologies and Applications (ICETA), Starý Smokovec, Slovakia, 21–22 November 2019; pp. 383–389. [Google Scholar]
  13. Dharmawan, T.; Ginardi, H.; Munif, A. Dropout detection using non-academic data. In Proceedings of the 2018 4th International Conference on Science and Technology (ICST), Yogyakarta, Indonesia, 7–8 August 2018; pp. 1–4. [Google Scholar]
  14. Hasbun, T.; Araya, A.; Villalon, J. Extracurricular activities as dropout prediction factors in higher education using decision trees. In Proceedings of the 2016 IEEE 16th International Conference on Advanced Learning Technologies (ICALT), Yogyakarta, Indonesia, 7–8 August 2016; pp. 242–244. [Google Scholar]
  15. Mduma, N.; Kalegele, K.; Machuve, D. A survey of Machine Learning Approaches and Techniques for Student Dropout Prediction 2019. Available online: https://dspace.nm-aist.ac.tz/handle/20.500.12479/71 (accessed on 17 January 2022).
  16. de Oliveira, C.F.; Sobral, S.R.; Ferreira, M.J.; Moreira, F. How Does Learning Analytics Contribute to Prevent Students’ Dropout in Higher Education: A Systematic Literature Review. Big Data Cogn. Comput. 2021, 5, 64. [Google Scholar] [CrossRef]
  17. Kriesel, D. Neural Networks. 2007. Available online: https://www.dkriesel.com/_media/science/neuronalenetze-en-zeta2-2col-dkrieselcom.pdf (accessed on 17 January 2022).
  18. Zhou, Z.H. Ensemble Learning. In Encyclopedia of Biometrics; Springer: Boston, MA, USA, 2009; pp. 270–273. [Google Scholar] [CrossRef]
  19. Dietterich, T.G. Ensemble methods in machine learning. In International Workshop on Multiple Classifier Systems; Lecture Notes in Computer Science (including subseries Lecture Notes in Artificial Intelligence and Lecture Notes in Bioinformatics); Springer: Berlin/Heidelberg, Germany, 2000; Volume 1857, pp. 1–15. [Google Scholar] [CrossRef] [Green Version]
  20. Brodley, C.E.; Friedl, M.A. Decision tree classification of land cover from remotely sensed data. Remote Sens. Environ. 1997, 61, 399–409. [Google Scholar] [CrossRef]
  21. Trainor, P.J.; Yampolskiy, R.V.; DeFilippis, A.P. Wisdom of artificial crowds feature selection in untargeted metabolomics: An application to the development of a blood-based diagnostic test for thrombotic myocardial infarction. J. Biomed. Inform. 2018, 81, 53–60. [Google Scholar] [CrossRef] [PubMed]
  22. Natekin, A.; Knoll, A. Gradient boosting machines, a tutorial. Front. Neurorobot. 2013, 7, 21. [Google Scholar] [CrossRef] [PubMed] [Green Version]
  23. Chen, T.; Guestrin, C. XGBoost: A scalable tree boosting system. In Proceedings of the ACM SIGKDD International Conference on Knowledge Discovery and Data Mining. Association for Computing Machinery, San Francisco, CA, USA, 13–17 August 2016; pp. 785–794. [Google Scholar] [CrossRef] [Green Version]
  24. Dorogush, A.V.; Ershov, V.; Gulin, A. CatBoost: Gradient boosting with categorical features support. arXiv 2018, arXiv:1810.11363. [Google Scholar]
  25. Breiman, L. Random forests. Mach. Learn. 2001, 45, 5–32. [Google Scholar] [CrossRef] [Green Version]
  26. He, H.; Garcia, E.A. Learning from Imbalanced Data. IEEE Trans. Knowl. Data Eng. 2009, 21, 1263–1284. [Google Scholar] [CrossRef]
  27. Vishwakarma, G.; Sonpal, A.; Hachmann, J. Metrics for Benchmarking and Uncertainty Quantification: Quality, Applicability, and Best Practices for Machine Learning in Chemistry. Trends Chem. 2021, 3, 146–156. [Google Scholar] [CrossRef]
Figure 1. Pairwise relationships between the most important features {0-Success, 1-Dropout}.
Futureinternet 14 00076 g001
Figure 2. Machine learning modularization pipeline.
Futureinternet 14 00076 g002
Figure 3. Permutation importance box plot.
Futureinternet 14 00076 g003
Figure 4. Age importance box plot (red: success, magenta: dropout).
Futureinternet 14 00076 g004
Figure 5. Number of fails per curricular unit (feature red: used in the model, feature blue: discarded).
Futureinternet 14 00076 g005
Figure 6. Data division strategy. Adapted from: https://scikit-learn.org/stable/modules/cross_validation.html (accessed on 17 January 2022).
Futureinternet 14 00076 g006
Figure 7. ANN pipeline architecture.
Futureinternet 14 00076 g007
Figure 8. Different ROC curves obtained on 10-fold cross validation test, for Random Forest.
Futureinternet 14 00076 g008
Table 1. Model, features, and metrics used and results obtained.
WorkFeaturesMethodsMetricsResult
Alban and Mauricio [6]PersonalANNACC0.963
KnowledgeRNNACC0.968
Chung and Lee [8]PersonalRFACC0.95
Test marks AUC0.97
Attendance Sensitivity0.85
Volunteer Specificity0.95
Dass et al. [5]ActivityRFF1-score0.875
AUC0.945
ACC0.875
Recall0.875
Precision0.88
Dharmawan et al. [13]DemographyDTACC0.660
EconomicSVMACC0.660
Social iteractionKNNACC0.564
Motivation
Personal
Fernádez-García et al. [10]MarksGBACC0.682
PersonalRFACC0.686
SVMACC0.686
EnsembleACC0.670
Hasbun et al. [14]AcademicDTACC0.793
Personal ACC0.939
Sports
High School data
Hutagaol et al. [11]AcademicKNNACC0.753
DemographyNaïve BayesACC0.629
DTACC0.649
GBACC0.791
Kiss et al. [12]AcademicGBACC0.680-0.858
PersonalXGBPrecision0.670–0.863
High School dataMLPRecall0.735–0.818
AUC0.729–0.920
Mubarak et al. [4]ActivityCNN-LSTMAUC0.76–0.86
Deep Neural NetworkF1-score0.86–0.89
SVMPrecision0.90–0.97
Linear RegressionRecall0.79–0.88
Pereira and Zambrano [9]MarksDTConfidence0.800
SocioEonomic
Personal
Institutional
Plagge [7]AcademicANNACC0.750
Queiroga et al. [3]ActivityGA (ADA, DT, RF, MLP, LG)AUC0.845
Table 2. Initial dataset features.
Feature NameAcronymCurricular Unit (CU)Scale
AgeAge Ordinal
City Nominal
Father Employment Status Nominal
Father Education Nominal
Father Profession Nominal
Mother Employment Status Nominal
Mother Education Nominal
Mother Profession Nominal
Final Grade Ordinal
Graduation Year Ordinal
Registration Status Nominal
Computational LogicCLYesOrdinal
Computer ArchitectureCAYesOrdinal
Digital SystemsDSYesOrdinal
English IE-IYesOrdinal
English IIE-IIYesOrdinal
Integrated Laboratory IIL-IYesOrdinal
Introduction to Computer EngineeringICEYesOrdinal
Linear AlgebraLAYesOrdinal
Mathematical Analysis IMA-IYesOrdinal
Mathematical Analysis IIMA-IIYesOrdinal
Methodology of Programming IMP-IYesOrdinal
Seminar IS-IYesOrdinal
Table 3. Model’s hyperparameters.
ModelHyperparameters
CatBoostiterations = 50
learning_rate = 0.9
l2_leaf_reg = 11
class_weights = [1, 1.67]
eval_metric = AUC
max_depth = 1
Random Forestclass_weight = [1, 1.67]
max_depth = 7
min_samples_leaf = 2
min_samples_split = 10
XGBoostlearning_rate = 0.15
scale_pos_weight = 1.67
colsample_bytree = 0.7
n_estimators = 100
min_child_weight = 7
max_depth = 5
gamma = 0.4
ANNactivation = logistic
alpha = 0.001
early_stopping = True
hidden_layer_sizes = 12
learning_rate_init = 0.6
Table 4. Comparison between the different models results of a stratified 10-fold cross validation test, on training data.
Precision 1Recall 1F1-Score 1AUROC 1Accuracy 1
CatBoost 0.78 ± 0.26 0.82 ± 0.25 0.79 ± 0.19 0.90 ± 0.12 0.84 ± 0.14
Random Forest 0.81 ± 0.21 0.81 ± 0.29 0.81 ± 0.22 0.91 ± 0.10 0.86 ± 0.15
XGBoost 0.78 ± 0.25 0.83 ± 0.30 0.80 ± 0.23 0.91 ± 0.11 0.85 ± 0.16
ANN 0.85 ± 0.28 0.71 ± 0.38 0.75 ± 0.23 0.92 ± 0.09 0.83 ± 0.14
1 Mean value ± standard deviation from the ten different validation sets, in cross-validation.
Table 5. Comparison between the different models’ predictions on the final test set.
PrecisionRecallF1-ScoreAUROCAccuracy
CatBoost0.840.840.840.950.88
Random Forest0.810.880.850.960.88
XGBoost0.820.920.870.950.90
ANN0.770.800.780.940.84
Publisher’s Note: MDPI stays neutral with regard to jurisdictional claims in published maps and institutional affiliations.

