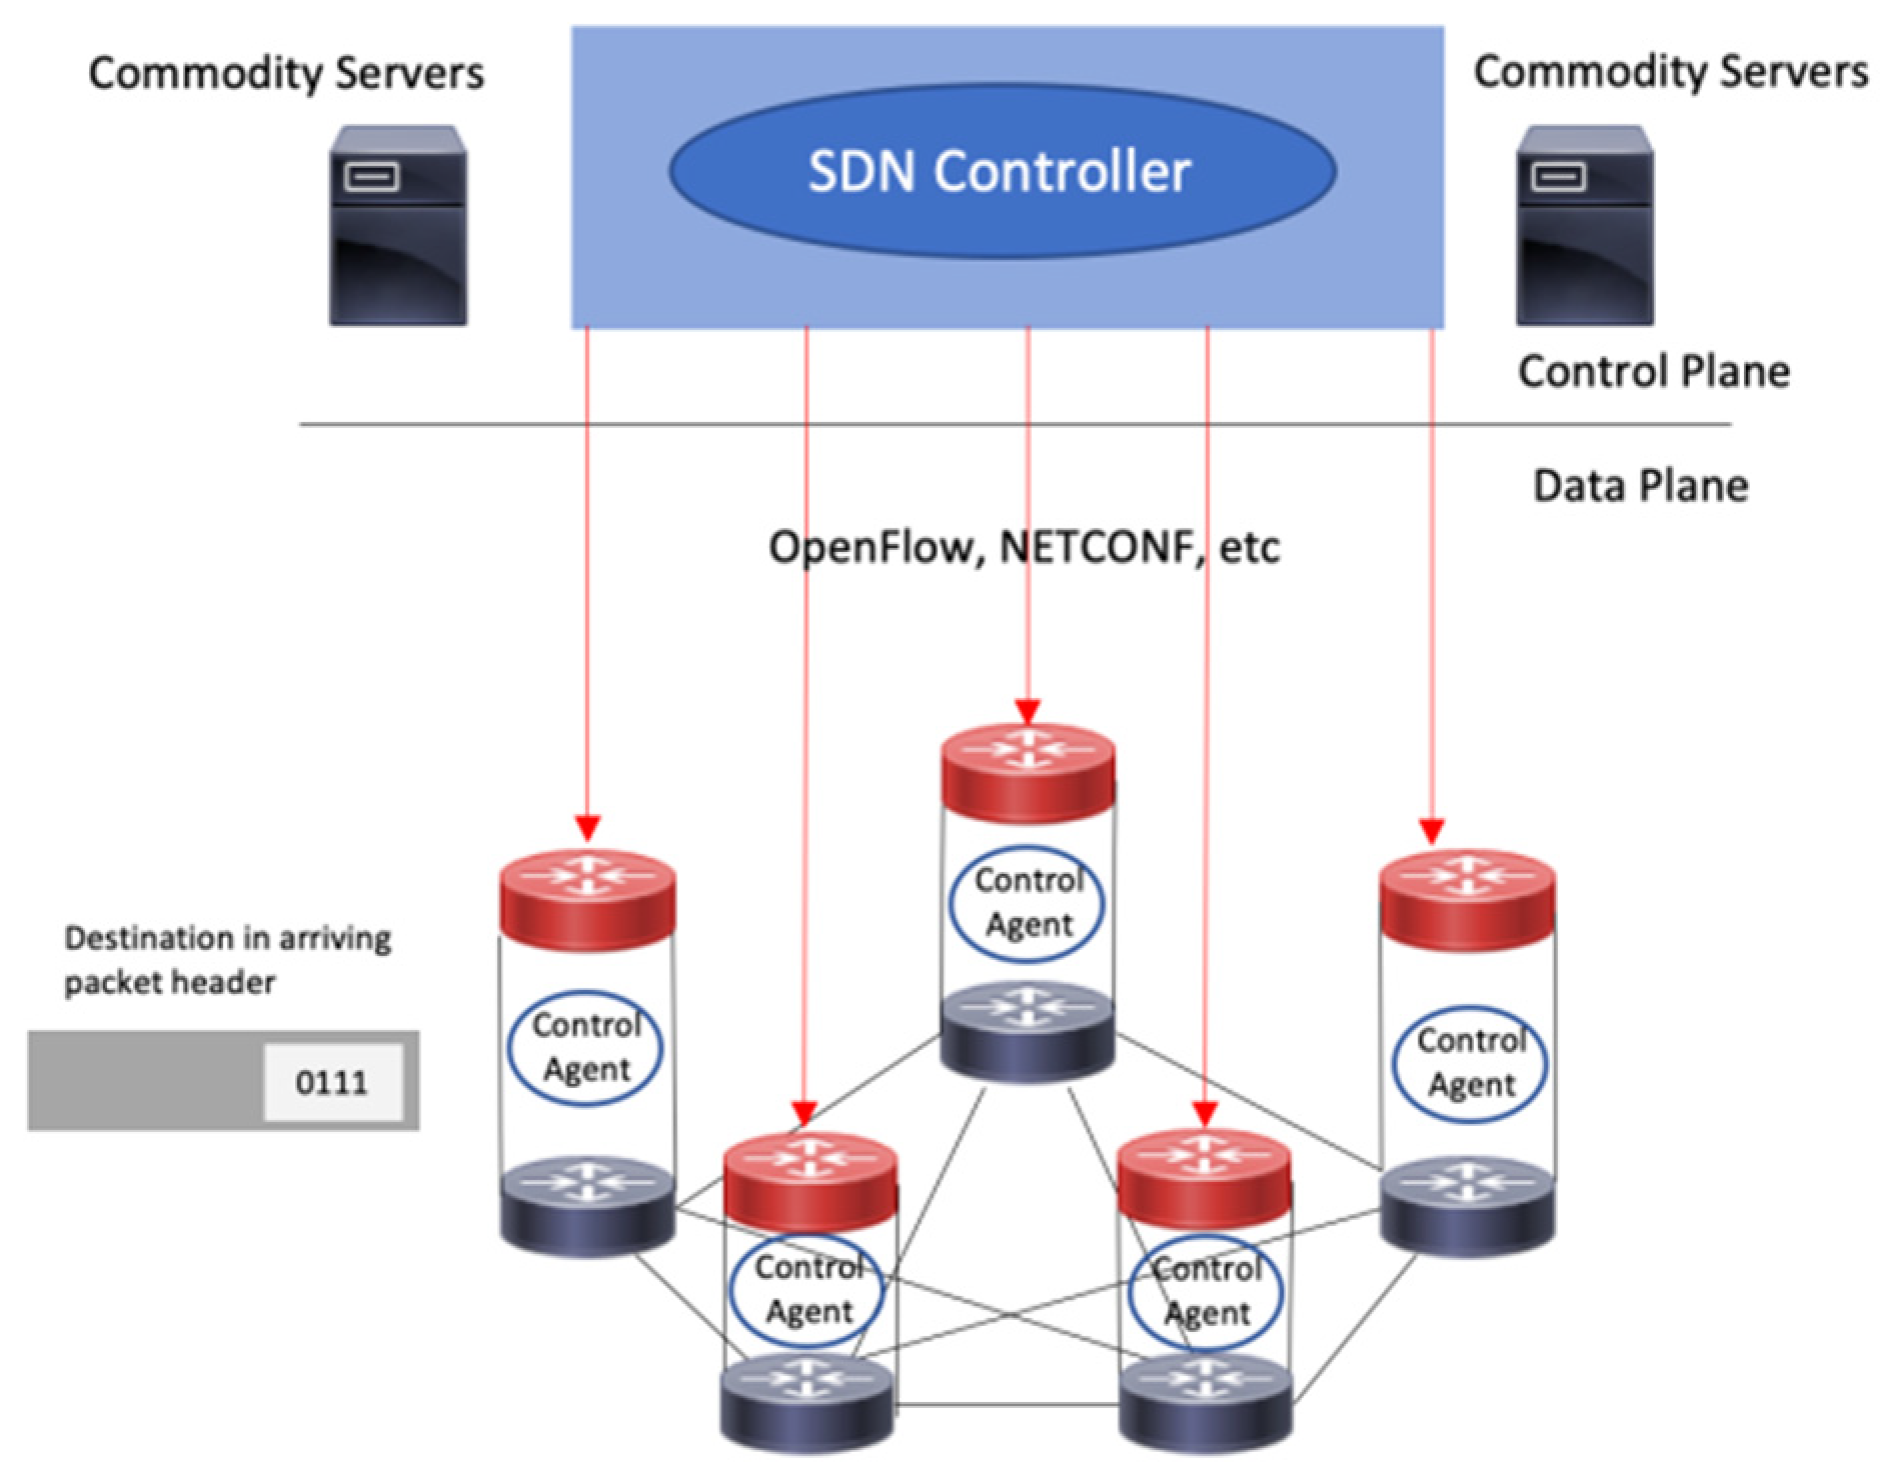
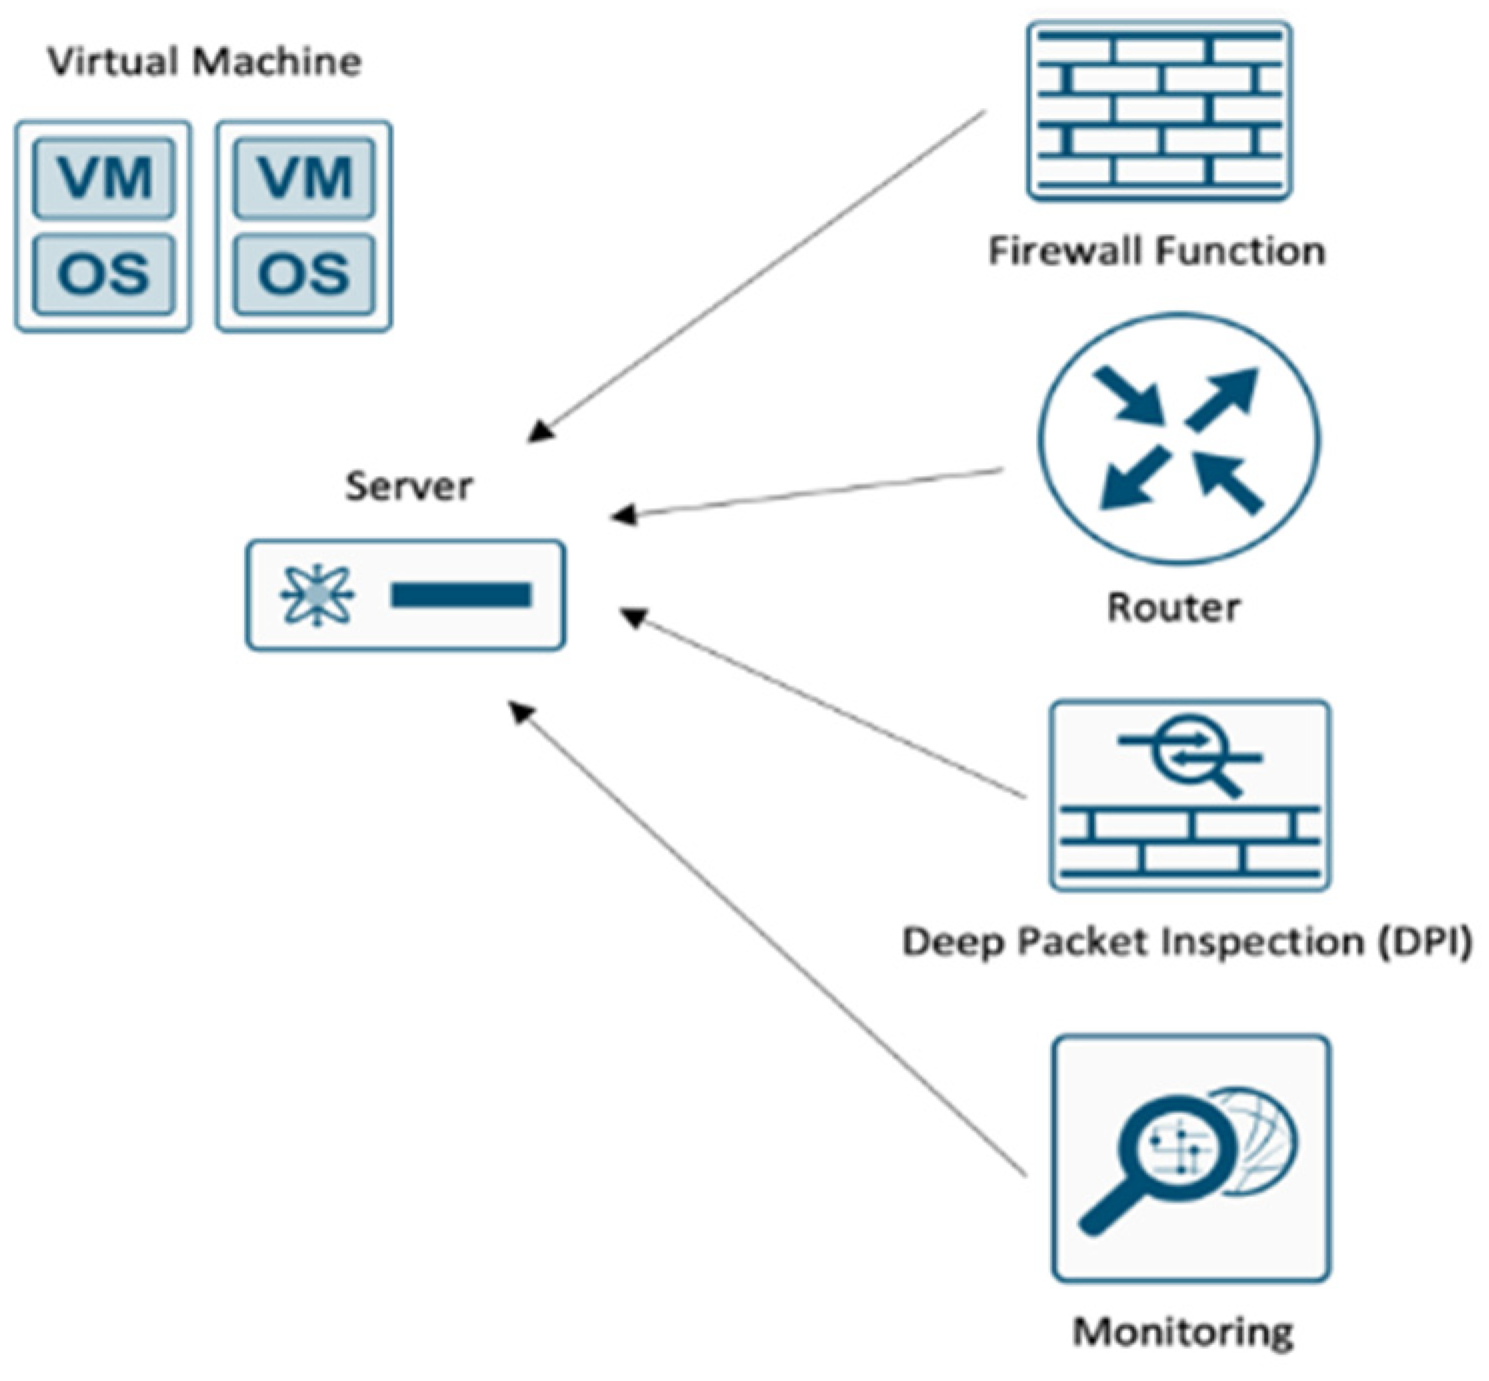
The objective of this section is to ensure that the integration of SDN and NFV is suitable for data center network infrastructure. This architecture also clarifies the benefits of using DPDK and SR-IOV at the computing level and the data center infrastructure for improving network performance. Therefore, we used throughput and latency parameters to demonstrate that this integration can enhance network performance. This integration and modification in the computing level is the one that possesses less latency and higher throughput, compared to other implemented SDN that are independent. In addition, we tested manageability by measuring the duration of changes that are usually made by personnel in carrying out daily operations.
4.2. Performance Evaluation
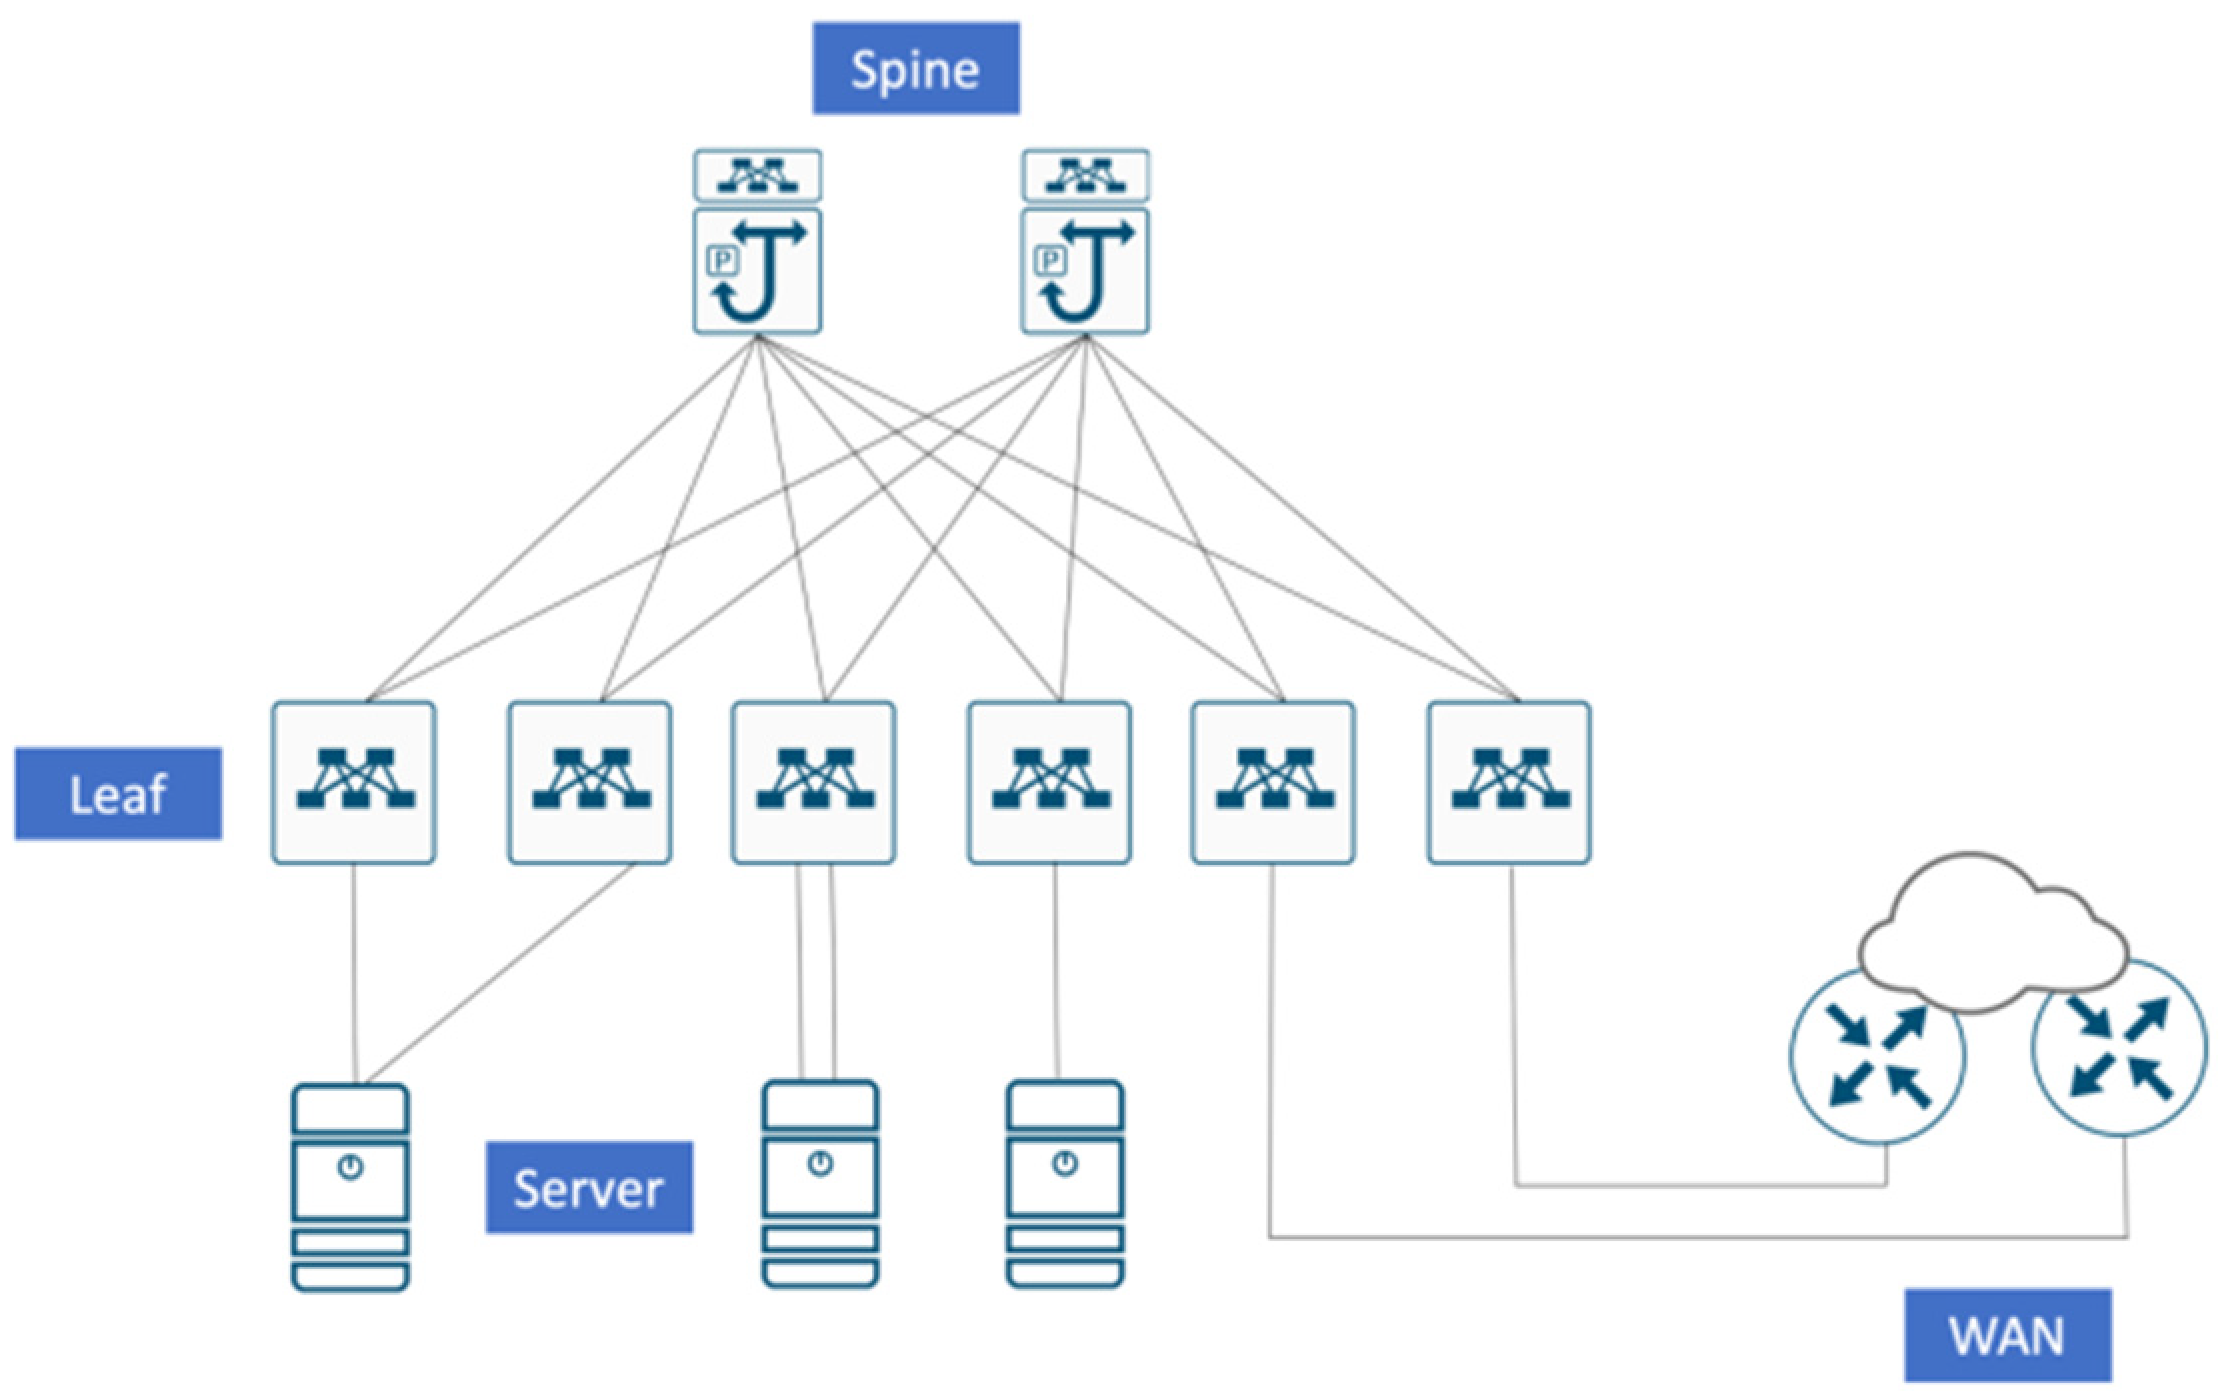
We evaluated the performance of the proposed architecture that integrates SDN and NFV with Cisco ACI (N9K-C9508 as Spine and N9K-C93180YC-FX as Leaf) and VMware TCI (Inside UCS Hyperflex Server with 10G FO Interface, 512 GB of RAM, and 32 TB SSD Storage). The evaluations were performed as follows.
- (1)
Previously, the throughput capacity generated from traffic communication that led to applications running on virtual machines was deemed less than optimal, because it only utilized the default virtual switch from the logical device platform virtualization. Therefore, there is an evaluation that will compare how the throughput capacity and latency between data centers that only use SDN, with data centers that combine SDN and NFV for communication from outside to VM, or vice versa.
- (2)
For this performance evaluation scenario, we used Cacti [
34]. The parameters that will be compared are the inbound and outbound throughput capacity of the interface, that provides communication on virtualization-based service applications and their latency. This test was carried out for 30 consecutive days (including weekends) so that the comparison of the data can be seen more clearly with the previous one, and was carried out at 18:00–21:00 when data traffic was heavy (peak hours).
- (3)
In this test, the network function that will be used as a testing tool is a virtual switch (VMware NSX as part of the VMware TCI) that is installed on the server to redirect cache traffic to applications accessed by customers.
Figure 11 shows the test topology, which is used to measures the throughput and latency from the implemented solution, where the monitoring server is placed in the DMZ block. The server installed Cacti as a monitoring tool, and Cacti was reachable by the server leaf and border leaf switch. Two interfaces are used as points of monitoring: interfaces to servers that have installed network function virtualization, servers with virtualized computing inside, and interfaces that face the Internet. The servers-facing interface is on the server leaf switch and the internet-facing interface is on a border leaf switch.
We compared the legacy architecture with the proposed architecture by calculating the average throughput and latency. We monitored the 10 selected interfaces on the leaf switch in the following manner:
- (1)
3 interface in 2 server leaf switch which leads to monitored server.
- (2)
2 interface in border leaf switch which leads to Internet or subscribers.
From the data that we collected for 30 days during the monitoring period before migration (legacy) and 30 days after implementation of the proposed architecture, we averaged per prime hour (18:00–21:00). Every hour, for example, at 18:00 we collected data from the interfaces that were selected for data collection which will be calculated later. The calculation is performed by calculating the average throughput at a certain hour: for example, we will calculate the average throughput and latency before migration at 18:00 on the leaf server, and we will calculate the average throughput and latency after migration at 19:00 on the border leaves.
Finally, we obtained the average of each section, for example, the server leaf at 18:00 or border leaf at 19:00 inbound or outbound to be compared to determine whether this integration and modification improves the performance of the data center network.
- (a)
Throughput
The data displayed in the graphs in
Figure 12 and
Figure 13 show that there is an increase in the throughput trend in both the input and output rates of traffic on the leaf switch server. The throughput increases values shown in the graphs in
Figure 12 and
Figure 13 were 160 Mbps to 220 Mbps for the input rate and 170–230 Mbps for the output rate. The increase was due to a modification of the network computing system, namely the DPDK and SR-IOV on servers filled with network function virtualization; thus, it is evident that the traffic cycle process between hosts on one server, as well as between hosts between servers (east-west traffic) becomes simpler and optimal according to the direction of data traffic communication. This leaf switch server also serves to communicate data traffic to the outside (north-south traffic) to be forwarded to the border leaf switch, but with an amount that is not more than the data traffic between servers.
The data from the graphs in
Figure 14 and
Figure 15 show the trend of increasing throughput values that occurred after the implementation of the proposed solution. The impact of the modification of the network computing system is not only visible at the server leaf switch level, but also at the border leaf switch. The throughput increase value shown in the graphs in
Figure 14 and
Figure 15 is 1.22 Gbps to 1.8 Gbps for the input rate, and 670 Mbps to 1.1 Gbps for the output rate. Traffic data on the border leaf switch is an aggregation of all server leaf switches in the fabric, which can also be called the estuary of the server leaf switch. This border leaf switch is connected directly to the external network through an external router that has a direct connection with it. Therefore, data traffic on the border leaf switch is traffic to the outside network, both inbound and outbound. When viewed from the data displayed on the graphs in
Figure 13 and
Figure 15, inbound traffic is more dominant in the border leaf switch data traffic because of the large number of subscribers (users) who make requests to servers in the fabric rather than requests from servers to the outside network or the Internet.
Based on
Table 5, there is an increase in throughput on both the server leaf switch and border leaf switch, after the application of the new SDN-NFV architecture and modification of the network computing system on the server containing network function virtualization. In this SDN and NFV network architecture, we can see that the incoming and outgoing throughput began to creep up from 18.00 h and then ramped up again at 21.00 h at the site used for testing. If we compare the SDN-NFV network and SDN only, on average, we can clearly see that the SDN network has the ability to issue a smaller throughput compared to the SDN-NFV combination.
This means that the SDN-NFV combination can serve more data requests from subscribers than the SDN alone. The greater the throughput value, the better because it can be faster and fulfills more subscriber traffic. In the research conducted by Nisar et al. [
35], the researcher performed a simulation using an independent SDN, namely the Ryu controller and the OpenFlow switch. From this research, the peak throughput is not too large, which is around 25 Mbps. This is because the test uses a simulator with a workload that is not too heavy, and the endpoint is not a computing system with a certain load so that we cannot know the actual results. In our research, we conducted tests using real world SDN and NFV environments where the two technologies are integrated with each other down to the computing level. In addition, the load given to the endpoint system is also very large, so that we can see the actual peak performance of the combination of SDN and NFV. As an endpoint, we also use a real computing system so that it truly describes the actual conditions in the field.
- (b)
Latency
From the data presented in
Figure 8, it can be seen that there is a striking difference between the latency of the legacy and the proposed traffic data. The value of decreasing data traffic latency on the leaf switch server is 12.05 ms to 12.15 ms, as shown in
Figure 16. This decrease in data traffic latency value is closely related to the optimization of hops through which data traffic passes, for example, if previously there was traffic data from host-1 to host-2 which turned out to be on one server, the traffic data would be forwarded out of the server to the leaf switch server. This is then reflected to the spine switch, and then returned to the leaf switch server until it returned to the server and host-2. Of course, the flow of data traffic such as this can be simplified by bypassing several data-forwarding mechanisms in the computing system, which in this study was carried out using the DPDK and SR-IOV on the server. With the application of DPDK and SR-IOV, the flow of traffic data between hosts and between servers can occur more simply and optimally to reduce the number of hops when data traffic passes. Optimization is performed by mapping the data traffic (between hosts/servers) with the network computing system that will be applied to the virtualized host/network function. Thus, the flow of data traffic and the networking computing system used is right on the target.
The border leaf switch is the same as the explanation in the throughput section where the border leaf switch is the estuary of the server leaf switch, and the border leaf switch manages the outgoing traffic data or north-south traffic. The value of decreasing data traffic latency on the leaf switch server is 16.75 ms to 17.85 ms, as shown in
Figure 17. A fairly large impact is also seen in the border leaf switch from the application of the new SDN-NFV architecture and modification of the network computing system on this server, because the number of hops passed by data traffic originating from subscribers (users) will also be reduced as well.
From
Table 6, we can see the trend of increasing latency values after the implementation of the proposed solution. The latency value of SDN-NFV testing on the border and the leaf switch is influenced by the number of hops and the direction of the data traffic. The latency value on the leaf switch server is smaller than that of the border leaf switch, because data communication on the leaf switch server is limited from host to host on one server, host to host between servers, server to leaf switch, and server to border leaf switch, while the value latency on the border leaf switch has more hops because it also counts the hops to the subscriber in terms of the hops at the very end. However, the focus of this research is the comparison of the latency value of the SDN-NFV combination with SDN alone. On average, we can clearly see that the SDN network has a higher latency value than the SDN-NFV combination. This is because of the use of virtualization technology that can boost server performance in processing data. This means that the SDN-NFV combination can serve data requests from subscribers faster than an SDN alone. The smaller the latency value, the better because it can be faster and can fulfill more subscriber traffic. Of course, a difference in performance is felt on the subscriber (user) side. This is in line with the business goals that the company wants to improve the user experience, so that users feel comfortable using company data services.
Numan et al. [
36] also conducted research on conventional networks and SDN where they focused on the comparison of latency and jitter. The test carried out to obtain the latency value in this study was to calculate the round-trip delay in several scenarios. Meanwhile, in our research, measurements are based on reports generated from cacti tools. These are used daily to monitor throughput and latency in SDN and NFV network environments, so that the results produced are more accurate because the data is taken in real time.
4.3. Manageability Evaluation
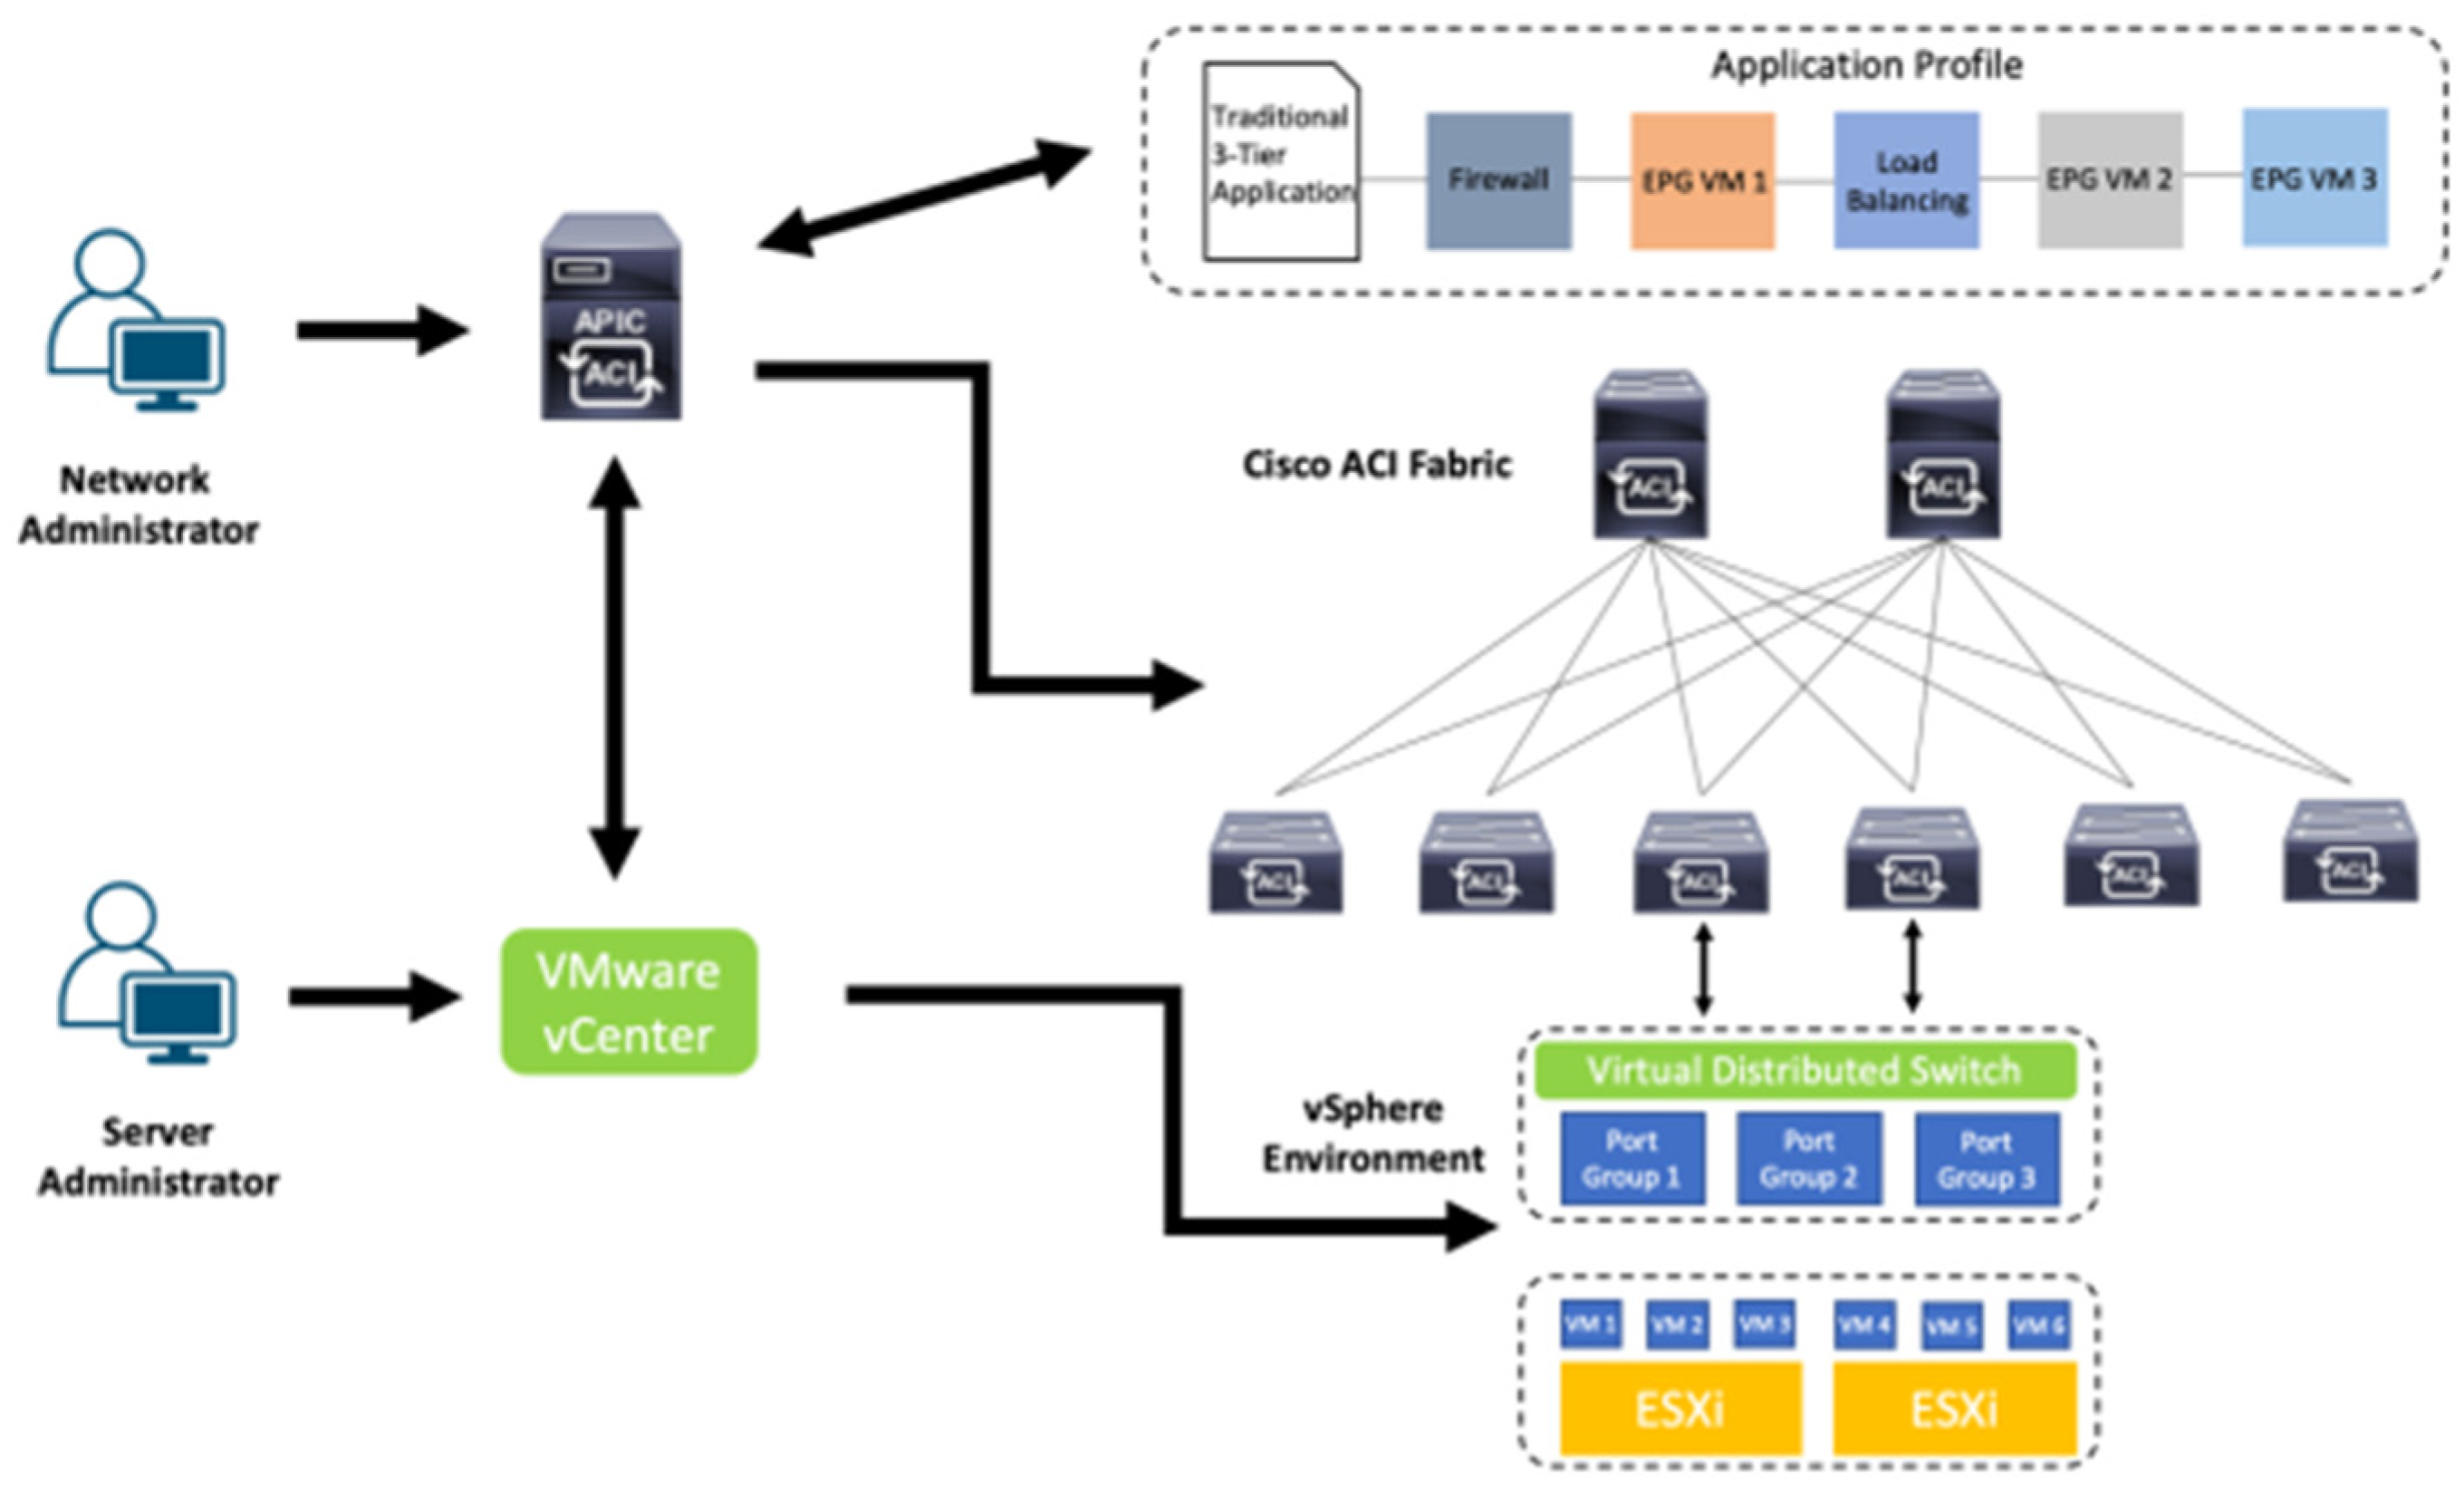
In this test, four scenarios were used to evaluate the manageability of the SDN-NFV combination by calculating the duration of the test. The tests carried out were the integration between the SDN controller and the VM controller, adding an integrated policy for VM instances through the SDN controller and creating an endpoint group (EPG) on the SDN controller and port-group on the distributed virtual switch (DVS).
- (1)
SDN and VM controller integration
The first test is to integrate the SDN controller with the VM controller, which is the beginning to combine SDN and NFV, where the two environments can be connected to each other. The initial requirements of this test are that the first VM controller has been formed, and then the interconnection between the server and the leaf switch server has also been established. After these two requirements are satisfied, integration can be initiated. To integrate the SDN controller with the VM controller, we simply need to do so in the SDN controller dashboard. Here we will create a special domain to accommodate the VM controller to be integrated by completing some basic VM controller information to be input on the dashboard. This is performed only once in one SDN controller sub-menu.
Based on the process flow described in
Table 7 and
Table 8, we created a table of the estimated time required to complete each process, so that we could determine the estimated total time required for each scenario. In
Table 7, we can see that the estimated time needed to complete the integration scenario between the SDN controller and the VM controller is 3 min, including checking on the VM controller side. Whereas, if only SDN is used, the integration process becomes more complicated and takes longer, as shown in
Table 8. This integration is also useful in the future, which will certainly make it easier for users when going to the process to set up the two environments.
Table 9 compares the estimated time in minutes required to complete the scenario of adding a new instance with the increase in the number of instances. As the number of separate SDN and NFV environment instances increases, it takes more time than integrating SDN and NFV.
- (2)
Added integrated policies for VM instances
The second test adds an integrated policy for VM instances, which is very important because it is performed quite often when the virtualization environment is already onboard. Another aspect that is no less important than this test is to maintain policy consistency between SDN and NFV caused by human error. The policy that can be made from the SDN controller for the VM controller is an attachable access entity that contains information about the physical interface between SDN and NFV, such as the discovery protocol interface, maximum transmission unit (MTU) and link aggregation. The interface policy regulates more towards layer 2 connections on the VM such as the spanning tree protocol (STP), port security, monitoring (Syslog) and Dot1x for authentication, if needed. All of these policies will be created entirely in the SDN controller, so that in the VM controller, we only need to check whether the policy we have created has been formed and register the host that will be bound to the policy created. This policy can be implemented in the attachable access entity profile, vSwitch policies, and leaf access port policy submenus.
In
Table 10 and
Table 11, we can see that the process of adding policies in the SDN-NFV combination environment is sufficient to be done centrally on the SDN controller dashboard, whereas the process of adding policies to separate SDN and NFV networks takes more time because it requires manual configuration on the two different dashboards. Of course, apart from being time-consuming, a configuration that is not centralized is at risk of misconfiguration, which can also make deployment time longer because troubleshooting must be performed in both environments.
Table 12 compares the estimated time in minutes needed to complete the scenario of adding an integrated policy with an increase in the number of policies. As the number of policies added increases, separate SDN and NFV environments require more time than integrated SDN and NFV environments in policy making.
- (3)
Added Endpoint Group (EPG) and port-group
The next test is to add an endpoint group (EPG) to the SDN controller and port group. This test is important considering that this is one of the activities that administrators often perform when setting up the data center environment. With the rapid addition of applications to the company, it also requires speed of deployment on the infrastructure side. In this test, an endpoint group (EPG) is added, accompanied by the creation of a centralized port group on the SDN controller. The endpoint group (EPG) is an entity on SDN that contains information on server infrastructure or the like connected to SDN devices, such as the VLAN used and the port connected to SDN. To associate EPG with DVS, we can do this through the SDN controller dashboard in the application EPG sub-menu.
Based on
Table 13 and
Table 14, we can see that the process of adding EPG and port-groups in the combined SDN-NFV environment is quite simple and can be done centrally on the SDN controller dashboard, while on separate SDN and NFV networks it takes more time because we need to perform manual configuration on two different dashboards. The time difference between the two tests was 3 min compared to 12 min. Of course, apart from being time-consuming, a configuration that is not centralized is very at risk of misconfiguration, which can also make deployment time longer because troubleshooting must be performed in both environments.
Table 15 provides a comparison of the estimated time in minutes required to complete the scenario of adding EPG and port groups with an increased number of instances. As the number of instances added increases, separate SDN and NFV environments take more time than integrated SDN and NFV environments to create instances.
If we combine the three scenarios in one graph, as shown in
Figure 11, we can see that the time required for the combined SDN-NFV network to complete the task is faster than that for the separate SDN and NFV networks, as shown in
Figure 18. We can understand this because on a combined SDN-NFV network, all configurations are performed centrally so as to minimize the need to configure or check individually for each device, which increase the deployment time and risks configuration errors and policy inconsistencies. In the research conducted by Awais et al. [
37], SDN is a technology that is intended to simplify network management. They also said that it enables complex network configuration and easy controlling through a programmable and flexible interface. It opens a new horizon for network application development and innovation. Currently, the development of SDN integration is very rapid with various endpoints or workloads. One of the most influential is virtualization; this point is very important in implementing SDN deployments because currently there are many technology developments that lead to it, so that tight integration between SDN and virtualization platforms is needed. Therefore, in our research, we are very concerned about the integration and segmentation policy in the SDN environment and virtualization, specifically NFV.


