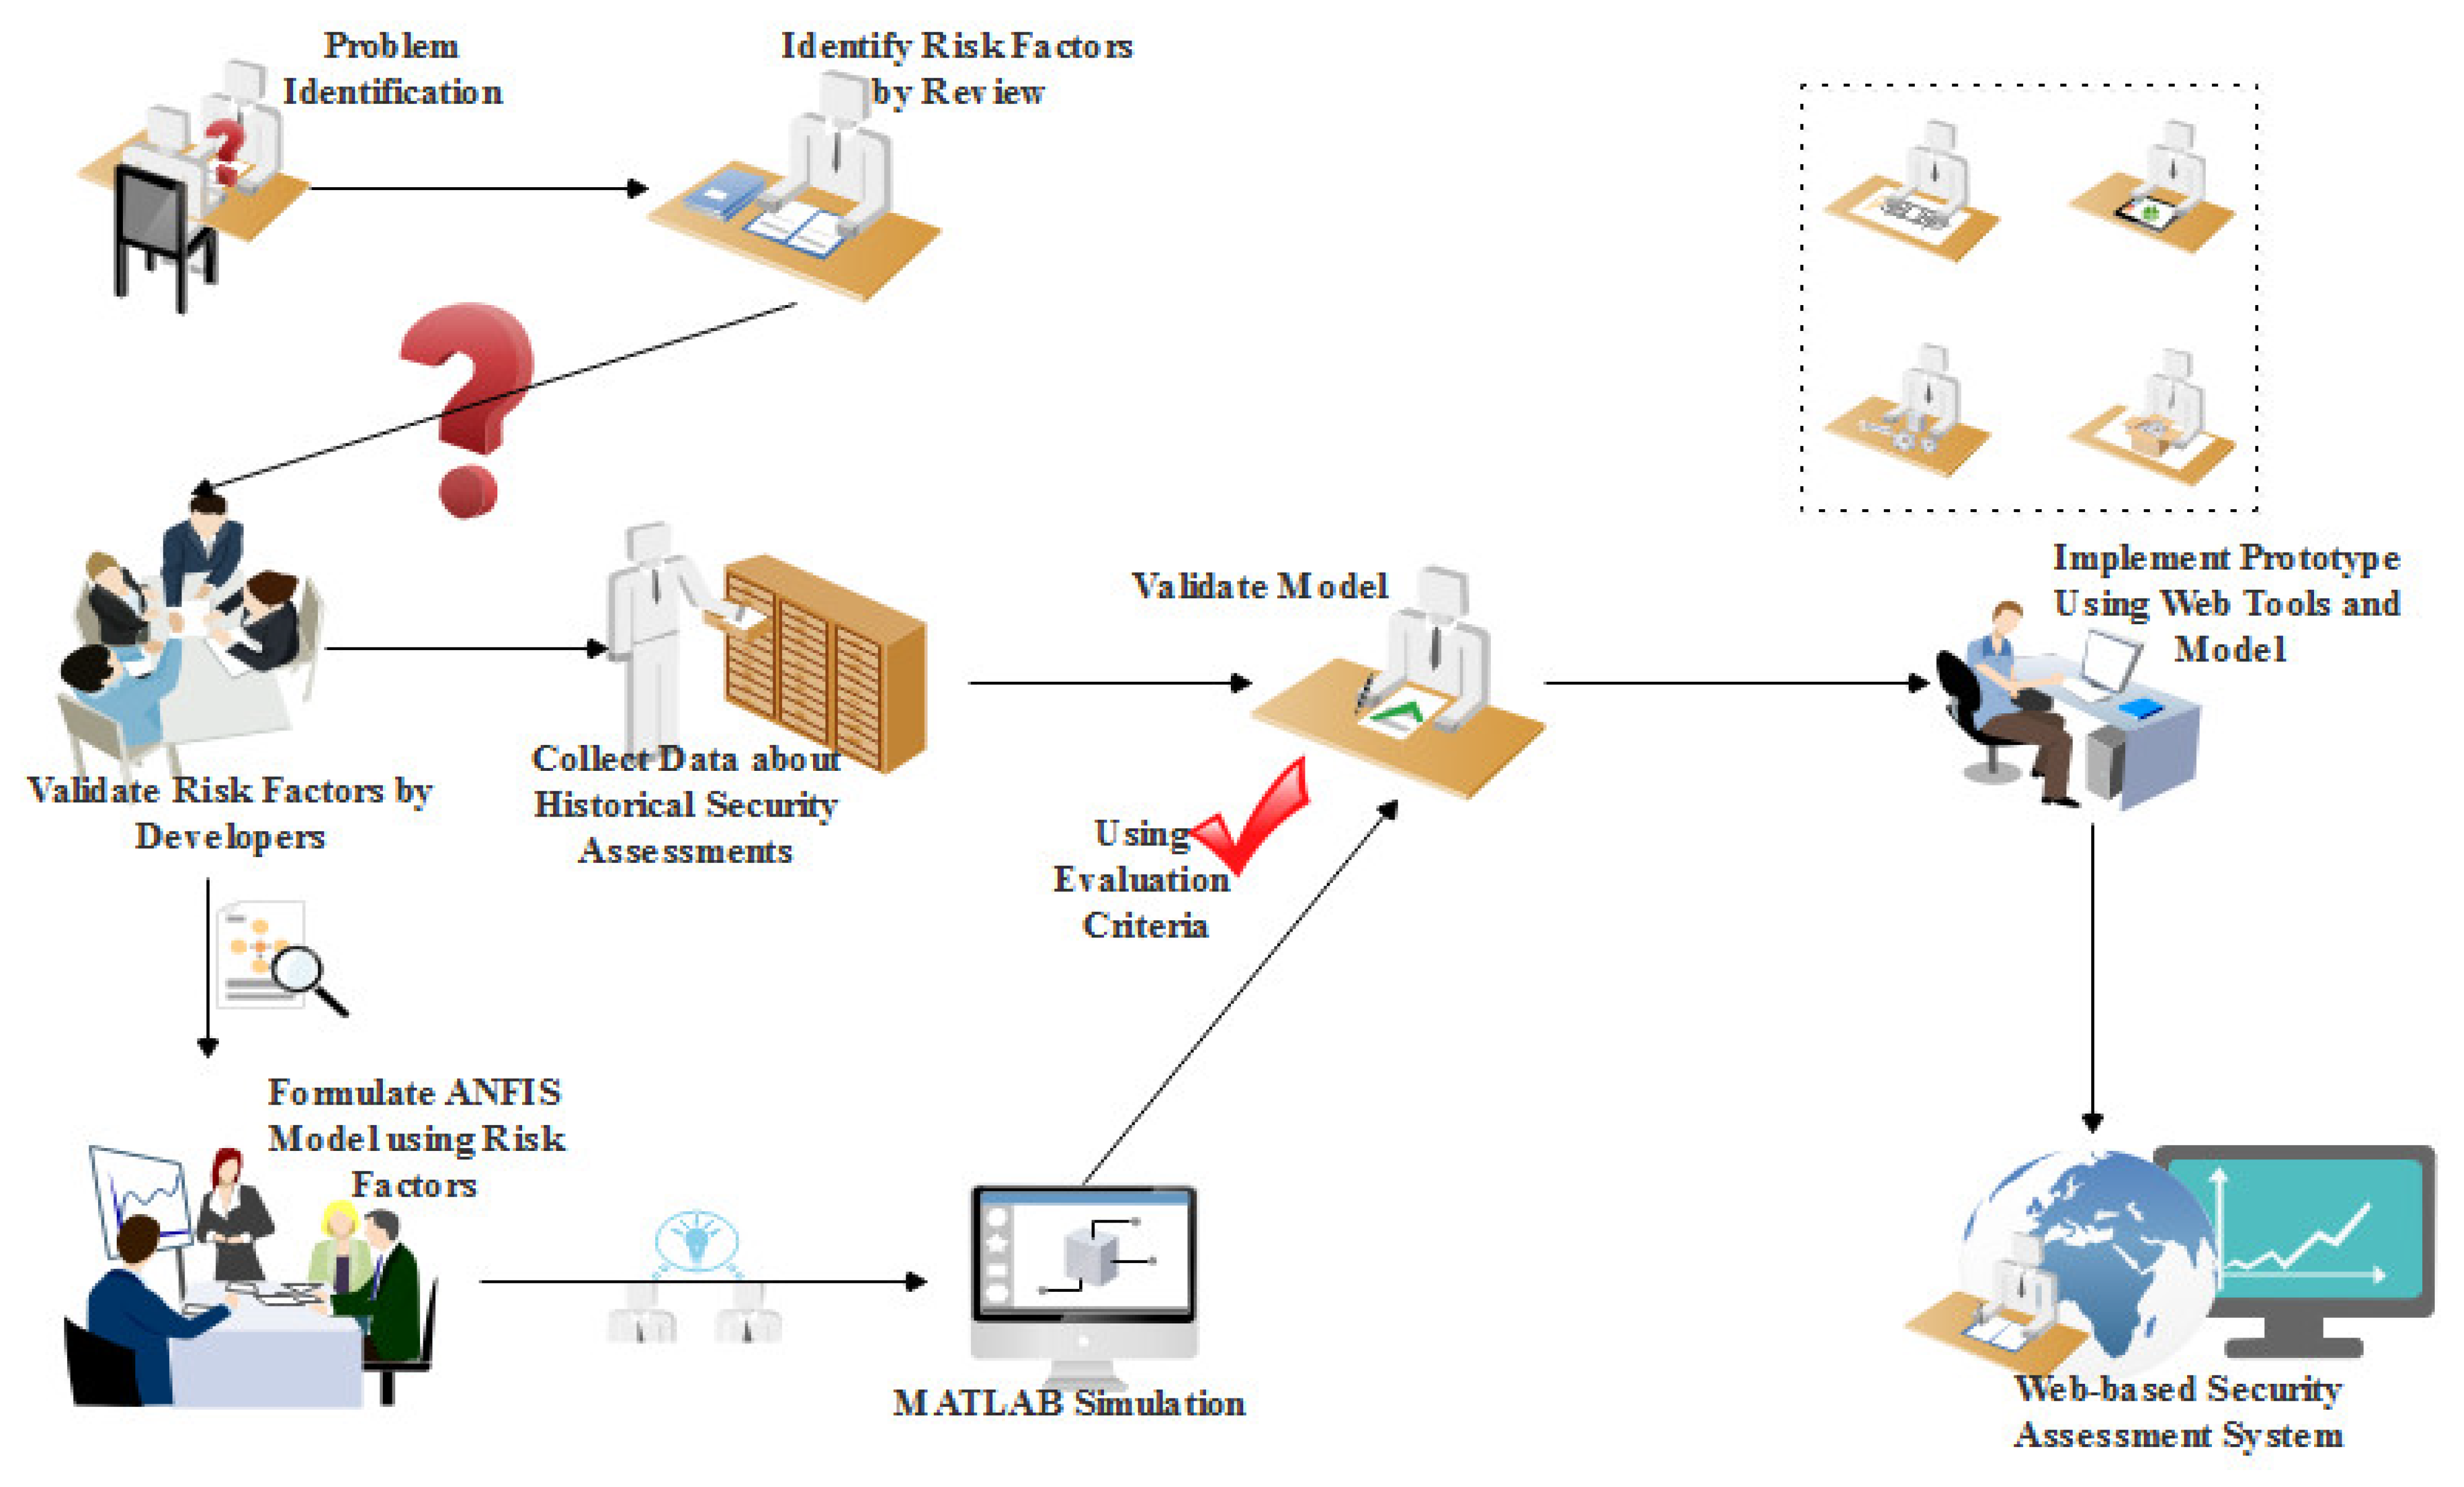
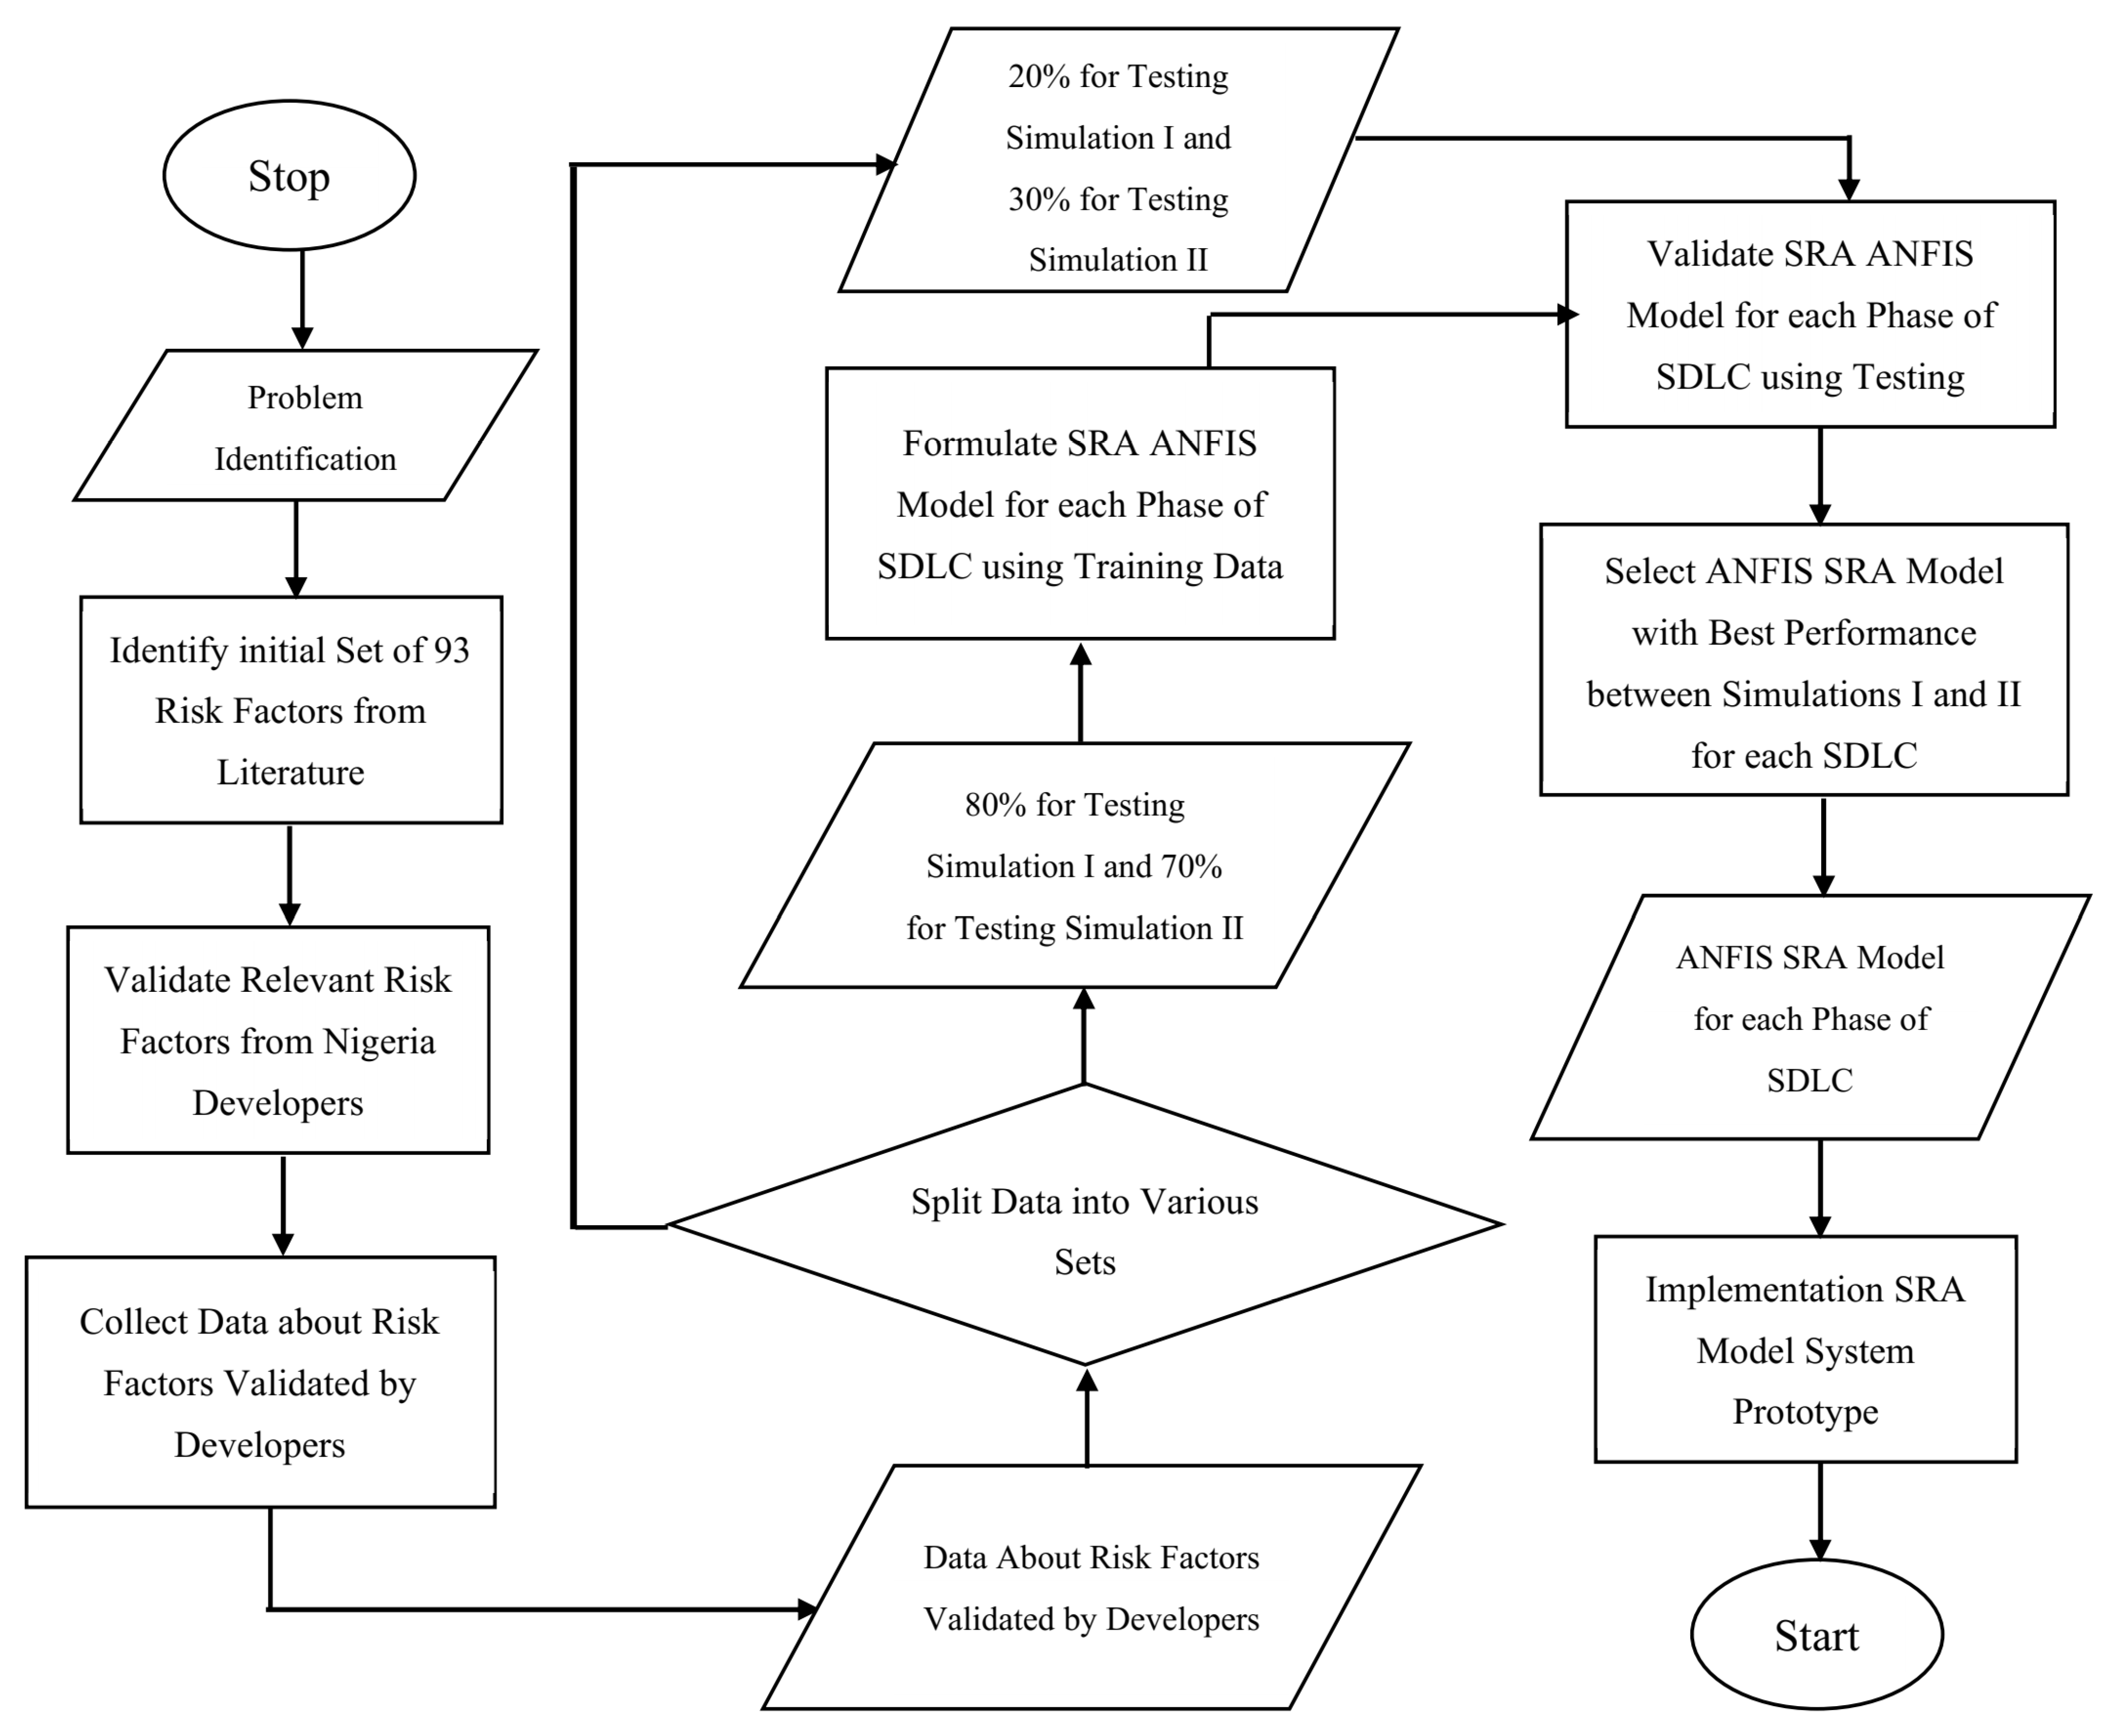
This section presents the validated various risks relating to the process of evaluating security risk based on information provided by the respondents in software development industries. The respondents selected the risks factors from the 93 used as the baseline risk categories using the questionnaires based on the background of software products designs in Nigeria contents as case study on under developing countries. We identified the risk indicators that were universally accepted by all developers using frequency distribution tables. Non-parametric tests were used to examine substantial discrepancies in the developers’ answers for those that the developers did not generally agree upon. Information about the follow-up questionnaire used to collect historical data required for the development of the ANFIS-based SRA model was also demonstrated for evaluating security risk at every stage of the SDLC.
4.1. The Results Regarding Software Development’s SRA Risk Factor Validation for Each Stage
Upon the distribution of the designed questionnaire to the respondents, the respondents answered to the survey by providing details on the risk factors for software development process, and provided the most suitable factors for evaluating the risks in Nigeria context.
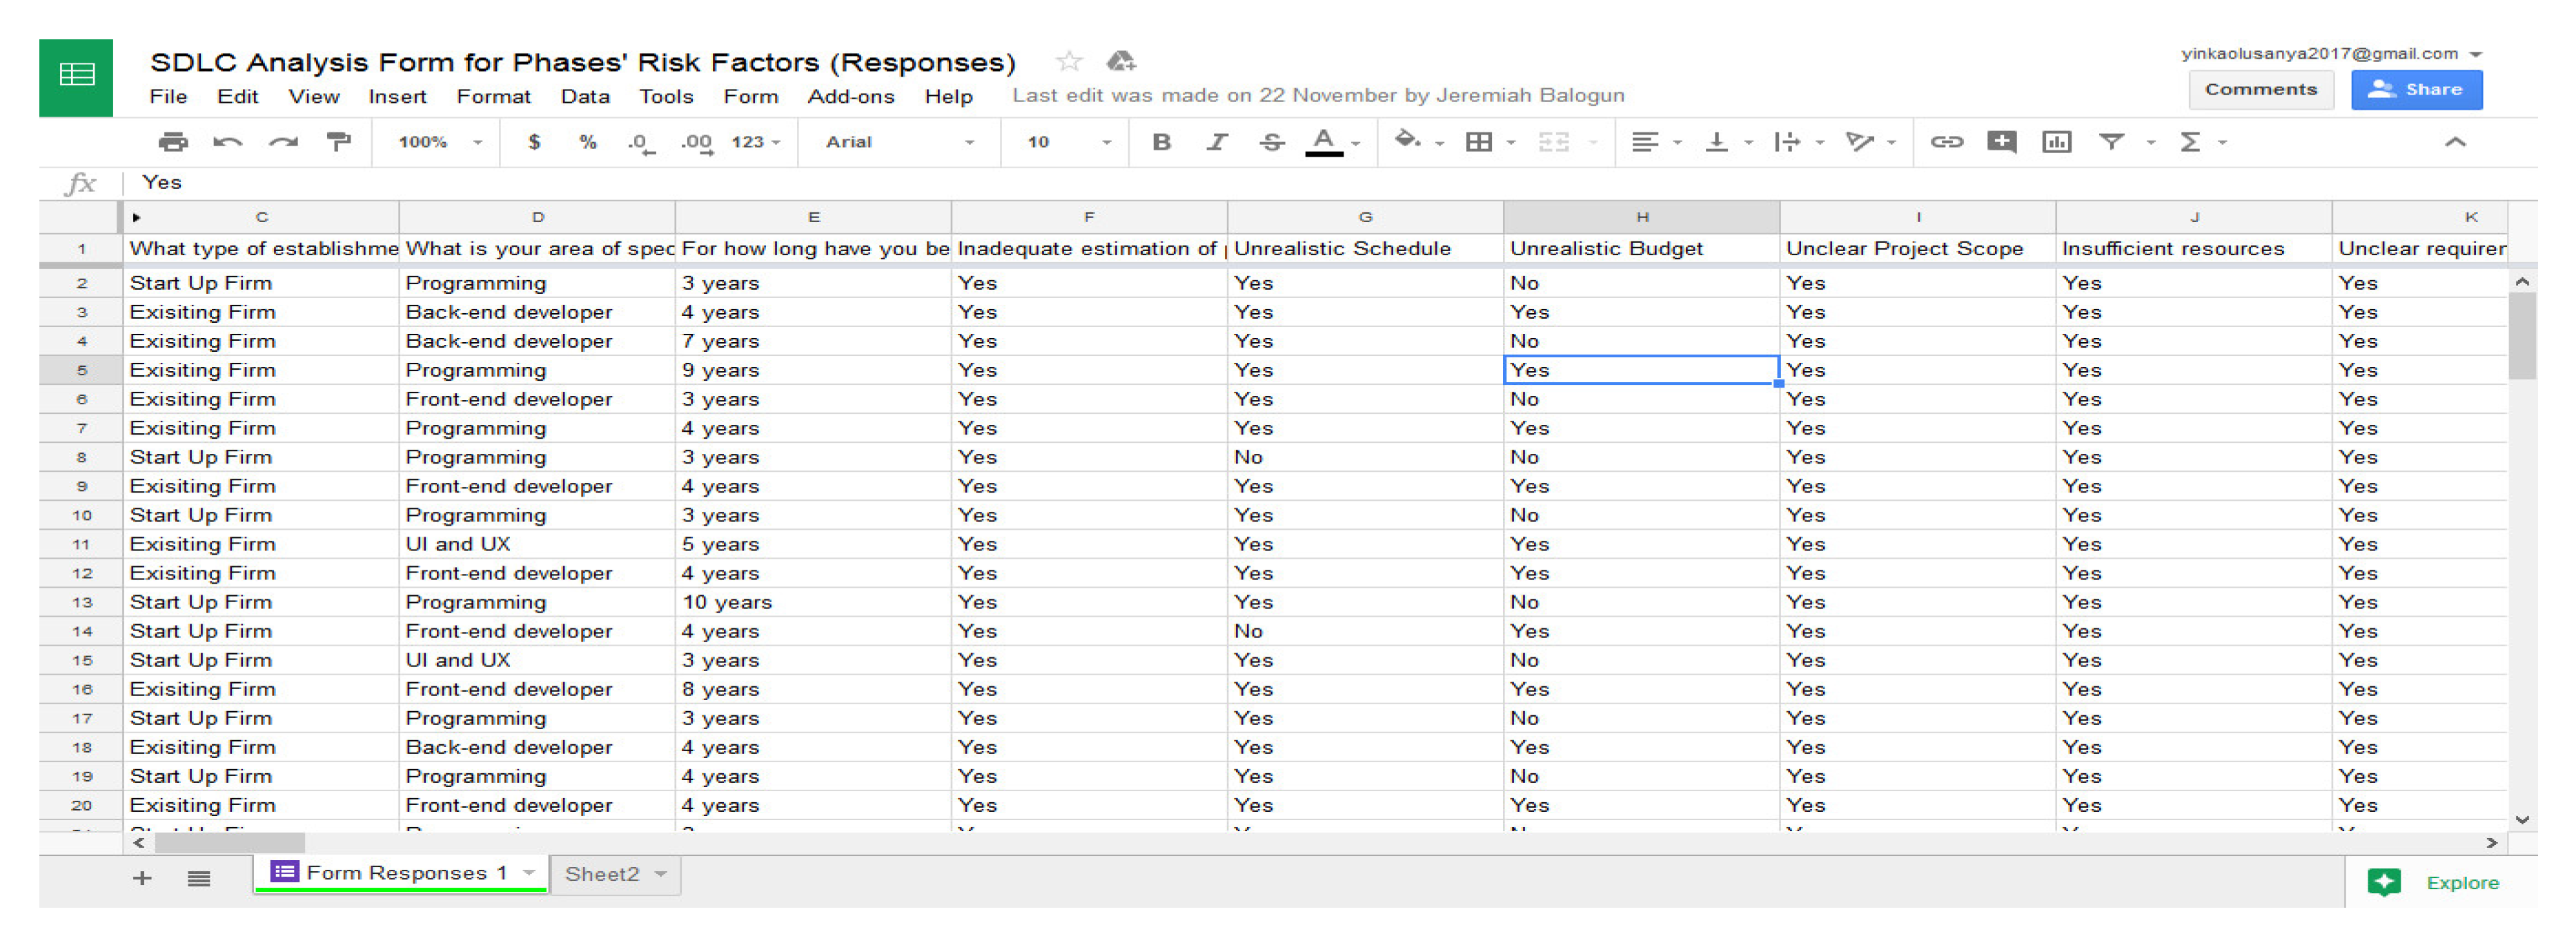
Figure 3 displays a screenshot of the survey replies provided by Google Sheets
®.
The risk factors that respondents did not select were not considered. Nevertheless, the findings of the percentage of developers that concur with the choice of risk factors for each stage was utilized to divide the risk factors into these three (3) groups:
- i.
The Risk Factors in High Priority: The risk elements that were deemed crucial for assessing the security risk of the SDLC process by all developers (100%); considering that there was no variation in the developers’ selection of the risk factors, these risk factors were taken into account but were not statistically examined;
- ii.
The Risk Factors in Low Priority: The risk categories that were not unanimously deemed necessary for each developer to evaluate the security risk of the SDLC process (<100%), non-parametric tests were used to determine the variations in responses of the developers depending on the types of organizations and specialty after these variables were eliminated but still taken into consideration for statistical analysis; and
- iii.
The Risk Factors in No Priority: The risk indicators that the developers chosen for this study did not concur with were eliminated and not taken into account for statistical analysis.
Table 6 displays the findings for the high priority risk categories that each software developer chosen using the designed questionnaire. From the initial 21 risk factors discovered, the findings of the selection of the pertinent risk factors taken into account throughout the requirements and definition stage revealed that 11 were deemed to be of high priority, 8 were deemed to be of low priority, 2 were regarded to be no-priority risk factors. The findings also indicated that, with the exception of unrealistic schedules, there was no statistical difference in replies depending on the kind of establishment when it came to the selection of risk factors with low importance.
The selection of pertinent risk factors taken into account throughout the SDLC design phase demonstrated that 8 of the 19 risk variables that were previously selected as high priorities, 6 were deemed to be of low priority, and 5 were labeled as risk factors with no priority. The findings also revealed a statistically significant variation in the diverse array of responses according to the type of establishment that they belong to. However, statistically no significant difference in the interpretation based on area of expertise of the respondents that fill the questionnaire.
The results of choosing the pertinent risk factors taken into account during the SDLC’s for execution and unit testing stage revealed that 9 of the 23 risk variables that were originally discovered were deemed to be of high priority, 3 risk factors were categorized as having no priority, while 11 was given a poor priority rating. The findings also revealed a significant discrepancy statistically based on the organization the respondents are working for. However, there was no noteworthy change statistically in the developers’ varying responses based on their area of expertise.
The outputs of choosing the pertinent risk factors taken into account during the SDLC’s system testing and amalgamation stage demonstrated that 4 of the 16 risk factors that were originally selected as high priorities, 1 risk factor was categorized as having no priority, while 11 were low priority. The findings also revealed a statistically significant variation in the diverse array of responses according to the type of establishment that they belong to. However, statistically no significant difference in the interpretation based on area of expertise of the respondents that fill the questionnaire.
The outputs of choosing the pertinent risk factors that were taken into account during the set-up and maintenance stage of the SDLC demonstrated that out of the 14 baseline risk factors, 6 were deemed to be of high priority, while 8 were deemed to be of low priority, and none were designated as risk factors with no priority. The findings further demonstrated that the response diversity did not statistically significantly, depending on the developers’ area of expertise. However, there was no noteworthy change statistically in the developers’ varying responses based on their area of expertise.
4.3. The Results of the Proposed ANFIS Enabled with SRA Model
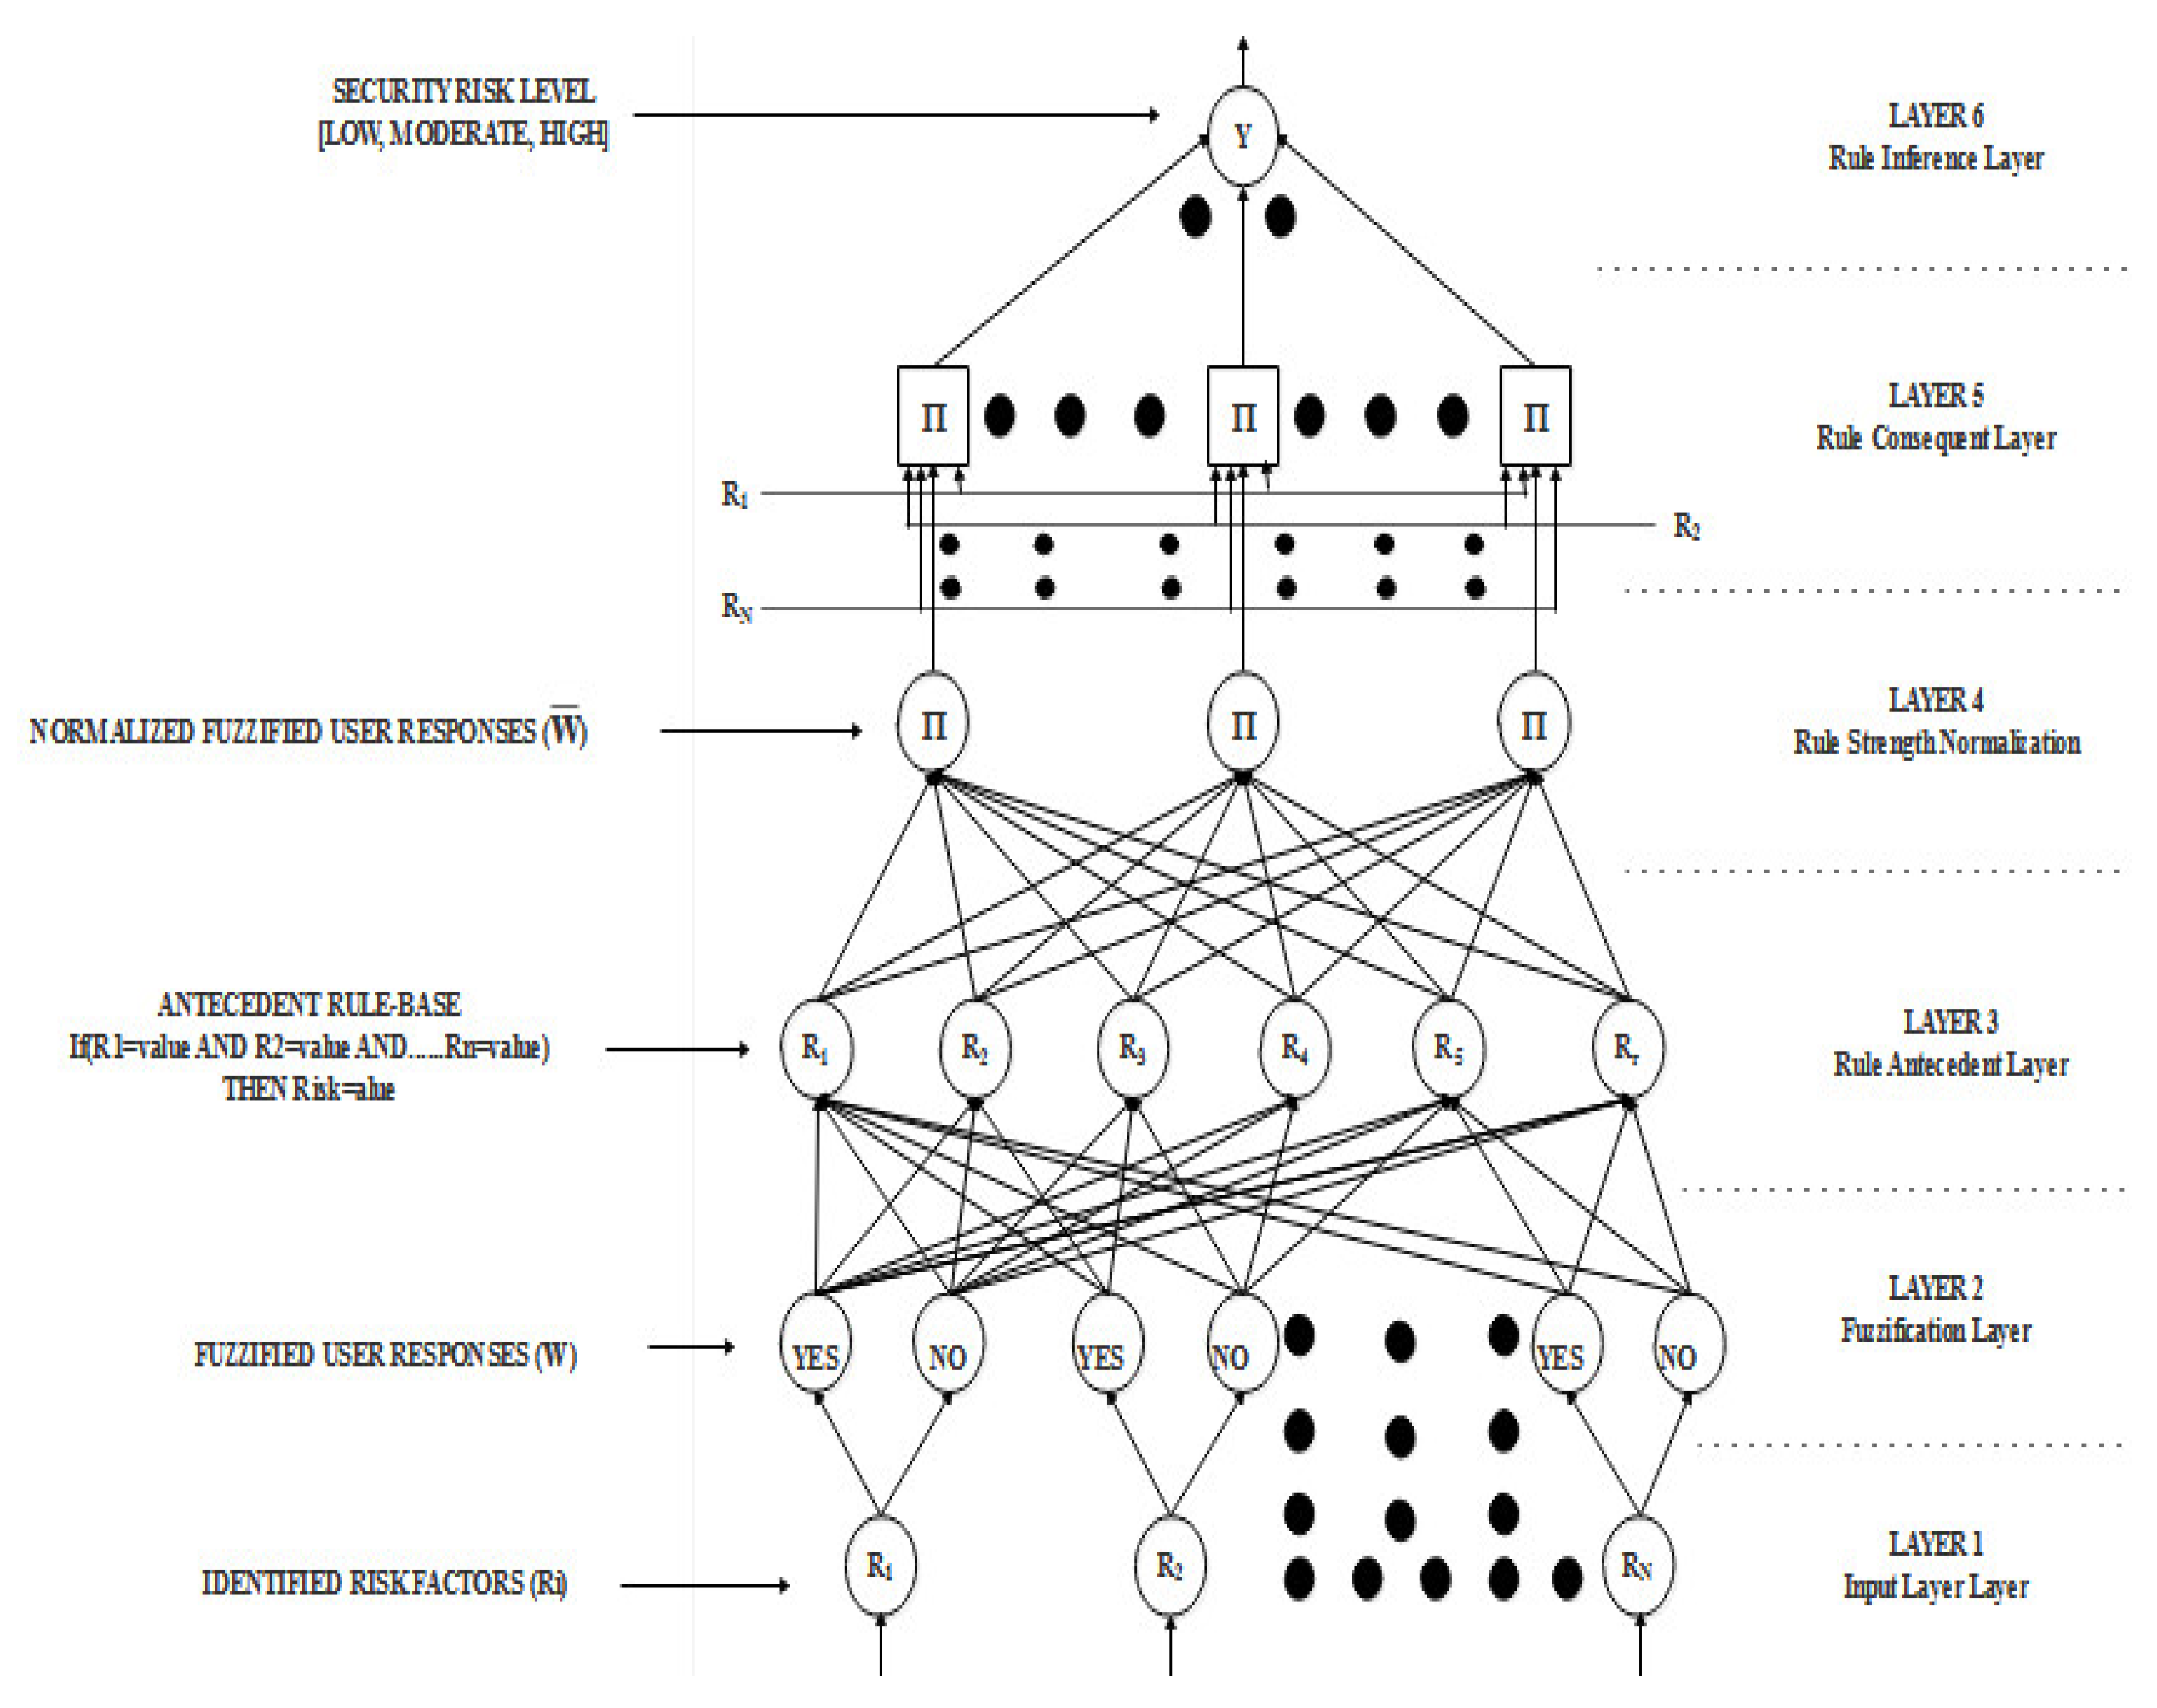
The results of the ANFIS model is presented in this section in accordance with the chosen risk factors in the preceding section. For each SDLC step that was identified, an SDLC security risk assessment model was created based on the proposed model. The proposed model first fuzzify each risk factor before processing it.
Figure 5 depicts the ANFIS model’s framework utilized the established SRA based on the factors identified in each SDLC process phase. The information flow from the point of input is depicted in the diagram (at the bottom) when the SRA for each stage was established fed the ANFIS model at the point of output (at the top).
The total amount of the user-provided information was calculated to established the each SRA for the SDLC phase. The greater the summation value, the greater the security risk as 1 was applied each time a user responded number that was equivalent to 1. The quantity of risk factors taken into account led to the highest sum being computed, afterwards split into three segments that serve as the threshold as indicated in Equation (1), however, the no-risk class is assigned 0 value. As a percentage of the phase output’s overall values, an interval was created using the various components.
For the risk assessment, four triangle membership functions with centers of 0, 1, 2, and 3 were developed for No, Low, Moderate and High-risk classes, respectively. The models were formulated such that a triangular membership function of the interval [−0.5, 0, 0.5] was assigned to the No risk class (Equation (4)), an interval of [0.5, 1, 1.5] were also assigned to the Low risk (Equation (5)), an interval of [1.5, 2, 2.5] were assigned to the Moderate risk (Equation (6)) while an interval of [2.5, 3, 3.5] was then assigned to the High-risk class (Equation (7)). The set of values used to allocate the security risk assessment variables was based on the amount of risk variables taken into account throughout each SDLC phase and distributed as shown in
Table 7.
The requirement analysis and definition phase’s SRA report revealed that 11 high-priority risk factors had been chosen. By assigning a value of 0 to No risk, the total value of 11 was divided between the Low, Moderate, and High-Risk classes. Therefore, no risk was assigned a linguistic value of 0, low risk was assigned a linguistic interval of [1.4], the moderate risk was assigned a linguistic interval of [5.8], and high risk was assigned a linguistic interval of [9.11]. Therefore, the linguistic value of 0 was assigned a fuzzy interval of [−0.5, 0, 0.5] for no risk, the linguistic interval of [1.4] was assigned a fuzzy interval of [0.5, 1, 1.5] for low risk, the linguistic interval of [5.8] was assigned a fuzzy interval of [1.5, 2, 2.5] for moderate risk while the linguistic interval of [9.11] was assigned a fuzzy interval of [2.5, 3, 3.5] for high risk.
The design phase’s SRA result revealed that 8 high priority risk factors had been chosen. By assigning a value of 0 to No risk, the total value of 8 was divided between the Low, Moderate, and High Risk classes. Therefore, no risk was assigned a linguistic value of 0, low risk was assigned a linguistic interval of [1.3], the moderate risk was assigned a linguistic interval of [4.6], and high risk was assigned a linguistic interval of [7.8]. Therefore, the linguistic value of 0 was assigned a fuzzy interval of [−0.5, 0, 0.5] for no risk, the linguistic interval of [1.3] was given a fuzzy interval of [0.5, 1, 1.5] for low risk, the linguistic interval of [4.6] was assigned a fuzzy interval of [1.5, 2, 2.5] for moderate risk while the linguistic interval of [7.8] was assigned a fuzzy interval of [2.5, 3, 3.5] for high risk.
The implementation and unit testing phase’s SRA result revealed that nine high-priority risk factors had been chosen. By assigning a value of 0 to No risk, the total value of 8 was divided between the Low, Moderate, and High-Risk classes. Therefore, no risk was assigned a linguistic value of 0, low risk was assigned a linguistic interval of [1.3], the moderate risk was assigned a linguistic interval of [4.6], and high risk was assigned a linguistic interval of [7.9]. Therefore, the linguistic value of 0 was assigned a fuzzy interval of [−0.5, 0, 0.5] for no risk, the linguistic interval of [1.3] was assigned a fuzzy interval of [0.5, 1, 1.5] for low risk, the linguistic interval of [4.6] was assigned a fuzzy interval of [1.5, 2, 2.5] for moderate risk. In contrast, the linguistic interval of [7.9] was assigned a fuzzy interval of [2.5, 3, 3.5] for high risk.
The output from the SRA during the system integration and testing phase indicated that 4 high-priority risk variables had been chosen. By assigning a value of 0 to No risk, the total value of 4 was divided between the Low, Moderate, and High-Risk classes. Therefore, no risk was assigned a linguistic value of 0, low risk was assigned a linguistic interval of [1.2], moderate risk was assigned a linguistic value of 3 and high risk was assigned a linguistic value of 4. Therefore, the linguistic value of 0 was assigned a fuzzy interval of [−0.5, 0, 0.5] for no risk, the linguistic interval of [1.2] was assigned a fuzzy interval of [0.5, 1, 1.5] for low risk, the linguistic value of 3 was assigned a fuzzy interval of [1.5, 2, 2.5] for moderate risk while the linguistic value of 4 was assigned a fuzzy interval of [2.5, 3, 3.5] for high risk.
The operation and maintenance stage results revealed 6 high-priority risk variables had been chosen. By assigning a value of 0 to No risk, the total value of 6 was divided between the Low, Moderate, and High-Risk classes. Therefore, no risk was assigned a linguistic value of 0, low risk was assigned a linguistic interval of [1.2], the moderate risk was assigned a linguistic interval [3.4], and high risk was assigned a linguistic interval of [5.6]. Therefore, the linguistic value of 0 was assigned a fuzzy interval of [−0.5, 0, 0.5] for no risk, the linguistic interval of [1.2] was assigned a fuzzy interval of [0.5, 1, 1.5] for low risk, the linguistic interval of [3.4] was assigned a fuzzy interval of [1.5, 2, 2.5] for moderate risk. In contrast, the linguistic interval of [5.6] was assigned a fuzzy interval of [2.5, 3, 3.5] for high risk.
4.5. Results of Historical Data Collected Using Follow-Up Questionnaire
Following the evaluation of the risk variables’ validity, we observed that they are required to assess the security risk assessment of the different phases of the system development life cycle (SDLC). The follow-up questionnaires distributed across 309 software developers selected from various IT establishments and with varying specialties and age groups are presented.
Table 9 shows the distribution of the follow-up questionnaires across the respondents selected based on the establishments they belonged to.
Following the collection of the questionnaire distributed for this study, it was observed that the majority were distributed among respondents selected from a number of sources who refused to be disclosed and were referred to as general, with a proportion of 64.7%. This was followed by respondents selected from PyCOM-NG and SIDMACH with a proportion of 9.1% each, APTECH with a proportion of 4.9%, TASUED with a proportion of 4.5%, CC-HUB with a proportion of 3.6%, NCS with a proportion of 3.2% and IFE with a proportion of 0.97%. Following the respondents’ responses regarding each set of risk factors that were used to assess the SRA of each phase of the SDLC process, some observations were made about the responses of the respondents selected from each establishment. Also, the responses made were used to assess the level of security risk based on the number of responses for Yes and No provided by the respondents.
It was observed in the requirements phase results that the majority of the assessments of the responses from APTECH, NCS, PyCOM-NG, and TASUED had no security risk while the majority of the assessments of the responses from CCHUB, IFE, General, and SIDMACH had low-security risk. However, some of the assessments of the responses from CC-HUB, General, IFE, PyCOM-NG, and SIDMACH had a moderate security risk. The results of the design phase showed that the majority of the assessment of the responses from APTECH, NCS, PyCOM-NG, and TASUED had no security risk, while the majority of the assessments of the responses from CC-HUB, General, IFE, and SIDMACH had a low-security risk. However, some of the assessments of the responses from General, PyCOM-NG, and SIDMACH had a moderate security risk. Also, high risk was assessed from a respondent each among General, PyCOM-NG, and SIDMACH respondents.
The results of the implementation phase revealed that the majority of the assessment of the responses from APTECH, NCS, PyCOM-NG, and TASUED had no security risk, while the majority of the assessments of the responses from CCHUB, General, IFE, and SIDMACH had a low-security risk. However, some of the assessments of CC-HUB, General, IFE, PyCOM-NG, and SIDMACH had moderate security risk, while the high-security risk was assessed from a respondent in PyCOM-NG. The results of the integration phase revealed majority of the assessment of the responses from APTECH, CC-HUB, General, NCS, PyCOM-NG, SIDMACH, and TASUED had no security risk. In contrast, the majority of the assessments of the responses from IFE had a low-security risk. However, some of the assessments of the responses from CCHUB, General, PyCOM-NG, and SIDMACH had moderate security risk while the high-security risk was assessed from respondents in PyCOM-NG and SIDMACH.
The results of the operation phase indicated that the majority of the assessment of the responses from APTECH, IFE, NCS, PyCOM-NG, SIDMACH, and TASUED had no security risk while the majority of the assessments of the responses from General low-security risk and an equal majority of the assessments of responses from CCHUB had None and Low-security risks. However, some of the assessments of the responses from CCHUB, General, IFE, PyCOM-NG, SIDMACH, and TASUED had moderate security risk while the high-security risk was assessed from respondents among General and PyCOM-NG.


