Article

Natural Language Processing and Cognitive Networks Identify UK Insurers’ Trends in Investor Day Transcripts

CogNosco Lab, Department of Computer Science, University of Exeter, Exeter EX4 4PY, UK
*
Author to whom correspondence should be addressed.
Future Internet 2022, 14(10), 291; https://doi.org/10.3390/fi14100291
Submission received: 19 September 2022 / Revised: 8 October 2022 / Accepted: 10 October 2022 / Published: 12 October 2022
(This article belongs to the Special Issue Information Networks with Human-Centric AI)

Abstract

:
The ability to spot key ideas, trends, and relationships between them in documents is key to financial services, such as banks and insurers. Identifying patterns across vast amounts of domain-specific reports is crucial for devising efficient and targeted supervisory plans, subsequently allocating limited resources where most needed. Today, insurance supervisory planning primarily relies on quantitative metrics based on numerical data (e.g., solvency financial returns). The purpose of this work is to assess whether Natural Language Processing (NLP) and cognitive networks can highlight events and relationships of relevance for regulators that supervise the insurance market, replacing human coding of information with automatic text analysis. To this aim, this work introduces a dataset of N I D T = 829 investor transcripts from Bloomberg and explores/tunes 3 NLP techniques: (1) keyword extraction enhanced by cognitive network analysis; (2) valence/sentiment analysis; and (3) topic modelling. Results highlight that keyword analysis, enriched by term frequency-inverse document frequency scores and semantic framing through cognitive networks, could detect events of relevance for the insurance system like cyber-attacks or the COVID-19 pandemic. Cognitive networks were found to highlight events that related to specific financial transitions: The semantic frame of “climate” grew in size by +538% between 2018 and 2020 and outlined an increased awareness that agents and insurers expressed towards climate change. A lexicon-based sentiment analysis achieved a Pearson’s correlation of ρ = 0.16 ( p < 0.001 , N = 829 ) between sentiment levels and daily share prices. Although relatively weak, this finding indicates that insurance jargon is insightful to support risk supervision. Topic modelling is considered less amenable to support supervision, because of a lack of results’ stability and an intrinsic difficulty to interpret risk patterns. We discuss how these automatic methods could complement existing supervisory tools in supporting effective oversight of the insurance market.

1. Introduction

The Prudential Regulation Authority (“PRA”) is the UK’s financial regulator with responsibility for prudential oversight of the insurance industry [1]. It regulates around 300 general insurers that write over £ 100 billion of premiums each year; covering everything from the motor, household, and pet insurance for retail customers, to the largest financial risks of global corporations [2]—for example, business interruption costs following natural catastrophes, such as hurricanes, or human-made disasters, such as terrorism. Identifying, monitoring, and ranking these events is critical to ensure that limited resources are focused on the firms, or sectors.
Today, this supervisory planning, relies on quantitative reporting (regulatory returns [3]) and supervisory judgement [1,2]. In the latter case, this will typically be informed by meetings with a firm’s senior management and interpreting large volumes of unstructured reports—for example, Board reports and minutes. The purpose of this work is to establish whether Natural Language Processing (NLP) techniques [4] can be adopted, enabling a systematic approach to analysing unstructured reports—e.g., extracting key topics and sentiment—thereby helping to monitor and identify firms with higher prudential risk [1]. Automatic NLP approaches could complement existing quantitative and qualitative assessments, based on numerical data [2], and help resource allocation, focusing more resources on those insurers described by more alarming text or associated more strongly with negative events. For regulators, the potential insights and hence benefits of NLP can be considered in mainly two areas as described below.
Firstly, NLP approaches might help identify emerging market issues: Some risks such as the increase in cyber-crime can hit the headlines and are relatively easy to be identified by humans engaging in knowledge search through information platforms [5]. For this reason, many studies about market fluctuations have focused on social/news media analysis to predict financial patterns, like shocks in stock prices [6,7,8]. Other topics might give rise to niche or underground debates, e.g., health practice [9,10]: These topics might be more uncommonly discussed across media channels and thus become more difficult to be identified by monitoring social/news systems [10]. In this regard, NLP approaches enhanced by cognitive science [11] might help identify market perceptions towards the insurance sector. Understanding “the market’s” view of an insurer or the sector is important in judging to what extent investors are willing to provide additional funding following an adverse event [2,12]. This view can be reconstructed by considering mostly two elements [13,14,15]: (i) the semantic content describing specific features of the view (e.g., identify disgruntled market analysts), and (ii) the affective content brought by these features (e.g., protesting inspiring negative feelings). In computer science, positive or negative attitudes are mapped within the idea of “sentiment” [7,16], which broadly overlaps with “valence” in psychology [15,17], i.e., how pleasantly or unpleasantly a concept is perceived. In this paper, sentiment and valence will be used as synonyms, like in previous works [17,18,19]. A persistent negative sentiment could concern supervisors [20], as it suggests an increase in the risk that investors may no longer support a financially weak insurer. In a banking context, Gandhi & colleagues [21] identified that more negative sentiment scores are associated with larger de-listing probabilities, lower odds of paying subsequent dividends, and higher subsequent loan loss provisions. By combining keyword extraction, sentiment analysis and network science, can NLP techniques unveil the key themes and sentiment patterns that would help insurance supervisors prioritise areas of focus? For instance, can such techniques help supervisory decisions on whether to prioritise more time on understanding cyber-attacks, inflation, or climate change-related issues? A second element of relevance to this study is the identification of risk-profile similarities across different insurers. Understanding what insurers talk about in their reports is important to supervisors, as such knowledge can identify what events that insurer has faced or is going to face in the future [2,3]. For example, a motor insurer is exposed to a severe winter potentially resulting in a significant increase in car accidents; in contrast, a satellite insurer will be exposed to possible electrical failures on launch. In practice, supervisors, in making judgments, group and benchmark their firm against those they believe have a similar risk profile [22]. Such groupings are based on a mixture of quantitative and qualitative factors. Can NLP provide a systematic, unbiased perspective identifying similar ways in which insurers discuss risk-related events, based on textual data alone as communicated and recorded in investor day transcripts?
This manuscript explores the above two research questions by using several NLP techniques, enriched by cognitive networks, i.e., representations of associative knowledge where concepts are represented as nodes and linked according to conceptual associations [11,15,23,24]. Whereas most NLP methods are excellent in producing model outputs (e.g., identifying keywords) they provide little insight into the organisation of knowledge in language [15,25].
This paper explores NLP/cognitive network techniques in addressing the above two research directions:
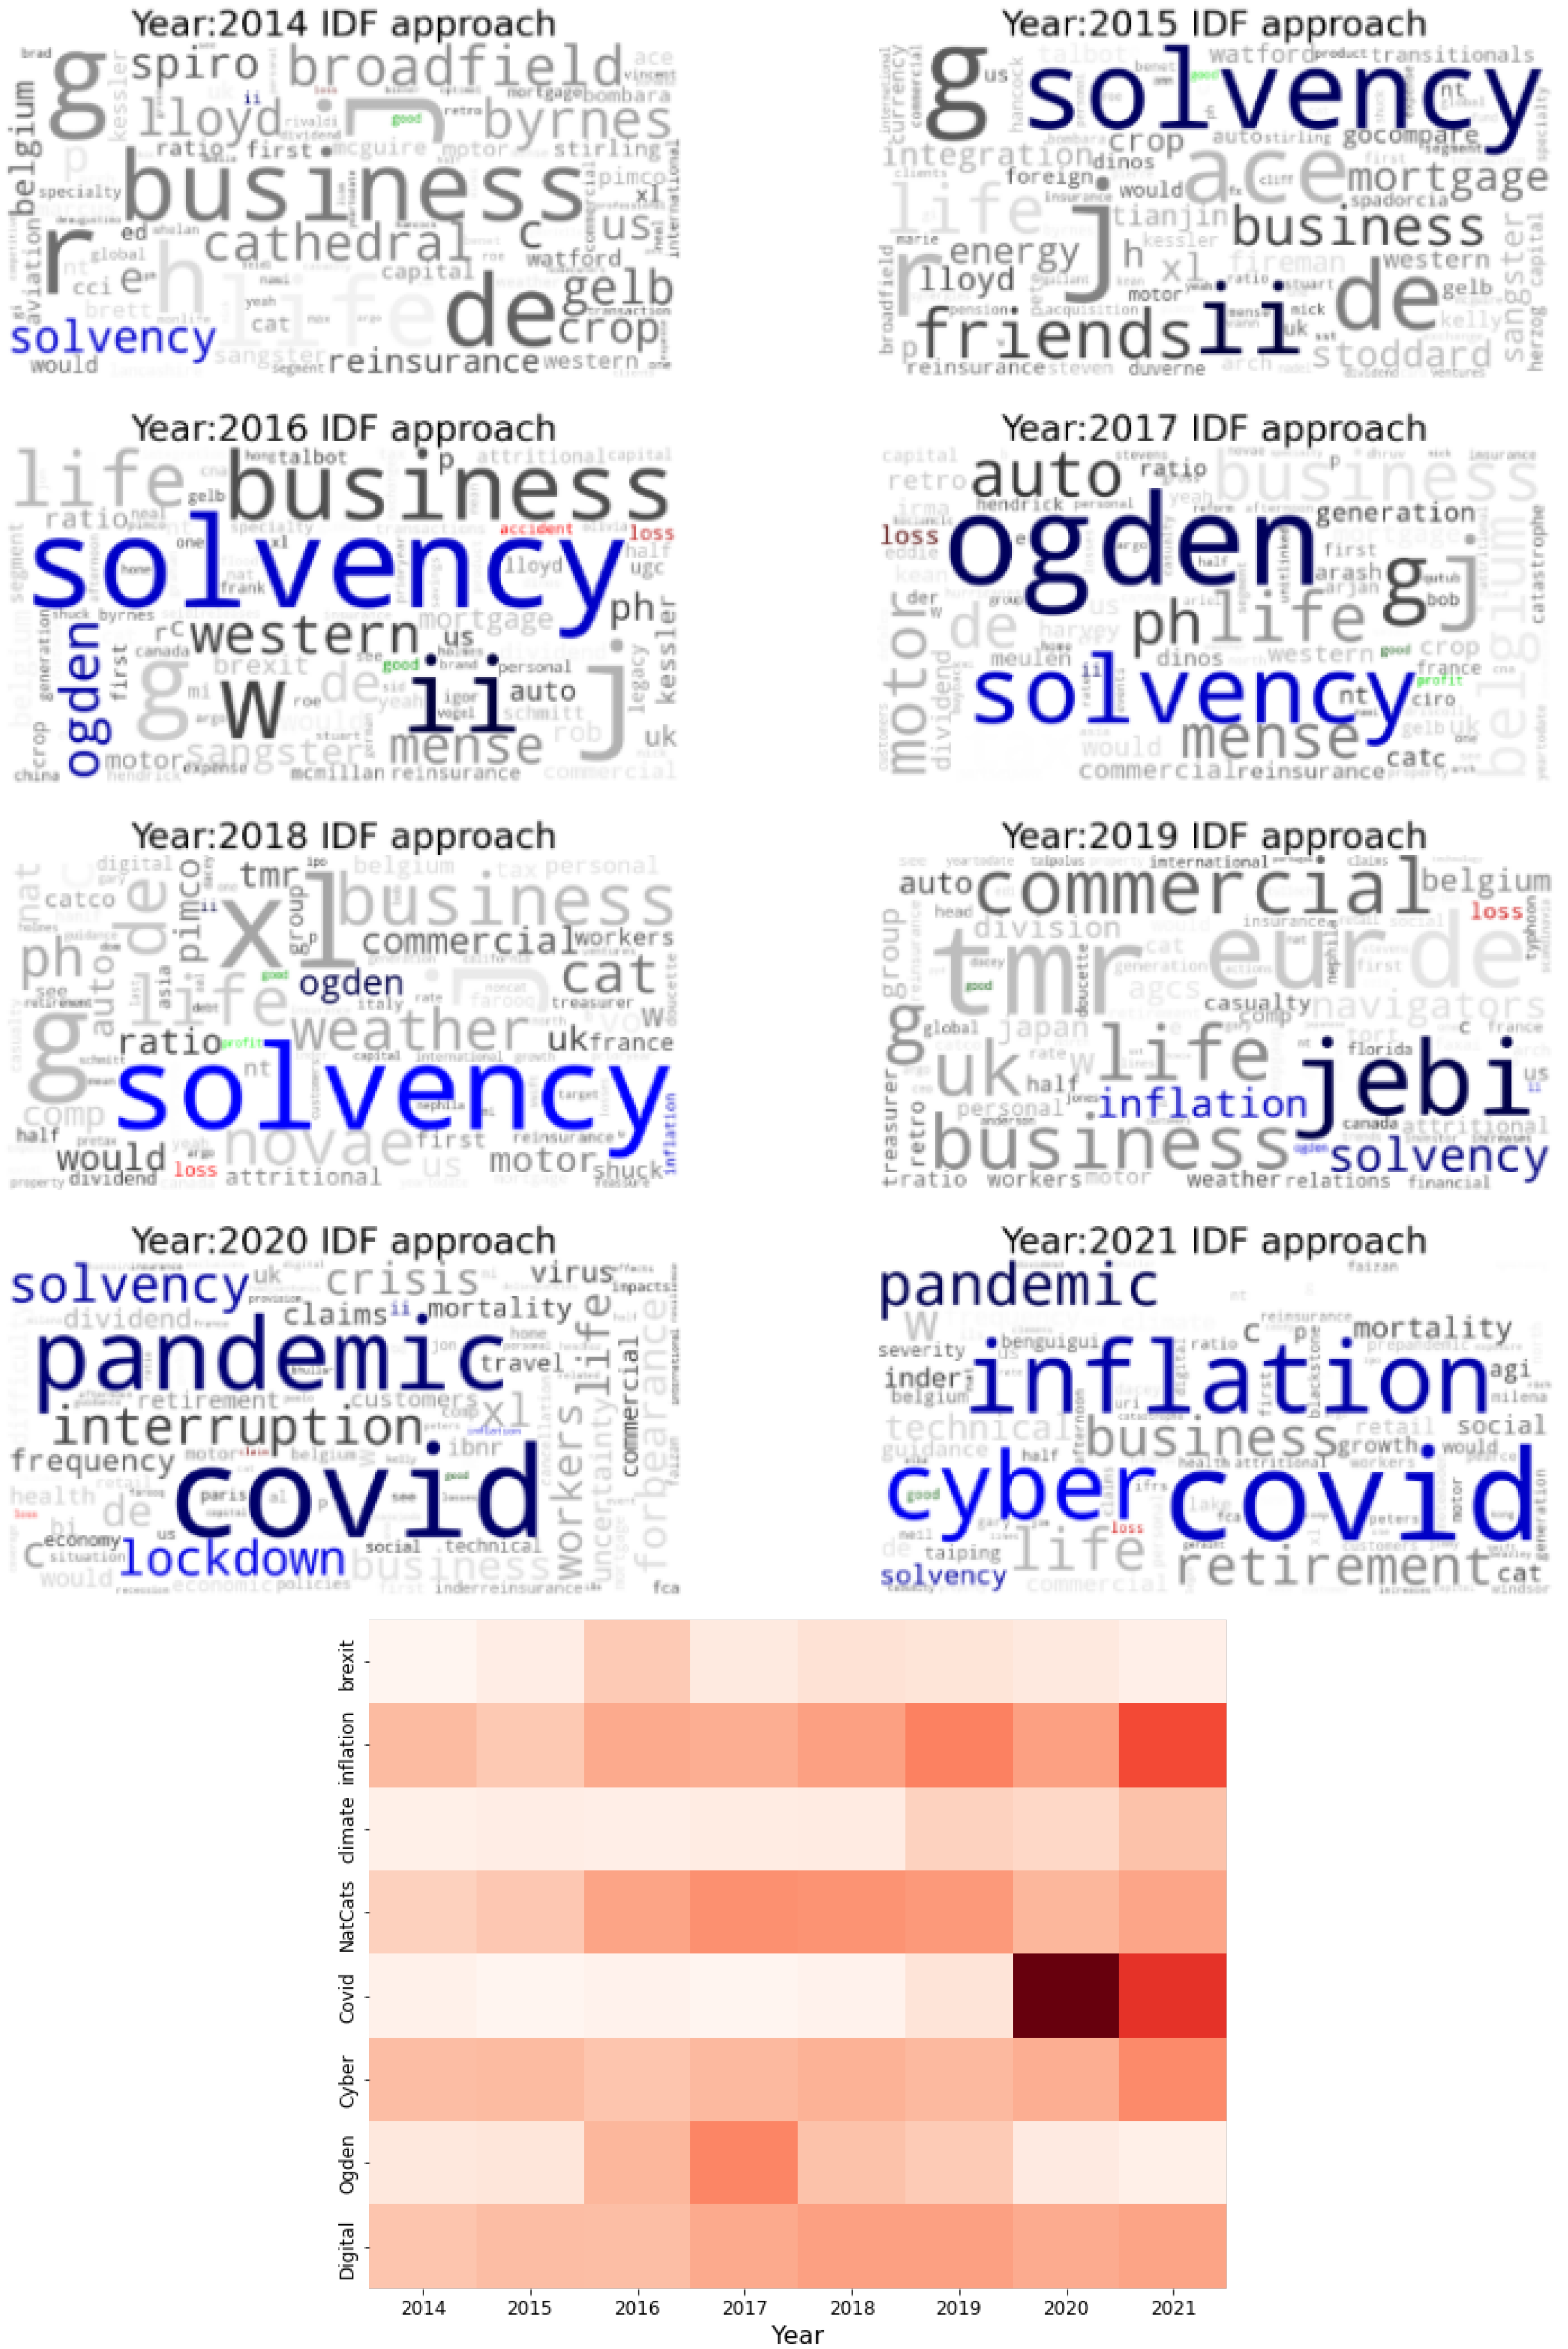
  • Uni-grams enhanced by Term Frequency - Inverse Document Frequency (TF-IDF) scores [26], and complemented with semantic network analysis, are used to identify emerging market issues;
  • A lexicon-based sentiment analysis, analogous to VADER [18], is used to identify the market analysts’ perception of the insurance industry;
  • Topic modelling, via a Latent Dirichlet Allocation (LDA) approach [4], explores whether the allocation of each insurer to a specific group aligns with or challenges existing perspectives on peer groups.
Let us briefly discuss why we selected the above methodological approaches:
  • The purpose of word/phrase automated extraction is to identify important topics in a given document [4]. According to Cavusoglu [27] there are three major methods for keyword extraction: (i) rule-based linguistic approaches, which usually rely on syntactic relationships and human coding [14]; (ii) statistical approaches, e.g., counting word frequency; and (iii) machine learning approaches, which usually require some prior knowledge for unsupervised learning or training data [4]. This paper explores statistical techniques using n-gram statistics, word frequency, and the TF-IDF measure because these techniques require no domain knowledge. The paper also explores a rule-based approach adopted from cognitive network science [19], which represents domain knowledge as a network of conceptual associations and enables greater contextual information.
  • The purpose of sentiment analysis is to determine the degree of positivity, negativity, or neutrality of transcripts that provide insight on analyst opinions towards insurers. This work uses the financial lexicon provided by Loughran and McDonald [28] (referred to as the “Loughran lexicon”) to identify sentiment. This lexicon was based on VADER’s approach [18], i.e., attribute a sentiment score to each word in a text and then compute an overall sentiment score for the whole text based on single scores and simple grammatical rules. The Loughran lexicon was specifically developed for data mining financial articles to address the fact that almost 3 out of 4 negative words in common language are typically not rated negative in a financial context (see [28]). Jairo and colleagues [29] have shown that the Loughran lexicon outmatched VADER and other approaches in predicting the sentiment of financial texts. Importantly, the Loughran lexicon provides predictions of the polarity of the content (i.e., whether it contains mainly positive or negative sentiments) and a subjectivity score that assesses the extent to which the text data is based on facts or opinions.
  • LDA is a family of unsupervised learning algorithms that identify hidden relationships between words used across several documents. No prior knowledge of topics or themes is usually required and LDA can infer collections of words consistently co-appearing together across documents, i.e., topics [4]. This paper examines whether LDA can identify similar firms based on the identified topics.

Relevant Literature

To the best of our knowledge, there is no directly related research that considers textual analysis to support the identification of prudentially relevant events specifically within the insurance sector. Instead, the most relevant research considers the extent to which textual information is able to predict stock prices across sectors [6,7,8]—such analysis is similar, but not identical, to identify firms that may be facing more negative events. For example, stockholders may reward a high-risk strategy that delivers excess returns, but which may disregard the interests or events discussed by policyholders in official transcripts. Boudouk and colleagues using advances in NLP—specifically the ability to identify relevance and tone (i.e., sentiment) of news—conclude that “market model R-squared are no longer the same on news versus no news days” [30]. Tetlock identifies that high media pessimism predicts downward pressure on market prices, but this is followed by reversion to fundamentals over longer periods—suggesting only short-term prediction is possible [31]. Heston and Sinha conclude that “daily news predicts stock returns for only one to two days, confirming previous research. Weekly news, however, predicts stock returns for one quarter.” [32]. In another study, Sinha’s findings “suggest the market underreacts to the content of news articles” [33]. In a related context, Tetlock and colleagues [34] looked at the relationship between language and a company’s earnings, and concluded that “the fraction of negative words in firm-specific news stories forecasts low firm earnings”. More recently, at a macro-economic level, Petropoulos and Siakoulis used NLP techniques coupled with machine learning (i.e., XG Boost) to generate a sentiment index that signals market turmoil with higher-than-random accuracy when trained on Central Bank speeches [35]. These studies provide converging evidence that textual data can contain insights useful for predicting market signals, thus encouraging further research about using NLP techniques for assessing risk profiles in insurance data.
NLP methods can be integrated by cognitive network science, a field that is growing quickly at the interface of psychology and computer science [23,36]. Cognitive networks are models that can map how concepts are organised and associated in cognitive data like texts, e.g., social media posts [5,14,19], movie transcripts [37] and books [25,38,39]. The structure of cognitive networks was shown to highlight key cognitive patterns like writing styles [39], alterations to cognition due to psychedelic drugs [36], and, relevantly for this work, it could reconstruct the semantic and emotional content of online perceptions towards to gender gap in science [15] and COVID-19 vaccines [5,40]. In text analysis, cognitive networks are advantageous for reconstructing the semantic frame of a target concept, i.e., the set of words appearing in the same context of the target and specifying its meaning [13,14]. In a network representing syntactic relationships between words, this semantic frame can be mapped onto the set of words adjacent to a given target one [5,15]. We follow a similar approach, reconstructing a network of word associations in insurance reports (both from analysts and insurers) and investigating target words by analysing their semantic frames/network neighborhoods. This quantitative pipeline will reconstruct specific perceptions of insurance jargon over the years. Cognitive networks have also been used in conjunction with sentiment analysis [19] to identify positive/negative perceptions about the COVID-19 lockdown in social media.
Sentiment analysis can be performed in many different ways. The simpler approaches are lexicon-based techniques [31], which then progressed to rule-based extraction approaches that attempt to capture phrase-level sentiments [30]. More recent research [32,33] deploys machine learning techniques, such as recurrent neural networks, to dynamically classify and identify sentiment. In absence of training data for the insurance reports considered here, this paper adopts the more straightforward lexicon-based approach.
Topic modelling is relative to identifying collections of words that are thematically referring to specific aspects of discourse, e.g., a social media conversation about politics might focus on topics like political issues, engagement and social challenges [41]. In LDA, each topic represents an unstructured mixture of words [42]: Each word is endowed with a statistical probability of co-occurring with other words in the same topic and with other words across other topics. In this way, each topic represents a distribution. The adoption of LDA techniques in investigating insurance reports is relatively fragmented. An insurance-related use of topic modelling was set out by Wang and Xu [43]. The authors used LDA to support the identification of fraudulent claims, raising some concerns about a lack of stability of results. Beyond this example, to the best of our knowledge, we are not aware of any research that uses topic modelling, or specifically the LDA, for identifying insurers that are exposed to similar risks/events. This represents an interesting research gap for our quantitative exploration.
The above literature review outlines our approach to the investigation of textual data for supporting event identification in the insurance sector. The manuscript proceeds with a Materials and Methods section, where we report on data and algorithms, a Results section, organised across different studies, and a Discussion section, where the pros and cons of our approach are discussed alongside relevant literature.

2. Materials and Methods

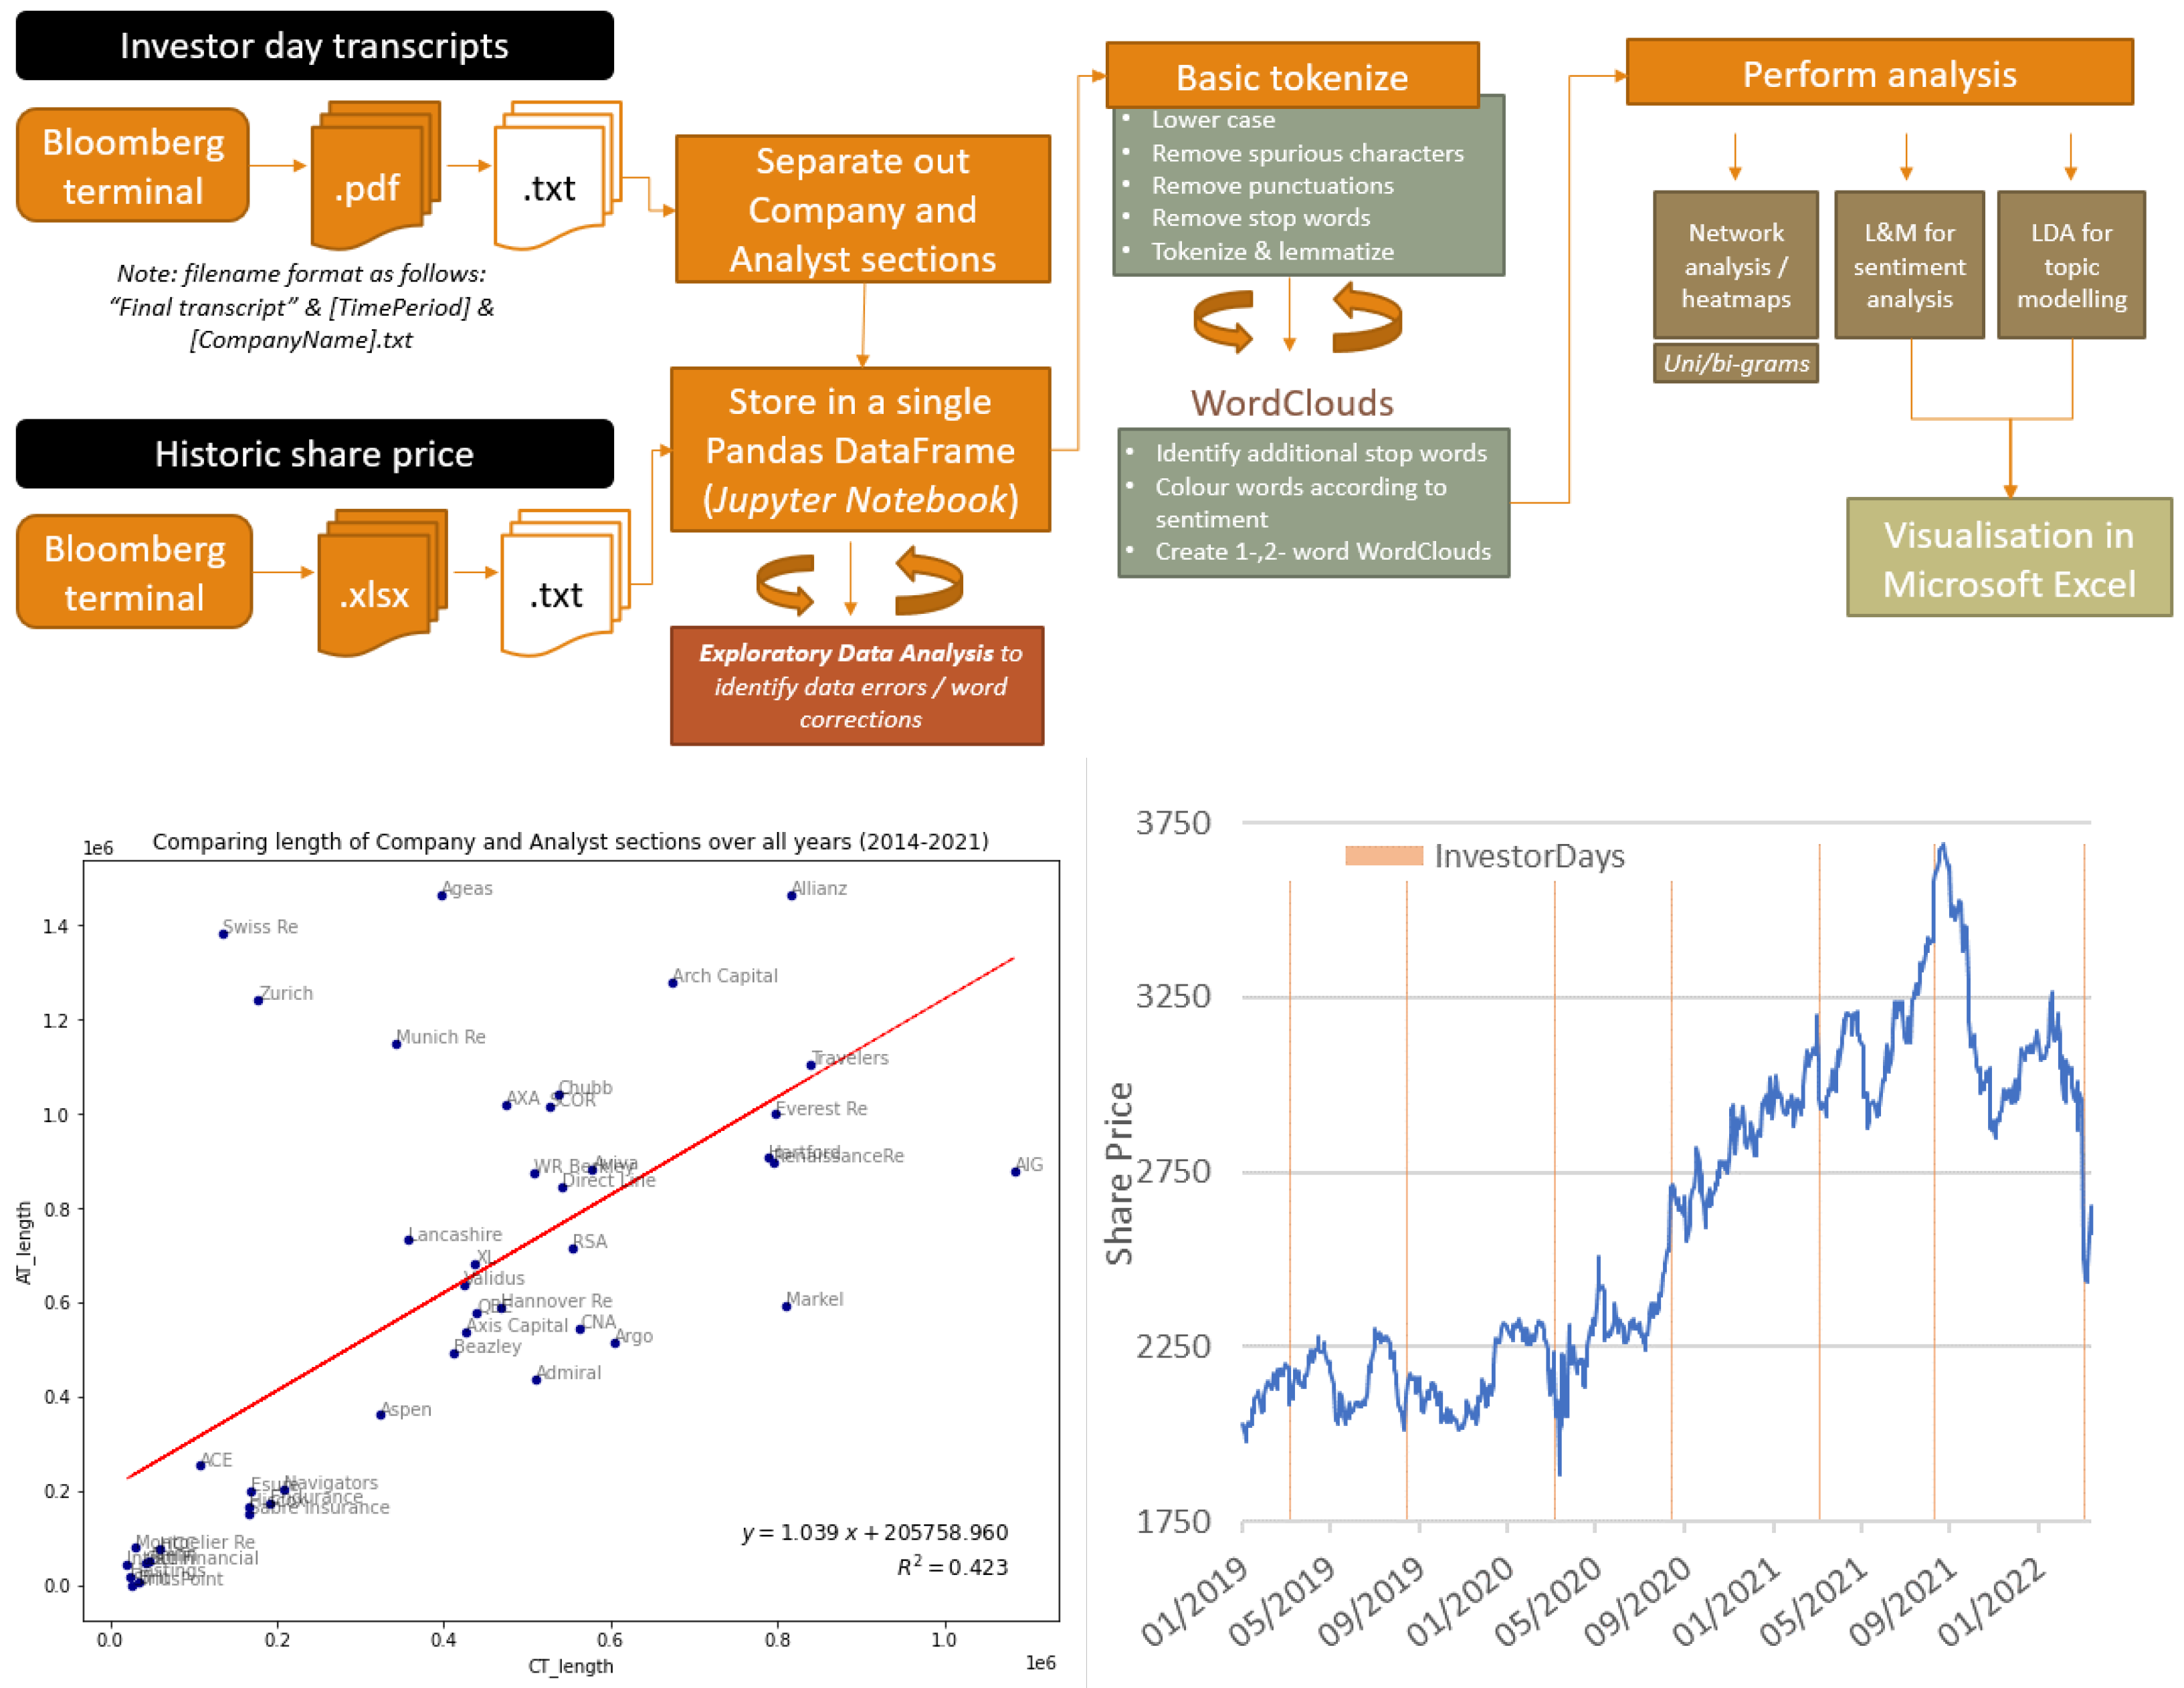
2.1. Investor Daily Transcripts

Our core dataset consists of investor day transcripts (IDTs). IDTs were downloaded from Bloomberg Terminal (cf. www.bloomberg.com, last accessed: 14 September 2022) as individual PDF files. These were converted using Adobe Acrobat into text (i.e., txt) files. The IDTs are transcripts from presentations hosted by insurers to provide information about the firm to investors. US-listed insurers are required to update the market quarterly throughout the year, whereas UK-listed firms are only required to update the market biannually. As a result, not all insurers have the same number of transcripts. The UK general insurance market consists of domestic insurers, such as Admiral and Aviva (who provide car and household insurance) and international insurers, such as AIG and Munich Re (who provide insurance and reinsurance to international businesses). Large overseas insurers such as Allianz and Axa are also included since they have substantial UK operations.
IDTs are typically in two distinct sections. The first is a presentation by the firm’s senior executives (referred to as the Company section), covering financial and operational performance since the previous communication, and typically includes perspectives on future opportunities or headwinds. For example, from Direct Line Group’s (DLG) 2019 Year-End IDT: “We have delivered an operating profit of 547 million and a return on tangible equity of 20.8%, which I think demonstrates the resilience of the business model”. This text describes the financial performance of DLG. The same report mentions also that “the technology upgrades that we have been working towards are injecting real momentum into the transformation now” in relation to operational issues. In each case, these sentences provide insight into the Company’s perspective on its performance. The second section covers “Questions & Answers” (“Q&A”), providing market analysts the opportunity to ask for further detail on specific areas of interest or challenge the firm on any aspects of the materials presented. For example, using the same DLG IDT, and extracting a question from one of the analysts, “…on the reserve releases. I guess they are a little bit lower than all of us in aggregate expected, how did that compare to your expectations?” Such questions provide information of what the market finds of interest, as well as potentially their perspective (as opposed to the firm’s view).
On average, Q&A transcripts are around 50% longer than the Company section in terms of word count, and there is a positive correlation (Pearson’s ρ = 0.65 ,   p < 0.001 ) between the length of the company section and the length of the Q&A section—i.e., firms that tend to have a lengthy Company section also provide more time for Q&A (see Figure 1, bottom left).
Data cleaning and text parsing were applied separately to each section as well as combined depending on the purpose. In total, 44 general insurers were selected, resulting in N I D T = 829 IDTs covering the period 2014 to 2021. During the period there were a number of transactions resulting in discontinuities in the data. For example, ACE only has 7 quarters of transcript data, as it acquired Chubb in Q4 2015 and retained the Chubb (rather than the Ace) brand. Such discontinuities inevitably distort over-time firm-level analysis but do not invalidate industry trends—for example, in this case, the Chubb transcripts from 2016 onwards contain business performance and risks of the combined entity.

2.2. Share Price Information

Historic daily share prices over the period 31 December 2013 to 31 March 2022, for each of the selected insurers, were downloaded from Bloomberg. For the purpose of this analysis the share price movement between 2 and days before and after the investor day presentation was recorded and compared to sentiment scores to assess whether they have any predictive qualities. A portion of this dataset is visualised in Figure 1, bottom right.

2.3. Text Cleaning and Normalisation

As reported in Figure 1, top, investor day transcripts were gathered from Bloomberg and subsequently curated. Text normalisation was performed through nltk and pandas, in Python. The interactive nature of Jupyter notebook made it easier to code manually which stopwords (e.g., proper names) had to be removed from texts. Text normalisation included: case removal, elimination of punctuation, elimination of spurious characters and stopwords, and lemmatisation. Additional data cleaning was needed to ensure company names were consistent—for example, “W.R. Berkley” was changed to “WR Berkley”. The following data were retrieved from each of the text files and stored in a pandas dataframe:
  • Company name: taken from the filename;
  • Time period: taken from the filename, and stored as a 6-digit number. The first four digits represent the year, and the subsequent two the calendar quarter;
  • Company section: all words within the text file up to a pre-defined identifier (for example, “questions and answers”) were allocated to the company section. In practice, this involved some trial and error, as the identifiers changed over the years;
  • Analyst section: contained all words within the text file not allocated to the company section.
Initial exploratory analysis was carried out to identify potential firms that could distort the findings. This included extracting the distribution of the transcript lengths for each section (across firms and over time), identifying the most common words (uni-, bi-, and tri-grams), and word clouds to identify whether themes could be identified. During this stage, one company, Berkshire Hathaway, was removed on the basis that (1) their transcript is significantly larger than the next largest transcript; and (2) the company themes were significantly different from other insurers—which reflects the fact that insurance, via its subsidiary GEICO, is only a relatively small part of the overall group (<20% of revenues in 2021 according to Statista.com, accessed on 14 September 2022), which would increase the risk of extracting non-insurance relevant themes during the keyword extraction analysis. The share price movement was also added to the pandas dataframe.
The following pipeline was created to format the unstructured corpus text before analysis:
  • Remove special characters (e.g., non-alphanumeric characters) and text within curly brackets. In the latter case, curly brackets are used within certain IDTs to denote who is speaking.
  • Tokenise text: This process breaks up each IDT into chunks of information, known as tokens, that are treated as discrete elements for analysis. This analysis also explored the use of sub-word tokenisation—i.e., in addition to analysing individual words, the analysis also considered 2- and 3-word tokens.
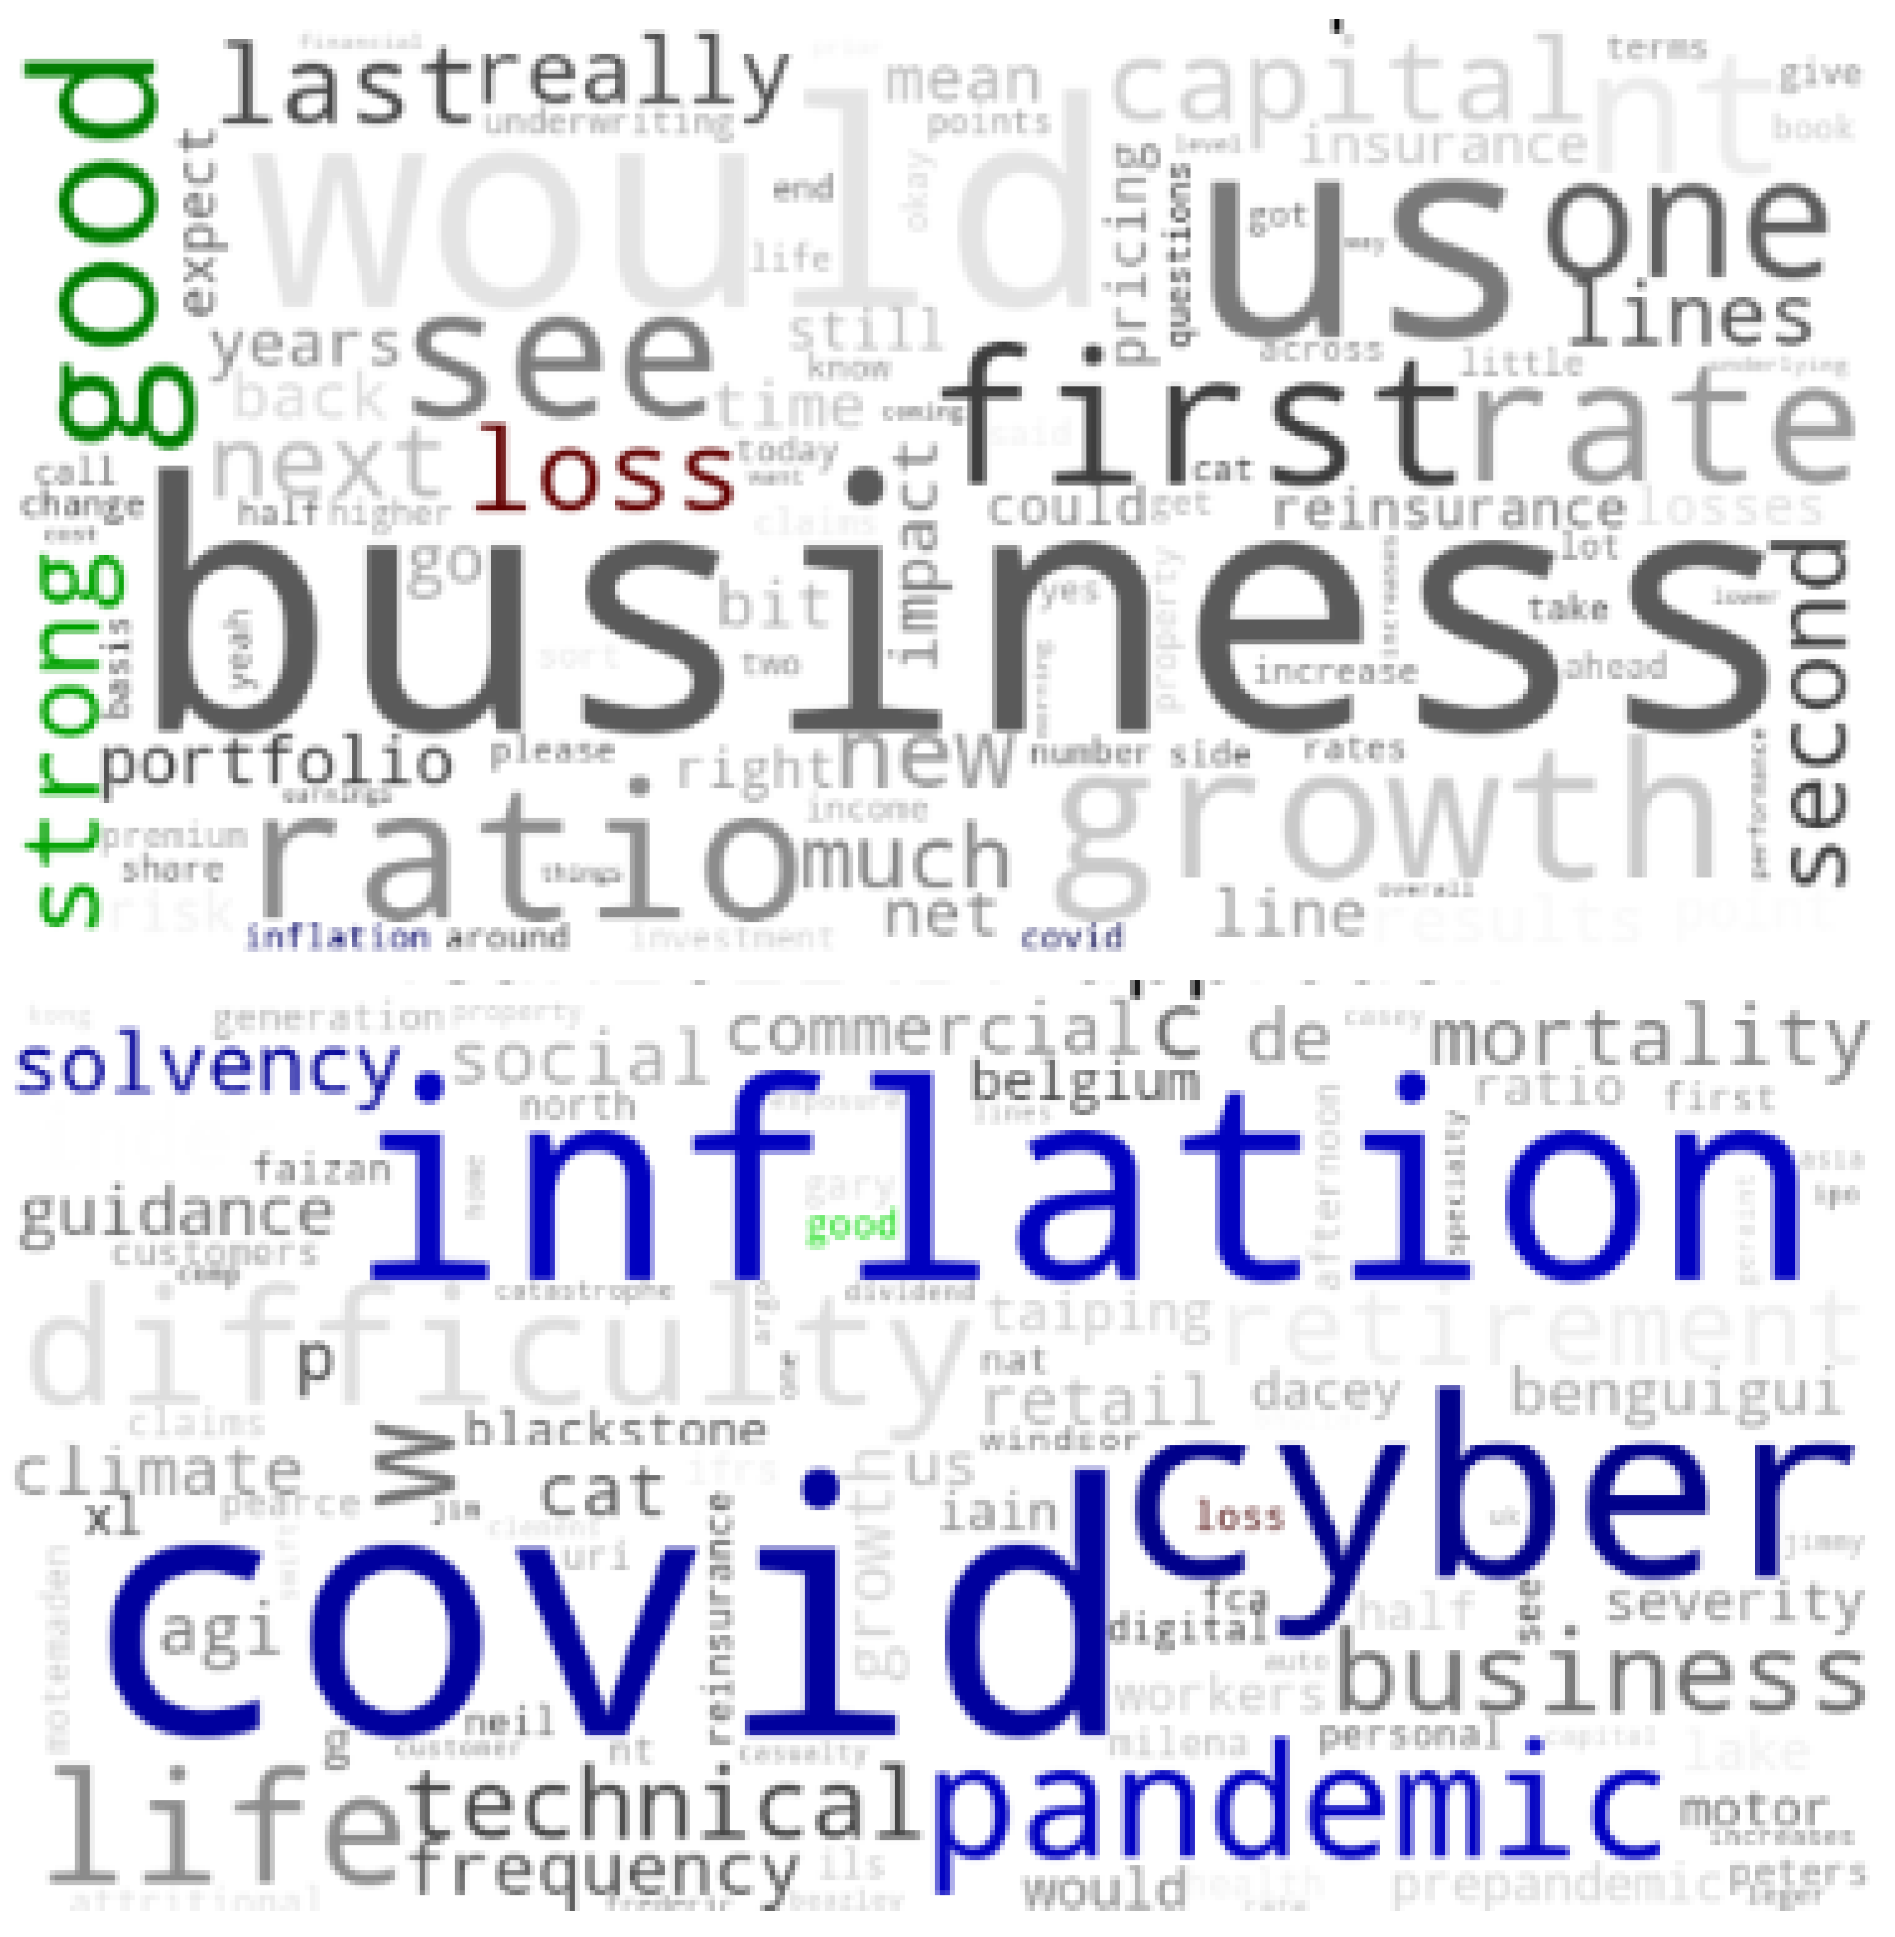
  • Remove stop-words: It is essential to remove stop words as these do not contain useful sentiment information (for example, words like “well, thank you”). In practice, identifying stopwords was an iterative and subjective process, using word clouds and word counts to establish those to remove. In this analysis, we started with the general stop words available from nltk, and then added firm and individual names to avoid larger insurers and analysts (who typically cover several insurers) dominating the themes.
  • Lemmatise the tokens: Lemmatisation refers to the process of removing inflectional endings, to ensure only the base form of a word is retained.

2.4. Text Analysis

For keyword/key-phrase extraction we used the TF-IDF weighting factor [26]. This measure attempts to identify the uniqueness of a specific word or phrase by reducing the weighting of words that appear commonly across all documents in a collection. Mathematically, given our corpus of IDTs, C, the document frequency of d f ( t ) is simply the number of documents d in C that contain the term t, in formulas d f ( t ) = | { d C | t d } | . Based on this, the inverse document frequency is defined as:
i d f ( t ) = log ( | C | d f ( t ) ) .
Note that the log function is used for sublinear scaling to avoid rare words getting an extremely high score. Each term is given a TF-IDF weighting, which provides high values for terms appearing frequently in the selected document D but rarely in others:
t f i d f ( t , D ) = t f ( t , D ) · i d f ( t ) .
A combination of word clouds, heatmaps, and network visualisations was used to outline the results. In word clouds, rather than changing word size according to their frequencies, we used TF-IDF scores. For example, Figure 2 illustrates the benefits of the TF-IDF in drawing out the pertinent themes which would be lost if we were merely highlighting the most common words. In this case, in 2021 the TF-IDF correctly highlights major themes (tracked also by previous works) like the COVID-19 pandemic (see [9,44]), the increasing risk for cyber-attacks and online manipulation (see [45,46,47]) and growing concern around inflation (see [48]).
In addition to computing TF-IDF scores, we also built cognitive networks. As common practice in computer science, we used co-occurrences between the cleaned, lemmatised, non-stopword word-forms to infer syntactic relationships between words in sentences [25,39]. This approach might miss syntactic dependencies between words far apart in sentences (see also [15]) but it has the advantage of being a computationally inexpensive method [39] that requires no prior training data. We also enriched this structure by building relationships between any two words being synonyms according to WordNet [49]. The resulting network structure is cognitive because it reflects, to a limited extent, how concepts were syntactically and semantically associated within the narratives of different transcripts. As in prior works, we aggregated links coming from different sentences in the same document. We reconstructed the semantic frame of concept X as the network neighbourhood of that concept, i.e., the collection of nodes adjacent to X. We use semantic frames to quantitatively compare how concepts were reported in the transcripts across different periods.
The evolution of words associated with a common word was also visualised through the lens of cognitive networks—this provides a perspective of how the meaning and context of words evolve over time and could provide insight into the changing risk landscape.
For sentiment analysis, we used the Loughran and McDonald dictionary [28] implemented via the pysent3 library. For any word w, the lexicon provides positive ( P w ) and negative ( N w ) word scores, as well as polarity p w and subjectivity s w based on the following formula [28]:
p w = P w N w P w + N w s w = P w + N w w ( P w + N w ) .
In addition, Pearson’s correlation coefficient is used to measure the strength and direction of relationship between the polarity and share price movements, defined as ρ ( X , Y ) = ( c o v ( X , Y ) ) / ( σ X σ Y ) , where X is the share price and Y is the corresponding polarity score.
For topic modelling with LDA [42] we use the generative version of LDA implemented in gensim. Each topic becomes an unstructured list/distribution of words that co-occur together in specific documents more than random expectation [4]. To select the optimal number K of topics, we adopted a coherence maximisation approach, which essentially selects K according to when topics provide words that overlap the most in co-occurrences across documents. Specifically, within gensim, we selected the c v option in models.coherencemodel. Without any gold labels on the dataset, we cannot provide quantitative measures for the interpretation of individual topics, but we can test their content and stability over time.

3. Results

This section outlines the key results of the manuscript in terms of: (i) keyword extraction and semantic frame analysis; (ii) sentiment analysis; (iii) topic modelling.

3.1. Keyword Extraction

Uni-gram word clouds based on the TF-IDF weightings highlight interesting patterns from the data, which are reported in Figure 3, top. “Solvency” was strongly featured in the years 2015–2017. This coincides with the introduction of a new complex prudential regulatory framework in the EU, known as Solvency II (https://www.eiopa.europa.eu/browse/solvency-2_en, last accessed: 14 September 2022). “Ogden” was prominent in 2016 and even more in 2017. This was a material issue for UK motor insurers, reflecting a significant increase in the number of court awards following a severe bodily injury claim (https://www.insurance2day.co.uk/ogden-rate-discount-rate/, last accessed: 14 September 2022). “Jebi” was a Japanese typhoon that occurred in December 2019 resulting in an estimated USD 13.5 billion. Its prominence reflects the timing (i.e., at the end of the year) and the uncertainty in total insured losses. COVID-19 and national lockdowns [19] were all unsurprisingly featured heavily in 2020. In 2021, in addition to the COVID-19-related topics, “cyber” and “inflation” became more prominent (according to the TF-IDF algorithm). In part, this relates to the tensions leading to the Russia-Ukraine conflict, especially since the year-end reporting for at least some of these firms occurred after the start of the war. These patterns indicate that the TF-IDF scores were able to identify notable events that influenced risks in the insurance sector, and hence of relevance to prudential regulators.
The heatmap in Figure 3, bottom, helps understand how these identified topics evolved over time, e.g., “inflation” and “covid” grew only recently whereas other topics persisted less prominently but over longer time windows. Both the analyses reported in Figure 3 could complement PRA internal planning meetings in providing an independent perspective of what topics the market is discussing—and hence whether they should be represented to a similar degree by the regulator.

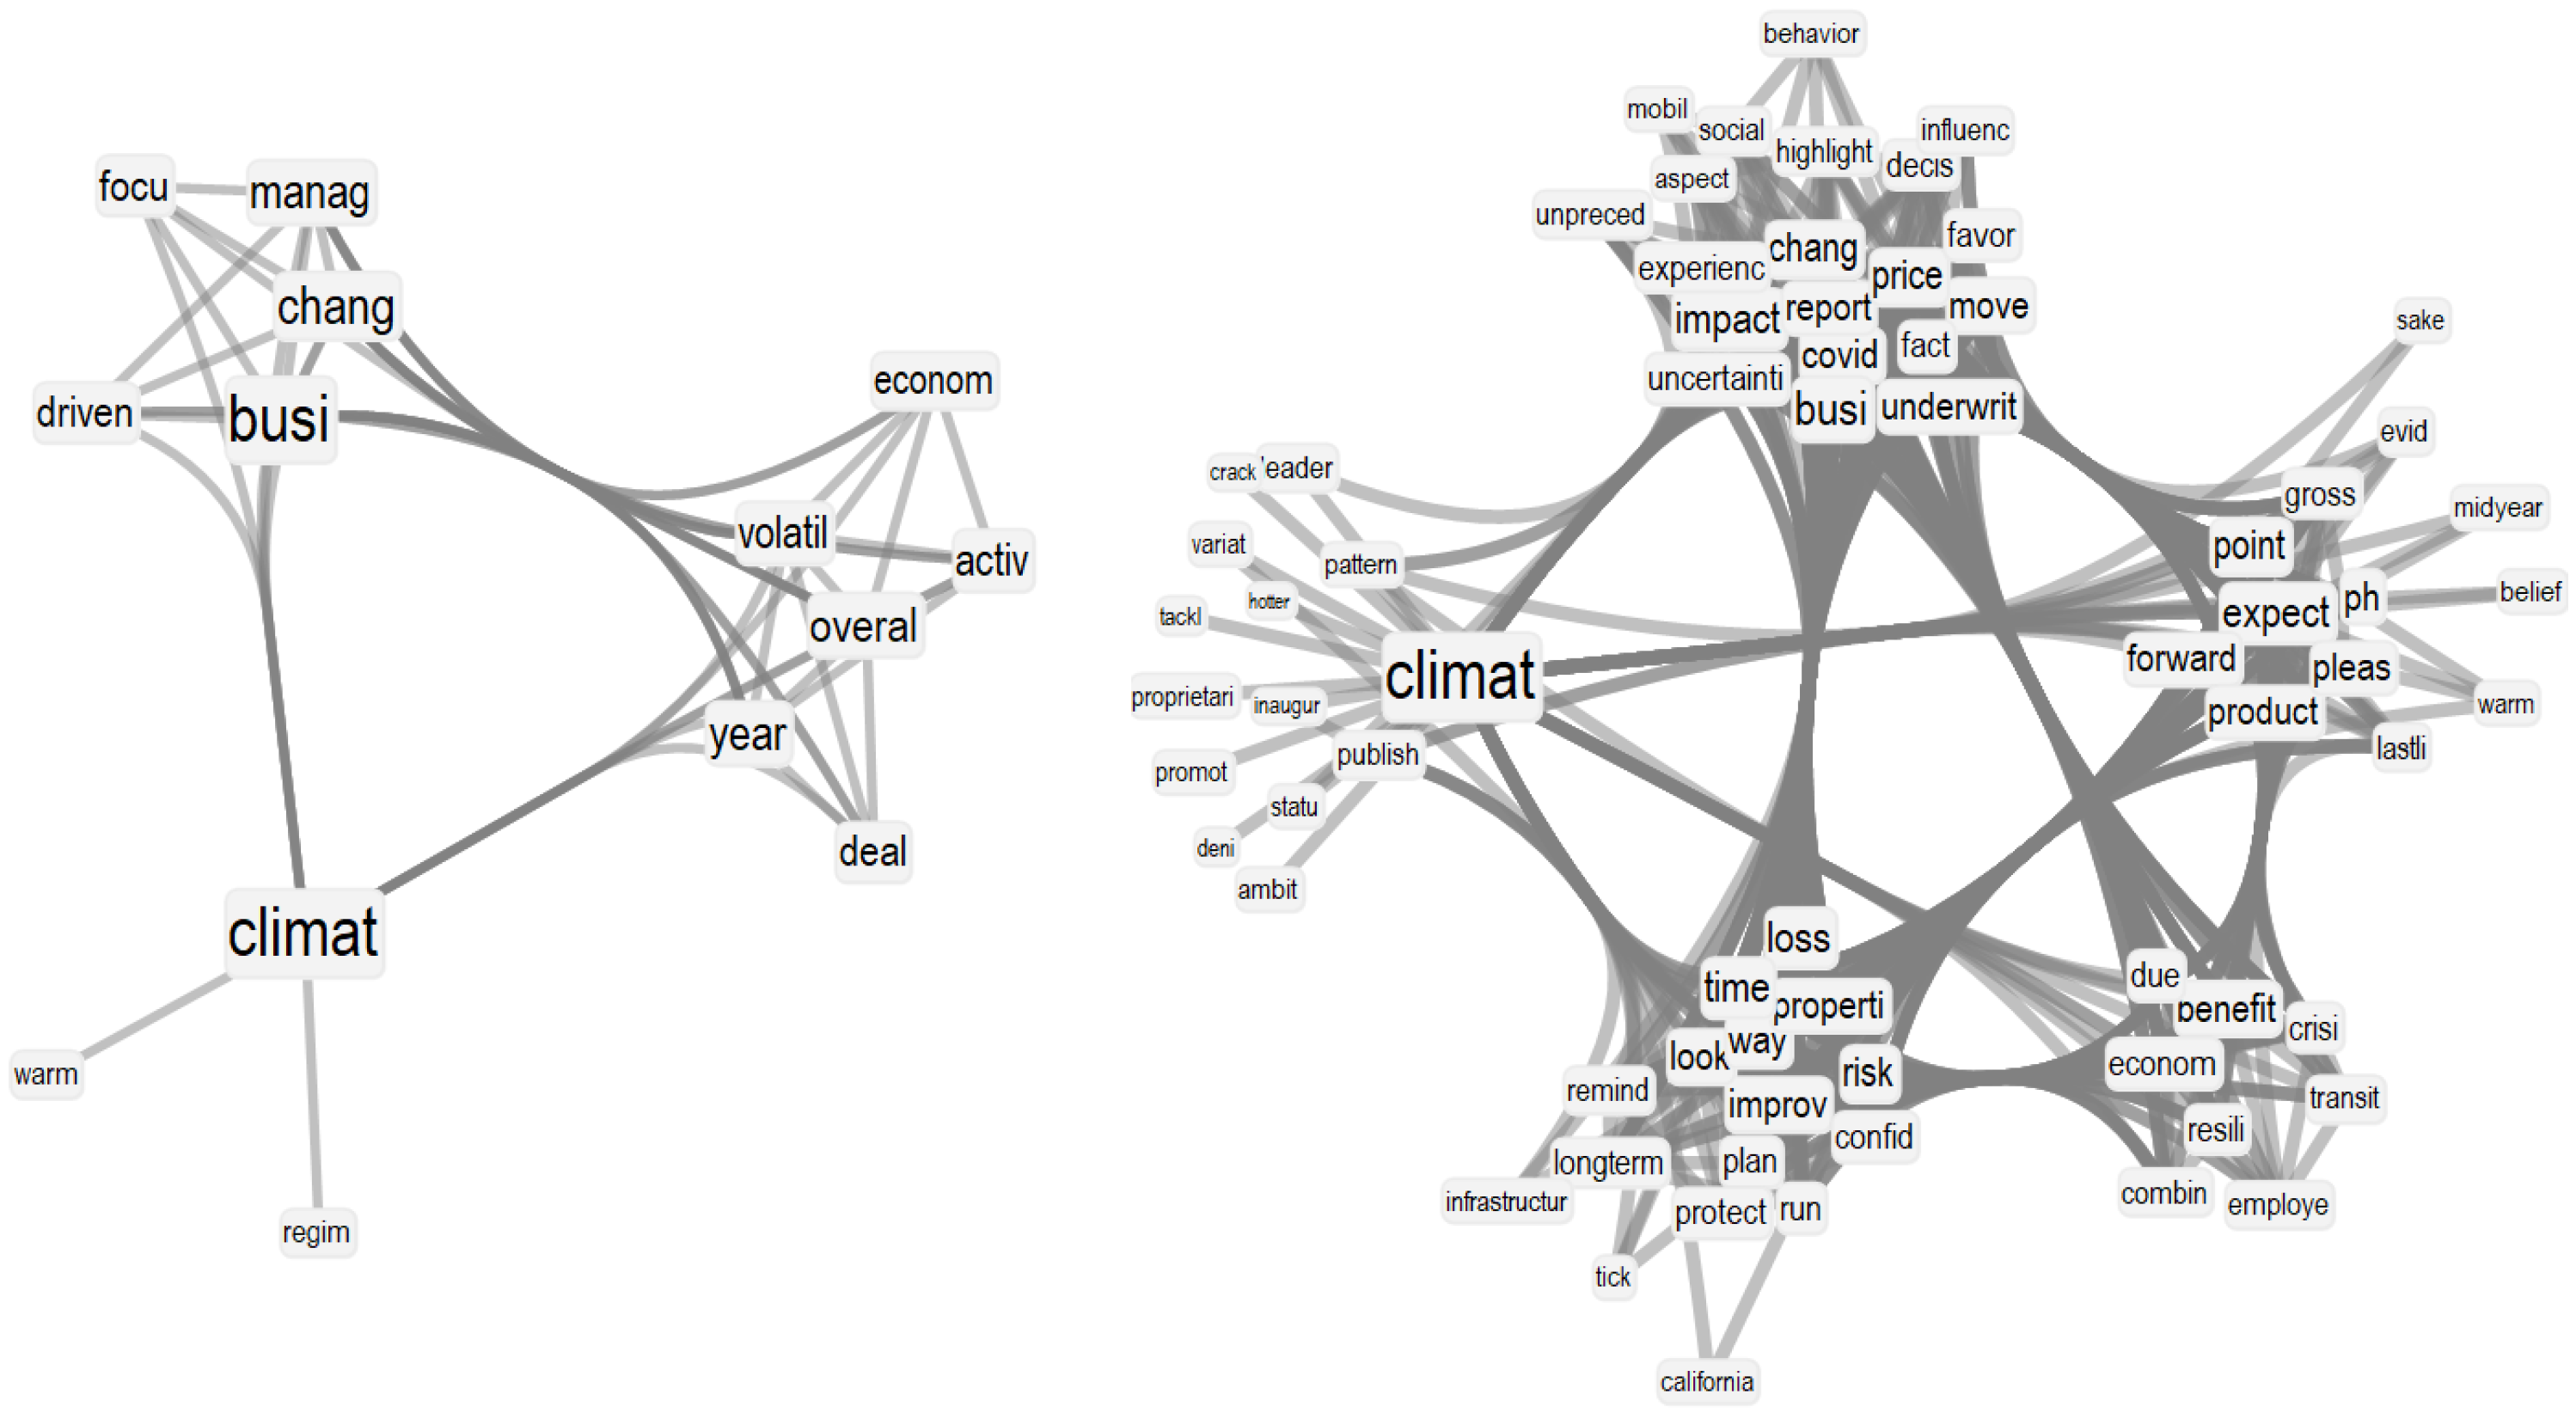
3.2. Semantic Frame Analysis

Semantic frame network analysis provides a further enhancement to uni-gram analysis since network links can identify how concepts were associated in insurance reports. Reporting all network neighbourhoods/frames for all the roughly 3000 unique words represented as nodes in each yearly network would be cumbersome. Hence, we focused our attention on concepts that underwent the most drastic transitions in their semantic frame size, i.e., the number of words linked to them. The most drastic fluctuation was found to be relative to “climate”, which underwent a massive increase in semantic frame size k between 2018 ( k = 13 ) and 2020 ( k = 70 ), an increase of 538%. The semantic frames for “climate” over these two years are reported in Figure 4. These conceptual associations highlight how the context of “climat” mentioned in IDTs has evolved and increased in recent years, particularly with the appearance of more conceptual associations linking climate change with the health emergency and the costs of developing a resilient infrastructure. Interestingly, in 2018, the IDTs framed “climate” as a concept with a rather narrow semantic frame, mentioning links with “business”, “volatility” and “management”. In 2020, the topic matured in 2020 to include crucial associations, that led to a more densely structured semantic frame, with several concepts revolving around the climate transition, its economic benefits and costs, and the need for resilience against crises, like COVID-19.
The above patterns emerge from hundreds of reports and can be visualised in a relatively straightforward way as a complex network. This indicates the powerfulness of this approach for supervisors and policymakers in extracting views about specific concepts across large volumes of texts in a simple, network-informed way.

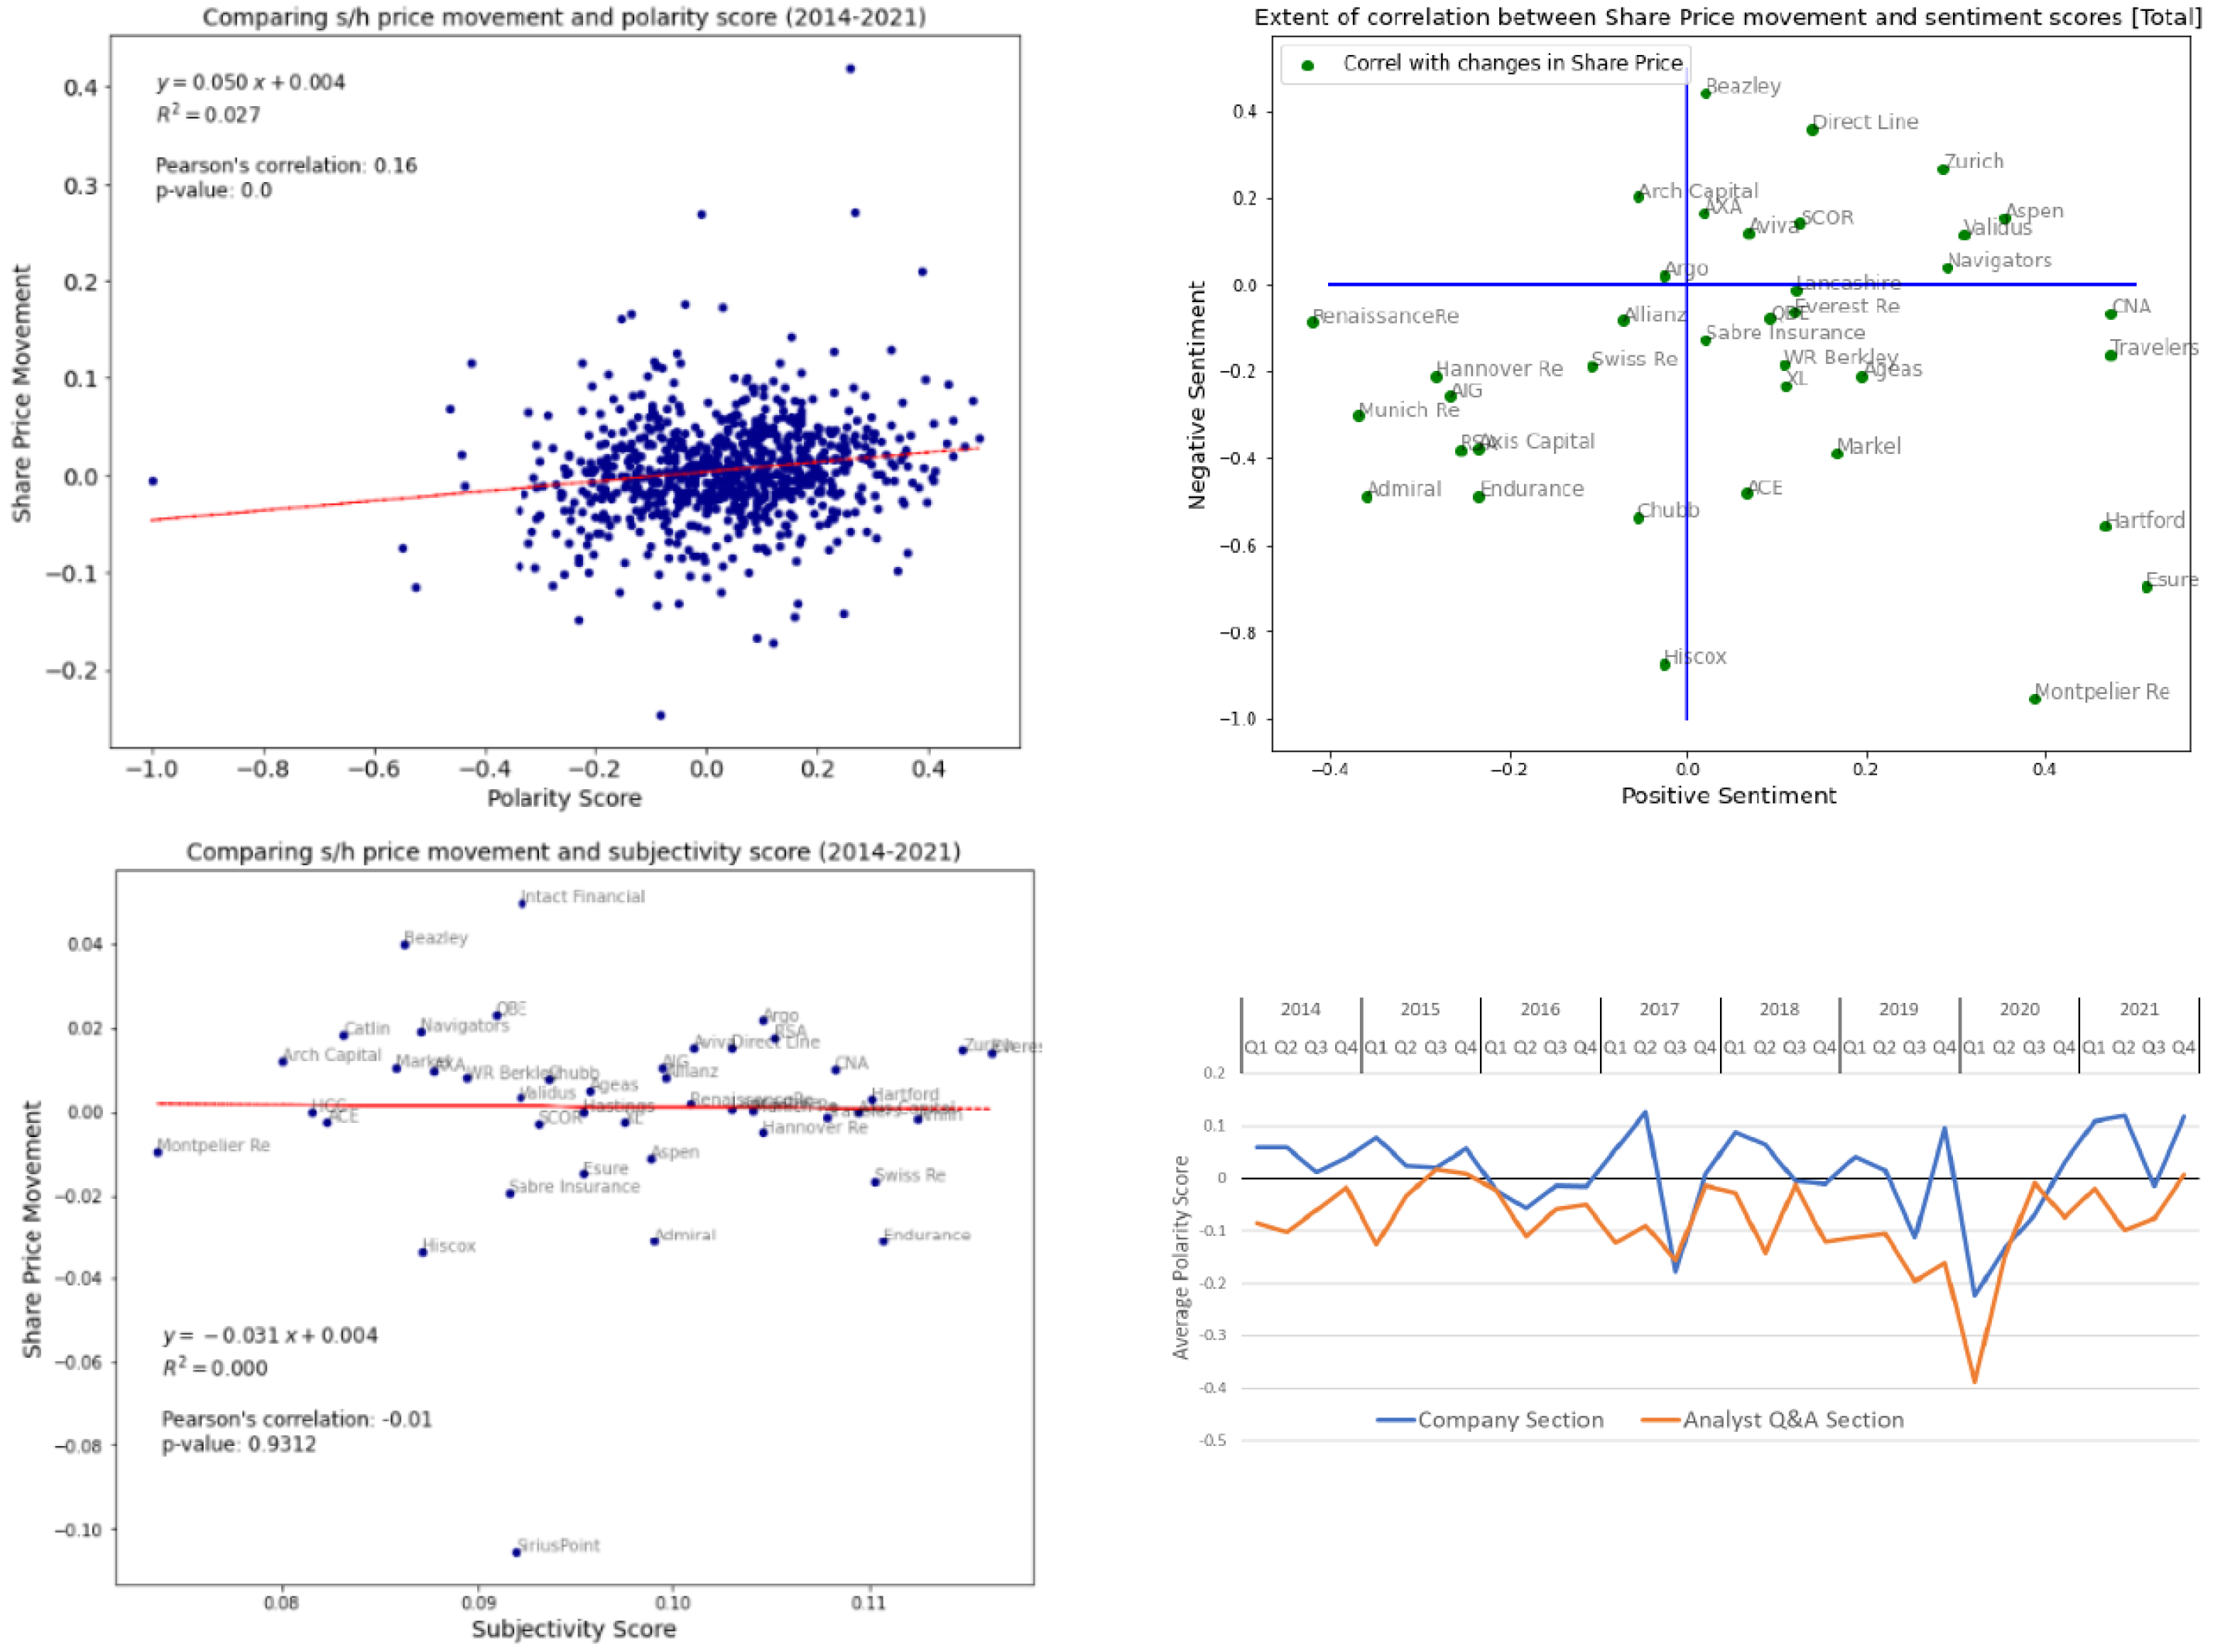
3.3. Valence/Sentiment Analysis

Share price movements are assumed to be a reasonable proxy for sentiment following the new information provided within the investor day presentations [7]. For example, we should expect a positive share price movement following positive news. Figure 5, top left, shows the relationship between polarity scores in IDTs and share price movements for each company and time period. A correlation analysis indicates the presence of a small yet statistically significant correlation (Pearson’s ρ = 0.16 , p < 0.001 < α = 0.05 ). In other words, the existence of more positive terms being used during the Q&A section of an insurer’s investor day presentation was subsequently reflected in a positive share price movement.
Polarity is a mix of positive and negative sentiment patterns. Hence, the next step is to assess how each of these parts determines the above result. This is shown in Figure 5, top right, which separates firms in four different quadrants according to their positive and negative sentiment scores. Firms for which both negative and positive sentiment scores were correlated with share prices would be those with price movements showing relatively higher positive correlations against positive sentiment (X axis) and higher negative correlation with negative sentiment (Y axis), i.e., firms with correlated prices should fall in the bottom right quadrant. Unfortunately, only a round 33 % of firms are clustered in this quadrant. Notice that these results might further improve with the advent of insurance-specific lexicons. The one we are using here, the Loughran and McDonald lexicon [28], is a generic one for financial services, which might be missing sentiment scores specific to the context of the insurance sector. Another element that could distort this analysis is that market analysts typically update their opinion on a sector based on the first reporting firm [8]. For example, if Admiral holds its investor day presentation setting out positive loss experience, analysts may assume all UK motor insurers will have had a good 6-months. Consequently, the share price for the other insurers (such as Direct Line) would also move. Any subsequent movements on the day of Direct Line’s actual presentation would represent the relative movement to the sector’s expectation regardless of whether it is overall positive from the firm’s perspective. Such a relationship is naturally more complex but should be considered as part of future refinements.
Figure 5, bottom right, shows the polarity scores over time for US insurers, which enables a consistent time series for each quarter (noting that most European insurers only provide updates every 6 months). Interestingly, in insurers’ IDTs, the sentiment of analysts in Q&A sections is consistently lower than the sentiment scores of company sections. This pattern persists across 7 years and cannot be caused by a systematic data analysis bias, since both the Q&A and company sections are analysed through the same pipeline and with the same sentiment lexicon (see Methods). We rather interpret this finding in view of analyst perspectives potentially challenging management, whilst the company section arguably reflects a marketing opportunity focusing on future positive opportunities for the insurer. Secondly, the lowest sentiment trends in the US insurance sectors are found to be at the start of the COVID-19 pandemic, in early 2020. This affects both sections in insurance reports. Thirdly, we find that even during the COVID-19 pandemic and subsequent lockdowns [19], the overall sentiment score improved over time compared to the levels of Q1 2020. This might be due to public interventions in providing relief to the economic crisis aggravated by the pandemic ().
Figure 5, bottom left, considers the interplay between the subjectivity expressed by companies in insurance reports and the relative share price movements. According to previous works, [28], subjectivity should reflect anticipation of the future related to economic growth. Do companies providing more subjective content, and hence possibly providing more aspirational messages, benefit from higher share prices? The data displays a negative answer: There is a lack of statistically significant correlation (Pearson’s ρ = 0.01 , p = 0.9312 ) between subjectivity scores in reports and share price movements. This negative finding indicates that the insurance market debated in the current dataset is portrayed as focused on the present, with statements that do not focus on the expectation of future growth.

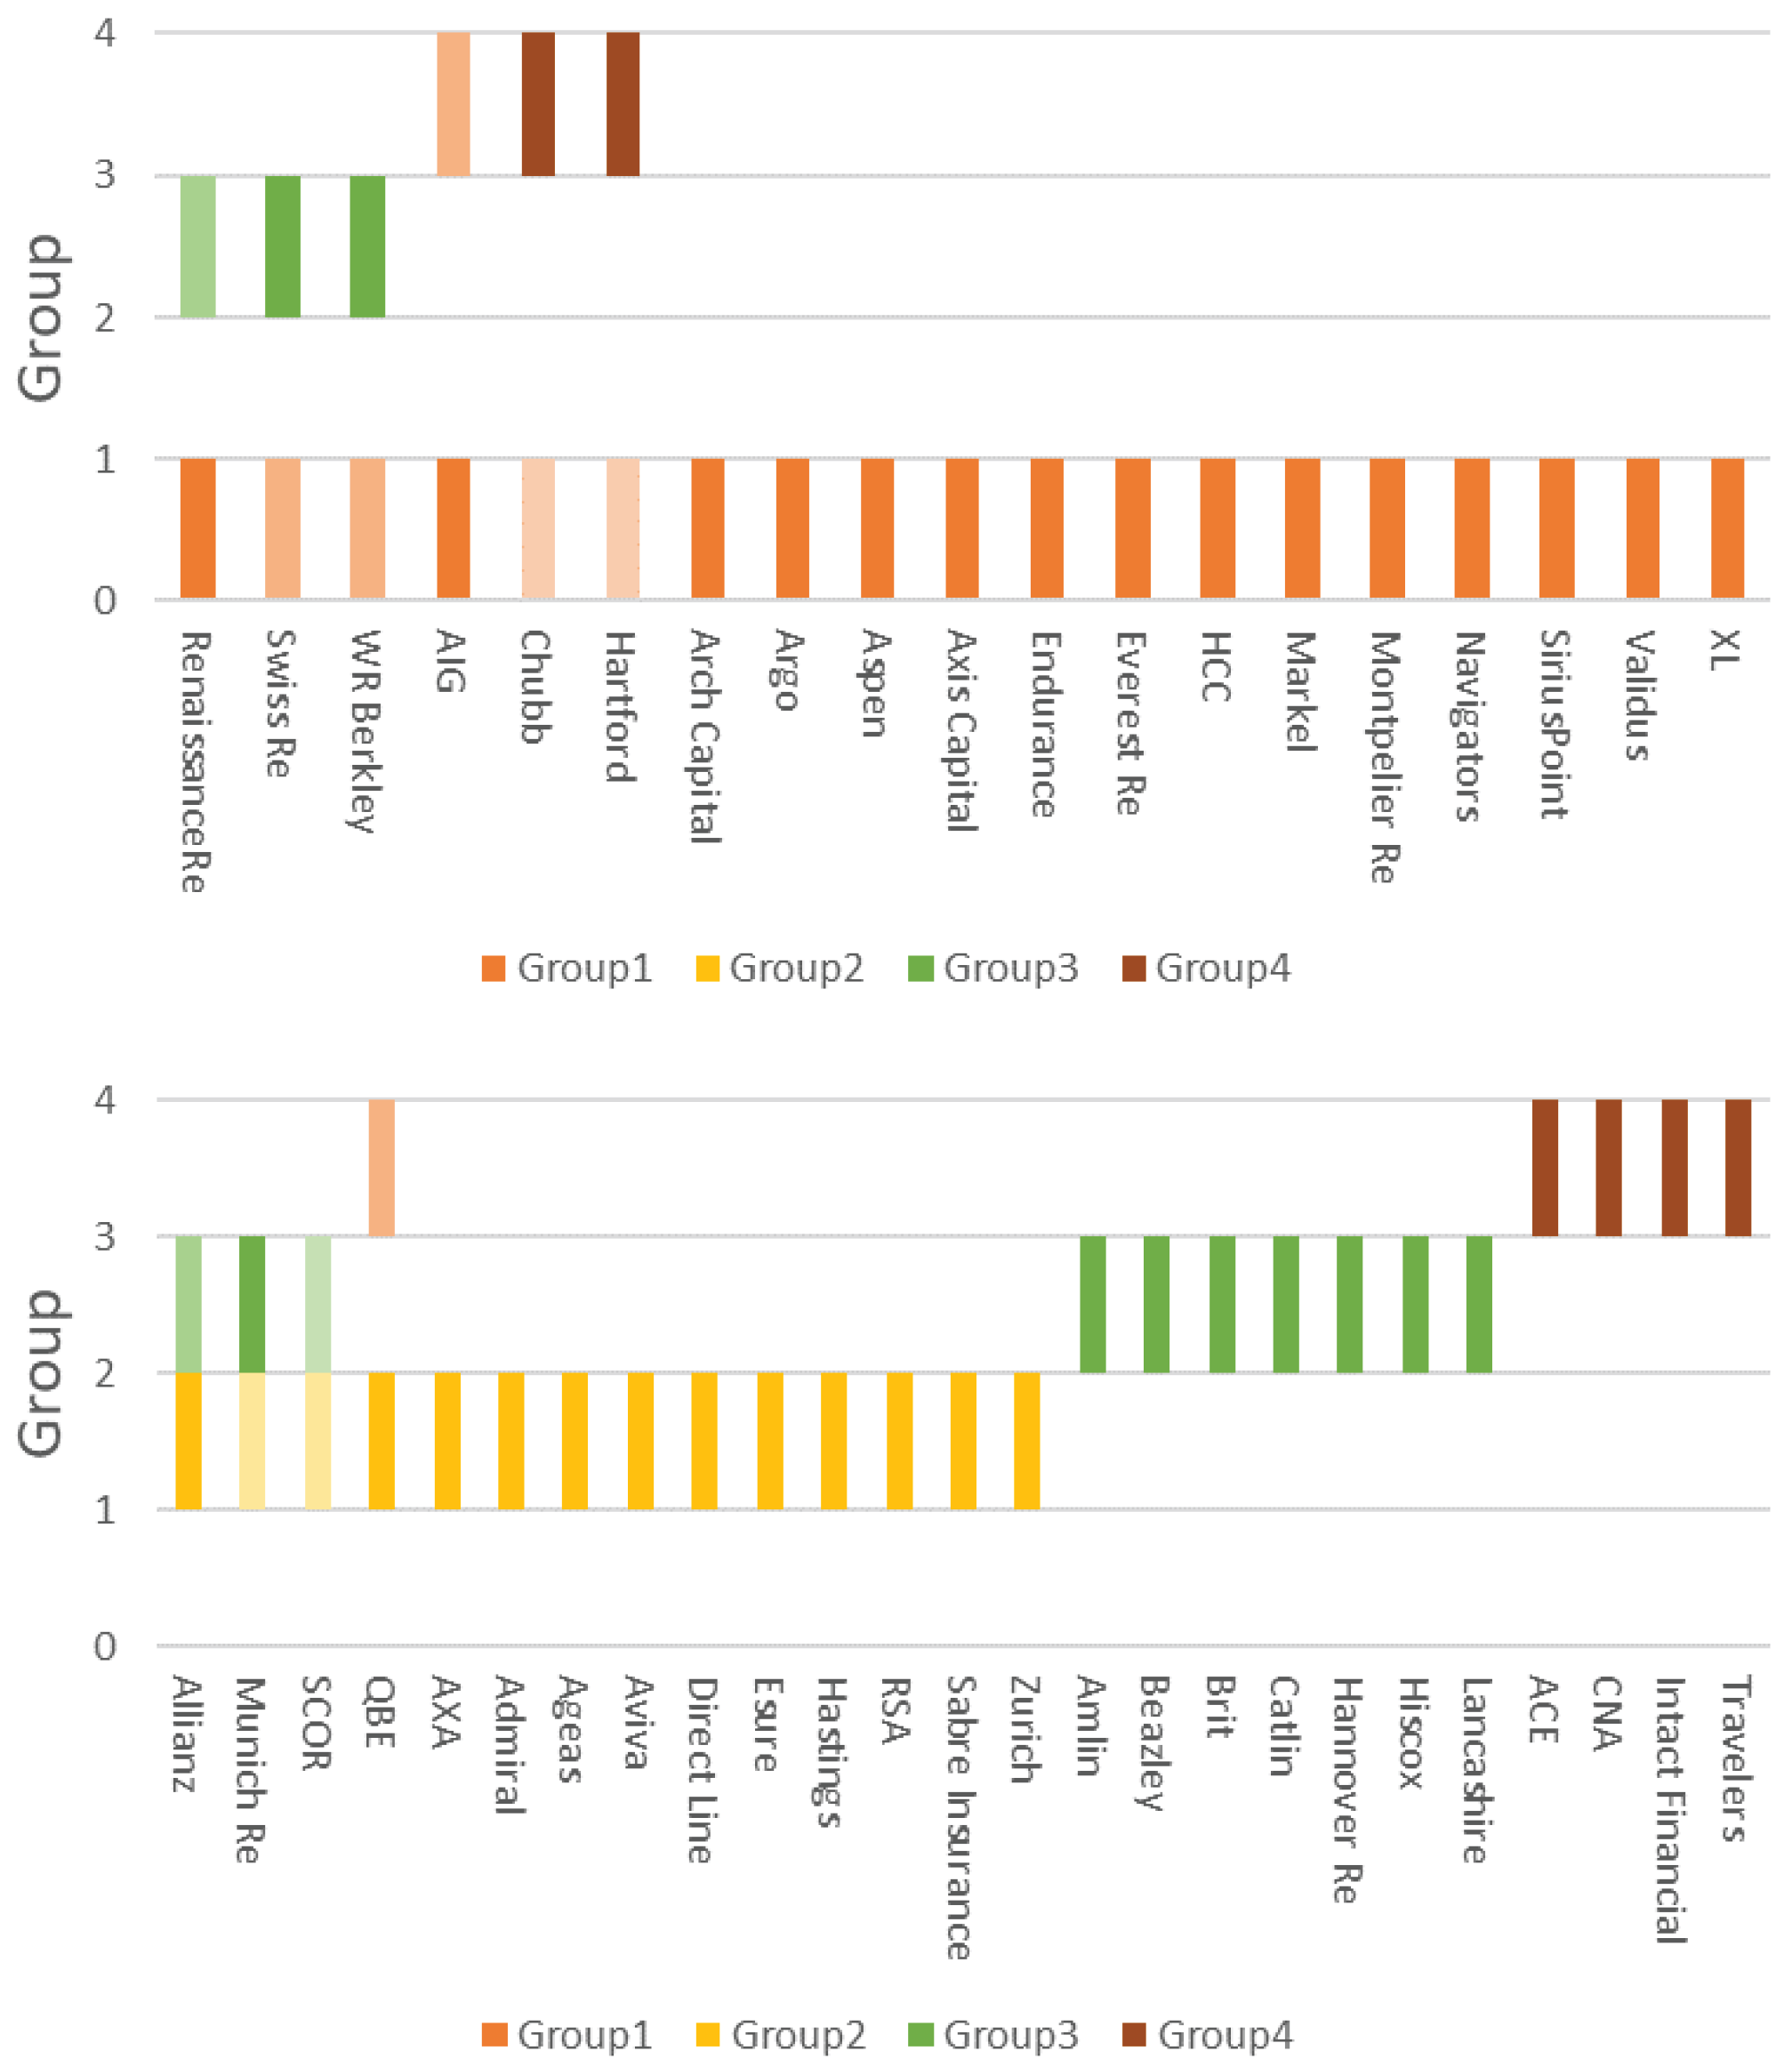
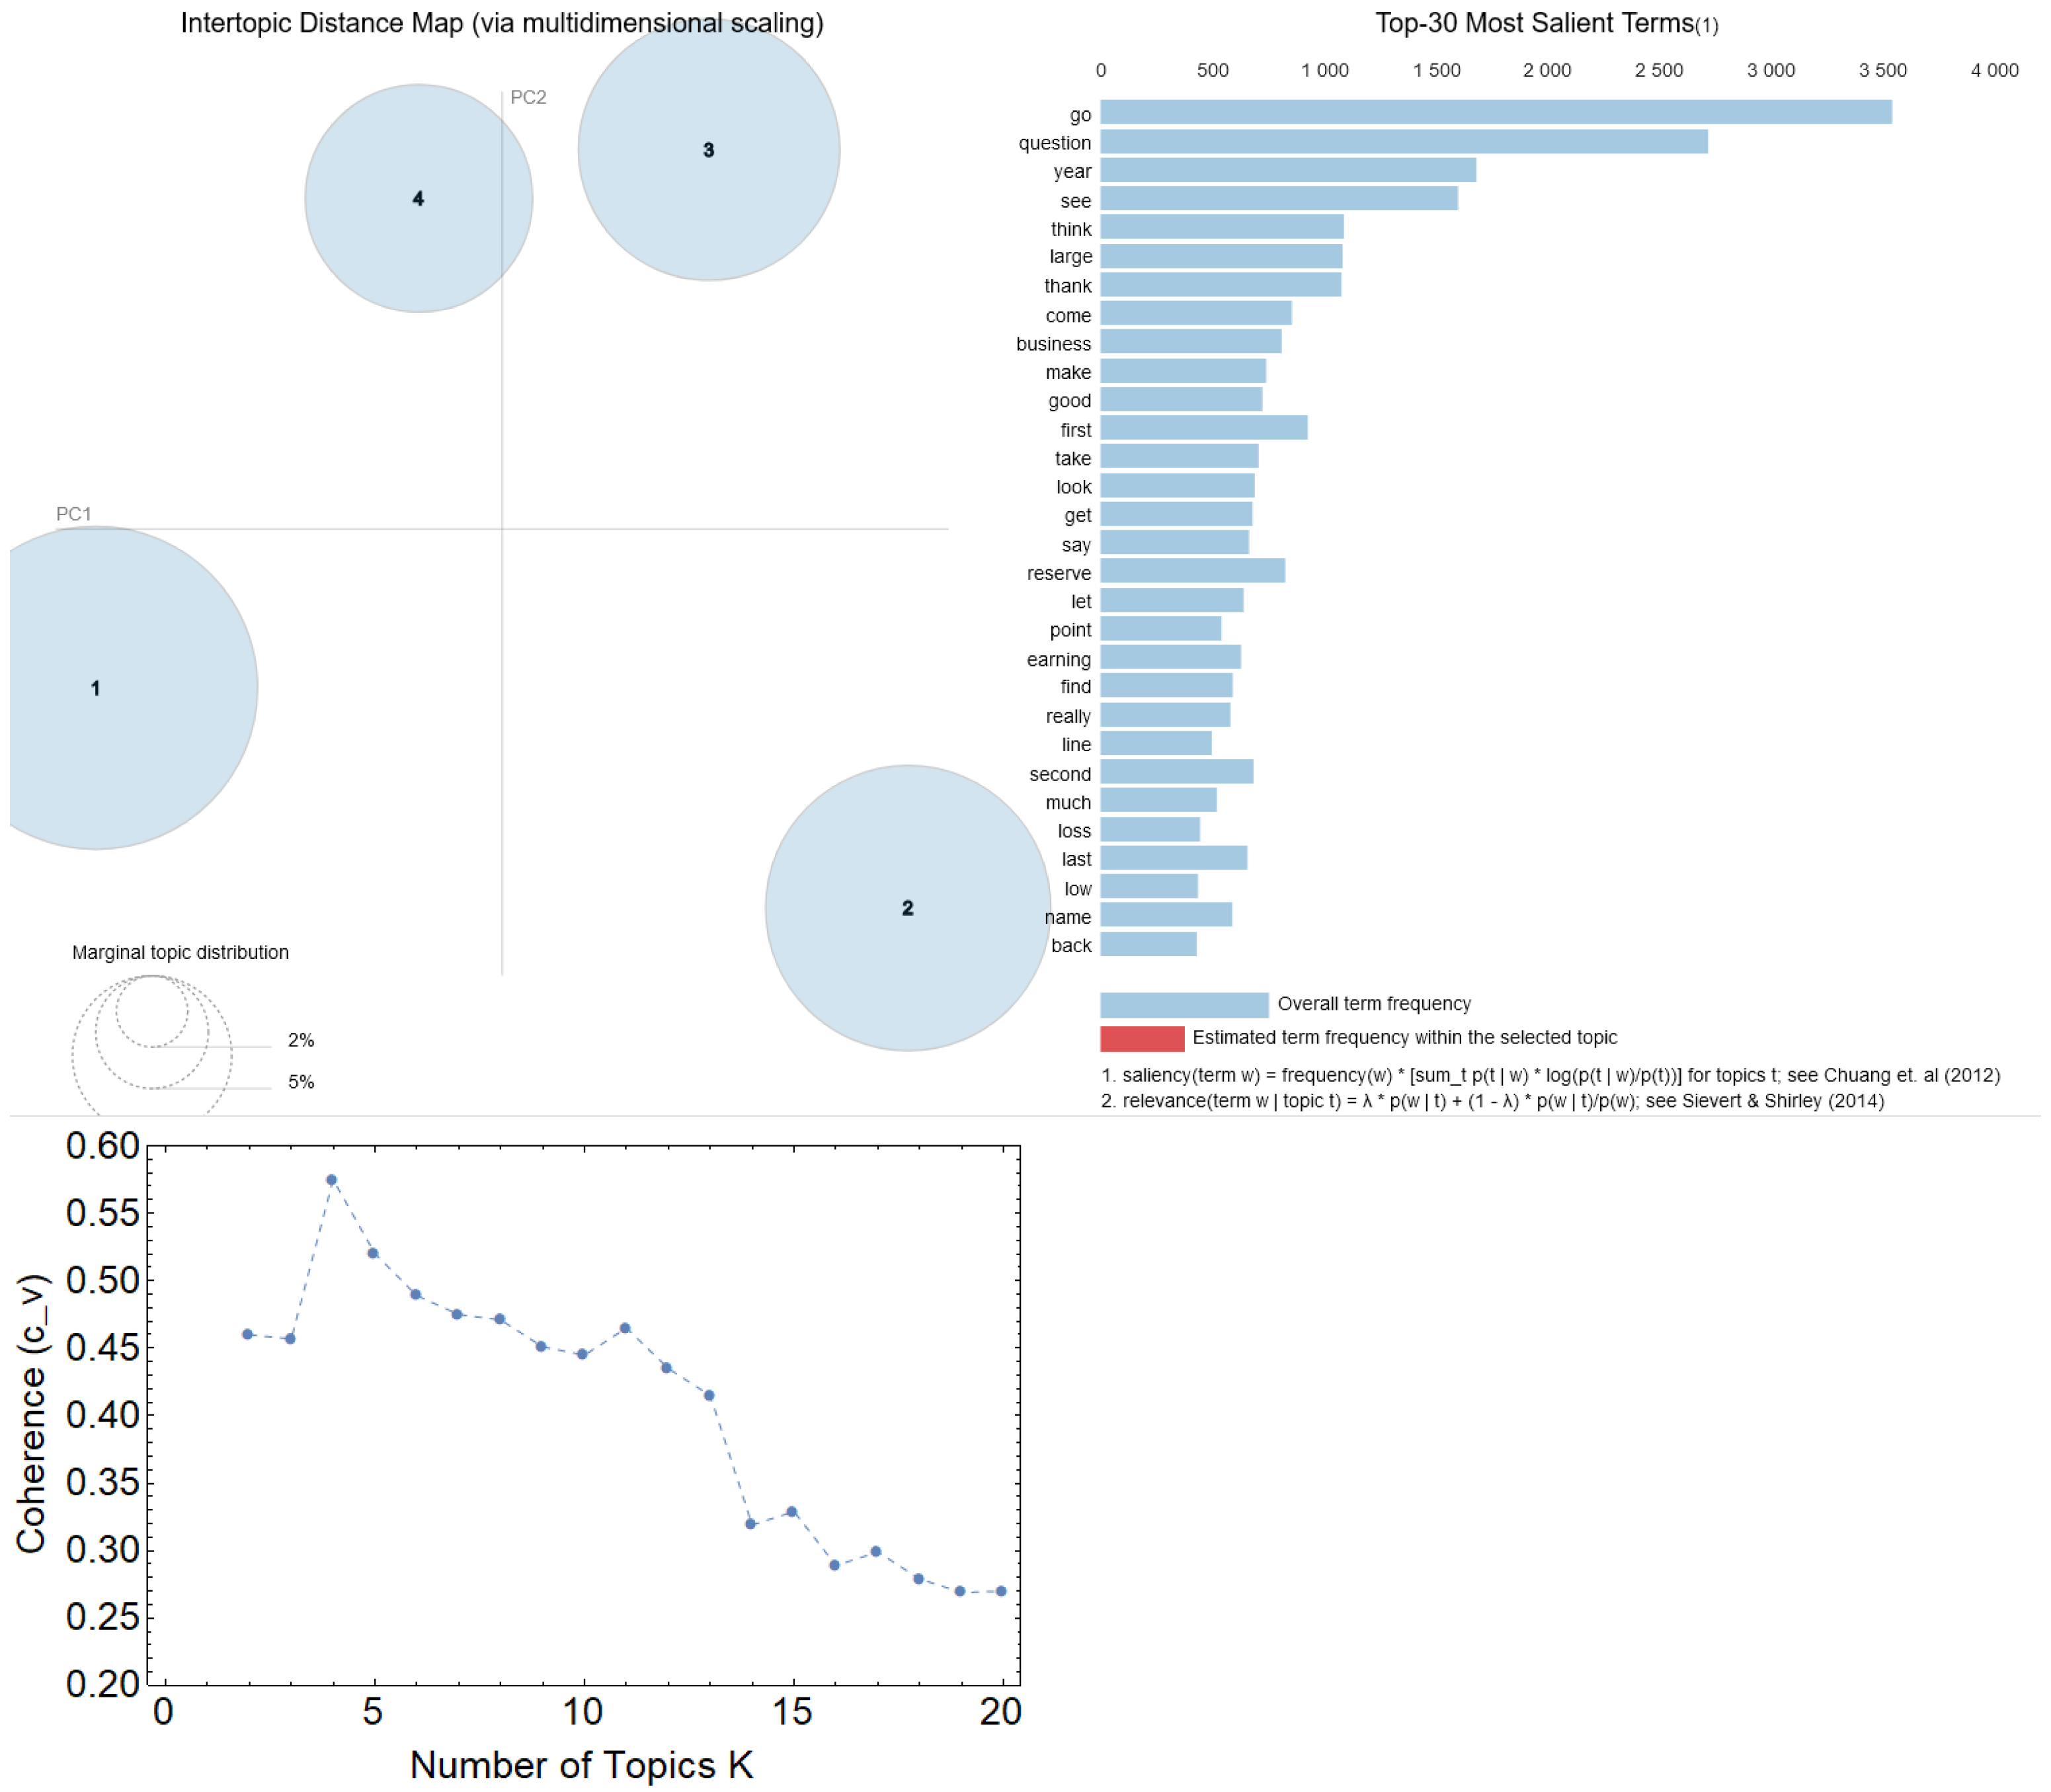
3.4. Topic Modelling

Each of the 829 IDTs (from 44 insurers) was parsed through an LDA implementation that identified K = 4 groups/topic allocation through consistency heuristics, see Methods and Appendix A, Figure 6 shows the LDA implied group/topic allocations, i.e., identifying and allocating a specific insurer’s IDT to a specific group based on the similarity of topics with all other IDTs. Once allocated in topics, IDTs were sorted across years, providing a chronological order. For some insurers, the allocation of their IDTs to one of the four groups changed over the time period. The allocation of the most recent IDT (i.e., those relating to 2021) is shown in a fuller shade, and any different allocations from the previous years’ IDTs are shown in a lighter shade. Where an insurer only has one allocated topic, this means that the LDA model has consistently allocated that insurer throughout the whole time window spanned by the dataset.
None of the identified topics exhibited obvious links with words that are commonly used to describe an insurer’s profile, making it difficult to interpret the groupings. However, the grouping induced by document allocation across groups/topics appears to some extent to reflect a combination of geographic locations and product focus. For example, Group 1 primarily consists of US-focused commercial insurers; Group 2 consists of largely European-focused insurers with primarily retail customers, and Group 3 are relatively niche specialty insurers operating in the London Market. However, Group 4 displays an overlap with Group 1, as this also contains large global commercial insurers with a significant presence in the US. It is noticeable that Ace acquired Chubb (but retained the Chubb brand) in 2015 (https://news.chubb.com/news-releases?item=122719, last accessed: 14 September 2022) which explains Chubb’s overlap between Groups 1 and 4. A potential area for further investigation is to establish why Swiss Re and WR Berkley display overlaps between Group 1 and 3, and Munich Re between 2 and 3—does this represent a shift in risk profile to more specialty business? These results are not conclusive, but they do highlight possible additional areas for investigation for future research.

4. Discussion

This work used NLP and network science techniques to investigate 829 insurance transcripts by 44 general insurers between 2014 and 2021. Let us organise our discussion across two main aspects: (i) contributions of this study to improving event analysis in financial and insurance firms, and (ii) relevance of this study for prudential insurance supervisors.

4.1. Contributions of This Study to Improving Event Analysis in Insurance Firms

The TF-IDF algorithm combined with the visualisation via word clouds, heat maps, and cognitive network analyses highlighted several events of relevance for the insurance market and quantified a growing awareness of the economic repercussions of climate change. Sentiment analysis also showed interesting results, finding a positive correlation between an insurer’s polarity and subsequent share price movements (Pearson’s ρ = 0.16 ,   p < 0.001 ), while relatively weak, this correlation could grow stronger in presence of more refined NLP approaches and lexicons capturing insurance specific-jargon. Our findings provide quantitative evidence that these techniques could mine knowledge from hundreds of documents at once and support human analytical assessments of past trends/issues, integrating with traditional insurance risk analyses. Finally, topic modelling with LDA [42] provided an interesting independent perspective of possible peer groups for insurers based on their language. Unfortunately, the retrieved topics did not highlight easy-to-interpret patterns over the risk profiles debated by insurers themselves. This is likely to reduce buy-in from key stakeholders of LDA analyses. Our analysis indicates that, when exploring a novel dataset of insurance reports by public firms, topic modelling with LDA, despite extensive hyperparameter tuning, does not capture semantically coherent topics and produces a clustering of firms—based on their language - that effectively reproduces geographical locations and product focus. In these terms, our study represents an informative yet negative finding.

4.2. Relevance of This Study for Prudential Insurance Supervisors

This analysis has provided examples of how NLP can be used to identify and highlight changes in notable events that have impacted the insurance sector over time. For supervisors, such analysis could support business planning decisions—for example, should more effort focused on addressing issues relating to inflation, or cyber-attacks?—as well as to help build a rich narrative of the past [47] The ability of a regulator to highlight historic market trends to galvanise the need for action should not be underestimated, especially since it can spawn increased coordination among different “silos” in organisations [20,50]. In this sense, techniques like the word-cloud enriched by TF-IDF scores, as implemented in our work, could be considered complementary to more common quantitative analyses based on numerical data. Furthermore, semantic frames in cognitive networks and their ability to showcase the associative structure of knowledge from texts [5,11,37,39] can be powerful in helping supervisors understand points of view from thousands or hundreds of different firms/reports by considering only dozens of words and connections between them. Our results showcased an increased level of organisation surrounding “climate change” and the latest years and awareness of such pattern might inform future areas of supervisory focus towards this sector. For example, in relation to climate, whether the industry is continuing to focus on those areas that support the transition to Net Zero Greenhouse Gas emission targets. Last but not least, our statistical analysis unveiled, within a novel investor day transcript dataset, a relatively small correlation between sentiment scores and share price movement. This might suggest that sentiment analysis could provide only limited insight at a company level. However, some intuitive sector sentiment scores (see Figure 5, bottom right) and cross-firm comparisons (Figure 6) suggest areas for further investigation. Such analysis could then provide supervisors with a perspective on whether market sentiment is turning positive or negative in the immediate neighbourhood for a given insurer. This work has largely focused on polarity scores; however, as pointed out by Skinner [51] the disclosure of good news tends to be point or range estimates, whereas bad news disclosures tend to be qualitative: This suggests merit in investigating different approaches even between positive and negative sentiment trends.

4.3. Conclusions: Limitations, Future Research and Closing Remarks

Having discussed the relevance of our findings for NLP researchers and, potentially, also for insurance managers, this section outlines key limitations in our working pipeline. The remainder of the manuscript proposes novel ways for overcoming limitations through future research. We conclude with a final remark about the contributions of the manuscript and its scope.

4.4. Limitations and Future Research Directions

The quantitative experiments reported here highlight the potential for NLP [4,26] and cognitive networks [11,15,19,25] to complement and enhance a supervisor’s view of both their firm and the sector within which it operates. Identifying emerging themes and understanding how an insurer is managing these is a core component of supervision. Understanding negative changes in market perceptions could highlight the need for more proactive supervision to understand the underlying drivers. That said, the automated analyses reported here come with some key limitations. Three noticeable shortcomings are: (1) the lexicon to categorise words is not insurance specific but rather relative to finance in general [28]; (2) the documents analysed are limited and stylised to meet the needs of a specific audience (in contrast the PRA receives a vast amount of additional information [2], including risk reports, that potentially contain a much richer risk-related source of intel—applying the same methods explained here to such documents might reveal more patterns); and (3) the use of share price as a proxy for prudential risk should be replaced by the PRA’s internal view—noting that share price movements may not always be aligned to prudential risk [1,3]. In presence of better lexicons and more extensive documents, the techniques reported here could be better developed to identify the ways of associating ideas between differential investor day transcripts. Specifically, as indicated by the network analysis of “climate change”, emotionally structured networks, representing associations between ideas, might be automatically extracted from reports as summaries of the content and sentiment of text towards specific aspects, e.g., “risk” or “investment”. Within this regard, we can discuss the recent methodology described by Semeraro and colleagues [5]. The authors used cognitive networks enriched by lexicon-based sentiment analysis to quantify the specific sentiment surrounding “Pfizer” and “Astrazeneca” across 5000 Italian news articles. The authors quantified that the perception of both these firms was drastically negative, even though in the same corpus overall concept of “vaccine” was portrayed with overwhelmingly positive sentiment. Future research adopting word-level sentiment patterns, e.g., the sentiment attributed to “risk” or “investment” across time-ordered reports, might provide correlations stronger than the one found in this study, leading to more fine-grained studies relating to textual information and its ability to predict market volatility or share prices.
To conclude, our work found a correlation between the sentiment of investor day transcripts and share price movements. Furthermore, the NLP pipelines implemented here managed to highlight several events of relevance for the insurance sector by analysing over 800 reports in a few seconds, a task that would have taken way longer for a human coder. Our results thus indicate that natural language processing represents a crucial direction for developing next-generation systems of firm analysis in the insurance sector. When text analysis is adopted more broadly in the insurance market, also on the onset of the promising exploratory results reported here, it will be important to monitor and assess any changes in the insurer or market analyst behaviour [22,32]. For example, will insurers try to game the system by using highly positive words, even when delivering bad news? Such concerns feel somewhat premature, however, as such analysis becomes widespread, being mindful of these possibilities will be increasingly important.

Author Contributions

Conceptualization, S.C. and M.S.; methodology, S.C. and M.S.; software, S.C.; validation, S.C. and M.S.; formal analysis, S.C.; investigation, S.C. and M.S.; data curation, S.C.; writing—original draft preparation, S.C. and M.S.; writing—review and editing, S.C. and M.S.; visualization, S.C.; supervision, M.S. All authors have read and agreed to the published version of the manuscript.

Funding

This research received no external funding.

Informed Consent Statement

Not applicable.

Data Availability Statement

The reports analysed in this study are publicly available on the Bloomberg Terminal (cf. www.bloomberg.com, last accessed: 14 September 2022). A copy of these transcripts is available on this Open Science Foundation repository: https://osf.io/9xh82/, accessed on 10 October 2022.

Acknowledgments

For valuable comments and suggestions: David Nicholls.

Conflicts of Interest

The authors declare no conflict of interest.

Appendix A

This Appendix provides more details about topic modelling with LDA. Figure A1 reports more results on the LDA analysis we followed in the main text. To perform LDA, we adopted the following steps:
1.
Create bag-of-words representations of documents where punctuation is fully discarded, i.e., each document becomes a list of words;
2.
Lemmatise all words in documents, get rid of stopwords and of additional words that do not convey meaning by themselves (e.g., names of people);
3.
Creating an ID-to-word dictionary, mapping words into numerical pointers (see [42]) and running topic detection over all documents, with different values for K (number of topics);
4.
Use gensim and the coherence metric denoted as [52] c v (for which lemmatised bag-of-words lists are required) to identify topic coherence for different numbers of topics. For each value of K select a random start of 150 and let the hyperparameter α be left to get tuned internally;
5.
Select the value of K relative to the highest coherence.
Figure A1. Top left: Multidimensional reduction of intertopic semantic distances between words, as obtained from pyLDAvis [52,53] (cf. https://pyldavis.readthedocs.io/en/latest/readme.html, accessed on 10 October 2022). Top right: Term frequencies for the considered dataset, as visualised with pyLDAvis. Bottom: Topic coherence ( c v ) versus the number of topics K, as obtained with gensim.
Futureinternet 14 00291 g0a1
As shown in Figure A1, the value K = 4 led to the highest coherence between topics. The latter were reported as 4 distinct non-overlapping entities in the 2-D intertopic distance map produced by pyLDAvis. In such visualisation, topics are embedded in a 2-D space and represented as circles whose size is proportional to the fraction of words belonging to that topic over the whole dictionary [53]. The multidimensional scaling considers multiple vectorial aspects of word allocations in topics and the 2-D embedding is performed so that topics that are closer have also more words in common. As a general rule of thumb, overlapping topic representations should be avoided, as overlaps might indicate an overestimation of the number of topics [53]. This is not the case for our investigation. Once these 4 topics were identified, document allocation (within gensim) made it possible to allocate individual firms across topics based on the transcripts produced by such firms.

References

  1. Sharma, T.; French, D.; McKillop, D. The UK equity release market: Views from the regulatory authorities, product providers and advisors. Int. Rev. Financ. Anal. 2022, 79, 101994. [Google Scholar] [CrossRef]
  2. Bailey, A.J.; Breeden, S.; Stevens, G. The Prudential Regulation Authority; Bank of England Quarterly Bulletin: London, UK, 2012; p. Q4. [Google Scholar]
  3. Klumpes, P.J. Performance benchmarking in financial services: Evidence from the UK life insurance industry. J. Bus. 2004, 77, 257–273. [Google Scholar] [CrossRef]
  4. Chowdhary, K.R. Natural language processing. In Fundamentals of Artificial Intelligence; Springer: New Delhi, India, 2020; pp. 603–649. [Google Scholar]
  5. Semeraro, A.; Vilella, S.; Ruffo, G.; Stella, M. Emotional profiling and cognitive networks unravel how mainstream and alternative press framed AstraZeneca, Pfizer and COVID-19 vaccination campaigns. Sci. Rep. 2022, 12, 14445. [Google Scholar] [CrossRef] [PubMed]
  6. Elshendy, M.; Colladon, A.F.; Battistoni, E.; Gloor, P.A. Using four different online media sources to forecast the crude oil price. J. Inf. Sci. 2018, 44, 408–421. [Google Scholar] [CrossRef] [Green Version]
  7. Pagolu, V.S.; Challa, K.; Panda, G.; Majhi, B. Sentiment analysis of Twitter data for predicting stock market movements. In Proceedings of the 2016 International Conference on Signal Processing, Communication, Power and Embedded System (SCOPES), Paralakhemundi, India, 3–5 October 2016; pp. 1345–1350. [Google Scholar]
  8. Ranco, G.; Aleksovski, D.; Caldarelli, G.; Grcar, M.; Mozetic, I. The Effects of Twitter Sentiment on Stock Price Returns. PLoS ONE 2015, 10, e0138441. [Google Scholar] [CrossRef] [Green Version]
  9. Montefinese, M.; Ambrosini, E.; Angrilli, A. Online search trends and word-related emotional response during COVID-19 lockdown in Italy: A cross-sectional online study. PeerJ 2021, 9, e11858. [Google Scholar] [CrossRef]
  10. Vilella, S.; Semeraro, A.; Paolotti, D.; Ruffo, G. Measuring user engagement with low credibility media sources in a controversial online debate. Epj Data Sci. 2022, 11, 29. [Google Scholar] [CrossRef]
  11. Stella, M. Cognitive network science for understanding online social cognitions: A brief review. Top. Cogn. Sci. 2022, 14, 143–162. [Google Scholar] [CrossRef]
  12. Kadilli, A. Predictability of stock returns of financial companies and the role of investor sentiment: A multi-country analysis. J. Financ. Stab. 2015, 21, 26–45. [Google Scholar] [CrossRef]
  13. Fillmore, C.J. Frame semantics. Cogn. Linguist. Basic Readings 2006, 34, 373–400. [Google Scholar]
  14. Carley, K. Extracting culture through textual analysis. Poetics 1994, 22, 291–312. [Google Scholar] [CrossRef]
  15. Stella, M.; Zaytseva, A. Forma mentis networks map how nursing and engineering students enhance their mindsets about innovation and health during professional growth. PeerJ Comput. Sci. 2020, 6, e255. [Google Scholar] [CrossRef] [PubMed] [Green Version]
  16. Wecker, A.J.; Lanir, J.; Mokryn, O.; Minkov, E.; Kuflik, T. Semantize: Visualizing the sentiment of individual document. In Proceedings of the 2014 International Working Conference on Advanced Visual Interfaces, Como, Italy, 27–30 May 2014; pp. 385–386. [Google Scholar]
  17. Kiritchenko, S.; Zhu, X.; Mohammad, S.M. Sentiment analysis of short informal texts. J. Artif. Intell. Res. 2014, 50, 723–762. [Google Scholar] [CrossRef] [Green Version]
  18. Hutto, C.; Gilbert, E. Vader: A parsimonious rule-based model for sentiment analysis of social media text. In Proceedings of the International AAAI Conference on Web and Social Media, Ann Arbor, MI, USA, 1–4 June 2014; Volume 8, pp. 216–225. [Google Scholar]
  19. Stella, M.; Restocchi, V.; De Deyne, S. #lockdown: Network-enhanced emotional profiling in the time of COVID-19. Big Data Cogn. Comput. 2020, 4, 14. [Google Scholar]
  20. Cropanzano, R.S.; Massaro, S.; Becker, W.J. Deontic justice and organizational neuroscience. J. Bus. Ethics 2017, 144, 733–754. [Google Scholar] [CrossRef] [Green Version]
  21. Gandhi, P.; Loughran, T.; McDonald, B. Using annual report sentiment as a proxy for financial distress in US banks. J. Behav. Financ. 2019, 20, 424–436. [Google Scholar] [CrossRef]
  22. Zappa, D.; Clemente, G.P.; Borrelli, M.; Savelli, N. Text mining in insurance: From unstructured data to meaning. Variance 2019, 14, 1–15. [Google Scholar]
  23. Siew, C.S.; Wulff, D.U.; Beckage, N.M.; Kenett, Y.N. Cognitive network science: A review of research on cognition through the lens of network representations, processes, and dynamics. Complexity 2019, 2019, 2108423. [Google Scholar] [CrossRef]
  24. Citraro, S.; Rossetti, G. Identifying and exploiting homogeneous communities in labeled networks. Appl. Netw. Sci. 2020, 5, 55. [Google Scholar] [CrossRef]
  25. Corrêa, E.A., Jr.; Marinho, V.Q.; Amancio, D.R. Semantic flow in language networks discriminates texts by genre and publication date. Phys. A Stat. Mech. Its Appl. 2020, 557, 124895. [Google Scholar] [CrossRef]
  26. Aizawa, A. An information-theoretic perspective of tf-idf measures. Inf. Process. Manag. 2003, 39, 45–65. [Google Scholar] [CrossRef]
  27. Çavusoğlu, D.; Dayibasi, O.; Sağlam, R.B. Key Extraction in Table Form Documents: Insurance Policy as an Example. In Proceedings of the 2018 3rd International Conference on Computer Science and Engineering (UBMK), Sarajevo, Bosnia and Herzegovina, 20–23 September 2018; pp. 195–200. [Google Scholar]
  28. Loughran, T.; McDonald, B. When is a liability not a liability? Textual analysis, dictionaries, and 10-Ks. J. Financ. 2011, 66, 35–65. [Google Scholar] [CrossRef]
  29. Jairo, P.B.Y.; Aló, R.A.; Olson, D. Comparison of Lexicon Performances on Unstructured Behavioral Data. In Proceedings of the 2019 Sixth International Conference on Social Networks Analysis, Management and Security (SNAMS), Granada, Spain, 22–25 October 2019; pp. 28–35. [Google Scholar]
  30. Boudoukh, J.; Feldman, R.; Kogan, S.; Richardson, M. Which News Moves Stock Prices? A Textual Analysis; Technical Report; National Bureau of Economic Research: Cambridge, MA, USA, 2013. [Google Scholar]
  31. Tetlock, P.C. Giving content to investor sentiment: The role of media in the stock market. J. Financ. 2007, 62, 1139–1168. [Google Scholar] [CrossRef]
  32. Heston, S.L.; Sinha, N.R. News vs. sentiment: Predicting stock returns from news stories. Financ. Anal. J. 2017, 73, 67–83. [Google Scholar] [CrossRef]
  33. Sinha, N.R. Underreaction to news in the US stock market. Q. J. Financ. 2016, 6, 1650005. [Google Scholar] [CrossRef]
  34. Tetlock, P.C.; Saar-Tsechansky, M.; Macskassy, S. More than words: Quantifying language to measure firms’ fundamentals. J. Financ. 2008, 63, 1437–1467. [Google Scholar] [CrossRef]
  35. Petropoulos, A.; Siakoulis, V. Can central bank speeches predict financial market turbulence? Evidence from an adaptive NLP sentiment index analysis using XGBoost machine learning technique. Cent. Bank Rev. 2021, 21, 141–153. [Google Scholar] [CrossRef]
  36. Rastelli, C.; Greco, A.; Kenett, Y.N.; Finocchiaro, C.; De Pisapia, N. Simulated visual hallucinations in virtual reality enhance cognitive flexibility. Sci. Rep. 2022, 12, 4027. [Google Scholar] [CrossRef]
  37. Kumar, A.M.; Goh, J.Y.; Tan, T.H.; Siew, C.S. Gender Stereotypes in Hollywood Movies and Their Evolution over Time: Insights from Network Analysis. Big Data Cogn. Comput. 2022, 6, 50. [Google Scholar] [CrossRef]
  38. de Arruda, H.F.; Marinho, V.Q.; Costa, L.d.F.; Amancio, D.R. Paragraph-based representation of texts: A complex networks approach. Inf. Process. Manag. 2019, 56, 479–494. [Google Scholar] [CrossRef] [Green Version]
  39. Quispe, L.V.; Tohalino, J.A.; Amancio, D.R. Using virtual edges to improve the discriminability of co-occurrence text networks. Phys. A Stat. Mech. Its Appl. 2021, 562, 125344. [Google Scholar] [CrossRef]
  40. Stella, M.; Vitevitch, M.S.; Botta, F. Cognitive Networks Extract Insights on COVID-19 Vaccines from English and Italian Popular Tweets: Anticipation, Logistics, Conspiracy and Loss of Trust. Big Data Cogn. Comput. 2022, 6, 52. [Google Scholar] [CrossRef]
  41. Golino, H.; Christensen, A.P.; Moulder, R.; Kim, S.; Boker, S.M. Modeling latent topics in social media using Dynamic Exploratory Graph Analysis: The case of the right-wing and left-wing trolls in the 2016 US elections. Psychometrika 2022, 87, 156–187. [Google Scholar] [CrossRef]
  42. Blei, D.M.; Ng, A.Y.; Jordan, M.I. Latent dirichlet allocation. J. Mach. Learn. Res. 2003, 3, 993–1022. [Google Scholar]
  43. Wang, Y.; Xu, W. Leveraging deep learning with LDA-based text analytics to detect automobile insurance fraud. Decis. Support Syst. 2018, 105, 87–95. [Google Scholar] [CrossRef]
  44. Patuelli, A.; Caldarelli, G.; Lattanzi, N.; Saracco, F. Firms’ challenges and social responsibilities during COVID-19: A Twitter analysis. PLoS ONE 2021, 16, e0254748. [Google Scholar] [CrossRef]
  45. Chen, W.; Pacheco, D.; Yang, K.C.; Menczer, F. Neutral bots probe political bias on social media. Nat. Commun. 2021, 12, 5580. [Google Scholar] [CrossRef]
  46. Simon, F.M.; Camargo, C.Q. Autopsy of a metaphor: The origins, use and blind spots of the ‘infodemic’. New Media Soc. 2021. [Google Scholar] [CrossRef]
  47. Li, Y.; Hills, T.; Hertwig, R. A brief history of risk. Cognition 2020, 203, 104344. [Google Scholar] [CrossRef]
  48. Picault, M.; Pinter, J.; Renault, T. Media sentiment on monetary policy: Determinants and relevance for inflation expectations. J. Int. Money Financ. 2022, 124, 102626. [Google Scholar] [CrossRef]
  49. Miller, G.A. WordNet: An Electronic Lexical Database; MIT Press: Cambridge, MA, USA, 1998. [Google Scholar]
  50. Bento, F.; Tagliabue, M.; Lorenzo, F. Organizational silos: A scoping review informed by a behavioral perspective on systems and networks. Societies 2020, 10, 56. [Google Scholar] [CrossRef]
  51. Skinner, D.J. Why firms voluntarily disclose bad news. J. Account. Res. 1994, 32, 38–60. [Google Scholar] [CrossRef] [Green Version]
  52. Syed, S.; Spruit, M. Full-text or abstract? Examining topic coherence scores using latent dirichlet allocation. In Proceedings of the 2017 IEEE International Conference on Data Science and Advanced Analytics (DSAA), Tokyo, Japan, 19–21 October 2017; pp. 165–174. [Google Scholar]
  53. Sievert, C.; Shirley, K. LDAvis: A method for visualizing and interpreting topics. In Proceedings of the Workshop on Interactive Language Learning, Visualization, and Interfaces, Baltimore, MD, USA, 27 June 2014; pp. 63–70. [Google Scholar]
Figure 1. Top: Flowchart of text analysis for keyword extraction, sentiment analysis, and network building from the investor transcripts. Bottom Left: Comparing the length of Company and Analyst sections overall years (2014–2021). Bottom Right: A smaller sample of Admiral Share Price fluctuations with Investor-Day dates.
Futureinternet 14 00291 g001
Figure 2. Combining word clouds and TF-IDF scores. Note: words are coloured according to their polarity—green positive, red negative, grey neutral. Words in blue highlight those selected for comment.
Futureinternet 14 00291 g002
Figure 3. Top: Uni-gram word clouds for the period 2014–2021. Each cloud represents all IDTs in one year. Note: words are coloured according to their polarity—green positive, red negative, grey neutral. Words in blue highlight those selected for comment. Bottom: Uni-gram word heat map of TF-IDF scores over each year, from 2014 to 2021.
Futureinternet 14 00291 g003
Figure 4. Semantic frame for “climat” in 2018 (left) and in 2020 (right) insurance reports. Note: node size reflects degree centrality, i.e., the semantic frame size of each word in the overall cognitive network. Words are clustered in Louvain communities only for the sake of visualisation (see also [5]).
Futureinternet 14 00291 g004
Figure 5. Top left: Share price movements vs. polarity scores (2014–2021). Top right: Scatter plot between share price movements and sentiment scores. Bottom left: Comparing share-price movement and subjectivity scores (2014–2021). Bottom right: US insurance industry sentiment analysis over the years.
Futureinternet 14 00291 g005
Figure 6. Allocations of different insurers across the 4 identified topics.
Futureinternet 14 00291 g006
Publisher’s Note: MDPI stays neutral with regard to jurisdictional claims in published maps and institutional affiliations.

