Article

Cloud-Native Observability: The Many-Faceted Benefits of Structured and Unified Logging—A Multi-Case Study

Department of Electrical Engineering and Computer Science, Lübeck University of Applied Sciences, 23562 Lübeck, Germany
Future Internet 2022, 14(10), 274; https://doi.org/10.3390/fi14100274
Submission received: 24 August 2022 / Revised: 19 September 2022 / Accepted: 22 September 2022 / Published: 26 September 2022
(This article belongs to the Special Issue Cloud-Native Observability)

Abstract

:
Background: Cloud-native software systems often have a much more decentralized structure and many independently deployable and (horizontally) scalable components, making it more complicated to create a shared and consolidated picture of the overall decentralized system state. Today, observability is often understood as a triad of collecting and processing metrics, distributed tracing data, and logging. The result is often a complex observability system composed of three stovepipes whose data are difficult to correlate. Objective: This study analyzes whether these three historically emerged observability stovepipes of logs, metrics and distributed traces could be handled in a more integrated way and with a more straightforward instrumentation approach. Method: This study applied an action research methodology used mainly in industry–academia collaboration and common in software engineering. The research design utilized iterative action research cycles, including one long-term use case. Results: This study presents a unified logging library for Python and a unified logging architecture that uses the structured logging approach. The evaluation shows that several thousand events per minute are easily processable. Conclusions: The results indicate that a unification of the current observability triad is possible without the necessity to develop utterly new toolchains.

1. Introduction

A “crypto winter” basically means that the prices for so-called cryptocurrencies such as Bitcon, Ethereeum, Solana, etc. fell sharply on the crypto exchanges and then stay low. The signs were all around in 2022: the failure of the Terra Luna crypto project in May 2022 sent an icy blast through the market, then the cryptocurrency lending platform Celsius Network halted withdrawals, prompting a sell-off that pushed Bitcoin to a 17-month low.
This study logged such a “crypto winter” on Twitter more by accident than by intention. Twitter was simply selected as an appropriate use case to evaluate a unified logging solution for cloud-native systems. The intent was to log Tweets containing stock symbols like $USD or $EUR. It turned out that most symbols used on Twitter are not related to currencies like $USD (US-Dollar) or stocks like $AAPL (Apple) but to Cryptocurrencies like $BTC (Bitcoin) or $ETH (Ethereum). However, although some data of this 2022 crypto winter will be presented in this paper, this paper will put the methodical part more into focus and will address how such and further data could be collected more systematically in distributed cloud-native applications. The paper will at least show that even complex observability of distributed systems can be reached, simply by logging events to stdout.
Observability measures how well a system’s internal state can be inferred from knowledge of its external outputs. The concept of observability was initially introduced by the Hungarian-American engineer Rudolf E. Kálmán for linear dynamical systems [1,2]. However, observability also applies to information systems and is of particular interest to fine-grained and distributed cloud-native systems that come with a very own set of observability challenges.
Traditionally, the responsibility for observability is (was?) with operations (Ops). However, this evolved into a collection of different technical methods and a culture for collaboration between software development (Dev) and IT operations (Ops). With this emergence of DevOps, we can observe a shift of Ops responsibilities to developers. Thus, observability is evolving more and more into a Dev responsibility. Observability should ideally already be considered during the application design phase and not be regarded as some “add-on” feature for later expansion stages of an application. The current discussion about observability began well before the advent of cloud-native technologies like Kubernetes. A widely cited blog post by Cory Watson from 2013 shows how engineers at Twitter looked for ways to monitor their systems as the company moved from a monolithic to a distributed architecture [3,4,5]. One of the ways Twitter did this was by developing a command-line tool that engineers could use to create their dashboards to keep track of the charts they were creating. While Continuous Integration and Continuous Deliver/Deployment (CI/CD) tools and container technologies often bridge Dev and Ops in one direction, observability solutions close the loop in the opposite direction, from Ops to Dev [
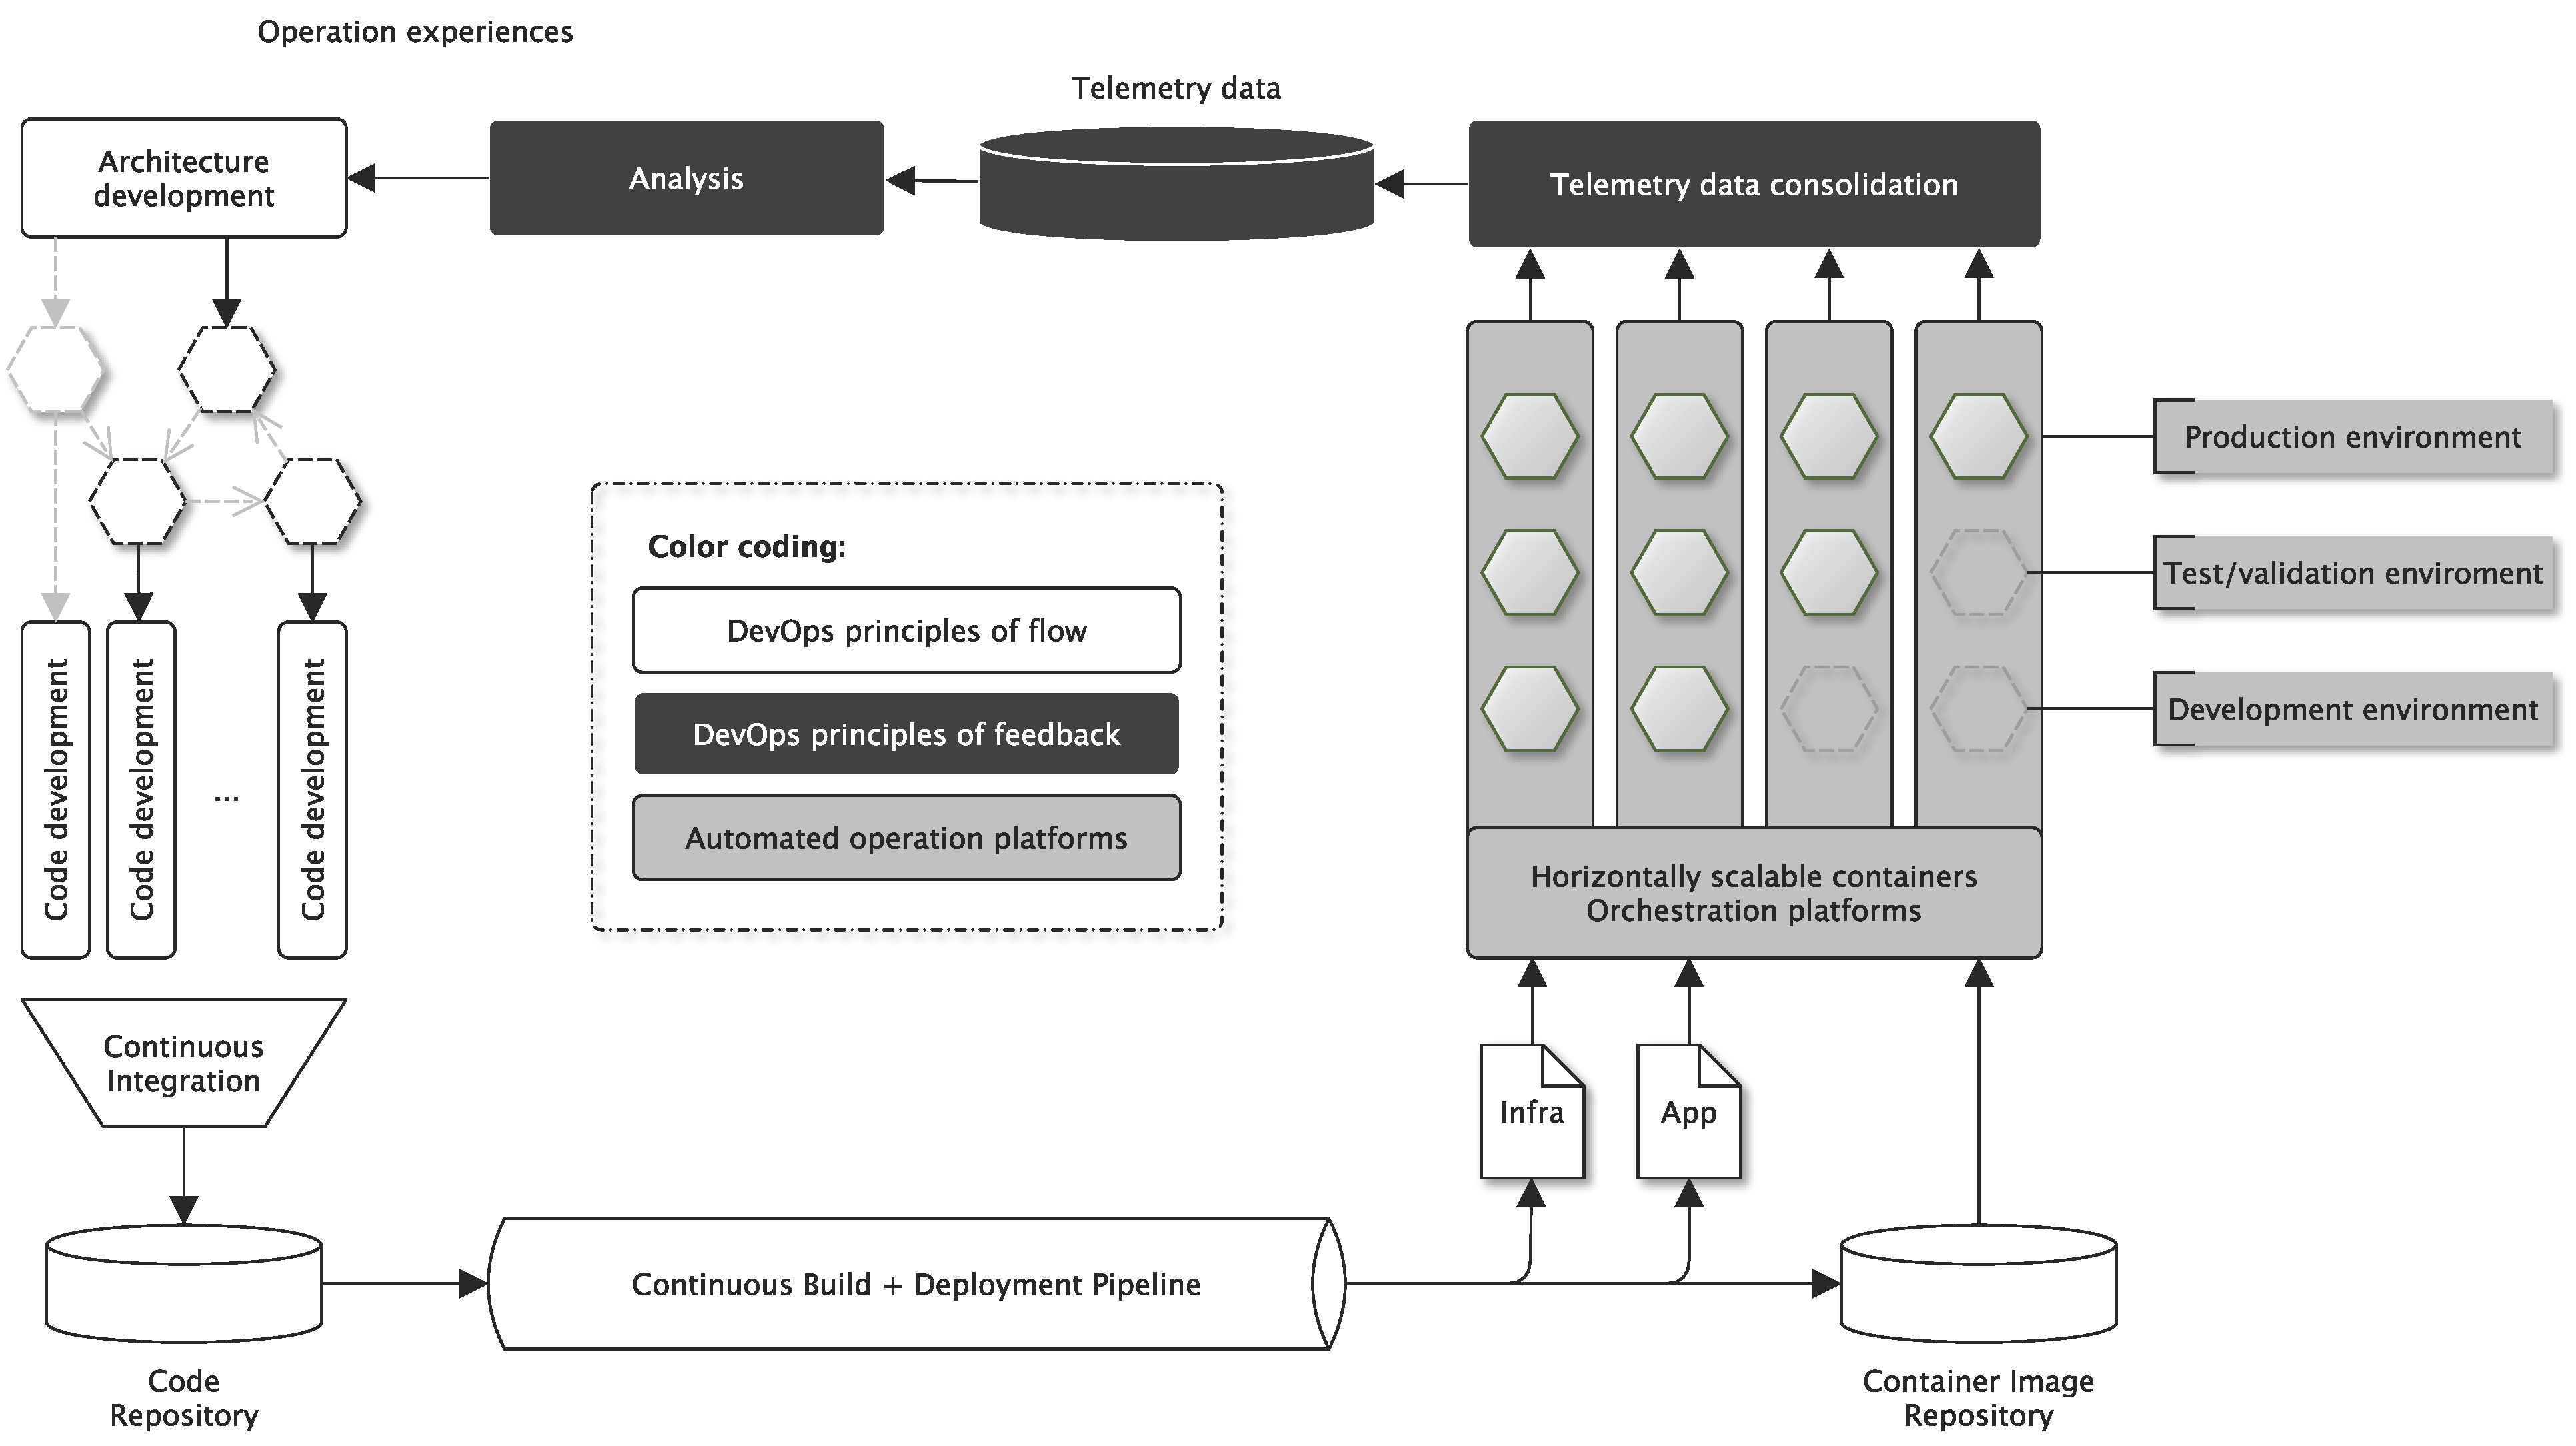
4]. Observability is thus the basis for data-driven software development (see Figure 1 and [6]). As developments around cloud(-native) computing progressed, more and more engineers began to “live in their dashboards”. They learned that it is not enough to collect and monitor data points but that it is necessary to address this problem more systematically.

2. Problem Description

Today, observability is often understood as a triad. Observability of distributed information systems is typically achieved through the collection and processing of metrics (quantitative data primarily as time-series), distributed tracing data (execution durations of complex system transactions that flow through services of a distributed system), and logging (qualitative data of discrete system events often associated with timestamps but encoded as unstructured strings). Consequently, three stacks of observability solutions have emerged, and the following somehow summarizes the current state of the art.
  • Metrics: Here, quantitative data are often collected in time series, e.g., how many requests a system is currently processing. The metrics technology stack is often characterized by tools such as Prometheus and Grafana.
  • Distributed tracing involves following the path of transactions along the components of a distributed system. The tracing technology stack is characterized by tools such as Zipkin or Jaeger, and the technologies are used to identify and optimize particularly slow or error-prone substeps of distributed transaction processing.
  • Logging is probably as old as software development itself, and many developers, because of the log ubiquity, are unaware that logging should be seen as part of holistic observability. Logs are usually stored in so-called log files. Primarily qualitative events are logged (e.g., user XYZ logs in/out). An event is usually attached to a log file in a text line. Often, the implicit and historically justifiable assumption prevails with developers that these log files are read and evaluated primarily by administrators (thus humans). However, this is hardly the case anymore. It is becoming increasingly common for the contents of these log files to be forwarded to a central database through “log forwarders” so that they can be evaluated and analyzed centrally. The technology stack is often characterized by tools such as Fluentd, FileBeat, LogStash for log forwarding, databases such as ElasticSearch, Cassandra or simply S3 and user interfaces such as Kibana.
Incidentally, all three observability pillars have in common that software to be developed must be somehow instrumented. This instrumentation is normally done using programming language-specific libraries. Developers often regard distributed tracing instrumentation in particular as time-consuming. In addition, which metric types (counter, gauge, histogram, history, and more) are to be used in metric observability solutions such as Prometheus often depends on Ops experience and is not always immediately apparent to developers. Certain observability hopes fail simply because of wrongly chosen metric types. Only system metrics such as Central Processing Unit (CPU), memory, and storage utilization can be easily captured in a black-box manner (i.e., without instrumentation in the code). However, these data are often only of limited use for the functional assessment of systems. For example, CPU utilization provides little information about whether conversion rates in an online store are developing in the desired direction.
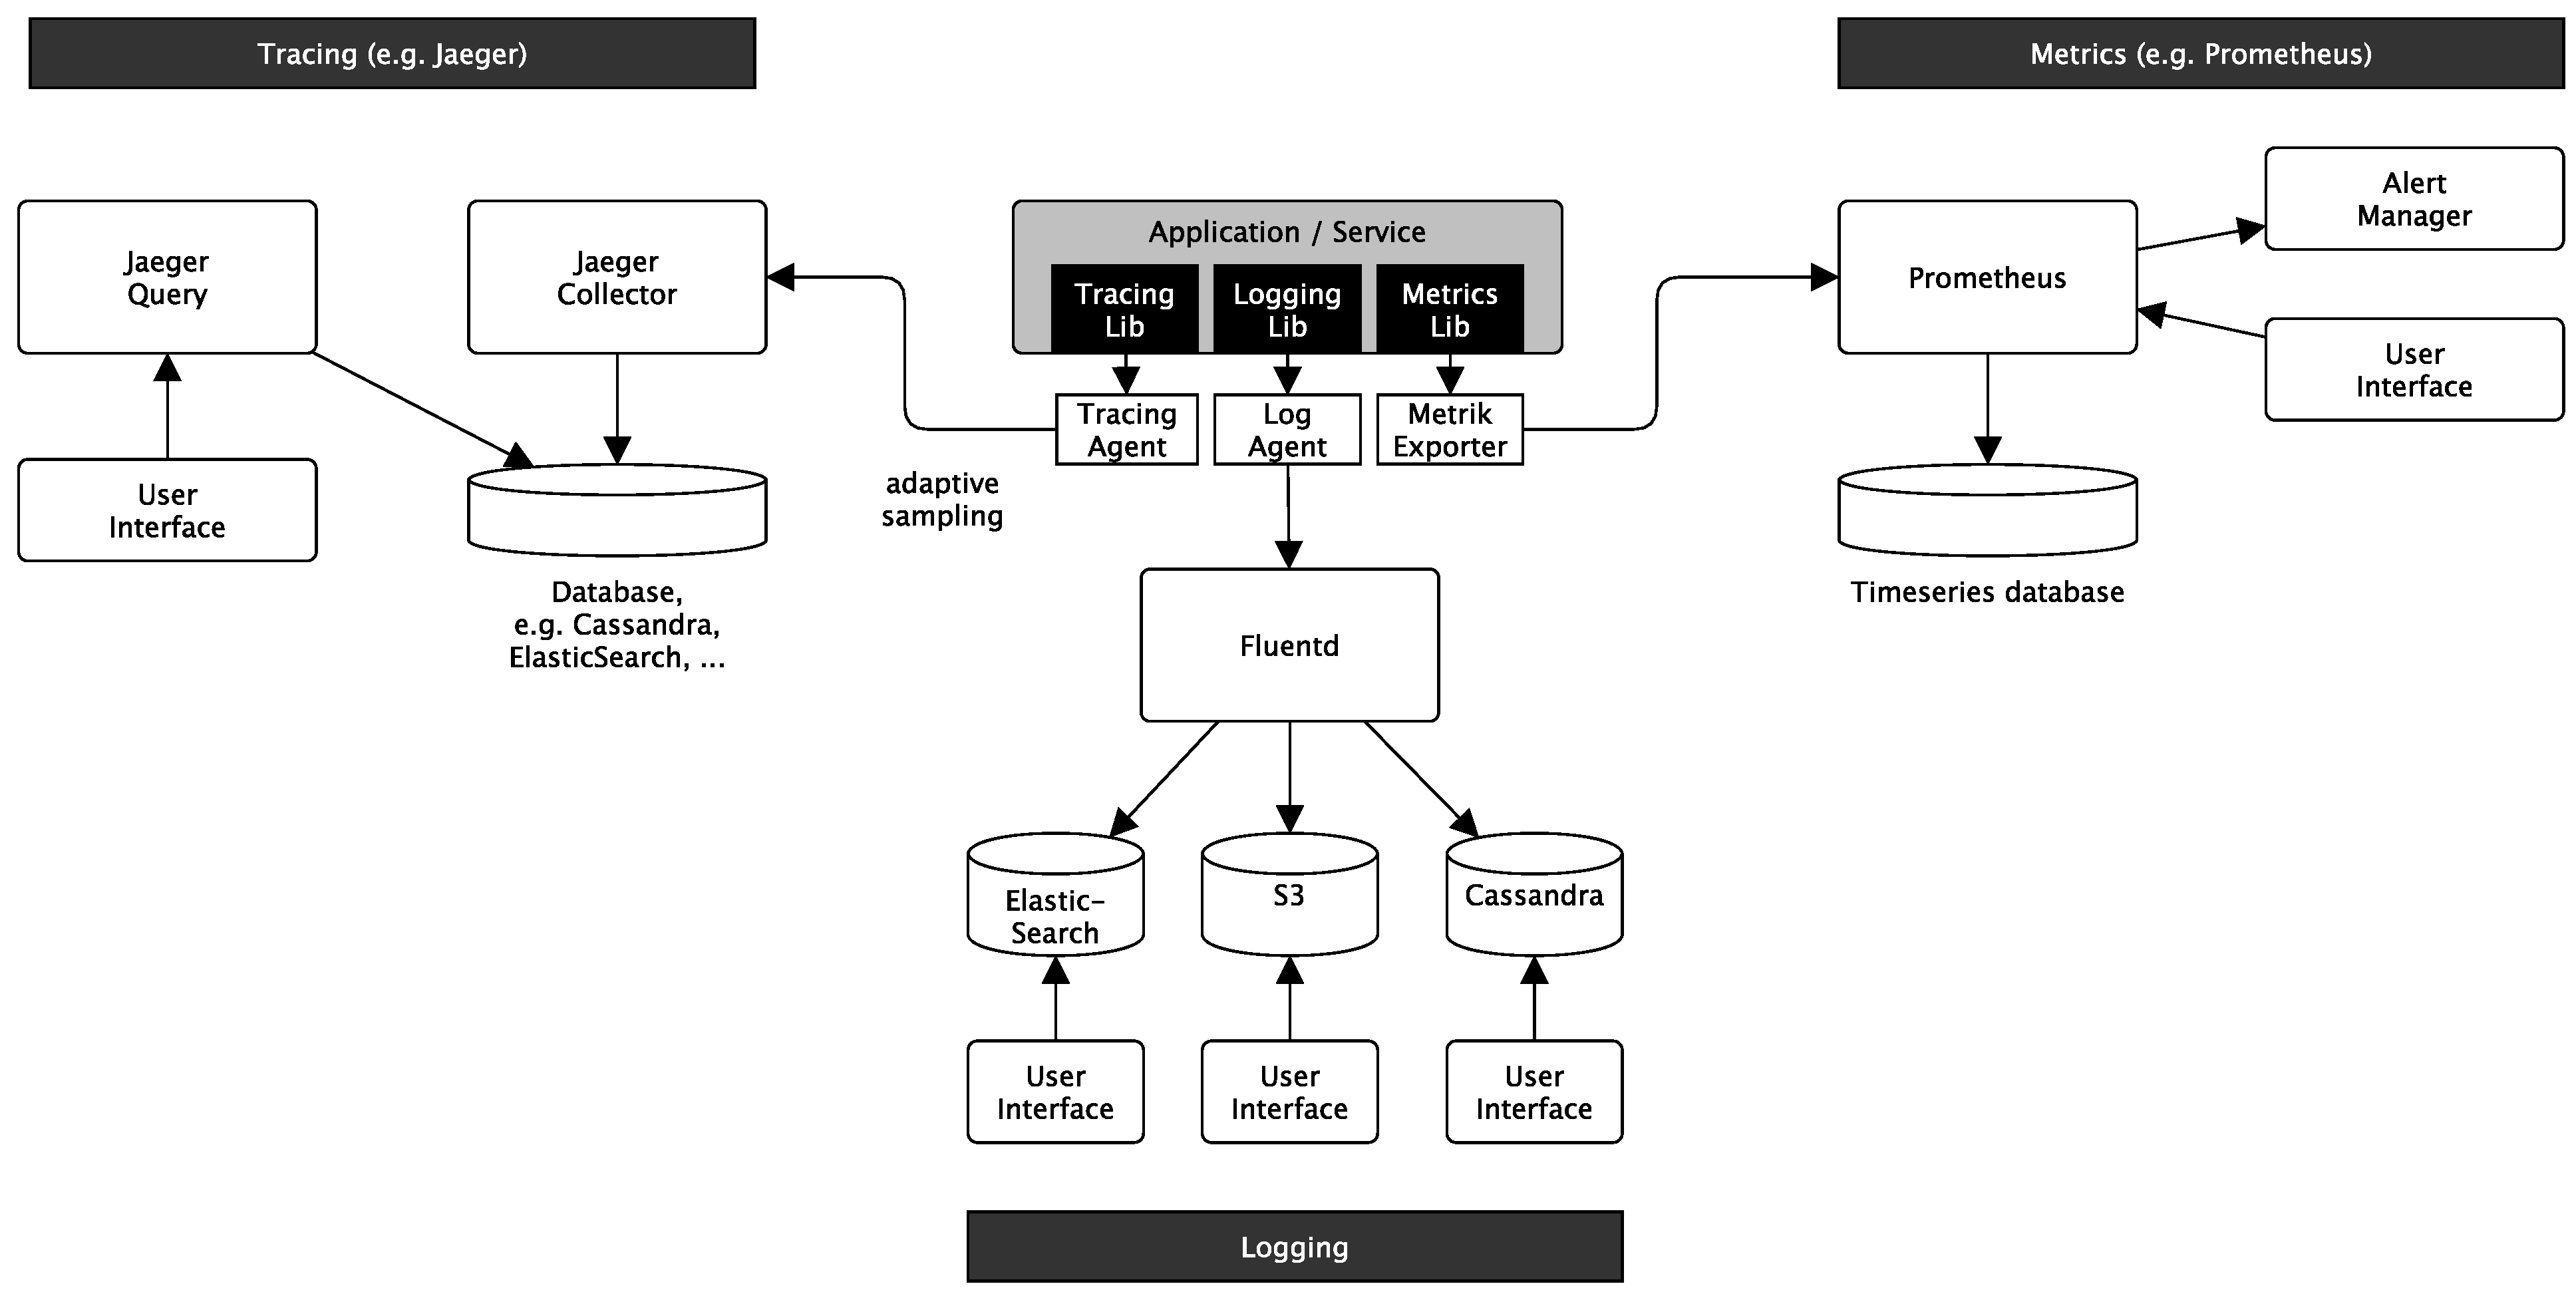
Thus, current observability solutions are often based on these three stovepipes for logs, metrics, and traces. The result is an application surrounded by a complex observability system whose isolated datasets can be difficult to correlate. Figure 2 focuses on the application (i.e., the object to be monitored) and triggers the question, whether it is justified to use three complex subsystems and three types of instrumentation, which always means three times the instrumentation and data analysis effort of isolated data silos.
The often-used tool combination of ElasticSearch, LogStash, and Kibana is used for logging and has even been given a catchy acronym: ELK-Stack [7,8]. The ELK stack can be used to collect metrics and using the Application Performance Management (APM) plugin [9] also for distributed tracing. Thus, at least for the ELK stack, the three stovepipes are not clearly separable or disjoint. The separateness is somewhat historically “suggested” rather than technologically given. Nevertheless, this tripartite division into metrics, tracing, and logging is very formative for the industry, as shown, for example, by the OpenTelemetry project [10]. OpenTelemetry is currently in the incubation stage at the Cloud Native Computing Foundation and provides a collection of standardized tools, Application Programming Interfaces (APIs), and Software Development Kits (SDKs) to instrument, generate, collect, and export telemetry data (metrics, logs, and traces) to analyze the performance and behaviour of software systems. OpenTelemetry thus standardizes observability but hardly aims to overcome the columnar separation into metrics, tracing, and logging.
In past and current industrial action research [4,6,11,12], I came across various cloud-native applications and corresponding engineering methodologies like the 12-factor app (see Section 4.1). However, this previous research was not primarily concerned with observability or instrumentation per se. Especially, no instrumentation libraries have been developed, like it was done in this research. Instrumentation and observability were—as so often—only used in the context of evaluation or assessment of system performance. The instrumentation usually followed the analysis stack used. Developers who perform Distributed Tracing use Distributed Tracing Libraries for instrumentation. Developers who perform metric instrumentation use metric libraries. Those who log events use logging libraries. This instrumentation approach is so obvious that hardly any developer thinks about it. However, the result is disjoint observability data silos. This paper takes up this observation and asks whether uniform instrumentation helps avoid these observability data silos. In various projects, we have used instrumentation oriented towards the least complex case, logging, and have only slightly extended it for metrics and distributed tracing.
We learned that the discussion around observability is increasingly moving beyond these three stovepipes and taking a more nuanced and integrated view. There is a growing awareness of integrating and unifying these three pillars, and more emphasis is being placed on analytics.
Each of the three pillars of observability (logs, metrics, traces) is little more than a specific application of time series analysis. Therefore, the obvious question is how to instrument systems to capture events in an unobtrusive way that operation platforms can efficiently feed them into existing time series analysis solutions [13]. In a perfect world, developers should not have to worry too much about such kind of instrumentation, whether it is qualitative events, quantitative metrics, or tracing data from transactions moving along the components of distributed systems.
In statistics, time series analysis deals with the inferential statistical analysis of time series. It is a particular form of regression analysis. The goal is often the prediction of trends (trend extrapolation) regarding their future development. Another goal might be detecting time series anomalies, which might indicate unwanted system behaviours. A time series is a chronologically ordered sequence of values or observations in which the arrangement of the results of the characteristic values necessarily from the course of time (e.g., stock prices, population development, weather data, but also typical metrics and events occurring in distributed systems, like CPU utilization or login-attempts of users).
The research question arises whether these three historically emerged observability stovepipes of logs, metrics and distributed traces could be handled in a more integrated way and with a more straightforward instrumentation approach. The results of this action research study show that this unification potential could be surprisingly easy to realize if we exploit consequently the shared characteristic of time-series analysis in all three stovepipes. This paper presents the followed research methodology in Section 3 and its results in Section 4 (including a logging prototype in Section 4.4 as the main contribution of this paper to the field). The evaluation of this logging prototype is presented in Section 5. A critical discussion is done in Section 6. Furthermore, the study presents related work in Section 7 and concludes its findings as well as future promising research directions in Section 8.

3. Methodology

This study followed the action research methodology as a proven and well-established research methodology model for industry-academia collaboration in the software engineering context to analyze the research-question mentioned above. Following the recommendations of Petersen et al. [14], a research design was defined that applied iterative action research cycles (see Figure 3):
  • Diagnosis (Diagnosing according to [14])
  • Prototyping (Action planning, design and taking according to [14])
  • Evaluation including a may be required redesign (Evaluation according to [14])
  • Transfer learning outcomes to further use cases (Specifying learning according to [14]).
With each of the following use cases, insights were transferred from the previous use case into a structured logging prototype (see Figure 3). The following use cases (UC) have been studied and evaluated.
  • Use Case 1: Observation of qualitative events occurring in an existing solution (online code editor; https://codepad.th-luebeck.dev (accessed on 20 September 2022), this use case was inspired by our research [15])
  • Use Case 2: Observation of distributed events along distributed services (distributed tracing in an existing solution of an online code editor, see UC1)
  • Use Case 3: Observation of quantitative data generated by a technical infrastructure (Kubernetes platform, this use case was inspired by our research [11,12,16])
  • Use Case 4: Observation of a massive online event stream to gain experiences with high-volume event streams (we used Twitter as a data source and tracked worldwide occurrences of stock symbols; this use case was inspired by our research [17]).

4. Results of the Software-Prototyping

The analysis of cloud-native methodologies like the 12-factor app [18] has shown that, to build observability, one should take a more nuanced and integrated view to integrate and unify these three pillars of metrics, traces, and logs to enable more agile and convenient analytics in feedback information flow in DevOps cycles (see Figure 1). Two aspects that gained momentum in cloud-native computing are of interest:
  • Recommendations on how to handle log forwarding and log consolidation in cloud-native applications;
  • Recommendations to apply structured logging.
Because both aspects guided the implementation of the logging prototype deeply, they will be explained in more detail providing the reader with the necessary context.

4.1. Twelve-Factor Apps

The 12-factor app is a method [18] for building software-as-a-service applications that pay special attention to the dynamics of organic growth of an application over time, the dynamics of collaboration between developers working together on a codebase, and avoiding the cost of software erosion. At its core, 12 rules (factors) should be followed to develop well-operational and evolutionarily developable distributed applications. This methodology harmonizes very well with microservice architecture approaches [3,19,20,21,22,23] and cloud-native operating environments like Kubernetes [24], which is why the 12-factor methodology is becoming increasingly popular. Incidentally, the 12-factor methodology does not contain any factor explicitly referring to observability, certainly not in the triad of metrics, tracing and logging. However, factor XI recommends how to handle logging:
Logs are the stream of aggregated events sorted by time and summarized from the output streams of all running processes and supporting services. Logs are typically a text format with one event per line. […]
A twelve-factor app never cares about routing or storing its output stream. It should not attempt to write to or manage log files. Instead, each running process writes its stream of events to stdout. […] On staging or production deploys, the streams of all processes are captured by the runtime environment, combined with all other streams of the app, and routed to one or more destinations for viewing or long-term archiving. These archiving destinations are neither visible nor configurable to the app—they are managed entirely from the runtime environment.

4.2. From Logging to Structured Logging

The logging instrumentation is quite simple for developers and works mainly programming language specific but basically according to the following principle illustrated in Python.
A logging library must often be imported, defining so-called log levels such as DEBUG, INFO, WARNING, ERROR, FATAL, and others. While the application is running, a log level is usually set via an environment variable, e.g., INFO. All log calls above this level are then written to a log file.
Futureinternet 14 00274 i001
For example, line 5 would create the following entry in a log file:
Futureinternet 14 00274 i002
In a 12-factor app, this logging would be configured so that events are written directly to Stdout (console). The runtime environment (e.g., Kubernetes with FileBeat service installed) then routes the log data to the appropriate database taking work away from the developer that they would otherwise have to invest in log processing. This type of logging is well supported across many programming languages and can be consolidated excellently with the ELK stack (or other observability stacks).
Logging (unlike distributed tracing and metrics collection) is often not even perceived as (complex) instrumentation by developers. Often, it is done on their own initiative. However, one can systematize this instrumentation somewhat and extend it to so-called “structured logging”. Again, the principle is straightforward. One simply does not log lines of text like
Futureinternet 14 00274 i003
but, instead, the same information in a structured form, e.g., using JSON:
Futureinternet 14 00274 i004
In both cases, the text is written to the console. In the second case, however, a structured text-based data format is used that is easier to evaluate. In the case of a typical logging statement like “User Max Mustermann tries to log in”, the text must first be analyzed to determine the user. This text parsing is costly on a large scale and can also be very computationally intensive and complex if there is plenty of log data in a variety of formats (which is the common case in the real world).
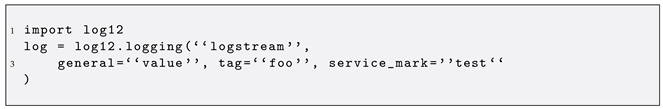
However, in the case of structured logging, this information can be easily extracted from the JavaScript Object Notation (JSON) data field “user". In particular, more complex evaluations become much easier with structured logging as a result. However, the instrumentation does not become significantly more complex, especially since there are logging libraries for structured logging. The logging looks in the logging prototype log12 of this study like this:
Futureinternet 14 00274 i005
The resulting log files are still readable for administrators and developers (even if a bit more unwieldy) but much better processable and analyzable by databases such as ElasticSearch. Quantitative metrics can also be recorded in this way. Structured logging can thus also be used for the recording of quantitative metrics:
Futureinternet 14 00274 i006
Furthermore, this structured logging approach can also be used to create tracings. In distributed tracing systems, a trace identifier (ID) is created for each transaction that passes through a distributed system. The individual steps are so-called spans. These are also assigned an identifier (span ID). The span ID is then linked to the trace ID, and the runtime is measured and logged. In this way, the time course of distributed transactions can be tracked along the components involved, and, for example, the duration of individual processing steps can be determined.

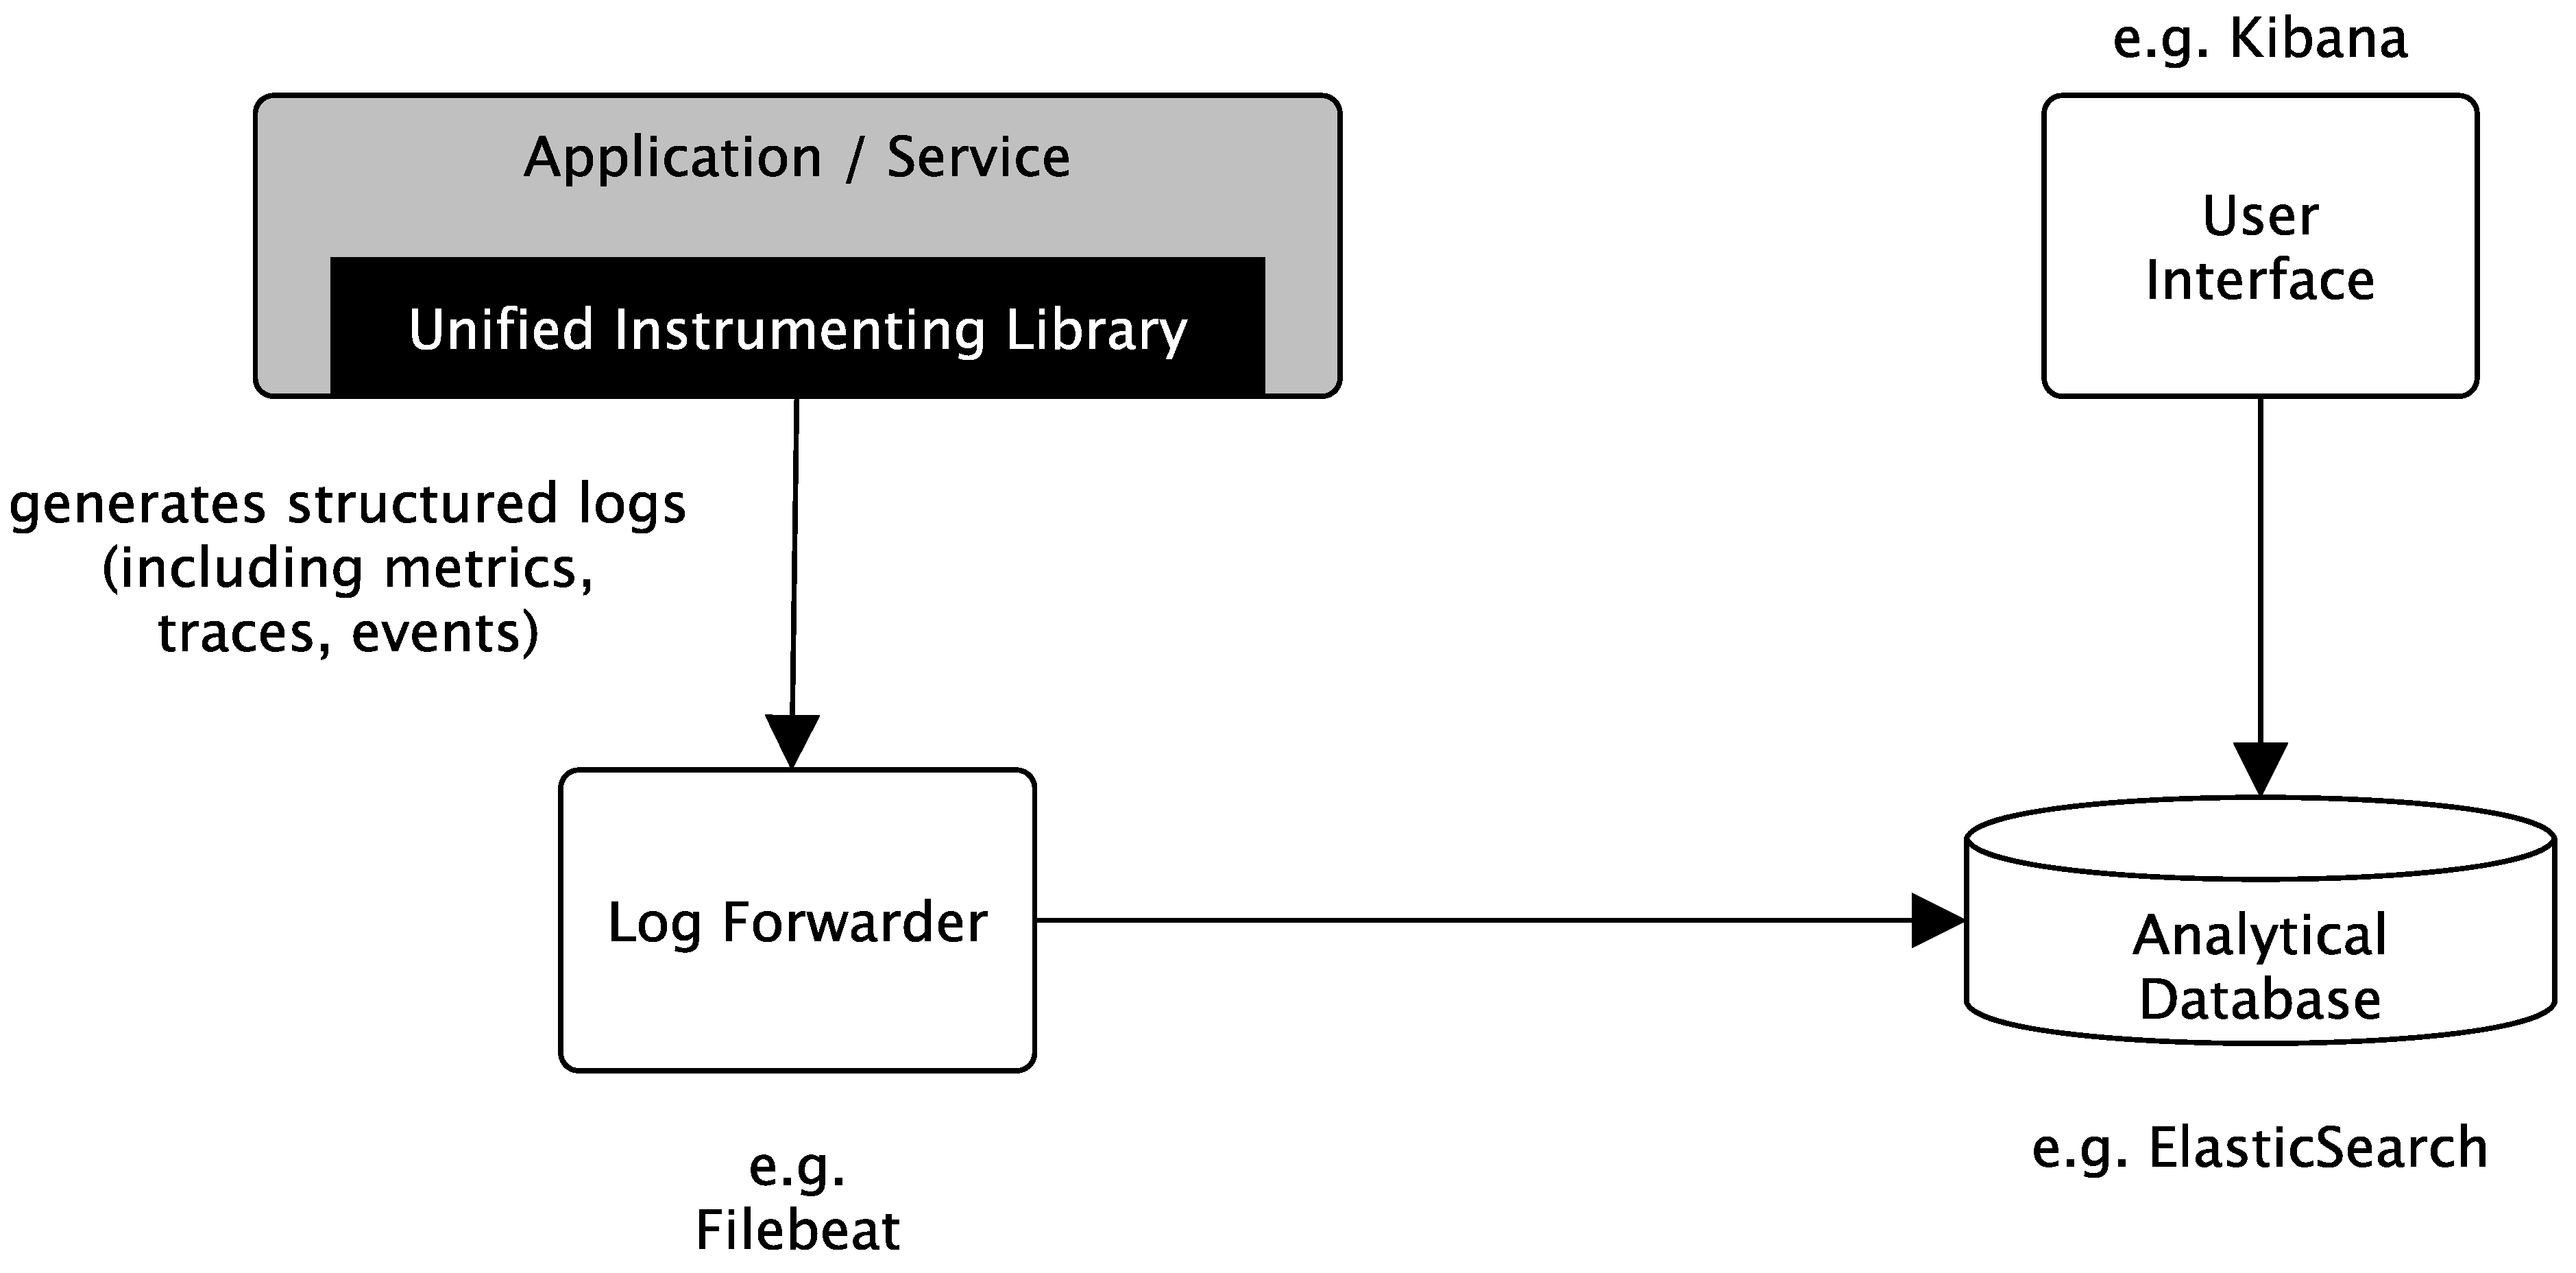
4.3. Resulting and Simplified Logging Architecture

Thus, the two principles to print logs simply to standard outout (stdout) and to log in a structured and text-based data format are applied consequently. The resulting observability system complexity thus reduces from Figure 2 to Figure 4 because all system components can collect log, metric, and trace information in the same style that can be routed seamlessly from an operation platform provided log forwarder (already existing technology) to a central analytical database.

4.4. Study Outcome: Unified Instrumentation via a Structured Logging Library (Prototype)

This paper will briefly explain below the way to capture events, metrics, and traces using the logging prototype that emerged. The prototype library log12 was developed in Python 3 but can be implemented in other programming languages analogously.
log12 will create automatically for each event additional key–value attributes like a unique identifier (that is used to relate child events to parent events and even remote events in distributed tracing scenarios) and start and completion timestamps that can be used to measure the runtime of events (although known from distributed tracing libraries but not common for logging libraries). It is explained:
  • how to create a log stream;
  • how an event in a log stream is created and logged;
  • how a child event can be created and assigned to a parent event (to trace and record runtimes of more complex and dependent chains of events within the same process);
  • and how to make use of the distributed tracing features to trace events that pass through a chain of services in a distributed service of services system).
The following lines of code create a log stream with the name “logstream” that is logged to stdout, see Listing 1:
Listing 1. Creating an event log stream in log12.
Futureinternet 14 00274 i007
Each event and child events of this stream are assigned a set of key–value pairs:
  • general = “value”
  • tag = “foo”
  • service_mark = “test”
These log-stream-specific key–value pairs can be used to define selection criteria in analytical databases like ElasticSearch to filter events of a specific service only. The following lines of code demonstrate how to create a parent event and child events, see Listing 2.
Listing 2. Event logging in log12 using blocks as structure.
Futureinternet 14 00274 i008
Furthermore, it is possible to log events in the event stream without the block style, see Listing 3. That might be necessary for programming languages that do not support closing resources (here a log stream) at the end of a block. In this case, programmers are responsible for closing events using the .info(), .warn(), .error() log levels.
Listing 3. Event logging in log12 without blocks.
Futureinternet 14 00274 i009
Using this type of logging to forward events along Hypertext Transfer Protocol (HTTP) requests is also possible. This usage of HTTP-Headers is the usual method in distributed tracing. Two main capabilities are required for this [25]. First, extracting header information received by an HTTP service process must be possible. Secondly, it must be possible to inject the tracing information in follow-up upstream HTTP requests (in particular, the trace ID and span ID of the process initiating the request).
Listing 4 shows how log12 supports this with an extract attribute at event creation and an inject method of the event that extracts relevant key–value pairs from the event so that they can be passed as header information along an HTTP request.
Listing 4. Extraction and injection of tracing headers in log12.
Futureinternet 14 00274 i010

5. Evaluation of the Logging Prototype

The study evaluated the software prototype in the defined use cases to determine its suitability for capturing qualitative events, quantitative metrics, and traces in distributed systems. The evaluation also performed long-term recordings of high-volume event streams in the sense of stress tests:
  • The study designed the use cases 1 and 2 mainly to evaluate the instrumentation of qualitative system events;
  • Use case 3 was primarily used to capture quantitative metrics that often occur in IT infrastructures or platforms and are essential to multi-level observability;
  • Use case 4 was used to monitor systems that were intentionally not under the direct control of the researchers and, therefore, could not be instrumented directly. Furthermore, the use case was intended to provide insight into both long-term detection and the detection of high-volume event streams.

5.1. Evaluation of Use Cases 1 and 2 (Event-Focused Observation of a Distributed Service)

Use Cases 1 and 2: Codepad is an online coding tool to share quickly short code snippets in online and offline teaching scenarios. It has been introduced during the Corona Pandemic shutdowns to share short code snippets mainly in online educational settings for 1st or 2nd semester computer science students. Meanwhile, the tool is used in presence lectures and labs as well. The reader is welcome to try out the tool at https://codepad.th-luebeck.dev (accessed on 20 September 2022). This study used the Codepad tool in its steps 1, 2, 3, and 4 of its action research methodology as an instrumentation use case (see Figure 3) to evaluate the instrumentation of qualitative system events according to Section 4.4. Figure 5 shows the Web-UI on the left and the resulting dashboard on the right. In a transfer step (steps 12, 13, 14, and 15 of the action research methodology, see Figure 3), the same product was used to evaluate distributed tracing instrumentation (not covered in detail by this report).

5.2. Evaluation of Use Case 3 (Metrics-Focused Observation of Infrastructure)

The Use Case 3 (steps 5, 6, 7, 8 of research methodology; Figure 3) observed an institute’s infrastructure, the so-called myLab infrastructure. myLab (Available online: https://mylab.th-luebeck.de) (accessed on 20 September 2022) is a virtual laboratory that can be used by students and faculty staff to develop and host web applications. This use case was chosen to demonstrate that it is possible to collect primarily metrics based data over a long term using the same approach as in Use Case 1. A pod tracked mainly the resource consumption of various differing workloads deployed by more than 70 student web projects of different university courses. To observe this resource consumption, the pod simply run periodically
  • kubectl top nodes;
  • kubectl top pods –all-namespaces
against the cluster. This observation pod parsed the output of both shell commands and printed the parsed results in the structured logging approach presented in Section 4.4. Figure 6 shows the resulting Kibana dashboard for demonstration purposes.

5.3. Evaluation of Use Case 4 (Long-Term and High-Volume Observation)

The Use Case 4 (steps 9, 10, 11 of research methodology; Figure 3) left our own ecosystem and observed the public Twitter Event stream as a type representative for a high-volume and long-term observation of an external system. Thus, a system that was intentionally not under the direct administrative control of the study investigators. The Use Case 4 was designed as a two-phase study.

5.3.1. Screening Phase of Use Case 4

The first screening phase was designed to gain experiences in logging high volume event streams and to provide necessary features and performance optimizations to the structured logging library prototype. The screening phase was designed to screen the complete and representative Twitter traffic as a kind of “ground truth”. We were interested in the distribution of languages and stock symbols in relation to the general Twitter “background noise”. This screening phase lasted from 20 January 2022 to 30 January 2022 and identified most used stock symbols (see Figure 7).

5.3.2. Long-Term Evaluation Phase of Use Case 4

A long-term recording was then done as a second long-term evaluation phase and was used to track and record the most frequent used stock symbols identified in the screening phase. This evaluation phase lasted from February 2022 until the middle of August 2022. In this evaluation phase, just one infrastructure downtime occurred due to a shutdown of electricity of the author’s institute. However, this downtime was not due to or related to the presented unified logging stack (see Figure 8).

5.3.3. The Instrumentation Approach Applied in Both Phases

The recording was done using the following source code, see Listing 5, compiled into a Docker container, that has been executed on a Kubernetes cluster that has been logged in Use Cases 1, 2, and 3. FileBeat was used as a log forwarding component to a background ElasticSearch database. The resulting event log has been analyzed and visualized using Kibana. Kibana was used as well to collect the data in form of CSV-Files for the screening and the evaluation phase. Figure 7, Figure 9 and Figure 10 have been compiled from that data. This setting followed the unified and simplified logging architecture presented in Figure 4 exactly.
Listing 5. The used logging program to record Twitter stock symbols from the public Twitter Stream API.
Futureinternet 14 00274 i011 Futureinternet 14 00274 i012

5.3.4. Observed and Recorded Twitter Behaviour in Both Phases of Use Case 4

According to Figure 7 and Figure 8, just every 100th observed event in the screening phase was a stock symbol. That is simply the “ground-truth” on Twitter. If one is observing the public Twitter stream without any filter, that is what you get. Thus, the second evaluation phase recorded a very specific “filter bubble” of the Twitter stream. The reader should be aware that the data presented in the following is a clear bias and not a representative Twitter event stream; it is clearly a stock market focused subset or, to be even more precise, a cryptocurrency focused subset, because almost all stock symbols on Twitter are related to cryptocurrencies.
It is possible to visualize the resulting effects using the recorded data. Figure 9 shows the difference in language distributions of the screening phase (unfiltered ground-truth) and the evaluation phase (activated symbol filter). However, in the screening phase, English (en), Spanish (es), Portugese (pt), and Turkish (tr) are responsible for more than 3/4 of all traffic; in the evaluation phase, almost all recorded Tweets are in English. Thus, on Twitter, the most stock symbol related language is clearly English.
Although the cryptocurrency logging was used mainly as a use case for technical evaluation purposes of the logging library prototype, some interesting insights could be gained. For example, although Bitcoin (BTC) is likely the most prominent cryptocurrency, it is by far not the most frequently used stock symbol on Twitter. The most prominent stock symbols on Twitter are:
  • ETH: Ethereum cryptocurrency;
  • SOL: Solana cryptocurrency;
  • BTC: Bitcoin cryptocurrency;
  • LUNA: Terra Luna cryptocurrency (replaced by a new version after the crash in May 2022);
  • BNB: Binance Coin cryptocurrency.
Furthermore, we can see interesting details in trends (see Figure 10).
  • The ETH usage on Twitter seems to reduce throughout our observed period;
  • The SOL usage is, on the contrary, increasing, although we observed a sharp decline in July.
  • The LUNA usage has a clear peak that correlates with the LUNA cryptocurrency crash in the middle of May 2022 (this crash was heavily reflected in the investor media).
The Twitter usage was not correlated with the currency rates in cryptocurrency stock markets. However, changes in usage patterns of stock market symbols might be of interest for cryptocurrency investors as interesting indicators to observe. As this study shows, these changes can be easily tracked using structured logging approaches. Of course, this can be transferred to other social media streaming or general event streaming use cases like IoT (Internet of Things) as well.

6. Discussion

This style of a unified and structured observability was successfully evaluated on several use cases that made usage of a FileBeat/ElasticSearch-based observability stack. However, other observability stacks that can forward and parse structured text in a JSON-format will likely show the same results. The evaluation included a long-term test over more than six months for a high-volume evaluation use-case.
  • On the one hand, it could be proven that such a type of logging can easily be used to perform classic metrics collections. For this purpose, BlackBox metrics such as CPU, memory, and storage for the infrastructure (nodes) but also the “payload” (pods) were successfully collected and evaluated in several Kubernetes clusters (see Figure 6).
  • Second, a high-volume use case was investigated and analyzed in-depth. Here, all English-language tweets on the public Twitter stream were logged. About 1 million events per hour were logged over a week and forwarded to an ElasticSearch database using the log forwarder FileBeat. Most systems will generate far fewer events (see Figure 7).
  • In addition, the prototype logging library log12 is meanwhile used in several internal systems, including web-based development environments, QR code services, and e-learning systems, to record access frequencies to learning content, and to study learning behaviours of students.

6.1. Lessons Learned

All use cases have shown that structured logging is easy to instrument and harmonizes well with existing observability stacks (esp. Kubernetes, Filebeat, ElasticSearch, Kibana). However, some aspects should be considered:
  • It is essential to apply structured logging, since this can be used to log events, metrics, and traces in the same style.
  • Very often, only error-prone situations are logged. However, if you want to act in the sense of DevOps-compliant observability, you should also log normal—completely regular—behaviour. DevOps engineers can gain many insights from how normal users use systems in standard situations. Thus, the log level should be set to INFO, and not WARNING, ERROR, or below.
  • Cloud-native system components should rely on the log forwarding and log aggregation of the runtime environment. Never implement this on your own. You will double logic and end up with complex and may be incompatible log aggregation systems.
  • To simplify analysis for engineers, one should push key–value pairs of parent events down to child events. This logging approach simplifies analysis in centralized log analysis solutions—it simply reduces the need to derive event contexts that might be difficult to deduce in JSON document stores. However, this comes with the cost of more extensive log storage.
  • Do not collect aggregated metrics data. The aggregation (mean, median, percentile, standard deviations, sum, count, and more) can be done much more conveniently in the analytical database. The instrumentation should focus on recording metrics data in a point-on-time style. According to our developer experience, developers are happy to be authorized to log only such simple metrics, especially when there is not much background knowledge in statistics.

6.2. Threats of Validity and to Be Considered Limitations of the Study Design

Action research is prone to drawing incorrect or non-generalizable conclusions. Logically, the significance is consistently the highest within the considered use cases. In order to minimize such kind of risks, the reader should consider the following threats on validity (see [26,27]):
  • Construct validity refers to the question, whether the employed measures appropriately reflect the constructs they represent.
  • Internal validity refers to the question of whether observed relationships are due to a cause–effect relationship. Thus, it is only relevant for case studies in which a cause–effect is to be determined [28], which is not the case for the presented software prototype study.
  • External validity refers to the question of whether the findings of the case study can be generalized.
  • Reliability or experimental validity refers to the question of whether the study can be repeated with the same results.
Therefore, considerations on construct and external validity are reported as well as considerations on repeatability.

6.2.1. Considerations on Construct Validity

In order to draw generalizable conclusions, this study defined use cases in such a way that intentionally different classes of telemetry data (logs, metrics, traces) were considered. It should be noted that the study design primarily considered logs and metrics but traces only marginally. Traces were not wholly neglected, however, but were analyzed less intensively. However, the study design deliberately covered logs, traces, and metrics to see if they could be recorded using a consistent instrumentation approach. This instrumentation approach was designed to generate a structured time-series dataset that can be consolidated and analyzed using existing observability tool stacks.
The study evaluated the resulted software prototype in four use cases to determine its suitability for capturing qualitative events, quantitative metrics, and traces in distributed systems. The evaluation also performed long-term recordings of high-volume event streams in the sense of stress tests. Although this setting was constructed to cover a broad range of web-service and web-application domains, outside the scope of this setting, the study outcomes should not be taken to draw any conclusions. For instance, the reader should not make any assumptions on the applicability in hard real-time scenarios where microsecond latencies often have to be considered.

6.2.2. Considerations on External Validity

This study did the proof of concept by creating a software prototype for the Python 3 programming language on the instrumentation side and using the ELK stack on the analysis side. Nevertheless, further efforts are needed for transferring the results to other programming languages and observability stacks. Since both basic principles (structured logging and time-series databases and analyses) can be assumed to be known and mastered, the reader can expect no significant difficulties of a technical nature here.
The long-term acquisition was performed with a high-volume use case to cover certain stress test aspects. However, the reader must be aware that the screening phase generated significantly higher data volumes in Use Case 4 than the evaluation phase. Therefore, to use stress test data from this study, one should look at the event volume of the screening phase of Use Case 4. Here, about ten thousand events per minute were logged for more than a week giving an impression of the performance of the proposed approach. The study data show that the saturation limit should be far beyond these ten thousand events per minute. However, the study design did not push the system to its event recording saturation limits.
Furthermore, this study should not be used to derive any cryptocurrency related conclusions. Although some interesting aspects from Use Case 4 could be of interest for cryptocurrency trading indicator generation, no detailed analysis on correlations between stock prices and usage frequencies of stock symbols on Twitter have been done.

6.2.3. Considerations on Repeatability

To give the reader the opportunity to reproduce the use cases presented here, source code from log12 [29] has been made available as open source software. We also reported on the applied observability stack that has been used in this study (ELK-Stack).

7. Related Work

The three pillars of metrics, traces, and logs have also been tackled in a recently published survey on anomaly detection and root cause analysis [30]. However, very often observability is reduced on tools and benchmarks for automated log parsing [31] or interesting publications like [32] focus on advances and challenges in log analysis. Publications like [33,34] report on empirical studies regarding how developers log or how to improve logging in general. Studies like [35,36] focus more on anomaly detection in logs. However, all log-related studies are meanwhile a bit outdated. In addition, very often logging is related to log file analysis in the context of IT security and anomaly detection only [37].
More recent studies look at observability from a more all-encompassing point of view. Ref. [38] focus explicitly on the observability and monitoring of distributed systems. Ref. [39] focuses microservices in this observability context. Ref. [40] focuses the need of multi-level observability especially in orchestration approaches. In addition, Ref. [41] considers scalable observability data management. An interesting and recent overview on observability of distributed edge and container-based microservices is provided by [42]. This survey provides a list of microservice-focused managed and unified observability services (Dynatrace, Datadog, New Relic, Sumo Logic, Solar Winds, Honeycomb). The presented research prototype of this study heads into the same direction but tries to pursue the problem primarily on the instrumenting side using a more lightweight and unified approach. Thus, to address the client-side of the problem is obviously harder economical exploitable, which is why the industry might address the problem preferably on the managed service side.
Of logs, metrics, and distributed traces, distributed tracing is still considered in the most detail. In particular, the papers around Dapper [25] (a large-scale distributed systems tracing infrastructure initially operated by Google) should be mentioned here, which had a significant impact on this field. A black box approach without instrumenting needs for distributed tracing is presented by [43]. It reports on end-to-end performance analysis of large-scale internet services mainly by statistical means. However, these black-box approaches are pretty limited in their expressiveness since operations must record large data sets to derive transactions along distributed systems’ components simply due to their observable network behaviour. In the meantime, it has become an abode to accept the effort of white-box instrumentation to be able to determine and statistically evaluate precise transaction processes. In this context, Ref. [44] compares and evaluates existing open tracing tools. Ref. [45] provides an overview of how to trace distributed component-based systems. In addition, Ref. [46] focuses on automated analysis of distributed tracing and corresponding challenges and research directions. This study, however, has seen tracing as only one of three aspects of observability and therefore follows a broader approach. Most importantly, this study has placed its focus on the instrumentation side of observability and less on the database and time series analysis side.

7.1. Existing Instrumenting Libraries and Observability Solutions

Although the academic coverage of the observability field is expandable, in practice, there is an extensive set of existing solutions, especially for time series analysis and instrumentation. A complete listing is beyond the scope of this paper. However, from the disproportion of the number of academic papers to the number of real existing solutions, one quickly recognizes the practical relevance of the topic. Table 1 contains a list of existing database products often used for telemetry data consolidation to give the reader an overview without claiming completeness. This study used ElasticSearch as an analytical database.
Table 2 lists several frequently used forwarding solutions that developers can use to forward data from the point of capture to the databases listed in Table 1. In the context of this study, FileBeat was used as a log forwarding solution. It could be proved that this solution is also capable of forwarding traces and metrics if applied in a structured logging setting.
An undoubtedly incomplete overview of instrumentation libraries for different products and languages is given in Table 3, presumably because each programming language comes with its own form of logging in the shape of specific libraries. To avoid this language-binding is hardly possible in the instrumentation context unless one pursues “esoteric approaches” like [43]. The logging library prototype is strongly influenced by the Python standard logging library but also by structlog for structured logging but without actually using these libraries.

7.2. Standards

There are hardly any observability standards. However, a noteworthy standardization approach is the OpenTelemetry Specification [10] of the Cloud Native Computing Foundation [66], which tries to standardize the way of instrumentation. This approach corresponds to the core idea, which this study also follows. Nevertheless, the standard is still divided into Logs [67], Metrics [68] and Traces [69], which means that the conceptual triad of observability is not questioned. On the other hand, approaches like the OpenTelemetry Operator [70] for Kubernetes enable injecting auto-instrumentation libraries for Java, Node.js and Python into Kubernetes operated applications, which is a feature that is currently not addressed by the present study. However, so-called service meshes [71,72] also use auto-instrumentation. A developing standard here is the so-called Service Mesh Interface (SMI) [73].

8. Conclusions and Future Research Directions

Cloud-native software systems often have a much more decentralized structure and many independently deployable and (horizontally) scalable components, making it more complicated to create a shared and consolidated picture of the overall decentralized system state [74,75]. Today, observability is often understood as a triad of collecting and processing metrics, distributed tracing data, and logging—but why except for historical reasons?
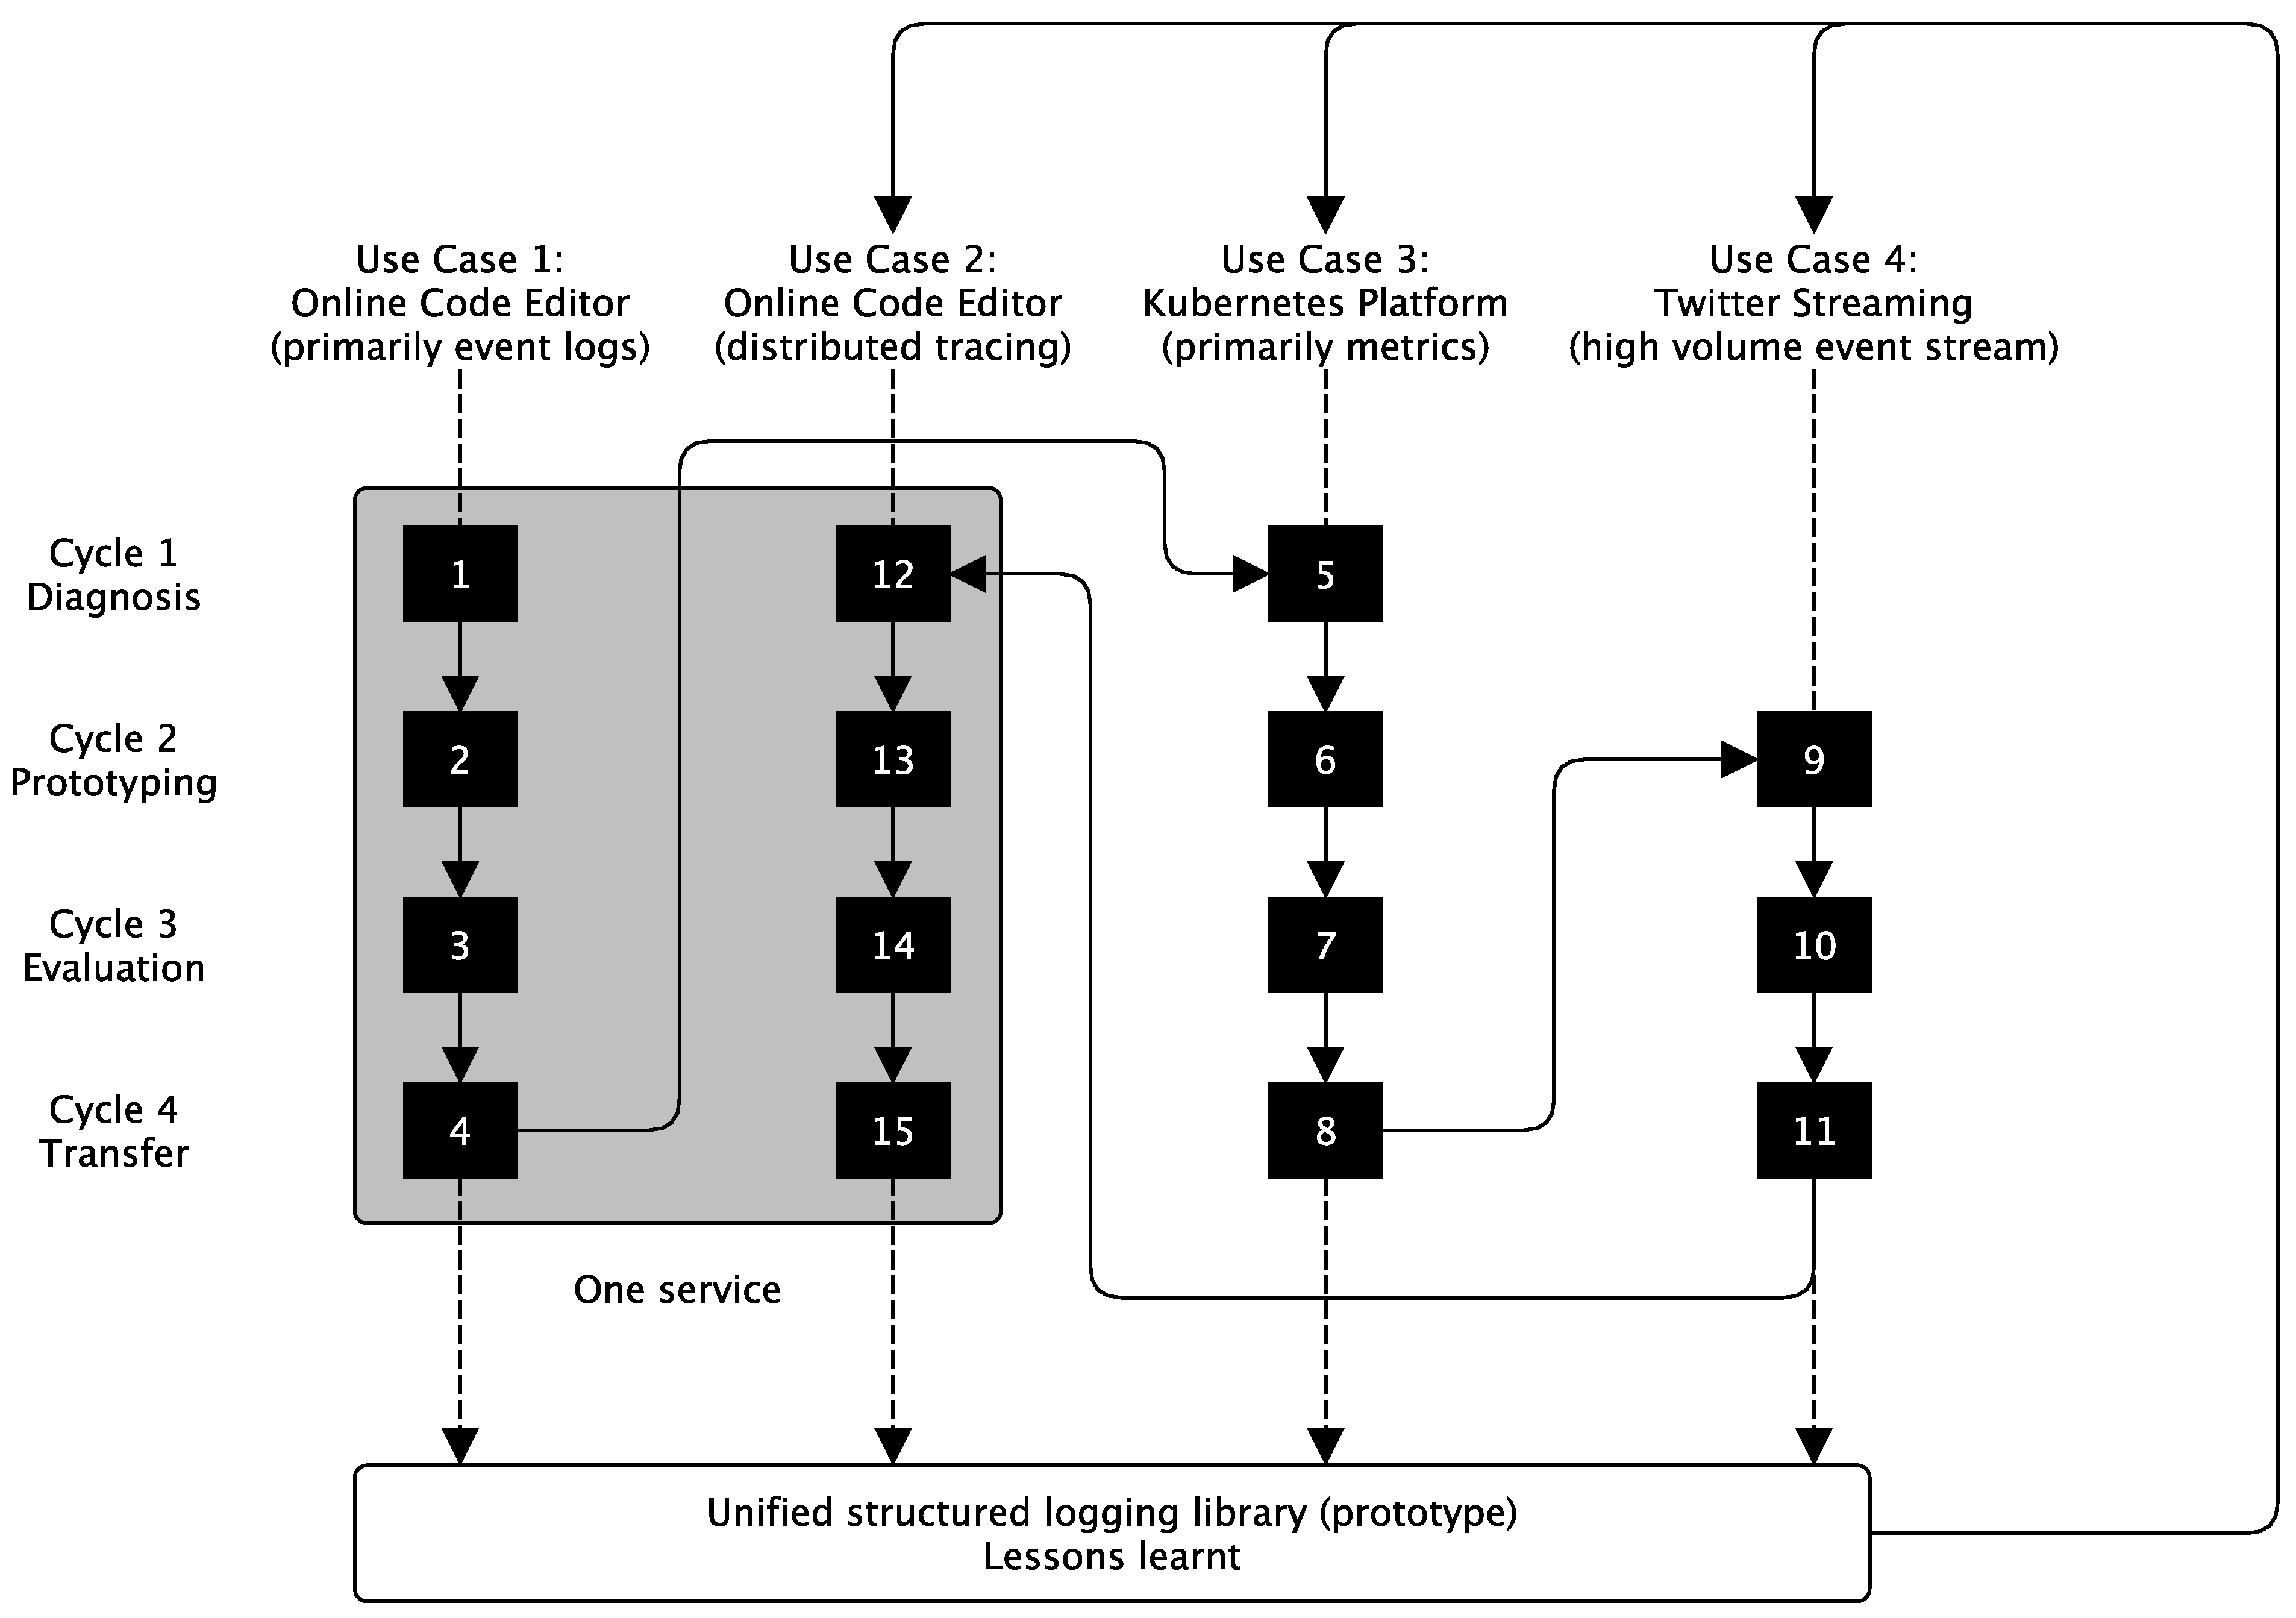
This study presents a unified logging library for Python [29] and a unified logging architecture (see Figure 4) that uses a structured logging approach. The evaluation of four use cases shows that several thousand events per minute are easily processable and can be used to handle logs, traces, and metrics the same. At least, this study was able with a straightforward approach to log the world-wide Twitter event stream of stock market symbols over a period of six months without any noteworthy problems. As a side effect, some interesting aspects of how crypto-currencies are reflected on Twitter could be derived. This might be of minor relevance for this study but shows the overall potential of a unified and structured logging based observability approach.
The presented approach relies on an easy-to-use programming language-specific logging library that follows the structured logging approach. The long-term observation results of more than six months indicate that a unification of the current observability triad of logs, metrics, and traces is possible without the necessity to develop utterly new toolchains. The reason is the flexibility of the underlying structured logging approach. This kind of flexibility is a typical effect of data format standardization. The trick is to
  • use structured logging and
  • apply log forwarding to a central analytical database
  • in a systematic infrastructure- or platform-provided way.
Further research should therefore be concentrated on the instrumenting and less on the log forwarding and consolidation layer. If we instrument logs, traces, and metrics in the same style using the same log forwarding, we automatically generate correlatable data in a single data source of truth, and we simplify analysis.
Thus, the observability road ahead may have several paths. On the one hand, we should standardize the logging libraries in a structured style like log12 in this study or the OpenTelemetry project in the “wild”. Logging libraries should be comparably implemented in different programming languages and shall generate the same structured logging data. Thus, we have to standardize the logging SDKs and the data format. Both should be designed to cover logs, metrics, and distributed traces in a structured format. To simplify instrumentation further, we should additionally think about auto-instrumentation approaches, for instance, proposed by the OpenTelemetry Kubernetes Operator [70] and several Service Meshes like Istio [76,77] and corresponding standards like SMI [73].

Funding

This research received no external funding.

Data Availability Statement

The resulting research prototype of the developed structured logging library log12 can be accessed here [29]. However, the reader should be aware, that this is prototyping software in progress.

Conflicts of Interest

The author declares no conflict of interest.

References

  1. Kalman, R. On the general theory of control systems. IFAC Proc. Vol. 1960, 1, 491–502. [Google Scholar] [CrossRef]
  2. Kalman, R.E. Mathematical Description of Linear Dynamical Systems. J. Soc. Ind. Appl. Math. Ser. A Control 1963, 1, 152–192. [Google Scholar] [CrossRef]
  3. Newman, S. Building Microservices, 1st ed.; O’Reilly Media, Inc.: Sebastopol, CA, USA, 2015. [Google Scholar]
  4. Kim, G.; Humble, J.; Debois, P.; Willis, J.; Forsgren, N. The DevOps Handbook: How to Create World-Class Agility, Reliability, & Security in Technology Organizations; IT Revolution: Sebastopol, CA, USA, 2016. [Google Scholar]
  5. Davis, C. Cloud Native Patterns: Designing Change-Tolerant Software; Simon and Schuster: New York, NY, USA, 2019. [Google Scholar]
  6. Kratzke, N. Cloud-Native Computing: Software Engineering von Diensten und Applikationen für die Cloud; Carl Hanser Verlag GmbH Co. KG: Munich, Germany, 2021. [Google Scholar]
  7. Rochim, A.F.; Aziz, M.A.; Fauzi, A. Design Log Management System of Computer Network Devices Infrastructures Based on ELK Stack. In Proceedings of the 2019 International Conference on Electrical Engineering and Computer Science (ICECOS), Batam Island, Indonesia, 2–3 October 2019; pp. 338–342. [Google Scholar]
  8. Lahmadi, A.; Beck, F. Powering monitoring analytics with elk stack. In Proceedings of the 9th International Conference on Autonomous Infrastructure, Management and Security (Aims 2015), Ghent, Belgium, 22–25 June 2015. [Google Scholar]
  9. APM Authors. APM: Application Performance Monitoring. 2022. Available online: https://www.elastic.co/observability/application-performance-monitoring (accessed on 20 September 2022).
  10. The OpenTelemetry Authors. The OpenTelemetry Specification. 2021. Available online: https://github.com/open-telemetry/opentelemetry-specification/releases/tag/v1.12.0 (accessed on 20 September 2022).
  11. Kratzke, N.; Quint, P.C. Understanding Cloud-native Applications after 10 Years of Cloud Computing-A Systematic Mapping Study. J. Syst. Softw. 2017, 126, 1–16. [Google Scholar] [CrossRef]
  12. Kratzke, N. A Brief History of Cloud Application Architectures. Appl. Sci. 2018, 8, 1368. [Google Scholar] [CrossRef]
  13. Bader, A.; Kopp, O.; Falkenthal, M. Survey and comparison of open source time series databases. In Datenbanksysteme für Business, Technologie und Web (BTW 2017)-Workshopband; Gesellschaft für Informatik: Bonn, Germany, 2017. [Google Scholar]
  14. Petersen, K.; Gencel, C.; Asghari, N.; Baca, D.; Betz, S. Action Research as a Model for Industry-Academia Collaboration in the Software Engineering Context. In Proceedings of the 2014 International Workshop on Long-Term Industrial Collaboration on Software Engineering, WISE ’14, Vasteras, Sweden, 16 September 2014; Association for Computing Machinery: New York, NY, USA, 2014; pp. 55–62. [Google Scholar] [CrossRef]
  15. Kratzke, N. Smart Like a Fox: How clever students trick dumb programming assignment assessment systems. In Proceedings of the 11th International Conference on Computer Supported Education (CSEDU 2019), Heraklion, Greece, 2–4 May 2019. [Google Scholar]
  16. Truyen, E.; Kratzke, N.; Van Landuyt, D.; Lagaisse, B.; Joosen, W. Managing Feature Compatibility in Kubernetes: Vendor Comparison and Analysis. IEEE Access 2020, 8, 228420–228439. [Google Scholar] [CrossRef]
  17. Kratzke, N. The #BTW17 Twitter Dataset-Recorded Tweets of the Federal Election Campaigns of 2017 for the 19th German Bundestag. Data 2017, 2, 34. [Google Scholar] [CrossRef]
  18. Wiggins, A. The Twelve-Factor App. 2017. Available online: https://12factor.net (accessed on 20 September 2022).
  19. Dragoni, N.; Giallorenzo, S.; Lafuente, A.L.; Mazzara, M.; Montesi, F.; Mustafin, R.; Safina, L. Microservices: Yesterday, today, and tomorrow. In Present and Ulterior Software Engineering; Springer: Berlin/Heidelberg, Germany, 2017; pp. 195–216. [Google Scholar]
  20. Taibi, D.; Lenarduzzi, V.; Pahl, C. Architectural patterns for microservices: A systematic mapping study. In Proceedings of the CLOSER 2018: The 8th International Conference on Cloud Computing and Services Science, Funchal, Portugal, 19–21 March 2018; SciTePress: Setubal, Portugal, 2018. [Google Scholar]
  21. Di Francesco, P.; Lago, P.; Malavolta, I. Architecting with microservices: A systematic mapping study. J. Syst. Softw. 2019, 150, 77–97. [Google Scholar] [CrossRef]
  22. Soldani, J.; Tamburri, D.A.; Van Den Heuvel, W.J. The pains and gains of microservices: A systematic grey literature review. J. Syst. Softw. 2018, 146, 215–232. [Google Scholar] [CrossRef]
  23. Baškarada, S.; Nguyen, V.; Koronios, A. Architecting microservices: Practical opportunities and challenges. J. Comput. Inf. Syst. 2020, 60, 428–436. [Google Scholar] [CrossRef]
  24. The Kubernetes Authors. Kubernetes, 2014. Available online: https://kubernetes.io (accessed on 20 September 2022).
  25. Sigelman, B.H.; Barroso, L.A.; Burrows, M.; Stephenson, P.; Plakal, M.; Beaver, D.; Jaspan, S.; Shanbhag, C. Dapper, a Large-Scale Distributed Systems Tracing Infrastructure; Technical Report; Google, Inc.: Mountain View, CA, USA, 2010. [Google Scholar]
  26. Feldt, R.; Magazinius, A. Validity Threats in Empirical Software Engineering Research-An Initial Survey. In Proceedings of the SEKE, San Francisco, CA, USA, 1–3 July 2010. [Google Scholar]
  27. Wohlin, C.; Runeson, P.; Höst, M.; Ohlsson, M.C.; Regnell, B.; Wesslén, A. Case Studies. In Experimentation in Software Engineering; Springer: Berlin/Heidelberg, Germany, 2012; pp. 55–72. [Google Scholar] [CrossRef]
  28. Yin, R. Case Study Research and Applications: Design and Methods; Supplementary Textbook; SAGE Publications: New York, NY, USA, 2017. [Google Scholar]
  29. Kratzke, N. log12-a Single and Self-Contained Structured Logging Library. 2022. Available online: https://github.com/nkratzke/log12 (accessed on 20 September 2022).
  30. Soldani, J.; Brogi, A. Anomaly Detection and Failure Root Cause Analysis in (Micro) Service-Based Cloud Applications: A Survey. ACM Comput. Surv. 2022, 55, 1–39. [Google Scholar] [CrossRef]
  31. Zhu, J.; He, S.; Liu, J.; He, P.; Xie, Q.; Zheng, Z.; Lyu, M.R. Tools and benchmarks for automated log parsing. In Proceedings of the 2019 IEEE/ACM 41st International Conference on Software Engineering: Software Engineering in Practice (ICSE-SEIP), Montreal, QC, Canada, 25–31 May 2019; pp. 121–130. [Google Scholar]
  32. Oliner, A.; Ganapathi, A.; Xu, W. Advances and challenges in log analysis. Commun. ACM 2012, 55, 55–61. [Google Scholar] [CrossRef]
  33. Fu, Q.; Zhu, J.; Hu, W.; Lou, J.G.; Ding, R.; Lin, Q.; Zhang, D.; Xie, T. Where do developers log? an empirical study on logging practices in industry. In Proceedings of the Companion Proceedings of the 36th International Conference on Software Engineering, Hyderabad, India, 31 May–7 June 2014; pp. 24–33. [Google Scholar]
  34. Zhu, J.; He, P.; Fu, Q.; Zhang, H.; Lyu, M.R.; Zhang, D. Learning to log: Helping developers make informed logging decisions. In Proceedings of the 2015 IEEE/ACM 37th IEEE International Conference on Software Engineering, Florence, Italy, 16–24 May 2015; Volume 1, pp. 415–425. [Google Scholar]
  35. Guan, Q.; Fu, S. Adaptive anomaly identification by exploring metric subspace in cloud computing infrastructures. In Proceedings of the 2013 IEEE 32nd International Symposium on Reliable Distributed Systems, Braga, Portugal, 1–3 October 2013; pp. 205–214. [Google Scholar]
  36. Pannu, H.S.; Liu, J.; Fu, S. Aad: Adaptive anomaly detection system for cloud computing infrastructures. In Proceedings of the 2012 IEEE 31st Symposium on Reliable Distributed Systems, Irvine, CA, USA, 8–11 October 2012; pp. 396–397. [Google Scholar]
  37. He, S.; Zhu, J.; He, P.; Lyu, M.R. Experience report: System log analysis for anomaly detection. In Proceedings of the 2016 IEEE 27th International Symposium on Software Reliability Engineering (ISSRE), Ottawa, ON, Canada, 23–27 October 2016; pp. 207–218. [Google Scholar]
  38. Niedermaier, S.; Koetter, F.; Freymann, A.; Wagner, S. On observability and monitoring of distributed systems–an industry interview study. In Proceedings of the International Conference on Service-Oriented Computing, Dubai, United Arab Emirates, 14–17 December 2019; Springer: Berlin/Heidelberg, Germany, 2019; pp. 36–52. [Google Scholar]
  39. Marie-Magdelaine, N.; Ahmed, T.; Astruc-Amato, G. Demonstration of an observability framework for cloud native microservices. In Proceedings of the 2019 IFIP/IEEE Symposium on Integrated Network and Service Management (IM), Bordeaux, France, 18–19 May 2021; pp. 722–724. [Google Scholar]
  40. Picoreti, R.; do Carmo, A.P.; de Queiroz, F.M.; Garcia, A.S.; Vassallo, R.F.; Simeonidou, D. Multilevel observability in cloud orchestration. In Proceedings of the 2018 IEEE 16th Intl Conf on Dependable, Autonomic and Secure Computing, 16th Intl Conf on Pervasive Intelligence and Computing, 4th Intl Conf on Big Data Intelligence and Computing and Cyber Science and Technology Congress (DASC/PiCom/DataCom/CyberSciTech), Athens, Greece, 12–15 August 2018; pp. 776–784. [Google Scholar]
  41. Karumuri, S.; Solleza, F.; Zdonik, S.; Tatbul, N. Towards observability data management at scale. ACM SIGMOD Rec. 2021, 49, 18–23. [Google Scholar] [CrossRef]
  42. Usman, M.; Ferlin, S.; Brunstrom, A.; Taheri, J. A Survey on Observability of Distributed Edge & Container-based Microservices. IEEE Access 2022, 10, 86904–86919. [Google Scholar] [CrossRef]
  43. Chow, M.; Meisner, D.; Flinn, J.; Peek, D.; Wenisch, T.F. The Mystery Machine: End-to-end Performance Analysis of Large-scale Internet Services. In Proceedings of the 11th USENIX Symposium on Operating Systems Design and Implementation (OSDI 14), Carlsbad, CA, USA, 11–13 July 2022; USENIX Association: Broomfield, CO, USA, 2014; pp. 217–231. [Google Scholar]
  44. Janes, A.; Li, X.; Lenarduzzi, V. Open Tracing Tools: Overview and Critical Comparison. arXiv 2022, arXiv:2207.06875. [Google Scholar] [CrossRef]
  45. Falcone, Y.; Nazarpour, H.; Jaber, M.; Bozga, M.; Bensalem, S. Tracing distributed component-based systems, a brief overview. In Proceedings of the International Conference on Runtime Verification, Limassol, Cyprus, 10–13 November 2018; Springer: Berlin/Heidelberg, Germany, 2018; pp. 417–425. [Google Scholar]
  46. Bento, A.; Correia, J.; Filipe, R.; Araujo, F.; Cardoso, J. Automated Analysis of Distributed Tracing: Challenges and Research Directions. J. Grid Comput. 2021, 19, 9. [Google Scholar] [CrossRef]
  47. ElasticSearch Authors. ElasticSearch Database. 2022. Available online: https://www.elastic.co/elasticsearch/ (accessed on 20 September 2022).
  48. InfluxDB Authors. InfluxDB Time Series Data Platform. 2022. Available online: https://www.influxdata.com/ (accessed on 20 September 2022).
  49. Jaeger Authors. Jaeger. 2022. Available online: https://jaegertracing.io (accessed on 20 September 2022).
  50. OpenSearch Authors. OpenSearch. 2022. Available online: https://opensearch.org (accessed on 20 September 2022).
  51. Prometheus Authors. Prometheus. 2022. Available online: https://prometheus.io (accessed on 20 September 2022).
  52. Zipkin Authors. Zipkin. 2022. Available online: https://zipkin.io (accessed on 20 September 2022).
  53. Fluentd Authors. Fluentd. 2022. Available online: https://fluentd.org (accessed on 20 September 2022).
  54. Flume Authors. Flume. 2022. Available online: https://flume.apache.org (accessed on 20 September 2022).
  55. LogStash Authors. LogStash. 2022. Available online: https://www.elastic.co/logstash (accessed on 20 September 2022).
  56. FileBeat Authors. FileBeat. 2022. Available online: https://www.elastic.co/filebeat (accessed on 20 September 2022).
  57. Rsyslog Authors. RSYSLOG-The Rocket-Fast Syslog Server. 2020. Available online: https://www.rsyslog.com (accessed on 20 September 2022).
  58. Syslog-Ng Authors. Syslog-Ng. 2022. Available online: https://www.syslog-ng.com (accessed on 20 September 2022).
  59. Go Standard Library Authors. Log. 2022. Available online: https://pkg.go.dev/log (accessed on 20 September 2022).
  60. Log4j Authors. Log4j. 2022. Available online: https://logging.apache.org/log4j/2.x (accessed on 20 September 2022).
  61. Python Standard Library Authors. Logging. 2022. Available online: https://docs.python.org/3/howto/logging.html (accessed on 20 September 2022).
  62. Micrometer Authors. Micrometer Application Monitor. 2022. Available online: https://micrometer.io/ (accessed on 20 September 2022).
  63. Splunk APM Authors. Splunk Application Performance Monitoring. 2022. Available online: https://www.splunk.com/en_us/products/apm-application-performance-monitoring.html (accessed on 20 September 2022).
  64. Schlawack, H. Structlog. 2022. Available online: https://pypi.org/project/structlog (accessed on 20 September 2022).
  65. Winston Authors. Winston. 2022. Available online: https://github.com/winstonjs/winston (accessed on 20 September 2022).
  66. Linux Foundation. Cloud-Native Computing Foundation, 2015. Available online: https://cncf.io (accessed on 20 September 2022).
  67. The OpenTelemetry Authors. The OpenTelemetry Specification-Logs Data Model. 2021. Available online: https://opentelemetry.io/docs/reference/specification/logs/data-model/ (accessed on 20 September 2022).
  68. The OpenTelemetry Authors. The OpenTelemetry Specification-Metrics SDK. 2021. Available online: https://opentelemetry.io/docs/reference/specification/metrics/sdk/ (accessed on 20 September 2022).
  69. The OpenTelemetry Authors. The OpenTelemetry Specification-Tracing SDK. 2021. Available online: https://opentelemetry.io/docs/reference/specification/trace/sdk/ (accessed on 20 September 2022).
  70. The OpenTelemetry Authors. The OpenTelemetry Operator. 2021. Available online: https://github.com/open-telemetry/opentelemetry-operator (accessed on 20 September 2022).
  71. Li, W.; Lemieux, Y.; Gao, J.; Zhao, Z.; Han, Y. Service mesh: Challenges, state of the art, and future research opportunities. In Proceedings of the 2019 IEEE International Conference on Service-Oriented System Engineering (SOSE), San Francisco, CA, USA, 4–9 April 2019; pp. 122–1225. [Google Scholar]
  72. Malki, A.E.; Zdun, U. Guiding architectural decision making on service mesh based microservice architectures. In Proceedings of the European Conference on Software Architecture, Paris, France, 9–13 September 2019; Springer: Berlin/Heidelberg, Germany, 2019; pp. 3–19. [Google Scholar]
  73. Service Mesh Interface Authors. SMI: A Standard Interface for Service Meshes on Kubernetes. 2022. Available online: https://smi-spec.io (accessed on 20 September 2022).
  74. Al-Debagy, O.; Martinek, P. A comparative review of microservices and monolithic architectures. In Proceedings of the 2018 IEEE 18th International Symposium on Computational Intelligence and Informatics (CINTI), Budapest, Hungary, 21–22 November 2018; pp. 000149–000154. [Google Scholar]
  75. Balalaie, A.; Heydarnoori, A.; Jamshidi, P.; Tamburri, D.A.; Lynn, T. Microservices migration patterns. Softw. Pract. Exp. 2018, 48, 2019–2042. [Google Scholar] [CrossRef]
  76. Sheikh, O.; Dikaleh, S.; Mistry, D.; Pape, D.; Felix, C. Modernize digital applications with microservices management using the istio service mesh. In Proceedings of the 28th Annual International Conference on Computer Science and Software Engineering, Toronto, ON, Canada, 29–31 October 2018; pp. 359–360. [Google Scholar]
  77. Istio Authors. The Istio Service Mesh. 2017. Available online: https://istio.io/ (accessed on 20 September 2022).
Figure 1. Observability can be seen as a feedback channel from Ops to Dev (adopted from [4,6]).
Futureinternet 14 00274 g001
Figure 2. An application is quickly surrounded by a complex observability system when metrics, tracing, and logs are captured with different observability stacks.
Futureinternet 14 00274 g002
Figure 3. Action research methodology of this study.
Futureinternet 14 00274 g003
Figure 4. An observability system consistently based on structured logging with significantly reduced complexity.
Futureinternet 14 00274 g004
Figure 5. Use Cases 1 and 2: Codepad is an online coding tool to share quickly short code snippets in online and offline teaching scenarios—on the left, the Web-UI; on the right, the Kibana Dashboard used for observability in this study. Codepad was used as an instrumentation object of investigation.
Futureinternet 14 00274 g005
Figure 6. Use Case 3: The dashboard of the Kubernetes infrastructure under observation (myLab).
Futureinternet 14 00274 g006
Figure 7. Recorded events (screening phase of use case 4).
Futureinternet 14 00274 g007
Figure 8. Recorded events (long-term evaluation phase of use case 4).
Futureinternet 14 00274 g008
Figure 9. Observed languages (screening and evaluation phase of Use Case 4).
Futureinternet 14 00274 g009
Figure 10. Recorded symbols per day (evaluation phase of Use Case 4).
Futureinternet 14 00274 g010
Table 1. Often seen databases for telemetry data consolidation. Products used in this study are marked bold ⊗, without claiming completeness.
ProductOrganizationLicenseOften Seen Scope
APM [9]ElasticApache 2.0Tracing (add-on to ElasticSearch database)
ElasticSearch ⊗ [47]ElasticApache/Elastic License 2.0Logs, Tracing, (rarely Metrics)
InfluxDB [48]InfluxdataMITMetrics
Jaeger [49]Linux FoundationApache 2.0Tracing
OpenSearch [50]Amazon Web ServicesApache 2.0Logs, Tracing, (rarely Metrics); fork from ElasticSearch
Prometheus [51]Linux FoundationApache 2.0Metrics
Zipkin [52]OpenZipkinApache 2.0Tracing
Table 2. Often seen forwarding solutions for log consolidation. Products used in this study are marked bold ⊗, without claiming completeness.
ProductOrganizationLicense
Fluentd [53]FluentD ProjectApache 2.0
Flume [54]ApacheApache 2.0
LogStash [55]ElasticApache 2.0
FileBeat ⊗ [56]ElasticApache/Elastic License 2.0
Rsyslog [57]AdisconGPL
syslog-ng [58]One IdentityGPL
Table 3. Often seen instrumenting libraries. Products that inspired the research prototype are marked bold ⊗, without claiming completeness.
ProductUse CaseOrganizationLicenseRemark
APM Agents ⊗ [9]TracingElasticBSD 3
Jaeger Clients [49]TracingLinux FoundationApache 2.0
log [59]LoggingGo Standard LibraryBSD 3Logging for Go
log4j [60]LoggingApacheApache 2.0Logging for Java
logging ⊗ [61]LoggingPython Standard LibraryGPL compatibleLogging for Python
Micrometer [62]MetricsPivotalApache 2.0
Open Telemetry [10]TracingOpen TelemetryApache 2.0
prometheus [51]MetricsLinux FoundationApache 2.0
Splunk APM [63]TracingSplunkApache 2.0
structlog ⊗ [64]LoggingHynek SchlawackApache 2.0, MITstructured logging for Python
winston [65]LoggingCharlie RobbinsMITLogging for node.js
Publisher’s Note: MDPI stays neutral with regard to jurisdictional claims in published maps and institutional affiliations.

