Article

Author Identification from Literary Articles with Visual Features: A Case Study with Bangla Documents

1
Department of Computational Science, Brainware University, Kolkata 700125, India
2
Department of Computer Science, West Bengal State University, Kolkata 700126, India
3
Techno Main Saltlake, Kolkata 700091, India
4
Department of Computer Science and Engineering, Aliah University, Kolkata 700156, India
5
Department of Computer Science, University of Évora, 7000-671 Évora, Portugal
6
ALGORITMI Research Center, Vista Lab, University of Évora, 7000-671 Évora, Portugal
*
Author to whom correspondence should be addressed.
Future Internet 2022, 14(10), 272; https://doi.org/10.3390/fi14100272
Submission received: 12 August 2022 / Revised: 17 September 2022 / Accepted: 18 September 2022 / Published: 23 September 2022
(This article belongs to the Special Issue Deep Learning and Natural Language Processing)

Abstract

:
Author identification is an important aspect of literary analysis, studied in natural language processing (NLP). It aids identify the most probable author of articles, news texts or social media comments and tweets, for example. It can be applied to other domains such as criminal and civil cases, cybersecurity, forensics, identification of plagiarizer, and many more. An automated system in this context can thus be very beneficial for society. In this paper, we propose a convolutional neural network (CNN)-based author identification system from literary articles. This system uses visual features along with a five-layer convolutional neural network for the identification of authors. The prime motivation behind this approach was the feasibility to identify distinct writing styles through a visualization of the writing patterns. Experiments were performed on 1200 articles from 50 authors achieving a maximum accuracy of 93.58%. Furthermore, to see how the system performed on different volumes of data, the experiments were performed on partitions of the dataset. The system outperformed standard handcrafted feature-based techniques as well as established works on publicly available datasets.

1. Introduction

The task of an author identification system is to recognize the respective author of an article from a set of authors. From the machine learning perspective, this task can be viewed as a multiclass text categorization problem where the classes identify the authors. Identifying authors from texts or paragraphs of poems, novels, essays, and stories can prove significant for a literary analysis. The proposed system can be beneficial to students for retrieving information regarding a major subject, e.g., literature. Furthermore, in some scenarios, various literary articles are encountered without author’s identification. This system can help users identify the respective author of the article in question. The style of writing depends on an author’s linguistic choice reflecting in one’s piece of art. One of the current and emanating fashion in author identification tasks is to extract the features from the piece of art computationally rather than extracting them manually, demanding the development of an automatic author identification system. Author identification can also be used in different natural language processing fields that involve criminal and civil law, bibliometrics, plagiarism detection, cybersecurity, forensics, and many more.
However, this is not a trivial task because of the occurrence of similar words and phrases within texts. At times, certain works of literature are inspired by works from different writers, leading to interclass similarities. The study of stylometry and author identification or profiling started back in the 19th century when Mendenhall [1] characterized the writing pattern of different authors using the frequency distribution of terms of varying lengths. In the early 20th century, various statistical features were studied involving metrics for stylometry such as Zipf’s distribution and Yule’s K measure. Later, Mosteller and Wallace [2] worked with Bayesian statistical measures where the frequencies of a small set of function words were analyzed as the stylistic features of the text. Many other different measures have been explored to extract stylistic features from the text for author identification tasks. Recently, deep learning has been studied in various natural language processing tasks, providing better performance when compared to previous state-of-the-art approaches.
In this paper, we propose a system that uses visual features along with a five-layer convolutional neural network for the identification of authors through the recognition of distinct writing patterns. Statistical as well as internal features were extracted and represented by three different types of charts (line, imagesc, and pie) that were then fed to a convolutional neural network. The experiments were done on 1200 literary articles written by 50 different authors from different generations, obtaining a maximum accuracy of 93.58%. Furthermore, the system performance was tested with a varied number of authors (from 5 to 50) to see how the features work on an incremental number of authors (and dataset sizes), as well as with a different number of features to perceive their discrete aspects on the studied datasets.
The work was performed on the Bangla language as it is the sixth most spoken language with approximately 265 million users in the world [3]. Since no such corpus was available in Bangla, we built one consisting of 1200 articles written by 50 different authors from different generations, totaling 323,780,594 tokens. The proposed system uses image-based features along with a lightweight CNN. This helps to visualize the writing patterns of an author (by observing the charts) rather than observing the relevant keywords by reading the articles.
The organization of the paper is the following: Section 2 presents a brief literature study on the existing research in this domain; Section 3 discusses the proposed methodology and Section 4 presents the experimental setup and discusses the results obtained. Finally, Section 5 concludes the paper with some future directions.

2. Related Work

We provide a brief survey considering works carried out in different languages. Qian et al. [4] explored various deep learning architectures on different corpora. Their experimental results showed that the article-level GRU obtained a maximum accuracy of 69.1% and 89.2% on the C50 and Gutenberg corpora, respectively. Mohsen et al. [5] used a deep learning architecture to extract features from articles based on different character-based n-gram approaches. They also investigated the application of various feature extraction and selection approaches using a stacked denoising autoencoder and support vector machines to build the classifier.
Zhang et al. [6] proposed a semantic relationship-based unsupervised method for identifying the writing pattern of different authors using principal component analysis and linear discriminant analysis based on expression, term relevancy, and nonsubject stylistic term from different articles. Benzebouchi et al. [7] used the word2vec word embeddings model, which provides semantic relationships between words, along with the multilayer perceptron (MLP) classification algorithm. The experimental results showed an accuracy of 95.83% on the PAN 2012 dataset [8], indicating a better performance of the system when compared to other standard approaches.
Anwar et al. [9] used the LDA model with n-grams and cosine similarity for identifying authors in English and Urdu documents. They obtained overall accuracies of 84.52% and 93.17% on the PAN 2012 dataset [8] and Urdu news articles. Rexha et al. [10] conducted two experiments, firstly comparing the decisions using content and stylometric features and secondly, describing the process and the features on which their judgment was based. Pandian et al. [11] trained a decision tree (J48 learning algorithm) using text-based features for identifying different authors of poems. Nirkhi et al. [12] worked with word and character unigram features and a support vector machine (SVM) classifier on the C50 dataset and achieved 88% accuracy. López-Monroy et al. [13] also used an SVM along with the bag-of-terms model, obtaining 80.80% accuracy on the C50 dataset for the author identification task.
Bevendorff et al. [14] provided a brief discussion on the results of the four shared tasks arranged at the PAN 2020 [15] lab on digital text forensics and stylometry. This involved author profiling, cross-domain author verification, celebrity profiling, and style change detection. The aim was to advance the existing approaches and evaluate them on new standard datasets. Sarwar and Hassan [16] worked with stylometric features to overcome the limitations of having only n-gram features for Urdu texts; their experimental results showed an accuracy of 94.03%, indicating a discriminative power of the stylometric features used.
Chakraborty and Choudhury [17] tested three different graph-based algorithms and, for each algorithm, the graphs were clustered, and the weights were assigned based on the graph traversal method. Experiments were done using articles from six authors obtaining a maximum accuracy of 94.98%. Using SMO along with the J48 algorithm, Digamberrao and Prasad [18] implemented two techniques that used lexical and stylistic feature extraction processes for identifying authors from 15 philosophical articles written in Marathi by five authors, achieving an accuracy of 80%.
Rakshit et al. [19] used semantic-based and stylistic-based features and the support vector machine algorithm for identifying poems from four genres and achieved an accuracy of 92.3%. Anisuzzaman and Salam [20] proposed a hybrid model by combining word n-grams with the naïve Bayes (NB) algorithm showing an encouraging accuracy of 95%.
A brief analysis of the literature study is provided in the following Table 1.
The literature study reveals that various researchers have paid interest to author identification tasks. However, they have mainly focused on the English language [21,22,23,24,25]. Some works focus on other languages as well, such as Arabic [22,26], Dutch [27,28,29], Greek [30,31], and Portuguese [32,33]. Nonetheless, very few works have been done on Indian languages, especially in Bangla; therefore, there is a pressing need for the development of an automatic author identification system in Bangla. Mostly, researchers have used syntactic, semantic, and stylistic-based features but have not explored various other aspects of the Bangla literary articles from different authors having similar writing styles. Thus, this work uses visual features obtained from the text-based as well as statistical-based features that are fed to a CNN for identifying the author of an article.

3. Proposed Methodology

The automatic author identification approach suggested in this paper used image-based features to categorize writers according to their writing style. Line, picture, and pie charts were used to represent statistical and text-based information, which was then input into a convolutional neural network. A maximum accuracy of 93.58% was reached on an experiment conducted on 1200 articles written by 50 authors of various generations. Additionally, we included a study on a growing number of authors to examine how the features worked on various datasets to perceive the discrete elements of the suggested features on the aforementioned datasets. Figure 1 uses a pictorial representation to explain the process.
In the present work, a database was prepared that comprised 1200 articles from 50 authors which were preprocessed prior to further processing. Here, tokenization and stopword removal were considered for the preprocessing phase as there was no publicly available POS tagger and stemmer/lemmatizer for Bangla, which could be used in our experiment. After receiving the preprocessed data, statistical-based and text-based features were extracted and fed to CNN architecture to identify the authors of a respective article. Furthermore, the results were compared with other supervised machine learning algorithms to see the efficiency of the proposed work.

3.1. Data Collection

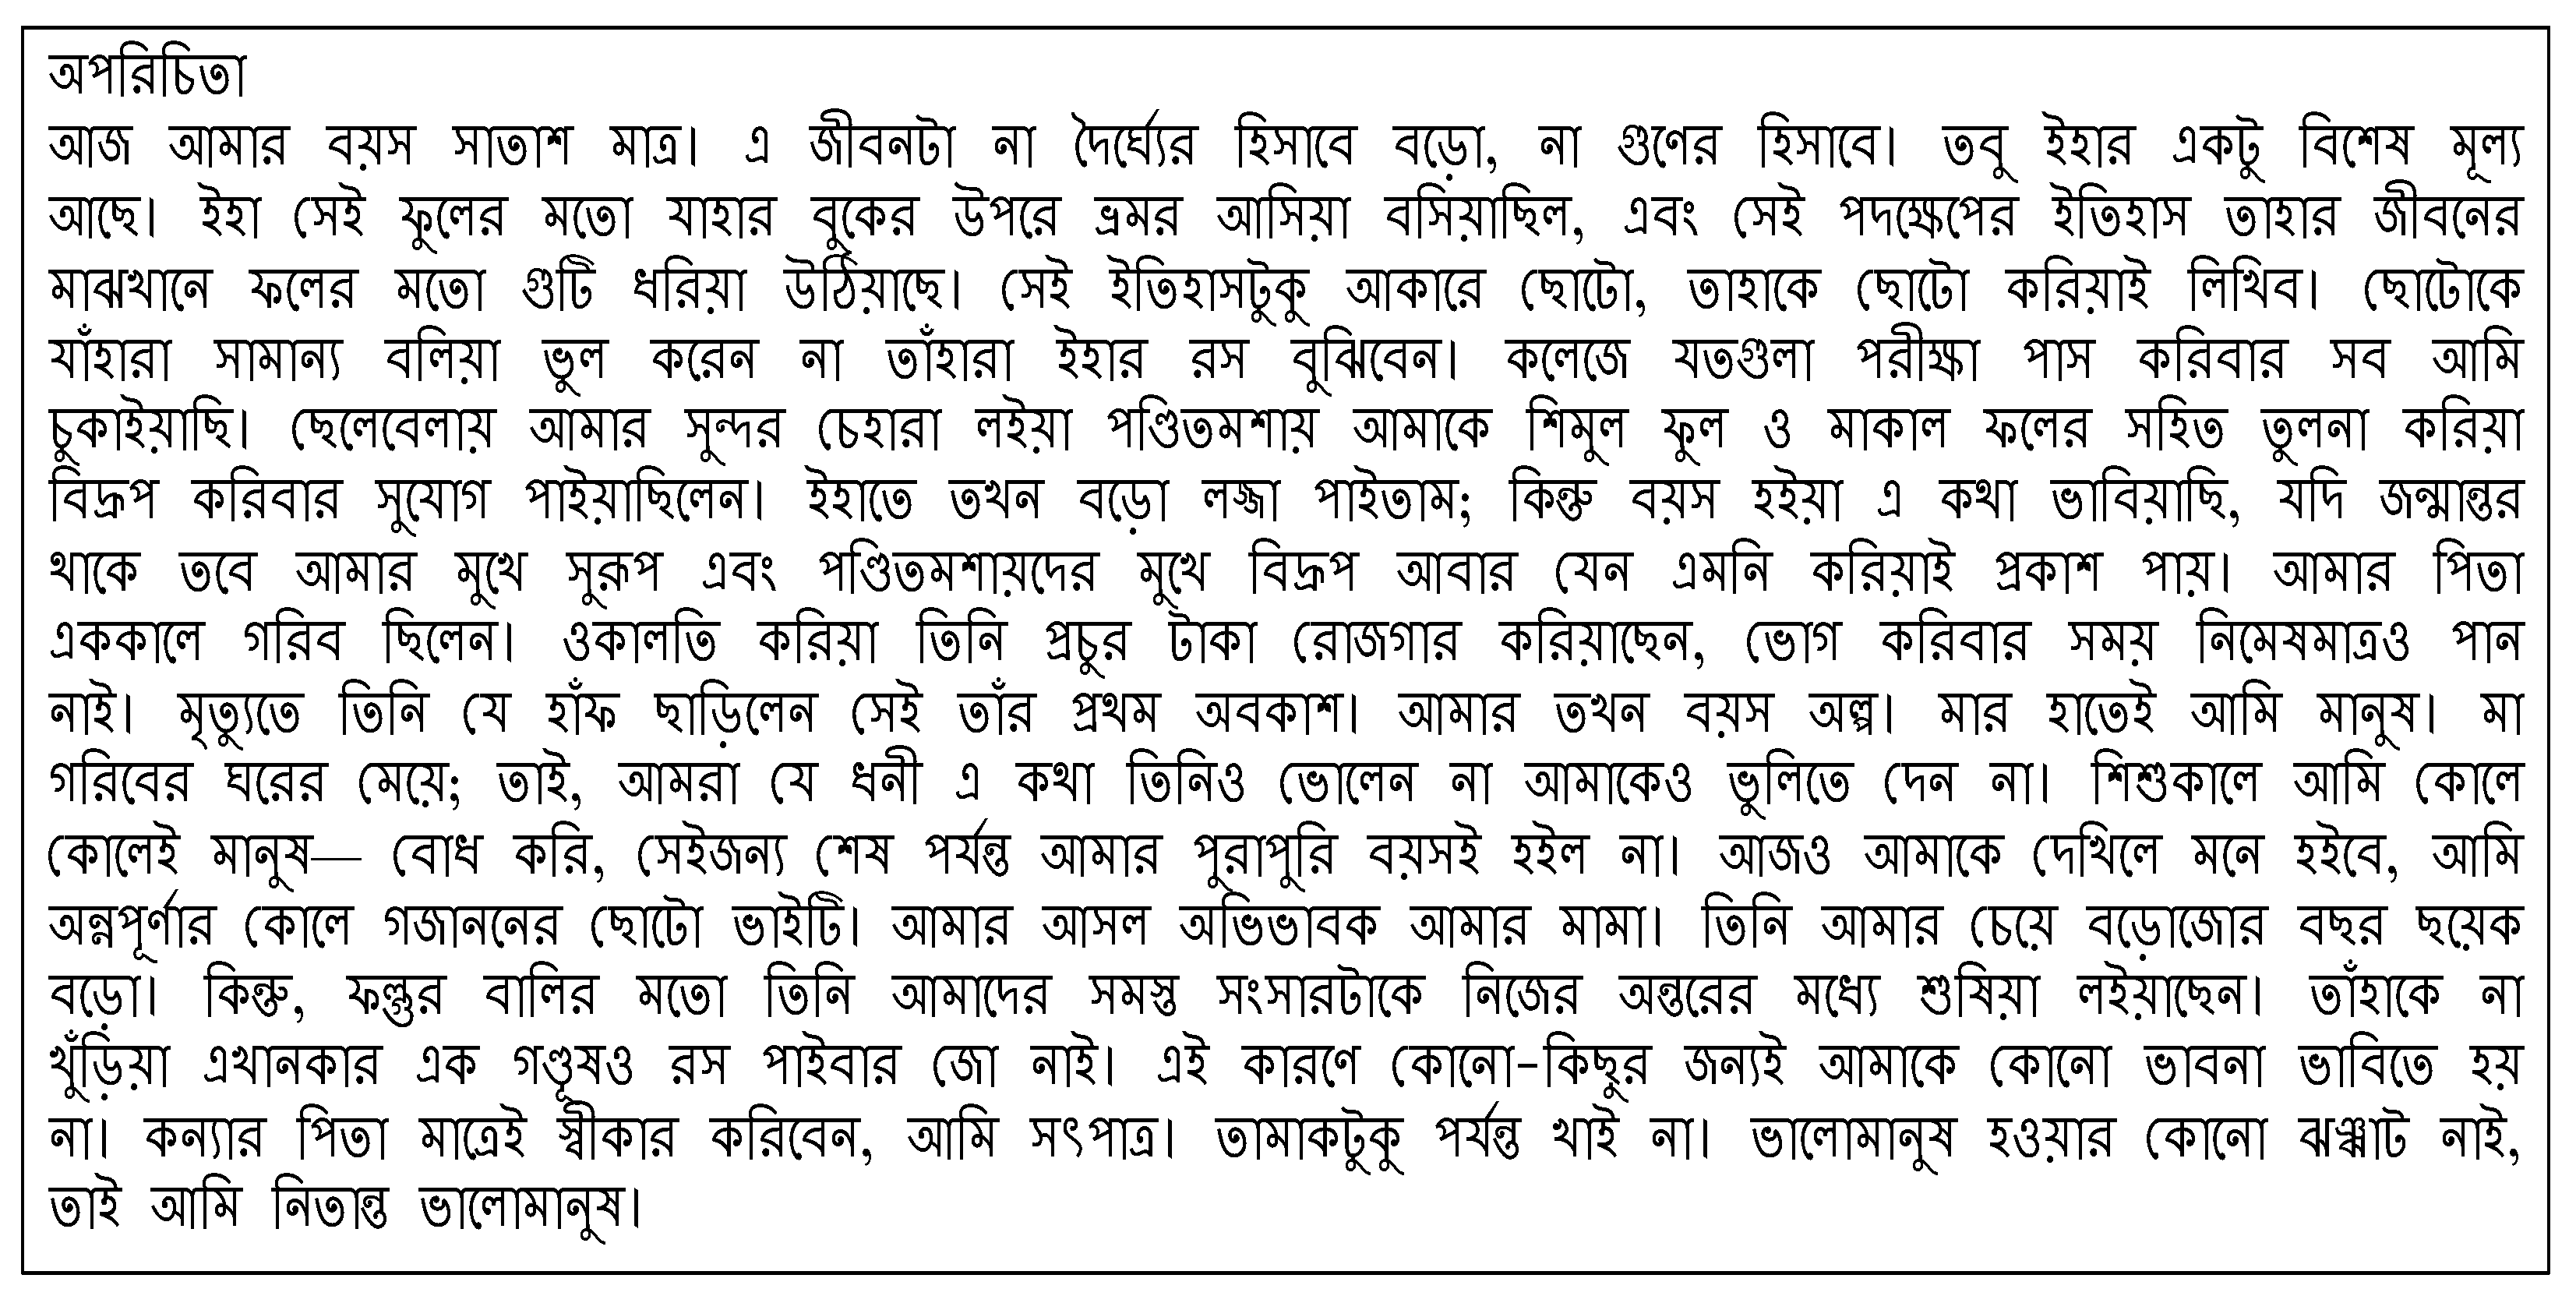
The literature study highlighted that there were no publicly available author identification datasets for the Bangla language. Therefore, for the present experiment, a corpus was prepared consisting of 1200 articles from 50 authors. There were difficulties during the development of the corpus in Bengali, as there were limited resources available on the internet [3]. The number of articles per author varied from 10 to 22. The developed corpus comprised articles from different literature types involving novels, essays, and big stories with similar writing styles obtained from www.ebanglalibrary.com (accessed on 17 January 2022). The dataset was digitized so that it could be used for developing automatic author identification systems. The maximum and minimum number of words present in a sentence was 16 and 9, respectively. The standard deviation of the dataset consisting of texts per author was 4.65. A sample text of four articles from four different authors is presented in Figure 2, Figure 3, Figure 4 and Figure 5 to give a glimpse of the data used in the experiments.
An experimentation was also carried out with a varied number of authors (5, 10, 15, 20, 25, 30, 35, 40, and 45) to perceive the characteristics of the features on incremental corpora sizes. The partition was done keeping in mind the scenario of having articles written by different authors of different ages with similar writing patterns so that the comparison was fair. The resulting partitioned corpora, illustrating the number of articles, are provided in Table 2.

3.2. Preprocessing

Before the extraction of the features, articles were preprocessed. The texts were tokenized using a space delimiter and a total of 323,780,594 tokens were obtained. Stopwords are tokens not relevant for the identification task; in this experiment, 355 Bangla stopwords were considered, following the list specified in [34]. After stopword removal, the corpus had a total of 267,632,425 tokens, with 200,829 unique ones. The statistical analysis of the data after preprocessing is provided in Table 3.

3.3. Feature Extraction

Two different types of characteristics, statistical-based and text-based, were extracted. By giving the tokens weights, the statistically based features took into account the structural relationships from the articles. Here, a variety of statistical measures were used, including the frequency of tokens, the likelihood that an article belonged to a particular author, the similarity between distinct articles and writers, as well as the mean, average, and standard deviation. Text-based features, in contrast, only took into account the lexical information from the articles; they estimated the common and unique vocabulary lists used by various authors in their articles, as well as the combination of characters (simple, compound and complex terms) they used when writing, along with the different n-gram (adjacent order of x terms from a given text) and dictionary-based features.

3.3.1. Statistical-Based Features

The proposed statistical-based features involved various metrics, as discussed below. Let A r d represent the articles in the database (d) and A r q the article in question (q). The statistical-based features were obtained using Equations (1)–(15), where a a u t h o r and T a r t l represent the total number of authors and articles in the dataset, respectively. This study not only estimated the statistical-based features from the articles but also measured the probability of belonging of an article as well.
W o r d o c c a r t i c l e : the presence of a token in the article in question
W o r d o c c a r t i c l e = t i | t i T w A r q .
W o r d o c c a r t i c l e s : the presence of a token in all the articles in the dataset
W o r d o c c a r t i c l e s = O c c ( A r q , T a r t l ) T w A r q .
O c c ( A r q , T a r t l ) = t i | t i ( A r q , A r d ) .
A r t i c l e o c c : counts the presence of a token in a particular category/domain in the entire dataset
A r t i c l e o c c = W o r d o c c a r t i c l e ( a a u t h o r ) .
A r t i c l e o c c p r o b : the probability of belonging of an article to a specific author
A r t i c l e o c c p r o b = O c c 1 ( A r q , a a u t h o r ) a a u t h o r .
O c c 1 ( A r q , a a u t h o r ) = n A r q ( A r q , a a u t h o r ) .
A r t i c l e s i m : counts the similarity of an article to the writing patterns of the associated authors in the dataset
A r t i c l e s i m = s i m ( A r q , T a r t l ) T a r t l .
s i m ( A r q , T a r t l ) = n a r t l | n a r t l ( A r q , T a r t l ) .
A u t h o r s i m : counts the similarity of the articles among different authors. There may be some similarities in the writing pattern of two or more authors whose information will help the model identify the authors of a particular article.
A u t h o r s i m = k = 1 a a u t h o r s i m ( A r q , T a r t l ) T a r t l .
T o t a l s i m : counts the similarity of an article in question in the entire dataset
T o t a l s i m = 1 / ( e W o r d o c c a r t i c l e s + A r t i c l e s i m + A u t h o r s i m ) .
A r e a o v r l p : counts the overlapping of the content of an article with all the articles in the entire dataset
A r e a o v r l p = o v r l p ( T o t t ) ( A r q , T a r t l ) .
A r t i c l e o v r l p : counts the number of articles overlapped for a specific author in the dataset
A r t i c l e o v r l p = o v r l p ( T o t t r t l ) ( a a u t h o r ) .
M e a n : mean of all the articles present in the dataset
M e a n = i = 1 i = T a r t l T o t a l s i m i ) T a r t l .
S D : standard deviation of all the articles in the total dataset
S D = i = 1 i = T a r t l T o t a l s i m i M e a n ) T a r t l .
A v g d e v : deviation of the probability of belongings of a target text with the mean
A v g d e v = S D T o t a l s i m .

3.3.2. Text-Based Features

Some text-based features were also proposed to be included as discriminants, such as the common vocabulary set, the unique vocabulary set, a combination of characters, n-grams (n being 2, 3, and 4), and dictionary-based features. Features were extracted on the total dataset as well as on the datasets containing articles with a varied number of authors as discussed in Section 3.1. The combination of characters and dictionary-based features was computed using the list provided in https://github.com/MinhasKamal/BengaliDictionary (accessed on 14 May 2022).

3.3.3. Feature Visualization

On different occasions, it becomes easy to discriminate articles by entirely gazing at the pattern of how they are woven, rather than just reading the articles by observing the relevant keywords. This motivated us to use an image-based feature extraction approach for the identification of authors. The features were visualized by representing them in a 2D plane. Three types of charts, namely line, imagesc, and pie charts, were used for the same feature. The x-axis values for line and imagesc charts represented the 17 features considered in the experiment. Similarly, for a pie chart, each area represented each feature being used here. The y-axis for each chart represented the feature values obtained for each feature.
The imagesc(C) rendered the information in array C as an image that made use of the entire color palette in the colormap. Each C element identified the color for a single picture pixel. An x-by-y grid of pixels, where x represents the number of rows and y represents the number of columns in C, made up the final image. The centers of the relevant pixels were determined by the row and column indexes of the elements. Similarly, the pie chart followed a color scheme palette that has 3 colors: Burnt Sienna (#EC6B56), Crayola’s Maize (#FFC154) and Keppel (#47B39C). Here, we considered the “hsv” theme. According to the selected palette, the color combination built up. However, for the line chart, a default color was chosen for the line.
The feature visualization using these three charts for one article of four different authors is presented in Figure 6, Figure 7 and Figure 8.

3.4. Classification

A convolutional neural network (CNN) is a neural network architecture specially developed to process input images. It is popularly used in various types of problems such as image and video recognition and image classification; it is also used for text-related and time series problems and other applications [35,36,37,38,39]. A CNN is built by stacking three kinds of layers: convolutional layers, pooling layers, and fully connected layers. To these main layers, the dropout layer and the activation function are added. The convolutional layer has a prime role in this architecture as this layer extracts features from the input. It contains convolutional kernels represented by a neuron which works by splitting the images into smaller blocks for the extraction of feature patterns. The multiplication of the input image by a filter of a certain size is performed by the kernels’ interaction with the images based on weights. The operation can be portrayed through Equation (16), where j d ( p , q ) is an occurrence of the input vector j d multiplied by the i c j ( k , l ) index of the jth kernel of the cth layer.
f c k ( m , n ) = d p , q j d ( p , q ) . i c j ( k , l )
The output mapping of the jth kernel is obtained using Equation (17)
F c j = [ f c j ( 1 , 1 ) , . , f c j ( m , n ) , . , f c j ( M , N ) ]
The pooling layer follows the convolutional layer. It decreases the size of the feature map, which reduces computational costs. This operation is done by reducing the relations between the layers and operates independently on each feature map as shown by Equation (18), where Y c j determines the pooled feature map of the cth layer for the jth kernel and O p denotes the pooling operation.
Y c j = O p ( F c j )
In this paper, a network was proposed where the inputs were fed to a 32-dimensional convolution layer. The present experiment for training the convolutional neural network model depended on the labeled instances extracted from the handcrafted features for supervised learning [40,41]. The output from this layer was not pooled to avoid a loss of clarity and was passed on to a second convolution layer with 16 dimensions. The dimensions were chosen based on experimental trials. The filter sizes of the 1st and 2nd convolution layers were set to 5 and 3, respectively, after experimental trials. The output of this second layer was max pooled with a window size of 3 followed by a dropout layer, whose result was passed to two dense layers with 256 and 100 dimensions, respectively. The output of the final dense layer was passed on to the fully connected layer. The network was initially trained with images of 100 × 100 pixels and a batch size of 100 instances for 100 epochs. The dropout was set at 50%. The convolution and the first two dense layers had a ReLU activation function, while the final dense layer had a softmax activation function. The architecture of the proposed network is illustrated in Figure 9.
The total number of parameters for each layer are summarized in Table 4.

4. Results and Analysis

This section presents the results obtained on the considered dataset by using the CNN on image-based features. It also presents the analysis of the interclass and intraclass similarities of the articles written by the authors. Furthermore, a comparative analysis of English datasets, state-of-the-art methods, other deep learning models, and commonly used machine learning algorithms is provided.

4.1. Experimental Results

The experiments were carried out on the total dataset comprising 1200 articles written by 50 authors using three different features: 12 statistical-based features, 7 internal features, and a combination of both features (12 + 7). These features were visualized by representing them in a 2D plane, using, as already mentioned, three types of charts (line, imagesc, and pie). Those image-based features were then provided to the CNN network. The results obtained for three charts using three feature sets based on a 80%–20% train–test split are illustrated in Table 5. The experiment was carried out by considering a batch size, image size and epochs of 100 and dropouts of 0.5.
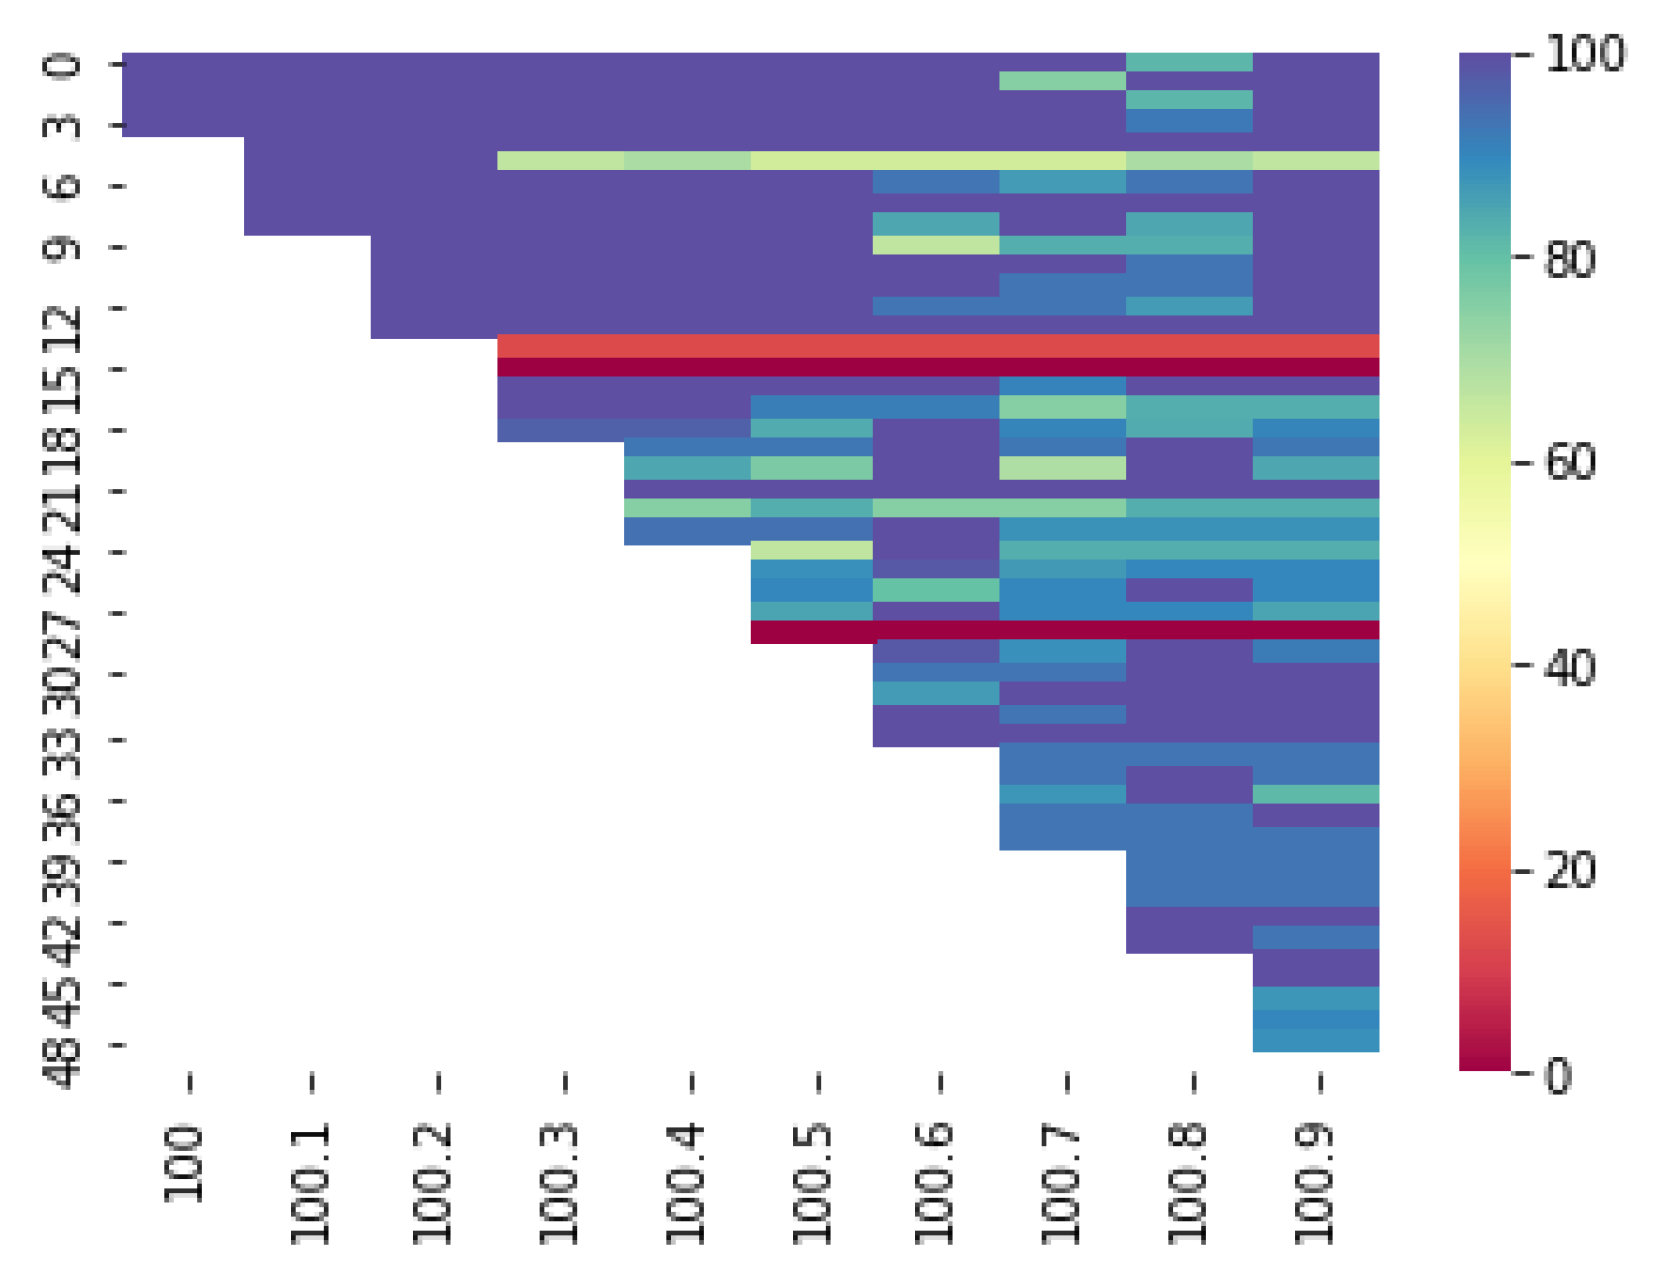
The variation in accuracy for a combination of features using a line chart is portrayed through the heat map presented in Figure 10. The x-axis represents the features and the y-axis represents the number of authors. Each cell of a heat map represents a grouping of data. It can be observed that the identification of authors is quite encouraging, as there was either only a slight variation, or the accuracy was maintained for individual authors. In real-world scenarios, the dataset keeps on changing both in terms of volume and variety. To test the performance of the proposed system for such scenarios, the dataset was gradually increased regarding the number of authors from five with a step of five. It was noted that the system maintained its overall accuracy with an increase in the volume of data.
Since the maximum accuracy of 93.58% was obtained for the line chart using the combination of both feature sets, further experiments were done by tuning the parameters. The results were obtained for different batch sizes, image sizes, epochs, and dropouts on this feature set, which are provided in Table 6, Table 7, Table 8 and Table 9.

4.2. Similarity Analysis

We provide a snapshot of the interclass and intraclass similarities in Figure 11. The line chart was considered as it had the maximum accuracy.

4.3. Performance on Datasets of Different Sizes

As already mentioned, the experiments were also expanded on subsets comprising articles from a different number of authors (5, 10, 15, 20, 25, 30, 35, 40, and 45) keeping the type of charts and the feature set the same. Furthermore, the values of the parameters for the CNN architecture for which maximum accuracies had been obtained were kept constant, such as a batch size and image size of 100, 150 epochs, and a dropout of 0.5. The dataset was partitioned based on the number of authors to see how the proposed approach worked for a particular number of articles written by different authors with similar writing patterns. The dataset arranged the authors in a lexicographic manner, so the partition was done based on the same sequence. The partition of the dataset was done incrementally, thus, if an author was selected for a particular set, it would always be considered for increasing datasets. The results obtained for the partitioned datasets are given in Table 10. The deviation in the accuracy from increasing the dataset size is presented in Figure 12. In most cases, the deviation is not very high between successive datasets. This is quite encouraging and also points to the system’s ability to handle changes in dataset size and variability.
Further, the variation in accuracies of author identification for datasets of disparate sizes, i.e., from 5 to 50 authors is presented in Figure 13. The x-axis represents the features and the y-axis represents the number of authors. Each cell of a heat map represents a grouping of data. It is observed that very low accuracies were obtained for some authors. It is also encouraging to observe that there was only a slight variation, or at times the accuracy was maintained, for individual authors when the number of authors was increased. This observation also shows the ability of the system to handle cases where the gradual increase of data over time is a common phenomenon.

4.4. Comparative Studies

In this section, the proposed CNN architecture was compared with other deep learning models, such as Inception and MobileNet, to test the performance of the model on the considered dataset. Furthermore, the result was compared with other popularly used machine learning algorithms to show the efficiency of the deep learning model compared to the supervised learning algorithms. A comparison of the proposed work with the existing state-of-the-art methods is also provided here. Furthermore, to show the language independence of the proposed work, the experiment was tested on an English dataset (C50) as well.

4.4.1. Performance of Established CNN Architectures

To compare the performance of the proposed CNN model, we also employed other CNN architectures: Inception and MobileNet. A brief overview of Inception and MobileNet is described below. These two architectures were selected based on their characteristics by keeping in mind the availability of limited resources.
Inception. This architecture resembles a scanty CNN with a condensed structure. It is a blend of 1 × 1, 3 × 3, and 5 × 5 convolutional layers where their outputs are integrated into a single vector, developing the input for the next level. It allows the internal layers to select the dimension of the filters that are required for learning. Each layer is a continual enhancement of the past layer. The number of the convolutional filters of an individual kernel size is kept low because of the effectiveness of a lesser number of neurons. Another characteristic is having a bottleneck layer, which reduces the computation costs. Furthermore, it replaces the fully connected layers with a pooling that moderates the estimates of the filters across the 2D feature map and thoroughly decreases the total number of parameters.
MobileNet. It is devised to productively enhance accuracy while keeping in mind limited resources. It requires less latency and power to encounter the resource limitations of various instances. This model is a heap of independent convolution layers comprising depthwise and pointwise convolutions that separately perform convolution in spatial sizes and input–output channels.
The experiments were performed on both the English (C50 [42]) and Bangla datasets. The results obtained are given in Table 11. The variation in the accuracy of author identification is also shown through the heat maps on Figure 14a,b. The shown heat maps illustrate the model in which the datasets obtained maximum accuracies (for the English dataset, it was the Inception model, whereas for the Bangla dataset, it was the MobileNet model). It is clear from the heat maps that there was confusion between multiple authors for Inception, which was reduced significantly for MobileNet. Though there was confusion among a lesser number of authors, the percentage of confusion was higher, leading to lower interclass accuracies.

4.4.2. Performance of Popular Classifiers

The maximum accuracy was obtained for the total dataset using the combination of both the statistical-based and text-based features. To prove the effectiveness of the proposed approach, this feature set was fed to different machine learning algorithms such as support vector machine (SVM), random forest (RF), multilayer perceptron (MLP), naïve Bayes multinomial (NBM), and rule-based (PART). The results obtained are shown in Figure 15. Comparisons were done keeping the number of dropouts (0.5) and epochs (150) the same for the classification algorithms considered here as those for which the maximum accuracy had been obtained for the CNN.
The parameters used for the SVM were: type of SVM, nu-SVC; type of kernel, sigmoid; degree in kernel function, 3; gamma in kernel function, 1/k; coef0 in kernel function, 0; nu of nu-SVC, 0.5.
The parameters used for the RF were: number of iterations, 1000; minimum number of instances per leaf, 1; minimum variance for split, 1e-3; maximum depth of the tree, 0; and batch size, 100.
The parameters used for the MLP were: number of iterations, 1000; batch size, 100; number of hidden units, 17; learning rate, 0.3; momentum, 0.2; loss function, squared error; activation function, approximate sigmoid.
The default parameters were considered for the NBM model as we used the tokenizer and stopwords removal separately. Furthermore, default values for the stemmer and classifier capabilities were chosen for the experiment.
The parameters used for PART were: confidence threshold for pruning, 0.50; minimum number of objects per leaf, 3; the unpruned decision list was generated; reduced error pruning; and number of folds for reduced error pruning, 4. One fold was used as a pruning set.

4.4.3. Performance of Available Works in the Literature

We also compared the performance of the proposed system with other existing works performed in the Bangla language. The experiments were performed following their frameworks and tested on our dataset. Rakshit et al. [19] used semantic-based and stylistic-based features for the identification of poems from four genres based on a support vector machine and achieved 92.3% accuracy. Anisuzzaman and Salam [20] proposed a hybrid model by combining n-gram and naïve Bayes (NB) algorithm and the results showed encouraging performance of the system with a 95% accuracy. The obtained accuracies using our dataset are presented in Table 12. The performance of the proposed model was better than all other existing algorithms when accuracy was concerned. The dataset used in this study was larger when compared to all the other research.

4.4.4. Performance on the Established Dataset (English)

To test the performance and to prove the language independence of the proposed author identification system, experiments were carried out with one of the most popular and widely used datasets, the C50 dataset, which is a subset of RCV1 [43]. The training and test sets included 2500 documents each (50 per author), nonoverlapping with one another. Here also, the dataset was partitioned into an 80%–20% train–test split for the experiment. The performance of our proposed system was compared with the works proposed by Qian et al. [4] where the authors used article-level GRU and obtained an accuracy of 69.10% on the C50 dataset, Nirkhi et al. [12] worked with word and character unigrams and an SVM classifier on the mentioned dataset and achieved 88% accuracy, and López-Monroy et al. [13] used bag-of-terms model and an SVM and obtained 80.80% accuracy. The accuracy obtained on the said dataset is provided in Table 13 where it can be observed that our system outperformed the existing systems.

5. Conclusions and Future Work

Using image-based attributes, a deep-learning-based author identification method was suggested in this study. Line, imagesc, and pie charts were utilized to construct the image-based features from 1200 articles written by 50 authors from different generations, using a combination of internal and statistical features. An impressive result of 93.58 percent accuracy for the line chart was obtained. In order to evaluate the applicability of the suggested approach with articles from a variety of authors, experiments were also conducted on the partitioned datasets. Furthermore, to show the language independence of the proposed approach, experiments were conducted on an English (C50) dataset. The system was also tested with an incremental number of authors to simulate real-world scenarios. The system was successful in adapting to the changing datasets and a minimal deviation in the overall accuracy was noted in every step.
In the future, the system will be extended to work with a larger number of articles from various authors of different genres. Experiments will be performed in other languages apart from Bangla and English to judge the language-independent nature of the proposed system. Furthermore, the proposed approach can be further implemented for the author’s profiling problem. We also plan to use various techniques, such as clustering, ensemble learning, and extreme learning, to identify authors for respective articles. Furthermore, we would like to explore stylometric features [46], intra and interarticle-based features, graph-based [47], and word embeddings models, respectively, for author identification tasks.

Author Contributions

Conceptualization, A.D. and H.M.; methodology, A.D.; software, A.D. and H.M.; validation, A.D. and H.M.; formal analysis, A.D. and S.S.; investigation, A.D., H.M. and K.R.; resources, A.D.; data curation, A.D.; writing—original draft preparation, A.D., H.M. and K.R.; writing—review and editing, A.D. and S.S.; visualization, A.D. and M.O.S.; supervision, A.B., T.G. and K.R.; project administration, A.D., T.G. and K.R. All authors have read and agreed to the published version of the manuscript.

Funding

This research received no external funding.

Institutional Review Board Statement

Not applicable.

Informed Consent Statement

Not applicable.

Data Availability Statement

Not applicable.

Acknowledgments

Authors would like to thank Ankita Shaw and Shilpa Roy, ex-students of the department of Computer Science, West Bengal State University for their help in dataset collection and development.

Conflicts of Interest

The authors declare no conflict of interest.

References

  1. Mendenhall, T.C. The characteristic curves of composition. Science 1887, 9, 237–249. [Google Scholar] [CrossRef] [PubMed]
  2. Mosteller, F.; Wallace, D.L. Inference in an authorship problem: A comparative study of discrimination methods applied to the authorship of the disputed Federalist Papers. J. Am. Stat. Assoc. 1963, 58, 275–309. [Google Scholar]
  3. Ethnologue. Available online: https://www.ethnologue.com/language/ben (accessed on 22 April 2022).
  4. Qian, C.; He, T.; Zhang, R. Deep Learning Based Authorship Identification. 2017. Available online: https://www.google.com.hk/url?sa=t&rct=j&q=&esrc=s&source=web&cd=&ved=2ahUKEwjQ7NuM-aD6AhXZgVYBHZnkD00QFnoECAkQAQ&url=https%3A%2F%2Fweb.stanford.edu%2Fclass%2Farchive%2Fcs%2Fcs224n%2Fcs224n.1174%2Freports%2F2760185.pdf&usg=AOvVaw1qFzrgbBbDt9PPK2aPElWC (accessed on 22 April 2022).
  5. Mohsen, A.M.; El-Makky, N.M.; Ghanem, N. Author identification using deep learning. In Proceedings of the IEEE International Conference on Machine Learning and Applications, Anaheim, CA, USA, 18–20 December 2016; pp. 898–903. [Google Scholar]
  6. Zhang, C.; Wu, X.; Niu, Z.; Ding, W. Authorship identification from unstructured texts. Knowl.-Based Syst. 2014, 66, 99–111. [Google Scholar] [CrossRef]
  7. Benzebouchi, N.E.; Azizi, N.; Hammami, N.E.; Schwab, D.; Khelaifia, M.C.E.; Aldwairi, M. Authors’ Writing Styles Based Authorship Identification System Using the Text Representation Vector. In Proceedings of the 2019 16th International Multi-Conference on Systems, Signals Devices (SSD), Istanbul, Turkey, 21–24 March 2019; pp. 371–376. [Google Scholar] [CrossRef]
  8. PAN 2012 Dataset. Available online: http://pan.webis.de/data.html (accessed on 16 July 2022).
  9. Anwar, W.; Bajwa, I.S.; Ramzan, S. Design and implementation of a machine learning-based authorship identification model. Sci. Program. 2019, 2019, 9431073. [Google Scholar] [CrossRef]
  10. Rexha, A.; Kröll, M.; Ziak, H.; Kern, R. Authorship identification of documents with high content similarity. Scientometrics 2018, 115, 223–237. [Google Scholar] [CrossRef]
  11. Pandian, A.; Manikandan, K.; Ramalingam, V.; Bhowmick, P.; Vaishnavi, S. Author Identification of Bengali Poems. Int. J. Eng. Technol. 2018, 7, 17–21. [Google Scholar]
  12. Nirkhi, S.M.; Dharaskar, R.V.; Thakare, V.M. Authorship identification using generalized features and analysis of computational method. Trans. Mach. Learn. Artif. Intell. 2015, 3, 41–45. [Google Scholar] [CrossRef]
  13. López-Monroy, A.P.; Montes-y Gómez, M.; Villaseñor Pineda, L.; Carrasco-Ochoa, J.A.; Martínez-Trinidad, J.F. A new document author representation for authorship attribution. In Proceedings of the Mexican Conference on Pattern Recognition, Querétaro, Mexico, 26–29 June 2012; pp. 283–292. [Google Scholar]
  14. Bevendorff, J.; Ghanem, B.; Giachanou, A.; Kestemont, M.; Manjavacas, E.; Potthast, M.; Rangel, F.; Rosso, P.; Specht, G.; Stamatatos, E.; et al. Shared Tasks on Authorship Analysis at PAN 2020. In Proceedings of the in European Conference on Information Retrieval, Lisbon, Portugal, 14–17 April 2020; pp. 508–516. [Google Scholar]
  15. PAN 2020 Dataset. Available online: https://pan.webis.de/data.html (accessed on 16 July 2022).
  16. Sarwar, R.; Hassan, S.U. UrduAI: Writeprints for Urdu Authorship Identification. Trans. Asian Low-Resour. Lang. Inf. Process. 2021, 21, 1–18. [Google Scholar] [CrossRef]
  17. Chakraborty, T.; Choudhury, P. Authorship identification in Bengali language: A graph based approach. In Proceedings of the IEEE/ACM International Conference on Advances in Social Networks Analysis and Mining, San Francisco, CA, USA, 18–21 August 2016; pp. 443–446. [Google Scholar]
  18. Digamberrao, K.S.; Prasad, R.S. Author Identification using Sequential Minimal Optimization with rule-based Decision Tree on Indian Literature in Marathi. Procedia Comput. Sci. 2018, 132, 1086–1101. [Google Scholar] [CrossRef]
  19. Rakshit, G.; Ghosh, A.; Bhattacharyya, P.; Haffari, G. Automated analysis of bangla poetry for classification and poet identification. In Proceedings of the International Conference on Natural Language Processing, Trivandrum, India, 11–14 December 2015; pp. 247–253. [Google Scholar]
  20. Anisuzzaman, D.M.; Salam, A. Authorship Attribution for Bengali Language Using the Fusion of N-Gram and Naïve Bayes Algorithms. Int. J. Inf. Technol. Comput. Sci. 2018, 10, 11–21. [Google Scholar] [CrossRef]
  21. Chaski, C.E. Empirical evaluations of language-based author identification techniques. Forensic Linguist. 2001, 8, 1–65. [Google Scholar] [CrossRef] [Green Version]
  22. Abbasi, A.; Chen, H. Applying authorship analysis to extremist-group web forum messages. IEEE Intell. Syst. 2005, 20, 67–75. [Google Scholar] [CrossRef]
  23. Holmes, D.I.; Robertson, M.; Paez, R. Stephen Crane and the New-York Tribune: A case study in traditional and non-traditional authorship attribution. Comput. Humanit. 2001, 35, 315–331. [Google Scholar] [CrossRef]
  24. Koppel, M.; Schler, J.; Argamon, S. Computational methods in authorship attribution. J. Am. Soc. Inf. Sci. Technol. 2009, 60, 9–26. [Google Scholar] [CrossRef]
  25. Kestemont, M.; Tschuggnall, M.; Stamatatos, E.; Daelemans, W.; Specht, G.; Stein, B.; Potthast, M. Overview of the author identification task at PAN-2018: Cross-domain authorship attribution and style change detection. In Proceedings of the Working Notes Papers of the CLEF 2018 Evaluation Labs, Avignon, France, 10–14 September 2018; pp. 1–25. [Google Scholar]
  26. Altheneyan, A.S.; Menai, M.E.B. Naïve Bayes classifiers for authorship attribution of Arabic texts. J. King Saud Univ.-Comput. Inf. Sci. 2014, 26, 473–484. [Google Scholar] [CrossRef]
  27. Juola, P.; Baayen, R.H. A controlled-corpus experiment in authorship identification by cross-entropy. Lit. Linguist. Comput. 2005, 20, 59–67. [Google Scholar] [CrossRef]
  28. Hoorn, J.F.; Frank, S.L.; Kowalczyk, W.; Van Der Ham, F. Neural network identification of poets using letter sequences. Lit. Linguist. Comput. 1999, 14, 311–338. [Google Scholar] [CrossRef]
  29. Maitra, P.; Ghosh, S.; Das, D. Authorship Verification-An Approach based on Random Forest. In Proceedings of the Working Notes for CLEF Conference, Évora, Portugal, 5–8 September 2016; pp. 1–9. [Google Scholar]
  30. Stamatatos, E.; Fakotakis, N.; Kokkinakis, G. Text genre detection using common word frequencies. In Proceedings of the Conference on Computational linguistics-Volume 2, Association for Computational Linguistics, Saarbrücken Germany, 31 July–4 August 2000; pp. 808–814. [Google Scholar]
  31. Kešelj, V.; Peng, F.; Cercone, N.; Thomas, C. N-Gram-based Author profiles for authorship attribution. In Proceedings of the Conference Pacific Association for Computational Linguistics, Halifax, NS, Canada, 22–25 August 2003; pp. 255–264. [Google Scholar]
  32. Pavelec, D.; Oliveira, L.S.; Justino, E.J.; Batista, L.V. Using Conjunctions and Adverbs for Author Verification. J. Univers. Comput. Sci. 2008, 14, 2967–2981. [Google Scholar]
  33. Silva, R.S.; Laboreiro, G.; Sarmento, L.; Grant, T.; Oliveira, E.; Maia, B. ‘Twazn Me!!!;(’Automatic Authorship Analysis of Micro-Blogging Messages. In Proceedings of the International Conference on Application of Natural Language to Information Systems, Alicante, Spain, 28–30 June 2011; pp. 161–168. [Google Scholar]
  34. Stopword. Available online: https://www.isical.ac.in/~fire/data/stopwords_list_ben.txt, (accessed on 22 April 2022).
  35. Dhivya, S.; Devi, U.G. TAMIZHI: Historical Tamil-Brahmi Script Recognition Using CNN and MobileNet. Trans. Asian Low-Resour. Lang. Inf. Process. 2021, 20, 1–26. [Google Scholar]
  36. Sun, L.; Xu, W.; Liu, J. Two-channel Attention Mechanism Fusion Model of Stock Price Prediction Based on CNN-LSTM. Trans. Asian Low-Resour. Lang. Inf. Process. 2021, 20, 1–12. [Google Scholar] [CrossRef]
  37. Gupta, V.; Jain, N.; Shubham, S.; Madan, A.; Chaudhary, A.; Xin, Q. Toward Integrated CNN-based Sentiment Analysis of Tweets for Scarce-resource Language—Hindi. Trans. Asian Low-Resour. Lang. Inf. Process. 2021, 20, 1–23. [Google Scholar] [CrossRef]
  38. Indira, D.N.V.S.L.S.; Goddu, J.; Indraja, B.; Challa, V.M.L.; Manasa, B. A review on fruit recognition and feature evaluation using CNN. Mater. Today Proc. 2021. [Google Scholar] [CrossRef]
  39. Dalal, T.; Singh, M. Review Paper on Leaf Diseases Detection and Classification Using Various CNN Techniques. In Mobile Radio Communications and 5G Networks; Springer: Berlin/Heidelberg, Germany, 2021; pp. 153–162. [Google Scholar]
  40. Cheng, G.; Lai, P.; Gao, D.; Han, J. Class Attention Network for Image Recognition. Sci. China Inf. Sci. 2022. [Google Scholar]
  41. Cheng, G.; Yang, C.; Yao, X.; Guo, L.; Han, J. When deep learning meets metric learning: Remote sensing image scene classification via learning discriminative CNNs. IEEE Trans. Geosci. Remote Sens. 2018, 56, 2811–2821. [Google Scholar] [CrossRef]
  42. C50 Dataset. Available online: https://archive.ics.uci.edu/ml/datasets/Reuter_50_50 (accessed on 16 July 2022).
  43. Stamatatos, E. Author identification using imbalanced and limited training texts. In Proceedings of the IEEE International Workshop on Database and Expert Systems Applications, Regensburg, Germany, 3–7 September 2007; pp. 237–241. [Google Scholar]
  44. Gupta, S.T.; Sahoo, J.K.; Roul, R.K. Authorship Identification Using Recurrent Neural Networks. In Proceedings of the 2019 3rd International Conference on Information System and Data Mining, Houston, TX, USA, 6–8 April 2019; Association for Computing Machinery: New York, NY, USA, 2019; pp. 133–137. [Google Scholar]
  45. Aykent, S.; Dozier, G. Author Identification via a Distributed Neural-Evolutionary Hybrid (DiNEH). In Proceedings of the 2020 SoutheastCon, Raleigh, NC, USA, 28–29 March 2020; pp. 1–6. [Google Scholar]
  46. Hassan, S.U.; Imran, M.; Iftikhar, T.; Safder, I.; Shabbir, M. Deep stylometry and lexical & syntactic features based author attribution on PLoS digital repository. In Proceedings of the International Conference on Asian Digital Libraries, Bangkok, Thailand, 13–15 November 2017; pp. 119–127. [Google Scholar]
  47. Gómez-Adorno, H.; Sidorov, G.; Pinto, D.; Markov, I. A graph based authorship identification approach. In Proceedings of the Working Notes Papers of the CLEF, Toulouse, France, 8–11 September 2015. [Google Scholar]
Figure 1. The methodology of the proposed work.
Futureinternet 14 00272 g001
Figure 2. The sample text written by Bankim Chandra Chattopadhyay [3].
Futureinternet 14 00272 g002
Figure 3. The sample text written by Rabindranath Tagore [3].
Futureinternet 14 00272 g003
Figure 4. The sample text written by Suchitra Bhattacharya [3].
Futureinternet 14 00272 g004
Figure 5. The sample text written by Sunil Gangopadhyay [3].
Futureinternet 14 00272 g005
Figure 6. The feature visualizations of one document by four authors using line charts. The x-axis represents the 17 features considered in the experiment. The y-axis represents the feature values obtained for each feature. The line chart follows the default color for the feature values.
Futureinternet 14 00272 g006
Figure 7. The feature visualizations of one document by four authors using imagesc charts. The x-axis represents the 17 features considered in the experiment. The y-axis represents the feature values obtained for each feature. Here, the “jet” theme was used for distinguishing the feature values from one another.
Futureinternet 14 00272 g007
Figure 8. The feature visualizations of one document by four authors using pie charts. Each area represents each feature value obtained for 17 features used in the experiment. Here, the “hsv” theme was used for distinguishing the feature values from one another.
Futureinternet 14 00272 g008
Figure 9. The architecture of the proposed network.
Futureinternet 14 00272 g009
Figure 10. The heat map obtained for the proposed approach.
Futureinternet 14 00272 g010
Figure 11. The inter- and intraclass similarity analysis. In this figure, four instances of four different authors are shown ((a)–(d) from Bankim Chandra Chattopadhyay; (e)–(h) from Rabindranath Tagore; (i)–(l) from Suchitra Bhattacharya; and (m)–(p) from Sunil Gangopadhyay). It can be observed that the interclass similarity is quite high among the authors. There is also a high similarity between different authors such as (d) and (h) marked in orange boxes, (j) and (n) marked in red boxes, and (l) and (p) marked in green boxes, which leads to confusion. Furthermore, an intraclass difference is observed, adding more challenge to our task: the difference can be observed for the pairs (c)–(d), (e)–(f), (i)–(j), and (n)–(o), all pairs from the same author, which further adds to the chances of misclassification.
Futureinternet 14 00272 g011
Figure 12. The relative differences in accuracy with increasing number of authors.
Futureinternet 14 00272 g012
Figure 13. Heat map obtained for datasets of disparate sizes.
Futureinternet 14 00272 g013
Figure 14. The Heat map obtained on the Bangla dataset and English datasets. The heat maps illustrate the model in which the datasets obtained maximum accuracies (for the English dataset it was the Inception model whereas for the Bangla dataset it was the MobileNet model).
Futureinternet 14 00272 g014
Figure 15. Performance of different popular classifiers.
Futureinternet 14 00272 g015
Table 1. The brief analysis of the literature study.
ReferenceApproachAccuracy (%)
Qian et al.  [4]Deep learning89.20
Mohsen et al.  [5]Deep learning95.12
Zhang et al.  [6]Semantic relationship95.30
Benzebouchi et al.  [7]Word embeddings and MLP95.83
Anwar et al.  [9]LDA model with n-grams93.17
and cosine similarity
Rexha et al.  [10]Content and stylometric features72.00 Confidence
Nirkhi et al.  [12]Unigram and SVM88.00
López-Monroy et al. [13]Bag-of-words model with SVM80.80
Sarwar and Hassan [16]Stylometric features94.03
Chakraborty and Choudhury [17]Graph-based algorithm94.98
Digamberrao and Prasad [18]SMO with J48 algorithm80.00
Rakshit et al. [19]Stylistic feature and SVM92.30
Anisuzzaman and Salam [20]n-gram and NB95.00
Table 2. The partitioned dataset illustrating the number of articles for each set.
No. of AuthorsNo. of Articles
555
10160
15273
20368
25468
30572
35753
40905
451055
501200
Table 3. The statistical analysis of the data after preprocessing.
Analysis per DocumentNumber of Words
Maximum3753
Minimum462
Average2882
Table 4. The number of parameters for different layers of the network.
LayersParameters
Convolution12432
Convolution24624
Dense13,936,512
Dense225,700
Dense35050
Total3,974,318
Table 5. Results obtained for three charts using three feature sets.
Types of ChartsAccuracy (in %)
Statistical FeaturesInternal FeaturesCombination of Both
line91.9286.6793.58
imagesc86.5081.6789.92
pie91.7588.4292.42
Table 6. Results obtained for different batch sizes keeping image size and epochs at 100 and dropout at 0.5.
Batch size50100150200
Accuracy (in %)92.7593.5893.2592.92
Table 7. Results obtained for different image sizes keeping batch size and epochs at 100 and dropout at 0.5.
Image size50100150200
Accuracy (in %)93.2593.5889.7592.42
Table 8. Results obtained for different epochs keeping batch size and image size as 100 and dropout as 0.5.
Epochs100150200
Accuracy (in %)93.1793.5893.25
Table 9. Results obtained for different dropout values keeping batch size, image size, and epochs as 100, 100, and 150, respectively.
Dropout0.10.20.30.40.50.60.70.80.9
Accuracy (in %)91.0090.6792.5092.8393.5892.5893.1793.5093.25
Table 10. The results obtained for the partitioned datasets.
No. of AuthorsNo. of ArticlesAccuracy (in %)Deviation from Past Accuracy
555100.00
10160100.000.00
15273100.000.00
2036894.84−5.16
2546894.44−0.40
3057291.44−3.00
3575394.292.85
4090590.50−3.79
45105593.462.96
50120093.580.12
Table 11. Results obtained for the other two CNN models.
ModelParametersAccuracy (in %)
English DatasetBangla Dataset
Inception26,524,20284.3677.58
MobileNet7,425,99482.9681.58
Proposed3,974,31893.5293.58
Table 12. The obtained accuracies of the existing systems on our dataset.
ReferenceApproachAccuracy (%)
Rakshit et al.Semantic and stylistic features + SVM90.67
Anisuzzaman and SalamN-gram + NB84.28
Our approachImage-based features + CNN93.58
Table 13. The results obtained on the C50 dataset using the proposed approach.
ReferenceAccuracy (%)
Gupta et al. (2019) [44]78.10
Nirkhi et al. (2015) [45]68.76
Our method93.52
Publisher’s Note: MDPI stays neutral with regard to jurisdictional claims in published maps and institutional affiliations.