Abstract
Online roadshow is a relatively new concept that has higher flexibility and scalability compared to the physical roadshow. This is because online roadshow is accessible through digital devices anywhere and anytime. In a physical roadshow, organizations can measure the effectiveness of the roadshow by interacting with the customers. However, organizations cannot monitor the effectiveness of the online roadshow by using the same method. A good user experience is important to increase the advertising effects on the online roadshow website. In web usage mining, clustering can discover user access patterns from the weblog. By applying a clustering technique, the online roadshow website can be further improved to provide a better user experience. This paper presents a review of clustering techniques used in web usage mining, namely the partition-based, hierarchical, density-based, and fuzzy clustering techniques. These clustering techniques are analyzed from three perspectives: their similarity measures, the evaluation metrics used to determine the optimality of the clusters, and the functional purpose of applying the techniques to improve the user experience of the website. By applying clustering techniques in different stages of the user activities in the online roadshow website, the advertising effectiveness of the website can be enhanced in terms of its affordance, flow, and interactivity.
1. Introduction
The World Wide Web (WWW) is a significant service that plays key roles in many real-world applications, such as education, entertainment, and social media. The Web has grown immensely over the years as Internet users interact with different types of websites. Online roadshow is a roadshow in the virtual environment that promotes products or services on digital devices [1]. Similar to a physical roadshow, the online roadshow can promote desired products in the form of online campaigns. The online roadshow website comprises multiple online campaigns that are held by different advertisers. As this online roadshow website is a fairly new web construct, many improvements are necessary to provide a better user experience.
User experience (UX) is defined as the creation and synchronization of aspects that affect users’ experience with a particular organization to shape their perceptions and behaviour towards the organization [2]. The aspects mentioned include what users can feel with their five senses and interact with it. User experience is designed to understand the feelings and emotions that the customers experienced in using the service beyond the concept of the user interface. Hence, user experience should be carefully developed to ensure effective advertising in an online roadshow website with active user engagement. There are three important good user experience constructs in advertising, namely the product affordance, flow, and interactivity [3,4,5]. Affordance refers to the attributes of the advertisement in terms of its ability to enable the customers to know, act, feel, and accomplish something that leads to the preferable use of the advertised product or service. Flow is the immersive psychological state of the customers when he or she is experiencing the advertisement. Interactivity comprises five elements, namely two-way communication, responsiveness, control, playfulness, and personalization. These constructs are relevant to the online roadshow website to provide a good user experience. To obtain insights on useful activities of the users, web mining is performed on the weblog [6]. Web mining is a process of using the data mining techniques to extract and discover useful information from web documents [7]. If web mining is performed on the weblog of the online roadshow website, developers can enhance user experience based on the mined information.
Web mining can be classified into three categories, namely Web Content Mining (WCM), Web Structure Mining (WSM), and Web Usage Mining (WUM). Each of the web mining categories focuses on different aspects of web documents. WCM aims to discover useful information in the Web pages such as HTML code, images, and downloadable files. WSM focuses on discovering the link structure of the hyperlinks in the Web pages to identify the relationship between Web pages. WUM attempts to discover the user access patterns while the users are navigating the website. The user’s access patterns that are discovered from web usage data are useful in analyzing how the Web pages are accessed. Web usage data usually comes from web server logs, browser logs, and proxy server logs. Website administrators can leverage this knowledge to identify the weakness in the website structure and make the necessary improvement.
WUM comprises three main phases of pre-processing, pattern discovery, and pattern analysis [8], as shown in Figure 1. In the pre-processing phase, the weblog data is first cleaned to remove the unnecessary contents such as the request of graphic files, scripts, and error logs. After that, user identification and session identification are performed to identify the unique users and to divide the navigation paths into individual sessions. Pattern discovery is the phase to extract the user behavioural patterns using different techniques such as statistical analysis, sequential patterns, clustering, etc. Pattern analysis will finally be able to extract interesting rules and patterns from the pattern discovery phase.
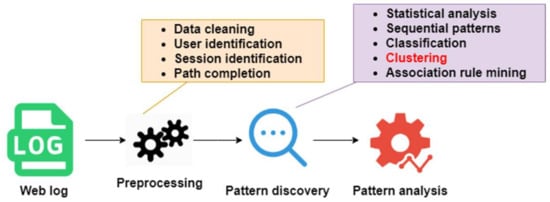
Figure 1.
Web usage mining process.
Although there are many methods to perform the pattern discovery, this paper focuses on the clustering techniques of user access patterns to monitor the advertising effectiveness of the online roadshow based on user experience. Clustering technique can group users with similar preferences, habits, and behavioral patterns [9]. By leveraging the advantages of the clustering technique to discover user activity in the Web pages, the advertising effectiveness of the online roadshow can be achieved by investigating the three user experience constructs suggested by Choi et al. [3]. Hence, this paper investigates the existing clustering techniques used for different functional purposes of web usage mining, aiming ultimately to enhance the user experience of the online roadshow website.
To carry out the review of the state-of-the-art clustering techniques in web usage mining, the review works are collected from IEEE, Springer, ACM Digital Library, and Science Direct. Google Scholar was also used to include articles published in other educational journals. The keywords include the name of the clustering technique and the term of “web usage mining” is used to narrow down the scope of the studies to the clustering techniques that have been applied in web usage mining. The referenced articles on the clustering techniques are published from 2010 to 2021, with the exception of an article on fuzzy c-means that is published in 2003.
To the best of our knowledge, there are a few comprehensive reviews on the utilization of different clustering techniques in web usage mining. The differences between our paper and the others are highlighted:
- In [10,11,12,13], the clustering techniques are generally discussed without focusing on any specific application, while our paper specifically discusses the clustering techniques used in web usage mining. In [10], greater focuses are on time series clustering, similarity measures, and evaluation metrics. In [11,13], both papers exclude the review of fuzzy-based clustering techniques.
- Refs. [14,15] introduce and discuss the clustering techniques used in data mining for big data, but do not review their similarity measures and evaluation metrics.
- Refs. [6,16] are dedicated to the review of clustering techniques in web usage mining. However, these papers do not discuss the suitable clustering techniques for different purposes of web usage mining.
To conclude, the clustering techniques are analyzed from three perspectives in this work. First, our paper reviews the similarity measures that are used in different clustering techniques. Second, we discuss the evaluation metrics of the clustering techniques that are used in determining if the clusters are optimal. Lastly, the purpose of applying the techniques to improve the user experience of the online roadshow website is proposed.
The rest of the paper is organized as follows. Section 2 presents the clustering techniques that are used in web usage mining. Section 3 presents the discussion. Finally, the paper is concluded with a discussion on the contribution of this work and future work in Section 4 and Section 5 respectively.
2. Clustering Techniques
Clustering is the identification of similar objects that can be placed into groups without advanced knowledge about the groups themselves [11]. Unlike classification, clustering is an unsupervised learning algorithm. Over the years, clustering techniques are applied in different areas, such as image processing [17], document analysis [18], data mining, networking [19], intrusion detection [20], and so on. In this section, the existing works related to the clustering techniques in web usage mining are discussed. Clustering techniques can be categorized into four groups, namely partition-based, hierarchical, density-based, and fuzzy. This section is organized as follows. For each type of clustering techniques, the explanation and steps of the techniques are discussed. After that, the variations of the existing works are presented.
2.1. Partition-Based Clustering
The partition-based clustering uses an iterative method, based on a selected distance measure to update the clusters, until an optimal partition is obtained [21]. In this technique, the number of the resulting clusters is pre-defined by the user. There are two notable partition-based clustering techniques that are used in web usage mining, namely the k-means and k-medoids.
K-meansclustering is a case where the cluster is represented by its centroid. The centroids that are selected do not have to be a member of the cluster. The basic steps are illustrated in Figure 2.
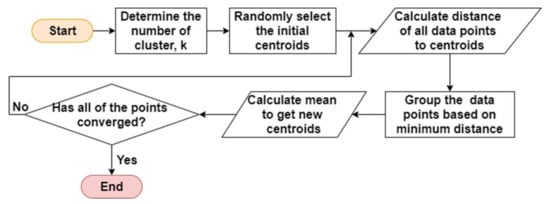
Figure 2.
Basic steps of k-means clustering.
- Step 1.
- Randomly select centroids for each cluster.
- Step 2.
- Calculate the distance of all data points to the centroids and assign them to the closest cluster.
- Step 3.
- Get the new centroids of each cluster by taking the mean of all data points in the cluster.
- Step 4.
- Repeat steps 2 and 3 until all the points converged and the centroids stop moving.
K-means clustering is one of the easiest techniques to implement, as it is easy to interpret and understand. In [22,23,24,25,26], the conventional k-means clustering technique is applied for web usage mining. As k-means clustering has its drawbacks, such as the need to predetermine the number of clusters and its high sensitivity to outliers, many researchers work on improving this technique. There is a slight difference between the conventional k-means clustering technique with [27,28]. In the modified k-means clustering technique [27], the old cluster centroid value is updated by delta, where delta is the average distance value of each cluster. When the modified technique is tested with the conventional k-means on a simple dataset, the results revealed that the modified k-means clustering works better than the basic technique in terms of reducing the number of iterations taken to converge and the quality of the clusters formed. Instead of randomly choosing the initial centroid value, the centroid values are calculated with an additional step to divide between the minimal and the maximal intra-cluster distance in [28]. In another study, Alguliyev et al. [29] performed particle swarm optimization (PSO) to the data after applying k-means clustering. The PSO will group the data objects based on the minimum distance criterion and evaluate the fitness function. The combination of PSO and k-means clustering shows a more promising performance than the conventional k-means clustering.
K-medoidsclustering works in a similar way to k-means clustering. However, unlike k-means clustering, the medoid (centre value) in k-medoids clustering must be a member of the cluster, where its dissimilarities with all other points in the cluster are at the minimum. The basic steps of k-medoids clustering are illustrated in Figure 3.
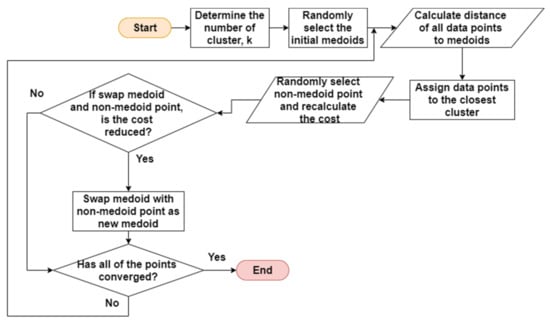
Figure 3.
Basic steps of k-medoids clustering.
- Step 1.
- Randomly select k random points out of the data points as medoids.
- Step 2.
- Calculate the distance of all data points to the medoids and assign them to the closest cluster.
- Step 3.
- Randomly select one non-medoid point and recalculate the cost.
- Step 4.
- Swap the medoid with the non-medoid point as the new medoid point if the swap reduces the cost.
- Step 5.
- Repeat steps 2 to 4 until all the points converge and the medoid point stop moving.
As k-means clustering is more sensitive to outliers, k-medoids clustering is claimed to be more robust than k-means because medoids are less influenced by outlier [30]. In [30,31,32], the authors performed the traditional k-medoids clustering technique on the dataset. Ji et al. [33] improved the clustering quality of k-medoids by not selecting the initial medoids at random. Instead, k data points that differ greatly from each other are added into the existing data and are used as the initial medoids, where k is the number of clusters. In [34], Shinde et al. also modified the calculation of the centroid by introducing the alpha and beta values as the thresholds for choosing the initial medoids and determining if a particular data point is an outlier. As result, the improved k-medoids clustering can be executed in a shorter time since the algorithm does not randomly choose the medoid.
To summarize from the evaluation of k-means and k-medoids clustering, partition-based clustering techniques are used because of their ease of interpretation and relatively fast computational speed. However, its major drawback is that the quality of the clusters highly depends on the selection of the initial centroid or medoid. To enhance the techniques so that they can converge faster and produce better clusters, many researchers come up with ways to modify the method of selecting a more suitable initial centroid or medoid.
2.2. Hierarchical Clustering
The hierarchical clustering technique can be further categorized into agglomerative (bottom-up) and divisive (top-down) approaches. The hierarchical clustering works by grouping objects in a hierarchical manner, which is a tree of cluster [35]. The result of the agglomerative hierarchical clustering can be visualised using a dendrogram to show how the clusters are formed. The resulting clusters are then determined by slicing the dendrogram with a horizontal line. Although partition-based clustering techniques are simple to implement, the number of clusters has to be predetermined beforehand. Thus, many researchers need to experiment with different k values to get the optimal clusters. On the contrary, the number of clusters does not need to be predetermined in agglomerative hierarchical technique. However, the divisive hierarchical clustering requires the number of clusters to be predetermined. Both types of hierarchical clustering techniques have its own disadvantages. The clusters cannot be undone once it is merged or split. Therefore, many researchers designed the improved version of hierarchical clustering techniques to overcome the limitation of the original technique.
For the agglomerative approach, CURE and CHAMELEON techniques are discussed. In agglomerative hierarchical clustering techniques, each observation starts in its own cluster, and pairs of clusters are merged as it moves up the hierarchy. CURE is an agglomerative hierarchical clustering technique that adopts a middle ground between the centroid and the all-point extremes. The basic steps are illustrated in Figure 4.
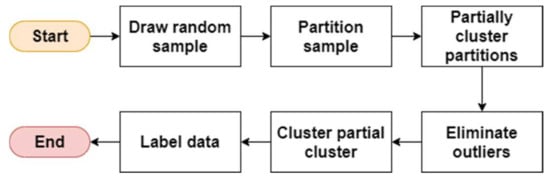
Figure 4.
Basic steps of CURE.
- Step 1.
- Draw a random sample and partition it.
- Step 2.
- Partially cluster the partitions.
- Step 3.
- Eliminate the outliers.
- Step 4.
- Cluster the partial clusters, shrinking representative towards the centroid.
- Step 5.
- Label the data.
In [36], the authors compared the traditional and optimized version of the CURE technique to perform clustering in their weblog data. The CURE technique is optimized by introducing two components. The two components are the initialization of the initial clusters and the use of k-dimensional (k-d) tree and heap tree data structures. When the cluster quality of both traditional CURE and optimized CURE are measured, the optimized algorithm shows a more promising result [37]. As CURE chooses random points as representative points from each cluster, this gives a problem when the datasets do not have a centroid tendency. To overcome this problem, Kumble et al. proposed using shared nearest neighbours (SNN) of the data points to form clusters. The authors aim to apply this improved CURE technique in data mining to uncover beneficial information from a big amount of data. Nevertheless, the improved CURE clustering technique from Kumble et al. is yet to be applied in web usage mining.
CHAMELEON is an agglomerative hierarchical clustering technique that uses dynamic modelling. CHAMELEON measures the similarity of two clusters based on a dynamic model. It has two major phases: (1) partitioning and (2) merging. The basic steps are illustrated in Figure 5.
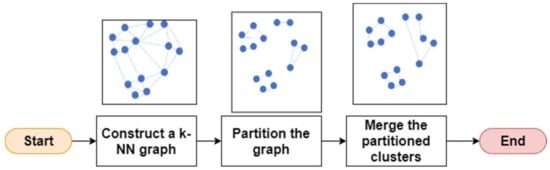
Figure 5.
Basic steps of CHAMELEON.
- Step 1.
- Construct a k-NN graph.
- Step 2.
- Partition the graph to produce equal-sized partitions and minimize the number of edges cut using a partitioning algorithm.
- Step 3.
- Merge the partitioned clusters whose relative interconnectivity and relative closeness are above some user-specified thresholds.
The key steps are partitioning and merging. The partitioning process has three stages, namely the coarsening phase, initial partitioning phase, and the uncoarsening phase. In the coarsening phase, the size of the hypergraph is decreased by reducing the number of vertices. In the initial partitioning phase, the hypergraph of a smaller size after the coarsening phase is partitioned. In the uncoarsening phase, the partitioned hypergraph is projected to the finer next level hypergraph by using a partitioning refinement algorithm to optimize the objective function without violating the partitioning balancing constraints. The difference between hMETIS and khMETIS lies in the refinement algorithm, where hMETIS uses the FM algorithm while khMETIS uses the greedy refinement algorithm [38].
Pransanth et al. [39] proposed a system that can discover the user’s frequent search pattern by clustering the weblog and performing semantic analysis. In addition, ref. [40] is a continuation of [39] by adding the recommendation rules into the CHAMELEON clustering. These recommendation rules help to retrieve the best access pages from the user’s frequent pattern access history. When the performances of the proposed algorithms of [39,40] are compared, the CHAMELEON clustering with semantic analysis and recommendation rules approach has better results. This might be a better approach for a recommender system in suggesting web pages to users as it considers two factors: the semantics of information and the recommendation rules.
For the divisive approach in hierarchical clustering, bisecting k-means is discussed. Bisecting k-means is a combination of k-means clustering and hierarchical clustering. Bisecting k-means attempts to overcome the limitation of k-means in identifying non-spherical shaped clusters. The basic steps are illustrated in Figure 6.
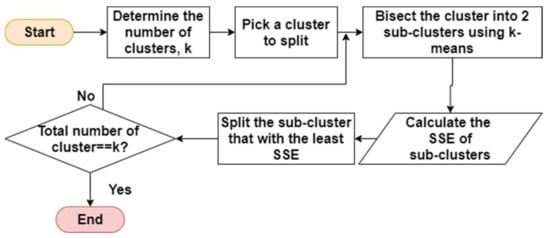
Figure 6.
Basic steps of bisecting k-means.
- Step 1.
- Determine the number of clusters, k.
- Step 2.
- Pick a cluster to split.
- Step 3.
- Find two sub-clusters using k-means clustering (bisecting step).
- Step 4.
- Repeat step 3 to take the split with the least total sum of squared error (SSE) until the list of clusters is k.
To the best of our knowledge, the authors commonly applied the traditional bisecting k-means in their weblog data. Abirami et al. [41] compared the performances of both k-means and bisecting k-means in web usage mining by using the five weblog data. It is found that bisecting k-means does not produce empty clusters like k-means and produces more balanced number of data points in each cluster [41,42].
2.3. Density-Based Clustering
Both hierarchical clustering and partition-based clustering are sensitive to outliers. On the other hand, density-based clustering is more robust towards outlier. Density-based clustering has two notions in mind, which are “clusters” and “noise” [43]. As clusters are normally a dense region of points, this technique targets the dense regions to perform clustering. The technique will treat the less dense regions as “noise”. However, density-based clustering has difficulty identifying the clusters if the density varies. The quality of the clusters in density-based clustering is also highly dependent on the clustering parameters, minPts and eps. If the minPts value is too low, the clusters will contain more outliers. On the other hand, if the eps value is too low, valid clusters will be split into smaller and smaller clusters. In this paper, DBSCAN is discussed, as it is widely used in web usage mining.
DBSCAN discovers clusters and noise in a spatial database. It uses two parameters: (1) minPts, which is the minimum number of points clustered together for a region to be dense, and (2) eps, which is the distance measure that will locate the points in the neighbourhood of any point. The basic steps are illustrated in Figure 7.
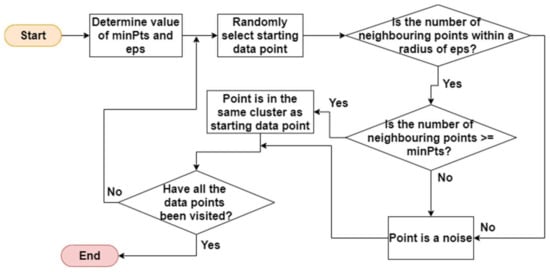
Figure 7.
Basic steps of DBSCAN.
- Step 1.
- Determine the value of minPts and eps.
- Step 2.
- Randomly select a starting data point. If there are at least minPts within a radius of eps to the starting data point, then the points are part of the same cluster. Otherwise the point is considered a noise.
- Step 3.
- Repeat step 2 until all the points are visited.
In [44,45], the conventional DBSCAN is used to perform clustering in web usage mining. The drawback of DBSCAN is its reduced performance for clusters with a big difference in densities. Thus, adaptive DBSCAN modifies the traditional DBSCAN algorithm [46]. Instead of having fixed values for minPts and eps, both of the values will be updated based on the data points. Huang et al. [47] compared the performance of the traditional and adaptive DBSCAN in web usage mining. As result, the adaptive DBSCAN is seen to have a higher accuracy and recall score. Ping et al. [48] combined both k-means clustering and DBSCAN to overcome the weaknesses in both algorithms. The k-means component that is incorporated in the DBSCAN is the search for a more optimal central point. On the other hand, Udantha et al. [49] combined both the Expectation Maximization (EM) algorithm and DBSCAN. The EM algorithm is first performed in the weblog data to get the number of clusters. After that, the output of the EM algorithm is inserted into a Gaussian function to calculate the minimum and the maximum number of web sessions in a cluster before performing the DBSCAN. The performance of this hybrid algorithm is significantly better than the standalone EM, DBSCAN, and k-means.
2.4. Fuzzy Clustering
Partition-based clustering, hierarchical clustering, and density-based clustering have one similarity, which is ensuring one data point belongs to only one cluster. These algorithms cannot handle overlapping clusters. Fuzzy clustering overcomes this problem by allowing each data point to belong to more than one cluster. Similar to partition-based clustering, the performance of fuzzy clustering is also sensitive to the centroids initialization. Fuzzy c-means (FCM) clustering is discussed here as it is widely applied in web usage mining.
FCM works by assigning each data point corresponding to each cluster centroid according to the distance between them. The shorter distance between the cluster centroid and data point will create a higher membership value of the data point to the centroid. The membership value refers to the degree of which the data point belongs to the cluster, ranging from 0 to 1. In the traditional fuzzy clustering, the centroid of a cluster is determined from the average of all the points weighted by their membership value. In FCM, the parameter, m determines the degree of fuzziness. The m value should be larger than 1. If m = 1, the resulting cluster is crisp, in which each data point belongs to only one cluster. With larger values of m, the data point tends to belong to many clusters. Thus, a suitable m value should be selected to get optimal clusters [50,51]. The basic steps are illustrated in Figure 8.
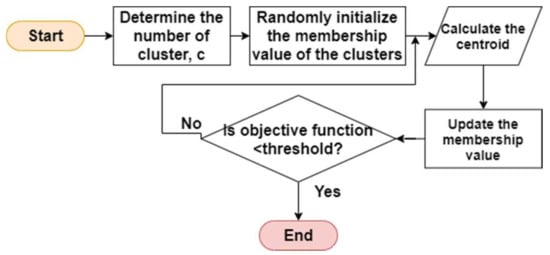
Figure 8.
Basic steps of FCM.
- Step 1.
- Determine the number of clusters, c.
- Step 2.
- Randomly initialize the membership value of the clusters.
- Step 3.
- Calculate the value of centroid and update the membership value.
- Step 4.
- Repeat step 3 until the objective function is less than a threshold value.
In [52,53,54,55], the traditional FCM is used to perform clustering in web usage mining. Over the years, the researchers improved fuzzy clustering through the initialization method and membership value assignment. The existing research attempted to improve the centroid initialization by using information entropy and genetic algorithm [56,57]. To improve the membership value assignment, researchers also introduced an iterative version and penalty factor [58,59]. Besides that, FCM can also be used to improve other algorithms, such as the Kohonen clustering [60] and PageRank algorithm [61]. To improve the existing PageRank algorithm, both FCM and information entropy are used to calculate the weight of the pages. The improved PageRank algorithm overcomes some of the weaknesses in the traditional algorithm, such as an excessive focus on historic pages, topic drifting, and indifferent link weights. Pan et al. [60] improved the existing Kohonen clustering by integrating a modified learning rate to speed up the convergence. Not only that, the improved Kohonen clustering incorporates the merits of fuzzy theory and neural network to provide a way to handle an extensive amount of weblogs with high complexity and uncertainty, resulting in high-quality clusters.
3. Discussion
Among the existing works, three perspectives are considered when choosing the clustering techniques, namely the similarity measures, the evaluation metrics, and the functional purposes of clustering. Table 1 summarizes the usage of different clustering techniques in web usage mining based on their similarity measures, evaluation metrics, and functional purposes. The * symbol represents the improved version of either the similarity measures, evaluation metrics, or clustering purposes.

Table 1.
The usage of clustering techniques in web usage mining.
3.1. Similarity Measure
Similarity measure refers to a function that measures the similarity between two data points. A similarity measure is used to cluster similar data points into the same clusters, while dissimilar data points are placed into different clusters. Choosing a suitable and accurate similarity measure is subjective in clustering. There are many similarity measures that are used by different researchers. The usage frequency of similarity measure among the four categories of clustering techniques is displayed in Table 2.
Table 2.
Frequency heat map of similarity measure with respect to the clustering algorithms.
Euclidean distance is shown with a frequency of 16, as the most commonly applied similarity measure in web usage mining. Euclidean distance is used widely because it is calculated based on the Cartesian coordinates and well understood by many. However, Euclidean distance has the drawback of significantly amplifying the effect of outliers by squaring the distances. The second most commonly used similarity measure is cosine similarity. Selvakumar et al. [28] claimed that the cosine similarity is more suitable than the Euclidean distance because the Euclidean distance might intercept the magnitude of data points to be equal distance for all the dimensions. On contrary, cosine similarity works better in high-dimensional data [66]. When the data points of the weblog are plotted on a multi-dimensional space, the cosine similarity can capture the angle of the data points rather than their magnitude.
Some other similarity measures that are not frequently used in web usage mining are Manhattan distance, Hamming distance, Jaccard similarity, and fuzzy similarity. Instead of squaring the distances as in Euclidean distance, Manhattan distance is the sum of absolute differences between the data points across all dimensions. It is not frequently used as it is sensitive to outliers. Hamming distance is commonly used as the similarity measure only when it needs to be applied in information theory to detect and correct errors in bits. Patel et al. [30] compared the usage of Cosine similarity and Hamming similarity as the distance measure in k-medoids clustering. Since there are only two clusters (binary), Hamming similarity shows a better performance as compared to Cosine similarity. Jaccard similarity is commonly used to evaluate the performance of the clustering process, rather than the similarity measure.
Some researchers attempted to improve upon the similarity measures so that the clustering quality can be improved. Poornalatha et al. [27] introduced a new distance measure called the Variable Length Vector Distance (VLVD) that can calculate the distance between two web session vectors of different lengths. VLVD is proposed as most of the papers represent each web session as a binary vector of a certain length, and do not consider vectors of longer lengths. In [67], Santhisree et al. introduced Sequence Similarity Measure (SSM) that focuses on measuring the similarities between the sequentially ordered web sessions. SSM is proposed as Jaccard similarity, Euclidean distance, and fuzzy similarity do not capture the sequential nature of the web sessions.
3.2. Evaluation Metrics
Cluster validity is the evaluation of clustering quality. A cluster of good quality minimizes the distance within clusters (intra-cluster distance) and maximizes the distance between clusters (inter-cluster distance). The definition of clusters highly depends on the user and the domain where clustering is applied [10]. The two major categories of evaluation metrics in clustering are internal criteria and external criteria [71]. They are evaluated based on the presence of data labels. Table 3 shows the equations of each evaluation metrics. Although the equations for accuracy and rand index look the same, they treat the class label differently. Accuracy compares the true labels (ground truth) with the predicted labels. As there are no true labels in clustering, the rand index will effectively check the similarity between the two data points.
Table 3.
Evaluation metrics and equations.
Internal criteria measure the validity of the clusters by applying similarity measure techniques. Internal criteria evaluate the clustering result by using only feature and information inherent in a dataset [71]. The metrics are usually used if the ground truth is unknown. It can only make an assumption about the cluster quality. Table 4 shows the evaluation metric with its associated range and clustering quality. Note that the increase or decrease of the value in different evaluation metric indicates a better performance quality of the clustering technique.
Table 4.
Evaluation metrics for internal criteria.
Based on Table 4, the commonly used internal criteria are inter-cluster distance, intra-cluster distance, DB index, C index, and Sum of Square Error (SSE). The inter-cluster distance and intra-cluster distance are usually calculated after the final clustering iteration to determine the cluster validity. If the inter-cluster distance is low and the intra-cluster distance is high, this shows that the clusters are formed well. Santhisree et al. [63,67] evaluated the performance of the clusters by calculating the mean and standard deviation of the intra-cluster distance and inter-cluster distance of each distance measure. For DB index and C index, a smaller value signifies better clustering quality. DB index and C index attempt to minimize the average of intra-cluster distance. SSE is not just a metric, but also an objective function that should be optimized when clustering is performed. SSE is the sum of the squared differences between each observation and its mean. As the SSE value decreases, the cluster validity is higher.
The least commonly used evaluation metrics are Silhouette index and Dunn index. The Dunn index should be maximized to identify clusters that are well separated and compact. Silhouette index computes a width for each point, depending on its membership in any cluster. Similar to the Dunn index, a higher Silhouette index indicates an optimal quality of cluster. Pan et al. [60] proposed a new cluster validity index called Snew. This new index is defined based on two essential measures, namely intra-cluster property and inter-cluster distance. The minimum value of Snew shows an optimal clustering quality, as it has achieved a small intra-cluster distance and a big inter-cluster distance. This new cluster validity index is introduced since the existing metrics, such as DB index and Silhouette index, lack the considerations of data size and distribution.
Table 5 shows the evaluation metrics for external criteria. Note that the increase or decrease of the value in different evaluation metric indicates a better performance quality of the clustering technique. The clustering quality displays the performance value of the metrics within the range from 0 to 1 to achieve a good clustering quality. External criteria measure the quality of the clusters based on the ground truth in three ways. The first type is to perform clustering on the weblog and calculate the clustering quality with the actual class label by using any of the evaluation metrics [22,29,30,34,36,39,40,41,42,48,58,61,64,71]. In the second type, the dataset is first split into training and testing datasets. Clustering will be performed on the training dataset. The testing dataset is used to evaluate the performance of the clustering process [24,33]. For the third type, clustering is first performed. After that, the result of clustering is trained using a neural network to validate the clusters [7,23,68,69].
Table 5.
Evaluation metrics for external criteria.
3.3. Functional Purpose
Before performing clustering on the weblog data, it is important to determine the functional purpose of clustering so that it can improve user experience on the website. From Table 1, the different functional purposes of clustering in web usage mining are listed. The most frequent purposes of clustering are web queries categorization, page recommendation, user group discovery, web personalization, user group categorization, and page categorization. These functional purposes are discussed thoroughly in how they can be applied in the case study of the online roadshow. As the web construct of an online roadshow is relatively new, clustering can help to aid the development of a more effective online roadshow website.
The contribution of the clustering purposes towards user experience is presented in Table 6. The general functionalities of page recommendation, web personalization and web queries categorization are similar, but they differ in some specific aspects. Page recommendation suggests the content based on similar user group behaviours, while the web personalization is more individualized. Web personalization suggests the content to the user according to the individual preferences.
Table 6.
Functional purpose and ways to improve user experience.
However, some pre-requisite steps shown in Figure 9 are necessary to achieve three aforementioned functional purposes. Page categorization is a pre-requisite step before performing either page recommendation or web personalization. In page categorization, the web pages are only clustered based on a common theme or topic. After that, page recommendation is performed to suggest the web pages to the users based on topics.
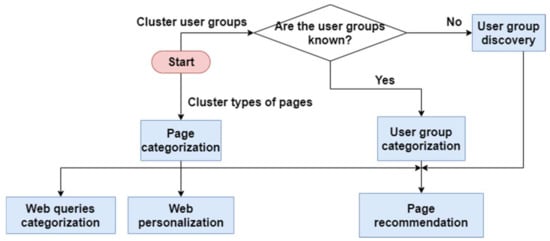
Figure 9.
Relationship between the functional purposes.
User group categorization and user group discovery also have their differences. User group discovery is necessary only when the user groups are not known to the organizations. Otherwise, user group categorization can be directly performed.
Table 7 presents the usage of the partition-based, hierarchical, density-based, and fuzzy-based clustering algorithms for different functional purposes in web usage mining. If the colour of the box is darker, it indicates a higher number of articles from Table 1 applied the clustering technique for that functional purpose.
Table 7.
Frequency heatmap of clustering purpose with respect to the clustering techniques.
There are some difficulties that need to be considered by researchers when applying the clustering techniques in web usage mining. Many researchers often compared the performance of the other clustering techniques with k-means clustering. When identifying unknown user groups, k-means clustering tends to produce empty clusters [31,41,42,55]. This is because of the random initialization of centroids, which causes some centroids to be too close to each other. Compared to k-means clustering, k-medoids, fuzzy c-means clustering produce clusters that are more uniform and balanced. In terms of time complexity, k-means executes faster than fuzzy c-means although the clustering quality of fuzzy c-means is higher. Fuzzy c-means takes a longer time to run because it requires more computational time to perform the fuzzy measures. Meanwhile, both bisecting k-means and k-medoids execute faster than k-means as they reduce the clustering computation for data point in each iteration. In [64], CHAMELEON clustering showed a slower execution time than k-means, which might cause a delay in a real-time solution. In [49], the authors attempted to investigate the possibility if the clusters generated by k-means and DBSCAN can be used to evaluate the changing relationship between user behaviour and the navigation structure of website. Among the two techniques, DBSCAN is able to identify the changes of the navigation structure of website, whereas k-means failed to detect the changes. Therefore, each clustering technique has its own drawback when applying to different functional purposes.
There are two aspects that should be noted when selecting a suitable clustering technique for the functional purpose, namely the processing time and number of clustering groups. The clustering technique is required to provide a shorter processing time when executing web queries categorization, page recommendation, and web personalization. This is because the website has to provide immediate feedback based on the user’s navigation behaviour. Since k-means, k-medoids, and FCM converge faster with shorter processing time, it is widely used for all the functional purposes stated in Table 7. The time complexity for hierarchical clustering and density-based clustering is higher. Therefore, they are not very suitable for functional purposes that require immediate feedback. Instead, they can be applied for user group discovery, user group categorization, and page categorization since the execution time requirement for these processes is less stringent. The second aspect is the knowledge of the number of user groups. The number of clusters needs to be predetermined before using k-means, k-medoids, bisecting k-means, and FCM. If the types of the user groups are not known, CHAMELEON, CURE, or DBSCAN can be used to perform clustering for user group discovery. However, the researcher has to perform several trial experiments on the weblog to find out a suitable number of clusters.
3.4. Case Study: Online Roadshow
After understanding the aspects for choosing the suitable clustering technique for different purposes, it is possible to apply all the functional purposes of Table 6 to an online roadshow website to improve user experience in terms of affordance, flow, and interactivity. Three pre-requisite steps should be performed before web queries categorization, page recommendation, and web personalization, as illustrated in Figure 9. The three pre-requisite steps are user group discovery, user group categorization, and page categorization.
Since the online roadshow website is a platform that hosts different types of campaign events, the types of user groups are not identifiable in advance. Therefore, clustering is firstly used to discover the user groups of the customers that take part in the online roadshow website. This is to enable the organizations or website administrators to discover various types of user behaviours. The users can be categorized into four groups, namely the opportunists (users who just visit the website to participate in a targeted campaign and leave), the contributors (users who constantly write their reviews and answer questions honestly if there is a survey), the explorers (users who spend time to browse a large amount of campaigns) and the followers (users who keep up with a certain category of campaign). These four groups are proposed by Xu et al. [79] for identifying the user groups in an online shopping platform. Organizations that advertise their campaigns on the online roadshow website can identify these customers to improve the user experience of their campaigns to cater for different user groups. After the user groups are identified, this step can lead to page recommendation where the users will be suggested with relevant campaigns.
After the user groups are determined, clustering can then perform user group categorization. The online roadshow website can provide additional information for the user groups that require more assistance to sustain their interest and to accommodate their preferences. If the users are grouped into clusters based on their interest, page recommendation can be provided to stimulate more consumption.
For page categorization, clustering can group similar campaigns in the online roadshow website. The campaigns can be grouped based on their types, such as health-based, brand awareness, brand promotion, and so on. After grouping them into campaign types, it can also be used in web queries categorization so that the user can search for the related campaigns easily. Page categorization can also be used for page recommendation if the online roadshow website is recommending campaigns based on types.
The three pre-requisite steps are insufficient to improve user experience as it is more of a discovery phase. The subsequent steps are the crucial processes to improve the user experience of the online roadshow website in terms of affordance, flow, and interactivity. Developers can improve the design of the website so that it can enable the users to accomplish a task conveniently to achieve affordance. In terms of flow, developers can design the website to be more enjoyable and easy to use for the users. In terms of interactivity, the website can display the campaigns that are tailored to suit the needs of the known clusters.
Clustering can be used for web queries categorization on various types of campaigns and advertisements. When there are many campaigns on the online roadshow website, it is difficult for the users to access a particular campaign that they are interested in. To support affordance, the search and filter function can help users to save time and conveniently access the relevant campaigns instead of scrolling through a list of uninteresting campaigns. The search and filter function can help users to search for campaigns based on their preferred campaign types, narrowing down to a more specific campaign list that meets the user’s preferences. In terms of flow and interactivity, users will be more comfortable and in control when navigating the website to easily get relevant campaigns with this feature. This will motivate them to continue to take part in more campaigns. Clustering of web queries will make the website more approachable.
For page recommendation, clustering can group the preferences of the users that take part in the campaign. After getting the user groups, users that belong to the specific user group are considered having a common interest. The user of a particular group has a higher chance of being interested to join a campaign that is suggested by the online roadshow website if the campaign is also taken part by another user in the same cluster. For instance, if user A in the user group takes part in a campaign, user B who is in the same user group as user A would be interested in participating in the same campaign as well. This recommendation can come in the form of an email notification. In terms of flow and interactivity, users will feel more enjoyable when navigating the online roadshow website as they can keep on receiving suggestions of campaigns based on like-minded user groups that will intrigue them as well. In terms of affordance, users will reduce their time spent to choose a campaign by having the website recommending the relevant ones to them. This will increase user engagement in the online roadshow website.
Instead of recommending the campaigns that interest a particular user group, web personalization can provide a more individualized web experience to the users based on their past web interactions. The navigation behaviours of the user can be extracted from the weblog, particularly the campaigns that are participated by the user. Clustering can be used to send a newsletter or notification to the user to suggest the list of campaigns that they might be interested in based on their past actions captured by online roadshow website. In terms of flow and interactivity, the personalized user interface elements based on their past preferences will allow the users to interact in a familiar environment. Hence, the users will enjoy the use of the customized website based on their own preferences. In terms of affordance, this method will reduce the time spent to discover new campaigns that they might be interested in. In summary, the fundamental difference between web personalization and page recommendation is how the content is recommended to the user. The website will recommend the users to the campaigns based on the user’s own navigation behaviour in web personalization, meanwhile the website will recommend the users to the campaigns based on the common interest of the user group in page recommendations.
In short, clustering techniques can be applied to different functional purposes on the online roadshow website to enhance better user experience in terms of affordance, flow, and interactivity. In terms of affordance, clustering allows the users to navigate the website more effectively. In terms of flow and interactivity, clustering allows the users to be more immersed when participating in the campaigns of the online roadshow website.
4. Conclusions
Online roadshow is a new web construct derived from the physical roadshow. As the online roadshow is done virtually through digital devices, organizations have to use an alternative way to increase the effectiveness of the online roadshow. Hence, to increase the advertising effects of the website, it is important to provide a good user experience. To make sure the users have a pleasant experience on the online roadshow website, clustering can be performed to understand web navigation. In this paper, the clustering techniques are analysed from three perspectives, namely their similarity measures, the evaluation metrics used, the purpose of applying the techniques to improve user web experience in the context of online roadshow.
After reviewing the web usage mining purposes in the existing works, the method of applying clustering in an online roadshow website were discussed. Clustering techniques open the opportunity of implementing the new online roadshow conceptual model towards a better user experience. By applying clustering techniques in an online roadshow website, the advertising effectiveness of the new implementation can be achieved in terms of its affordance, flow, and interactivity.
The articles on clustering techniques in web usage mining are focused from 2010 to 2021 since the application of clustering techniques on weblogs to extract user access patterns is at the highest peak during this decade. Although clustering techniques are widely used in that area, there is still room of improvement for clustering quality. Clustering techniques that can provide good clustering quality also face the problem of a longer execution time, which may cause a limitation to the real-time scenario.
5. Future Work
The future work in this study involves measuring the effectiveness of the clustering techniques implementations in improving the online roadshow website. Besides that, implementing clustering techniques to improve user experience can also be applied in other domains where user satisfaction matters. The domains that require user experience are not limited to web applications, but also include any domains that involve user experience. For instance, the domains related are product design and development, customer support, service and so on. In the domains listed, ensuring good user satisfaction or user experience is important when there is an increasing volume of data available for analysis. Therefore, clustering techniques can be applied to these domains as well to improve user experience.
Author Contributions
Funding acquisition, M.-C.L.; investigation, Z.-Y.L.; project administration, M.-C.L.; supervision, L.-Y.O.; visualization, Z.-Y.L.; writing—original draft, Z.-Y.L.; writing—review and editing, L.-Y.O. and M.-C.L. All authors have read and agreed to the published version of the manuscript.
Funding
This research was funded by Telekom Malaysia Research and Development, grant number RDTC/191001 (MMUE/190086) and Multimedia University.
Conflicts of Interest
The authors declare no conflict of interest.
References
- Leow, K.R.; Leow, M.C.; Ong, L.Y. Online Roadshow: A New Model for the Next-Generation Digital Marketing. In Proceedings of the Future Technologies Conference, Vancouver, BC, Canada, 28–29 October 2021. [Google Scholar]
- Unger, R.; Chandler, C. A Project Guide to UX Design: For User Experience Designers in the Field or in the Making; New Riders: Indianapolis, IN, USA, 2012. [Google Scholar]
- Choi, M.W. A study on the application of user experience to ICT-based advertising. Int. J. Pure Appl. Math. 2018, 120, 5571–5586. [Google Scholar]
- Brajnik, G.; Gabrielli, S. A review of online advertising effects on the user experience. Int. J. Hum. Comput. Interact. 2010, 26, 971–997. [Google Scholar] [CrossRef]
- Pucillo, F.; Cascini, G. A framework for user experience, needs and affordances. Des. Stud. 2014, 35, 160–179. [Google Scholar] [CrossRef]
- Ivancsy, R.; Kovacs, F. Clustering Techniques Utilized in Web Usage Mining. In Proceedings of the 5th WSEAS International Conference on Artificial Intelligence, Knowledge Engineering and Data Bases, Madrid, Spain, 15–17 February 2006; Volume 2006, pp. 237–242. [Google Scholar]
- Cooley, R.; Mobasher, B.; Srivastava, J. Web Mining: Information and Pattern Discovery on the World Wide Web. In Proceedings of the Ninth IEEE International Conference on Tools with Artificial Intelligence, Newport Beach, CA, USA, 3–8 November 1997; pp. 558–567. [Google Scholar] [CrossRef]
- Etzioni, O. The World-Wide Web: Quagmire or gold mine? Commun. ACM 1996, 39, 65–68. [Google Scholar] [CrossRef]
- Jafari, M.; SoleymaniSabzchi, F.; Jamali, S. Extracting Users’ Navigational Behavior from Web Log Data: A Survey. J. Comput. Sci. Appl. 2013, 1, 39–45. [Google Scholar] [CrossRef]
- Aghabozorgi, S.; Seyed Shirkhorshidi, A.; Ying Wah, T. Time-series clustering—A decade review. Inf. Syst. 2015, 53, 16–38. [Google Scholar] [CrossRef]
- Rai, P.; Singh, S. A Survey of Clustering Techniques. Int. J. Comput. Appl. 2010, 7, 1–5. [Google Scholar] [CrossRef]
- Saxena, A.; Prasad, M.; Gupta, A.; Bharill, N.; Patel, O.P.; Tiwari, A.; Er, M.J.; Ding, W.; Lin, C.T. A review of clustering techniques and developments. Neurocomputing 2017, 267, 664–681. [Google Scholar] [CrossRef]
- Popat, S.K.; Emmanuel, M. Review and comparative study of clustering techniques. Int. J. Comput. Sci. Inf. Technol. 2014, 5, 805–812. [Google Scholar]
- Shirkhorshidi, A.S.; Aghabozorgi, S.; Wah, T.Y.; Herawan, T. Big Data Clustering: A Review. In Proceedings of the 14th International Conference on Computational Science and Its Applications, Guimarães, Portugal, 30 June–3 July 2014; Murgante, B., Misra, S., Rocha, A.M.A.C., Torre, C., Rocha, J.G., Falcão, M.I., Taniar, D., Apduhan, B.O., Gervasi, O., Eds.; Springer International Publishing: Cham, Switzerland, 2014; pp. 707–720. [Google Scholar]
- Kameshwaran, K.; Malarvizhi, K. Survey on clustering techniques in data mining. Int. J. Comput. Sci. Inf. Technol. 2014, 5, 2272–2276. [Google Scholar]
- Kaur, R.; Kaur, S. A Review: Techniques for Clustering of Web Usage Mining. Int. J. Sci. Res. 2012, 3, 1541–1545. [Google Scholar]
- Dehariya, V.K.; Shrivastava, S.K.; Jain, R.C. Clustering of Image Data Set using k-Means and Fuzzy k-Means Algorithms. In Proceedings of the 2010 International Conference on Computational Intelligence and Communication Networks, Bhopal, India, 26–28 November 2010; IEEE: Piscataway, NJ, USA; pp. 386–391. [Google Scholar]
- da Cruz Nassif, L.F.; Hruschka, E.R. Document Clustering for Forensic Analysis: An Approach for Improving Computer Inspection. In IEEE Transactions on Information Forensics and Security; IEEE: Piscataway, NJ, USA, 2012; Volume 8, pp. 46–54. [Google Scholar]
- Ahmad, H.; Zubair Islam, M.; Ali, R.; Haider, A.; Kim, H. Intelligent Stretch Optimization in Information Centric Networking-Based Tactile Internet Applications. Appl. Sci. 2021, 11, 7351. [Google Scholar] [CrossRef]
- Haider, A.; Khan, M.A.; Rehman, A.; Rahman, M.; Kim, H.S. A Real-Time Sequential Deep Extreme Learning Machine Cybersecurity Intrusion Detection System. Comput. Mater. Contin. 2021, 66, 1785–1798. [Google Scholar] [CrossRef]
- Äyrämö, S.; Kärkkäinen, T. Introduction to Partitioning-Based Clustering Methods with a Robust Example; Reports of the Department of Mathematical Information Technology. Series C, Software engineering and computational intelligence; No. C. 1/2006; Department of Mathematical Information Technology, University of Jyväskylä: Jyväskylä, Finland, 2006; pp. 1–34. [Google Scholar] [CrossRef]
- El Aissaoui, O.; El Madani El Alami, Y.; Oughdir, L.; El Allioui, Y. Integrating Web Usage Mining for an Automatic Learner Profile Detection: A Learning Styles-Based Approach. In Proceedings of the International Conference on Intelligent Systems and Computer Vision (ISCV), Fez, Morocco, 2–4 April 2018; IEEE: Piscataway, NJ, USA; pp. 1–6. [Google Scholar]
- Kaur, S.; Rashid, E.M. Web news mining using Back Propagation Neural Network and clustering using k-Means algorithm in big data. Indian J. Sci. Technol. 2016, 9. [Google Scholar] [CrossRef]
- Kathuria, A.; Jansen, B.J.; Hafernik, C.; Spink, A. Classifying the user intent of web queries using k-Means clustering. Internet Res. 2010, 20, 563–581. [Google Scholar] [CrossRef]
- Nasser, M.; Salim, N.; Hamza, H.; Saeed, F. Clustering web users for reductions the internet traffic load and users access cost based on k-Means algorithm. Int. J. Eng. Technol. 2018, 7, 3162–3169. [Google Scholar] [CrossRef]
- Chatterjee, R.P.; Deb, K.; Banerjee, S.; Das, A.; Bag, R. Web Mining Using k-Means Clustering and Latest Substring Association Rule for E-Commerce. J. Mech. Contin. Math. Sci. 2019, 14, 28–44. [Google Scholar] [CrossRef]
- Poornalatha, G.; Raghavendra, P.S. Web User Session Clustering using Modified k-Means Algorithm. In Advances in Computing and Communications; Springer: Berlin/Heidelberg, Germany, 2011; Volume 191, pp. 243–252. [Google Scholar] [CrossRef]
- Selvakumar, K.; Ramesh, L.S.; Kannan, A. Enhanced k-Means clustering algorithm for evolving user groups. Indian J. Sci. Technol. 2015, 8. [Google Scholar] [CrossRef]
- Alguliyev, R.M.; Aliguliyev, R.M.; Abdullayeva, F.J. PSO+k-Means algorithm for anomaly detection in big data. Stat. Optim. Inf. Comput. 2019, 7, 348–359. [Google Scholar] [CrossRef]
- Patel, R.; Kansara, A. Web pages recommendation system based on k-medoid clustering method. Int. J. Adv. Eng. Res. Dev. 2015, 2, 745–751. [Google Scholar]
- Ansari, Z.A. Web User Session Cluster Discovery Based on k-Means and k-Medoids Techniques. Int. J. Comput. Sci. Eng. Technol. 2014, 5, 1105–1113. [Google Scholar]
- Sengottuvelan, P.; Gopalakrishnan, T. Efficient Web Usage Mining Based on K-Medoids Clustering Technique. Int. J. Comput. Inf. Eng. 2015, 9, 998–1002. [Google Scholar] [CrossRef]
- Ji, W.T.; Guo, Q.J.; Zhong, S.; Zhou, E. Improved k-Medoids Clustering Algorithm under Semantic Web. In Advances in Intelligent Systems Research; Trans Tech Publications Ltd.: Stafa-Zurich, Switzerland, 2013. [Google Scholar]
- Shinde, S.K.; Kulkarni, U.V. Hybrid Personalized Recommender System using Fast k-Medoids Clustering Algorithm. J. Adv. Inf. Technol. 2011, 2, 152–158. [Google Scholar] [CrossRef]
- Rani, Y.; Rohil, H. A study of hierarchical clustering algorithms. Int. J. Inf. Comput. Technol. 2015, 3, 1115–1122. [Google Scholar]
- Dhanalakshmi, P.; Ramani, K. Clustering of users on web log data using Optimized CURE Clustering. HELIX 2018, 7, 2018–2024. [Google Scholar] [CrossRef]
- Kumble, N.; Tewari, V. Improved CURE Clustering Algorithm using Shared Nearest Neighbour Technique. Int. J. Emerg. Trends Eng. Res. 2021, 9, 151–157. [Google Scholar] [CrossRef]
- Karypis, G.; Kumar, V. Multilevel k-Way Hypergraph Partitioning. In Proceedings of the 36th Annual Design Automation Conference (DAC 1999), New Orleans, LA, USA, 21–25 June 1999; Hindawi: London, UK, 1999; pp. 343–348. [Google Scholar]
- Prasanth, A.; Hemalatha, M. Chameleon clustering algorithm with semantic analysis algorithm for efficient web usage mining. Int. Rev. Comput. Softw. 2015, 10, 529–535. [Google Scholar] [CrossRef]
- Prasanth, A.; Valsala, S. Semantic Chameleon Clustering Analysis Algorithm with Recommendation Rules for Efficient Web Usage Mining. In Proceedings of the 9th IEEE-GCC Conference and Exhibition (GCCCE 2017), Manama, Bahrain, 8–11 May 2017; IEEE: Piscataway, NJ, USA; pp. 1–9. [Google Scholar]
- Abirami, K.; Mayilvahanan, P. Performance Analysis of k-Means and Bisecting k-Means Algorithms in Weblog Data. Int. J. Emerg. Technol. Eng. Res. 2016, 4, 119–124. [Google Scholar]
- Patil, R.; Khan, A. Bisecting k-Means for Clustering Web Log data. Int. J. Comput. Appl. 2015, 116, 36–41. [Google Scholar] [CrossRef]
- Ester, M.; Kriegel, H.-P.; Sander, J.; Xu, X. A Density-Based Algorithm for Discovering Clusters in Large Spatial Databases with Noise. In KDD-96 Proceedings; AAAI: Menlo Park, CA, USA, 1996; Volume 96, pp. 226–231. [Google Scholar]
- Langhnoja, S.G.; Barot, M.P.; Mehta, D.B. Web Usage Mining using Association Rule Mining on Clustered Data for Pattern Discovery. Int. J. Data Min. Tech. Appl. 2013, 2, 141–150. [Google Scholar]
- Ansari, Z.A. Discovery of web user session clusters using dbscan and leader clustering techniques. Int. J. Res. Appl. Sci. Eng. Technol. 2014, 2, 209–217. [Google Scholar]
- Khan, M.M.R.; Siddique, M.A.B.; Arif, R.B.; Oishe, M.R. ADBSCAN: Adaptive Density-Based Spatial Clustering of Applications with Noise for Identifying Clusters with Varying Densities. In Proceedings of the 4th International Conference on Electrical Engineering and Information Communication Technology (iCEEiCT), Dhaka, Bangladesh, 13–15 September 2018; IEEE: Piscataway, NJ, USA; pp. 107–111. [Google Scholar]
- Huang, Y.; Huang, W.; Xiang, X.; Yan, J. An empirical study of personalized advertising recommendation based on DBSCAN clustering of sina weibo user-generated content. Procedia Comput. Sci. 2021, 183, 303–310. [Google Scholar] [CrossRef]
- Xie, P.; Zhang, L.; Wang, Y.; Li, Q. Application of An Improved DBSCAN Algorithm in Web Text Mining. In Proceedings of the International Workshop on Cloud Computing and Information Security (CCIS), Shanghai, China, 9–11 November 2013; Atlantis Press: Amsterdam, The Netherlands; pp. 400–403. [Google Scholar]
- Udantha, M.; Ranathunga, S.; Dias, G. Modelling Website User Behaviors by Combining the EM and DBSCAN Algorithms. In Proceedings of the Moratuwa Engineering Research Conference (MERCon), Moratuwa, Sri Lanka, 5–6 April 2016; IEEE: Piscataway, NJ, USA; pp. 168–173. [Google Scholar]
- Zhou, K.; Fu, C.; Yang, S. Fuzziness parameter selection in fuzzy c-means: The perspective of cluster validation. Sci. China Inf. Sci. 2014, 57. [Google Scholar] [CrossRef]
- Torra, V. On the Selection of m for Fuzzy c-Means. In Proceedings of the 2015 Conference of the International Fuzzy Systems Association and the European Society for Fuzzy Logic and Technology, Gijón, Asturias, Spain, 30 June–3 July 2015. [Google Scholar] [CrossRef]
- Lingras, P.; Yan, R.; West, C. Fuzzy C-Means Clustering of Web Users for Educational Sites. In Advances in Artificial Intelligence; Xiang, Y., Chaib-draa, B., Eds.; Springer: Berlin/Heidelberg, Germany, 2003; pp. 557–562. [Google Scholar]
- Agarwal, A.; Saxena, A. An approach for improving page search by clustering with reference to web log data in R. Int. J. Sci. Technol. Res. 2020, 9, 2832–2838. [Google Scholar]
- Chandel, G.S.; Patidar, K. A Result Evolution Approach for Web usage mining using Fuzzy C-Mean Clustering Algorithm. Int. J. Comput. Sci. Netw. Secur. 2016, 16, 135–140. [Google Scholar]
- Ali, W.; Alrabighi, M. Web Users Clustering Based on Fuzzy C-MEANS. VAWKUM Trans. Comput. Sci. 2016, 4, 51–59. [Google Scholar] [CrossRef]
- Suresh, K.; Mohana, R.M.; Reddy, A.R.M.; Subrmanyam, A. Improved FCM Algorithm for Clustering on Web Usage Mining. In Proceedings of the International Conference on Computer and Management (CAMAN), Wuhan, China, 19–21 May 2011; IEEE: Piscataway, NJ, USA; pp. 11–14. [Google Scholar]
- Niware, D.K.; Chaturvedi, S.K. Web Usage Mining through Efficient Genetic Fuzzy C-Means. Int. J. Comput. Sci. Netw. Secur. (IJCSNS 2015) 2014, 14, 113. [Google Scholar]
- Cobos, C.; Mendoza, M.; Manic, M.; Leon, E.; Herrera-Viedma, E. Clustering of web search results based on an Iterative Fuzzy C-means Algorithm and Bayesian Information Criterion. In Proceedings of the 2013 Joint IFSA World Congress and NAFIPS Annual Meeting (IFSA/NAFIPS), Edmonton, AB, Canada, 24–28 June 2013; IEEE: Piscataway, NJ, USA; pp. 507–512. [Google Scholar]
- Chitraa, V.; Thanamani, A.S. Web Log Data Analysis by Enhanced Fuzzy C Means Clustering. Int. J. Comput. Sci. Appl. 2014, 4, 81–95. [Google Scholar] [CrossRef][Green Version]
- Pan, Y.; Zhang, L.; Li, Z. Mining event logs for knowledge discovery based on adaptive efficient fuzzy Kohonen clustering network. Knowl. Based Syst. 2020, 209, 106482. [Google Scholar] [CrossRef]
- Zheng, W.; Mo, S.; Duan, P.; Jin, X. An Improved Pagerank Algorithm Based on Fuzzy C-Means Clustering and Information Entropy. In Proceedings of the 2017 3rd IEEE International Conference on Control Science and Systems Engineering (ICCSSE), Beijing, China, 17–19 August 2017; pp. 615–618. [Google Scholar]
- Anwar, S.; Rohmat, C.L.; Basysyar, F.M.; Wijaya, Y.A. Clustering of internet network usage using the K-Medoid method. In Proceedings of the Annual Conference on Computer Science and Engineering Technology (AC2SET 2020), Medan, Indonesia, 23 September 2020; IOP Publishing: Bristol, UK, 2021; Volume 1088. [Google Scholar]
- Santhisree, K.; Damodaram, A. Cure: Clustering on Sequential Data for Web Personalization: Tests and Experimental Results. Int. J. Comput. Sci. Commun. 2011, 2, 101–104. [Google Scholar]
- Gupta, U.; Patil, N. Recommender system based on Hierarchical Clustering algorithm Chameleon. In Proceedings of the IEEE International Advance Computing Conference (IACC), Banglore, India, 12–13 June 2015; IEEE: Piscataway, NJ, USA; pp. 1006–1010. [Google Scholar]
- Kumar, T.V.; Guruprasad, S. Clustering of Web Usage Data using Chameleon Algorithm. Int. J. Innov. Res. Comput. Commun. Eng. 2014, 2, 4533–4540. [Google Scholar]
- Deepali, B.A.; Chaudhari, J. A New Bisecting k-Means algorithm for Inferring User Search Goals Engine. Int. J. Sci. Res. 2014, 3, 515–521. [Google Scholar]
- Santhisree, K.; Damodaram, A. SSM-DBSCAN and SSM-OPTICS: Incorporating a new similarity measure for Density based Clustering of Web usage data. Int. J. Comput. Sci. Eng. 2011, 3, 3170–3184. [Google Scholar]
- Chen, B.; Jiang, T.; Chen, L. Weblog Fuzzy Clustering Algorithm based on Convolutional Neural Network. Microprocess. Microsyst. 2020, 103420. [Google Scholar] [CrossRef]
- Shivaprasad, G.; Reddy, N.V.S.; Acharya, U.D.; Aithal, P.K. Neuro-Fuzzy Based Hybrid Model for Web Usage Mining. Procedia Comput. Sci. 2015, 54, 327–334. [Google Scholar] [CrossRef]
- Hasija, H.; Chaurasia, D. Recommender System with Web Usage Mining Based on Fuzzy c Means and Neural Networks. In Proceedings of the 2015 1st International Conference on Next Generation Computing Technologies (NGCT), Dehradun, India, 4–5 September 2015; IEEE: Piscataway, NJ, USA; pp. 768–772. [Google Scholar]
- Halkidi, M.; Batistakis, Y.; Vazirgiannis, M. On Clustering Validation Techniques. J. Intell. Inf. Syst. 2001, 17, 107–145. [Google Scholar] [CrossRef]
- Davies, D.L.; Bouldin, D.W. A Cluster Separation Measure. In IEEE Transactions on Pattern Analysis and Machine Intelligence; IEEE: Piscataway, NJ, USA, 1979; Volume PAMI-1, pp. 224–227. [Google Scholar]
- Hubert, L.; Schultz, J. Quadratic Assignment as a General Data Analysis Strategy. Br. J. Math. Stat. Psychol. 1976, 29, 190–241. [Google Scholar] [CrossRef]
- Rokach, L.; Maimon, O. Clustering Methods. In Data Mining and Knowledge Discovery Handbook; Maimon, O., Rokach, L., Eds.; Springer: Boston, MA, USA, 2005; pp. 321–352. ISBN 978-0-387-25465-4. [Google Scholar]
- Rosenberg, A.; Hirschberg, J. V-measure: A Conditional Entropy-Based External Cluster Evaluation Measure. In Proceedings of the 2007 Joint Conference on Empirical Methods in Natural Language Processing and Computational Natural Language Learning (EMNLP-CoNLL), Prague, Czech Republic, 28–30 June 2007; pp. 410–420. [Google Scholar]
- Dunn, J.C. Well-Separated Clusters and Optimal Fuzzy Partitions. J. Cybern. 1974, 4, 95–104. [Google Scholar] [CrossRef]
- Petrovic, S. A Comparison between the Silhouette Index and the Davies-Bouldin Index in Labelling IDS Clusters. In Proceedings of the 11th Nordic Workshop on Secure IT-systems, Linköping, Sweden, 19–20 October 2006; pp. 53–64. [Google Scholar]
- Palacio-Niño, J.-O.; Berzal, F. Evaluation Metrics for Unsupervised Learning Algorithms. arXiv 2019, arXiv:1905.05667. [Google Scholar]
- Xu, Y.; Lee, M.J. Identifying Personas in Online Shopping Communities. Multimodal Technol. Interact. 2020, 4, 19. [Google Scholar] [CrossRef]


Publisher’s Note: MDPI stays neutral with regard to jurisdictional claims in published maps and institutional affiliations. |
© 2021 by the authors. Licensee MDPI, Basel, Switzerland. This article is an open access article distributed under the terms and conditions of the Creative Commons Attribution (CC BY) license (https://creativecommons.org/licenses/by/4.0/).