Article

A DFT-Based Running Time Prediction Algorithm for Web Queries

1
CITIAPS, Universidad de Santiago, Santiago 9170020, Chile
2
CONICET, Universidad Nacional de San Luis, San Luis 5700, Argentina
3
CeBiB, Centre for Biotechnology and Bioengineering, Santiago 9170020, Chile
*
Author to whom correspondence should be addressed.
Future Internet 2021, 13(8), 204; https://doi.org/10.3390/fi13080204
Submission received: 26 May 2021 / Revised: 19 June 2021 / Accepted: 19 June 2021 / Published: 4 August 2021
(This article belongs to the Special Issue Parallel, Distributed and Grid/Cloud/P2P Computing)

Abstract

:
Web search engines are built from components capable of processing large amounts of user queries per second in a distributed way. Among them, the index service computes the top-k documents that best match each incoming query by means of a document ranking operation. To achieve high performance, dynamic pruning techniques such as the WAND and BM-WAND algorithms are used to avoid fully processing all of the documents related to a query during the ranking operation. Additionally, the index service distributes the ranking operations among clusters of processors wherein in each processor multi-threading is applied to speed up query solution. In this scenario, a query running time prediction algorithm has practical applications in the efficient assignment of processors and threads to incoming queries. We propose a prediction algorithm for the WAND and BM-WAND algorithms. We experimentally show that our proposal is able to achieve accurate prediction results while significantly reducing execution time and memory consumption as compared against an alternative prediction algorithm. Our proposal applies the discrete Fourier transform (DFT) to represent key features affecting query running time whereas the resulting vectors are used to train a feed-forward neural network with back-propagation.

1. Introduction

Query running time prediction is useful for effective resource management, query optimization, accurate scheduling and user experience management [1]. Some prediction algorithms have been proposed in the technical literature mainly for database systems [1,2,3,4,5,6,7]. In this paper, we focus on query running time prediction in Web search engines (WSE). Large-scale Web search engines are designed to process hundreds of thousands of queries per second where each query has to be processed within a fraction of a second. To achieve this goal, search engines are composed of services capable of processing large amounts of data. One of these services is the index service which is responsible for calculating the top-k documents for user queries. The index service executes a ranking algorithm on a data structure called inverted index or inverted file [8,9]. For each term, the inverted index keeps a posting list with the document identifiers where the term appears in and data for document ranking such as the frequency of the term in the document. Document ranking algorithms compute a similarity score for every document that contains any of the query terms.
A dynamic pruning technique named Weighted AND (WAND) is a strategy that first runs a fast-approximate evaluation on candidate documents, and then makes a full costly evaluation limited to the promising candidates only. This algorithm enables many documents to be skipped and thereby it is able to achieve efficient performance by reducing the total number of full document score evaluations. The BM-WAND extends the WAND by skipping consecutive sets of documents by using a block-wise inverted index where each posting list block has a maximum score.

1.1. Research Objective

In Web search engines, large amounts of computational resources must be dedicated to execute the document ranking operations for the multiple queries being solved concurrently by the index service at all times. We aim at reducing the total number of cluster processors by being efficient in performing multi-threaded query processing at each processor. In our view, this requires fast prediction of the cost of queries at run time in order to enable the automatic selection of proper thread scheduling strategies for the incoming queries. To this end, we propose a query running time prediction algorithm which can be used as a tool for efficient thread management because it is fast and light in terms of CPU and memory requirements, respectively. Devising a practical solution for this problem is challenging since the running time for dynamic pruning techniques such as the WAND and BM-WAND algorithms are not linear to the size of the associated posting lists [10]. In addition, the computational cost of the thread scheduling strategy must be very low to prevent it from compromising the efficiency of the response time for the queries solved in each processor.

1.2. Contribution

We propose an algorithm based on the application of the discrete Fourier transform (DFT) technique that is able to predict the running time of queries for the index service of Web search engines. The proposed running time prediction algorithm is more efficient than alternative algorithms and is general purpose with respect to the document ranking algorithm used to calculate the query results. The advantage of our proposal is that the application of the DFT technique significantly reduces the number of descriptors needed to train the respective machine learning model. We demonstrate its effectiveness for industry standard document ranking strategies such as the TF-IDF and BM25 document score functions executed either under the WAND or the BM-WAND document ranking algorithms.
A preliminary version of our work was presented in [11] where we described the application of the DFT technique to predict the running time of the BM-WAND algorithm. This provided evidence that our DFT based strategy was able to achieve promising results. In the present paper, we deepen into its design and assessment as follows. We study the expressiveness of the DFT descriptors by considering both WAND and BM-WAND under the BM25 and TF-IDF document scoring strategies. We also present a comprehensive evaluation study involving alternative machine learning methods and comparison against the state of the art strategy for solving the same problem. The outcome of this study defines the final tuning of the parameters and machine learning method required by our prediction algorithm. We also demonstrate its practical utility by considering a use-case in multi-threaded query processing.

1.3. Outline

To better understand this work, in Table 1, we show a description of the techniques and the relevant acronyms used in the following sections.
The remaining of this paper is as follows. In Section 2, we describe the background. In Section 3, we present related previous work. In Section 4, we present our DFT-based query running time prediction algorithm. In Section 5, we present a comprehensive evaluation study using different standard benchmark data sets. Finally, our concluding remarks are presented in Section 6.

2. Background

In this section, we describe the main components of a search engine and focus on the component for which we propose to quickly predict the running time of each query in advance at arrival.

2.1. Web Search Engines

Web Search Engines (WSEs) are usually built as a collection of services hosted in large clusters of multi-core processors wherein each service is deployed on a set of processors supporting multi-threading. Typically, a WSE is composed of three services: the Front-Service (FS), the Cache-Service (CS) and the Index-Service (IS) [12,13]. These services are deployed on clusters of multi-core processors and connected by high-speed communication networks [14,15,16]. They are organized on arrays of P × R multi-core processors, where P is the level of data partitioning and R is the level of data replication.
In Figure 1a, we show the query flow through the three services of a WSE. After a query arrives to an FS, it routes the query to the CS to determine if the query has been previously processed (step 2). The CS partition is selected by applying a hash function on the query terms. The replica is selected in a round-robin way. If the query is found in the cache memory (step 3), the CS sends the top-k document results identifiers (docIDs) to the FS, which builds the HTML page. Otherwise, if the query is not found in cache, the CS sends a miss message to the FS (also step 3). In this last case, the FS sends an index search request to a single replica of all P partitions of the index service (step 4). The replicas are selected in a round-robin way for each query. Then, each index service executes a ranking algorithm to compute the top-k document results and sends them to the FS (step 5). Finally, the FS merges the partial results, builds the web page for the user (step 7) and sends an update message to the CS (step 6).
The computation of the top-k documents results for user queries is a high-computational demanding operation executed by the IS. A ranking algorithm is executed on an inverted index or inverted file [8]. The index is built from a large set of web documents. The index is composed of a vocabulary table (which contains the C distinct relevant terms found in the document collection) and a set of posting lists. For each term c, there is a list of data items (called postings) storing the identifiers of the documents that contain the term c, along with additional data used for ranking purposes. Figure 1b shows the main steps executed inside an IS processor to process an user query [15]. First, a local top-k cache is used to search for pre-computed queries inside each IS processor. Then, an intersection cache—which keeps the documents belonging to the intersection of posting lists of previously processed query terms—and the inverted index are used to quickly determine the list of documents that contain the query terms. Finally, the IS computes the ranking of the resulting set of documents.

2.2. The WAND and BM-WAND Dynamic Pruning Techniques

Ranking algorithms return the top-k documents for user queries. To quickly process large inverted indices, these algorithms use dynamic pruning techniques to allow efficient retrieval by not fully scoring all postings of the documents matching a query. In this paper, we focus on the WAND [17] and the BM-WAND [18] techniques because they present significant benefits by avoiding the scoring of documents that cannot make the top-k retrieved documents set [18].
The WAND strategy processes each query by looking for query terms in the inverted index and retrieving each posting list. Documents retrieved from the intersection of the posting lists allow us to answer conjunctive queries (AND bag of word query), and documents retrieved at least from one posting list allow us to answer disjunctive queries (OR bag of word query). It is based on two levels. In the first level, some potential documents are selected as results using an approximate evaluation. Then, in the second level, those potential documents are fully evaluated (e.g., using scoring functions such as the BM25 or the vector model) to obtain their scores. A heap keeps the current top-k documents where in the root is located the document with least score. The root score provides a threshold value which is used to decide whether to evaluate the full score of the remaining documents in the posting lists associated with the query terms.
The Block-Max WAND (BM-WAND) technique [18] uses compressed posting lists organized in blocks. Each block stores the upper bound of the scores (Block max) for the documents inside that block in uncompressed form, thus enabling to skip large parts of the posting lists by skipping blocks. This reduces the cost of the WAND but does not guarantee correctness because some relevant documents could be lost. This problem is solved in [18] with an algorithm that moves forward and backwards in the posting lists to ensure that no documents are missed. Independently, the same idea was presented in [19].

2.3. Challenges for Query Running Time Prediction

In this section, we expose the difficulty in predicting query running time for the WAND and BM-WAND techniques. The datasets used in the following experiments are described below in Section 5. In particular, the ClueWeb09 and the Gov2 Web collections are considered standard collections for comparative performance evaluation.
In Figure 2, we show running times in milliseconds achieved by both ranking algorithms with different values of k for the top-k documents using the ClueWeb09 collection. Over a large set of input queries, the results show that for each k the average running time values do not increase linearly with k. As the value of k increases, both techniques present nearly logarithmic increasing running times. This is because the heap used to keep the current top-k documents is larger as more documents are kept inside the heap until the algorithm finishes query processing. The probability of finding a document more relevant than those currently stored in the heap is also higher so that more insertions and eliminations are performed on average. The results show that the BM-WAND algorithm presents lower running times than the WAND algorithm. In Figure 2a, the WAND algorithm presents about twice the time reported by the BM-WAND algorithm for small values of k. For large values of k, the difference reported by both algorithms is 23% on average. However, the results in Figure 2b, obtained with the Gov2 collection, show that the difference between both dynamic pruning techniques tends to be smaller.
The challenge is to predict the behaviour of individual queries whilst performing thread management at run time. The results in Figure 2 show that this is at least dependent on the document collection and the combination of algorithms used to perform the document ranking process.
In Figure 3, we show the running time in milliseconds required to process 15,000 queries from the query log, using the ClueWeb09 and the Gov2 Web collections. We also show results with the BM25 and TF-IDF document scoring algorithms. We set k = 1000 . The x-axis represents the 15,000 queries sorted by their running time from low to high values. The y-axis shows the running time of the individual queries in log scale. In Figure 3a, we show the results obtained with the WAND strategy. The BM25 scoring algorithm tends to present lower running times than the TF-IDF scoring algorithm. This is counter intuitive since BM25 demands more computations than TF-IDF per processed document. The reason for this behaviour is the effect that the calculated document score values have on the heap used to hold the current top-k documents. In Figure 3b, we show results obtained with the BM-WAND algorithm. In this case, all curves tend to be almost overlapped. However, the query running times obtained with the ClueWeb09 collection and the BM25 document scoring algorithm tend to be slightly higher. As in practice the index service, at single processor level, must solve each query from the input stream in least than, say, 50 or 100 ms on commodity hardware, Figure 3 shows that it is relevant to reduce individual running times by means of multi-threading. In this case, the challenge is to determine at run time what strategy to apply to perform multi-threaded query processing.
The results presented in this section show that the running times reported by the WAND and BM-WAND are highly influenced by a few parameters such as the number of document score evaluations, the specific query contents and the features of the document collection. The proposed prediction algorithm is designed to properly consider these parameters and their impact on the query running time.

3. Related Work

Query running time prediction is a challenging task widely used in database management systems [1,2,3,4,5,6,7]. In the context of Web search engines, query running time prediction deals with additional challenges such as dynamic pruning techniques. Dynamic pruning techniques such as the WAND or the BM-WAND can improve the efficiency of queries, but they can take different amounts of time for different queries. That is because their cost is not directly related to the posting list lengths of the query terms as many documents can be skipped. In this context and under different incoming user query rates, query running time prediction algorithms based on machine learning techniques can be useful to determine in advance which resources can be allocated to a given query.
The work in [20] presented a query running time prediction algorithm that aggregates the terms features into statistics related to the query. The results of the aggregations are used as input to a learned regression model. This work showed promising initial results for disk-based indices. Later, the work in [21] applied the prediction algorithm presented in [20] for evenly distributing the query workload across processors acting as replicas for each partition of the document collection. The work in [22] presented an algorithm which is based on the relative entropy between a query language and the corresponding collection language model.
The work in [10] specifically presented a query running time predictor for the WAND technique. The proposed predictor is designed for distributed search engines. The authors propose to use a vector with 42 descriptors to represent different features of the queries and the respective posting lists. To estimate the query running time, the proposed algorithm uses a linear regression method which has been trained from the statistics obtained by the aggregations of the terms features. The work in [23] improves the accuracy of [10] by including additional data on the query terms for the prediction of the running time. More recently, the authors in [24] proposed to use index synopses which are stochastic samples of the full index for attaining accurate timing predictions.
The work in [25] proposed to model the complexity of query features by using a personalization method. This approach outperformed existing predictors in terms of accuracy and memory consumption. The query running time predictor was used to decide on whether to process a single query with multiple threads (the ones with predicted large running times) or a single thread (the ones with predicted small running times). The work in [26] determined the most relevant parameters used in [10] and based on that finding proposed to optimize memory usage on heterogeneous hardware. The authors proposed a predictor named Delayed, Dynamic, and Selective (DDS). First, queries are executed for a short period of time D so short-running queries can be completed without prediction overhead. Then, the algorithm collects 10 features of the query after running it during the first step. In the final step, the algorithm classifies the queries as long or medium using a threshold value. This work was extended in [27] by presenting more comprehensive experimental evaluation.
The work in [28] aimed to achieve a minimum query response time when query traffic is high. The algorithm is configured to prune more or less aggressively, depending on the expected duration of the query. The value of k is also estimated in [29]. Nevertheless, in [29] the effectiveness of the search engine is not compromised as it ensures the retrieval of the actual top-k document results. The work in [30] presented a scheduler to process queries concurrently by using multi-threading. It also allows to execute updates in the posting lists. Queries are decomposed into work units that are assigned to different threads. The authors use the number of query terms and the sum of lengths of the respective posting lists for performing the classification required to set the number of threads to be assigned to each co-occurring query.
The work in [31] proposed a prediction algorithm for multi-stage retrieval systems where an initial document candidate generation stage is followed by one or more re-rankers. The work in [32] proposed an analytical performance modeling framework for user queries. The overhead introduced by the proposed analytical model varies between 5% and 6% depending of the particular test. More recently, the work in [33] proposed a reinforcement learning based approach for search engines. During query evaluation, the query is classified using pre-defined categories, and consequently a match plan is selected. The authors proposed a method to predict which match plan to employ for each incoming query.
The Discrete Fourier Transform (DFT) technique has been previously used in contexts such as patterns recognition in data mining [34,35], and to predict the popularity of videos by analyzing videos view count traces in the frequency domain [36]. In the Web search engine application domain, it has been used for determining (i) document relevance [37], (ii) document semantic representation [38] and (iii) document classification [39]. In this paper, we show that the DFT technique can also be useful for predicting the running time of query processing algorithms.

4. A DFT-Based Query Running Time Prediction Algorithm

Query running time prediction has practical applications in the efficient assignment of resources. In particular, in this paper, we show its benefits for an efficient assignment of threads to incoming queries. The DFT-based algorithm can be used by a scheduler to decide for each query at runtime, whether to assign to it a single thread or more than one thread to process it depending on the estimated time. Furthermore, the scheduler can determine the number of threads to allocate to each query using the predictions provided by our algorithm. An efficient allocation of threads allows to obtain a better utilization of the resources and reduces the latencies of query execution times [10].
The algorithm proposed in this work uses a new approach to describe user queries with low-dimensional vectors. Our approach allows us to drastically reduce the computational cost without compromising the accuracy of the top-k document results. The cost of predicting a query running time is directly proportional to the number of inputs to the prediction algorithm, regardless of the particular document ranking algorithm being used. Any regression model with several independent variables x i with an output dependent variable y, must process the entire input vector x = { x 1 , x 2 , , x p } of p descriptors. In particular, a basic regression model of several variables can be defined as y = β 0 + i = 1 p β i x i + ε , which corresponds to a multiple linear regression model where β i is the correlation coefficient to be obtained, β 0 is the slope of the regression line and ε is the error.
To predict the query running time, we propose to use the Discrete Fourier Transform (DFT). The DFT is an approximation of the Fourier Transform and is used to find the content in the frequency of signals that are periodic and discrete, which implies that in the domain of frequency they will also be periodic and discrete. The DFT includes in its descriptor signal data such as the variance, the arithmetic means, and factors associated with the continuity of the signal and its density. The signal obtained with the DFT satisfies the symmetry property [40]. Therefore, it allows us to use only half the components of the vector.
These properties allow us to obtain a good characterization of the posting, since it includes in its signal (output of the DFT) descriptive information of an input signal. Thus, using the DFT allows to reduce the number of descriptors used to represent the information while remaining representative for each posting list.
In particular, we use the DFT to:
  • Describe the distribution of scores of each document in the posting list of the terms and to determine how is the distribution of the scores of the documents with higher probability of being part of the top-k document results. In this way, we describe the search space of each posting list.
  • Describe the variation of the running time of different queries as we retrieve a larger number of top-k document results.
In this work, the distribution of the weights w ( d , t ) of the posting lists are treated as signals of the DFT, where these signals are the function of independent variables given by the random distribution of w ( d , t ) and determined by the order of the documents identifiers (docIDs). Low DFT frequencies are used to describe how the high values of w ( d , t ) are distributed (because they appear less frequently in the posting list according to the Zipf law [8]) and high DFT frequencies are used to describe the distribution of low values of w ( d , t ) (because they appear more frequently in the posting lists).
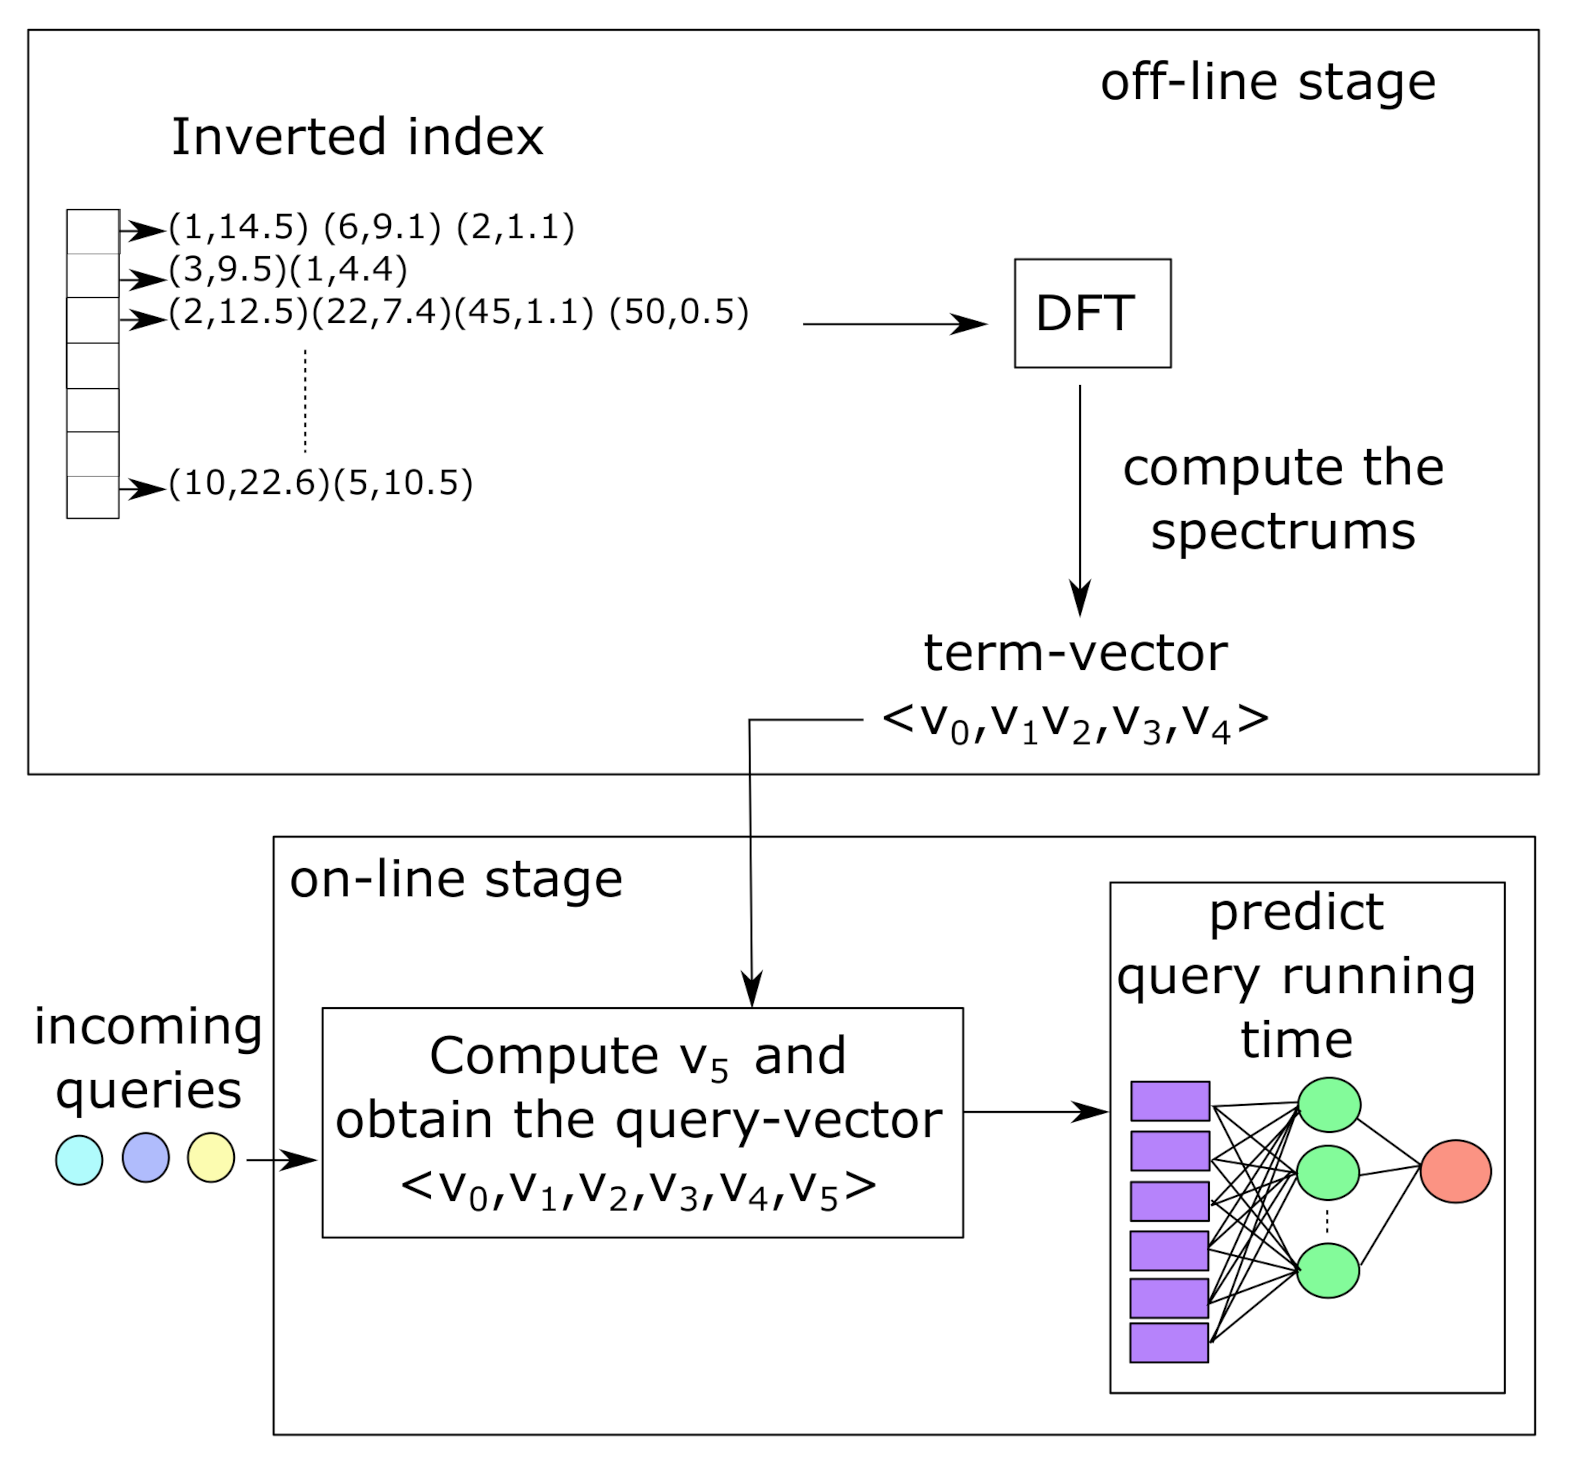
Our DFT-based algorithm builds a query-vector in two stages as illustrated in Figure 4. During the off-line stage (Figure 4 on top), our proposal builds a five-dimensional term-vector to represent the posting lists of the terms stored in the inverted index. Three descriptors of the term-vector are obtained with the DFT which calculates the spectrum of the posting lists. The two remaining descriptors of the term-vector correspond to the characterization of the threshold for a given value of top-k (e.g., top-10) and the posting list size. The term-vectors are used later during the on-line stage, as illustrated in Figure 4 at bottom, to build a six-dimensional vector representing the incoming user queries. The query-vector feeds a feed-forward neural network with back-propagation which estimates the query running time. In the following, we present the technical details.

4.1. Term Coefficients

Given a query q containing the terms t l with l 1 , where each term has a posting list L t containing pairs < d , w ( d , t ) > where d is the document identifier and w ( d , t ) is the score of the term in the document (e.g., the frequency of occurrence of the term t in the document d), our DFT-based algorithm works as follows. We use information regarding the frequency spectrum of density functions Φ t obtained from the posting lists of the terms t l q , and the information related to the spectrum of frequency of the processing time T ( t l , k ) for each term t l required to retrieve the top-k document results. The spectrum of frequencies is obtained with the discrete Fourier transform (DFT). In addition, we use: (a) the size of each posting list s t = | L t | (i.e., the number of documents where the term appears), (b) the processing time for T ( t , 10 ) , T ( t , 100 ) , T ( t , 1000 ) and for T (t, 10,000), and (c) the threshold value for the top-k document. Then, we describe each term with a five dimension vector ψ : < ψ 0 , ψ 1 , ψ 2 , ψ 3 , ψ 4 > .
The density function X D F T of the posting lists of the term t l , describes the search space Ω t of the posting list L t . The X D F T of the processing time functions T ( t , k ) describes the differences of the times required to process the posting list of a term t with different k values. In practice, the values of X D F T [ u ] are the u-th coefficients of Fourier and express the frequency content of a function or a signal. In this analysis, the DFT of Φ t can be considered as a characterization of the distribution of the values w ( d , t ) and, therefore, it can be seen as a function of bulk density in the frequency domain.
We use the spectral power density of X D F T over w ( d , t ) , because it represents the cost of processing the signal in the frequency domain. It shows how the power is scattered as a function of the frequency F = 1 / 10 , which is the minimum frequency (or fundamental frequency) of the DFT. The fundamental frequency F = 1 / 10 describes the density of posting lists by using the convolution of the broader sinusoidal signal. Thus, it allows us to describe well the posting lists that have a higher density. We also use the magnitude of the spectrum of the fundamental frequency F = 1 / 4 of the D F T for the posting lists and for the processing times obtained for each term T ( t , k ) , which describes the difference between the processing times as the value of k increases in a quadratic way. Table 2 summarizes the descriptors used in the proposed prediction algorithm.
PSD of Φ t at a frequency 1 / 10 : ψ 0 is the Power Spectral Density (PSD) of the DFT of Φ t in the fundamental frequency F = 1 / 10 . The calculation is | X D F T [ u ] { Φ t } | 2 , u = 1 . Φ t (Equation (1)) is a vector containing the cumulative sums of Φ G (Equation (2)) of scores w ( d , t ) of each document d L t inside the intervals I j . Each j-th interval I is equi-spaced at the rate of # P o s t i n g s / 10 items. If there are empty intervals, the cumulative sum is zero in those positions. Each value of Φ t , i is obtained with Equation (3).
Φ t = < Φ t , 1 , Φ t , 2 , , Φ t , i , Φ t , 10 >
Φ G = m a x { d L t w ( d , t ) } , t I n v e r t e d I n d e x
Φ t , i = 1 Φ G d I i w ( d , t )
We set the number of intervals I = 10 because a greater number of intervals implies a distribution of the average power of the signal in a greater number of frequencies of the DFT. In other words, by increasing the number of intervals the percentage of documents that quantify the density of w ( d , t ) decreases inside each interval. On the other hand, if the number of intervals is decreased, the power spectral density values tend to increase close to the average value of the signal power and the characterization of the density distribution in the frequency domain is decreased. Then, for the purposes of characterizing how the accumulated sum is distributed (density of values of w ( d , t ) in each interval) and specifically to describe the posting lists that have higher density and, therefore, a higher cost of processing, it is not necessary to use a large number of intervals. Therefore, we define I = 10 to keep an accumulated density of scores w ( d , t ) of 10% of the documents (for posting lists of 10 or more documents), which is a representative percentage to characterize the density of w ( d , t ) in different parts of the posting lists. Additionally, we have experimentally found I = 10 to be a value that produces accurate results.
DFT magnitude of Rank-Score of frequency 1/4: ψ 1 is the magnitude of the frequency spectrum of the DFT in the fundamental frequency F = 1 / 4 of the distribution of cumulative density of the documents scores from k = 1 to k = { 10 ; 100 ; 1000 ; 10 , 000 } . We set F = 1 / 4 to quantify the accumulated density distribution of the high values of w ( d , t ) of the documents that are more likely to match the query terms.
#Postings: ψ 2 is the number of documents where the term appears.
DFT magnitude of processing times: ψ 3 is the magnitude of the frequency spectrum of the DFT obtained for the vector containing the processing times T ( t , k ) of a term t at frequency T = 1 / 4 . The elements of the vector are < T ( t , 10 ) , T ( t , 100 ) , T ( t , 1000 ) , T ( t , 10 , 000 ) >. T ( t , k ) is the running time required to retrieve the top-k documents results for the term t.
Threshold: ψ 4 score value (threshold) for the k-th document (top-k). If the list has less than k documents, then ψ 4 = 0 .

4.2. Query Coefficients

To predict the query running time, we compute the query descriptor Ψ q as a six-dimensional vector < x 0 , x 1 , x 2 , x 3 , x 4 , x 5 > as follows. For each term t q , we add the corresponding descriptors t ψ 0 , t ψ 1 , t ψ 2 and t ψ 3 of each term in q, so we obtain an initial query vector with dimension four. Then, we include two additional descriptors computed as the max { t ψ 2 } and max { t ψ 4 } for each t q . All vectors ψ t are calculated off-line, while Ψ q is obtained at query run time.
For a given query q, the descriptors < x 0 , x 1 , x 3 > represent the sum of integrals obtained with the DFT and the descriptor x 2 represents the sum of all documents where the query terms appears, which gives an approximation to the search space of q. We do not compute the sum of ψ 4 for each term of the query because it is a lower bound of the score of the top-k and if there are several term lists with high scores, the sum of those scores will increase the value of ψ 4 and it will lose its characteristic of lower bound. We also use the maximum values of ψ 1 and ψ 4 that are minimum bounds.
All of the DFT descriptors are based on the use the fundamental frequency F which depends on the period P of the input signal. That is, the distributions of w ( d , t ) with period of P = 10 , the distributions of the cumulative density with period of P = 4 , and the distributions of processing time with period of P = 4 where the fundamental frequency is F = 1 / P . As we explained above, we use the fundamental frequency to quantify how is the distribution of the high values of the input signal. In our case, high values of the magnitudes of the DFT represent a higher list processing cost.

5. Experimental Evaluation

5.1. Data Collection and Methodology

The research was conducted using a query log and two document collections of different sizes. We build an inverted index for each one of these collections by using the Terrier IR platform (http://terrier.org/, accessed on 19 June 2021). We pruned the index to keep only the data related to the terms of the query log. Once the indexes were built, we processed the query log using these indexes to retrieve the most relevant document results for each query. In this section, we will further describe the query log, the document collection, the hardware, deployment details and the baseline algorithm used to compare the results obtained by our DFT-based query time prediction algorithm.
In the following sections, we first evaluate the accuracy of the prediction algorithm with different machine learning methods. We show that the best accuracy is obtained with a feed-forward neural network with back-propagation using five neurons in the hidden layer. Then, we present the accuracy and the performance evaluation for our proposal and the baseline algorithm. Finally, we show the benefits of our proposal to facilitate the assignment of threads to incoming queries.
Query log: We use a query log containing 20,000 queries in English selected from the TrecMillion Query Track (https://trec.nist.gov/data/million.query09.html, accessed on 19 June 2021). The query log is a list of text query like “used car parts”, “poker tournaments” and “lake links”. From this dataset we selected unique queries with two or more terms and removed the stopwords (e.g., this, that, these, etc.). The resulting query log has 15,000 queries.
ClueWeb09 Dataset: We use a 50.2 million document collection from the TREC ClueWeb09 dataset (category B) (http://www.lemurproject.org/clueweb09.php/, accessed on 19 June 2021). This collection has a total of 428,136,613 unique documents. The resulting index size for this collection is 60.2 GB with 10,230 different terms.
Gov2 Dataset: We use a second collection named TREC Gov2 with 25.2 million documents crawled from .gov sites (http://ir.dcs.gla.ac.uk/test_collections/gov2-summary.htm, accessed on 19 June 2021). It includes html and text, plus the extracted text of pdf, word and postscript. The resulting index size is 13.7 GB with 12,062 different terms.
Hardware and Deployment Details: The running time of each query includes the pre-processing of uppers bounds plus the time required by the WAND or the BM-WAND iterators to process the query. The running times for the actual execution of the query processing strategies were obtained on an Intel Processor Core i7-3820 with 4 Cores (8 threads) and 32 GB RAM. All the experiments were performed with the whole inverted index loaded into main memory. In the case of the ClueWeb09, due to the index size is larger than the size of the main memory of the hardware, we performed the experiments with batches of 500 queries each. Only the posting lists associated with the terms present in each batch are loaded into the main memory using on average 22 GB of memory space. The average execution time of each query is measured independently one by one. The code of the algorithms presented in this paper are available at https://github.com/neurovisionhub/dft-running-time-prediction, accessed on 19 June 2021.
Baseline Algorithm: In the experimentation, we evaluate the performance of our DFT-based algorithm for query running time prediction by using the WAND and the BM-WAND dynamic pruning techniques executed under the BM25 and the TF-IDF document scoring methods. We compare the proposed prediction algorithm against the approach proposed in [10]. We selected this algorithm as our baseline for comparison purposes since it is suitable for predicting the running time of queries solved with the WAND and BM-WAND algorithms for either conjunctive or disjunctive queries.
Evaluation Metrics: The main performance metrics used in our experiments are (i) the Pearson correlation among the predicted query running times y j and the actual running times x j obtained from the real execution of each query solution strategy; (ii) the root-mean-square error (RMSE) ( 1 n j = 1 n ( y j x j ) 2 ) , where n is the number of queries considered in each run; (iii) the variation coefficient relative to the mean value calculated as VC = σ y ¯ × 100 ; (iv) the average absolute error (AAE) defined as ( s u m | x i y i | ) / n ; and (v) the maximum absolute error m a x e observed from the differences between the actual and predicted values ( max | x i y i | ).

5.2. Learning Methods

In this section, we evaluate the accuracy of the prediction algorithm for query solution running time when implemented with different machine learning methods. We tested several methods such as the linear regression, the multivariate linear regression (MV), the extreme machine learning (EML-5) with five neurons in the hidden layer, the feed-forward neural network with back-propagation (BP-5) using five neurons in the hidden layer, the Random Forest (RF) and the support vector machine (SVM). In the following, we present the accuracy achieved with each learning method under the BM-WAND dynamic pruning algorithm. Similar results were obtained with the WAND strategy. We use the BM25 and TF-IDF scoring algorithms on both Web collections, namely the ClueWeb09 and the Gov2.
The BP-5 has six input neurons, one for each descriptor of the six-dimensional characteristic vector ψ and one output. For the purpose of this section, we show results with five neurons in the hidden layer. However, we conducted experiments with 1, 5, 10, 25 and 50 neurons in the hidden layer and the best results were obtained with 5 neurons as we show in the next section. We used the log-Sigmoid transfer function in the hidden layer and a linear transfer function in the output layer.
We evaluated the accuracy of the learning methods by applying a swap c-fold cross validation with c = {2, 3, 5, 10}. In other words, we inverted the size of the c-folds. For c = 2, both training and test folds have the same size (50–50%). For c = 3, the training fold has 33.3% of the data and the test fold has 66.3% of the data, and so on.
Table 3 shows the results reported by the query running time prediction algorithm when executing the learning methods listed above. We show the RMSE, the coefficient of variation (VC) and the Pearson correlation (PrC) obtained with different Web collections and the BM-WAND technique. The results show that VC tends to be small in all cases, meaning that the values are well represented by the mean. The linear and multivariate methods show low accuracy (high RMSE values) because the distribution of the running times of queries is not linear neither a combination of variables. The distribution of the actual query running times tends to be like an inverse of the Zipf’s law. The BP-5 and the Random Forest methods achieve the best results in almost all cases as they achieve low RMSE and high PrC values. However, the Random Forest method tends to create many branches and long paths when the curve representing the execution time for different queries has many inflections.
The EML-5 method presents lower accuracy than the BP-5. That is, the EML-5 presents higher RMSE and lower PrC values than the respective values of the BP-5 method. We conducted additional experiments which showed that the EML-5 requires a larger number of neurons in the hidden layer between 20 and 25, to achieve similar results than the ones achieved by the BP-5 method. Finally, the SVM method tends to be over-fitting to the training set. In our application case (fast Web query solution using inverted indexes) most query running time are very low, thus the SVM is not capable of estimating long query running times. Therefore, in the following sections, we use the BP-5 learning method for the query running time prediction algorithms. We experimentally tested that similar conclusion holds for the baseline prediction algorithm as it only differs from our DFT-based algorithm in the specific attribute vectors used to train the learning method.

5.3. Accuracy Evaluation

In this section, we evaluate the accuracy of the query running time prediction algorithms. We train the respective neural network with 60% of the queries and we use 40% of the remaining queries for the experiments. We evaluate accuracy with 1 , 5 , 10 , 25 and 50 neurons in the hidden layer where we use the log-Sigmoid transfer function in the hidden layer and the linear transfer function in the output layer.
Table 4 shows the accuracy achieved by the query running time prediction algorithms. Numbers in bold font denote the best accuracy results in each case. Our DFT-based algorithm achieves the lowest RSME values and the highest Pearson correlation (PrC) values in most cases. The baseline approach outperforms our proposal only for the BM-WAND with TF-IDF and using the Gov2 Web collection. However, the difference is very small. Table 4 also shows that the best results are obtained with 5 and 10 neurons in the hidden layer. With more than five neurons, results show no improvement and with more than 10 neurons both approaches tend to lose accuracy.
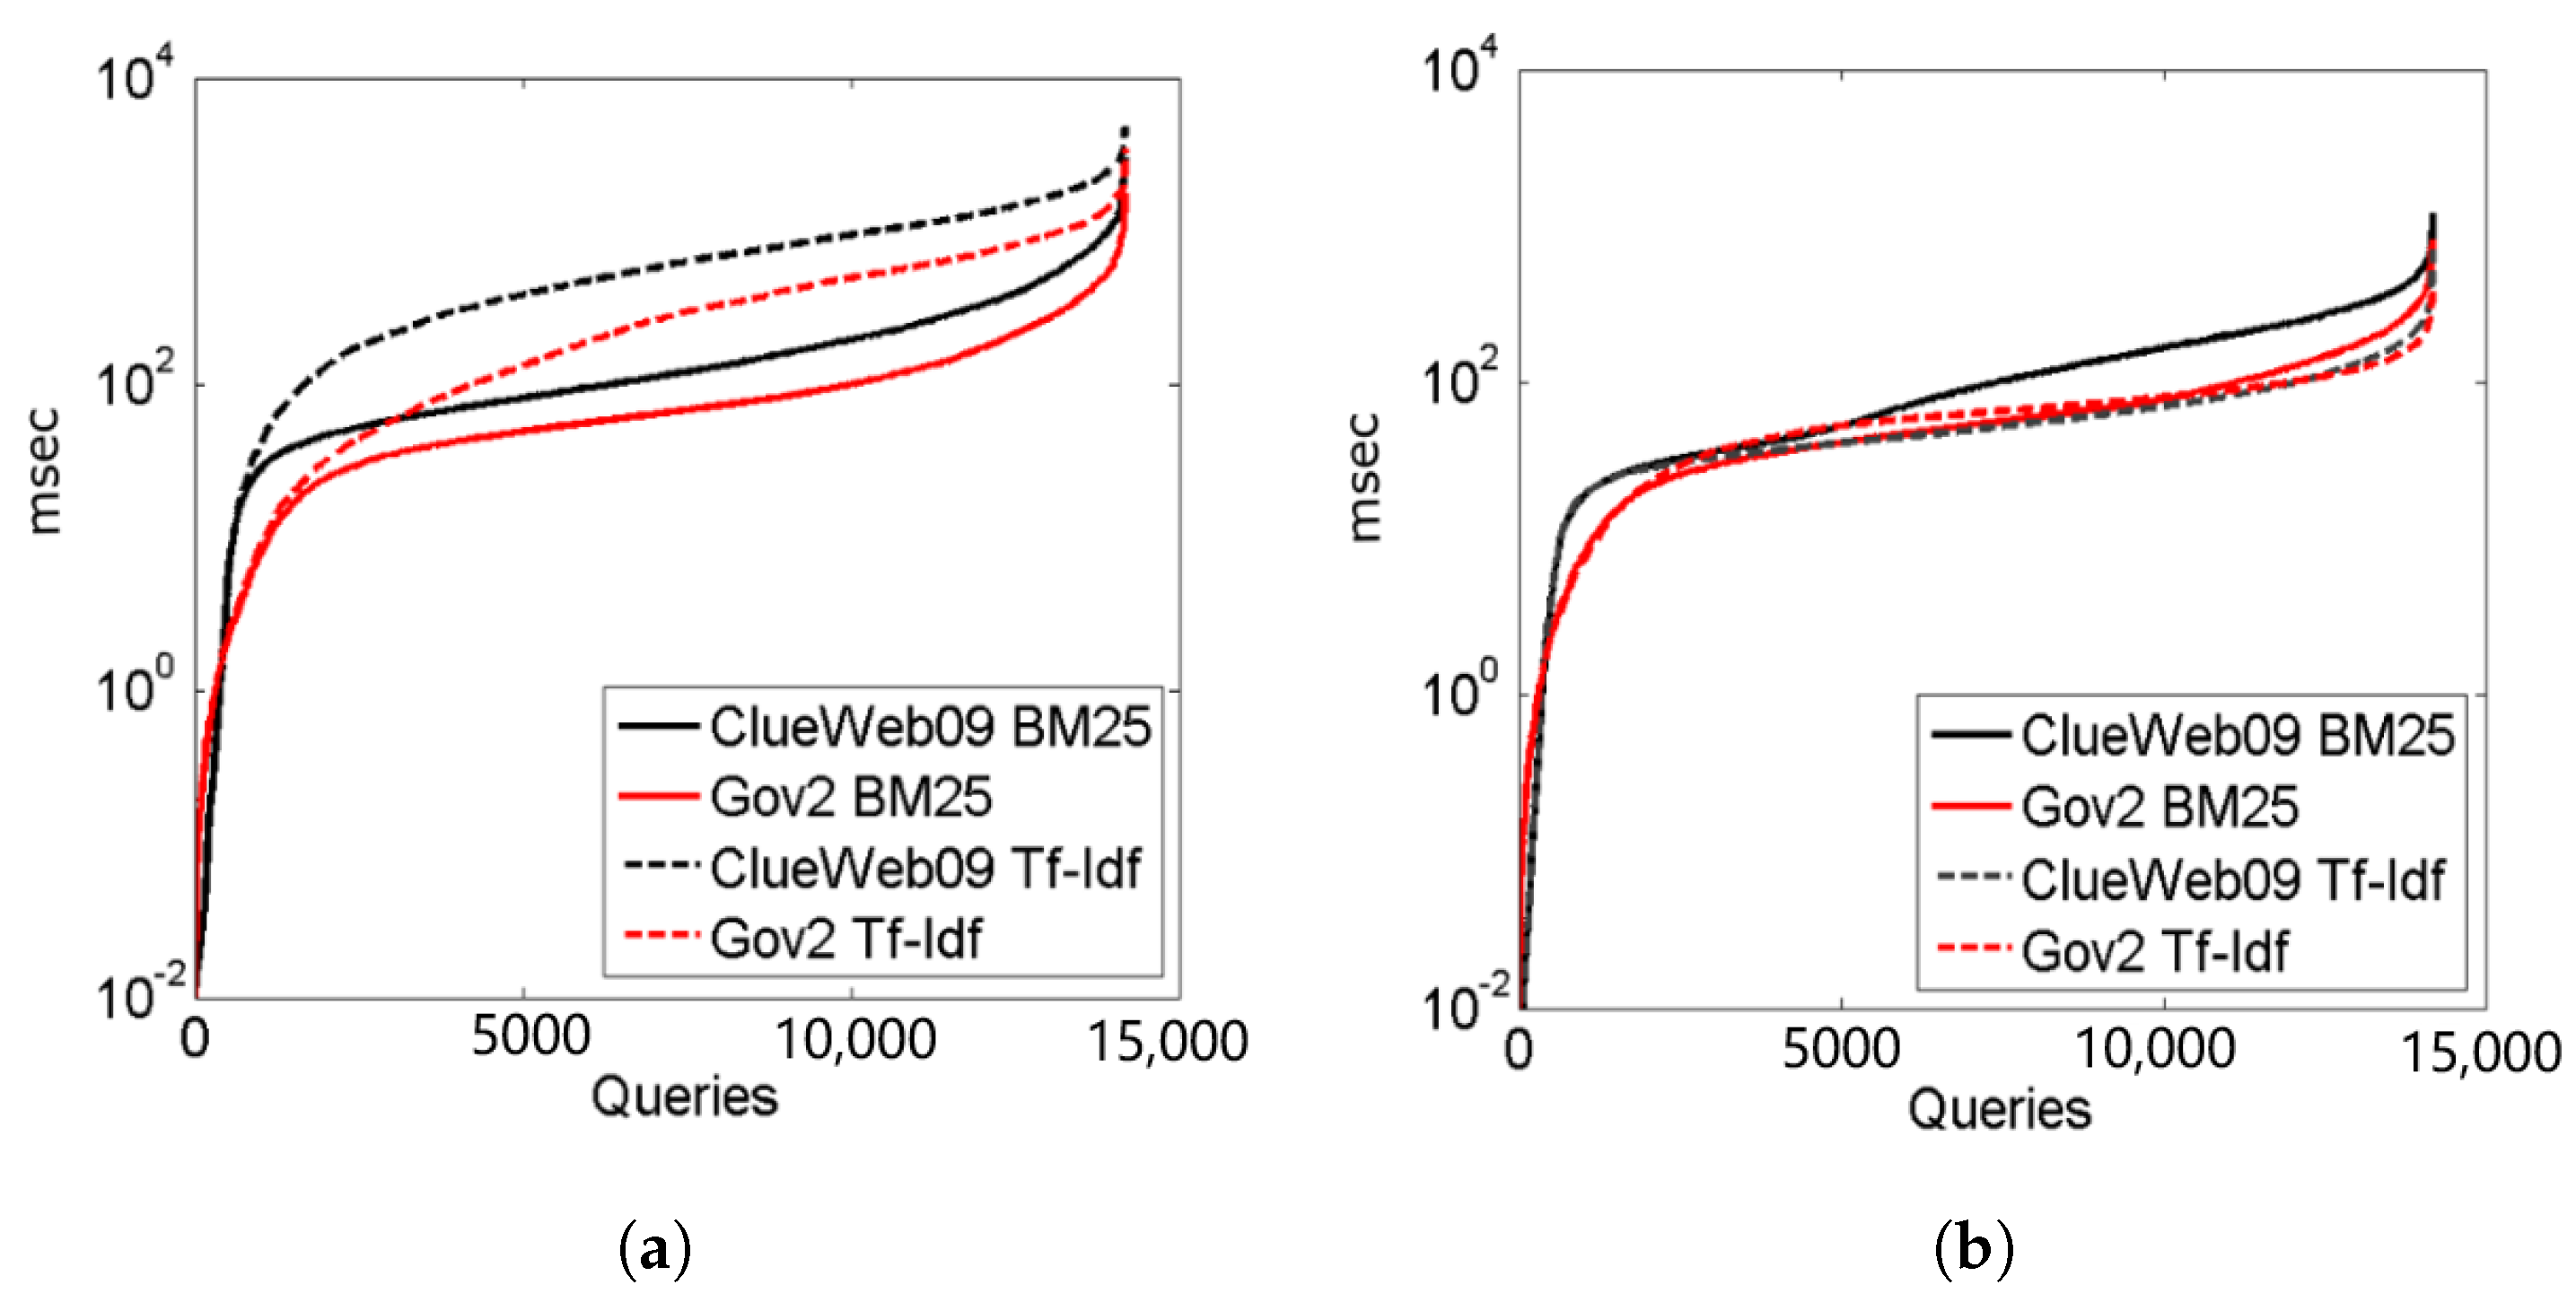
In Table 5, we show results obtained with (1) the real execution of the query processing strategies for different datasets, (2) the proposed query running time prediction algorithm, and (3) the baseline query running time prediction algorithm, both operating with five neurons in the hidden layer. In the columns, QRT is the average query running time and m a x t is the maximum query running time observed in the set of processed queries. AAE is the average absolute error and m a x e is the maximum error observed in the predicted running times for the set of processed queries.
In general, the results in Table 5 show that both approaches are able to make excellent prediction of the QRT values. The proposed algorithm presents smaller error values than the baseline algorithm (numbers in bold font in the table). For the AAE metric, the reduction is in the range between 5% and 15%, whereas for m a x e the reduction is in the range between 49% and 74% for WAND and between 1.6% and 52% for BM-WAND. The m a x t value indicates the single query that demands the maximum running time. For this case, both approaches outperform each other depending on the dataset and query processing strategy. For WAND, the baseline algorithm achieves better overall predictions where it underestimates the exact value by 4% on average whereas the proposed algorithm underestimates the exact value by 14% on average. In this case the baseline algorithm is able to predict the exact values for two maximum queries. Furthermore, the computations associated with the TF-IDF method are much lighter than the BM25 ones which increases the linear effect. For BM-WAND, this underestimation is similar in both approaches with 19% for the baseline algorithm and 18% for the proposed algorithm.
To evaluate the effect of the index size on our DFT-based method, Table 5 shows that the m a x e reported with the ClueWeb09 tends to be 10% higher when executing the WAND and 15% higher when executing the BM-WAND. This is mainly because as we increase the number of documents some posting lists tend to be significantly larger, which tends to increase the maximum error in of the prediction algorithm. However, the AAE increases only 0.0035 s for the WAND and 0.0055 s for the MB-WAND. Notice that when using the BM-WAND and the TF-IDF, there is no difference between the AAE reported with both datasets. In other words, with a larger dataset, the maximum errors increase by 15% at most, but the average of the absolute error reported by our DFT-based algorithm are very similar.

5.4. Performance Evaluation

In this section, we evaluate the execution time and the memory consumption of the query running time prediction algorithms. At run time, for each incoming query, Table 6 shows (i) the average execution time required to compute the vectors for queries with two and five terms and (ii) the average execution time required by the neural network that predicts the running time of queries. We present results for a neuronal network with 5, 10, 25 and 50 neurons in the hidden layer. The results show that the proposed algorithm reduces the on-line query vector construction time in a significant manner (90–92%) as it handles a smaller number of attributes than the baseline algorithm (6 vs. 42 attributes, respectively). Furthermore, the proposed algorithm is able to reduce in at least 32% the execution time of the neuronal network that uses the small query vector to predict each query running time. In total, considering the query vector construction time and its use in the neural network for predicting the respective query running time, the improvement in execution time of the proposed algorithm over the baseline algorithm is in the range 77–82%.
Table 7 shows the memory consumption in bytes required to store (1) the descriptors of the term-vector and (2) the descriptor of the query-vector for each query being solved in the processor. As expected, the proposed algorithm also reduces the memory consumption requirements of each incoming query in a significant manner in about 70%.

5.5. An Application Case for Query Running Time Prediction

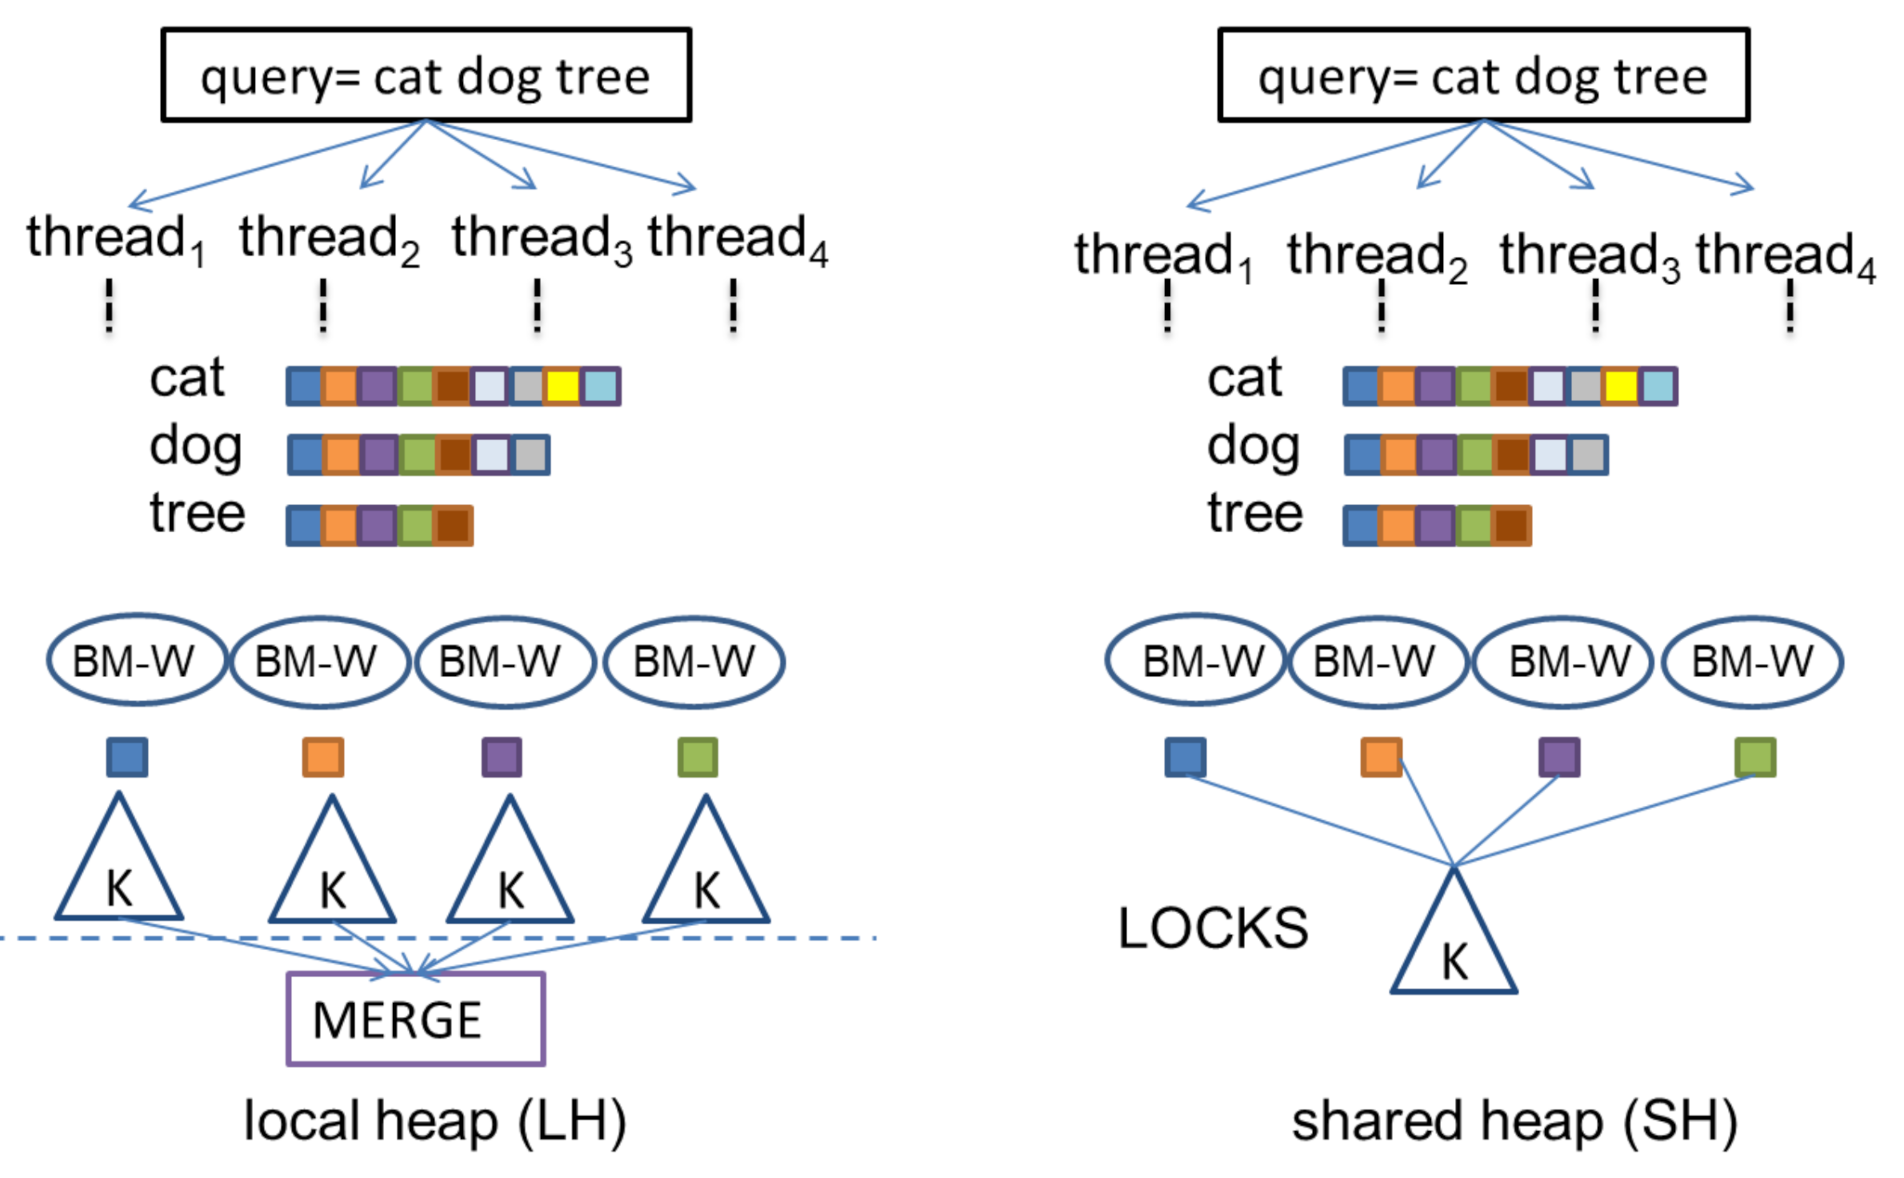
In this section, we describe two multi-threaded query processing strategies [29] as an application case for the query running time prediction algorithm presented in the paper. In the first strategy, called Local BM-WAND (LBM-WAND), each thread keeps a local heap to hold the top-k documents calculated by the thread. The posting lists of the documents index are distributed among a total of T threads using the rule d o c I D mod T . This posting list partition rule ensures that any given document is always assigned to the same thread. Then, each thread processes the query using its own local inverted index. At the end of the query processing process, we merge the local heaps of each thread to select the top-k document results. To this end, a synchronization barrier is executed before the merge operation. The second strategy, called Shared BM-WAND(SBM-WAND), uses the same index partition scheme as the LBM-WAND but all threads update a single global heap of size k holding the top-k results. Therefore, the SBM-WAND strategy does not perform a merge of partial document results at the end of the process as it already contains the top-k results. A lock operation is executed to guarantee exclusive access to the shared heap during updates to prevent from read-write conflicts. Figure 5 describes these two parallel strategies for query processing.
Experimentally, we have found [29] that the LBM-WAND strategy performs better than the SBM-WAND strategy when the sequential query running time is below a given β value. The SBM-WAND strategy outperforms the LBM-WAND strategy for queries demanding running times larger than β . In practice, the value of β can be calculated as a part of the training process for the DFT algorithm. Thus, for each incoming query, a scheduler uses the proposed DFT-based algorithm to decide on which strategy to apply at run time.
The number of threads T required for solving single queries is determined as the minimum necessary to ensure that no query is solved beyond an upper bound for the response time in the index service. In this way, the total number of threads available for query processing can be grouped into a set of T-threads units capable of using either LBM-WAND or SBM-WAND for solving single queries in parallel. In practice, for our Web collections and test processor, with T = 8 threads is sufficient for achieving query response times below 50 ms which is a standard upper bound for search engines.

5.5.1. Accuracy Evaluation of the DFT-Based Algorithm under Multi-Threaded Query Processing

We evaluate the predictive ability of the algorithm to determine the query running time for a given number of threads. This prediction is challenging since the running time does not decrease linearly with the number of threads. Table 8 shows the Pearson correlation (PrC) and the error RMSE obtained by both prediction algorithms for different number of neurons in the hidden layer and different number of threads (1, 2, 4 and 8). The correlation and error are evaluated against the actual execution of each multi-threading strategy (LBM-WAND and SBM-WAND). As we increase the number of threads, both prediction algorithms achieve a more accurate prediction of the query running time. This is mainly because the differences between the maximum and minimum query running times tend to be smaller with thread increase. The baseline prediction algorithm presents better prediction accuracy than our DFT-based algorithm for the case of a single neuron in the hidden layer. The results show that the proposed algorithm achieves more accurate predictions than the baseline algorithm with five and more neurons in the hidden layer. The SBM-WAND strategy presents relatively larger error values (RMSE) because in this case it is more difficult for the algorithm to predict the number of locks executed to control the accesses to the shared heap.
Table 9 shows the query running times for 1, 2, 4 and 8 threads obtained with (i) the actual execution of the LBM-WAND (L) and SBM-WAND (S) strategies, (ii) the respective query running times predicted by the proposed algorithm and (iii) the respective query running times predicted by the baseline algorithm, both using 5 neurons in the hidden layer. The results show that the proposed algorithm reduces the absolute error (AAE) by 7% on average whereas the maximum absolute error ( m a x e ) is reduced by 26% on average. For the single query demanding the maximum running time ( m a x t ) the baseline algorithm underestimates its value by 16% on average, whereas the proposed algorithm is less effective in this case as it underestimates its value by 28% on average.
Notice that the results in Table 9 show that the LBM-WAND strategy is 29% less efficient than the SBM-WAND strategy on average. This is true for the average values taken by considering the whole set of queries used in the experiments. However, for the same test dataset, LBM-WAND is on average 10% more efficient than SBM-WAND for a small subset of queries (5%). In practice, the size of this subset depends on the specific query contents and how frequently they occur in the dynamic incoming stream of user queries.
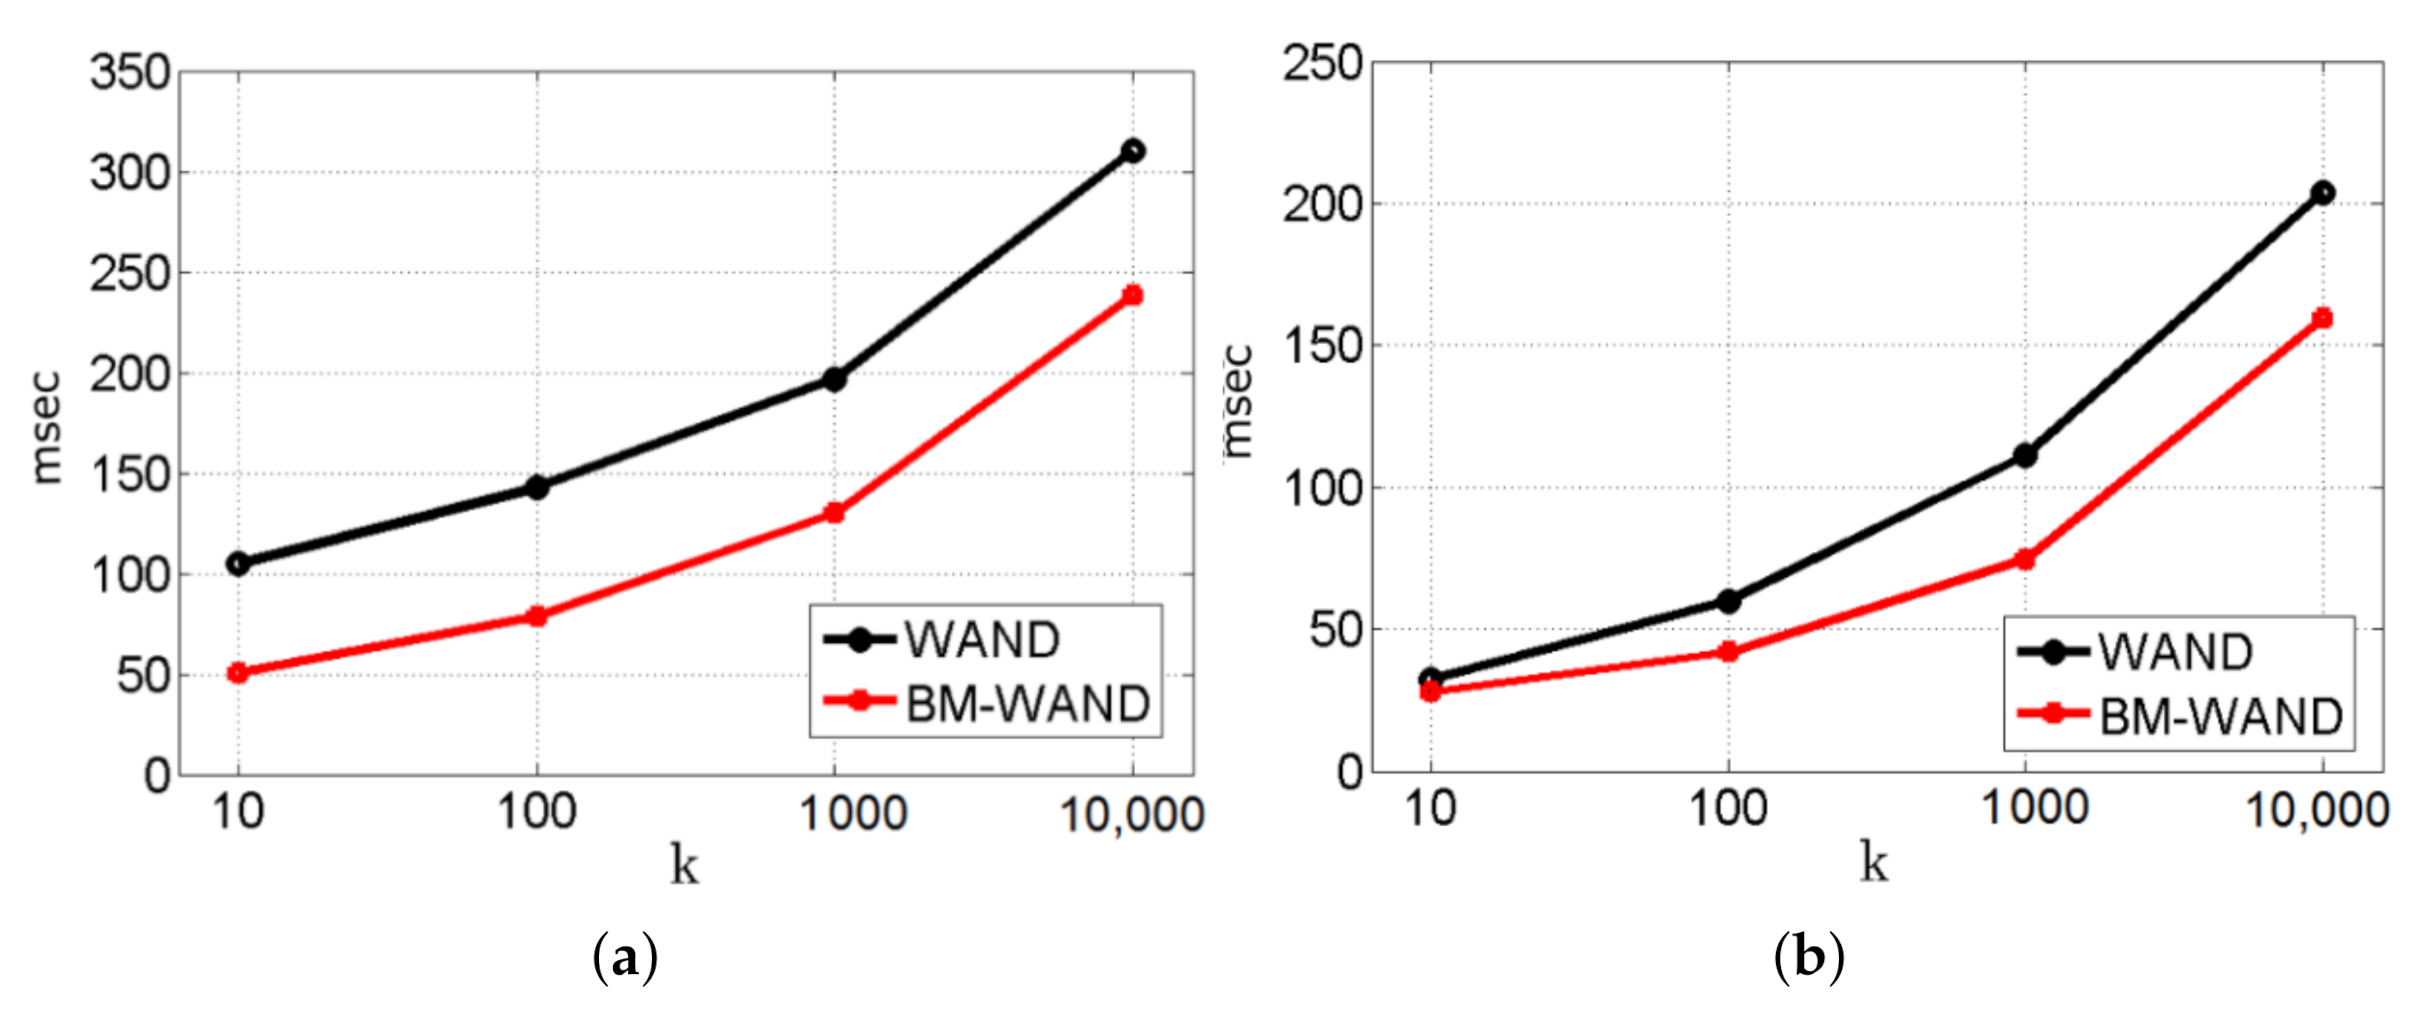
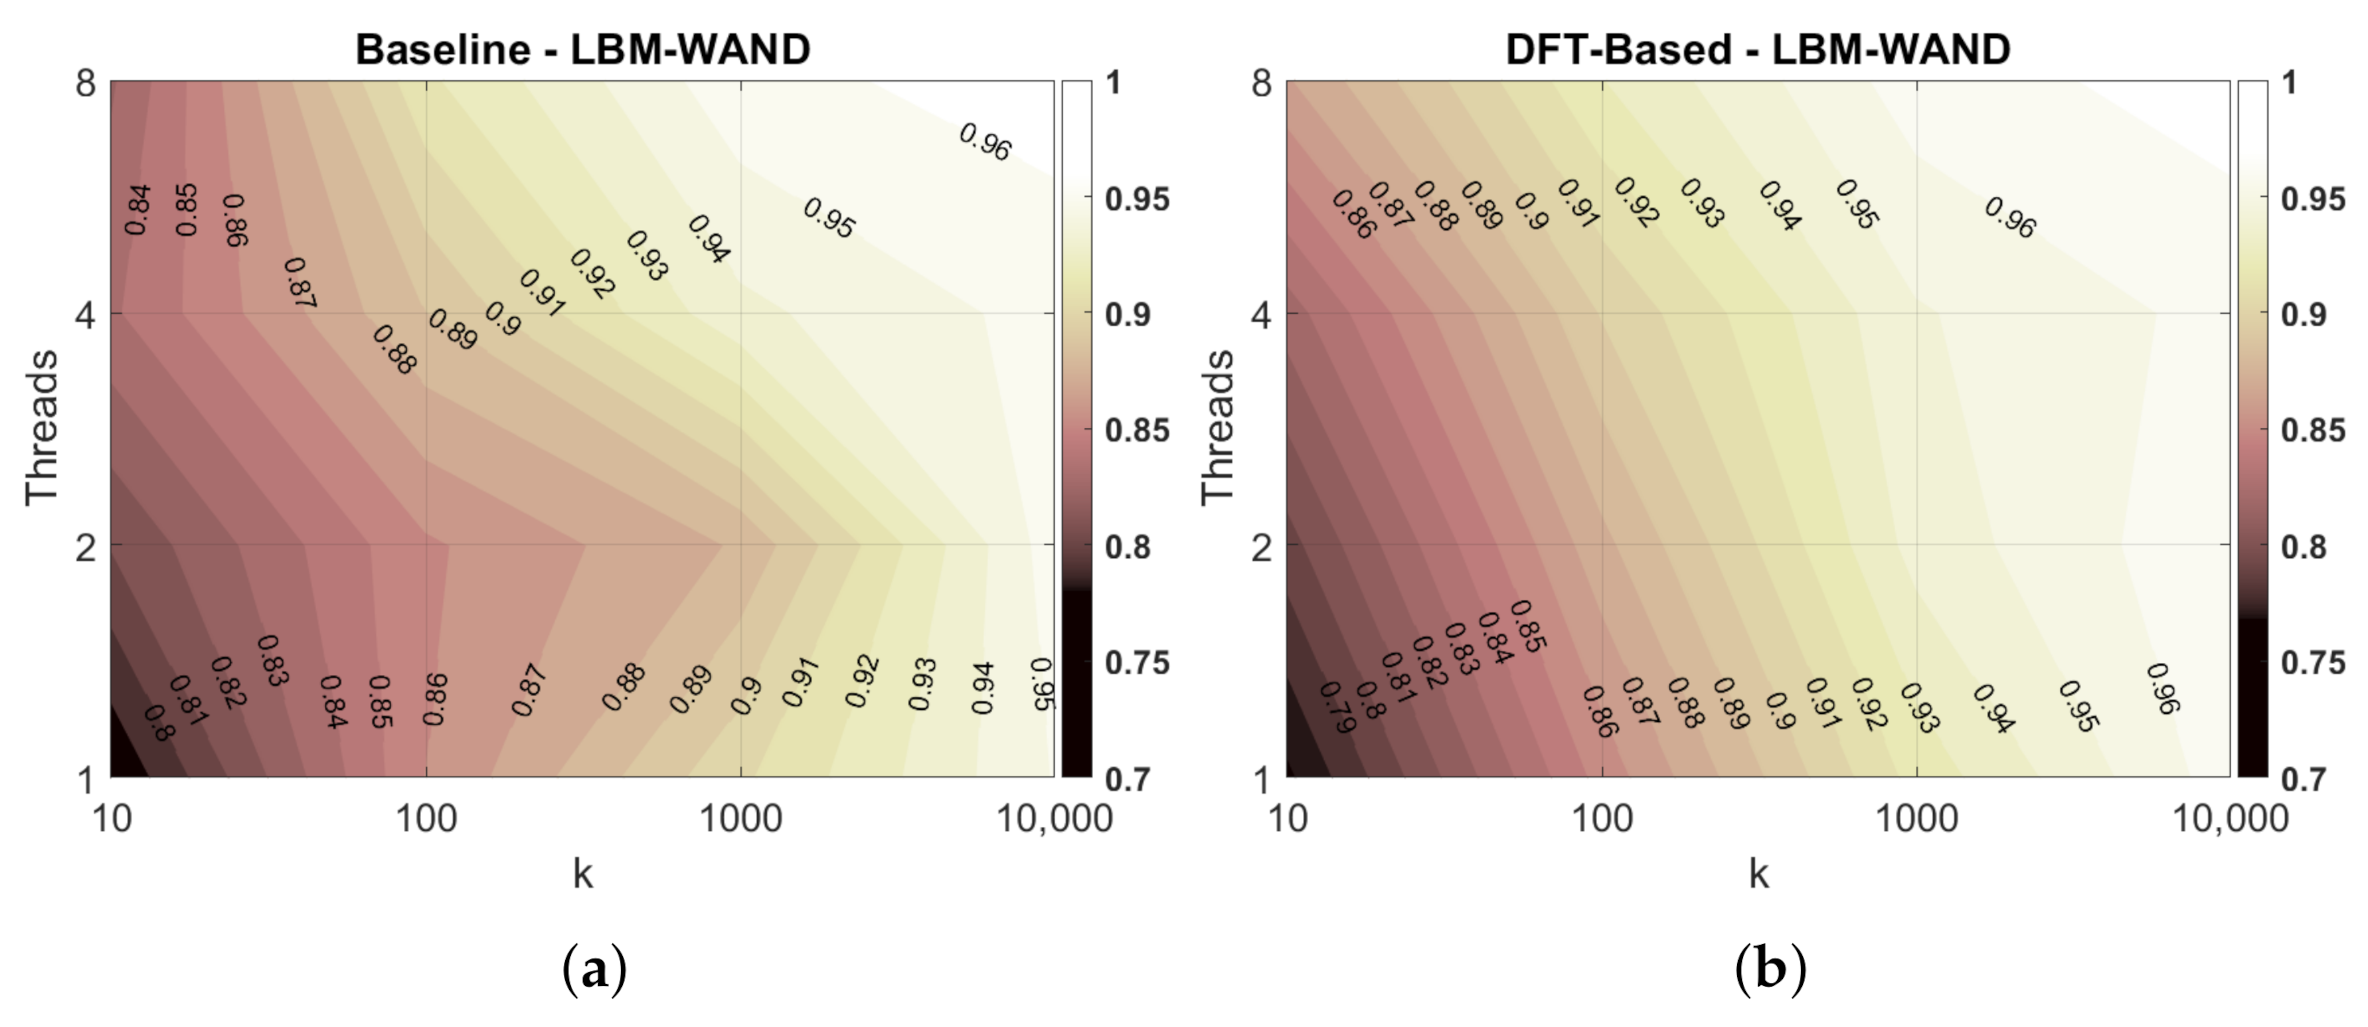
Finally, we show in Figure 6 the Pearson correlation reported by the baseline and the DFT-based algorithm with different values for top-k document results and different number of threads. The y-axis (left) shows the number of threads ranging from 1 to 8. The y-axis (right) shows the Pearson correlation from 80% to 100%. The x-axis shows the k values from 10 to 10,000. We show results obtained with the LMB-WAND strategy. Similar results were obtained for the SBM-WAND strategy. For k = 10 , both prediction algorithms report similar results. With a larger k value, the DFT-based algorithm reports better results. On the other hand, as we increase the number of threads the Pearson correlation reported by both algorithms is slightly reduced. However, the lost in the correlation is very small, less than 5%.

5.5.2. Performance Evaluation of the DFT-Based Algorithm under Multi-Threaded Query Processing

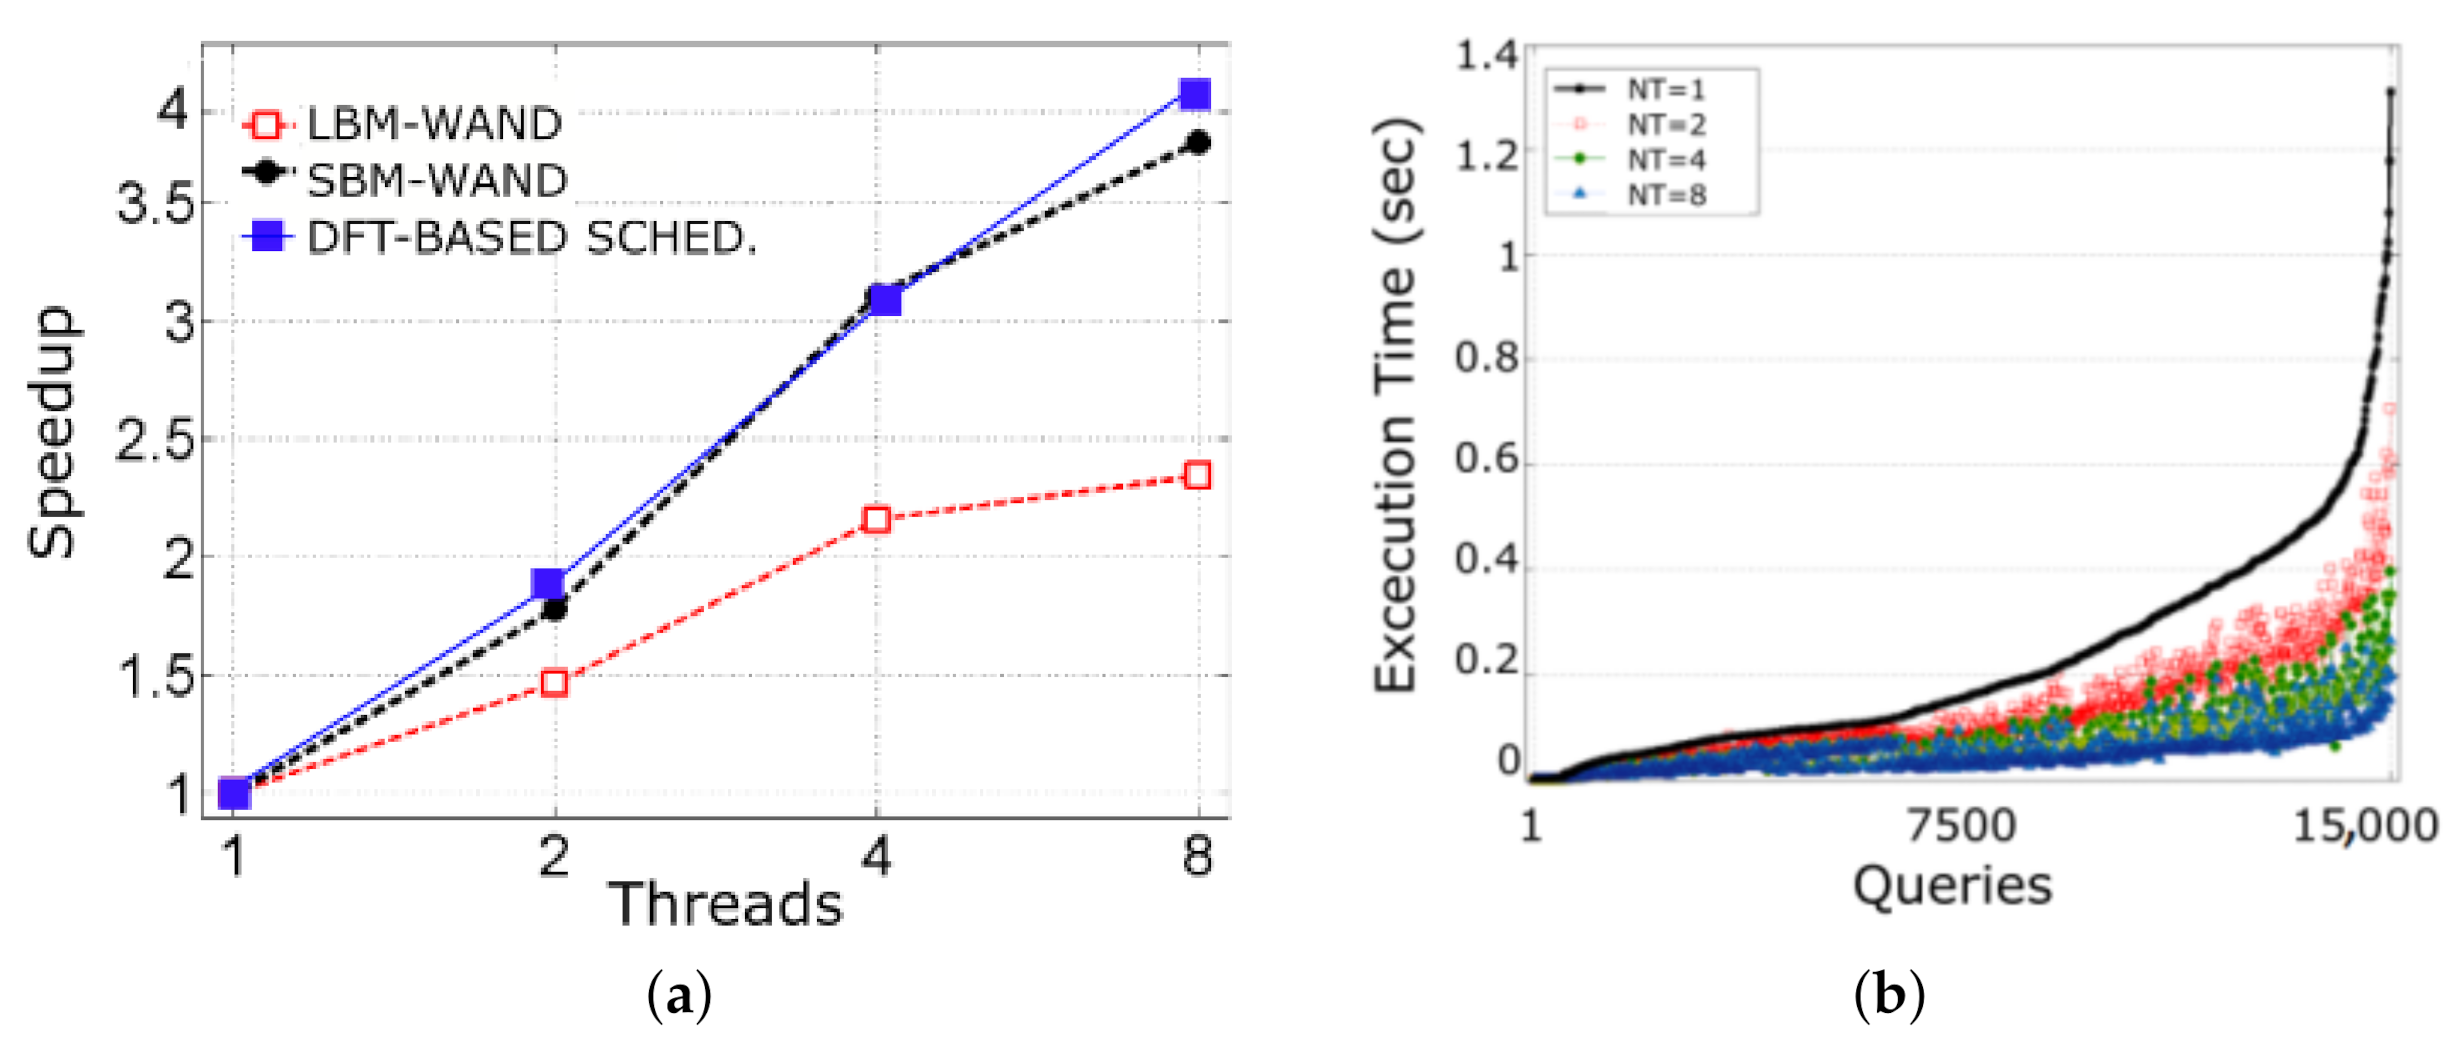
In this section, we present the efficiency reported by the LBM-WAND, the LBM-WAND multi-thread strategies and a DFT-based scheduler as described in previous section. The Scheduler uses the DFT-based algorithm to estimate the query running time to decide whether to use the LBM-WAND or the SBM-WAND strategy. We show results for different number of threads ranging from 1 to 8, for the BM-WAND pruning algorithm and the ClueWeb09 dataset.
Figure 7a shows that the speedup reported by the SBM-WAND drastically improves the speedup reported by the LBM-WAND strategy. For eight threads, the SBM-WAND almost doubles the speed-up reported by the LSB-WAND. Additionally, the DFT-based Scheduler algorithm reports speedups slightly higher than the SBM-WAND.
Finally, in Figure 7b, we present the execution times in seconds with different number of threads. The x-axis shows the queries identifiers ordered according to their execution time from lowest (left) to highest (right). Results show that query execution times tends to decrease with a larger number of threads.

6. Conclusions

We have presented a new query running time prediction algorithm based on the DFT for the WAND and BM-WAND document ranking algorithms. The design of the proposed predictor is based on the application of the discrete Fourier transform (DFT) to describe the key features affecting the query running time in the frequency domain. The DFT is executed off-line to compute a total of five descriptor attributes for each posting list in the inverted index. At run time, a query content attribute is computed to extend the respective five posting list attributes and to form a 6-dimensional vector which is then used as an input for a feed-forward neural network with back-propagation to estimate the query running time.
We evaluated the DFT-based prediction algorithm with different learning methods and also under the effects of concurrency control for accesses to shared data in two multi-threaded query processing strategies that may be used in combination. The results show that the proposed prediction algorithm is more efficient in running time and memory consumption than the baseline algorithm and it is able to achieve average reductions of (i) 7% for the average absolute error between the actual running time and the predicted running time, and (ii) 26% for the maximum absolute error.

Author Contributions

Investigation, V.G.-C.; Software, O.R.; Supervision, M.M. All authors have read and agreed to the published version of the manuscript.

Funding

This work has been partially funded by the Chilean Agency for Research and Development (ANID) under grant Basal Centre CeBiB code FB0001.

Data Availability Statement

Not Applicable, the study does not report any data.

Conflicts of Interest

The authors declare no conflict of interest.

References

  1. Akdere, M.; Çetintemel, U.; Riondato, M.; Upfal, E.; Zdonik, S.B. Learning-based Query Performance Modeling and Prediction. In Proceedings of the IEEE International Conference on Data Engineering, Arlington, VA, USA, 1–5 April 2012; pp. 390–401. [Google Scholar]
  2. Ganapathi, A.; Kuno, H.; Dayal, U.; Wiener, J.L.; Fox, A.; Jordan, M.; Patterson, D. Predicting Multiple Metrics for Queries: Better Decisions Enabled by Machine Learning. In Proceedings of the Conference on Data Engineering, Shanghai, China, 29 March–2 April 2009; pp. 592–603. [Google Scholar]
  3. Gupta, C.; Mehta, A.; Dayal, U. PQR: Predicting Query Execution Times for Autonomous Workload Management. In Proceedings of the Conference on Autonomic Computing, Chicago, IL, USA, 2–6 June 2008; pp. 13–22. [Google Scholar]
  4. Kleerekoper, A.; Navaridas, J.; Luján, M. Can the Optimizer Cost be Used to Predict Query Execution Times? arXiv 2019, arXiv:1905.00774. [Google Scholar]
  5. Li, J.; König, A.C.; Narasayya, V.; Chaudhuri, S. Robust Estimation of Resource Consumption for SQL Queries Using Statistical Techniques. Very Large Data Base Endow. 2012, 5, 1555–1566. [Google Scholar] [CrossRef] [Green Version]
  6. Singhal, R.; Nambiar, M. Predicting SQL Query Execution Time for Large Data Volume. In Proceedings of the International Database Engineering Applications Symposium, Montreal, QC, Canada, 11–13 July 2016; pp. 378–385. [Google Scholar]
  7. Wu, W.; Chi, Y.; Zhu, S.; Tatemura, J.; Hacigümüs, H.; Naughton, J.F. Predicting query execution time: Are optimizer cost models really unusable? In Proceedings of the International Conference on Data Engineering, Brisbane, QLD, Australia, 8–12 April 2013; pp. 1081–1092. [Google Scholar]
  8. Baeza-Yates, R.; Ribeiro-Neto, B. Modern Information Retrieval; ACM Press/Addison-Wesley: Boston, MA, USA, 1999. [Google Scholar]
  9. Zobel, J.; Moffat, A. Inverted files for text search engines. ACM Comput. Surv. 2006, 38, 1–56. [Google Scholar] [CrossRef]
  10. Macdonald, C.; Tonellotto, N.; Ounis, I. Learning to Predict Response Times for Online Query Scheduling. In Proceedings of the ACM SIGIR Conference on Research and Development in Information Retrieval, Portland, OR, USA, 12–16 August 2012; pp. 621–630. [Google Scholar]
  11. Rojas, O.; Gil-Costa, V.; Marin, M. Running Time Prediction for Web Search Queries. In Proceedings of the Parallel Processing and Applied Mathematics, Krakow, Poland, 6–9 September 2015; pp. 210–220. [Google Scholar]
  12. Badue, C.S.; Almeida, J.M.; Almeida, V.; Baeza-Yates, R.A.; Ribeiro-Neto, B.A.; Ziviani, A.; Ziviani, N. Capacity Planning for Vertical Search Engines. arXiv 2010, arXiv:1006.5059. [Google Scholar]
  13. Gil-Costa, V.; Inostrosa-Psijas, A.; Marin, M.; Feuestein, E. Service Deployment Algorithms for Vertical Search Engines. In Proceedings of the Euromicro International Conference on Parallel, Distributed, and Network-Based Processing, Belfast, UK, 27 February–1 March 2013; pp. 140–147. [Google Scholar]
  14. Barroso, L.A.; Dean, J.; Hölzle, U. Web Search for a Planet: The Google Cluster Architecture. IEEE Micro 2003, 23, 22–28. [Google Scholar] [CrossRef] [Green Version]
  15. Marin, M.; Gil-Costa, V.; Gomez-Pantoja, C. New caching techniques for web search engines. In Proceedings of the HPDC, Chicago, IL, USA, 21–25 June 2010; pp. 215–226. [Google Scholar]
  16. Marin, M.; Gil-Costa, V.; Bonacic, C.; Inostrosa-Psijas, A. Simulating Search Engines. Comput. Sci. Eng. 2017, 19, 62–73. [Google Scholar] [CrossRef]
  17. Broder, A.Z.; Carmel, D.; Herscovici, M.; Soffer, A.; Zien, J.Y. Efficient query evaluation using a two-level retrieval process. In Proceedings of the Conference on Information and Knowledge Management, New Orleans, LA, USA, 3–8 November 2003; pp. 426–434. [Google Scholar]
  18. Ding, S.; Suel, T. Faster top-k document retrieval using block-max indexes. In Proceedings of the ACM SIGIR Conference on Research and Development in Information Retrieval, Beijing, China, 24–28 July 2011; pp. 993–1002. [Google Scholar]
  19. Chakrabarti, K.; Chaudhuri, S.; Ganti, V. Interval-based pruning for top-k processing over compressed lists. In Proceedings of the International Conference on Data Engineering, Hannover, Germany, 11–16 April 2011; pp. 709–720. [Google Scholar]
  20. Tonellotto, N.; Macdonald, C.; Ounis, I. Query Efficiency Prediction for Dynamic Pruning. In Proceedings of the Large-Scale and Distributed Informational Retrieval, Glasgow, UK, 28 October 2011; pp. 3–8. [Google Scholar]
  21. Freire, A.; Macdonald, C.; Tonellotto, N.; Ounis, I.; Cacheda, F. Scheduling Queries Across Replicas. In Proceedings of the ACM SIGIR Conference on Research and Development in Information Retrieval, Portland, OR, USA, 12–16 August 2012; pp. 1139–1140. [Google Scholar]
  22. Cronen-Townsend, S.; Zhou, Y.; Croft, W.B. Predicting Query Performance. In Proceedings of the ACM SIGIR Conference on Research and Development in Information Retrieval, Tampere, Finland, 11–15 August 2002; pp. 299–306. [Google Scholar]
  23. Peng, Z.; Plale, B. A Multi-tenant Fair Share Approach to Full-text Search Engine. In Proceedings of the Data-Intensive Computing in the Cloud, Salt Lake City, UT, USA, 14 November 2016; pp. 45–50. [Google Scholar]
  24. Tonellotto, N.; Macdonald, C. Using an Inverted Index Synopsis for Query Latency and Performance Prediction. ACM Trans. Inf. Syst. 2020, 38, 1–33. [Google Scholar] [CrossRef]
  25. Jeon, M.; Kim, S.; Hwang, S.W.; He, Y.; Elnikety, S.; Cox, A.L.; Rixner, S. Predictive Parallelization: Taming Tail Latencies in Web Search. In Proceedings of the ACM SIGIR Conference on Research and Development in Information Retrieval, Gold Coast, QLD, Australia, 6–11 July 2014; pp. 253–262. [Google Scholar]
  26. Kim, S.; He, Y.; Hwang, S.W.; Elnikety, S.; Choi, S. Delayed-Dynamic-Selective (DDS) Prediction for Reducing Extreme Tail Latency in Web Search. In Proceedings of the Conference on Web Search and Data Mining, Shanghai, China, 2–6 February 2015; pp. 7–16. [Google Scholar]
  27. Hwang, S.W.; Kim, S.; He, Y.; Elnikety, S.; Choi, S. Prediction and Predictability for Search Query Acceleration. ACM Trans. Web 2016, 10, 19:1–19:28. [Google Scholar] [CrossRef]
  28. Tonellotto, N.; Macdonald, C.; Ounis, I. Efficient and Effective Retrieval Using Selective Pruning. In Proceedings of the ACM International Conference on Web Search and Data Mining, Rome, Italy, 4–8 February 2013; pp. 63–72. [Google Scholar]
  29. Rojas, O.; Gil-Costa, V.; Marin, M. Efficient Parallel Block-Max WAND Algorithm. In Proceedings of the Euro-Par, Aachen, Germany, 26–30 August 2013; pp. 394–405. [Google Scholar]
  30. Bonacic, C.; Bustos, D.; Gil-Costa, V.; Marin, M.; Sepulveda, V. Multithreaded Processing in Dynamic Inverted Indexes for Web Search Engines. In Proceedings of the Large-Scale and Distributed Systems for IR, Melbourne, VIC, Australia, 23 October 2015; pp. 15–20. [Google Scholar]
  31. Culpepper, J.S.; Clarke, C.L.A.; Lin, J. Dynamic Cutoff Prediction in Multi-Stage Retrieval Systems. In Proceedings of the Australasian Document Computing Symposium, Caulfield, VIC, Australia, 5–7 December 2016; pp. 17–24. [Google Scholar]
  32. Wu, H.; Fang, H. Analytical Performance Modeling for Top-K Query Processing. In Proceedings of the Information and Knowledge Management, Shanghai, China, 3–7 November 2014; pp. 1619–1628. [Google Scholar]
  33. Rosset, C.; Jose, D.; Ghosh, G.; Mitra, B.; Tiwary, S. Optimizing Query Evaluations Using Reinforcement Learning for Web Search. In Proceedings of the ACM SIGIR Conference on Research and Development in Information Retrieval, Ann Arbor, MI, USA, 8–12 July 2018; pp. 1193–1196. [Google Scholar]
  34. Doudpota, S.; Guha, S.; Baber, J. Mining movies for song sequences with video based music genre identification system. Inf. Process. Manag. 2013, 49, 529–544. [Google Scholar] [CrossRef]
  35. Warren Liao, T. Clustering of Time Series Data-a Survey. Pattern Recogn. 2005, 38, 1857–1874. [Google Scholar] [CrossRef]
  36. Zhou, Y.; Wu, Z.; Zhou, Y.; Hu, M.; Yang, C.; Qin, J. Exploring Popularity Predictability of Online Videos With Fourier Transform. IEEE Access 2019, 7, 41823–41834. [Google Scholar] [CrossRef]
  37. Park, L.A.F.; Ramamohanarao, K.; Palaniswami, M. Fourier domain scoring: A novel document ranking method. IEEE Trans. Knowl. Data Eng. 2004, 16, 529–539. [Google Scholar] [CrossRef]
  38. Zhang, H.; Bie, S.; Luo, B. Classifying web documents using term spectral transforms and Multi-Dimensional Latent Semantic representation. In Proceedings of the Joint Conference on Neural Networks, Beijing, China, 6–11 July 2014; pp. 1320–1327. [Google Scholar]
  39. Pryczek, M.; Szczepaniak, P.S. On Textual Documents Classification Using Fourier Domain Scoring. In Proceedings of the Web Intelligence, Hong Kong, China, 18–22 December 2006; pp. 773–777. [Google Scholar]
  40. Ambardar, A. Analog and Digital Signal Processing, 2nd ed.; Thomson: Singapore, 1999. [Google Scholar]
Figure 1. (a) Query processing in a WSE and (b) inside an index service processor.
Futureinternet 13 00204 g001
Figure 2. Average execution time in milliseconds (ms) reported by the WAND and the BM-WAND algorithms with the (a) ClueWeb09 and the (b) Gov2 Web collections.
Futureinternet 13 00204 g002
Figure 3. Running time of individual queries in milliseconds sorted from low to high values. (a) Results obtained with the WAND algorithm. (b) Results obtained with the BM-WAND algorithm.
Futureinternet 13 00204 g003
Figure 4. Scheme of the DFT-based query running time prediction algorithm.
Futureinternet 13 00204 g004
Figure 5. At left side is the LBM-WAND strategy. At right side is the SBM-WAND strategy where all threads share a global heap.
Futureinternet 13 00204 g005
Figure 6. Pearson Correlation reported by the baseline and the DFT-based prediction algorithm with the LBM-WAND multi-thread strategy and (a) the Baseline prediction algorithm and (b) the DFT-Based prediction algorithm.
Futureinternet 13 00204 g006
Figure 7. (a) Speedup reported by the LBM-WAND, the SBM-WAND query processing strategies and the DFT-based scheduler. (b) Execution time in seconds reported with up to 8 threads by the DFT-based scheduler.
Futureinternet 13 00204 g007
Table 1. Description of the technical words.
Tech./AcronymDescription
BM25Ranking function to estimate the relevance of documents.
BM-WANDBlock-Max WAND. Optimized pruning technique that discard
not relevant documents for a query.
It uses compressed data organized in blocks.
ClueWeb09Collection of 428,136,613 unique documents.
CSCache-Service. It is a service component of a WSE.
DFTDiscrete Fourier Transform
FSFront-Service. It is a service component of a WSE.
Gov2Collection of 25.2 million documents.
ISIndex Service. It is a service component of a WSE.
LBM-WANDLocal BM-WAND multi-thread strategy.
PSDPower Spectral Density
SBM-WANDShared BM-WAND multi-thread strategy.
TF-idfRanking function to estimate the relevance of documents.
top-kBest document results for a query
WANDWeighted AND. Pruning technique used to discard
not relevant documents for a query.
WSEWeb Search Engine
Table 2. Term-vector and query-vector descriptors.
Descriptors for Term t
1. ψ 0 : PSD of Φ t at a frequency 1 / 10 .
2. ψ 1 : DFT magnitude of Rank-Score at a frequency 1 / 4 .
3. ψ 2 : # P o s t i n g s
4. ψ 3 : DFT magnitude for the processing times.
5. ψ 4 : score value for the k-th document in the term list (score ( k , t )).
Query Descriptors Ψ q
1. x 0 : t q t ψ 0
2. x 1 : t q t ψ 1
3. x 2 : t q t ψ 2
4. x 3 : t q t ψ 3
5. x 4 : max t q { t ψ 1 }
6. x 5 : max t q { t ψ 4 }
Table 3. Accuracy obtained by the proposed DFT-based query running time prediction algorithm using different machine learning methods.
CueWeb09Gov2
BM25TF-IDFBM25TF-IDF
RMSEVCPrCRMSEVCPrCRMSEVCPrCRMSEVCPrC
10-folds
Linear0.151.1%0.880.101.7%0.940.122.2%0.880.140.8%0.96
MV0.054.0%0.880.026.8%0.940.044.3%0.880.042.7%0.96
EML-50.0612.5%0.830.0312.2%0.930.058.3%0.830.0314.3%0.94
BP-50.045.5%0.930.0111.4%0.980.035.4%0.940.028.5%0.98
RF0.045.2%0.930.0115.2%0.980.039.7%0.950.028.2%0.98
SVM0.150.9%0.920.102.0%0.960.121.6%0.930.141.2%0.95
5-folds
Linear0.150.3%0.880.100.9%0.940.121.9%0.880.141.0%0.96
MV0.052.04%0.880.024.0%0.940.042.2%0.880.042.8%0.96
EML-50.0718.9%0.790.039.4%0.920.0510.0%0.80.0417.4%0.93
BP-50.044.0%0.920.017.1%0.980.036.2%0.930.023.2%0.98
RF0.043.8%0.930.0211.7%0.980.035.5%0.950.026.3%0.98
SVM0.150.7%0.920.101.0%0.950.120.9%0.930.140.5%0.95
3-folds
Linear0.151.1%0.880.100.7%0.940.120.9%0.880.140.3%0.96
MV0.050.9%0.880.022.3%0.940.041.2%0.880.042.0%0.96
EML-50.064.0%0.850.034.3%0.930.047.4%0.870.0310.6%0.94
BP-50.041.9%0.920.011.1%0.980.033.3%0.930.024.4%0.98
RF0.042.1%0.930.028.7%0.980.035.8%0.940.023.9%0.98
SVM0.150.4%0.920.100.6%0.950.120.8%0.920.140.5%0.95
2-folds
Linear0.150.2%0.880.100.3%0.940.120.3%0.880.140.3%0.96
MV0.050.6%0.880.020.9%0.940.043.1%0.880.040.4%0.96
EML-50.065.0%0.840.024.7%0.940.056.5%0.840.030.8%0.95
BP-50.042.1%0.920.024.1%0.980.034.6%0.930.022.3%0.98
RF0.042.0%0.930.027.3%0.970.035.3%0.940.025.8%0.98
SVM0.150.2%0.920.100.2%0.950.120.8%0.920.141.1%0.94
Table 4. Accuracy for a training fold of 60% and a test fold of 40% with 1 , 5 , 10 , 25 and 50 neurons in the hidden layer.
Neurons in the Hidden Layer
15102550
PrCRMSEPrCRMSEPrCRMSEPrCRMSEPrCRMSE
WAND
ClueWeb09 BM25
Baseline0.9190.0320.9690.0200.9660.0220.9640.0220.9560.025
DFT-based0.7690.0520.9790.0170.9790.0170.9790.0170.9750.018
Gov2 BM25
Baseline0.8600.0390.9250.0300.9230.0300.8950.0350.8740.038
DFT-based0.5930.0620.9470.0250.9490.0240.9480.0240.9470.025
ClueWeb09 TF-IDF
Baseline0.9900.0170.9930.0150.9880.0190.9830.0240.9790.026
DFT-based0.9890.0180.9940.0130.9940.0130.9930.0140.9910.017
Gov2 TF-IDF
Baseline0.9610.0290.9600.0300.9660.0270.9620.0300.9450.035
DFT-based0.9550.0320.9710.0250.9730.0240.9720.0250.9670.027
BM-WAND
ClueWeb09 BM25
Baseline0.8980.0490.9230.0430.9080.0470.8620.0590.8440.063
DFT-based0.8860.0520.9300.0410.9280.0420.9250.0430.9190.044
Gov2 BM25
Baseline0.8980.0390.9240.0340.9110.0380.8770.0460.8720.049
DFT-based0.8850.0420.9370.0310.9280.0340.9200.0360.9180.037
ClueWeb09 TF-IDF
Baseline0.9660.0180.9750.0160.9780.0150.9760.0160.9730.018
DFT-based0.9710.0170.9790.0140.9780.0150.9770.0150.9750.016
Gov2 TF-IDF
Baseline0.9680.0260.9830.0180.9760.0220.9730.0230.9630.028
DFT-based0.9610.0280.9800.0200.9800.0200.9770.0220.9750.023
Table 5. Query running time in seconds obtained with the real execution, the baseline and the proposed prediction algorithms. Numbers in bold font indicate better results.
Data-ScoringRealBaselineDFT-Based
QRT max t QRT max t AAE max e QRT max t AAE max e
WAND
ClueWeb09—BM250.1973.0300.1972.6020.0341.4440.1972.9010.0300.731
Gov2—BM250.1071.7720.1081.7400.0281.7380.1071.5010.0240.609
ClueWeb09—TF-IDF0.7314.8670.7344.8670.0334.0940.7304.0770.0301.075
Gov2—TF-IDF0.3703.4860.3713.4860.0323.1660.3692.8470.0291.034
BM-WAND
ClueWeb09—BM250.1331.0620.1330.8390.0250.3760.1340.9090.0250.370
Gov2—BM250.0740.8810.0750.8110.0150.7500.0750.5630.0140.362
ClueWeb09—TF-IDF0.0640.6920.0640.4920.0060.3090.0640.5990.0050.253
Gov2—TF-IDF0.0660.4110.0660.3360.0050.0980.0660.3830.0050.178
Table 6. Running time in nanoseconds reported by both the proposed algorithm and the baseline algorithm. The best results are highlighted in boldface type.
Vector Construction TimeNeuronal Network
Algorithm2 terms5 terms5 neurons10 neurons25 neurons50 neurons
Baseline22,129 ns31,429 ns6844 ns9150 ns14,108 ns23,397 ns
DFT-based2095 ns2376 ns4610 ns5238 ns6984 ns8894 ns
Table 7. Memory consumption per query in bytes required to store the descriptors of the term-vectors and the query-vectors.
Term-VectorQuery-VectorTotal
Baseline92 Bytes213 Bytes305 Bytes
DFT-based45 Bytes46 Bytes91 Bytes
Table 8. Prediction ability of the baseline and proposed algorithms for query running time prediction under two multi-threaded query processing strategies for different number of threads. For each case the best value for Pearson Correlation (PrC) and error RMSE are indicated in boldface type. The smallest RMSE values are indicated with *. The correlation and error values are obtained by comparing against the actual implementation of each multi-threaded query processing strategy: LBM-WAND (L) and SBM-WAND (S) both executed under ClueWeb09-BM25.
Neurons in the Hidden Layer
15102550
PrCRMSEPrCRMSEPrCRMSEPrCRMSEPrCRMSE
LBM-WAND (L)/SBM-WAND (S)
1 thread
Baseline-L/S0.8980.0490.9230.0430.9080.0470.8620.0590.8440.063
DFT-based-L/S0.8860.0520.930* 0.0410.9280.0420.9250.0430.9190.044
2 threads
Baseline-L0.9120.0470.9320.0420.9250.0440.8940.0520.8760.058
DFT-based-L0.8960.0510.944* 0.0380.9400.0390.9410.0390.9180.046
Baseline-S0.8970.0510.9010.0500.8910.0540.8610.0620.8130.074
DFT-based-S0.8800.0550.926* 0.0430.9290.0430.9060.0490.9030.050
4 threads
Baseline-L0.9200.0440.9450.0370.9280.0430.9210.0450.8840.055
DFT-based-L0.9020.0480.9480.0350.951* 0.0340.9490.0350.9280.042
Baseline-S0.8970.0520.9050.0500.9010.0510.8650.0610.8530.064
DFT-based-S0.8750.0560.926* 0.0440.9270.0440.9250.0440.9180.047
8 threads
Baseline-L0.9390.0350.9550.0310.9540.0310.9480.0340.9220.042
DFT-based-L0.9270.0390.9560.0300.9630.0280.967* 0.0260.9540.031
Baseline-S0.9130.0500.9360.0430.9270.0460.9020.0530.8910.057
DFT-based-S0.8920.0550.938* 0.0420.9380.0420.9250.0470.9190.048
Table 9. Results obtained under ClueWeb09-BM25 with the actual execution of the multi-threaded query solution algorithms LBM-WAND (L) and SBM-WAND (S), and the respective query running time predictions delivered by the proposed and baseline algorithms.
5 Neurons in the Hidden Layer
RealBaselineDFT-Based
ThreadsQRT max t QRT max t AAE max e QRT max t AAE max e
1T-L/S0.1331.0620.1330.8390.0250.3760.1340.9090.0250.370
2T-L0.0910.6680.0910.5060.0160.2830.0910.4920.0140.256
2T-S0.0750.5860.0760.4220.0150.4890.0750.3640.0140.222
4T-L0.0620.4240.0620.3560.0090.1910.0610.3530.0080.148
4T-S0.0430.3230.0430.2630.0080.3050.0430.1950.0080.132
8T-L0.0570.4060.0560.4030.0070.2040.0560.2960.0060.196
8T-S0.0360.2560.0350.2400.0060.1040.0340.2060.0060.093
Publisher’s Note: MDPI stays neutral with regard to jurisdictional claims in published maps and institutional affiliations.

