Article

Mobile Application to Provide Traffic Congestion Estimates and Tourism Spots to Promote Additional Stopovers

1
Faculty of Information Networking for Innovation and Design, Toyo University, Tokyo 115-0053, Japan
2
Department of Civil Engineering, Shibaura Institute of Technology, Tokyo 135-8548, Japan
3
Department of Tourism Science, Tokyo Metropolitan University, Hino 192-0397, Japan
4
NAVITIME Japan Co., Ltd., Tokyo 107-0062, Japan
*
Author to whom correspondence should be addressed.
Future Internet 2020, 12(5), 83; https://doi.org/10.3390/fi12050083
Submission received: 19 February 2020 / Revised: 23 April 2020 / Accepted: 28 April 2020 / Published: 29 April 2020
(This article belongs to the Special Issue Selected Papers from ICITE 2019)

Abstract

:
In Japan, traffic congestions often occur on the expressways connecting tourism areas with the Tokyo metropolitan area. This congestion can be mitigated if tourists delayed their departure of homeward trips to avoid peak traffic hours. A potential method to promote staggered departure times is providing the estimates of near-future traffic congestion. This study hypothesized and experimentally confirmed that some tourists would delay their departure to avoid traffic based on near-future traffic estimates. The experiment was conducted in the Yatsugatake area using a mobile application that provided this information to tourists. The results suggest that approximately 40% of self-driving tourists will perform an additional stopover if the returning route is congested and near-future traffic congestion estimate is provided.

1. Introduction

One of the biggest challenges in the transportation sector is addressing traffic congestion on expressways. In Japan, traffic congestion is often caused by traffic moving from surrounding tourism spots toward the Tokyo metropolitan area; the number of vehicles tend to increase on Sundays and the last day of consecutive holidays. This results in tourists losing time and also negatively impacts tourism as travelers return early to avoid traffic congestion.
A potential solution to reduce traffic congestion is to promote delayed departure for tourists. While the construction of new roads can potentially ease congestion, it is time-consuming and expensive. However, promoting delayed departures is a behavior change approach, which is inexpensive, effective, and feasible. Kawahara [1] showed that delaying the departure time of vehicles could reduce traffic congestion. A survey of Japanese tourists showed that over 60% of respondents would change their departure time based on traffic congestion information [2]. Additionally, delaying departure from tourist spots could potentially increase consumer activity, which may not have been initially planned, such as shopping or eating at restaurants. In this study, such unplanned activities are referred to as “additional stopovers”.
In recent years, the increased use of smartphones and mobile applications has made it easier to provide real-time information to consumers. Such applications have been used to promote socially desirable behavior in various fields [3,4], including the transportation tourism sectors (e.g., [5,6]). If tourists are provided with traffic congestion information tailored to their homeward journey via mobile applications, they may delay their departure to avoid traffic.
Prior studies on this subject examined the Global Positioning System (GPS) trajectory data (mobile probe data) of tourists in the Yamanashi prefecture of Japan and demonstrated that self-driving tourists tend to make additional stopovers to avoid congestion [7]. These studies provided indirect evidence showing that the real-time traffic congestion information can increase stopovers. However, these studies also reported results of situations where no estimated near-future traffic information was provided. Moreover, the reasons for additional stopovers could not be explained using the existing datasets. Thus, an experimental approach is necessary to verify the effect of providing near-future traffic estimates on reducing congestion and promoting tourism.
This study aimed to provide empirical evidence to demonstrate the effectiveness of providing real-time traffic congestion estimates to increase tourism-related additional stopovers. For this, the authors tested and confirmed the following hypothesis through a field experiment.
Hypothesis 1.
Self-driving tourists will make additional stopovers to delay their departure and avoid traffic if near-future traffic congestion estimation is provided.
A mobile application was developed to provide information on real-time traffic congestion estimation and nearby tourism spots, for self-driving tourists in Yatsugatake, Japan, to understand its impact on their stopover behavior. Existing traffic congestion data indicate that congestion is at a peak between 16:00 and 17:00 approximately, and it gradually reduces after that. Therefore, delaying departure times during peak hours would potentially reduce the travel time for returning home. The mobile application offers options such as “depart now” and “depart later”, along with the estimated travel time required to reach the intended destination. The user’s operation logs their travel trajectory, and post-experiment questionnaire results were obtained via the application.
The aim of this study was to provide evidence to demonstrate the effectiveness of information intervention to travel and tourism behaviors, while also providing empirical evidence that actual stopover behavior can be inferred from smartphone application operation logs. This finding eliminates the need for GPS trajectory data to determine the effectiveness of such interventions and eases the process of conducting such experiments from the viewpoint of personal information protection.
The remainder of this paper is organized as follows. Section 2 delves into related previous studies, including tourist behavior studies using GPS trajectory data and intervention studies using mobile applications. In addition, this section describes the advantages of the present study. Section 3 describes the design and implementation of the smartphone application to provide real-time traffic estimation. It also presents methods for field experimentation to demonstrate that actual behavior can be inferred using an application operation log. Section 4 describes the experimental results and discussion. Section 5 presents our conclusions, limitations of the study, and future work.

2. Related Work

As GPS data collection is more accurate and reliable than traditional self-reporting, the use of GPS is common in the field of transportation and tourism [8]. Various studies have analyzed tourist behavior using GPS trajectory data in the transportation and tourism fields [8,9]. Hallo et al. investigated traveler behavior using GPS in case studies of national park visitors [10]. Connell and Page examined car-based tourism in a national park in Scotland and mapped the itineraries of the tourists [11]. They indicated that itinerary mapping could help policy makers understand spatial patterns for tourism planning. Newton et al. investigated the spatial–temporal patterns of vehicular stopping behavior along park roads, indicating that such information is valuable to park managers to better understand and manage visitor flow [12]. Le et al. highlighted the tendency of additional stopover behavior during different departure periods under various congestion conditions, stating the possibility of promoting additional stopovers by providing near-future traffic congestion information [7]. The findings of these studies can help policy makers or managers promote tourism. Nevertheless, these implications were discovered in observations without actual interventions; therefore, it is difficult to conclude that these interventions are effective. The present study tested the effect of interventions via a field experiment.
Mobile applications are used for interventions in broad research areas such as promoting healthy [3,4] and pro-environmental behaviors [13,14] and traffic and tourism research [5,6]. However, a mobile application for stopover promotion has not been designed thus far. Gabrielli et al. described the user-centered design of a mobile application to promote sustainable behaviors in urban mobility, thereby demonstrating that not all users are motivated by environmental concerns and that users desire concrete rewards that are closely related to the target behavior [5]. Siuhi and Mwakalonge listed several mobile applications that could contribute to resolving traffic problems [6]. Certain mobile applications provide real-time traffic information and can reduce traffic congestion. For example, Sigalert.com [15] provides real-time updates on traffic and road speeds for the U.S. 511 Georgia and Atlanta Traffic [16], which is the official traffic application of the Georgia Department of Transportation (DOT). Colorado Roads [17] provides real-time information related to highways in the U.S. state of Colorado such as speeds, travel times, road conditions, incidents, and road closures. However, although such applications are commercialized and found in application stores, none of them target the behavior change of promoting stopovers.

3. Methods

An experiment was conducted using a mobile application developed to provide information on estimated near-future traffic congestion and nearby tourism spots. The application, called “Sui-sui tabi”, which means comfortable to travel in Japanese [18], was provided to participants who were recruited using the method described in the following sub-section. The application operation logs location information at the time of usage, and the driving trajectory (probe data) after the start of navigation, which were recorded after the participants provided their approval for data collection of departure time and stopover behavior. Additionally, data on participants’ personal attributes, stopover spots, consumption behavior, and the reasons for said behavior, among other variables, were collected through a questionnaire after the experiment.

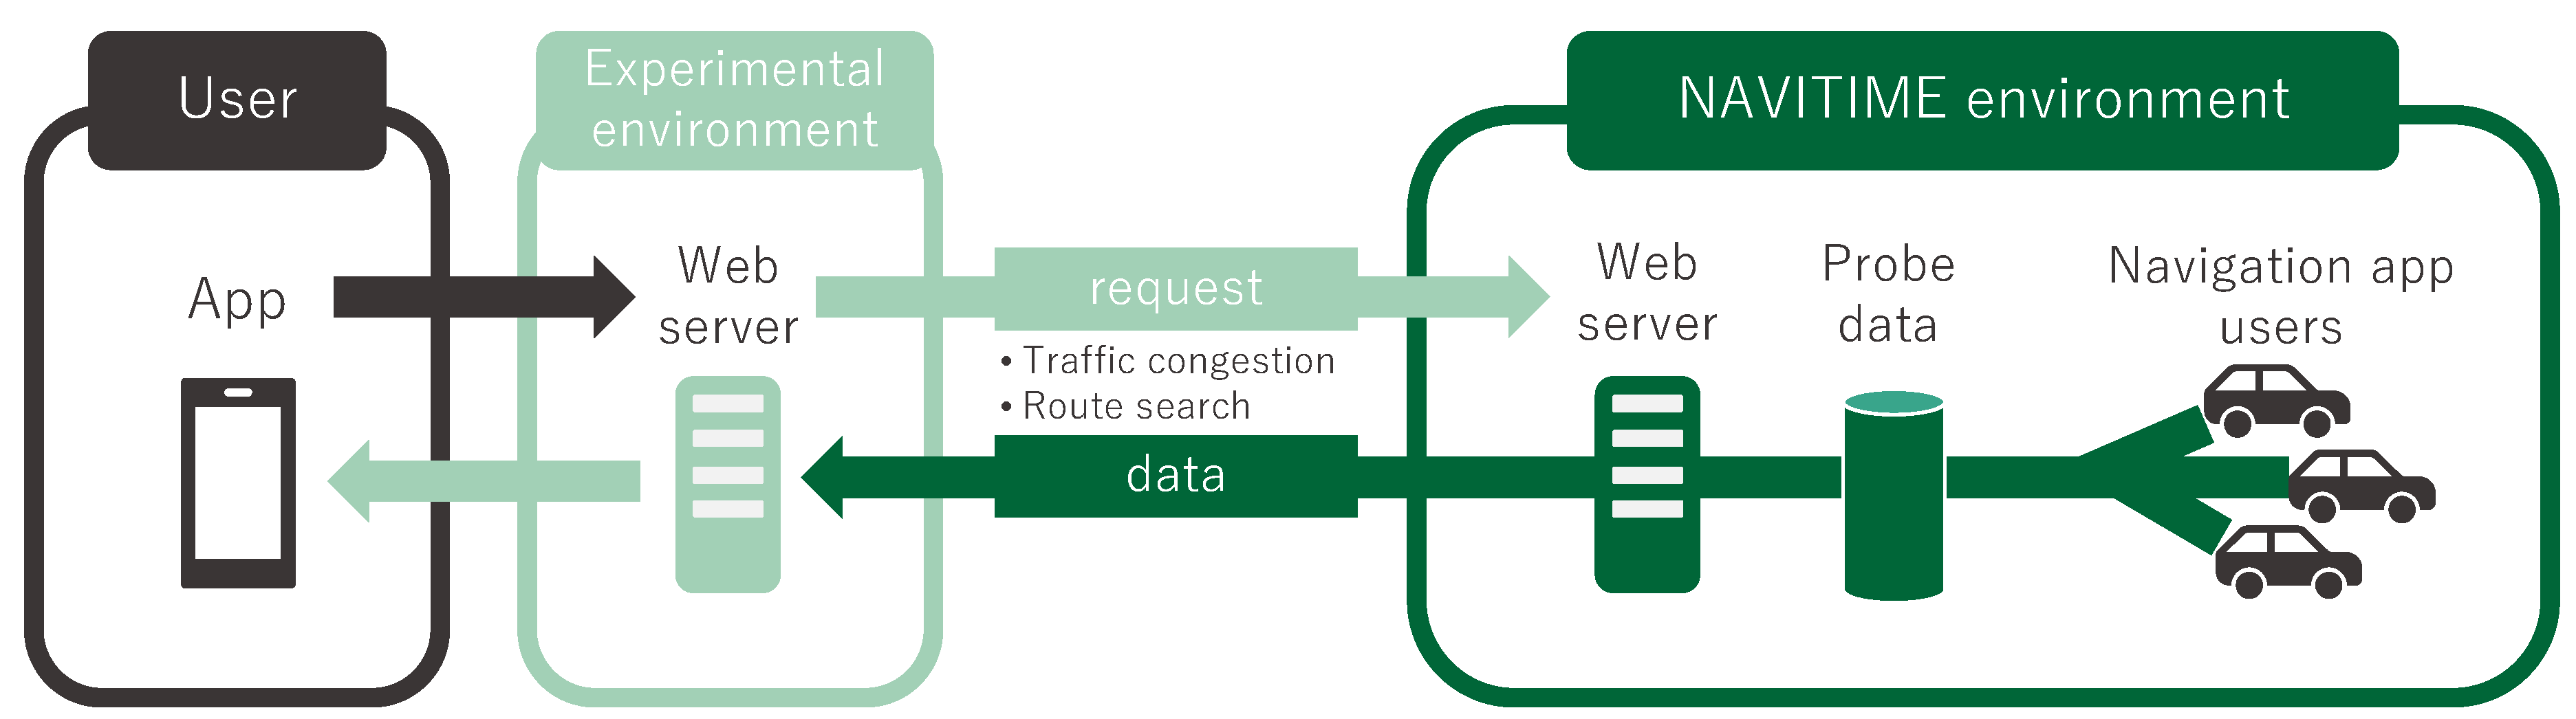
3.1. Experimental Overview

The experiment was conducted for a month, from July 6 to August 6, 2019, during which traffic congestion is known to occur owing to consecutive holidays in Japan. The experimental area was the Yatsugatake area. The experiment focused on tourists who returned to the Tokyo metropolitan area using the Chuo Expressway from the Nagano or Yamanashi Prefectures in Japan. Participants were recruited using leaflets placed at 10 locations in the area under consideration, such as the Kobuchizawa Tourist Information Center road station, Haramura Tourist Information Center, and Fujimi Kogen Resort. Flyers were also distributed at popular tourist spots such as the Yamanashi Prefectural Makiba Park. Participants were also recruited via the Internet prior to the experimental period. The leaflet used in the experiment is provided online [18].
First, the process and purpose of the experiment were explained to the participants, and their approval concerning their participation was obtained. The participants then installed the developed application, which is described in Section 3.3 and Section 3.4, on their mobile phones. On launching the application for the first time, the participants answered questions on personal attributes, their current practice for changing their departure time considering traffic congestion, and their intention to change their departure time using the questionnaire function of the application. They used the application to search for routes to return home and checked the estimated travel times as required. Upon departing, a car navigation application linked with “Sui-sui tabi”, which records the travel trajectory, is launched. After returning home, they completed the post-experiment questionnaire on their actual travel behavior and consumption via the application.

3.2. Application Requirements

The provision of real-time traffic congestion estimation and tourism spots is one of the main functions of the application. The acquisition of locations with participant consent was also an essential requirement of the application to collect data on the travel trajectory (probe data). Additionally, a questionnaire was required to record descriptive information when the participants made a stopover. An experimental application satisfying these requirements was developed before the experimental period.

3.3. Application Use and Data Acquisition Flow

Figure 1 shows the flow and data acquisition process for the mobile application. Participants first input their departure location and destination to find suitable routes to their intended destinations (Route search). Then, the application displays four options: “Depart now”, “Depart after 1 hour”, “Depart after 2 hours”, and “Depart after 3 hours”, along with their respective estimated travel times, taking into account the hourly traffic congestion estimates from the time of route search, as shown in Figure 2a. Then, participants selected an option (Route choice). If an option other than “Depart now” was selected, suggestions for stopovers in the surrounding tourism areas were displayed with the return route as map markers. These stopovers were classified as “restaurants”, “shopping”, “sightseeing spots”, and “hot springs”, as shown at the top of Figure 2b (Spot check).
Detailed information such as business hours, photos, and ratings are also displayed for each location upon selection, as shown in Figure 2b. Only facilities currently open were displayed to improve convenience. If the “depart now" option was selected, the final route confirmation screen was displayed. If a participant decided to stopover, they could choose the expected additional time required (Spot choice). Finally, the travel time from the departure location to the stopover, total stay time, and the required travel time to the final destination, considering the estimated traffic congestion, are displayed as shown in Figure 2c (Route check). When a participant selects the “Start navigation” button, the “Drive Supporter” application (a Japanese car navigation application by Navitime Japan Co., Ltd.) initiates, obtaining driving trajectories using mobile GPS and providing voice navigation (Start navigation).

3.4. Application Implementation

The application was customized for Apple iPhone and Google Android devices owing to their proliferation in Japan. It was developed as a cross-platform application using Microsoft’s Xamarin to ensure the uniformity of user experience across platforms. Figure 3 shows an overview of the application’s architecture. The route search Application Programming Interface (API) developed by NAVITIME Japan Co., Ltd. was used to provide traffic congestion estimates. This API provided information on the route between the specified departure and destination locations and calculated the total travel time based on the estimated road congestion probe data from other users using the NAVITIME application. This provided the application current or future travel times, depending on the specified departure time. The application shows four route search options with different departure and travel time estimates, as shown in Figure 2a; this function differentiates this application from other existing route search applications such as Google maps. Additionally, the application uses the Places API (Google) to provide information on tourism spots. The participant questionnaire and operation log concerning their route search and route choice, among other relevant information, were recorded and transmitted to the webserver.

4. Results and Discussion

4.1. Participants

Seventy-two participants agreed to participate in the experiment and installed the application on their mobile phones. Sixty participants searched for routes to their intended destination using the application and are designated as active participants in this paper. Table 1 provides an overview of the participant attributes, which were obtained via a questionnaire within the application.
The experiment included more male participants than female. This may be because there are more male drivers than female drivers in Japan. According to a Japanese survey on transportation means during holidays, self-driving was selected by 48.9% of males and only 24.2% of females [19]. More than 75% of all participants were between the age of 30 and 59 years. Most participants traveled with their families, and the presence of small children, in particular, could potentially influence stopover behavior during late hours on Sundays or the last day of consecutive holidays. Therefore, the presence or absence of children under elementary school age was also obtained as an individual attribute. The most common purposes of travel were sightseeing, homecoming, and visiting friends, i.e., activities that have minor time constraints.
Before the experiment started, the participants’ current practice of considering traffic congestion to adjust the departure time and their intention to change the departure time accordingly were examined using a questionnaire within the application. Figure 4 and Figure 5 show the results of this questionnaire.
Figure 4 shows the answers to questions such as “Do you adjust your departure time considering traffic congestion?” The aggregate of the responses “Sometimes”, “I do”, and “Always” were 90% of the total results. This suggests that participants consider traffic to a large extent. No difference in gender was observed in these responses.
If the participants were accompanied by a family with children in elementary school, their consideration of delaying departure time and their flexibility in changing the time was slightly lower.
Figure 5 shows the answers to the question: “Is it possible to delay the departure time for returning home after sightseeing?” Positive responses accounted for 88% of the total responses, and information regarding traffic congestion was likely to change their behavior. The proportion of positive answers was lower for female participants and participants who had children in elementary school: approximately 70%.

4.2. Analysis of App Operations Logs

The operational logs of the main application screen are listed in Table 2. The number of route selection actions was significantly less than the number of routes searched. This suggests that participants searched for routes multiple times and checked the estimated traffic before they departed. Operational logs revealed that participants who checked sightseeing spots chose the spots by receiving information on nearby tourism spots and then confirmed their final route; these participants accounted for approximately 15% of all participants.
Participants checked the required travel times and chose one of the four options (“Depart now”, “Depart after 1 hour”, “Depart after 2 hours”, and “Depart after 3 hours”) for their return journey. These results are shown in Figure 2a. One hundred and fifty operational logs for route selection were extracted and analyzed to identify which option was chosen after the estimated travel time information was provided. As a result, 98 logs displayed “Depart now”, and 52 logs displayed the other departure options.
In addition, operational logs on route choice were extracted when the estimated travel time for other options was shorter than that for the "Depart now" option. Fifty-seven route choice logs were extracted; in 30 logs, “Depart now” was chosen, and in 27 logs, other delay departure options were chosen. The selection ratio of the “Depart now” option and other options is shown in Figure 6; the horizontal axis is the shortened travel time required to return home. If this time was greater more than 20 min, the ratio of selecting the options of delaying the departure was higher. The time of “-20 min” implies that the estimated travel time of a delayed departure trip was 20 min less than the estimated travel time of the "Depart now" option. Furthermore, for “-30 min”, the selection ratio of the decision to delay the departure time was 100%. These results show that the participants were sensitive to the difference in the shortened travel time.

4.3. Analysis of Questionnaire Results and Travel Trajectory

Fifty-seven route selection logs created by 31 participants were analyzed in the previous section. In addition, a post-experiment questionnaire, and the corresponding travel trajectories from 12 participants were also obtained and examined. Table 3 summarizes their route selection logs and actual behavior obtained from the questionnaires and travel trajectory. Data for “Shortened travel time” and “Chosen option” were obtained from the operational logs. “Actual behavior” was confirmed by the results of the questionnaire and the travel trajectory analysis.
The chosen option in the route selection log for 10 of the 12 participants was consistent with their actual behavior, which was a match rate of approximately 83%. This suggests that it is possible to estimate actual stopover behavior from the operational logs.
Five participants, as listed in Table 3, made additional stopovers, for a stopover rate of approximately 41%. In addition, the operational logs showed that 45% of the participants (14 of 31) chose the “Depart later” option. People who chose the “Depart later” option were more likely to stopover. Considering these results, the stopover rate was estimated to be approximately 40%.
Figure 7 summarizes when the participants searched for return routes using the application; the results were obtained using the questionnaire. Ninety-two percent of all participants used the application just before departing for returning home or on the way home. Therefore, if they had not searched for a route at that time, they were likely to depart when the route search was conducted. A stopover performed after the search was carried out was considered as an additional stopover because of the information on estimated traffic congestion and, as such, it was not a planned stopover.

5. Conclusions

In this study, a mobile application to simultaneously provide real-time traffic congestion estimation along with nearby tourism spots was developed. The experiment results showed that if delaying the departure significantly shortened the required travel time for returning home, most users tended to delay their departure. If the estimated travel time could be shortened by 20 min or more, the selection ratio of delaying the departure time was higher than that of departing immediately, and if it was shortened by 30 min or more, 100% of the participants delayed their departure. Thus, it is expected that approximately 40% of people will perform an additional stopover if the returning route is congested and a near-future traffic congestion estimate is provided.
Therefore, the hypothesis that tourists would make additional stopovers to delay their departure is partially supported by the experimental results.
The experimental results show that providing information on estimated near-future traffic congestion and nearby tourism spots promoted stopover behavior. A major contribution of this study is that it empirically confirmed that information interventions are effective in promoting unplanned stopovers when avoiding traffic congestion, especially in the case of tourism-related travel. Moreover, the experimental results revealed that chosen options detected by operation logs showed a high consistency with actual stopover behaviors confirmed by questionnaires and travel trajectory, suggesting the possibility of inferring actual stopover behaviors from smartphone application operation logs. This finding eliminates the need for GPS trajectory data to determine the effectiveness of interventions and eases the process of conducting extensive large-scale experiments in future studies from the viewpoint of personal information protection.
It should be noted that the participants of this experiment had an intention to avoid congestion. It is necessary to reconsider the methodology of the recruitment of participants for future experiments. In addition, the number of active participants was 60, and the experimental period was one month. The number of active participants may seem to be small. The recruitment of participants for this experiment was difficult because it requires personal information such as GPS trajectory data. People hesitated to agree to participate, even if it was clearly stated that the data will be processed such that no individual can be identified. It is expected that the effectiveness of the developed application would enable the increase in the number of users of the application for a more extended experimental period. Therefore, a large-scale and long-term control experiment with more participants is planned in the future.

Author Contributions

Conceptualization, Y.L., S.A. and T.S.; methodology, Y.L. and S.A.; software, S.A. and K.T.; validation, Y.L. and S.A.; formal analysis, Y.L. and S.A.; investigation, Y.L. and S.A.; resources, K.T.; data curation, S.A., Y.L., and K.T.; writing–original draft preparation, S.A. and Y.L.; writing–review and editing, T.S.; visualization, S.A. and Y.L.; supervision, T.S.; project administration, Y.L. and T.S.; funding acquisition, Y.L. All authors have read and agreed to the published version of the manuscript.

Funding

This research was funded by the JSPS (Japan Society for the Promotion of Science) KAKENHI grant number JP18K18286 and The APC was funded by Toyo University.

Acknowledgments

The authors would like to thank the Hachioji division of the Central Nippon Expressway Company for providing the data, and the Yatsugatake Tourism Management Association for their cooperation in conducting the experiment.

Conflicts of Interest

The author declares no conflict of interest.

References

  1. Kuwahara, M. The science of traffic congestion. Noise Control 2003, 27, 431–436. (In Japanese) [Google Scholar]
  2. Central Nippon Expressway Company. Chuo Expressway Congestion Relief Working Group Survey. 2007; (unpublished). (In Japanese) [Google Scholar]
  3. Zhao, J.; Freeman, B.; Li, M. Can mobile phone applications influence people’s health behavior change? An evidence review. J. Med. Internet Res. 2016, 18, e287. [Google Scholar] [CrossRef] [PubMed] [Green Version]
  4. Conroy, D.E.; Yang, C.; Maher, J.P. Behavior change techniques in top-ranked mobile applications for physical activity. Am. J. Prev. Med. 2014, 46, 649–652. [Google Scholar] [CrossRef] [PubMed] [Green Version]
  5. Gabrielli, S.; Maimone, R.; Forbes, P.; Masthoff, J.; Wells, S.; Primerano, L.; Haverinen, L.; Bo, G.; Pompa, M. Designing motivational features for sustainable urban mobility. In CHI ’13 Extended Abstracts on Human Factors in Computing Systems, Paris, France, 2013; ACM Press: New York, NY, USA, 2013; pp. 1461–1466. [Google Scholar] [CrossRef]
  6. Siuhi, S.; Mwakalonge, J. Opportunities, and Challenges of Smart Mobile Applications in Transportation. J. Traffic Transp. Eng. 2016, 3, 582–592. [Google Scholar] [CrossRef] [Green Version]
  7. Le, Y.; Aoyagi, S.; Takahashi, K. Understanding additional stopover behaviors of car tourists: An analysis of combined route search and mobile GPS travel trajectory data. In Proceedings of the 4th International Conference on Intelligent Transportation Engineering (ICITE 2019), Singapore, 5–7 September 2019. [Google Scholar] [CrossRef]
  8. Hallo, J.C.; Beeco, J.A.; Goetcheus, C.; McGee, J.; McGehee, N.G.; Norman, W.C. GPS as a Method for Assessing Spatial and Temporal Use Distributions of Nature-Based Tourists. J. Travel Res. 2012, 51, 591–606. [Google Scholar] [CrossRef]
  9. Li, J.; Xu, L.; Tang, L.; Wang, S.; Li, L. Big data in tourism research: A literature review. Tour. Manag. 2018, 68, 301–323. [Google Scholar] [CrossRef]
  10. Hallo, J.C.; Manning, R.E.; Valliere, W.; Budruk, M. A Case Study Comparison of Visitor Self-reported and GSP Recorded Travel Routes. In Proceedings of the Northeastern Recreation Research Symposium 2004—GTR-NE-326, Newtown Square, PA, USA, 31 March–2 April 2005; pp. 172–177. [Google Scholar]
  11. Connell, J.; Page, S.J. Exploring the spatial patterns of car-based tourist travel in Loch Lomond and Trossachs National Park, Scotland. Tour. Manag. 2008, 29, 561–580. [Google Scholar] [CrossRef] [Green Version]
  12. Newton, J.N.; Newman, P.; Taff, B.D.; D’Antonio, A. Spatial-temporal dynamics of vehicle stopping behavior along a rustic park road. Appl. Geogr. 2017, 88, 94–103. [Google Scholar] [CrossRef]
  13. Froehlich, J.; Tawanna, D.; Predrag, K.; Mankoff, J.; Consolvo, S.; Beverly, H.; Landay, J.A. UbiGreen: Investigating a mobile tool for tracking and supporting green transportation habits, In Proceedings of the 27th International Conference on Human Factors in Computing Systems—CHI 09, Boston, MA, USA, 4–9 April 2009; ACM Press: New York, NY, USA, 2009. [CrossRef]
  14. Aoyagi, S.; Okamura, T.; Ishii, H.; Shimoda, H. Proposal, and evaluation of a method for promoting continuous pro-environmental behavior with moderate communication. Pap. Hum. Interface Soc. 2011, 13, 31–44. (In Japanese) [Google Scholar]
  15. Sigalert.com. Available online: https://apps.apple.com/us/app/sigalert-com-live-traffic-reports/id424889327 (accessed on 24 March 2020).
  16. 511 Georgia & Atlanta Traffic. Available online: https://apps.apple.com/us/app/511-georgia-atlanta-traffic/id584675609 (accessed on 24 March 2020).
  17. Colorado Roads. Available online: https://play.google.com/store/apps/details?id=com.cdot.mobile (accessed on 24 March 2020).
  18. Suisui-tabi. Available online: https://www.suisuitabi.org (accessed on 21 January 2020).
  19. Ministry of Land, Infrastructure, Transport and Tourism, City Bureau, City Planning Survey and Information Office: Movement People in Cities and Its Changes—From Nationwide Traffic Characteristics Survey 2015-. Available online: https://www.mlit.go.jp/report/press/toshi07_hh_000117.html (accessed on 24 March 2020). (In Japanese).
Figure 1. Use and data collection of the mobile app.
Futureinternet 12 00083 g001
Figure 2. Screenshot of the English version of the app: (a) Route choice; (b) Spot choice; (c) Route check.
Futureinternet 12 00083 g002
Figure 3. Overview of the application architecture using NAVITIME Application Programming Interfaces (APIs).
Futureinternet 12 00083 g003
Figure 4. Current practice of considering traffic congestion to adjust departure time for returning home.
Futureinternet 12 00083 g004
Figure 5. Intention to change departure time for returning home.
Futureinternet 12 00083 g005
Figure 6. Selection ratio of “Depart now” and the other departure options based on estimated shortened travel time.
Futureinternet 12 00083 g006
Figure 7. Timing of searches for returning routes using the app.
Futureinternet 12 00083 g007
Table 1. Participant attributes overview.
AttributesNumberPercentage
GenderMale5373.6%
Female1926.4%
Age20s811.1%
30s1723.6%
40s1926.4%
50s1926.4%
60s811.1%
70s or more11.4%
CompanionTraveling alone79.7%
Family with children3041.7%
Family without children2737.5%
Friends79.7%
Others11.4%
Purpose of travelSightseeing5677.8%
Homecoming/visiting friends1115.3%
Business00.0%
Others56.9%
Table 2. Summary of application operation logs.
Operation TypeNumber of OperationsNumber of OperatorsAverage Number of Operations
Route search9076015.12
Route choice234584.03
Spot check341575.98
Spot choice1441410.29
Route check1992.11
Table 3. Summary of operation logs and actual behavior of participants who answered the post-experiment questionnaire.
ParticipantProbe Data
Recorded
Shortened Travel Time Min)Chosen Option in the Application’s Operation LogsActual BehaviorConsistency of Chosen Option and Actual Behavior
#1Yes2.5Depart nowNo stopoverYes
#2Yes22.1Depart laterAdditional stopoverYes
#3No data3.3Depart laterAdditional stopoverYes
#4Yes1.3Depart nowNo stopoverYes
#5Yes2.2Depart nowNo stopoverYes
#6Yes26.9Depart laterAdditional stopoverYes
#7Yes10.4Depart nowNo stopoverYes
#8Yes4.6Depart laterAdditional stopoverYes
#9Yes1.5Depart laterNo stopoverNo
#10No data4.1Depart nowAdditional stopoverNo
#11No data6.2Depart nowNo stopoverYes
#12Yes16.7Depart nowNo stopoverYes

