Article

Vulnerability Assessment of Ubiquitous Cities Using the Analytic Hierarchy Process

by
Muhammad Atiq Ur Rehman Tariq
1,2,*,
Cheuk Yin Wai
1 and
Nitin Muttil
1,2,*
1
College of Engineering and Science, Victoria University, Melbourne, VIC 8001, Australia
2
Institute for sustainable Industries & Livable Cities, Victoria University, P.O. Box 14428, Melbourne, VIC 8001, Australia
*
Authors to whom correspondence should be addressed.
Future Internet 2020, 12(12), 235; https://doi.org/10.3390/fi12120235
Submission received: 19 November 2020 / Revised: 7 December 2020 / Accepted: 9 December 2020 / Published: 21 December 2020
(This article belongs to the Special Issue Sustainable Smart City)

Abstract

:
Urbanization is a challenge faced by most countries worldwide and leads to several problems. Due to rapid communication capabilities, conforming the megacities into Ubiquitous cities (U-cities) seems to be a potential solution to mitigate the problems caused by urbanization. Extensive reliance and dependencies of U-cities on information and communication technologies (ICTs) bring forth a new set of risks and vulnerabilities to these megacities. This research investigates the vulnerabilities of ICTs against man-made and natural hazards in a systematic way using the Analytic Hierarchy Process. The study identifies the vulnerabilities of different ICTs in U-cities and helps in improving the system’s resistivity against various hazards. The task is performed by evaluating the level of disruption on the different technologies and areas under the identified man-made and natural hazards. The research provides an insight into the working mechanisms of involved ICTs. It also helps to manage U-cities with more secure and sustainable services. The research identified that the new ICTs-based hazards have emerged and have become among the most influential hazards. The research has concluded that the vulnerabilities of U-cities are significantly different from that of conventional cities and need further studies to develop further understandings. The research recommends similar vulnerability studies for regional areas as well.

1. Introduction

The rate of urbanization has drastically increased due to several reasons with the main being population growth. As a direct result of this urbanization, megacities or extremely densely populated cities are forming [1]. Studies by the United Nations (UN) show that 54% of the global population are living in major cities, and it will rise to 66% by 2050 [2]. Urbanization creates subsequent issues including growing population densities, amplified pollution, poor sustainability, and weak security [3,4]. These phenomena impose problems in the form of urban management which increases demands on resources and services within cities [5]. However, there is no doubt that urbanization can provide prospective economic opportunities with proper planning and management [6]. A relatively new solution to alleviate the problems associated with increases in population density is the implementation of Ubiquitous cities [7]. Ubiquitous cities assure in achieving prosperity both economically and inconvenience. Local municipalities and governments may work in unison while optimizing and sharing information and reducing disparities between regions [8].
Urban management is a difficult task that generally requires a broad interdisciplinary understanding of both technical knowledge and general urban function [9]. Automation and self-intelligence of cities is a result of a crucial ligament in knowledge management and control through the use of information and communication technologies (ICTs) [10]. ICTs are being developed to alleviate this issue and many more by providing services that can display comprehensive data as required on demand [11]. Advancements in ICTs have seen them place themselves in a position where they are dependent on in the fields of urban planning and management. They increase the quality and ease of day to day tasks. Areas such as the office, security, residential, commerce, health care, education, outdoor environment, transportation, and the integrated city networks can be managed wholly by the use of ICTs [12].
The ubiquitous cities’ services are enabled through the adaption of ICTs and ubiquitous computing [13]. With the implementation and reliance on such a broad network of ICTs, vulnerabilities and failure points are created [14]. Natural disasters can wreak havoc through cities, by adding the reliance on infrastructure which can also be damaged by these phenomena can worsen the matter. Not only are these ICTs vulnerable to natural disasters but they are also susceptible to man-made risks such as terrorist attacks [15]. These threats can be both be in the physical and viral sense. With the latter being a more predominant threat to the implementation and reliance on ICTs [16].

1.1. Problem Statement

The concept of ubiquitous cities (U-Cities) is based on sharing information and data by collaborating and utilized various ICTs between city’s services [17]. The idea of ubiquitous computing first arose around 1988 although the first to label it was Mark Weiser who was recognized to be the pioneer of Ubiquitous computing after the project presented at the Xerox Palo Alto Research Centre in the US [18,19,20]. However, the available technologies that allow utilizing computers practices were limited at the time. Until recently, South Korea has been the pioneer to adopt and apply ubiquitous computing in their cities. With the urbanization process in Seoul, Songdo is one of the successful examples that a new city district constructed with implementing the ubiquitous computing technology into city service systems though analysis the collected information and dispatches [21].
“Ubiquitous” means having access to any data or services at any time and in any place via any device through the network [22,23]. The idea of U-cities is implemented by the process of ubiquitous computing, which is integrating computing technology into objects seamlessly whilst being invisible to the end-user. By picking up information via sensors and actuators in the built urban environment, all devices within the U-cities’ network can interact with each other in the system continuously and transfer information simultaneously [24]. The heavy reliance of U-cities on modern information technology obtrudes an additional set of threats from natural and man-made hazards. These hazards may affect sensors, communications, or the process of computing.
The issue needs urgent attention, and the presented paper identifies the above-mentioned vulnerabilities and performs a detailed risk assessment of U-cities using the Analytic Hierarchy Process (AHP) approach.

1.2. Limitations

The research covers the risk assessment of U-cities areas and their interconnectivity using ICTs. U-services, the interconnectivity of services and sensors are not assessed exclusively as the vulnerabilities of sensors and technologies are considered in accumulation and the impacts of the service area are eventually transmitted to U-services. The study deals with the natural and man-made hazards separately due to the complexity of combining both types of hazards. The studies provide a proposed plan of mitigation as well. However, a detailed evaluation of mitigation options and the evaluation of their impacts are not a part of current research studies.

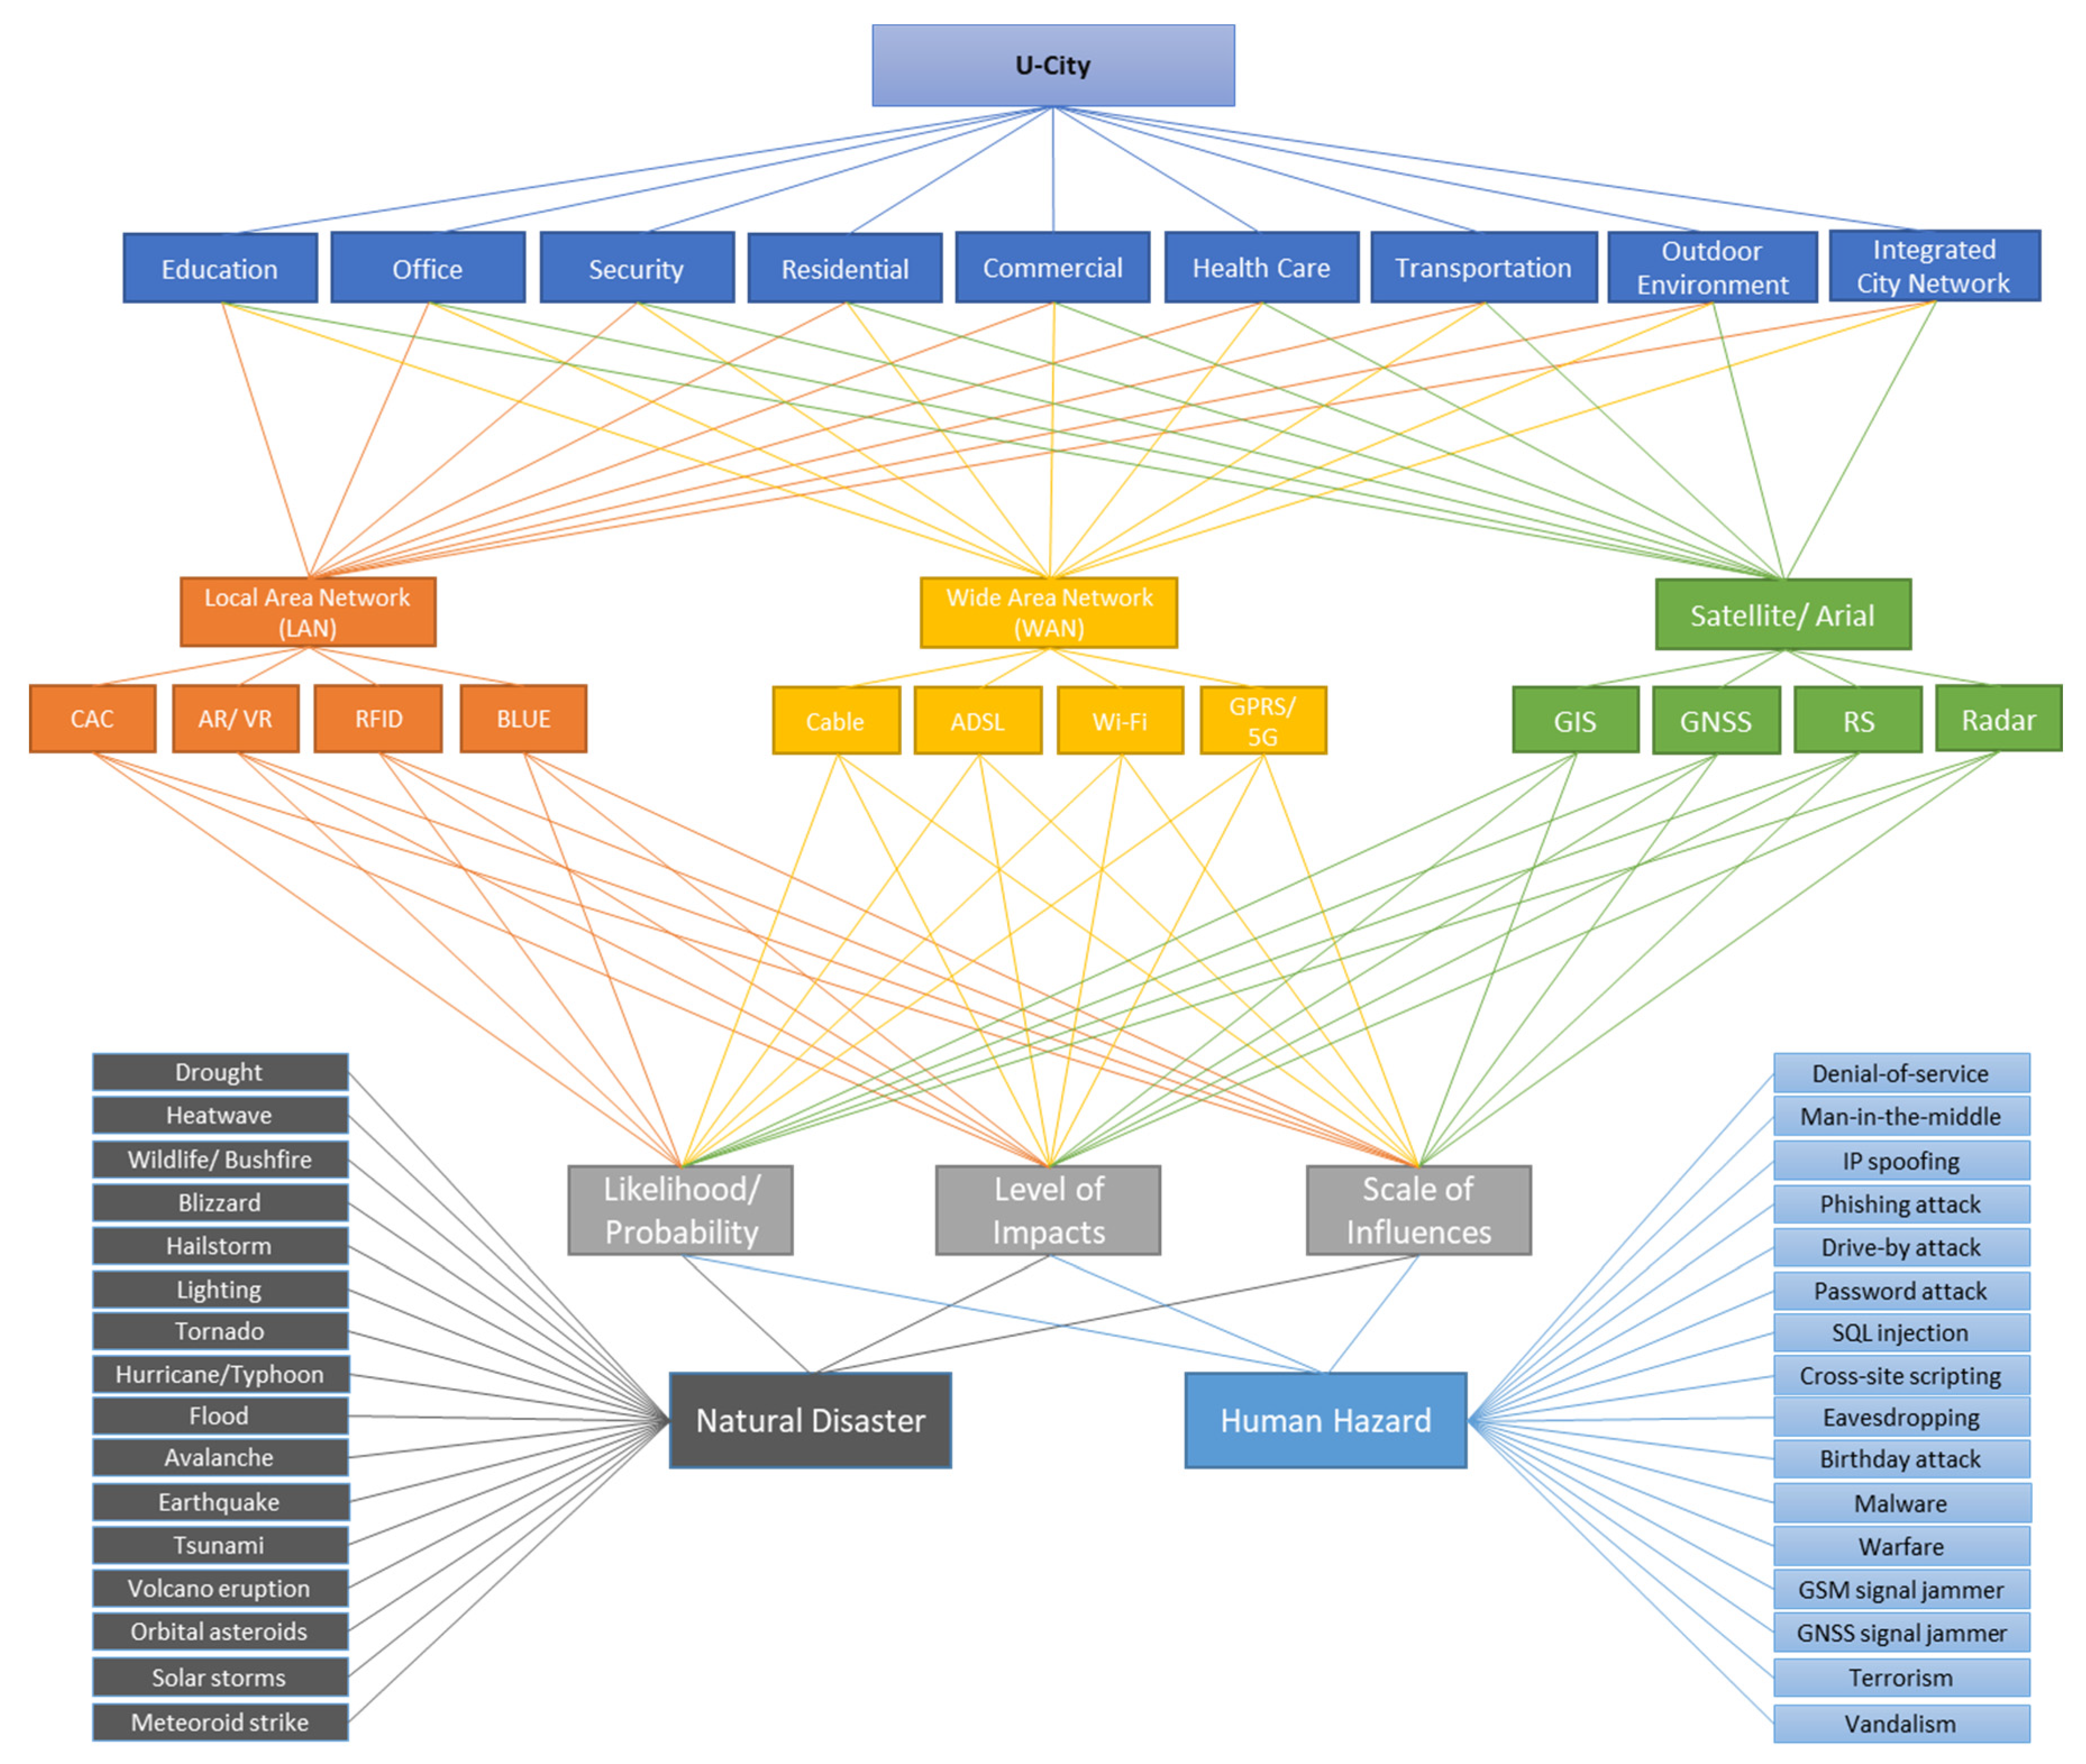
2. The Components of U-Cities and Hazards

Although hazards and disasters can prove catastrophic individually to human lives, the additional reliance on ICTs and ubiquitous networks creates an extra point of failure. As some of these networks can potentially control major city assets such as water supply, electricity grids, and sewage disposal systems. Had these systems fail on top of the disaster already occurring the recovery time would greatly increase. Indirectly causing major damage to infrastructure and technologies used by businesses and commerce can also have a severe impact on the global economy.
The U-city is aimed to improve the resident’s life quality with additional economic benefits to the city by boosting productivity through streamlined tasks. The network allows controlling and automation of general daily tasks [25], different services will be provided according to the areas that the department contains. From administrative services, automated transportation, crime prevention, fire and security services, natural hazards, and the list goes on [26]. Figure 1 illustrates the U-city concept.

2.1. Areas

In this study, organizations, departments, and facilities that contain city services are categorized into 9 major areas following Lee et al. and Kee and Kim [26,27]:
Education: General education system such as schools, TAFE institutions, Universities, etc. Also including academic facilities like library, theaters, and museums.
Office: Entails both home office and work office which incorporates administration and customer services.
Security: General public safety includes CCTV monitoring and law enforcement, also emergency services such as police, fire brigade, and paramedic.
Residential: Daily tasks including the automation and services provided within the home of families or households.
Commerce: Refers to enterprise and incorporations with a focus on business, economy, and finance.
Healthcare: Cover all services relating to the healthcare system, included but not limited to hospitals, pharmacy, dental clinic, aged care, etc.
Transportation: Consider all types of traffic systems on land, air, and sea that are used by pedestrians and vehicles.
Outdoor environment: In an urban context, this refers to any public share open space facilities, which can be a plaza, city square, park, and garden, etc.
Integrated city network: A series of sensors and detection devices which plays a key role in the urban management, included disaster alert system, energy and resources management, waste and pollutant.

2.2. Services

Some standard services offered by U-cities are supported by more than one area mentioned above. Some examples are listed as follows to outline the general idea of interconnective services across areas:
U-life: Services that assist daily household tasks by utilizing applicants through remote control such as lighting, curtains, ovens, washing machines, dishwashers, and so forth. Even utility services on inspections and reading meters can be performed remotely. Systems such as ZigBee embrace their system of sensors which allow the management of physical environment parameters [28].
U-business: Cost benefits and time efficiency services can be provided by using augmented reality (AR) and virtual reality (VR) or holographic projection multimedia for business conferences and meetings with clients and colleagues from offices around the globe [22].
U-government: Detection of pollutants can be completed with ease simply by the addition of an array of sensors. Airborne, waterborne, and soil pollutants can be distinguished. Closed-circuit television (CCTV) cameras being utilized in public areas such as parks and squares add to the safety of the citizens. Specific technologies and instruments allow for the precise projection of public transport schedules, allowing for a smoother commute reducing traffic because of the greater incentive to use public transport [22]. The vision-impaired can be assisted greatly by the addition of location-based services. Agricultural uses have become prevalent in monitoring livestock both in location and heath.
Location-based services (LBS): By utilizing mobile phone networks, LBS and information can be collected from users. GPS data can be gathered from mobile devices anonymously and received by third-party advertising agents. When GPS is unreachable, triangulation and trilateration are used to obtain data. This allows businesses such as restaurants to advertising within the vicinity. It also integral to emergency services for quicker responses and accurate location data hence reducing dispatch and call-out times [29].
Intelligent Transportation Systems (ITS): It provides efficient public transportation systems by saving time, cost, and reducing traffic congestion and impacts [30].
Smart and Intelligent Building: Smart buildings can automate and manage tasks by forecasting situations and scenarios in which it can preemptively respond with a significant reduction in resources [3].
Teleport and Intelligent Building: A teleport dealing predominantly with a large scale of data and information. It receives, modifies, and relays information accordingly to the desired destination. The teleport generally incorporates a central processing unit which controls telecommunications between different areas [24].
With the implementation of a combination of the technologies, these services help to create a ubiquitous city with an efficient and organized lifestyle for the occupants, by reducing pollution, promoting environmental sustainability, and ensuring security and safety.

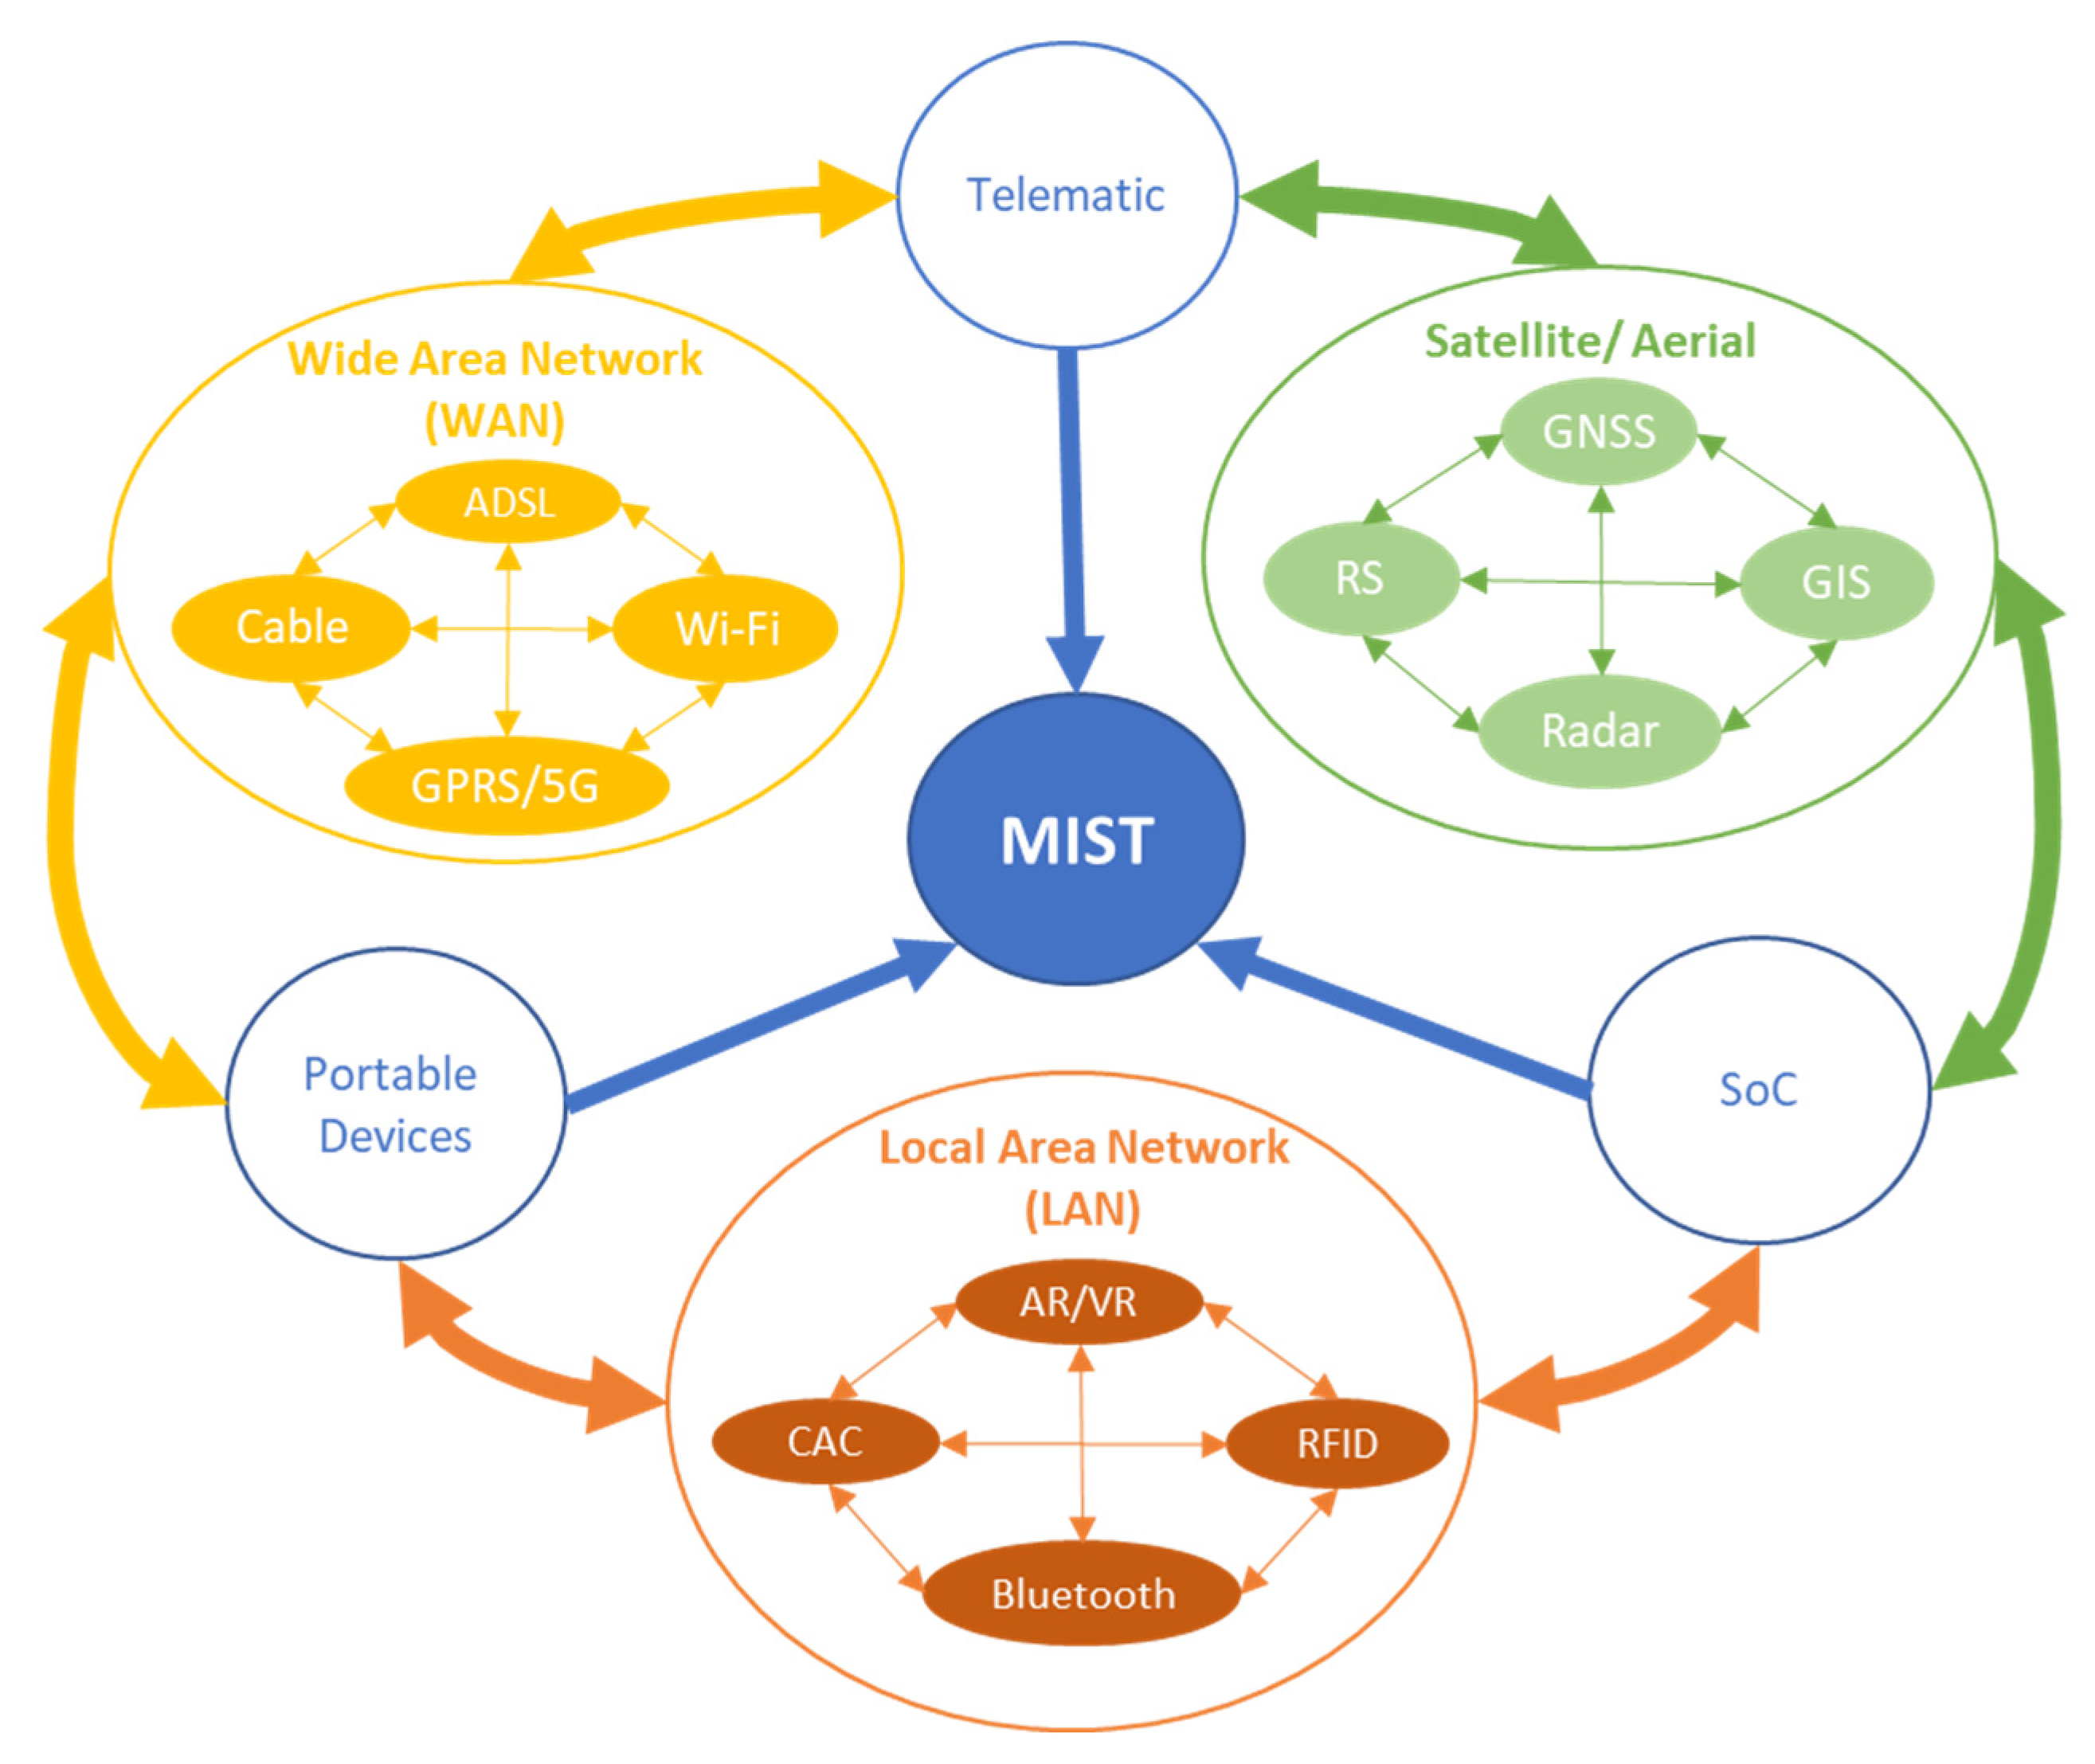
2.3. Information and Communication Technologies (ICTs)

Following Lee, Baik and Choonhwa Lee [31], three main groups of communication technologies have been established, namely, Local Area Network (LAN), Wide Area Network (WAN) and Satellite/Aerial, which covers 12 technologies that are predominately used in functionalities of ubiquitous cities (see Figure 2). Services within a ubiquitous city network rely heavily on these technologies to function effectively [32]. As the networks grow and become a substantial staple in the proceedings of city management the reliability of these networks is imperative as failure can prove catastrophic [33].

2.3.1. Local Area Network (LAN)

LAN is the network that connects the devices in one physical location, the network size can be small as a home network for a single user to as big as a company size network with thousands of users and devices. The typical ICTs associated with LAN is Bluetooth, radio frequency identification, context awareness computing, and augmented/ virtual reality.
Bluetooth (BLUE): Bluetooth is a wireless technology frequently used in mobile devices for short-distance connections. The technology using specific radio wavelengths to provide stable and effective connectivity between devices [34].
Radio Frequency Identification (RFID): RFID allows wireless automatic identification in short-range, by utilizes radio waves to communicate via RFID tags, transponders, and RFID readers. There are two main components in RFID tags, first is a circuit which processes and stores information while modulating and demodulating a radio frequency. The second being an antenna to receive and transmit the signal [35].
Context Awareness Computing (CAC): CAC is a technology which relies on context associated information to provide specific services and tailored experiences depending on the place, time, and events. By acquiring and utilizing particular information, a device can automatically be placed on vibrate mode when you are in the meeting room during the designated time [36].
Augmented and Virtual Reality (AR/VR): AR/VR technology focused on the advancement and amalgamation of the digital and real world. It aims at seamlessly integrating reality with technologies that are currently present. Currently, in its simplest form computer-generated graphics and visuals can be implemented into live video this can be seen in apps such as Snapchat and Instagram. Further research is looking into applications where the digitally placed context can be interacted with via motion tracking and gestures [37].

2.3.2. Wide Area Network (WAN)

WAN is the network of networks that allows the LANs or other networks that communicate with each other’s, it can cover a larger geographic area and the internet is the largest WAN in the world. The typical ICT that associated with WAN are asymmetric digital subscriber line, cables, wi-fi, and general packet radio services.
Asymmetric Digital Subscriber Line (ADSL): ADSL is a technology that connects the internet by using the existing copper wire phone network [38]. By installed and connect to a modem, the user can be able to access the internet by wireless as well but must be in close distance with a radius no more than 2.5 miles [39].
Cable: Cable is essential to connect the network devices by a physical wire, also the wireless connection with the advanced technologies. Broadband Convergence Network (BCN) is an evolved broadband network which integrated wired and wireless service for telecommunications, broadcasting, and multimedia [40]. Nowadays, Fibre to the Premise (FTTP) is the fastest fiber-optic network connection type, where the optical fiber cable run directly onto the premises. This is opposed to Fibre to the Node (FTTN) or Fibre to the Curb (FTTC) which relies on copper cables to complete the run which is less reliable and slower in comparison [41]. With the rapid increase of internet users, this will further need to be advanced deeper into the sensor network for U-cities.
Wi-Fi: High-Speed Downlink Packet Access (HSCPA) and Wireless Broadband (WiBro) are both advancements in wireless internet, enabling users to receive and engage with content conventionally design for PC on their smartphones. Main features include video conferencing and high-speed file transmission services between mobile devices [27].
General Packet Radio Services (GPRS—5G): The most updated version of mobile network 5G is based on the GPRS, the first mobile technology that enables the phone to go online. GPRS started with data speeds between 40–128 kbps, become 384 kbps in 3G to 100 Mbps in 4G, 5G, and 6G is expected to go beyond these numbers [42].

2.3.3. Satellite/Aerial Network

The satellite networks designed for telecommunications services are low earth orbit and geostationary satellite networks, which able to cover almost everywhere on Earth’s surface. Aerial navigation network is a collection of various airborne applications using different aircraft, which provide services such as air surveillance, search, and rescue. Geographic information system, global navigation satellite system, remote sensing, and radar are examples of Satellite/Aerial Networks.
Geographic Information System (GIS): GIS incorporates the ability to store, edit, analyze, share, and display data that is geographically accurate. This allows the ability for the citizens to obtain location-specific information for example map data and spatial references. This data can be used in the amplitude of scenarios the most prevalent being route guidance but also management tasks and monitoring. It works in unison with the sensors capable of monitoring pollutants and references the data geographically allowing for a sensical data collection [43].
Global Navigation Satellite System (GNSS): Global Navigation Satellite System (GNSS) is a well-known geographic locating technology that can be used in all weather and anywhere in the world. A GNSS receiver can lock on the signal from three or more satellites circulate on the Earth orbit, to determine the precise position through latitude, longitude, and altitude [44]. Multiple-use cases have been applied to this technology including speed detection, navigation, earthquake studies, and telecommunication network synchronization [27].
Remote Sensing (RS): RS is the acquisition of information about an object or phenomenon without making physical contact with the object and thus in contrast to on-site observation, the sensors can collect data from a satellite or mounted on aircraft by detecting the energy that is reflected from Earth surface [45].
Radar: Radar is referred to as radio detection and ranging, which using a transmitted radio signal emitted by an antenna and using a receiver to detect the signals echoes bounce from objects. Radar technology is commonly used in military applications, traffic control, and weather observations [46].

2.3.4. Internet of Things (IoT)

The concept of U-cities eventually creates a network, called the Internet of Things (IoT). The purpose of IoT is to utilize all the information and data from all the ICTs into a big database by using the middleware in simulation technology (MIST) as the bridge to connect with portable devices, telematics, and system on a chip [47] (refer to Figure 3). To connect each group, certain devices/sensors will be used, for example, telematics will help to connect between Satellite and WAN, SoC is used to connect between LAN and Satellite, whereas portable devices are used to link between WAN and LAN. Utilizing these devices and sensor allow the city to collect data and information, by using MIST to produce meaningful database and develop management models for the city, which communicate sensed data seamlessly and omnipresent, to create a network that information can be exploited in automating and streamlining processes. As the advancements in ICTs continue further, developments are made in Ubiquitous city concepts.
Middleware in Simulation Technology (MIST): MIST represents computing software that adapts programs and applications to work simultaneously and seamlessly. Its main uses are to amalgamate complex applications. Thus, including web servers, application servers, content management systems, and similar tools that support application development and delivery [48].
Telematics: Telematics is the communication of multiple devices allowing sending, receiving a string of information. Telematics most common use is in GNSS technology relaying information between computers and mobile devices. Telematics provides services via telecommunications, which allows the user to access real-time traffic data to allow better trip plans [22].
System-on-a-Chip (SoC): SoC integrates a full computer system into a micro fully functional circuit. It can process several different technologies as well as possessing an array of different sensor functionalities such as RFID, GNSS, Location-Based Service (LBS), and so on. Generally, any embedded sensor will contain and utilize this technology [49].
Portable devices: Portable devices allow individuals to access the services from different U-city areas, at the same time act as part of the IoT network on providing feedback information to the big database. Different to SoC’s focus on processing information, portable devices is to transfer digital or analog information signals wirelessly and allows more flexibility on customizable information by using application software [50].

2.4. Hazards to a U-City

With the addition and reliance on such an abundance of different technologies and infrastructure, there are several associated risks to be considered. These risks pose several natural and man-made threats to the operations and security of the U-city.

2.4.1. Man-Made Hazards

There are two forms of man-made hazards towards technologies applied in U-cities: digitally and physically. Digital man-made hazards are mainly driving by cyber-attacks, but also include a human error or malfunction factories in the system. Some typical digital hazards based on literature [51,52]:
Denial-of-services (DoS) and distributed denial-of-service (DDoS) attacks: DoS and DDoS are one of the most popular attacks that targeting private cloud networks to cause reduction or denial of services, by bandwidth or connection flooding with invalid requests hence the legitimate requests got denial [53].
Man-in-the-middle (MITM) attack: MITM attack happened whenever the attacker intercepts the user’s network, or the user traffic intercepted a network controlled by the attacker, and the attacker can decrypt the network cipher without alert the user [54].
Internet protocol (IP) spoofing: IP spoofing is the attack that breaches a computer or network security by gaining unauthorized access by spoofing the IP address of a trusted device, it camouflages the attack and masking the true identity by sending a malicious message to the target [55].
Phishing and spear-phishing attacks: Phishing is a cybercrime that a scammer uses fake emails or websites to gather sensitive information by trick people to reveal their details unintentionally, while spear phishing is more target orientated to a specific individual or organization [56].
Drive-by attack: A drive-by attack is usually associated with other attacks like malware or MITM, the attack is using an insecure website with malicious scripts or code embedded on the page, which may install malware, spyware, or trojan to the victims’ devices who visits the site [57].
Password attack: This is simply an attacker try to obtain the password from a user without their authorization, the attacks can be either digitally using the network but also in the physical world without using any network or electronic devices [58].
SQL injection attack: This attack injects malicious SQL code into a database program, which processes the user input to the back-end database controlled by the attacker, allows them to delete, copy or modify the content of the database [59].
Cross-site scripting (XSS) attack: Similar to SQL injection attack, the XSS attacks happen when attackers injected their code into a vulnerable webpage, usually, JavaScript or HTML, and the code allows attackers to steal user information [60].
Eavesdropping attack: Also known as sniffing or snooping attack, is a cybercrime that steals user information from any devices connected to the network. The attacker can insert the software by virus or malware to extract information from the user, which is commonly associated with MITM attack [61].
Birthday attack: The birthday attack is a type of cryptographic attack named after the birthday paradox due to the implemented probability of the attack algorithm, which is designed to exploit the communication between two parties and usually affects the digital signature susceptibility [62].
Malware attack: Malware is software that intentionally causes damage to the device and network, such as Trojan, spyware, and ransomware, the attacks can be a small scale on stealing sensitive information of the individual user to a larger scale on damaging the cloud system or infrastructures [63].
GSM/GNSS signal jammer: Signal jamming is a major concern in the military and defense sector, as the jamming devices can emit signal noise that interrupts satellite transmissions and impact civilian and military life [64].
Physical man-made hazards are simply referring to the direct damages and destructions that intentionally targeting U-cities’ infrastructure, devices, and installations. Which included but not limited to:
  • Lesser crimes like stealing small devices
  • Terrorist vandalism on facilities
  • Sabotage infrastructures for wars efforts

2.4.2. Natural Hazards

A natural hazard is an occurrence of disturbing climatic conditions which adversely affects and endangers human lives. These hazards also implement risks of damaging different U-cities’ technologies in different ways.
Blizzard: Extreme low temperatures might influence the wired connection, heavy snowfall can weaken the wireless and satellite signals [65].
Earthquake: Earthquake can easily destroy infrastructures and even landscapes. Technologies that rely on large scale underground cables such as BCN and IPv6 will be easily damaged, while wireless and small devices are less likely to be influenced. Far distance signal transmitting like GNSS is not affected by the earthquake at all. Therefore, satellite technology and wireless communications are often used to network seismic stations and monitor seismic activity [66].
Flood: Similar to earthquakes, floods cause major damage to the ground and underground infrastructures but has more impact on electronic devices without waterproofs.
Lightning: A lightning strike occurs when a huge amount of energy released by a spontaneous electricity discharge from the atmosphere. It causes physical damage to the power grid and communication facilities such as power line and radio tower, leads to large-scale blackout, affects the communication network, potential electronic devices malfunctions [67].
Hailstorm: Technologies that most vulnerable to hailstorms will be fragile objects installed on rooftops since the damage is usually caused by gravitational forces. Devices and sensors with glass components or solar panel parts have a higher chance to be damaged. For example, traffic control signals and solar panels on the streetlight pole [68].
Heat Wave: Opposite to blizzard, heatwave occurs with extreme heat for extended periods. Extreme high temperatures might influence the wired connection and slow down the internet [69].
Hurricane/Typhoon: Hurricanes and typhoons consist of heavy rainfall, rapid temperature changes, and extreme wind speed. Small, lightweight outdoor devices or installations have a high chance to be damaged, Wi-Fi and radio signals are weakened, and result in slow internet. Also, it often leads to flooding and lighting [70].
Solar storm: Solar storm contains charged particles by sending Coronal Mass Ejections (CMEs), which can disrupt satellites and electronic devices on Earth, with the potential to affect the power grid, internet, telecommunications, and navigation system [71].
Tornado: The wind speeds of a tornado can excess 480 km (300 miles) per hour, infrastructure and objects especially power lines and small devices are easily destroyed by the shear forces and debris [72].
Tsunami: Tsunami can cause an earthquake, volcanic eruption, or landslide. These powerful tidal waves often lead to devastating destruction to the coastal area and flood the affected area for a period. Most wire connections, electronic devices, and equipment would be destroyed [73].
Volcanic eruption: An unstoppable natural disaster that can destroy any structures, change the landmasses, cover the atmosphere with smoke and dust, this results in poor phones and radios signals reception. Volcanic eruption often associates with earthquakes and lightning [74].
Wildfire/Bushfire: Wildfire, or bushfire, is a large-scale uncontrolled blaze that consumes all flammable objects in its path. Wildfire can disable the communication network follow by the destruction of cables, radio signal towers, and the smoke and heat can inference satellites accuracy [75].
Others: Hazards such as avalanches, drought, and meteoroid strikes have a serious impact on humans.

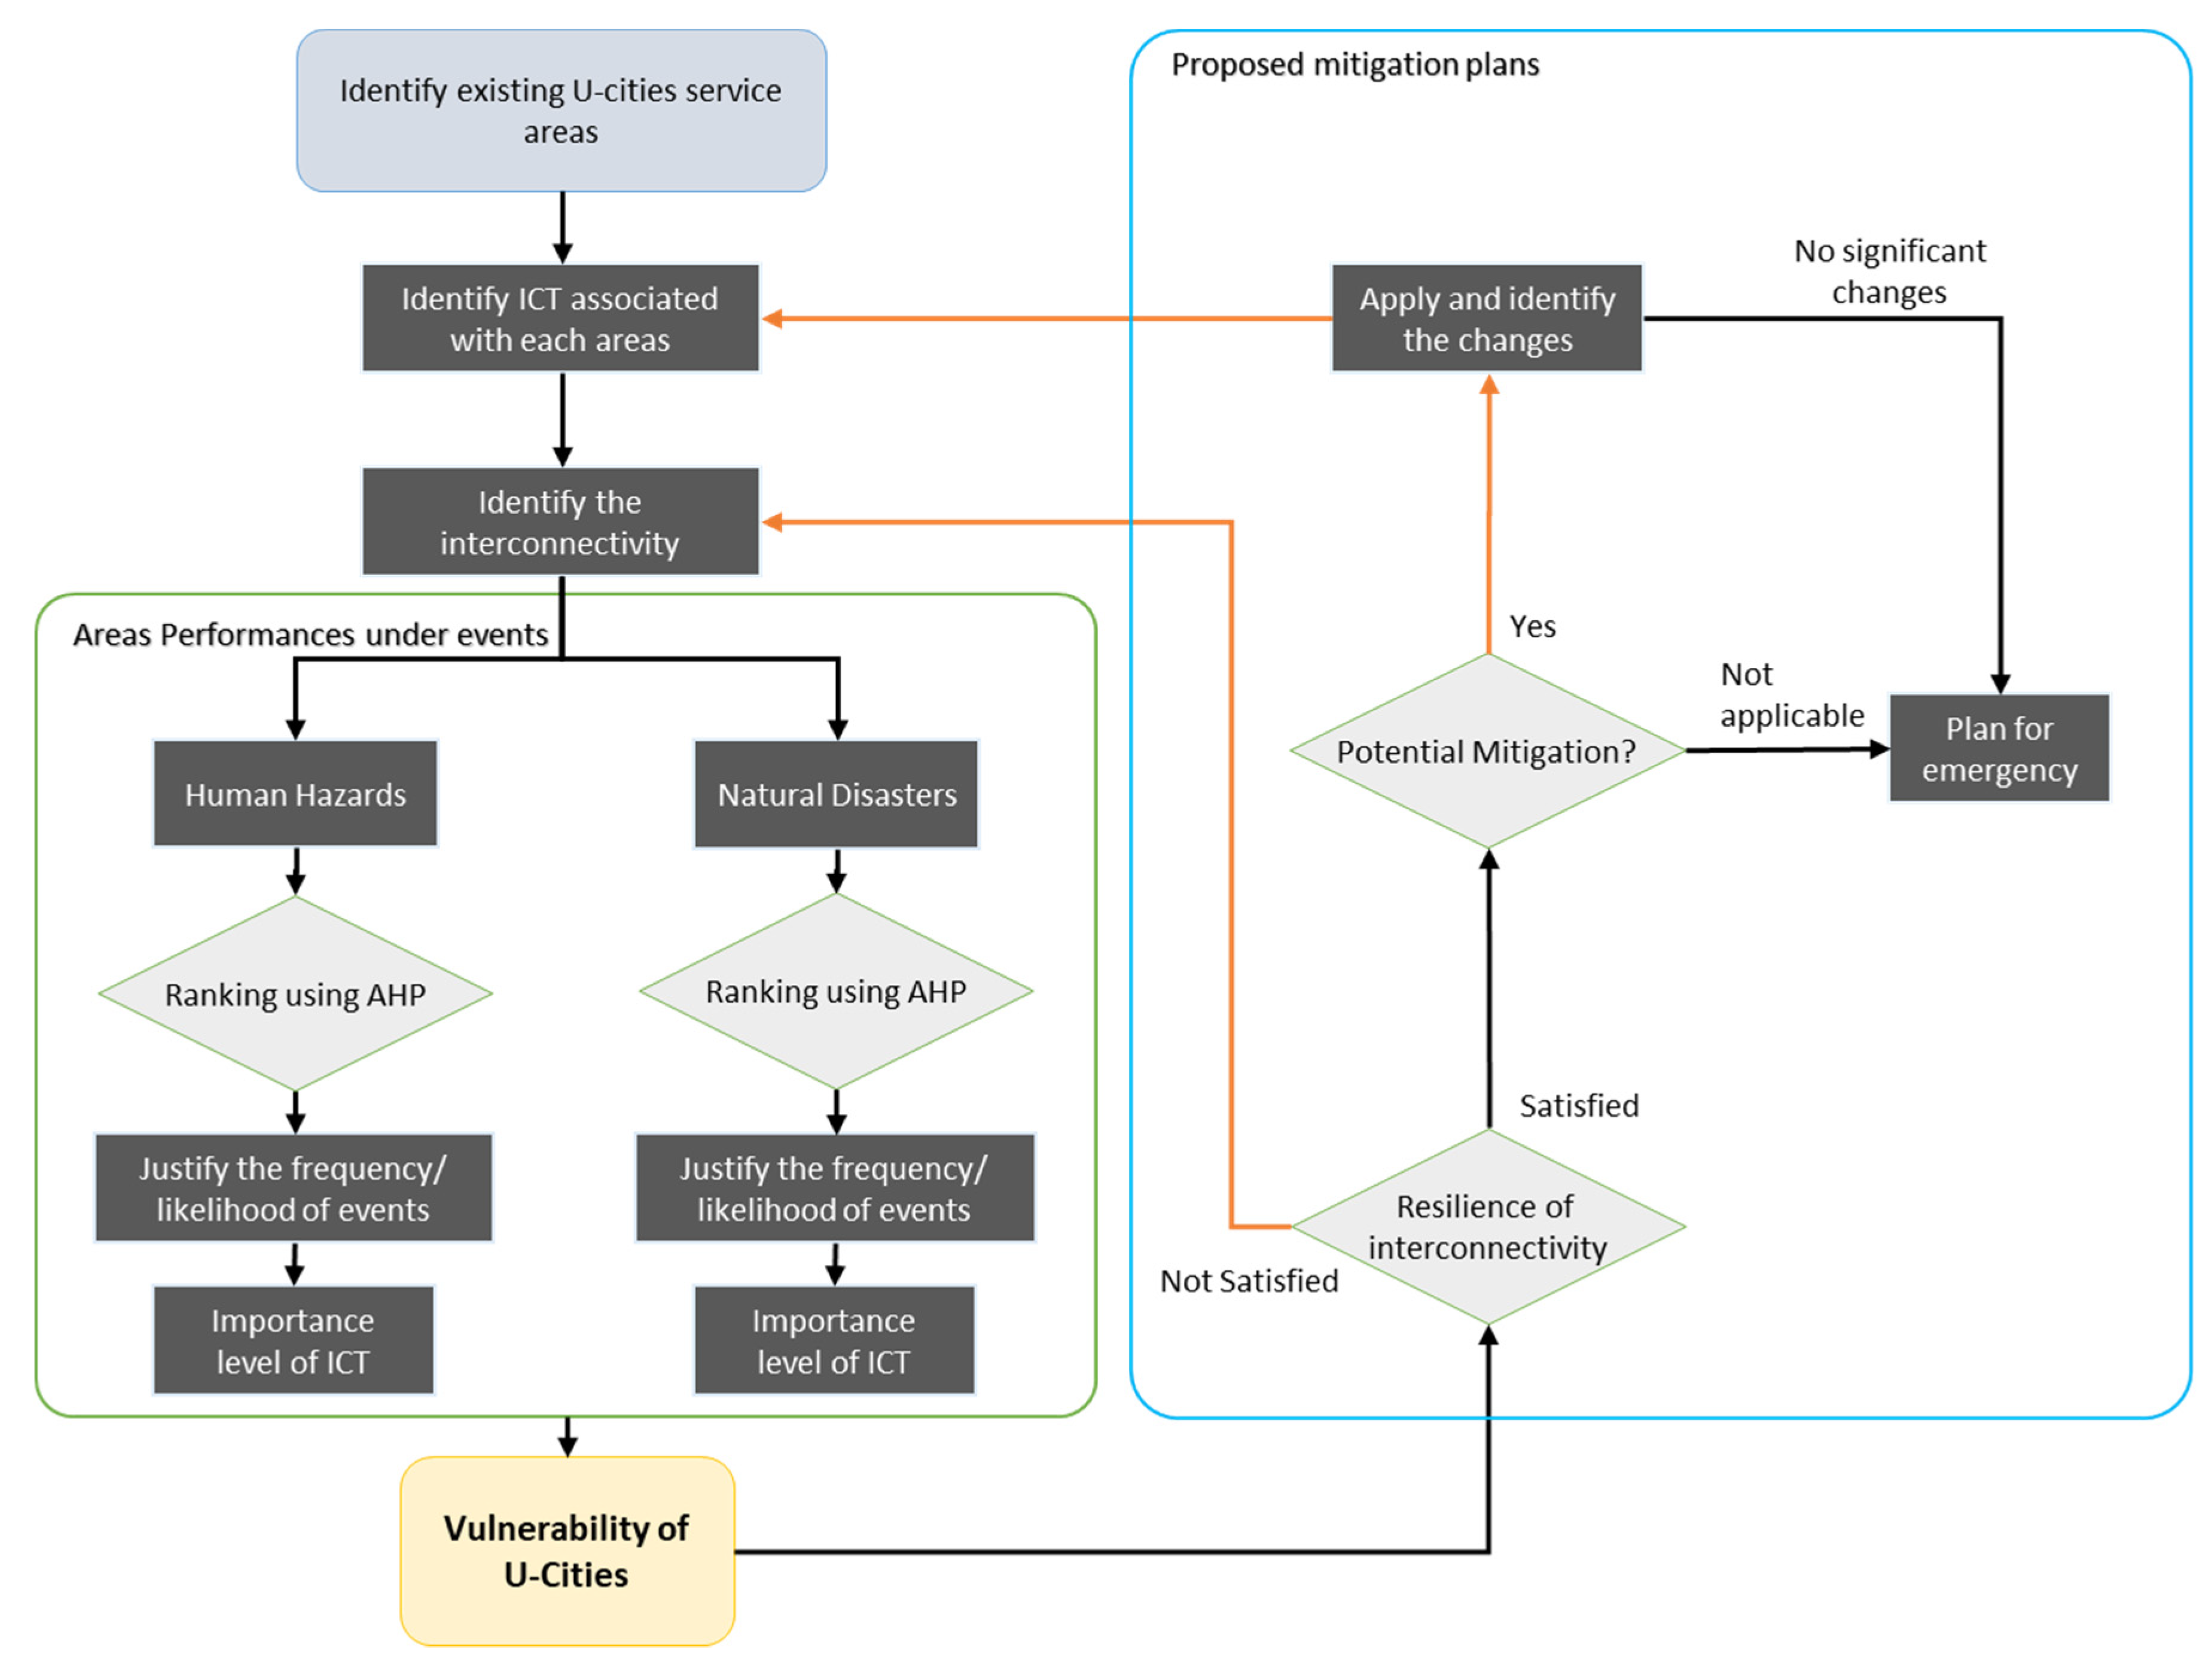
3. Vulnerability Assessment of Cites

Numerous methods have been developed to perform a vulnerability assessment of cities under natural and man-made hazards. Gandini et [76] conducted a vulnerability assessment for the cities of Spain under flooding and extreme precipitation events followed a holistic and multi-stakeholder methodology. Tapia et al., [77] used an alternative method to include socio-economic concerns by developing an indicator-based vulnerability assessment for 571 European cities experiencing heatwaves, flooding, and droughts. The weightage was assigned using Factor Analysis (FA) and Principal Component Analysis (PCA). Another case study on flash floods in Egypt used a ranking system based on a composite vulnerability index with eight parameters that integrated hydro-climate and physical vulnerability components [78,79]. Fuzzy functions of the catastrophe theory are used for the seismic vulnerability of Tabriz city to study the impact of natural, physical, and human variables [80].
Recent studies of vulnerability studies include remote sensing and extensive use of geographic information systems (GIS). Adnan and Ullah [81] conducted a case study in Pakistan on accessing drought hazard by analyzing the past droughts and developed the Drought Hazard Index (DHI). The vulnerability assessment of Mumbai City in India focused on the climate change impacts by considering the frequency of natural disaster, as well as the land-use/ land-cover (LULC), digital elevation model (DEM) and historical record on the flood, occurred regions [79]. Alelaiwi A. [82] explained to role of AHP for the evaluation of performance of a system (edge/cloud platforms in his study). Myeong S., et al. [83] used AHP to identify the determinant factors in the development of smart city composition. While in a recent study, Jnr B. A., [84] developed AHP-software risk prioritization model to identify and prioritize the influential risk factors using partial least square-structural equation modeling. A few more studies in India are conducted using the AHP for assessing forest cover vulnerability, landslide vulnerability, flood hazard assessment, and the vulnerability of watersheds to climate change [85,86,87,88,89,90].
Since U-cities are associated with a large amount of data handling, data acquisition, communication, processing, and reliability is considered as an indispensable property. Any natural hazard that affects the functionality of data handling or any man-made intervention can cause a high risk of U-cities normal functionality. For example, any untrusted information is a potential risk from the privacy security of individuals, to company finance or even the economy of global markets [91], [92]. Cyberattacks on the IoT network can make physical damage and it can be fatal, especially the applications in the industrial sector [50]. For example, the network security risk assessment for critical information infrastructure is potentially subjected to attack vector [93].
Researchers recommend considering the vulnerability assessment on the hardware and software separately, as the nature of physical and digital vulnerabilities will require a different set of parameters [93,94,95,96]. A hardware security vulnerability assessment has been developed to use a fault injection attack by a clock glitch generator on an embedded application and evaluate the data flow [96]. A study has pointed out that the Certificate Authority can be a countermeasure in the process to build safe a secured IT service in U-cities [93]. Therefore, it is suggested to conduct a security requirement analysis with a list of the vulnerabilities under different attacks [95]. Based on conflicting theories and paradigms, Botta et al. [50] suggested a meta-analysis and meta-knowledge approach to provide an interdisciplinary and integrated way to understand the nature of the hazard, as well as the interactions between hazards and the ICTs.

3.1. Development of the Framework

The following steps are performed for the research studies:
  • Identify the service areas (performed in Section 2.2)
  • Identify the associated ICTs (performed in Section 2.3)
  • Identify natural and man-made hazards (performed in Section 2.4)
  • Ranking, Likelihood, and area of influence of hazard using AHP (performed in Section 3.3)
  • Overall vulnerability assessments of U-city (performed in Section 3.4)
As mentioned in Section 1.2, the scope of the presented research is limited to evaluation of the vulnerabilities of the U-cities, proposed mitigation plans are shown for the elaboration purpose only in Figure 4. A follow-up research will develop a comprehensive approach towards an effective plan to mitigate these vulnerabilities.

3.2. Interconnectivity of Areas

There are two types of connectivity. Conventionally, the information for sensor data is relayed to a central hub, which is processed and forwarded to its relevant parties that utilize the information to streamline particular services and processes throughout the city [47]. The problem with this type of connectivity, however, is it leaves quite several vulnerabilities open due to the main rely on the central hub. Whereas, in an ideal environment, each party would be able to process and utilize the data it requires which would alleviate the need for a central processing hub and reduce the potential vulnerabilities and failure of individual technologies themselves. The ideal interconnectivity of a U-city is typically viewed as represented in Figure 5.

3.3. Performance of a U-city under Hazards

For overall analysis, both the primary and the secondary data were utilized. A detailed literature review was carried out as explained in Section 2 for the identification of hazards, services, and ICTs. Whereas Microsoft Excel-based numerical model was developed to obtain the primary data through AHP. However, experts’ opinions were sought for developing the interconnectivity of ICTs and ranking of the hazards using AHP that are further described in the following section.

3.3.1. Analytical Hierarchical Process (AHP)

The probability of natural hazards is estimated using statistical methods [97]. But in our case, it was practically impossible to collect the statistical data for all hazards while meeting the requirements of statistical analysis. Besides, the rapid development on the interconnection of current technologies has generated hazards with lack of standardization, it has limited the effective analysis due to the complexity of big data.
Therefore, AHP suits the requirements of our case study of Melbourne city. AHP is a decision-making method developed by Thomas Saaty in 1970, which is used for evaluations by creating an alternative ranking to sort the best selection base on a set of criteria [98,99]. As the factors and criteria of the U-cities vulnerability contain a large volume of assessments and are often related to each other’s, the AHP allows the translation of the quantitative and qualitative assessments into a multi-criterion ranking by the decision-makers [100].
The AHP is used to create a ranking to show the impact on the U-cities service areas under the various natural disasters and human hazards. As different areas are associated with specific ICTs, with the justification of probability and the scale of influence, a weighing for the vulnerability assessment has been created. Figure 6 shows the process of vulnerability analysis explaining the role of AHP in detail.

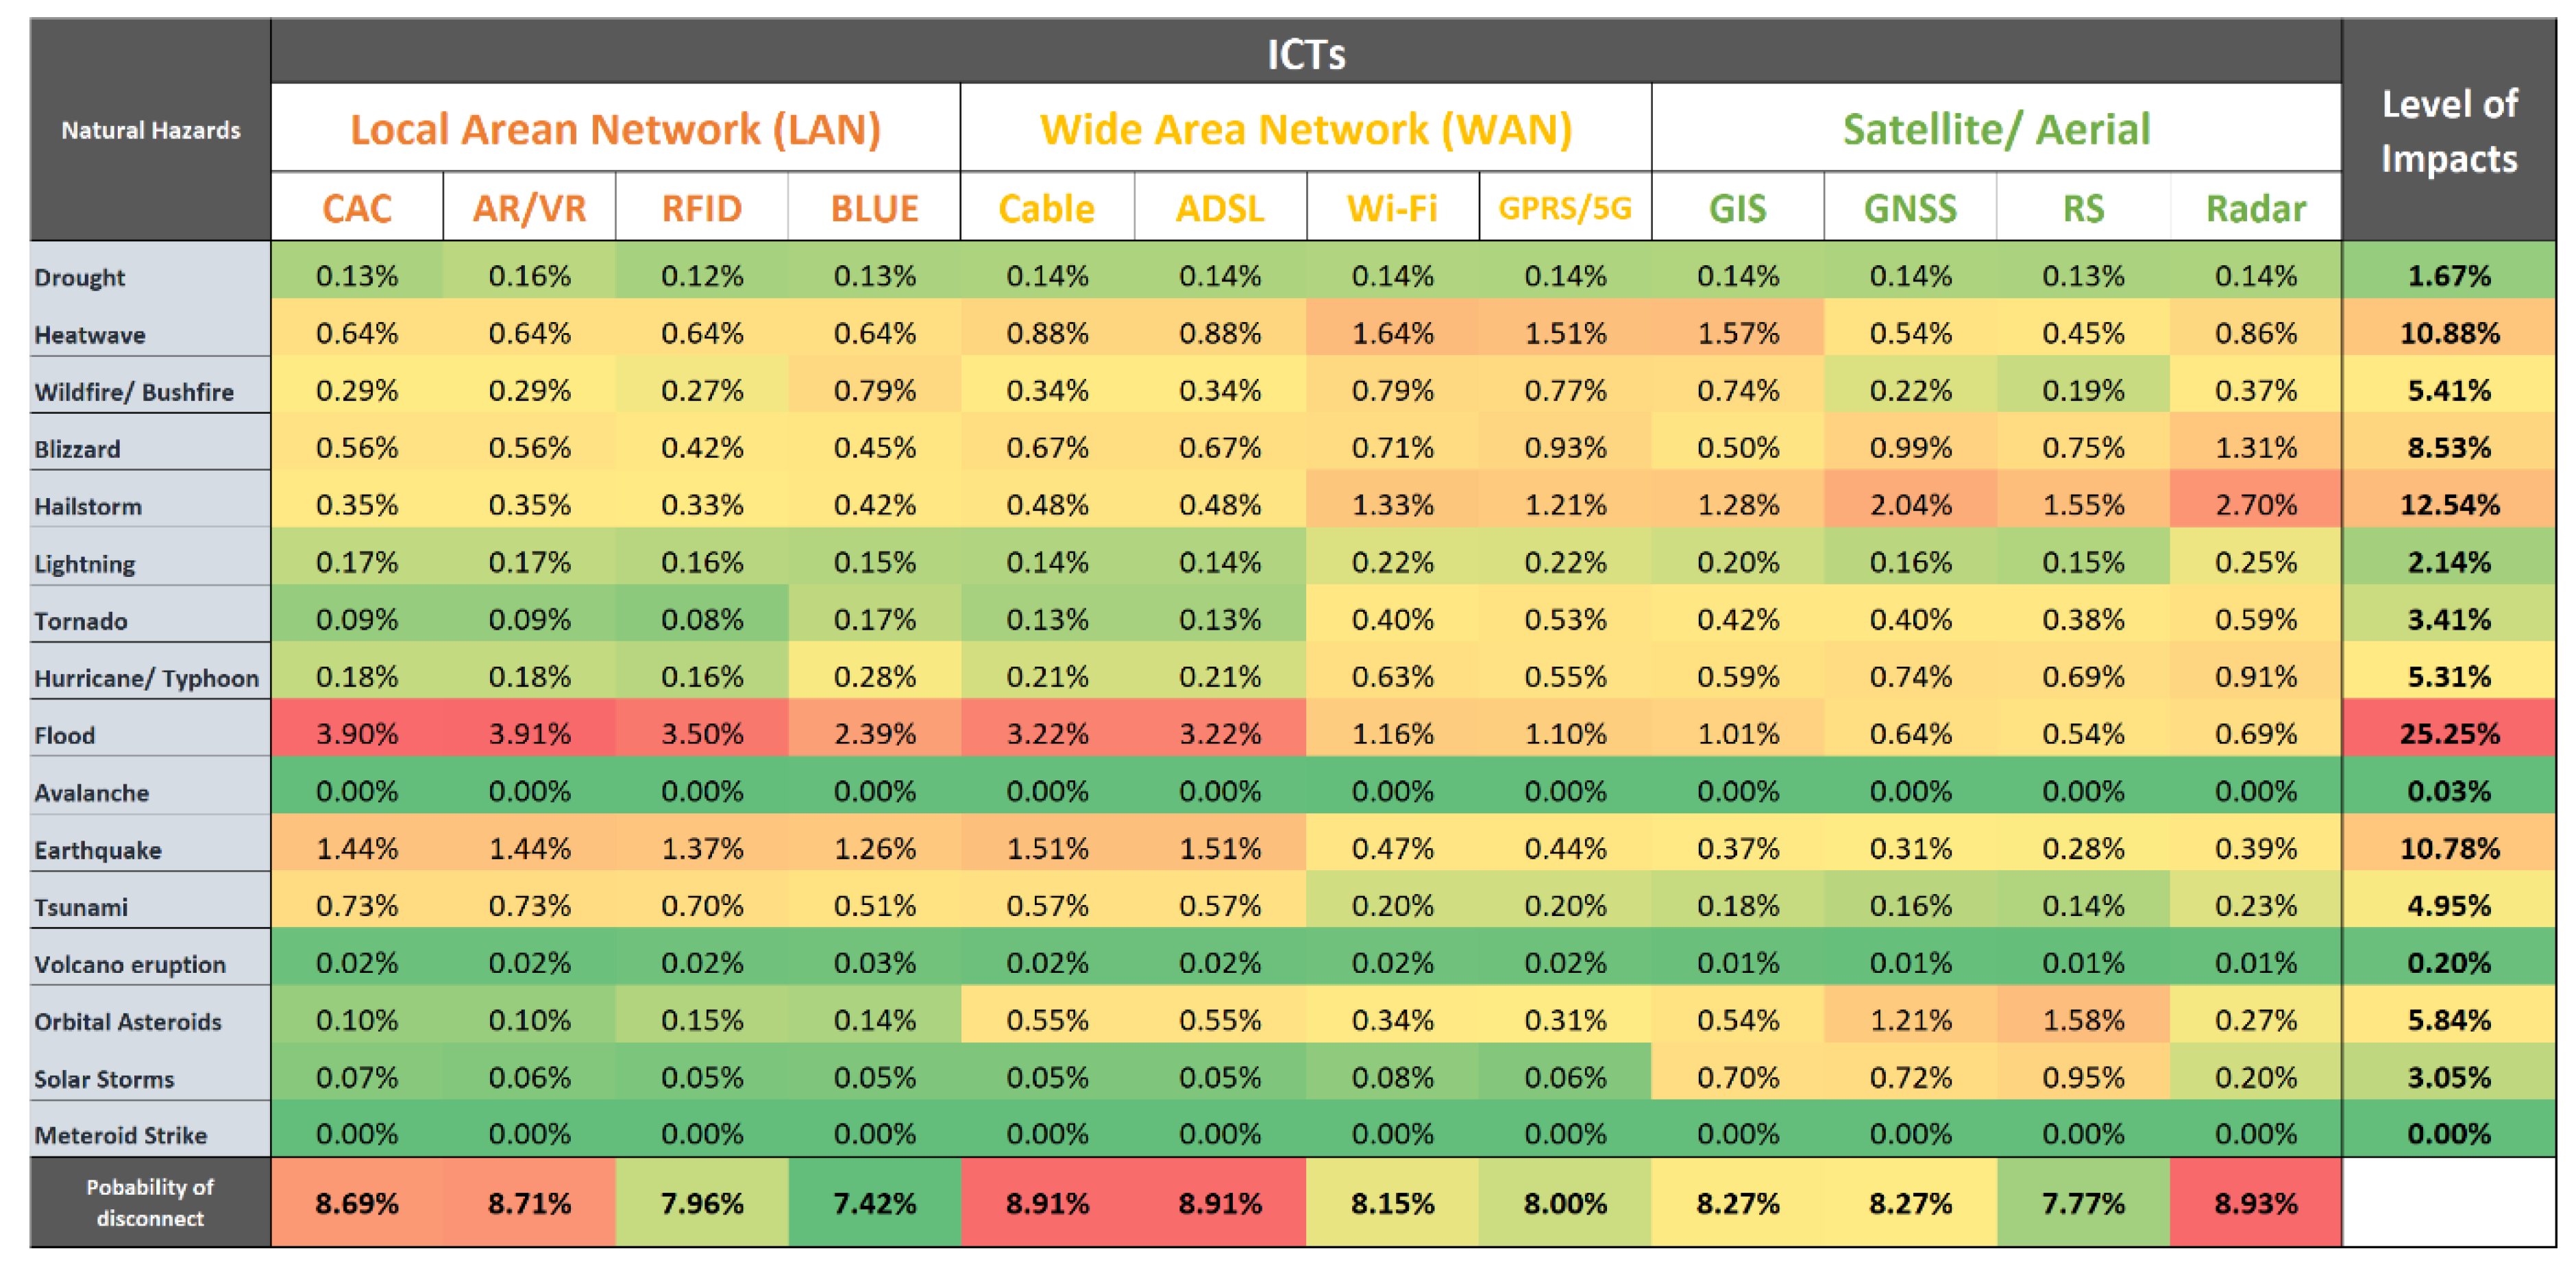
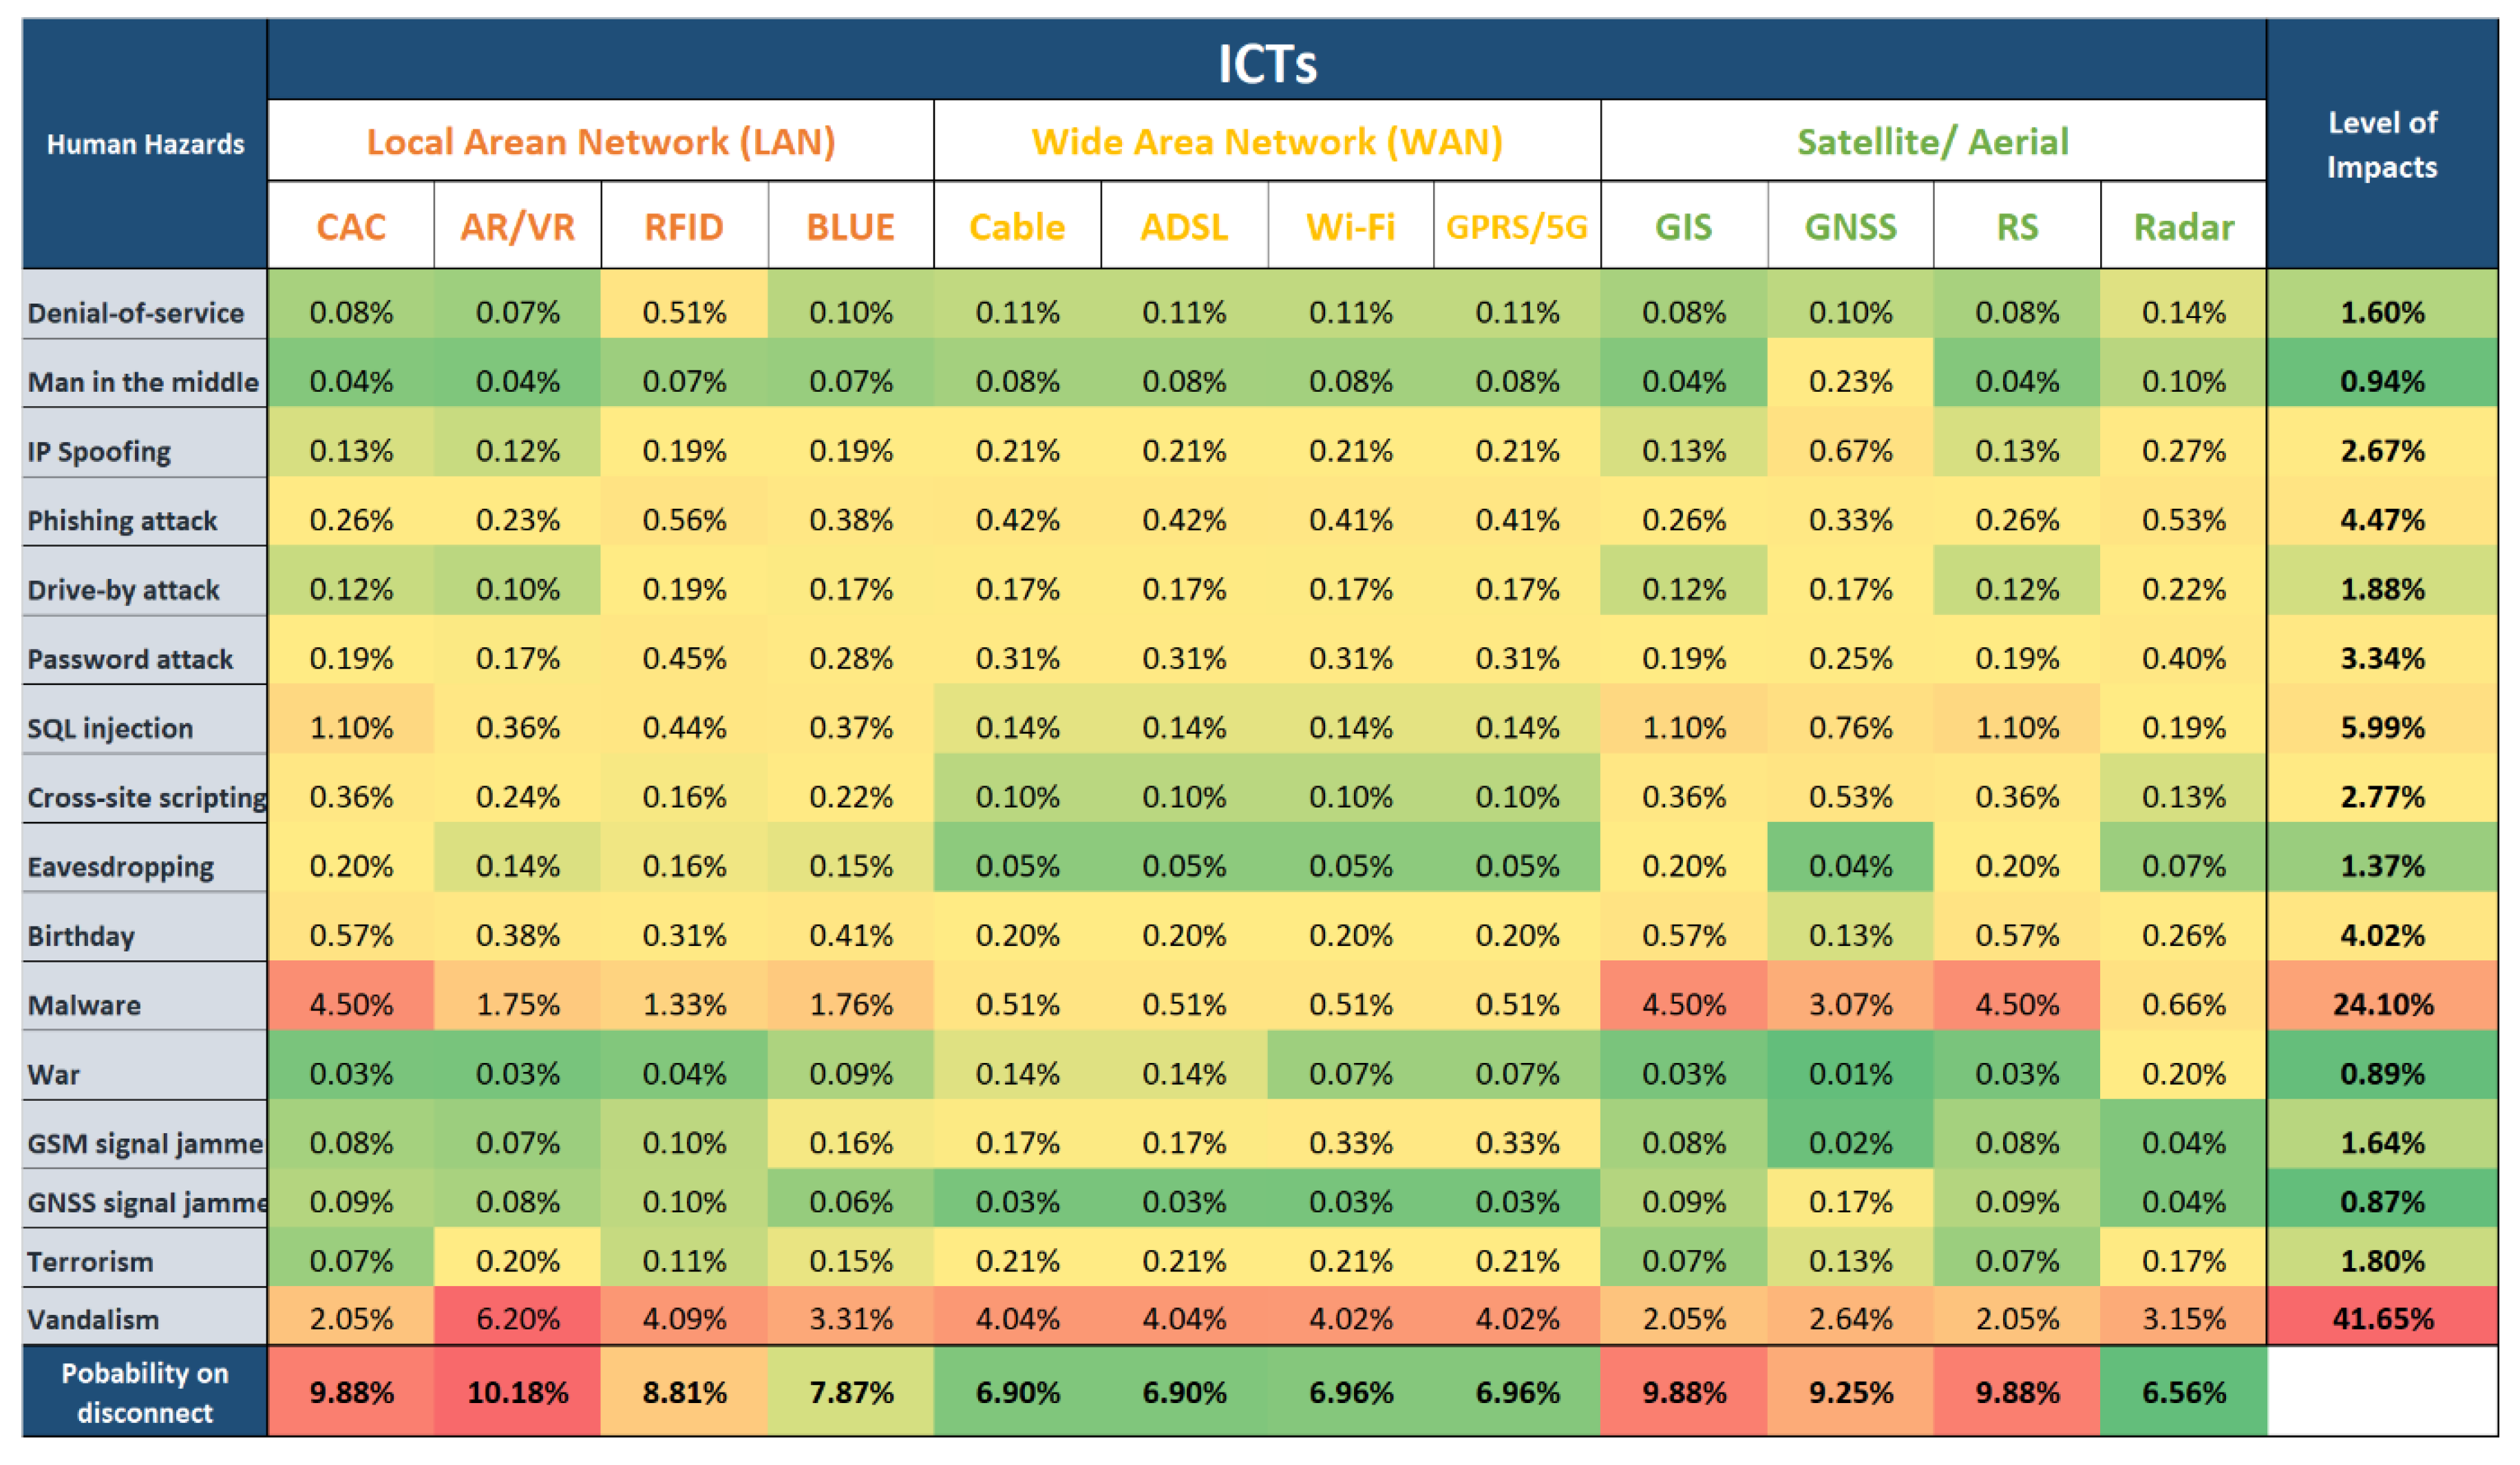
3.3.2. The Impact of Disasters on ICTs

For the analysis purposes, the first step is to establish the ranking for man-made and natural hazards using AHP. Then the impacts of these hazards were estimated on ICTs. As demonstrated in Figure 6 the same process for natural and man-made hazard was followed to rank likelihood, area of influence, and extent of influence (susceptibility) of different ICTs. All disasters were first ranked for their likelihood to occur based on expert opinion as input of the AHP process. In a second step AHP process was carried out to assess the susceptibility of various ICTs against different hazards, which was a tedious and efforts taking process. The vulnerability analysis was carried out without AHP and without considering the area of influence. Those results were rejected by the expert panel and the process was repeated using AHP and considering the area of influence of different disasters. As a result, the outcomes obtained were quite reliable. Figure 7 shows which technologies are affected by some natural disasters. Some hazards being more destructive and catastrophic than others while some ICTs are more susceptible to others some hazards. It is also quite noticeable that natural hazards heavily affect technologies that require physical infrastructure. The exception being GNSS which is satellite technology and resides out of reach of most natural disasters. Floods are the most destructive natural hazard under the climatic and infrastructural conditions of Melbourne. All ICTs are somehow in the same range of vulnerability. However, Cable and ADSL are among the top three due to heavy reliance on these ICTs, and Radar being the one that needs attention due to weather conditions can influence its functioning.
Figure 8 presents the impacts of man-made hazards on ICTs. A very clear and obvious threat is vandalism following by Malware. These two hazards are more influential due to their higher probabilities all over the city and susceptibility of the ICTs to these two types of disasters. Vandalism is a physical-based hazard and Malware is the digital-based or connected to internet hazard which has appeared influential over recent times and can be special to U-cities only due to heavy reliance on ICTs.

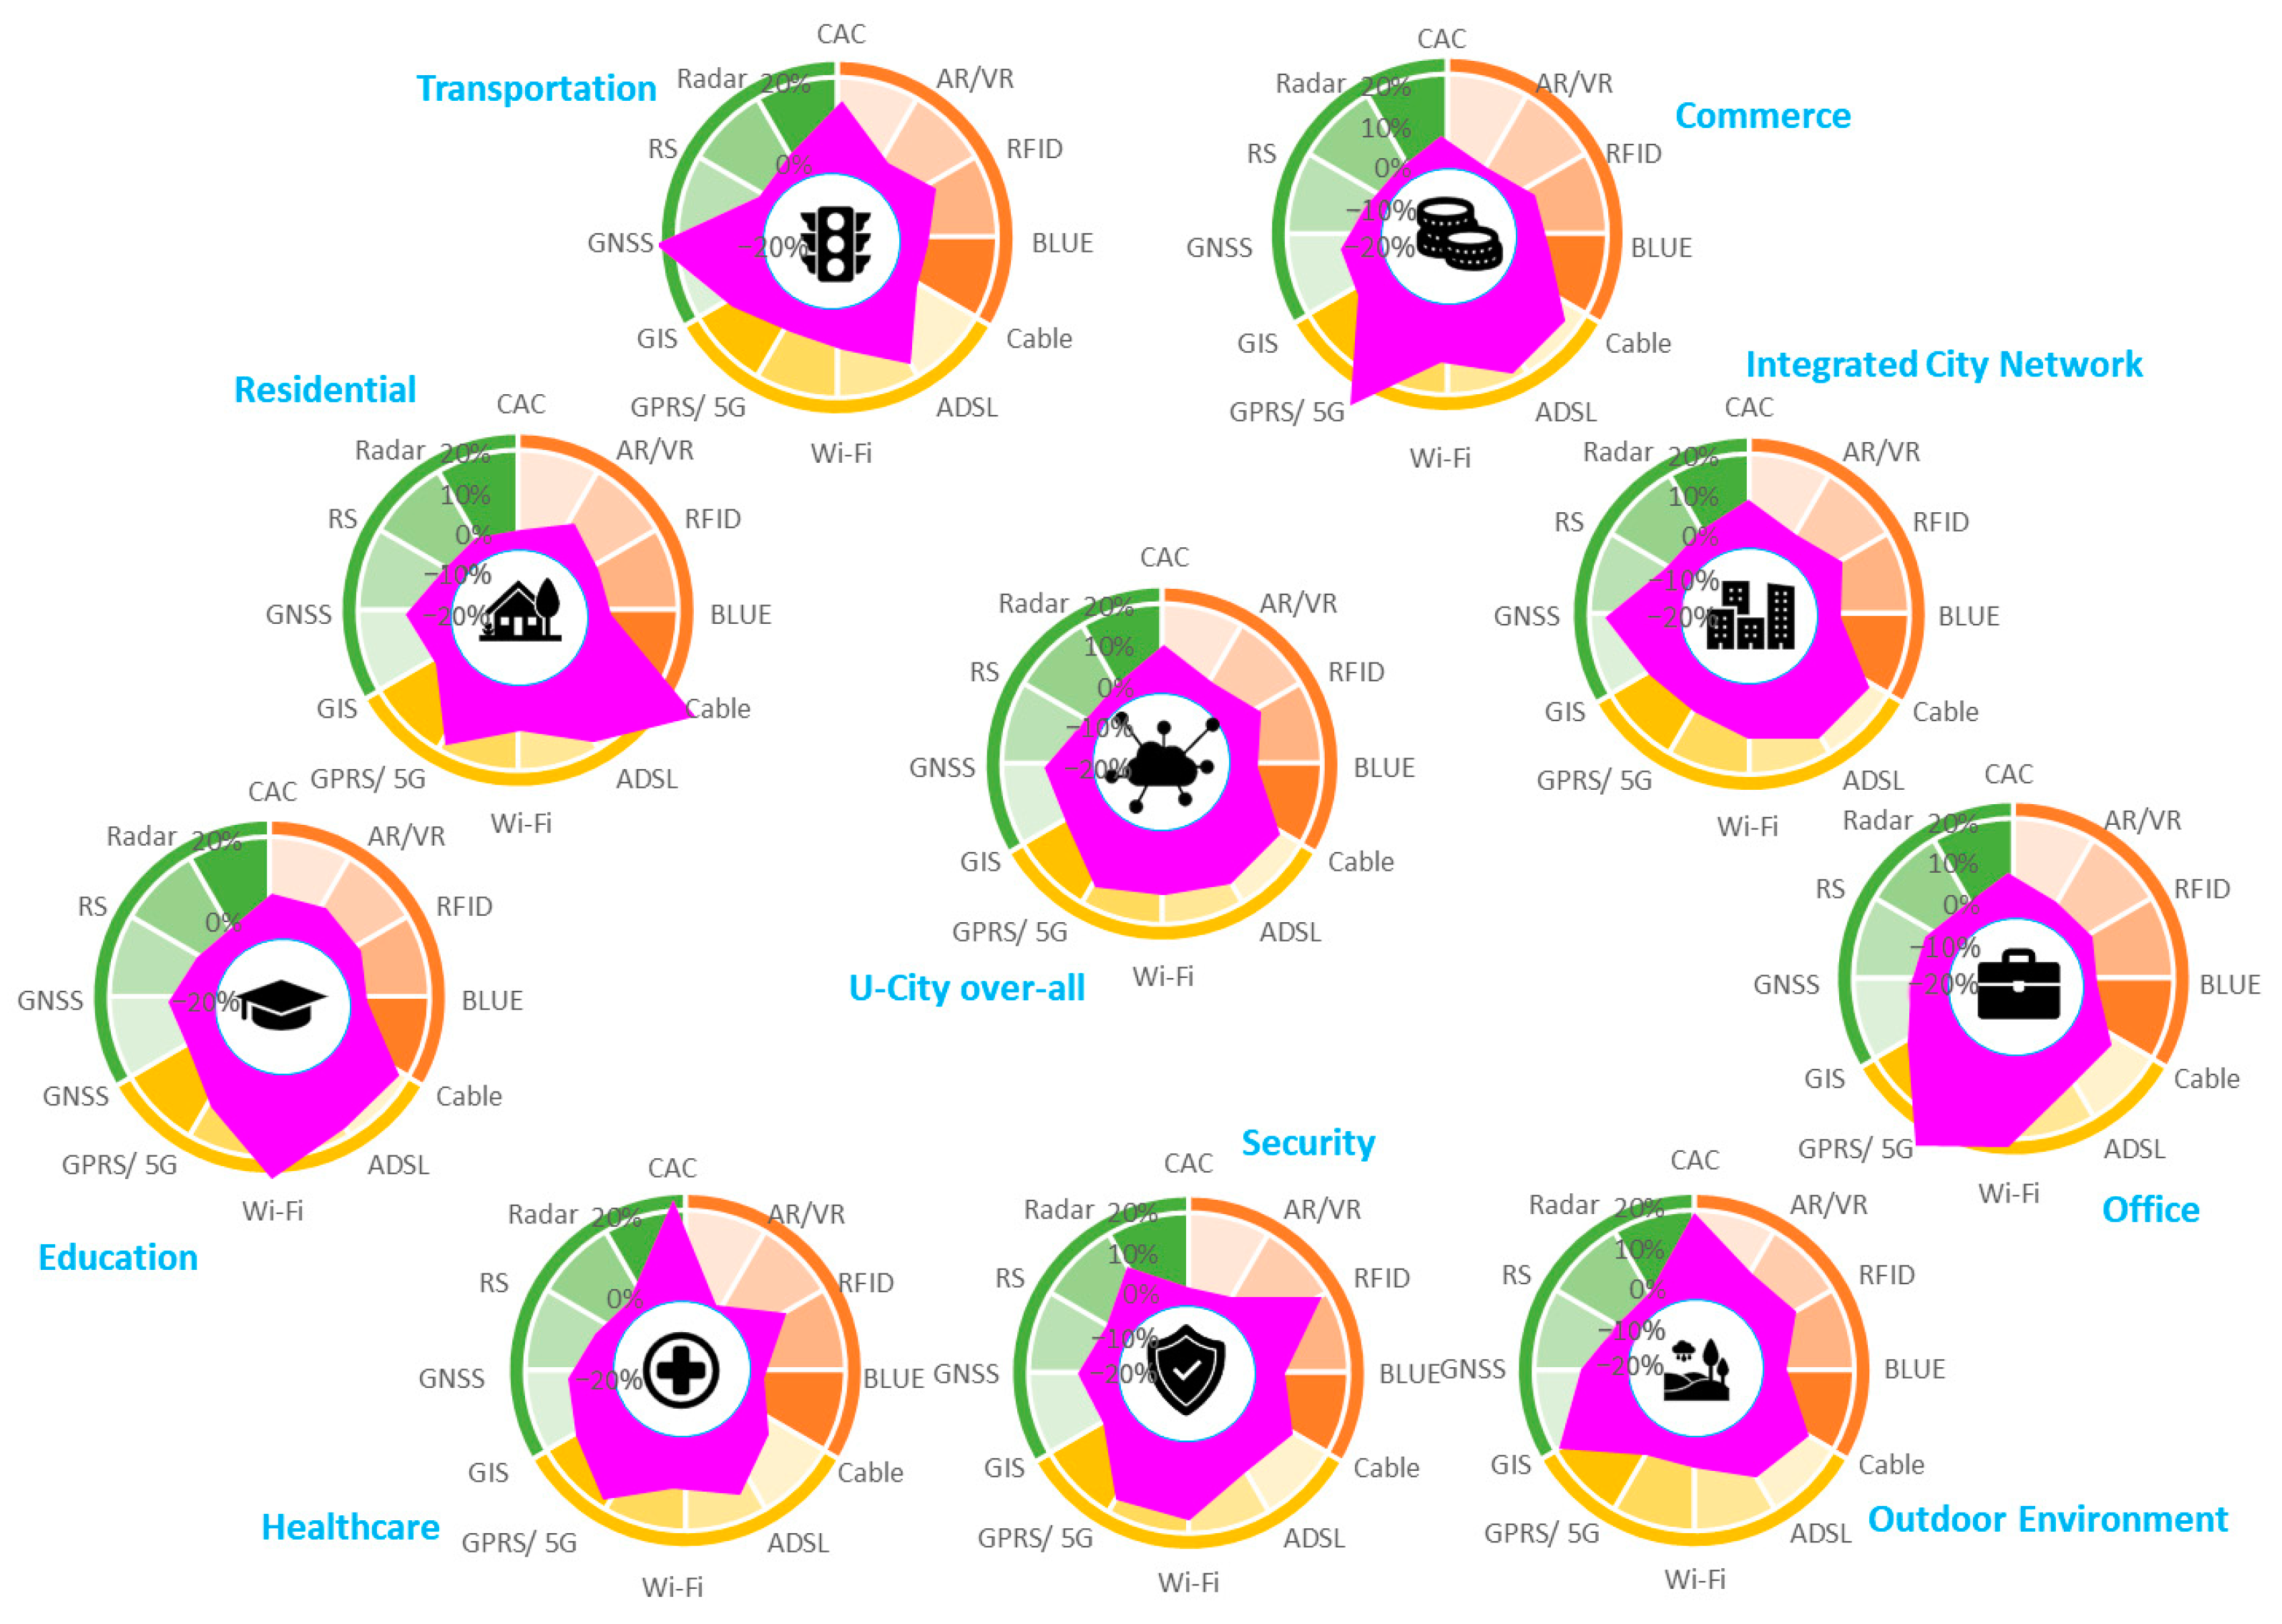
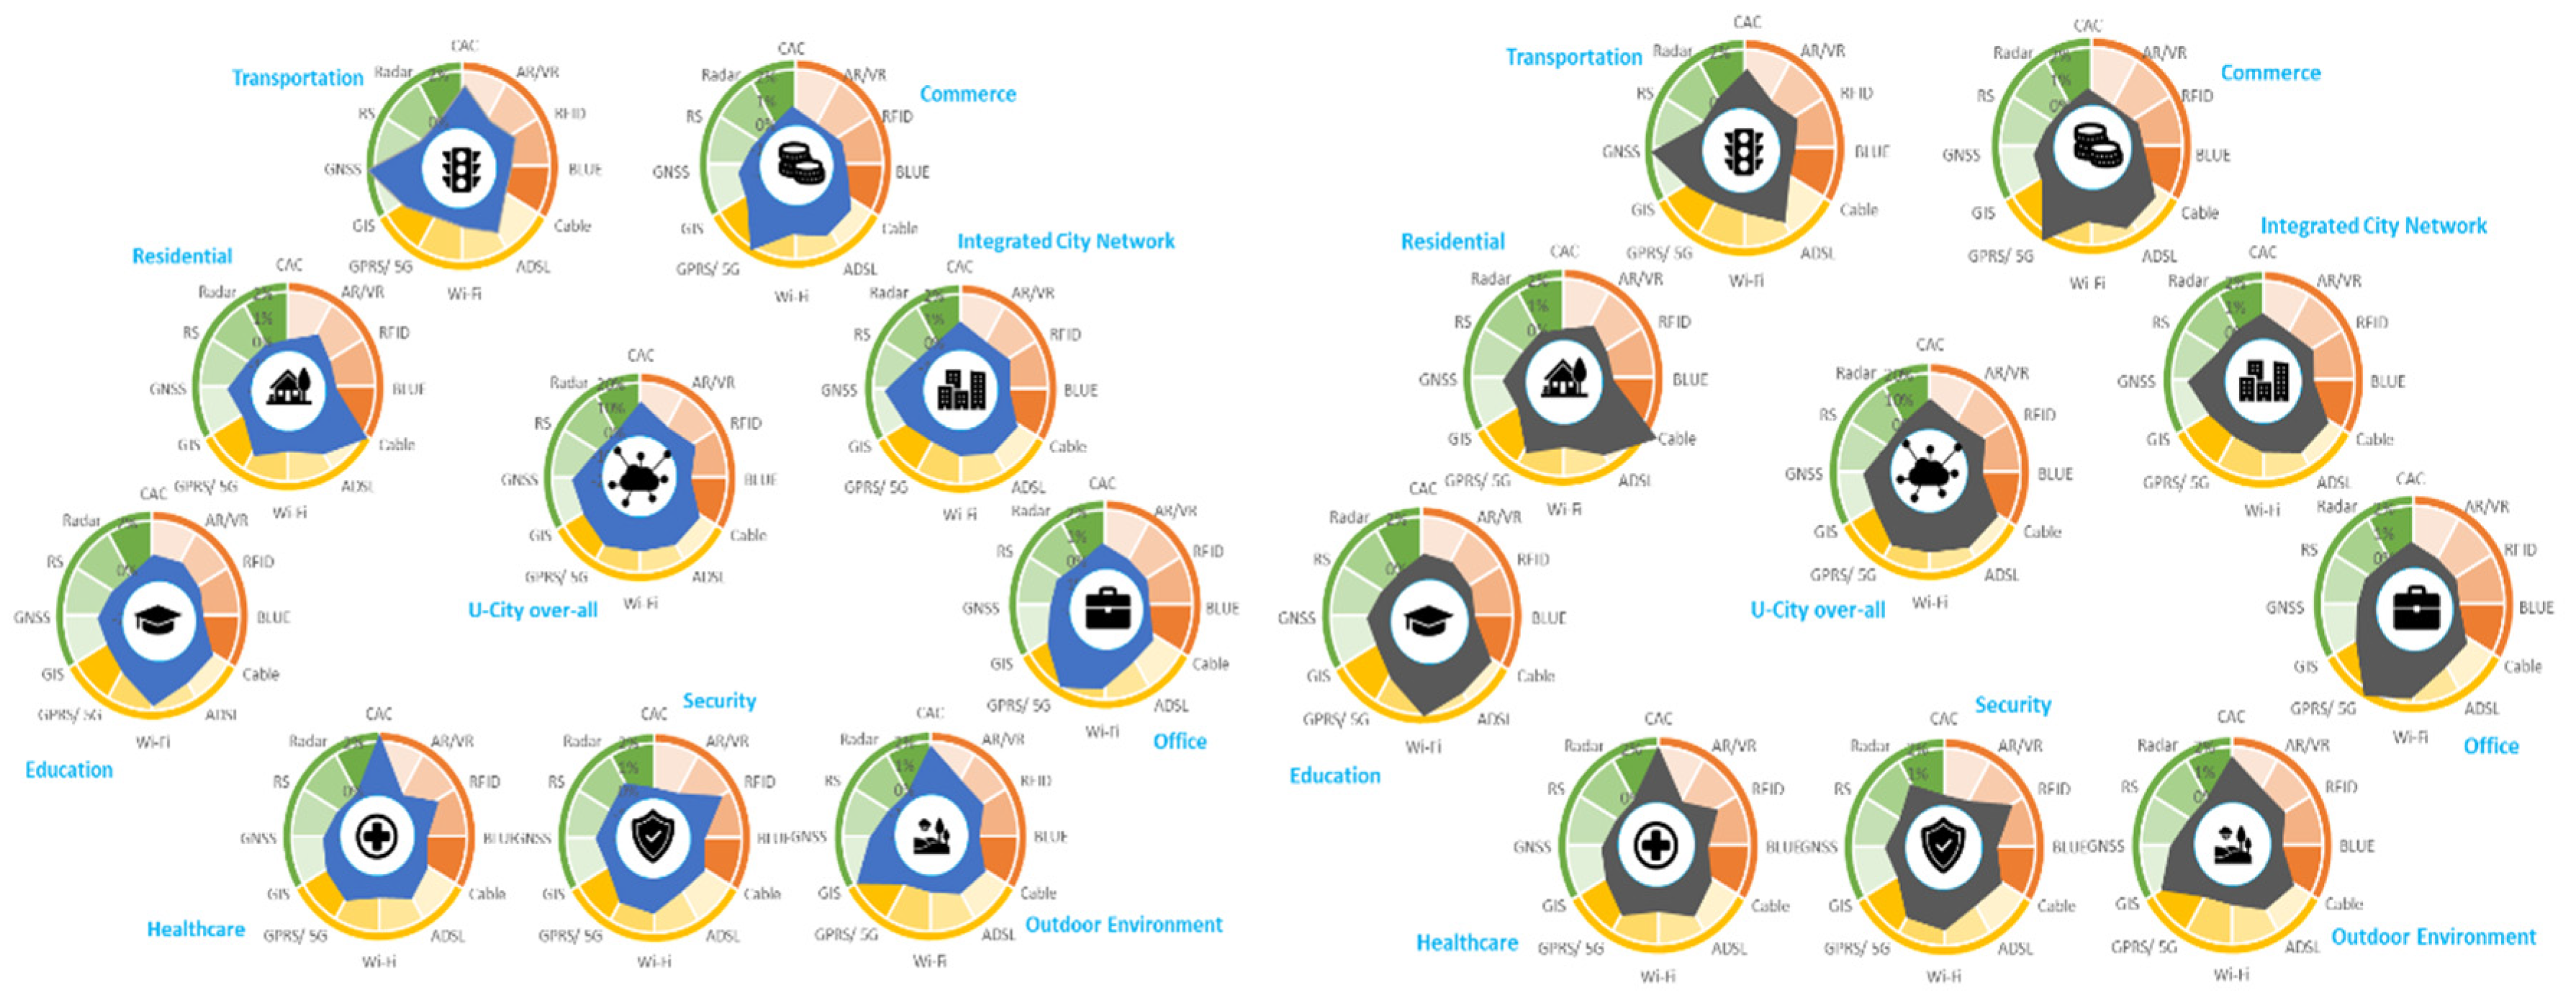
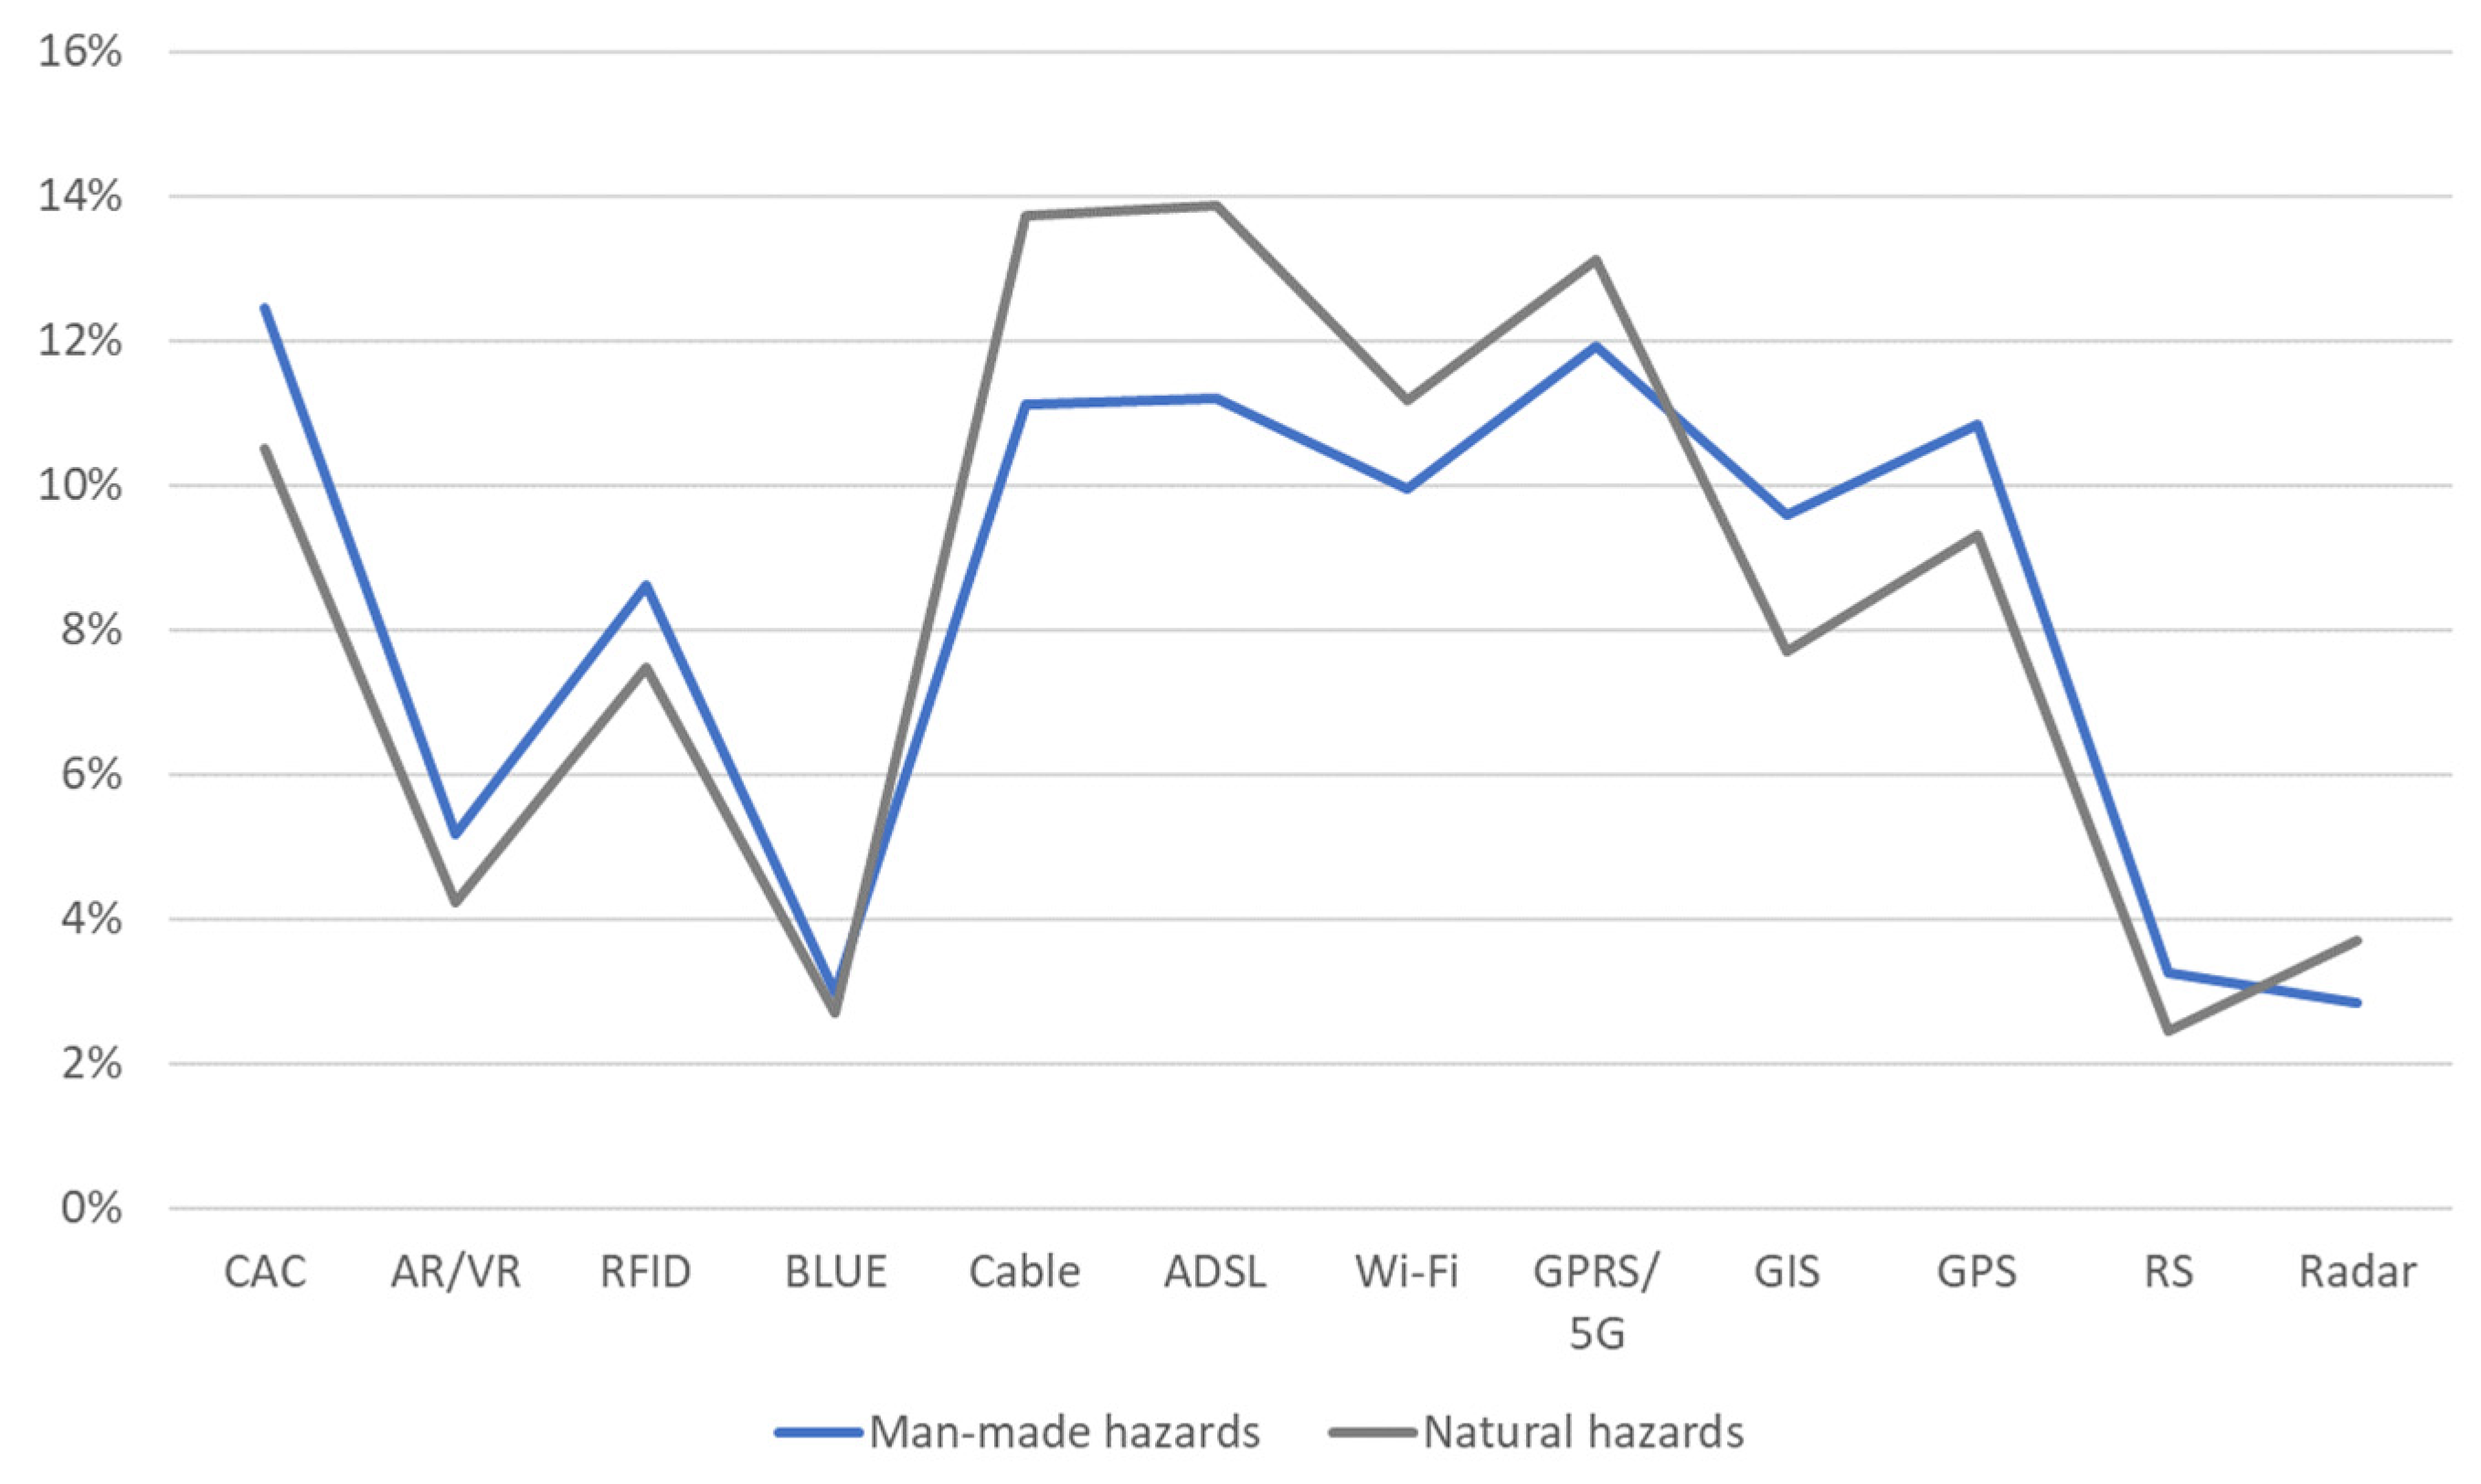
3.4. Overall Vulnerability Assessments of U-City

The reliance of each service area on these ICTs is demonstrated in Figure 9. The overall functioning of U-city depends fairly even on all ICTs. However, Cable, ADSL, Wi-Fi, and 5G are the main ICTs for the functioning of a U-city. Every service area has a biased tilt to one or more ICTs. For example, Commerce uses 5G, Office Wi-Fi, and 5G, Outdoor environment on CAC and GIS, Healthcare CAC, Residential on Cable, etc.
Further assessments of these areas against the hazards develop the vulnerability maps for each service area against man-made and natural hazards (refer to Figure 10). These maps show slight variations to the exposure map (Figure 9). This employs that the impact of natural or man-made hazards mainly depends upon the exposure of each service area to different ICTs.
Vulnerabilities of each ICTs against natural and man-made hazards were analyzed further and it was found that major vulnerable ICTs are Cable, ADSL, and 5G (refer Figure 11). All three ICTs are more vulnerable to natural hazards as compared to man-made hazards. Man-made hazards impact the ICTs relatively more evenly.

4. Conclusions & Recommendations

The study warns about the emerging risks to the modern cities (U-cities). It provides a well-defined systematic approach to identify and quantify the risks imposed to communication-based future cities. As referred in the Section 3, many studies have been conducted for risk assessment of smart cities but the focus on U-cities have been neglected overall so far. The study has an edge over the previous case studies by overcoming the issue of statistical analysis that might become practically impossible for 32 types of natural and man-made hazards.
A U-city provides solutions to ease urban management and help mitigate problems exacerbating major cities. With the advancements in technology, the reliance on these ubiquitous services and technologies are becoming ineluctable. Although, with the added connectivity and infrastructure, additional vulnerabilities have been induced. A comprehensive evaluation of these extended vulnerabilities is essential to foresee future risks and developing precautions in place early in the integration phase of ubiquitous cities. As per the initial analysis of the interconnectivity in the conducted research, it is identified that the services, which rely on minimal connections, need to be reinforced with backup ICTs to ensure a safe failure.
The shift to ICTs-based urban management has not only to induce new vulnerabilities but has come up with new ICT-based hazards. For example, Malware has become the second most effective hazard after vandalism. Vandalism rules out to be the most influential due to a reduction in human-based securities that used work also as street crime watch. Natural hazards are mostly affecting the hardware of the technologies. However, satellite-based networks are affected by severe weather and a Solar storm. Floods are the most damaging hazard due to their severe capability to damage the hardware and frequent occurrence under the climatic conditions of Melbourne. The impact of natural hazards fluctuates slightly more as compared to man-made hazards over different ICTs.
The research is carried out with the assumption of general prevailing conditions. However, due to climatic conditions, man-made hazards including wars, terrorism, or any unforeseen socio-economic crises may develop different scenarios. It is strongly recommended to carry out a few detailed analyses under different scenarios. The presented preliminary studies are conducted for Melbourne, it is recommended to conduct further studies with improved methodologies for different cities around the world to identify more critical vulnerabilities of U-cities. Besides, the role of ICTs and IoT has grown to regional/ rural areas as well. There might be some interesting findings if regional areas are analyzed for their dependence on ICTs with a detailed vulnerability assessment.
A follow up study is being carried out to identify the remedial measures and to evaluate the effectiveness under socio-economic constraints. However, to propose effective mitigation plans that have undergone a comprehensive evaluation procedure are under research. Reduction in susceptibilities of ICTs as well as controlling hazards wherever possible are the initial points of considerations.

Author Contributions

Conceptualization, M.A.U.R.T. and N.M.; Data curation, M.A.U.R.T.; Formal analysis, M.A.U.R.T. and C.Y.W.; Investigation, M.A.U.R.T. and C.Y.W.; Methodology, M.A.U.R.T. and C.Y.W.; Software, M.A.U.R.T. and C.Y.W.; Supervision, M.A.U.R.T. and N.M.; Validation, M.A.U.R.T.; Visualization, M.A.U.R.T. and C.Y.W.; Writing—original draft, M.A.U.R.T. and C.Y.W.; Writing—review & editing, M.A.U.R.T. All authors have read and agreed to the published version of the manuscript.

Funding

This research received no external funding.

Conflicts of Interest

The authors declare no conflict of interest.

References

  1. Management Association. Megacities and Rapid Urbanization; IGI Global: Hershey, PA, USA, 2019. [Google Scholar]
  2. Charles, A. World Economic Forum. 2017. Available online: https://www.weforum.org/agenda/2017/02/cities-must-tirelessly-innovative-to-respond-to-their-challenges/ (accessed on 10 July 2020).
  3. Abellá-García, A.; Ortiz- de-Urbina-Criado, M.; De-Pablos-Heredero, C. The Ecosystem of Services around Smart Cities: An Exploratory Analysis. Procedia Comput. Sci. 2015, 64, 1075–1080. [Google Scholar] [CrossRef] [Green Version]
  4. Garg, S. Impact of Overpopulation on Land Use Pattern. In Megacities and Rapid Urbanization; IGI Global: Hershey, PA, USA, 2019; pp. 1–19. [Google Scholar]
  5. Agudelo-Vera, C.M.; Mels, A.R.; Keesman, K.J.; Rijnaarts, H.H.M. Resource management as a key factor for sustainable urban planning. J. Environ. Manag. 2011, 92, 2295–2303. [Google Scholar] [CrossRef] [PubMed]
  6. Girardet, H. Cities, People, Planet: Urban Development and Climate Change; John Wiley & Sons Ltd.: Chichester, UK, 2008. [Google Scholar]
  7. Shin, D.-H. Ubiquitous City: Urban Technologies, Urban Infrastructure and Urban Informatics. J. Inf. Sci. 2009, 35, 515–526. [Google Scholar] [CrossRef]
  8. Jo, S.-S. An Analysis on the Evolutionary Characteristics of Ubiquitous City through Evolutionary Map of Ubiquitous City. J. Korean Assoc. Geogr. Inf. Stud. 2015, 18, 75–91. [Google Scholar] [CrossRef]
  9. Wong, S.W.; Tang, B.S.; van Horen, B. Strategic urban management in China: A case study of Guangzhou Development District. Habitat. Int. 2006, 30, 645–667. [Google Scholar] [CrossRef] [Green Version]
  10. The Free Library. Incheon FEZ Expects Upturn from Smart City Project. 2018. Available online: https://www.thefreelibrary.com/Incheon+FEZ+expects+upturn+from+Smart+City+project.-a0531750388 (accessed on 20 November 2019).
  11. Engin, Z.; van Dijk, J.; Lan, T.; Longley, P.A.; Treleaven, P.; Batty, M.; Penn, A. Data-driven urban management: Mapping the landscape. J. Urban Manag. 2019, 9, 140–150. [Google Scholar] [CrossRef]
  12. Poslad, S. Ubiquitous Computing: Smart Devices, Environments and Interactions; John Wiley & Sons Ltd.: Chichester, UK, 2009. [Google Scholar]
  13. Hwang, B.J.; Kim, B.S.; Lee, J.Y. Proposes on Essential Ubiquitous City Service to Guarantee Minimum Quality of Ubiquitous City. J. Korean Soc. Geospat. Inf. Syst. 2013, 21, 53–64. [Google Scholar]
  14. Zhu, W.; Panteli, M.; Milanovic, J.V. Reliability and Vulnerability Assessment of Interconnected ICT and Power Networks Using Complex Network Theory. In Proceedings of the 2018 IEEE Power and Energy Society General Meeting (PESGM), Portland, OR, USA, 5–10 August 2018; IEEE: New York, NY, USA, 2018. [Google Scholar] [CrossRef] [Green Version]
  15. Kim, S.H.; Leem, C.S. Security threats and their countermeasures of mobile portable computing devices in ubiquitous computing environments. In Lecture Notes in Computer Science; Springer: Berlin, Germany, 2005; Volume 3483, pp. 79–85. [Google Scholar] [CrossRef]
  16. van Niekerk, B. Vulnerability Assessment of Modern ICT Infrastructure from an Information Warfare Perspective. Ph.D. Thesis, University of Kwazulu-Natal, Durban, South African, 2011. Available online: http://hdl.handle.net/10413/12295 (accessed on 23 January 2020).
  17. Mehmood, Y.; Ahmad, F.; Yaqoob, I.; Adnane, A.; Imran, M.; Guizani, S. Internet-of-Things-Based Smart Cities: Recent Advances and Challenges. IEEE Commun. Mag. 2017, 55, 16–24. [Google Scholar] [CrossRef]
  18. Weiser, M. Some computer science issues in ubiquitous computing. Commun. ACM 1993, 36, 75–84. [Google Scholar] [CrossRef]
  19. Weiser, M.; Gold, R.; Brown, J.; Weiser, G.; Brown, J.M.R. The origins of ubiquitous computing research at PARC in the Late 1980s. IBM Syst. J. 1999, 38, 693–696. [Google Scholar] [CrossRef]
  20. Papa, R.; Gargiulo, C.; Galderisi, A. Towards an urban planners’ perspective on Smart City. TeMA 2013, 6, 5–17. [Google Scholar] [CrossRef]
  21. Lee, J.; Oh, J. New Songdo City and the Value of Flexibility: A Case Study of Implementation and Analysis of a Mega-Scale Project. Ph.D. Thesis, Massachusetts Institute of Technology, Cambridge, MA, USA, 2008. Available online: http://hdl.handle.net/1721.1/58657 (accessed on 23 February 2020).
  22. Lee, M.; Uhm, Y.; Hwang, Z.; Kim, Y.; Jo, J.; Park, S. An Urban Computing Framework for Autonomous Services in A U-City. In Proceedings of the 2007 International Conference on Convergence Information Technology (ICCIT 2007), Gyeongju, Korea, 21–23 November 2007. [Google Scholar] [CrossRef]
  23. Hashemi, M.; Sadeghi-Niaraki, A. A theoretical framework for ubiquitous computing. Int. J. Adv. Pervasive Ubiquitous Comput. 2016, 8, 1–15. [Google Scholar] [CrossRef] [Green Version]
  24. Jang, M.; Suh, S.T. U-City: New Trends of Urban Planning in Korea Based on Pervasive and Ubiquitous Geotechnology and Geoinformation. In Proceedings of the Computational Science and Its Applications—ICCSA 2010, Fukuoka, Japan, 23–26 March 2010; Lecture Notes in Computer Science. Taniar, D., Gervasi, O., Murgante, B., Pardede, E., Apduhan, B.O., Eds.; Springer: Heidelberg, Germany, 2010; Volume 6016. [Google Scholar] [CrossRef]
  25. Bell, G.; Dourish, P. Esterday’s tomorrows: Notes on ubiquitous computing’s dominant vision. Pers. Ubiquitous Comput. 2007, 11, 133–143. [Google Scholar] [CrossRef]
  26. Lee, J.; Lee, H.; Kim, T. Evaluating and assessing a typology of ubiquitous city services by classifying and assigning actual services from an inventory of identified services in practice. In Proceedings of the 6th International Conference on Theory and Practice of Electronic Governance; ACM International Conference Proceeding Series; ACM: Albany, NY, USA, 2012; pp. 279–285. [Google Scholar] [CrossRef]
  27. Lee, S.H.; Han, J.H.; Leem, Y.T.; Yigitcanlar, T. Towards Ubiquitous City: Concept, Planning, and Experiences in the Republic of Korea; IGI Global: Hershey, PA, USA, 2008. [Google Scholar]
  28. Capeluto, I.G.; Ben-Avraham, O.; Capeluto, O.B.-A.I.G. Assessing the green potetial of existing buildings towards smart cities and districts. Indoor Built Environ. 2015, 25, 1124–1135. [Google Scholar] [CrossRef]
  29. Gaddis, J.L. Rethinking Cold War History; Oxford University Press: New York, NY, USA, 1997. [Google Scholar]
  30. Villa, V. Progressive energy retrofit for the educational building stock in a smart city. In Proceedings of the 2016 IEEE International Smart Cities Conference (ISC2), Trento, Italy, 3 October 2016; p. 1. [Google Scholar] [CrossRef]
  31. Lee, J.; Baik, S.; Lee, C.C. Building an integrated service management platform for ubiquitous cities. Computer 2011, 44, 56–63. [Google Scholar] [CrossRef]
  32. Leem, C.S.; Kim, B.G. Taxonomy of ubiquitous computing service for city development. Pers. Ubiquitous Comput. 2013, 17, 1475–1483. [Google Scholar] [CrossRef]
  33. Suopajärvi, T.; Ylipulli, J.; Kinnunen, T. ‘Realities behind ICT Dreams’ Designing a Ubiquitous City in a Living Lab Environment. Int. J. Gend. Sci. Technol. 2012, 4, 231–252. [Google Scholar]
  34. What Determines Bluetooth Range? Available online: https://www.bluetooth.com/learn-about-bluetooth/bluetooth-technology/range/ (accessed on 13 November 2020).
  35. Rouse, M. RFID (Radio Frequency Identification). 2007. Available online: https://internetofthingsagenda.techtarget.com/definition/RFID-radio-frequency-identification (accessed on 13 November 2020).
  36. Wei, E.J.Y.; Chan, A.T.S. Towards Context-Awareness in Ubiquitous Computing. In Embedded and Ubiquitous Computing 2007; Springer: Heidelberg, Germany, 2007; pp. 706–717. [Google Scholar] [CrossRef] [Green Version]
  37. The Important Difference between Virtual Reality, Augmented Reality and Mixed Reality. 2019. Available online: https://www.forbes.com/sites/bernardmarr/2019/07/19/the-important-difference-between-virtual-reality-augmented-reality-and-mixed-reality/?sh=585ee3dc35d3 (accessed on 13 November 2020).
  38. Telstra. ADSL2+, ADSL Plans. 2020. Available online: https://www.telstra.com.au/internet/adsl (accessed on 13 November 2020).
  39. Beal, V. ADSL-Asymmetric Digital Subscriber Line. 2020. Available online: https://www.webopedia.com/TERM/A/ADSL.html (accessed on 13 November 2020).
  40. ICACT. Broadband Convergence Network [BcN] for ubiquitous Korea vision. In Proceedings of the 7th International Conference on Advanced Communication Technology, Phoenix Park, Korea, 21–23 February 2005; pp. 168–181. [Google Scholar] [CrossRef]
  41. FTTP vs. FTTN vs. FTTC: Connections to the National Broadband Network Explained, Aussie Broadband Blog. 2018. Available online: https://www.aussiebroadband.com.au/blog/fttp-vs-fttn-connections-national-broadband-network-explained/ (accessed on 13 November 2020).
  42. A Brief History of GPRS, 3G, 4G and the Latest 5G Mobile Network Technology. 2018. Available online: https://www.raptorhub.com/guides/4g (accessed on 13 November 2020).
  43. Evers, J. Encyclopedic Entry: GIS (Geographic Information System). National Geographic Society. 2017. Available online: https://www.nationalgeographic.org/encyclopedia/geographic-information-system-gis/#:~:text=Ageographicinformationsystem (accessed on 13 November 2020).
  44. Ferreira, R. White Paper: Where to Place the Frotcom GPS Terminal Inside a Vehicle; Frotcom: Piatra Neamt, Romania, 2019. [Google Scholar]
  45. NOAA. What Is Remote Sensing? 2020. Available online: https://oceanservice.noaa.gov/facts/remotesensing.html (accessed on 14 November 2020).
  46. RADAR-Basics, Types & Applications. 2020. Available online: https://www.elprocus.com/radar-basics-types-and-applications/ (accessed on 14 November 2020).
  47. Lea, R.; Blackstock, M. City hub: A cloud-based IoT platform for smart cities. In Proceedings of the 2014 IEEE 6th International Conference on Cloud Computing Technology and Science, Singapore, 15–18 December 2014; IEEE: Singapore, 2015; pp. 799–804. [Google Scholar] [CrossRef] [Green Version]
  48. Farahzadi, A.; Shams, P.; Rezazadeh, J.; Farahbakhsh, R. Middleware technologies for cloud of things: A survey. Digit. Commun. Netw. 2018, 4, 176–188. [Google Scholar] [CrossRef]
  49. Saxby, R. The Advancing Importance of System on a Chip Technology & Application. In TechTarget; IET: London, UK, 2003; Available online: https://search.ebscohost.com/login.aspx?direct=true&AuthType=shib&db=cat06414a&AN=vic.b4585372&site=eds-live (accessed on 14 November 2020).
  50. Botta, A.; de Donato, W.; Persico, V.; Pescapé, A. On the Integration of Cloud Computing and Internet of Things. In Proceedings of the 2014 International Conference on Future Internet of Things and Cloud, Barcelona, Spain, 27–29 August 2014; IEEE: Barcelona, Spain, 2014; pp. 23–30. [Google Scholar] [CrossRef]
  51. Bachani, M.; Memon, A.; Shaikh, F.K. Sensors network: In regard with the security aspect and counter measures. In Network Security Attacks and Countermeasures; IGI Global: Hershey, PA, USA, 2016; pp. 176–196. [Google Scholar] [CrossRef]
  52. Kibirige, G.W.; Sanga, C.A. Attacks in wireless sensor networks. In Network Security Attacks and Countermeasures; IGI Global: Hershey, PA, USA, 2016; pp. 157–175. [Google Scholar] [CrossRef]
  53. Virupakshar, K.B.; Asundi, M.; Channal, K.; Shettar, P.; Patil, S.; Narayan, D.G. Distributed Denial of Service (DDoS) Attacks Detection System for OpenStack-based Private Cloud. Procedia Comput. Sci. 2020, 167, 2297–2307. [Google Scholar] [CrossRef]
  54. Al-Hababi, A.; Tokgoz, S.C. Man-in-the-Middle Attacks to Detect and Identify Services in Encrypted Network Flows using Machine Learning. In Proceedings of the 2020 3rd International Conference on Advanced Communication Technologies and Networking (CommNet), Marrakech, Morocco, 4–6 September 2020. [Google Scholar] [CrossRef]
  55. Spitzner, L. Endpoint Protection-Symantec Enterprise. IP Spoofing: An Introduction. 2003. Available online: https://community.broadcom.com/symantecenterprise/communities/community-home/librarydocuments/viewdocument?DocumentKey=9d18fc06-b229-4c4a-8ca5-7386d0870c01&CommunityKey=1ecf5f55-9545-44d6-b0f4-4e4a7f5f5e68&tab=librarydocuments (accessed on 16 November 2020).
  56. The Difference between Phishing and Spear Phishing|PhishProtection.com. Available online: https://www.phishprotection.com/content/phishing-prevention/difference-between-phishing-and-spear-phishing/ (accessed on 16 November 2020).
  57. Simmonds, M. Beware the drive-by attack. Comput. Fraud Secur. 2016, 2016, 19–20. [Google Scholar] [CrossRef]
  58. Password Attacks|Infosavvy Security and IT Management Training. Available online: https://info-savvy.com/password-attacks/ (accessed on 16 November 2020).
  59. Porup, J.M. What Is sql Injection? How SQLi Attacks Work and How to Prevent Them|CSO Online. 2018. Available online: https://www.csoonline.com/article/3257429/what-is-sql-injection-how-these-attacks-work-and-how-to-prevent-them.html (accessed on 16 November 2020).
  60. What Is a Cross-Site Scripting (XSS) Attack: Definition & Examples. Available online: https://www.ptsecurity.com/ww-en/analytics/knowledge-base/what-is-a-cross-site-scripting-xss-attack/ (accessed on 16 November 2020).
  61. York, D. Chapter 3—Eavesdropping and Modification. In Seven Deadliest Unified Communications Attacks; York, D., Ed.; Elsevier: Burlington, VT, USA, 2010; pp. 41–69. [Google Scholar] [CrossRef]
  62. What Is a Birthday Attack and How to Prevent It? Available online: https://www.internetsecurity.tips/birthday-attack/ (accessed on 16 November 2020).
  63. Patel, V.; Choe, S.; Halabi, T. Predicting Future Malware Attacks on Cloud Systems using Machine Learning. In Proceedings of the 2020 IEEE 6th International Conference on Big Data Security on Cloud, Baltimore, MD, USA, 25–27 May 2020; pp. 151–156. [Google Scholar] [CrossRef]
  64. GNSS Jammers and Its Impacts in Military Defense—VisionSpace Blog. Available online: https://visionspace.blog/blog/2020/2/27/gnss-jammers-and-its-impacts-in-military-defense (accessed on 16 November 2020).
  65. Do Weather Conditions Affect GPS Accuracy? 2016. Available online: https://www.frotcom.com/blog/2016/11/do-weather-conditions-affect-gps-accuracy (accessed on 17 November 2020).
  66. El-Sayed, K.A.; Sakr, M.A.; Awad, E.A. National Seismic Network and Earthquake Activities in Egypt. Earthq. Hazards Mitig. 2007, 7, 88–101. [Google Scholar]
  67. Surge and Lightning Damage to Electronics. 2016. Available online: https://strikecheck.com/webinars/surge-and-lightning-damage-to-electronics/ (accessed on 17 November 2020).
  68. Carlos. Can Solar Panels Be Damaged by Hail? 2019. Available online: https://ecotality.com/can-solar-panels-be-damaged-by-hail/ (accessed on 17 November 2020).
  69. How Summer Heat Can Affect Your Internet. 2018. Available online: https://www.softcom.net/how-summer-heat-can-affect-your-internet/ (accessed on 17 November 2020).
  70. Hale, J. Can the Weather Affect Your Wi-Fi? Here’s Why Your Internet Seems Slow When It’s Gross Out. 2018. Available online: https://www.bustle.com/p/can-the-weather-affect-your-wi-fi-heres-why-your-internet-seems-slow-when-its-gross-out-9215741 (accessed on 17 November 2020).
  71. Byrd, D. Are Solar Storms Dangerous to Us? 2020. Available online: https://earthsky.org/space/are-solar-storms-dangerous-to-us (accessed on 18 November 2020).
  72. Tornadoes, Explained: Learn How These Deadly Storms Form and Wreak Havoc, and How You can Reduce Your Risk. National Geographic Society. 2019. Available online: https://www.nationalgeographic.com/environment/natural-disasters/tornadoes/ (accessed on 18 November 2020).
  73. Deziel, C. What Damage Do Tsunamis Cause? 2018. Available online: https://sciencing.com/tsunami-created-8747310.html (accessed on 18 November 2020).
  74. Xiao, R.; He, X.; Zhang, Y.; Ferreira, V.G.; Chang, L. Monitoring groundwater variations from satellite gravimetry and hydrological models: A comparison with in-situ measurements in the mid-atlantic region of the United States. Remote Sens. 2015, 7, 686–703. [Google Scholar] [CrossRef] [Green Version]
  75. Tonkin, C. Telcos Scramble to Fix Networks during Bushfires. 2020. Available online: https://ia.acs.org.au/article/2020/telcos-scramble-to-fix-rural-networks-during-bushfires.html (accessed on 18 November 2020).
  76. Gandini, A.; Garmendia, L.; Prieto, I.; Álvarez, I.; San-José, J.-T. A holistic and multi-stakeholder methodology for vulnerability assessment of cities to flooding and extreme precipitation events. Sustain. Cities Soc. 2020, 63, 102437. [Google Scholar] [CrossRef]
  77. Tapia, C. Profiling urban vulnerabilities to climate change: An indicator-based vulnerability assessment for European cities. Ecol. Indic. 2017, 78, 142–155. [Google Scholar] [CrossRef]
  78. Mohamed, S.A.; El-Raey, M.E. Vulnerability assessment for flash floods using GIS spatial modeling and remotely sensed data in El-Arish City, North Sinai, Egypt. Nat. Hazards 2020, 102, 707–728. [Google Scholar] [CrossRef]
  79. Murali, R.M.; Riyas, M.J.; Reshma, K.N.; Kumar, S.S. Climate change impact and vulnerability assessment of Mumbai city, India. Nat. Hazards 2020, 102, 575–589. [Google Scholar] [CrossRef]
  80. Arouq, M.K.; Esmaeilpour, M.; Sarvar, H. Vulnerability assessment of cities to earthquake based on the catastrophe theory: A case study of Tabriz city, Iran. Environ. Earth Sci. 2020, 79, 354. [Google Scholar] [CrossRef]
  81. Adnan, S.; Ullah, K. Development of drought hazard index for vulnerability assessment in Pakistan. Nat. Hazards 2020, 103, 2989–3010. [Google Scholar] [CrossRef]
  82. Alelaiwi, A. Evaluating distributed IoT databases for edge/cloud platforms using the analytic hierarchy process. J. Parallel Distrib. Comput. 2019, 124. [Google Scholar] [CrossRef]
  83. Myeong, S.; Jung, Y.; Lee, E. A study on determinant factors in smart city development: An analytic hierarchy process analysis. Sustainability 2018, 10, 2606. [Google Scholar] [CrossRef] [Green Version]
  84. Jnr, B.A. Validating the usability attributes of AHP-software risk prioritization model using partial least square-structural equation modeling. J. Sci. Technol. Policy Manag. 2019, 10. [Google Scholar] [CrossRef]
  85. Pal, S.C.; Das, B.; Malik, S. Potential Landslide Vulnerability Zonation Using Integrated Analytic Hierarchy Process and GIS Technique of Upper Rangit Catchment Area, West Sikkim, India. J. Indian Soc. Remote Sens. 2019, 47, 1643–1655. [Google Scholar] [CrossRef]
  86. Sami, G.; Hadda, D.; Mahdi, K.; Abdelwahhab, F. A Multi-criteria Analytical Hierarchy Process (AHP) to Flood Vulnerability Assessment in Batna Watershed (Algeria). Analele Univ. Oradea Ser. Geogr. 2020, 30. [Google Scholar] [CrossRef]
  87. Dandapat, K.; Panda, G.K. Flood vulnerability analysis and risk assessment using analytical hierarchy process. Model. Earth Syst. Environ. 2017, 3, 1627–1646. [Google Scholar] [CrossRef]
  88. Ghosh, A.; Kar, S.K. Application of analytical hierarchy process (AHP) for flood risk assessment: A case study in Malda district of West Bengal, India. Nat. Hazards 2018, 94, 349–368. [Google Scholar] [CrossRef]
  89. Behera, R.; Kar, A.; Das, M.R.; Panda, P.P. GIS-based vulnerability mapping of the coastal stretch from Puri to Konark in Odisha using analytical hierarchy process. Nat. Hazards 2019, 96, 731–751. [Google Scholar] [CrossRef]
  90. Monjardin, C.E.F.; Tan, F.J.; Uy, F.A.A.; Bale, F.J.P.; Voluntad, E.O.; Batac, R.M.N. Assessment of the Existing Drainage System in Infanta, Quezon Province for Flood Hazard Management using Analytical Hierarchy Process. In Proceedings of the 2020 IEEE Conference on Technologies for Sustainability (SusTech), Santa Ana, CA, USA, 23–25 April 2020; IEEE: Santa Ana, CA, USA, 2020; pp. 1–7. [Google Scholar] [CrossRef]
  91. Abomhara, M.; Køien, G.M. Cyber Security and the Internet of Things: Vulnerabilities, Threats, Intruders and Attacks. J. Cyber Secur. Mobil. 2015, 4, 65–88. [Google Scholar] [CrossRef]
  92. Hwang, Y.H. IoT Security & Privacy: Threats and Challenges. In Proceedings of the 1st ACM Workshop on IoT Privacy, Trust, and Security, New York, NY, USA, April 2015; p. 1. Available online: https://dl.acm.org/citation.cfm?id=2732216 (accessed on 21 December 2020). [CrossRef]
  93. Kim, J.; Choi, H.; Ryou, J. Countermeasures to Vulnerability of Certificate Application in u-City. In Proceedings of the 2010 5th International Conference on Ubiquitous Information Technologies and Applications, Sanya, China, 16–18 December 2010; pp. 1–5. [Google Scholar] [CrossRef]
  94. Forsström, S.; Butun, I.; Eldefrawy, M.; Jennehag, U.; Gidlund, M. Challenges of Securing the Industrial Internet of Things Value Chain. In Proceedings of the 2018 Workshop on Metrology for Industry 4.0 and IoT, Brescia, Italy, 16–18 April 2018; pp. 218–223. [Google Scholar] [CrossRef] [Green Version]
  95. Yin, M.; Wang, Q.; Cao, M. An Attack Vector Evaluation Method for Smart City Security Protection. In Proceedings of the 2019 International Conference on Wireless and Mobile Computing, Networking and Communications (WiMob), Barcelona, Spain, 21–23 October 2019; pp. 1–7. [Google Scholar] [CrossRef]
  96. Kazemi, Z.; Fazeli, M.; Hely, D.; Beroulle, V. Hardware Security Vulnerability Assessment to Identify the Potential Risks in a Critical Embedded Application. In Proceedings of the 2020 IEEE 26th International Symposium on On-Line Testing and Robust System Design (IOLTS), Napoli, Italy, 13–15 July 2020; pp. 1–6. [Google Scholar] [CrossRef]
  97. Tariq, M.A.U.R.; van de Giesen, N.C. Risk-Based Planning and Optimization of Flood Management Measures in Developing Countries: Case Pakistan Volume. Ph.D. Thesis, Delft University of Technology, Delft, The Netherlands, 2011; p. 163. [Google Scholar]
  98. Roy, U.; Majumder, M. Vulnerability of Watersheds to Climate Change Assessed by Neural Network and Analytical Hierarchy Process; Springer: Singapore, 2016; ISBN 978-981-287-344-6. [Google Scholar]
  99. Bany Abdelnabi, A.A. An Analytical Hierarchical Process Model to Select Programming Language for Novice Programmers for Data Analytics Applications. In Proceedings of the 2019 International Arab Conference on Information Technology (ACIT), Al Ain, UAE, 3–5 December 2019; pp. 128–132. [Google Scholar] [CrossRef]
  100. Alaneme, G.U.; Ezeokpube, G.C.; Mbadike, E.M. Failure Analysis of a Partially Collapsed Building using Analytical Hierarchical Process. J. Fail. Anal. Prev. 2020, 1–12. [Google Scholar] [CrossRef]
Figure 1. The concept of U-city and interconnectivity of service areas.
Futureinternet 12 00235 g001
Figure 2. Information and communication technologies (ICTs) for a ubiquitous city.
Futureinternet 12 00235 g002
Figure 3. Internet of Things (IoT) covering the information and communication technologies (ICTs).
Futureinternet 12 00235 g003
Figure 4. Schematic representation of vulnerability analysis and a possible plan of mitigation Interconnectivity of areas.
Futureinternet 12 00235 g004
Figure 5. An ideal interconnectivity of service areas Performance of a U-city under hazards.
Futureinternet 12 00235 g005
Figure 6. A vulnerability assessment of U-city under natural and man-made hazards for ICTs and areas using AHP.
Futureinternet 12 00235 g006
Figure 7. Impacts of natural hazards on the ICTs.
Futureinternet 12 00235 g007
Figure 8. The impacts of man-made hazards on ICTs.
Futureinternet 12 00235 g008
Figure 9. The role of each ICT in the functioning of each service area (exposure of areas).
Futureinternet 12 00235 g009
Figure 10. Detailed vulnerabilities of service areas against man-made hazards (on left) and natural hazards (on right).
Futureinternet 12 00235 g010
Figure 11. Vulnerabilities of ICTs against natural and man-made hazards.
Futureinternet 12 00235 g011
Publisher’s Note: MDPI stays neutral with regard to jurisdictional claims in published maps and institutional affiliations.

