1. Introduction
Modern technology has made our day to day life easier and more comfortable. We can see the blessing of modern technology in every aspect of our life. People today follow a trend of slacking off their work. Localizing their position can specify one’s location that helps us to know where they are. In the World Wide Web (www), Information Retrieval (IR) plays an important role to provide resources that can be further used in research purposes. IR extracts the right information which can satisfy user requirements for any kind of data analysis [
1].
Location-based service (LBS) is a commonly used term in the IR system. It generally uses the geographical data of a user’s surrounding and provide services. Recommendation System (RS) is one of the key features of LBS. RS takes information from a user and analyses it to find the most relevant items according to the user’s choices [
2]. It becomes a common application that provides suggestions based on the user’s interest. Mobile devices with GPS technology provide a vast range of information about user’s activities [
3]. This information works as a data source to improve the quality of the modern RS.
There has been a lot of work on the RS. Most of them used to find similar users and make suggestions. Thus, it sometimes fails to give results according to the user’s choice. In this era of modern technology, it is necessary to find an effective and efficient RS system. The parameter of this system may include information about travel destinations, entertainment, activities and different locations, etc. based on the user’s interest [
4]. After considering this information RS provide a recommendation to the user. A recommendation can also provide a suitable place, where a group of friends can meet together according to their preferred type of places and previously tagged in places. As RS considers the user profile, it calculates the similarity between different profiles and suggests the best matching. However, finding a suitable place that users might be interested in or meeting together by a group of users using their personal preferences is not that easy. Therefore, challenges appear when a group of friends wants to meet in a place. To build a RS we have to consider the following points:
Firstly we make a user interest profile for each user according to their previous activity.
Then we create a map presentation using the grid structure for all POIs so that we can reduce the processing complexity.
Finally we calculate the similarity between user profile and POIs to recommend a user as well as a group of user. We also measure the Manhattan distance between the user location and POIs to provide the shortest path.
In this paper, our main objective is to identify the user’s interest and provide recommendations about places. These suggestions are of two categories: one is for a single user and the other is to suggest a suitable place for a group of users measuring their similarities. All the suggested places have a minimum distance from the user’s current location. We have adapted a grid-based structure for our system to reduce computational time and also collaborative filtering (CF) method to find similar users with similar activities.
Motivating Example
Presently, collaborative filtering (CF) is a widely used method to generate a recommendation system. The existing user-based collaborative filtering method in the recommender system intends to find a similar user based on their previous activity. However, the important thing is that most of these suggestions do not concern about the user’s interest profile and thus there can be a lot of suggestions on irrelevant places. Considering this problem, it is necessary to generate the user’s profile to build a more effective recommender system.
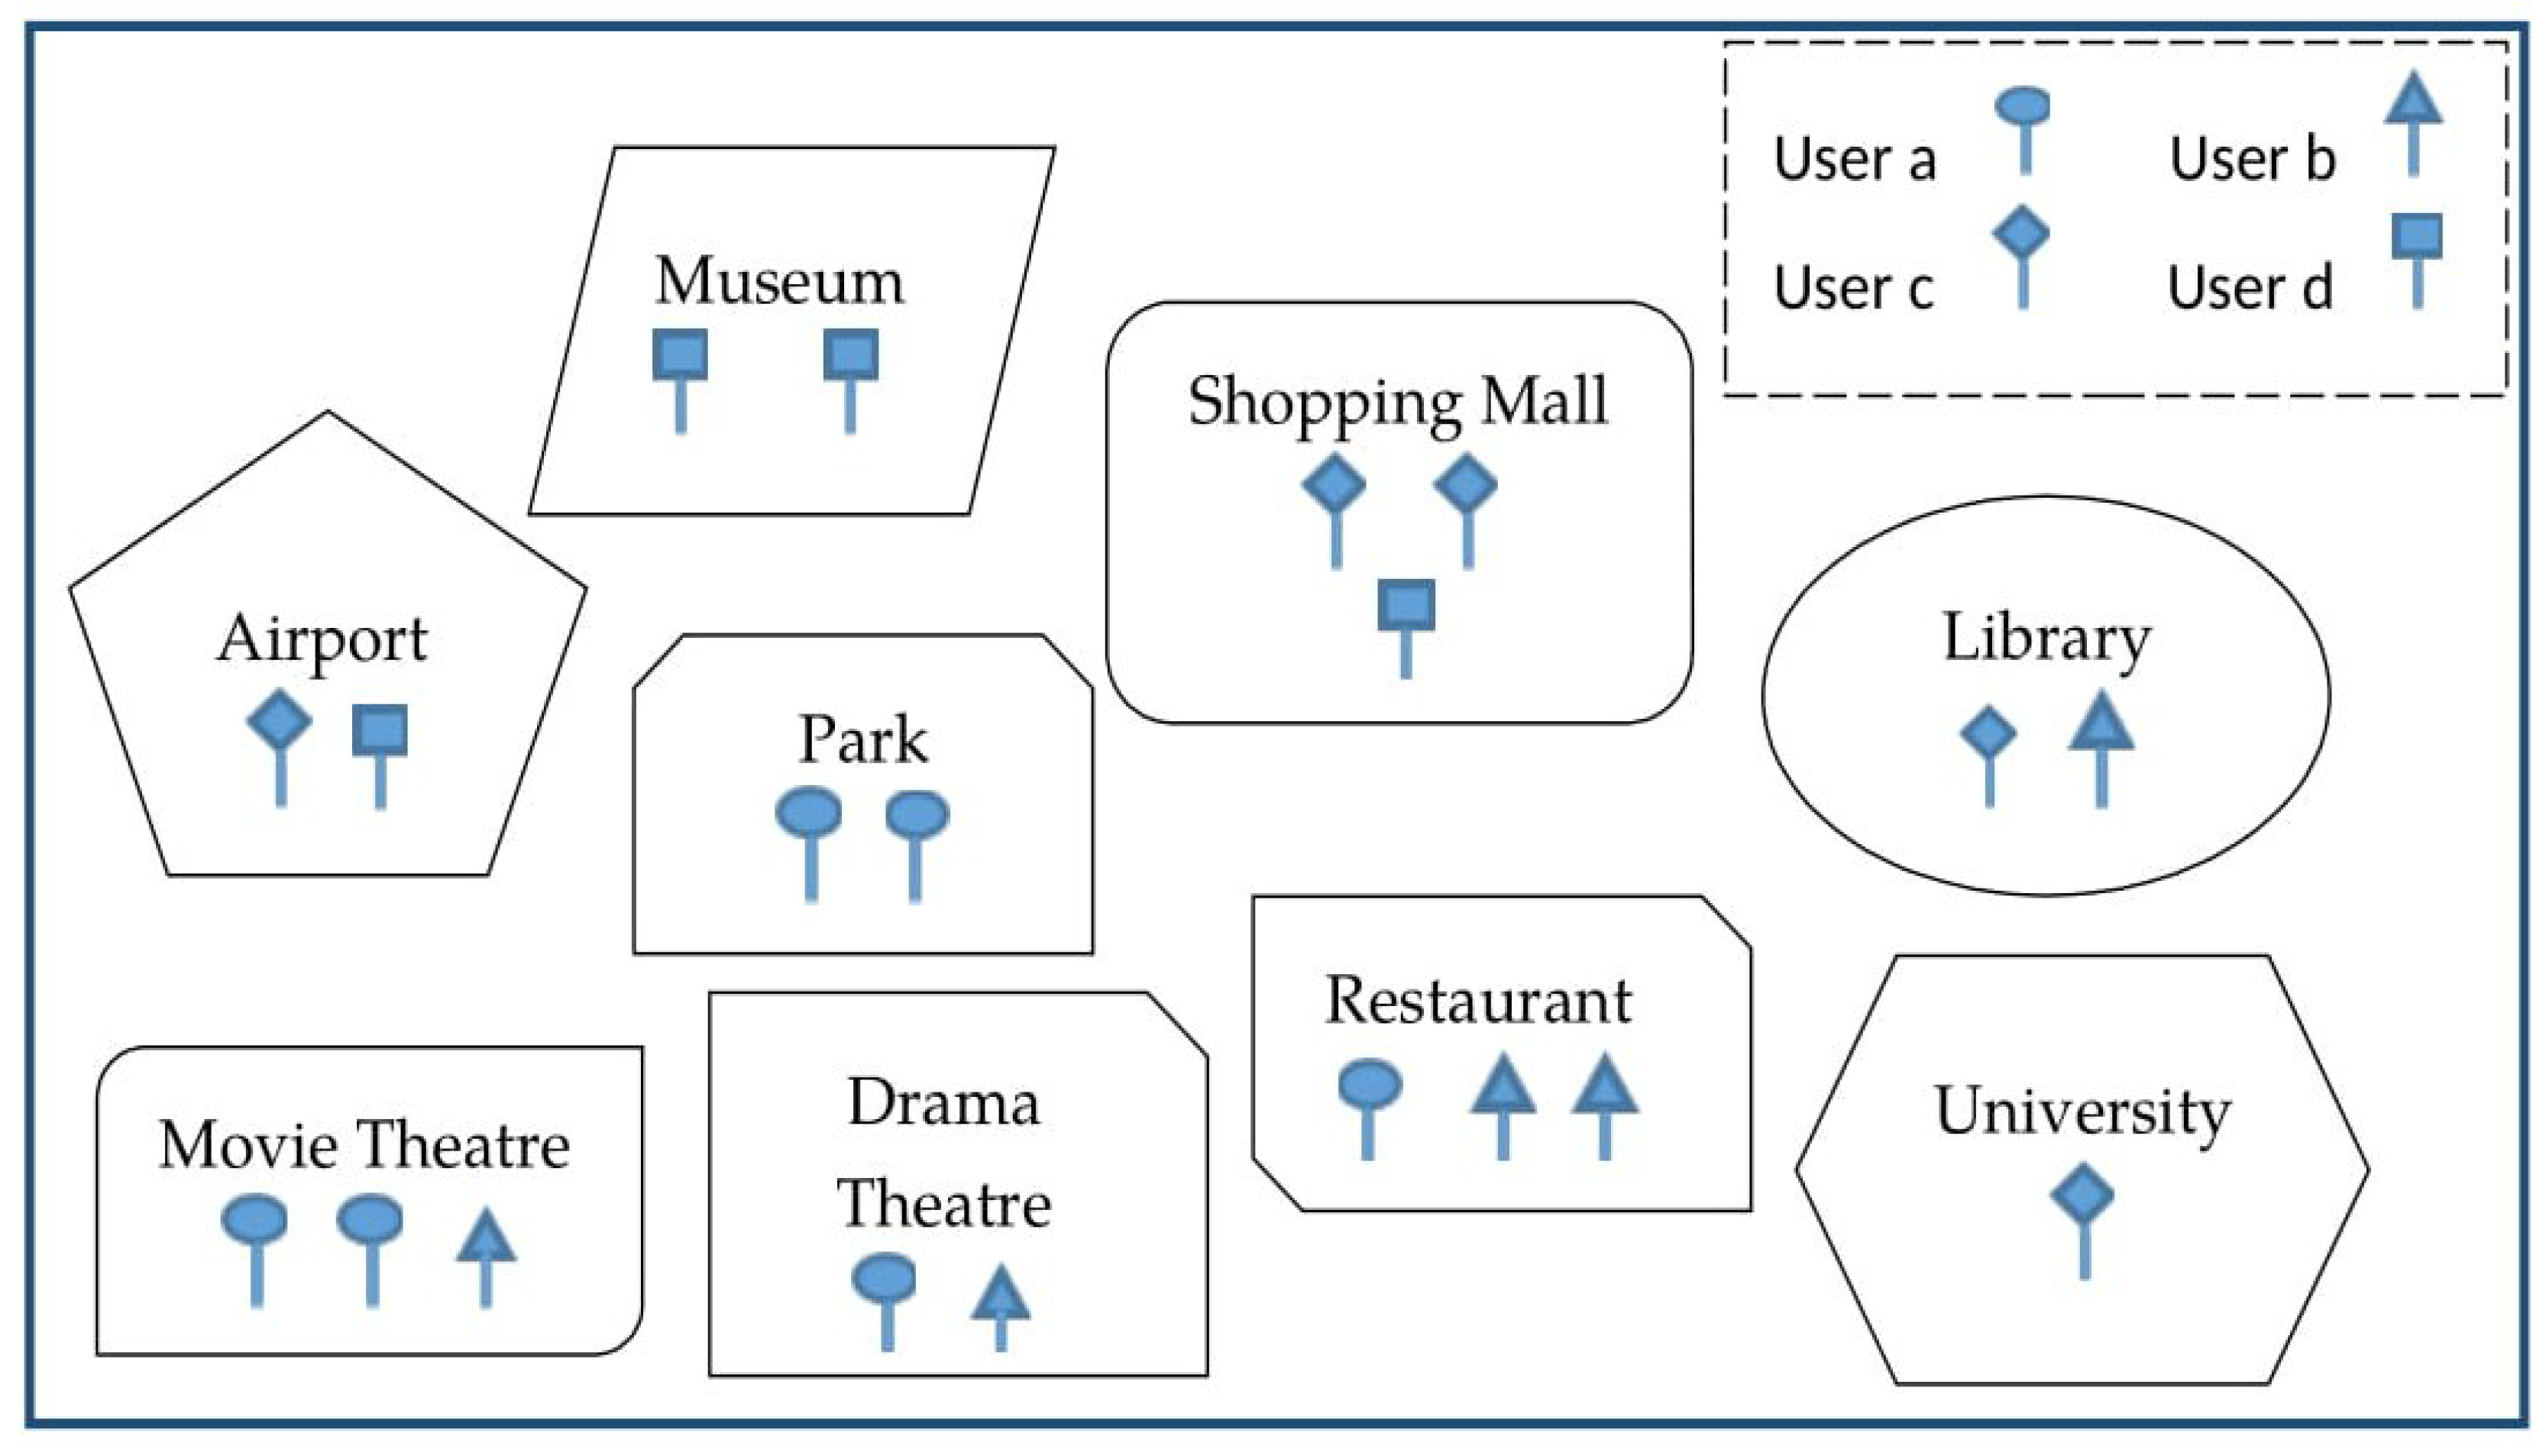
Figure 1 shows a pictorial representation of some check-in places of four users
a,
b,
c, and
d. Each user’s visiting spots are defined with a pin of different shapes. There are nine different places ’Museum’, ’Airport’, ’Park’, ’Shopping Mall’, ’Movie Theatre’, ’Drama Theatre’, ’Restaurant’, ’Library’, and ’University’, where the four users checked in.
Table 1 gives detailed information about their visiting places shown in the figure.
The CF method usually generates a similarity score between different users and based on the highest score it makes recommendations. Let us make a recommendation for a. We can see that the activity of a has a higher similarity with b as both of them checked into ‘Movie Theatre’, ‘Drama Theatre’, and ‘Restaurant’. Now, the CF method makes the recommendation ‘Library’ for a based on the activity of b. However, it is not the best suited for a because the visiting information of a demonstrates the interest in ‘Recreation’ purposes, such as ‘Museum’. To overcome this limitation, we are going to create an interest profile for each user so that recommendations can happen accordingly.
One of the limitations of the existing RS is that it does not recommend a common place for a group of users based on their preferred choices. Thus, we are going to propose a framework that can suggest appropriate places for some users.
The rest of the paper is arranged as follows.
Section 2 summarizes the related work.
Section 3 includes the underlying ideas about RS system.
Section 4 describes the recommendation generation method.
Section 5 demonstrates the experimental and evaluating process.
Section 6 includes the discussion and lessons learned. Finally,
Section 7 concludes the paper and provides future research directions.
2. Related Work and Comparative Analysis
In this section, we provide a short overview of the existing location-abased services, place recommendation services, collaborative filtering and other mechanisms that are relevant to the contributions of this work. We highlight the gaps that have not been well covered in the current state-of-the-art research.
2.1. Location-Based Services
The availability of GIS technology the Location-Based Social Networks (LBSNs) adds a new dimension of recommendations. Using geotagged places, AlBanna et al. [
2] provided a RS system to explore public interest. They work on the user’s score to map the interests and to reduce the cold start problem they considered the user which is new in the system. To improve the marketing approach, Jaradat et al. [
3] analyzed the marketing strategy which involves LBS. They also provided some instructions to overcome consumer problems and limitations of the companies. Uitz et al. [
4] took a similar approach to identify the factors regarding economic benefits. Huang et al. [
5] presented some topics on LBS which includes analyzing, evaluating the LBS data. Similarly, Raper et al. [
6] evaluated the possible potentiality of LBS on the science and technology field.
Based on the location of users, LBS provides information which is very helpful to analyze the behavior of users. Chang et al. [
7] introduced a hybrid approach based on the Zaltman metaphor elicitation technique (ZMET) to identify the factors which influence the quality of LBS and provides a better development of services. Based on the mobile location, Huang et al. [
8] reviewed the evolution process of LBS and tried to find the challenges towards the development of LBS. Decision-making ability, the interaction between users, and privacy on social media are some challenging features which affect the services. Analyzing the geo-tagged data some systems predict possible visitors. Saleem et al. [
9] provided a prediction approach based on matrix factorization using previous places, time, and distances. Then an influence-mining model to consider those who are related to the user. Elazab et al. [
10] focuses on the classifications of services and provides a messaging alert to mobile devices using GIS technology.
Presently, themed street provides a unique recognition of a specific region intending to develop the economics. Ji et al. [
11] introduced a clustering approach to identifying the commercial themed street for the LBS. Mobile devices are the common platform for the location-bases service because of their portability. Taking account of this advantage, Yim et al. [
12] introduced a neural network to work on these heterogeneous data to improve marketing strategies. Though smartphones with GPS are the best possible choices to get the benefits of LBS, the privacy issue is a big risky concern. Considering this issue, Yun et al. [
13] analyzed the privacy level of the users and their performance expectancy.
2.2. Place Recommendation System
Liao et al. [
14] introduced the tensor factorization for a recommendation system to improve the accuracy of user recommendation. First, to extract the user’s POI information they used the Latent Dirichlet Allocation (LDA) model and created probability distribution for each kind of information. Then the extracted data are divided into different groups for each user which defines the preferences of a user. For generating recommendation finally a singular value decomposition (SVD) algorithm is used to find the preferences. Ajantha et al. [
15] worked on a system that can help the tourism services. They proposed a system using the user-location vector to identify the relationship between POIs and user interest. Chen et al. [
16] proposed a semantic approach to find the recommendation. They identify the similarity between the user’s previous activities using user-based collaborative filtering.
Kosmides et al. [
17] presented a machine learning (Probabilistic Neural Network) method for recommendations. They extracted the data from Location-Based Social Network (LBSN). The system generates the suggestion according to the user’s previous activities. Berjani et al. [
18] introduced a model for Online Social Network services (OSN) using the matrix factorization. the similarity of users can be calculated with the interest and location of the user. Lee et al. [
19] used a semantic approach to measure the similarity using the location. Kbaier et al. [
20] proposed a hybrid method combining three machine-learning algorithms to form a recommendation system. At first, they used the
K-
clustering for a collaborative filtering module. Then a decision tree is applied for demographic filtering (DF). Finally, a switching and weighted technique is used to find the optimal solution. Singh et al. [
21] Worked on a system based on the user’s previous activities to provide a nearby suggestion.
Tourists use to visit different locations at different times. Sometimes it is difficult to find a preferable place due to a lack of tourist guides. To overcome such problems, Bhaidkar et al. [
22] developed a mobile application using the triangulation method for android devices to identify nearby tourism places as well as to provide weather forecasts for visitors. Jueajan et al. [
23] also worked on a similar android application to provide a place RS. Bao et al. [
24] introduced a recommendation system based on two modules. The first one is the offline data processing module and the second one is online recommendation generation. In the first module. they used weighted category hierarchy (WCH) and for the second they considered local preferences. Yu et al. [
25] surveyed some RS systems to provide some additional features for future development.
2.3. Collaborative Filtering
Li et al. [
26] proposed an approach to overcome cold start and data sparsity problems. They included user attributes and ratings of the items to calculate the similarity score by a weighted coefficient value. Prasanth [
27] introduced a system to predict the user pattern using their previous navigational activities. Here collaborative filtering is used to find the user with similar interests. Gupta et al. [
28] used collaborative filtering on the similar user and user’s check-in spots. Similarly, Bhanushali et al. [
29] worked on a model that not only considered the user’s previous history but also some other features such as location and ratings given by similar users. They also introduced two modules: offline clustering and online CF method. Mu et al. [
30] performed collaborative filtering to generate a service recommendation system. First they create a model for each user’s information. Then they calculate the similarity using the Pearson correlation on the user’s service information. Zheng et al. [
31] introduced a hierarchical-graph-based similarity measurement (HGSM) module on the user’s individual check-in history and check-in similarities between users. This approach contains three sections for calculating the content-based filtering: (i) the individual’s data on outdoor activities, (ii) data at a certain geographical region, and (iii) the sequenced data of geographic spaces. Schafer et al. [
32] worked on the collaborative filtering where the primary data of users are from the adaptive web. They developed the system on user ratings using the nearest neighbor algorithm. Zhang et al. [
33] combined three algorithms to provide a better recommendation system. First, they used a memory-based method to generate the score model. Then, matrix factorization is introduced for the training process and finally the CF method to combine these two models. A similar approach of matrix factorization was used by Takács et al. [
34] on the Netflix dataset. Sharma et al. [
35] also discussed various collaborative filtering methods on their work.
2.4. Other RS Systems
Farjoo et al. [
36] proposed an RS for online shopping. Decision tree and association rules are merged into this system to generate recommendations. Association rules give the user’s pattern and the user’s interest is identified using a decision tree. Combining these two results the final interests can be found. Ilango et al. [
37] introduced a Grid structure to divide objects into different groups and performed further analysis. Because of the finite number of grids, the use of a grid-based structure gives fast processing results. Aguilar et al. [
38] introduced a framework of a system based on knowledge. Here they used the Fuzzy Cognitive Maps (FCMs) method to generate recommendations. Ramzan et al. [
39] analyses on heterogeneous data to identify suggestions. This proposed approach integrated lexical, syntax, and semantic analysis to understand user preferences. Gomathi et al. [
40] proposed a machine learning technique for recommending restaurants with personal interests. Here the NLP algorithm is used to evaluate the positivity of previous responses. The PITF-BPR algorithm is used to model these records. Baidu map cloud service is used by Lin et al. [
41] to implement another restaurant recommending system. Zhiming et al. [
42] proposed a friend recommendation system based on three collaborative frameworks. They considered check-in location, common friends as the parameter for this work. Considering two parameters: price and ratings, Zeng et al. [
43] introduced a grid-based algorithm to recommend restaurants. Wang et al. [
44] proposed a hybrid model for movie recommendation. They combined the
K-
algorithm with the generic algorithm for partitioning the user data. Finally, a principal component analysis (PCA) is employed to carry out the recommendations.
In this paper, we present an empirical framework to support location-based services. The main contributions of this paper can be summarized as follows.
Generating users interest profile.
Adapting grid-structure to reduce processing time.
Recommending the best possible places for a group of users.
3. Preliminaries
In this section, we present the underlying concepts and definitions of the location-based RS system, check-in information, POI information and collaborative filtering.
3.1. Place Recommender System
Due to the growth of Location-Based networks (LBN), the need for providing recommendations to individuals according to their interests is very much appreciable. In this case, the location-based services contributing more effectively to this purpose [
2]. Recommendation system (RS) is one of the most popular features provided by the LBSNs. RS has different types of applications based on user choices. It can find the user’s interest depending on the user’s previous activities and can suggest the user on unvisited places. It can also provide a suitable place for a group of users to meet together.
3.2. Check-In Information
To collect the user’s choices, we need to analyze the check-in spot of users. There may be different visiting places and people visit these places for various purposes. Whenever a user comes to visit a place they usually post on the social network about their activities. The information about the check-in spots defines the behavior of a user and by analyzing them it is possible to recommend on their future activities [
16]. To build a recommendation system based on the user’s previous activities it is necessary to collect information about the check-in spots.
3.3. Point of Interest (POI)
Because of the availability of GPS technology, it is easy to get the location of a user. Point of Interest (POI), defines the points which are interested to a user. Geographical Information System (GIS) can also provide a list of POIs on a certain location which includes information about the name of the location, latitude, longitude, and rating of that place [
5].
Table 2 shows a sample of POI of a user which contains the name of the place, co-ordinates, type, and rating of that place.
3.4. Collaborative Filtering
Collaborative Filtering (CF) is a well-known method used in the most RS. CF is the information filtering process to find the important patterns among the users which leads to future activities [
16]. The main motivation behind the CF is that someone can get the best suggestions from people with similar activities. It works with the previous user-item collaborations to predict the possibilities. CF is of two types: user-based CF and item-based CF. The user-based CF method calculates the similarity between users to analyze the prediction. It usually identifies users who share similar patterns and generates a neighborhood of users. Using this neighborhood it can also find the groups of users who have the same activities. Another form of CF is item-based that predicts the item’s similarity rated by the users. As the rating of items does not change frequently, it can use more users with various attributes. An item to item matrix measures the similarity between the items.
4. Methodology
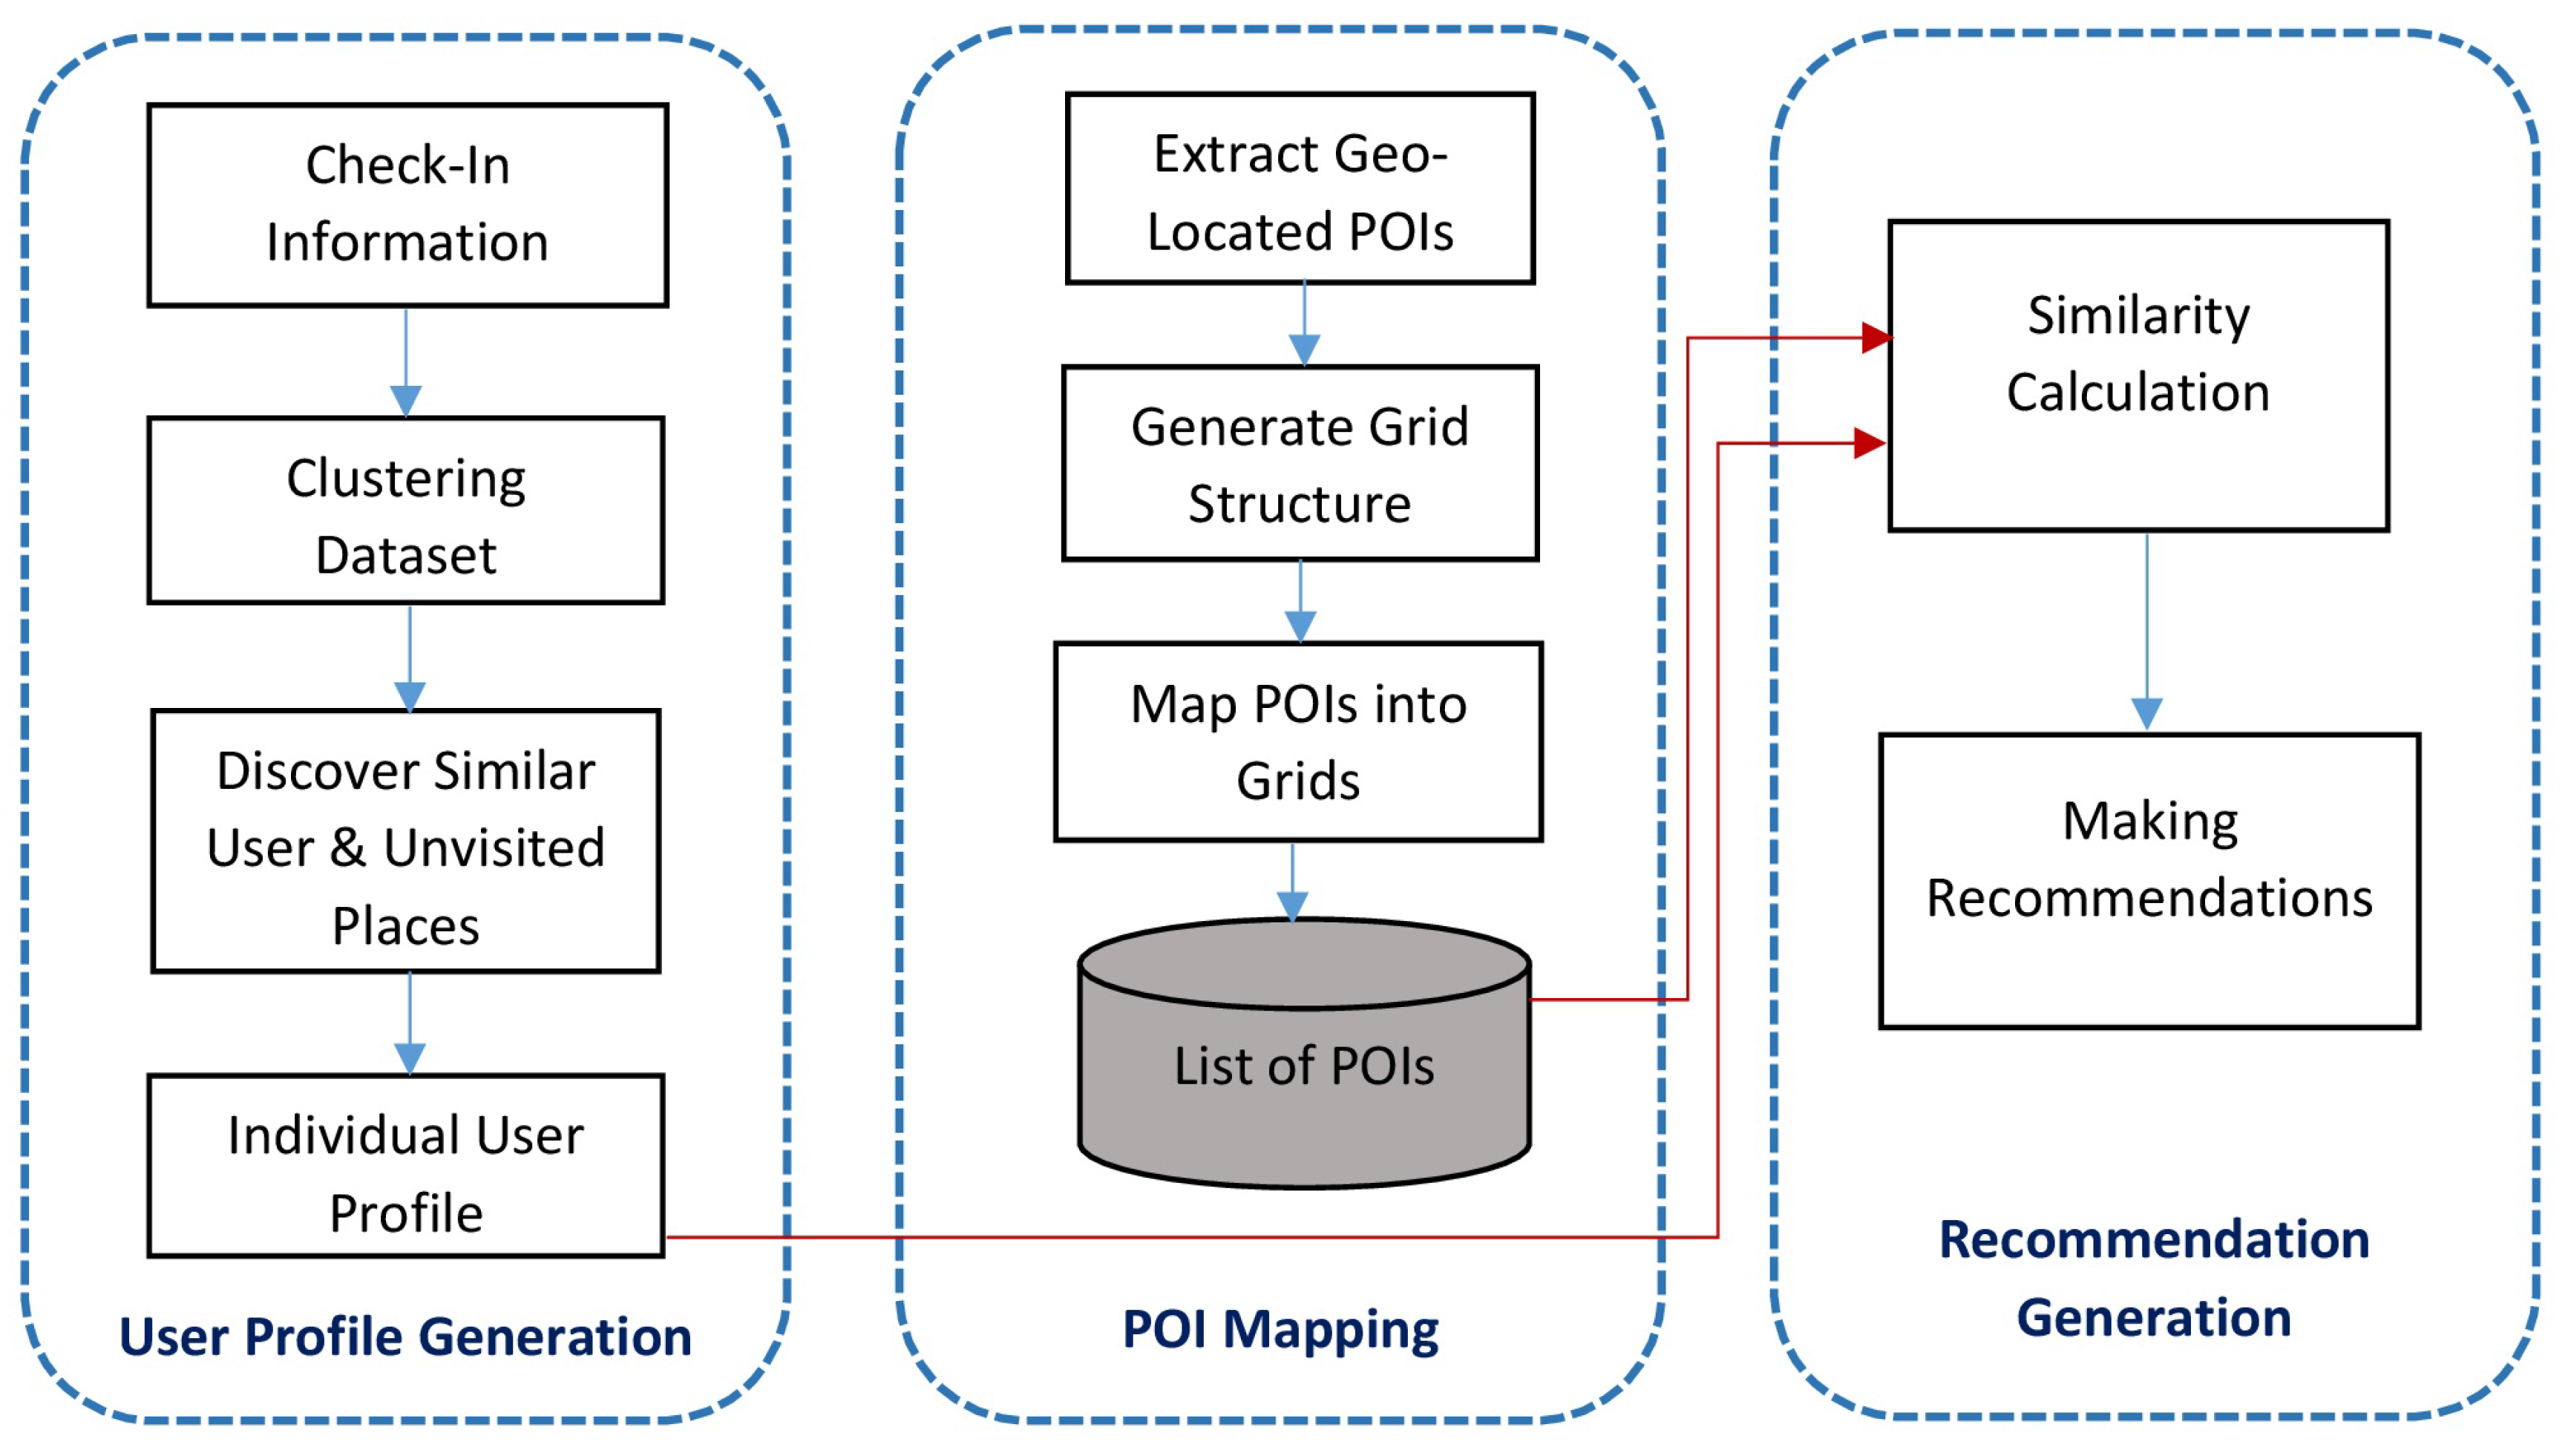
In this section, we explain the detailed framework of our place RS system to support location-based services. Our system contains three main modules: user profile generation, map representation of POIs, and recommendation generation.
Figure 2 shows the system architecture of our framework.
4.1. User Profile Generation
4.1.1. Discovering Interest
For interest discovery for each user, we have to analyze their activities. People visit various spots for different reasons. Some of them are for daily purposes and some of them are for entertainment purposes. Whenever user posts about the spot they visited, it defines as a check-in spot. Each check-in spot has its own information. This information tells about the category of that place. To discover the user interest we have to cluster the check-in spots into a different category. To cluster into different groups, we used a familiar clustering algorithm known as Density-Based Spatial Clustering of Applications with Noise (DBSCAN) [
16]. It requires two parameters
for DBSCAN. Where
defines the distance to a point if the point can be a neighborhood point of a cluster and
defines the minimum number of neighbor points within the
radius. This algorithm also has three data points.
Core point: within the radius, when a point has more neighbor than the it is called core point.
Border point: it defines the fewer neighbor points than the .
Noise: noise is point which stays outside of the radius.
Algorithm 1 represents the procedure of DBSCAN.
| Algorithm 1 DBSCAN Clustering. |
procedure DBSCAN(, , ) ▹ Initial cluster index is 1 for all p in do ▹ p defines each individual point mark p visited neighbors the neighboring points of p if then if is not a member of any cluster then add p to cluster c return
|
Steps of DBSCAN:
We select an arbitrary unvisited point and extract all the neighboring points within the radius .
When the number of neighborhood points exceed , we try to find the border points with the less dense area to form a cluster and marked them all as a visited point.
Then we start with a new unvisited point and recursively processed steps 1 and 2 to find another cluster.
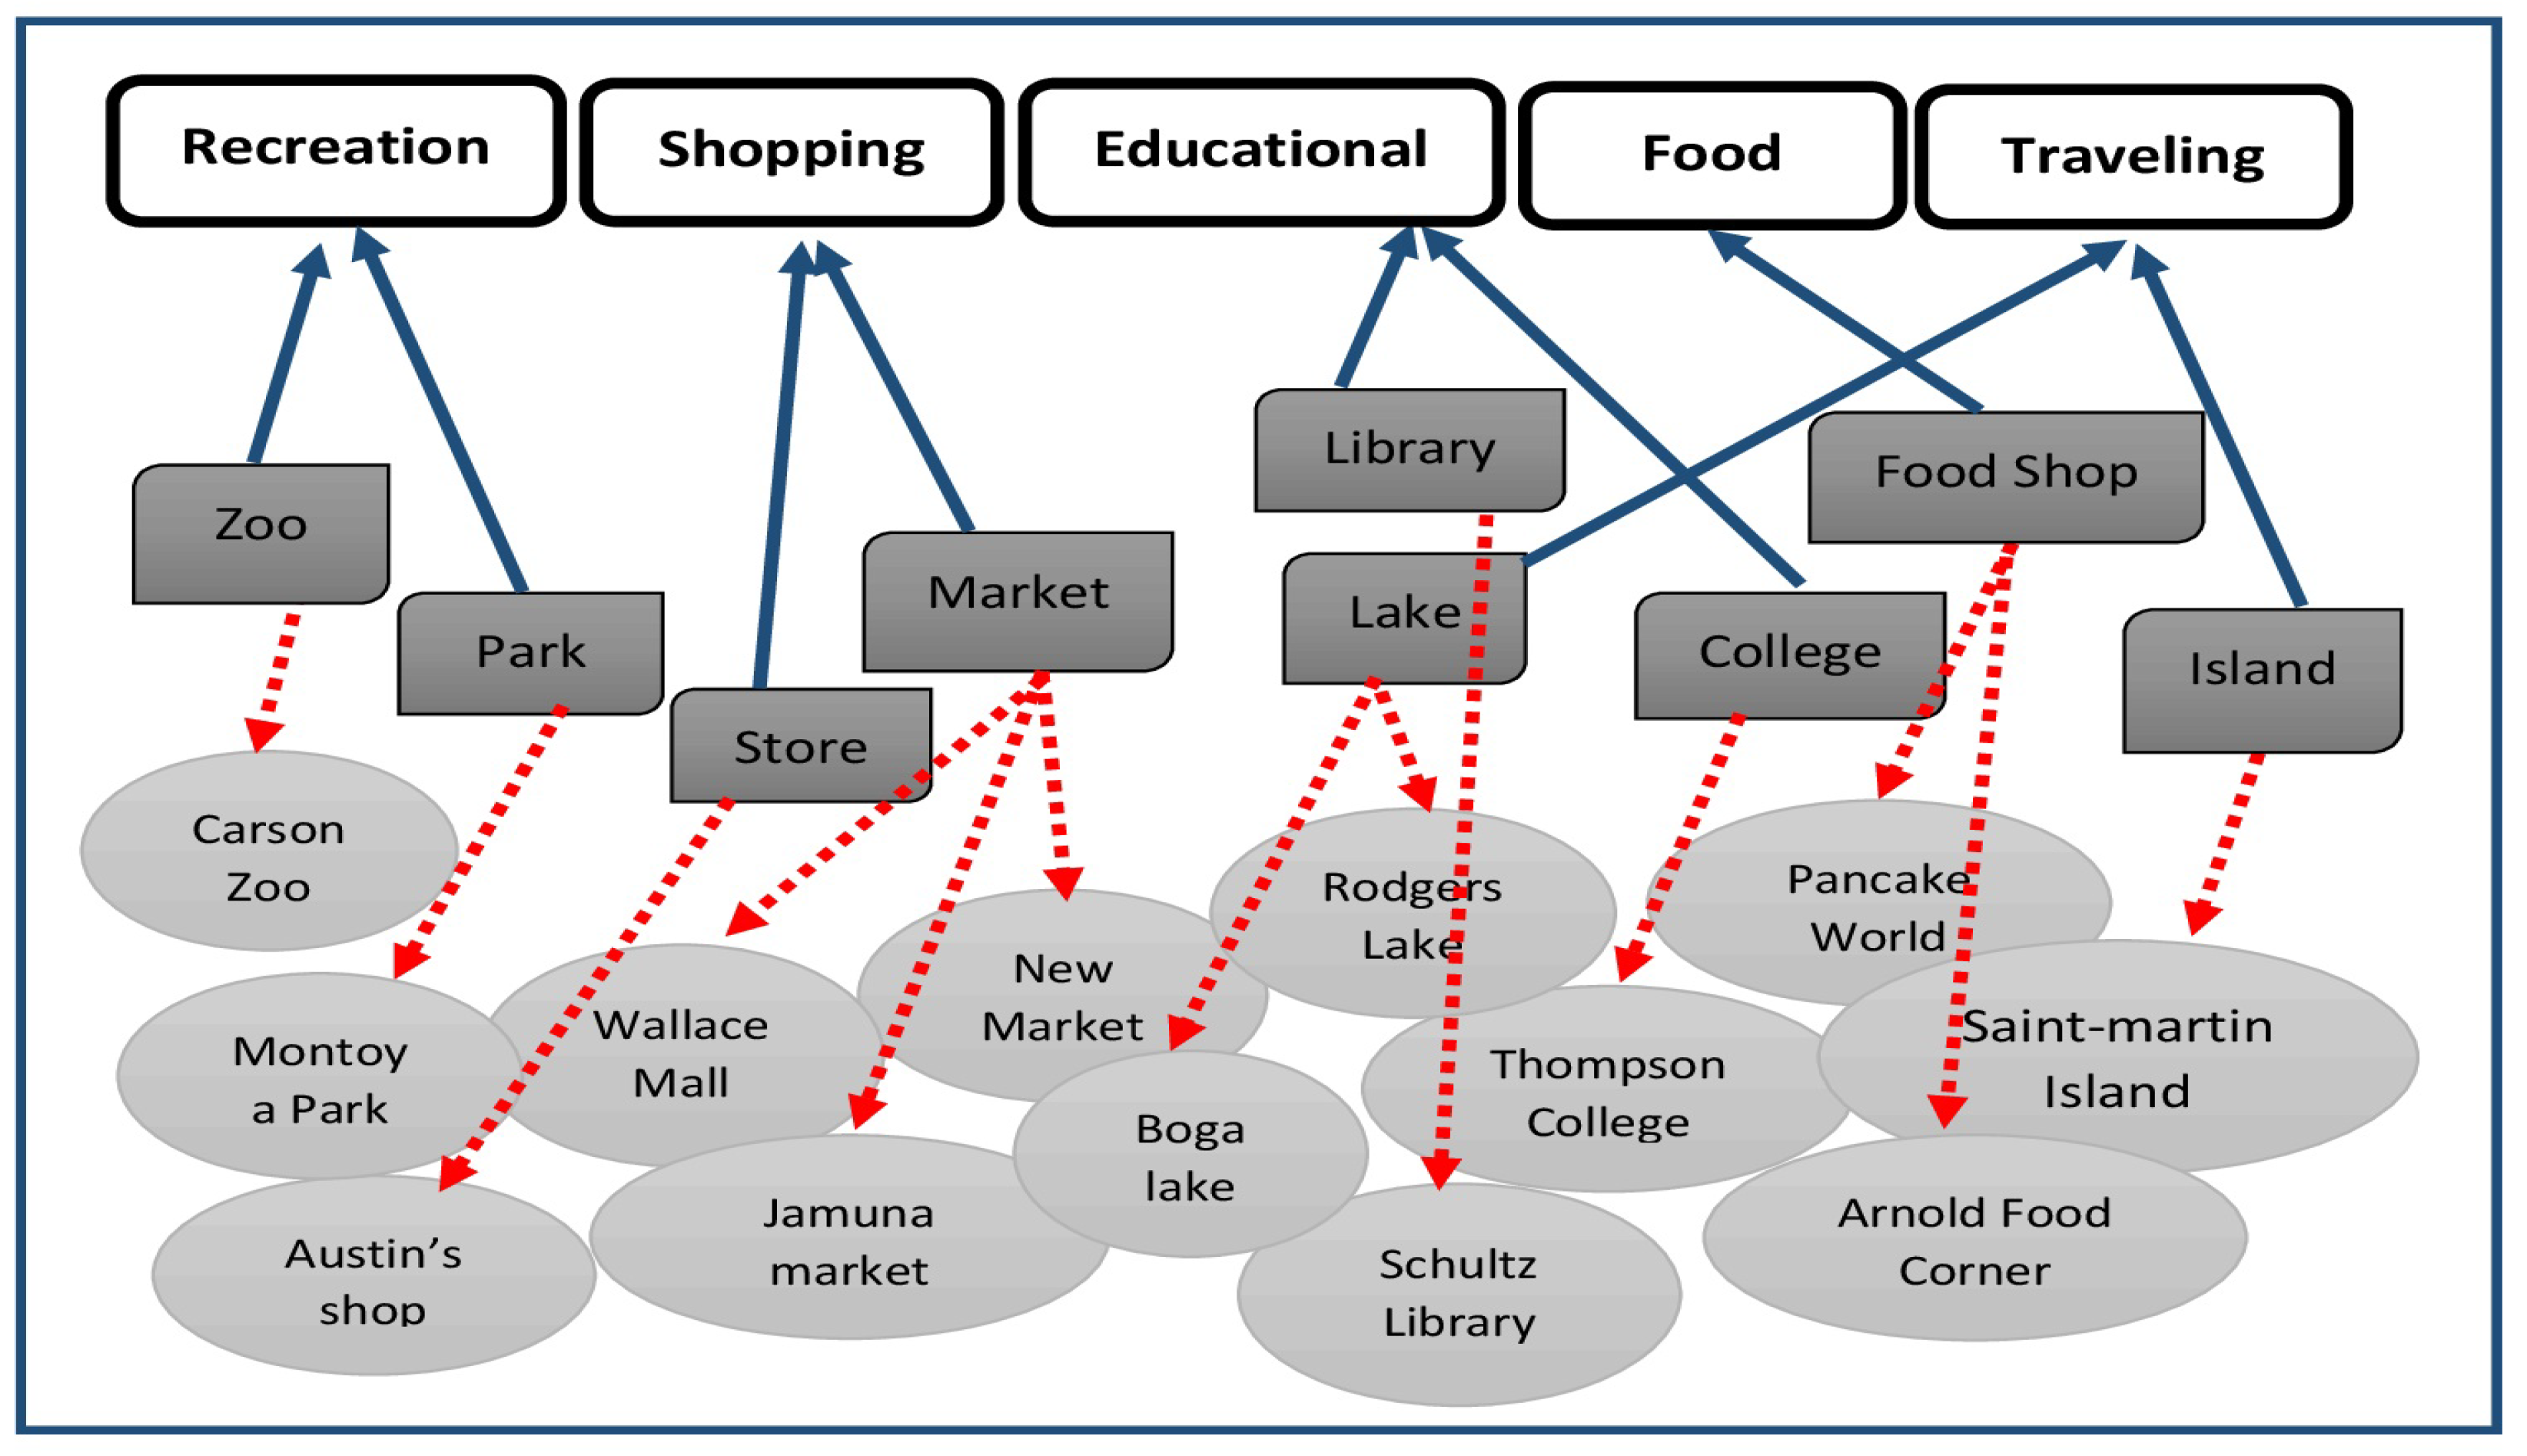
From
Figure 3 we can see that in the bottom layer there are some check-in spots visited by a user that is not categorized. DBSCAN provides us the clusters shows in the middle layer. For example, ’Wallace Mall’, ’Jamuna market’, and ’New Market’ all are the market places that are clustered in the market category with ’shopping’ purpose as the parent category. similarly, ’Boga Lake’, ’Rodgers Lake’, and ’Saint-martin Island’ can be grouped into the ’traveling’ category. People used to go to market or store for shopping purposes as well as zoos and parks for recreation purposes.
First, we eliminate the null values, all punctuations, and symbols if there are any. Then encode the parent category with the Label Encoder so that: ‘Recreation’ = 0, ‘Food’ = 1, ‘Traveling’ = 2, and so on. We tokenize the words and then with the Porter Stemmer of NLTK try to find the root of a word. The
-
vectorizes the features to reflect how important a word is to a document in a collection. Finally, we perform DBSCAN to cluster all the place types into 11 categories and measure the Completeness and Homogeneity Score. We construct a table for two users A and B about their check-in spots and categorized them using the algorithms. From
Table 3 we can easily find out each user’s interest profile according to their previous visiting places.
As we have the parent category of each visiting place for the individual user from
Table 3, now we calculate the percentage of each visiting parent category. Then we make the order of category from high to low which defines the priority of interest for the user. In case of the same priority score, we make the list arbitrary.
Table 4 shows the generated profile for each user and defines the priority of interest on their list.
4.1.2. Discovering Similar Users and Unvisited Places
Collaborative filtering is a useful tool in the recommendation system. It tends to find the similar user and suggest them according to their similarity score. Previously, we created a user profile based on their activities. Now if we can identify those users who have a similar type of interest and extract the unvisited places that can be a probable visiting place of a user that will complete the interest profile. Generally, Collaborative filtering helps us to find a similar type of user [
31]. It produces a similarity score from which we can identify the similar user. If
defines the similarity score of unvisited places, where user
u and place
p are calculated by an aggregate shown in Formula (
1) of the ratings of
N similar users.
To calculate the similarity we used cosine similarity given in the following Formula (
2). At first we try to find the frequency of words for each user profile using the
-
which generates a sparse matrix. Then we calculate the dot product of two users using their vectors values
A and
B and divide it by the product of the magnitude of both vectors. The value of the cosine angle between the two vectors defines the similarity score. This value ranges from 0 to 1, with 0 means the least similar and 1 the most similar.
Table 5 shows the general formation of the similarity matrix. We use the correlation formula on some user to find the similarity score between them.
Table 6 shows the similarity score generated by cosine vector similarity.
After generating the score, we can see that there is a lot of similarity between some users. For example, user
matches the most with the user
and
. That is why we calculate the final list using the union operation of users’
,
,
. To identify similar users, we consider those scores greater than a threshold value 0.5. Thus, we have to update the profile of the user
with
and
so that
can have more POI options.
Table 7 shows the user profile after collaborative filtering.
4.2. Map Representation of POIs
The representation of locations is an essential part of LBS. There are different types of map representation for spatial datasets. It is necessary to find a perfect map to present the POIs so that the system can easily identify the location of a specific point of interest. From various representation types, we use the Grid-based structure because it can provide the quantified number of cells with various numbers of POIs, which helps to find a fast processing comparison [
43]. Before generating the recommendation for the user we extract the POIs of a user’s current location using Google API and place them into the different grid according to the location of those points. Algorithm 2 represents the detailed process of Grid generation.
| Algorithm 2 Grid Structure. |
procedure Grids() ▹ P defines places, N is the value of grids for all in P do for all in P do minimum Cartesian x of the maximum Cartesian x of the minimum Cartesian y of the maximum Cartesian y of the ▹ size in X axis ▹ size in Y axis Function latitude of geolocation longitude of geolocation 6371 ▹ radius of the earth return () end Function
|
We see that at first each POI’s location (latitude, longitude) is converted into cartesian co-ordinates. Then we consider four border points to cover the region at a certain location. To form
grid structure each length of
X and
Y axis is divided by the number of cells
N.
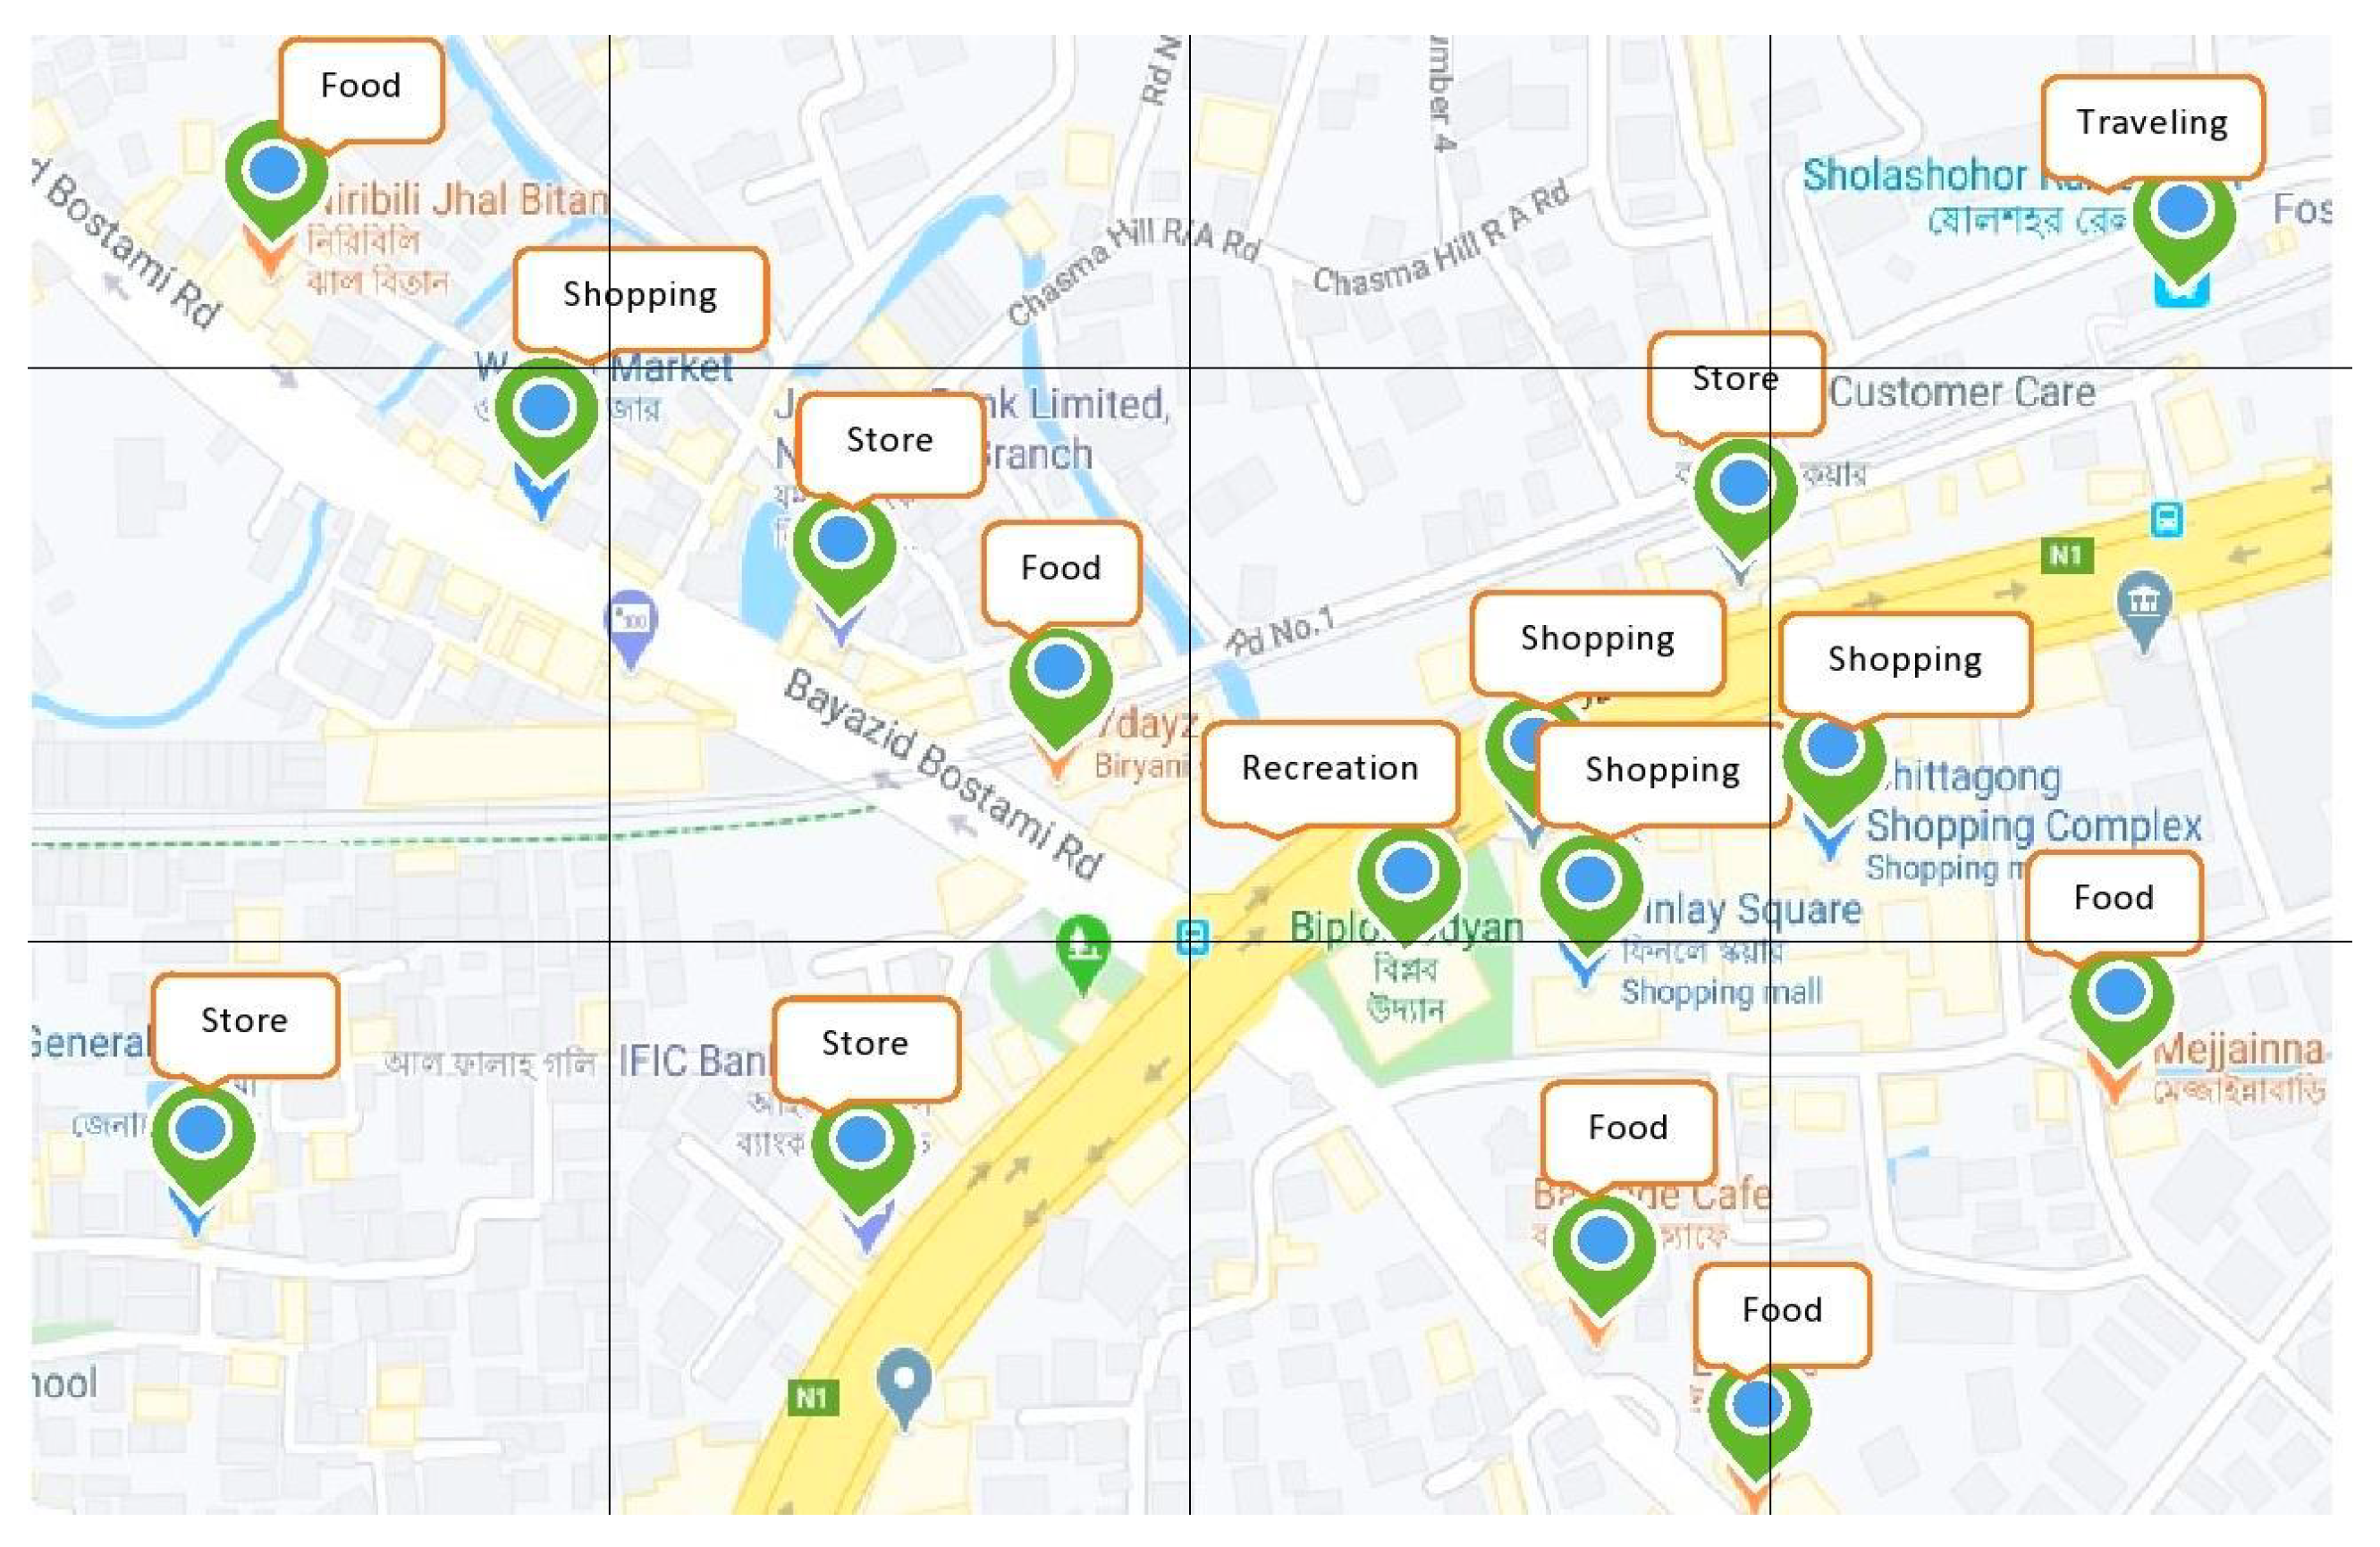
Figure 4 shows a grid representation of some POIs.
Now there are 15 POIs with different categories marked with various colors. From 12 grids only 10 grids contain POI and thus it reduces our processing time since we do not have to consider the whole.
Table 8 gives a listed grid with POI.
4.3. Recommendation Generation
In this section, we describe two types of recommendation generation, one is for a single user, and the other one is for a group of user. Algorithm 3 summerizes the first calculation. As we have the user’s interest profile generated by DBSCAN and collaborative filtering (CF), for recommendation generation we measure the user’s current location (cartesian co-ordinate) and also extract all the surrounding POIs. Using the grid structure all extracted POIs are sorted into a list already shown in
Table 7, which also allows us to find a better choice of the area of recommendations. Then we calculate the similarity score between the person’s priority and extracted POIs using the cosine similarity coefficient shown by Formula (
2). Here, vector A and B defines the frequency values of user profile and the extracted POIs respectively. We also calculate the Manhattan distance between the user and the location of POI to provide the shortest path. The highest value of
defines the suggested POI and also in case of same type of POIs, we consider with higher rating of that place.
| Algorithm 3 Recommendation for a single user. |
procedure Recommendation(U, ) ▹ U defines users, P defines each place location, N is the value of grids for all in U do for all in P do from the geolocation of the user from the geolocation of the POI return
|
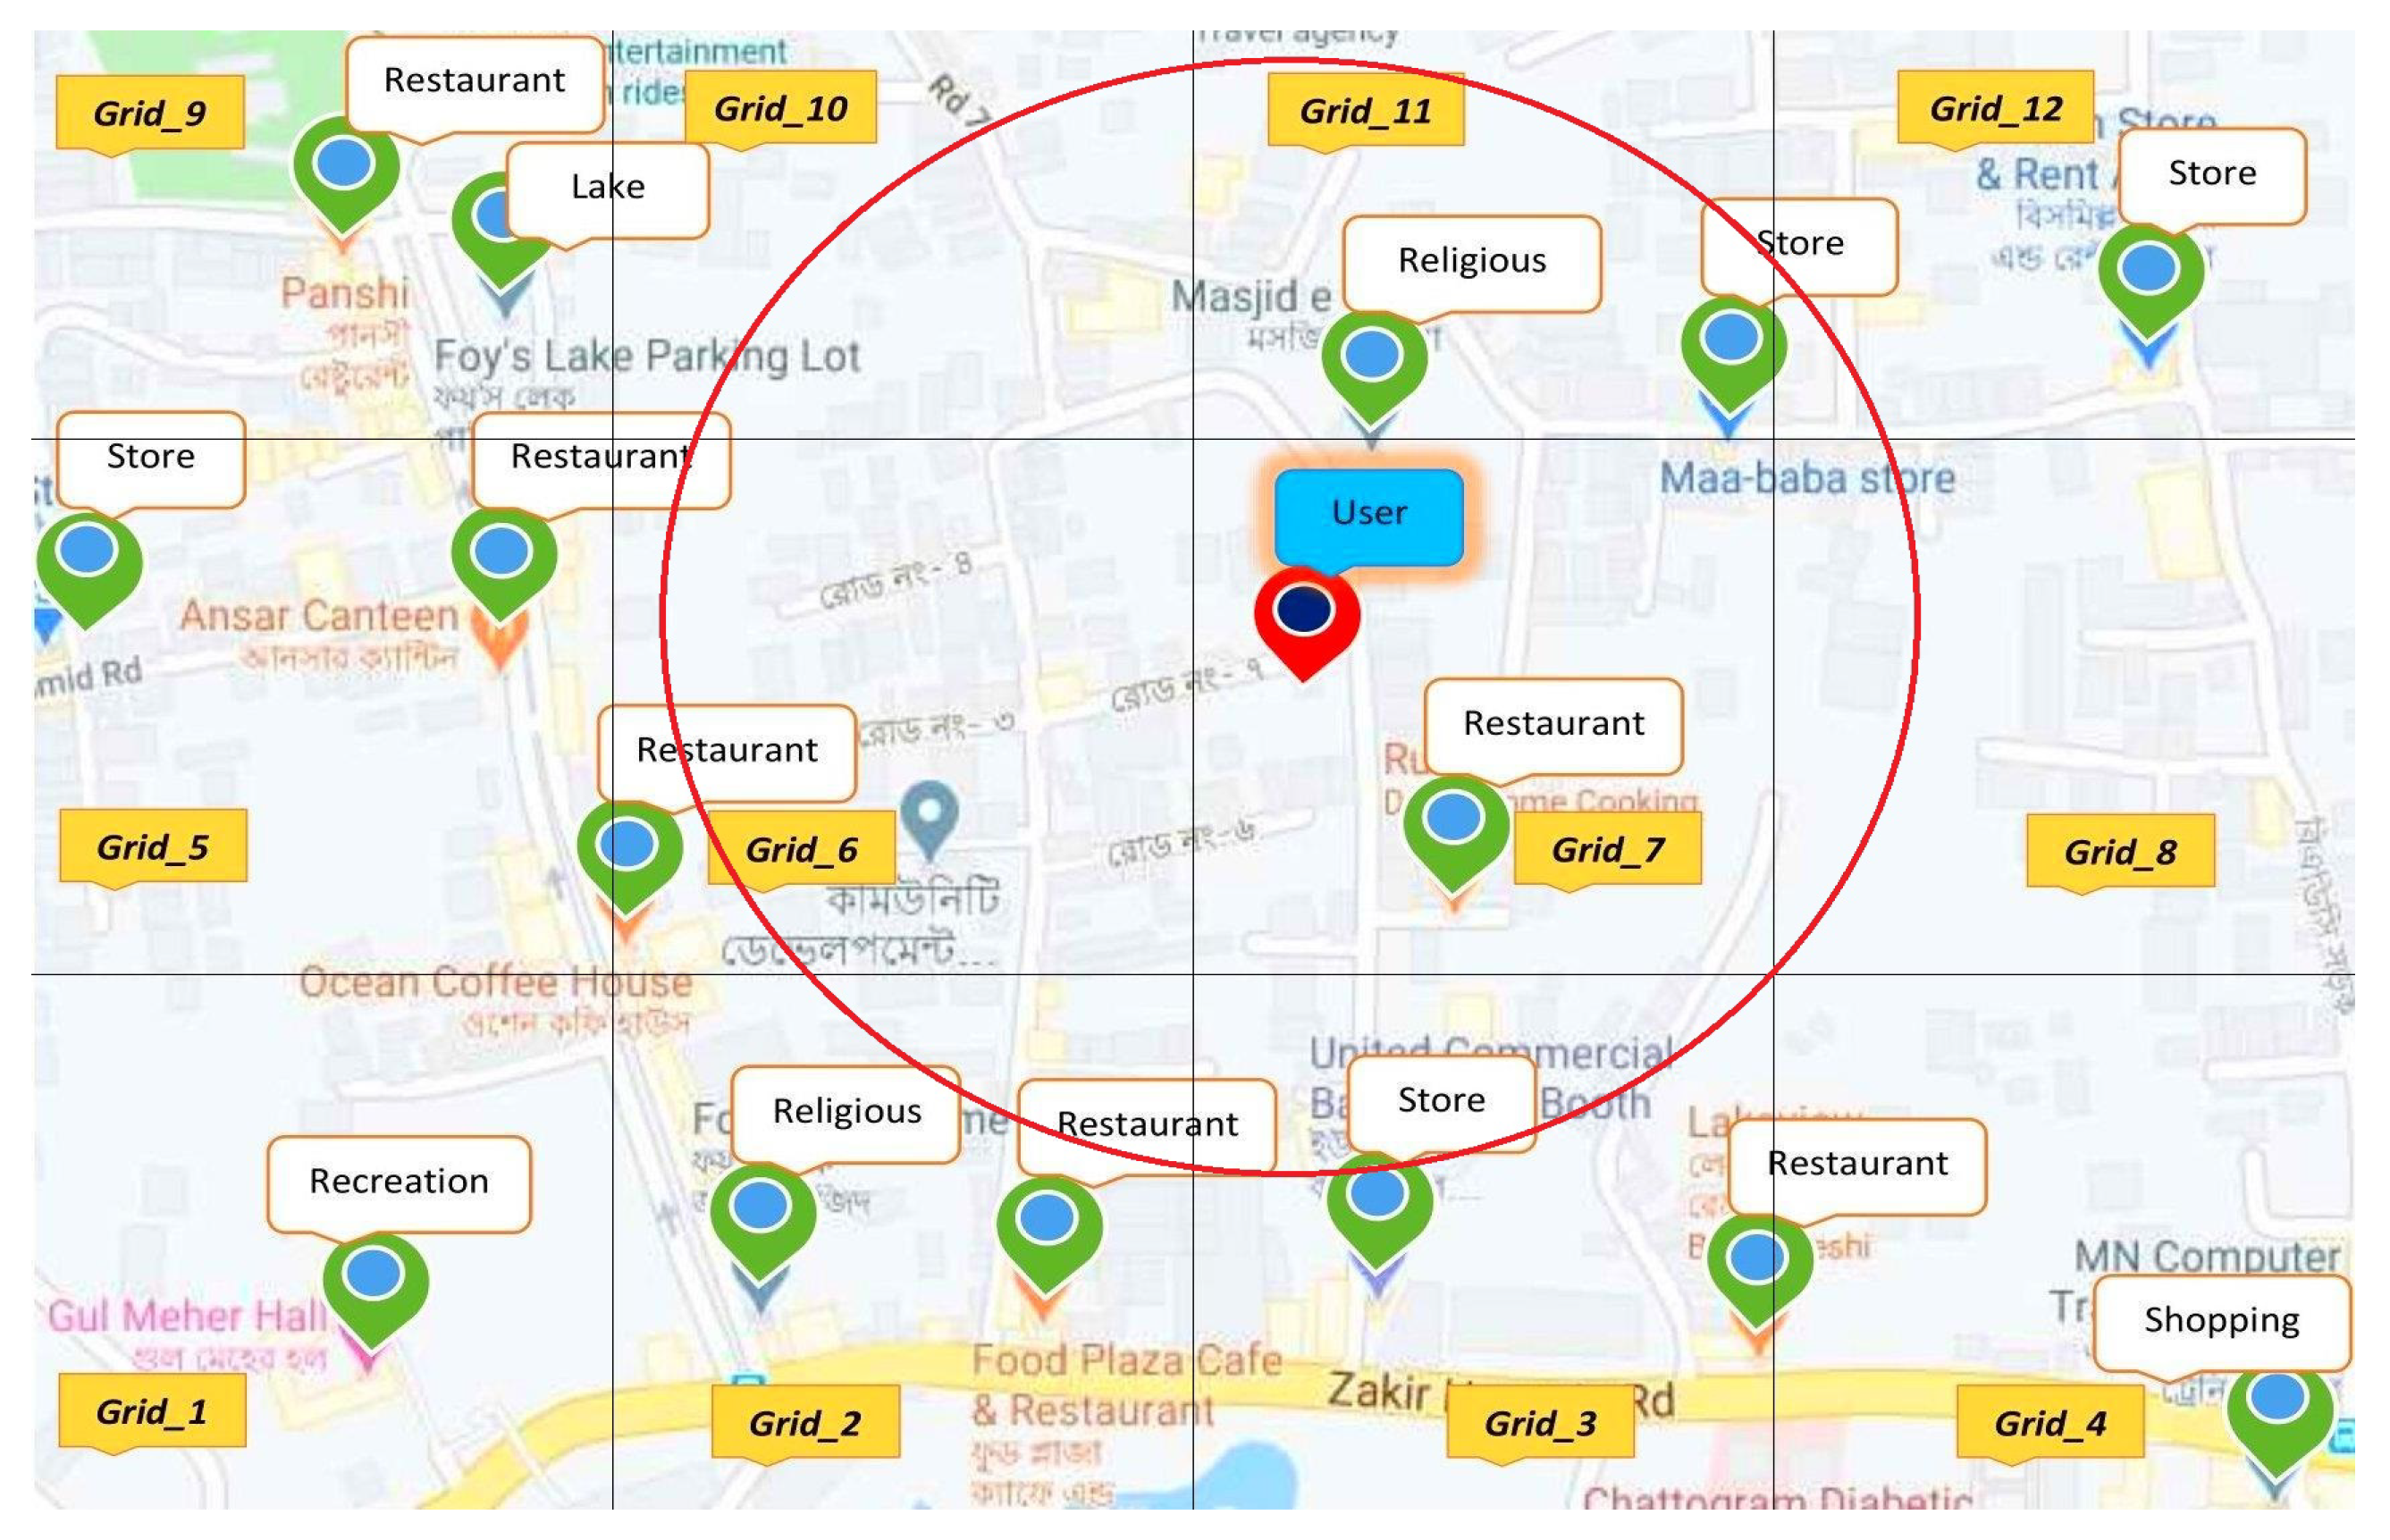
Consider a user location marked by a red pin shown in
Figure 5. Now we extract all the POIs around the user and plot it grid-wise. Then we take a specific area defined by the user to make the recommendations marked by the circle. We also make a list of POIs from the grids that are within the range of the circle to measure the similarities. Thus, we can reduce the number of calculations by avoiding the grids which stay outside of the circle. As we do not have to consider all the POIs of all grids, it also minimizes the processing time. For example, there are eight grids
,
,
,
,
,
,
, and
for the user and if the priority profile defines the ’Restaurant’ category, then there remain only 4 grids
,
,
, and
to recommend. since we have to offer the shortest possible distance, so the system suggests the ’Restaurant’ on the same grid
with the user.
To recommend a group of users, at first we match the similarity of interest between the user’s profile to find the best matching interest for all users using Formula (
2) and make a list of that for further matching. Then we calculate the centroid location (cartesian co-ordinate) of the users so that the suggested place can be a minimum distance from all the users of the group. We extract all POIs at the centroid location using the grid structure and make a list of it. Finally, we calculate the similarity between user priority and extracted POIs to measure the
and identify the suggestions. We also consider the rating of each location to make the recommendation more perfect. For this Algorithm 4 is given below.
| Algorithm 4 Recommendation for a group of user. |
procedure Recommendation(U, ) ▹ U defines users, P defines each place location, N is the value of grids for all in U do for all in P do SimilarityScore [] ▹ No of user in a group of Cartesian x of all users in the group of Cartesian y of all users in the group Similarity between and POIs on centroid location∗ratings return
|
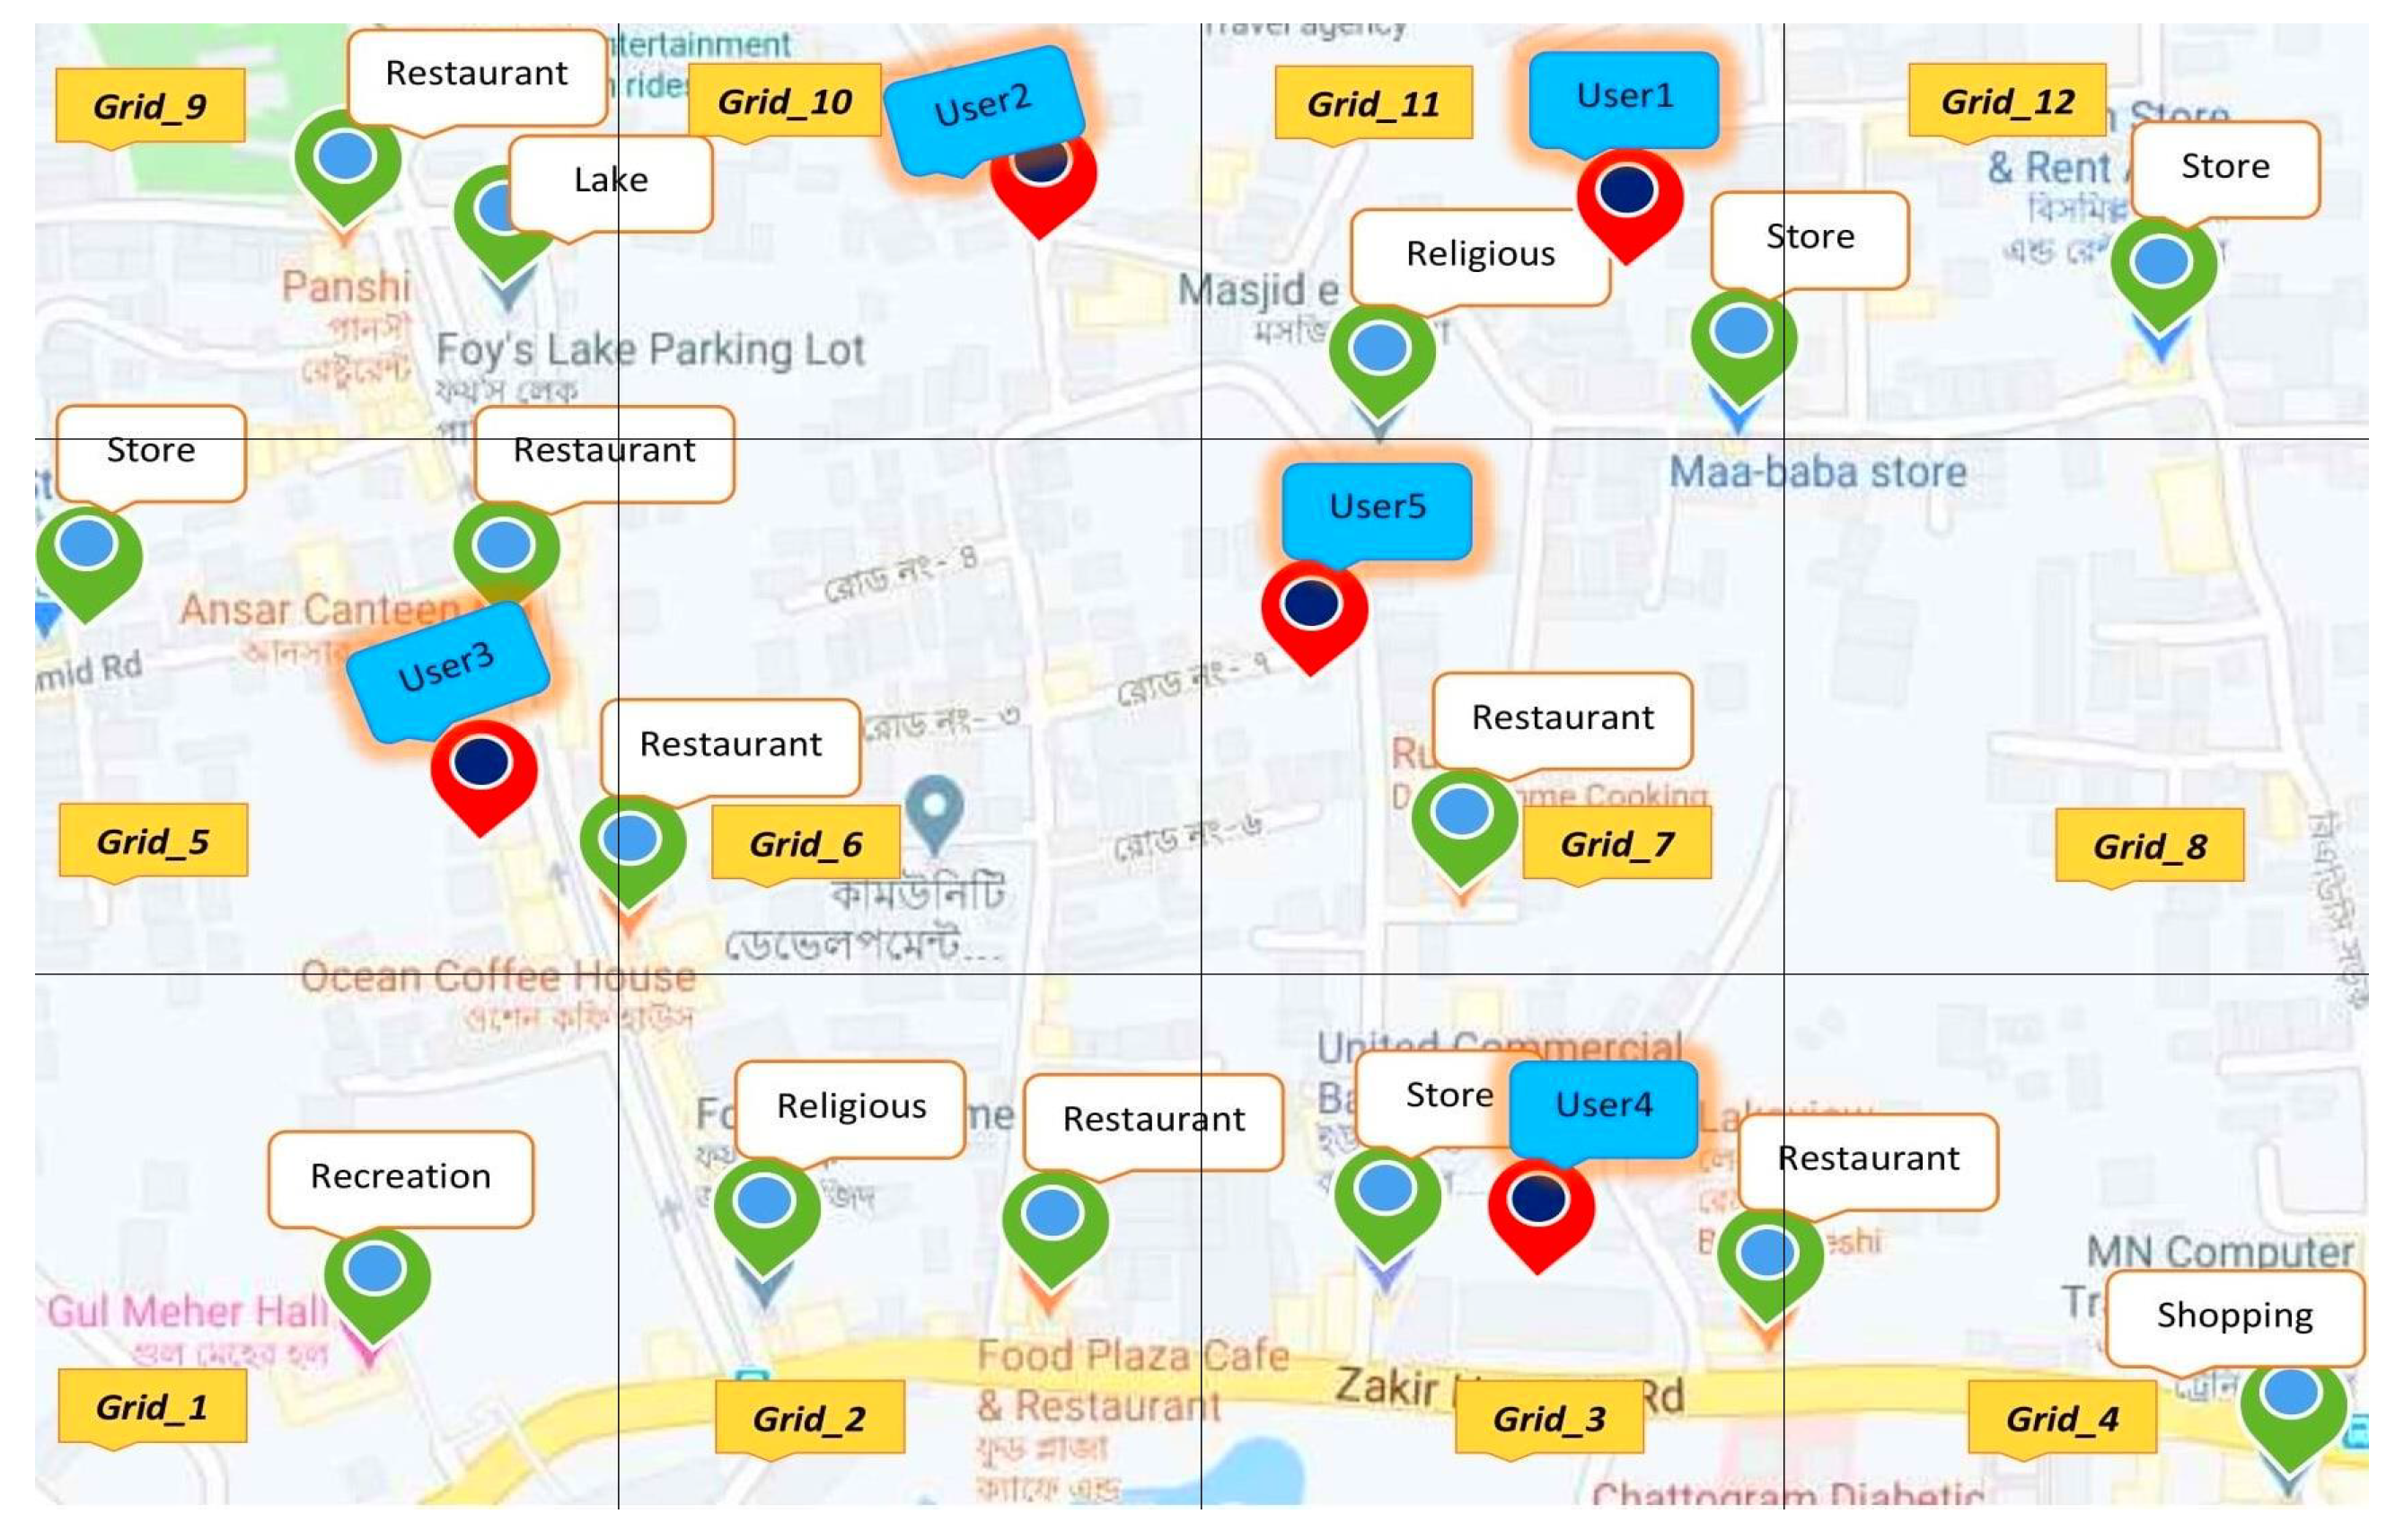
From
Figure 6 we can see that there are five users in five different grids. First, we analyze each user’s profile individually to find their POIs within a specific range.
Let consider
has
,
,
,
,
, and
to calculate the similarity. Similarly,
has
,
,
,
,
, and
;
has
,
,
,
,
, and
;
has
,
,
,
,
, and
;
has
,
,
,
,
,
,
,
, and
. First, we compare each user’s interest profile with the POIs within the selected grids to identify the best matching. After finding each user’s matched POIs, we calculate the majority voting to find the best matching POIs among the users. For example, we have two best matching POI such as ’Restaurant’ and ’Shopping’ category for the group. Then we try to find the ’Restaurant’ category at an optimal distance from all the users of the group using their centroid location. From
Figure 6 we can see that
contains a ’Restaurant’ which is located at an optimal distance. In case the first priority ’Restaurant’ could not be found then we try to find the second priority ’Shopping’ to make the final suggestion.
5. Experimental Results and Evaluation
We use the synthetic dataset of check-in spots for offline experiment and real-world map information to evaluate the system accuracy of our proposed framework.
5.1. Dataset and Implementation
The information concerning the location contains the name, latitude, longitude, type, and rating are already shown in
Table 2. In our work, the number of locations is 55,368 from 2500 different users. We considered 2000 users who checked more than 50 spots. In the DBSCAN clustering algorithm we used around a radius
of 0.84 and the value of
of the cluster is 18. In the Cosine similarity formula, we used 200 users profile for similarity calculation. We consider eleven parent categories based on the statistical analysis of the extracted POIs using the google place API. To demonstrate
Figure 3 we only show five categories as an example.
5.2. Evaluation of Our Proposed Mechanism
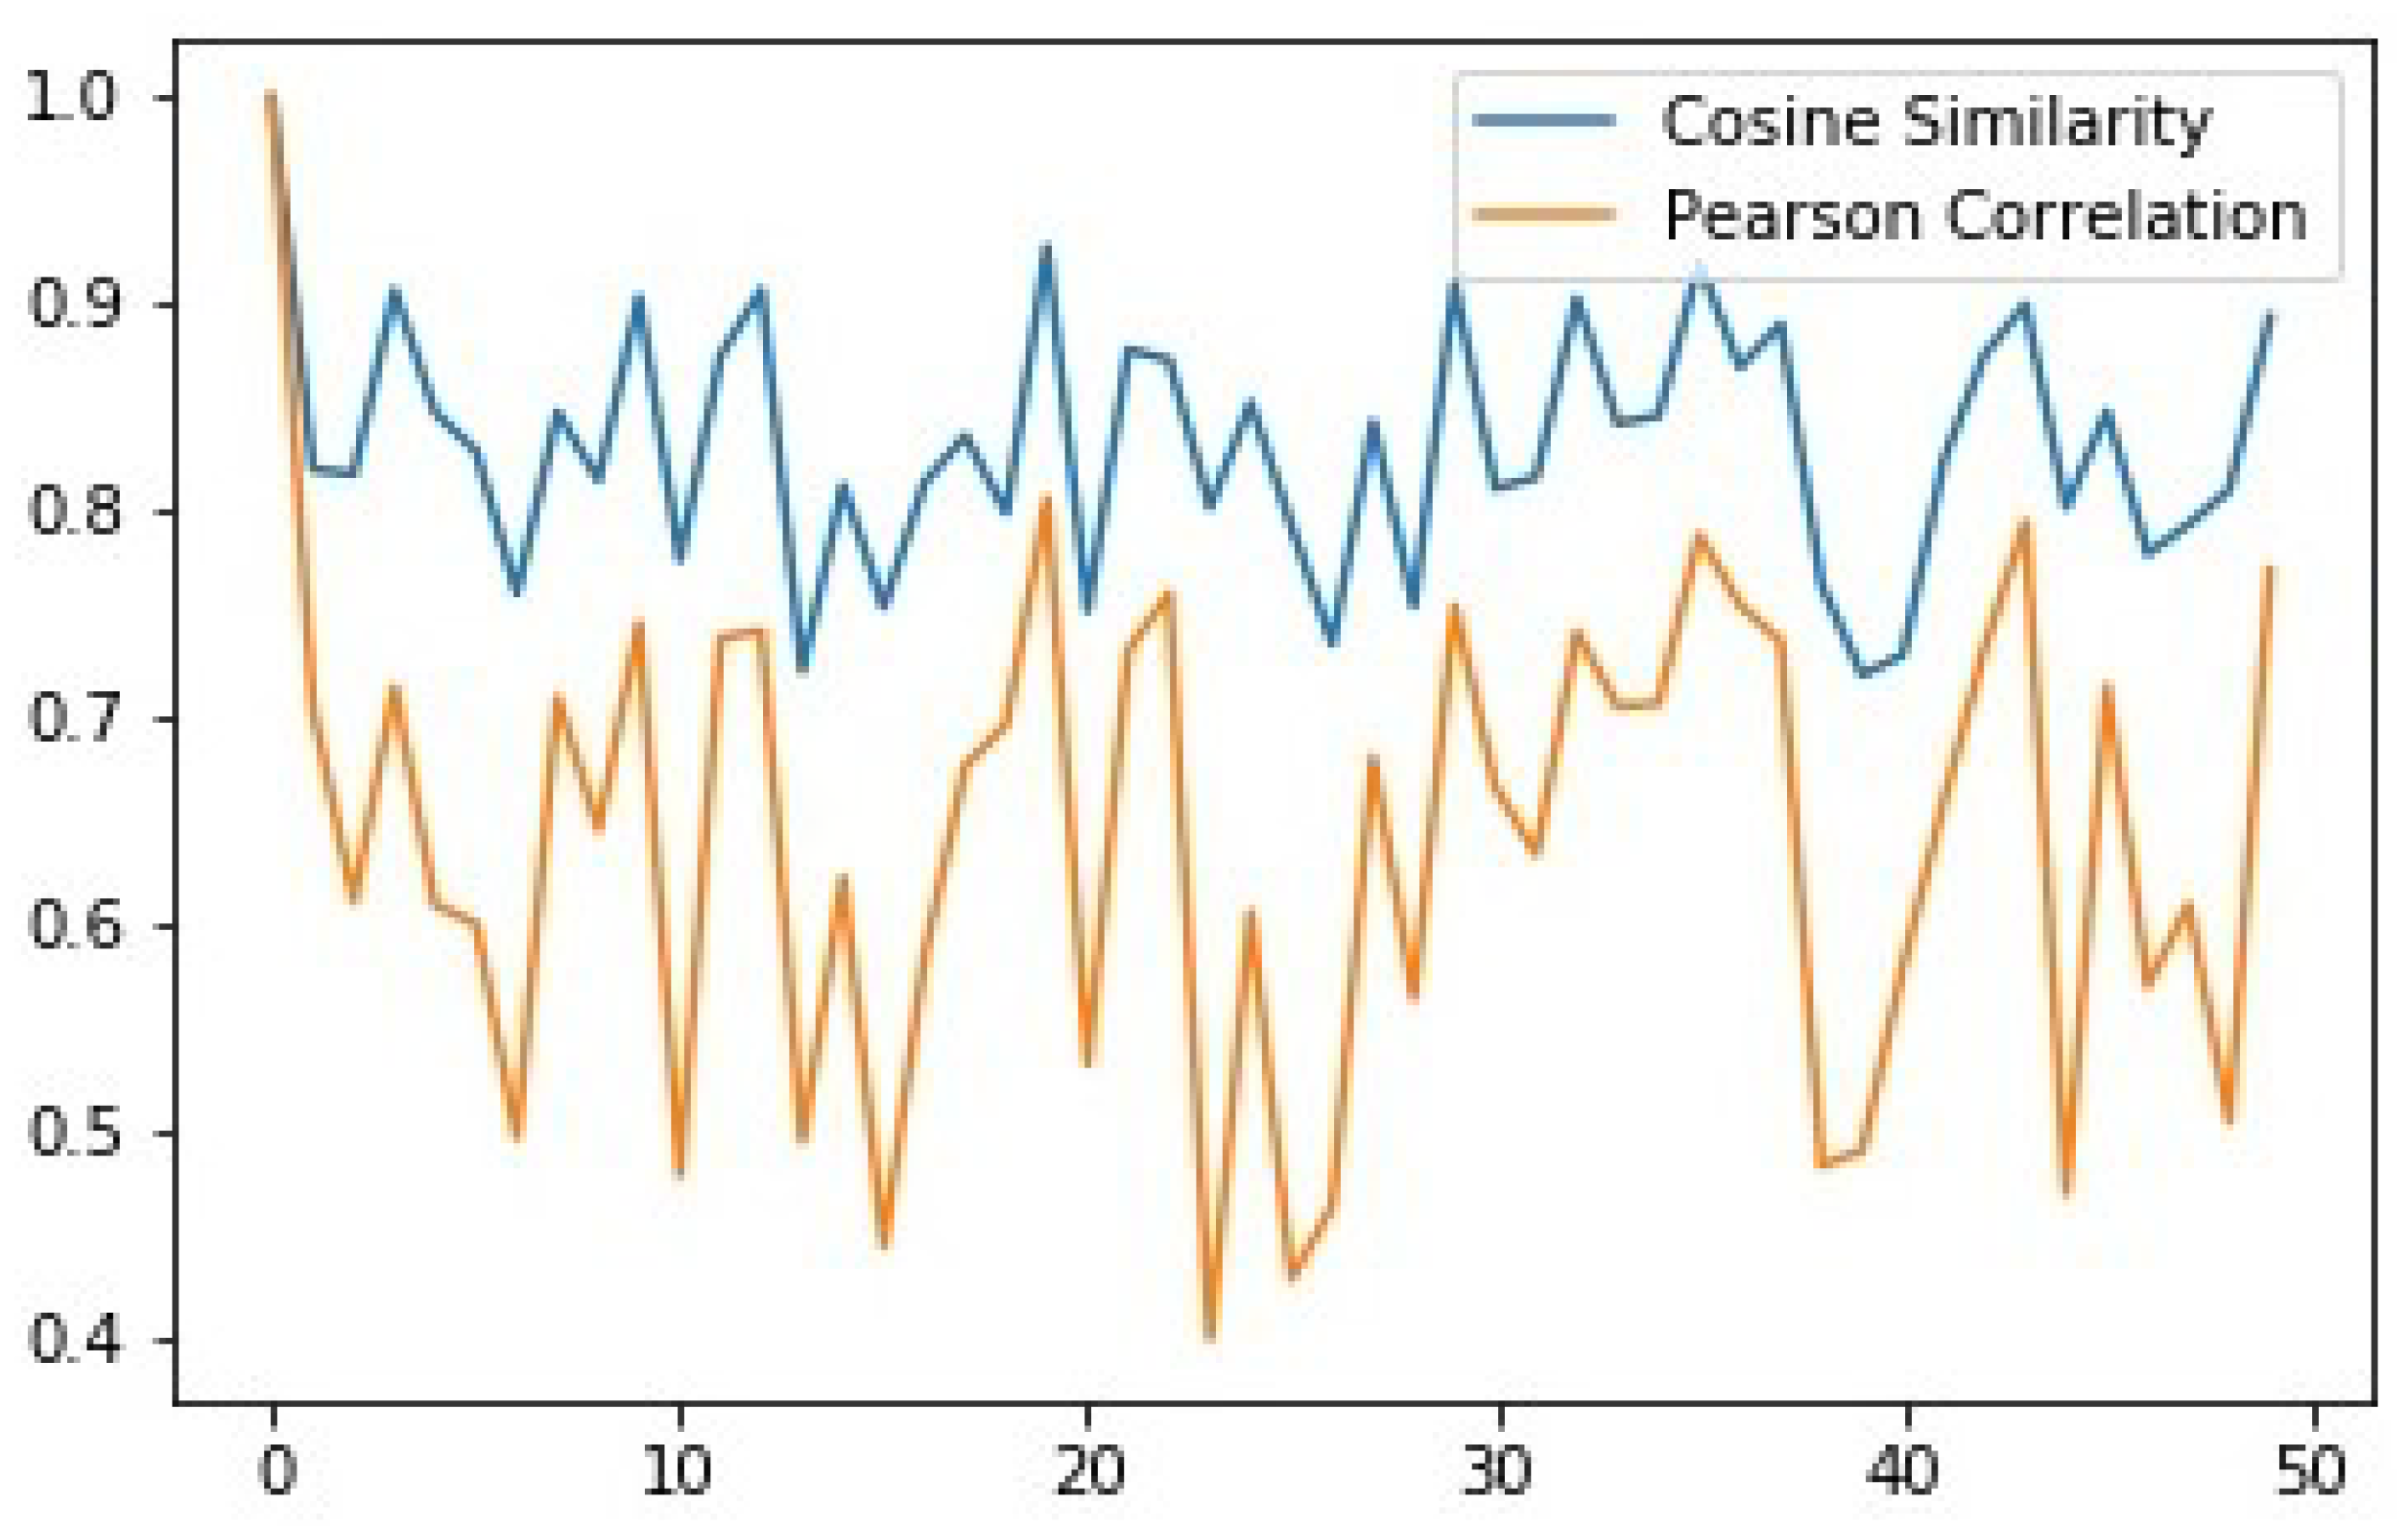
Once our proposed system is developed, it is necessary to evaluate the accuracy of the system. For the similarity calculation we also considered the Pearson coefficient given in Formula (
3) alongside with the Cosine similarity.
To measure the best similarity score we compared this two well-known correlation co-efficient formula and plot it into a graph.
Figure 7 represents a graph where we compared each user profile with 50 other users using these two correlation. It can be seen that the cosine coefficient gives more effective scores than the Pearson coefficient to find the top-k similar user.
To demonstrate the results of our system outcome, the three accuracy measurement parameter is used. The first parameter of the measurement is known as the Precision rate in Formula (
4).
Here, the variable
defines the number of true suggestions and
defines the number of suggestions that are false to the user. A higher precision rate means our results are useful. The next measure rate recall is given below.
From Formula (
5),
defines the number of instances when the system fails to suggest a POI place. Higher recall value means our system outcomes are complete. The last parameter is
F-measure and the formula is given here.
F-measure is the weighted Harmonic Mean of
and
value. Higher the
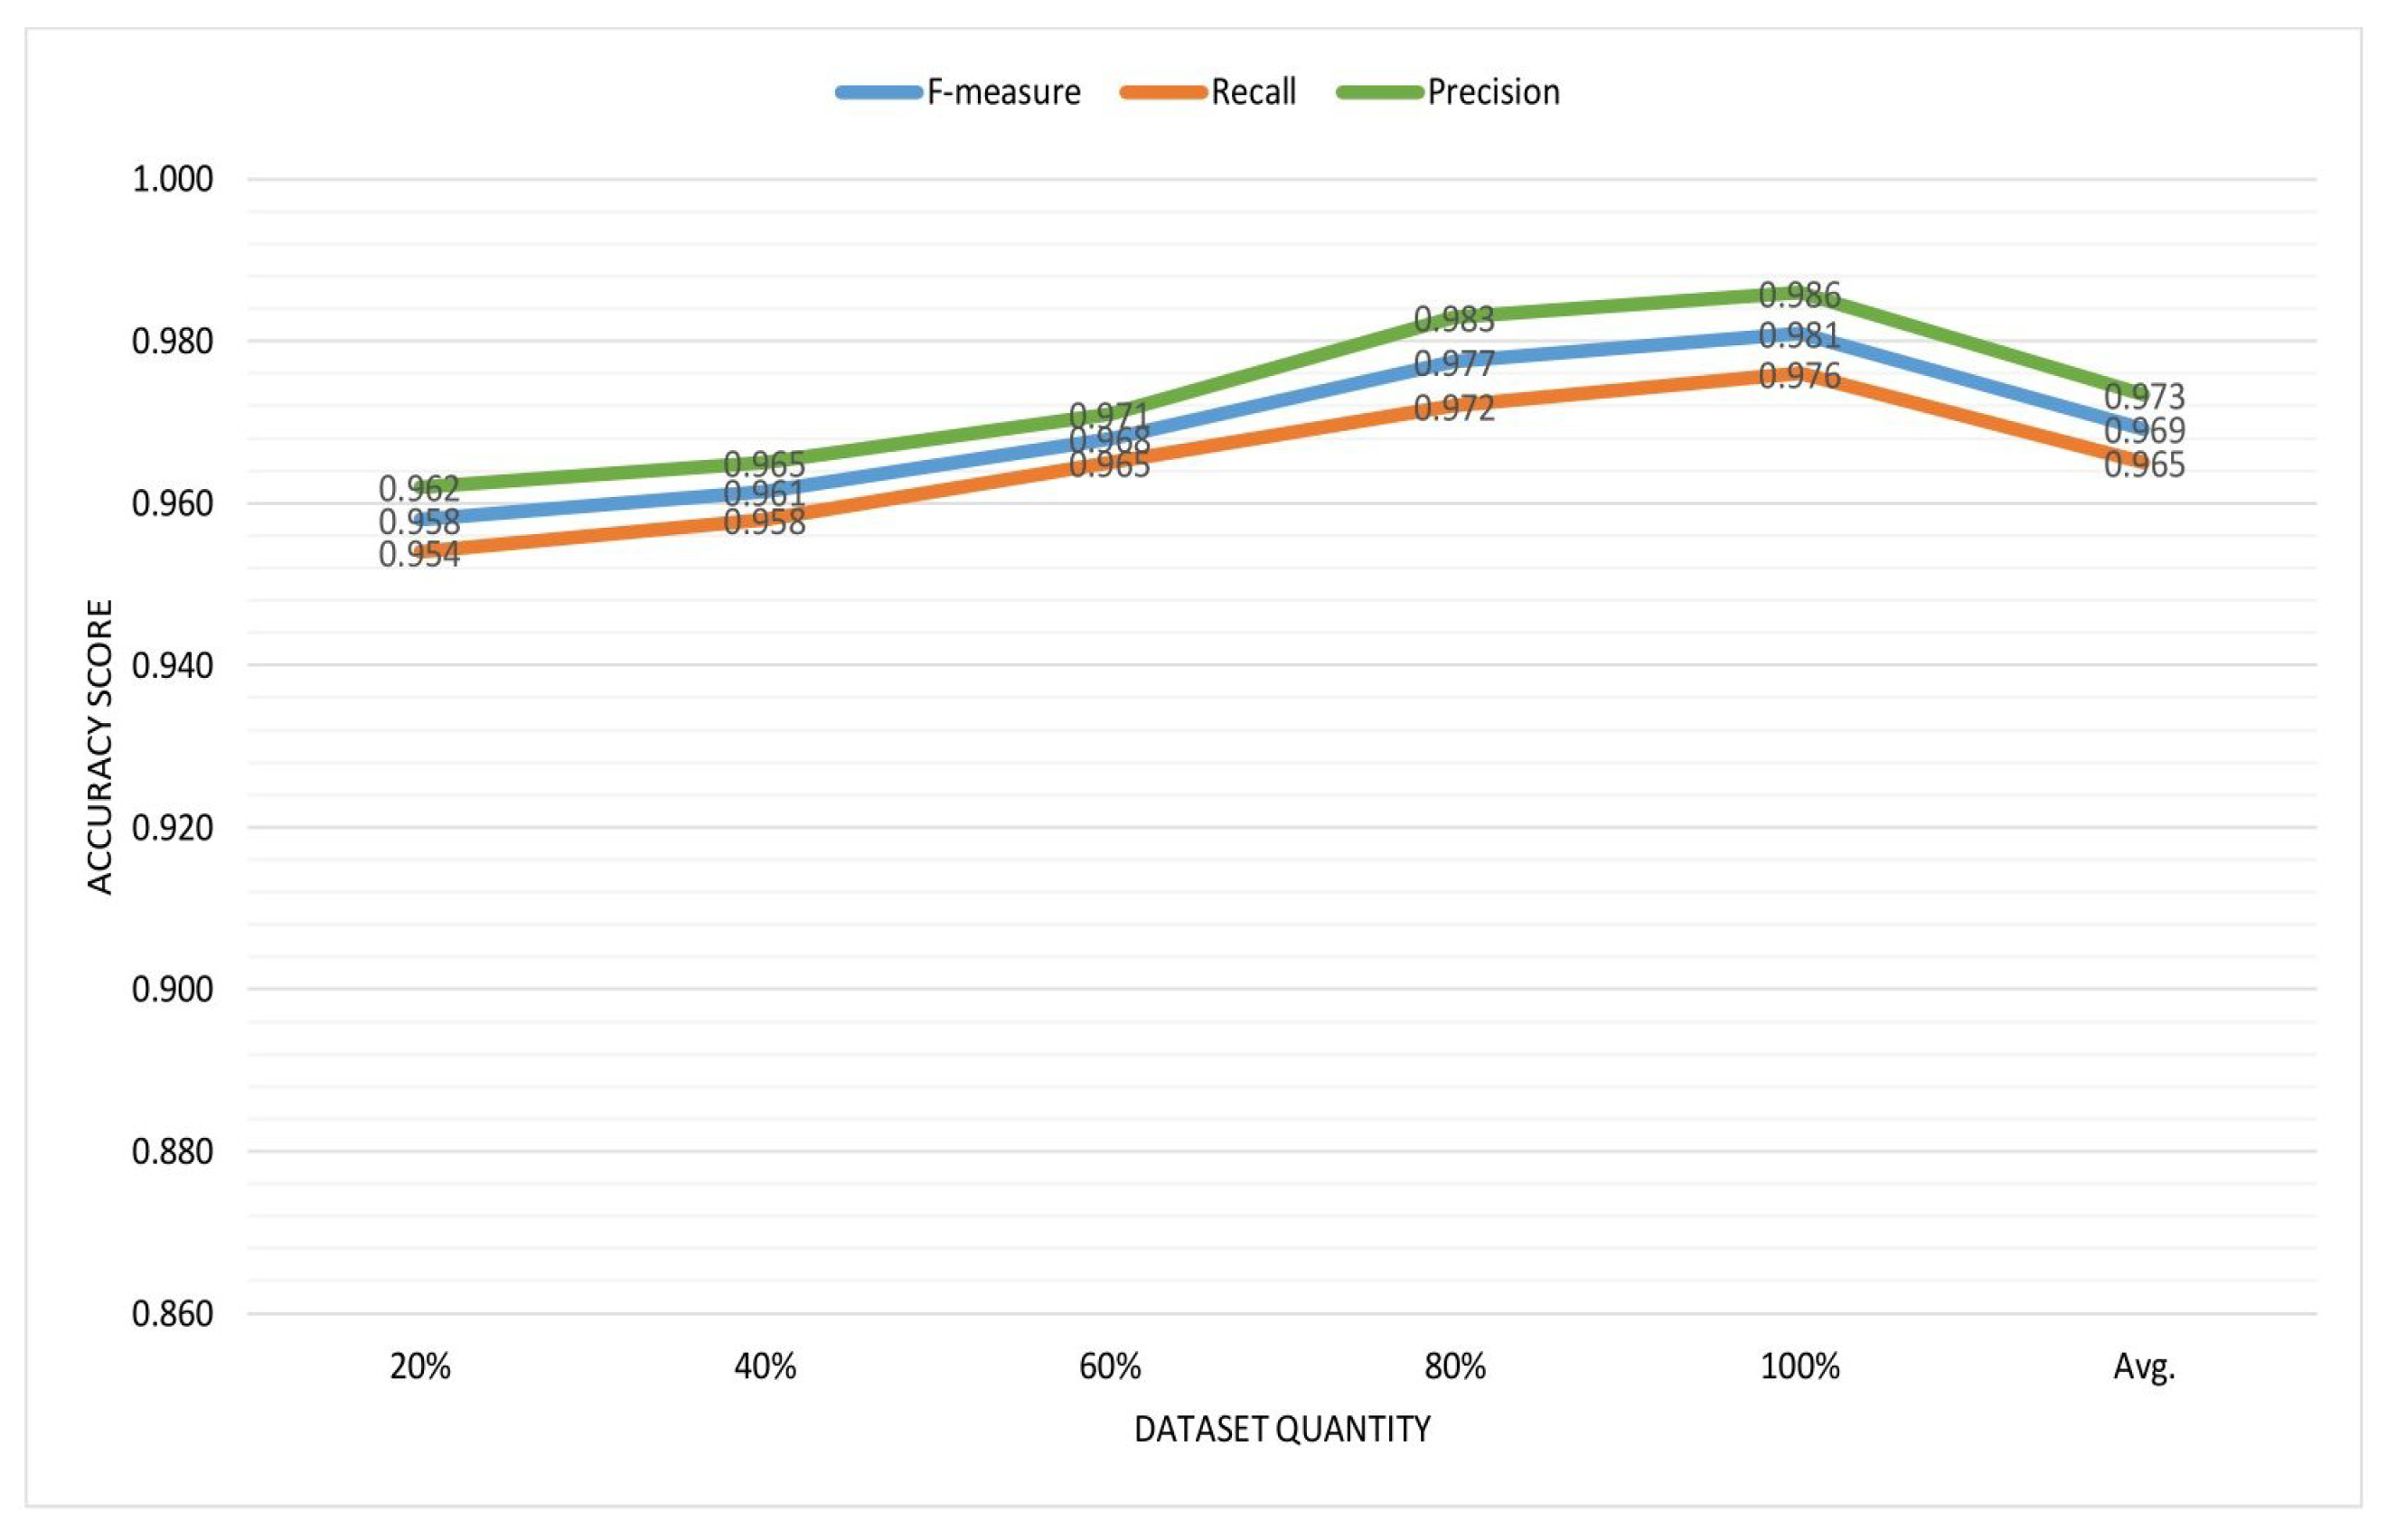
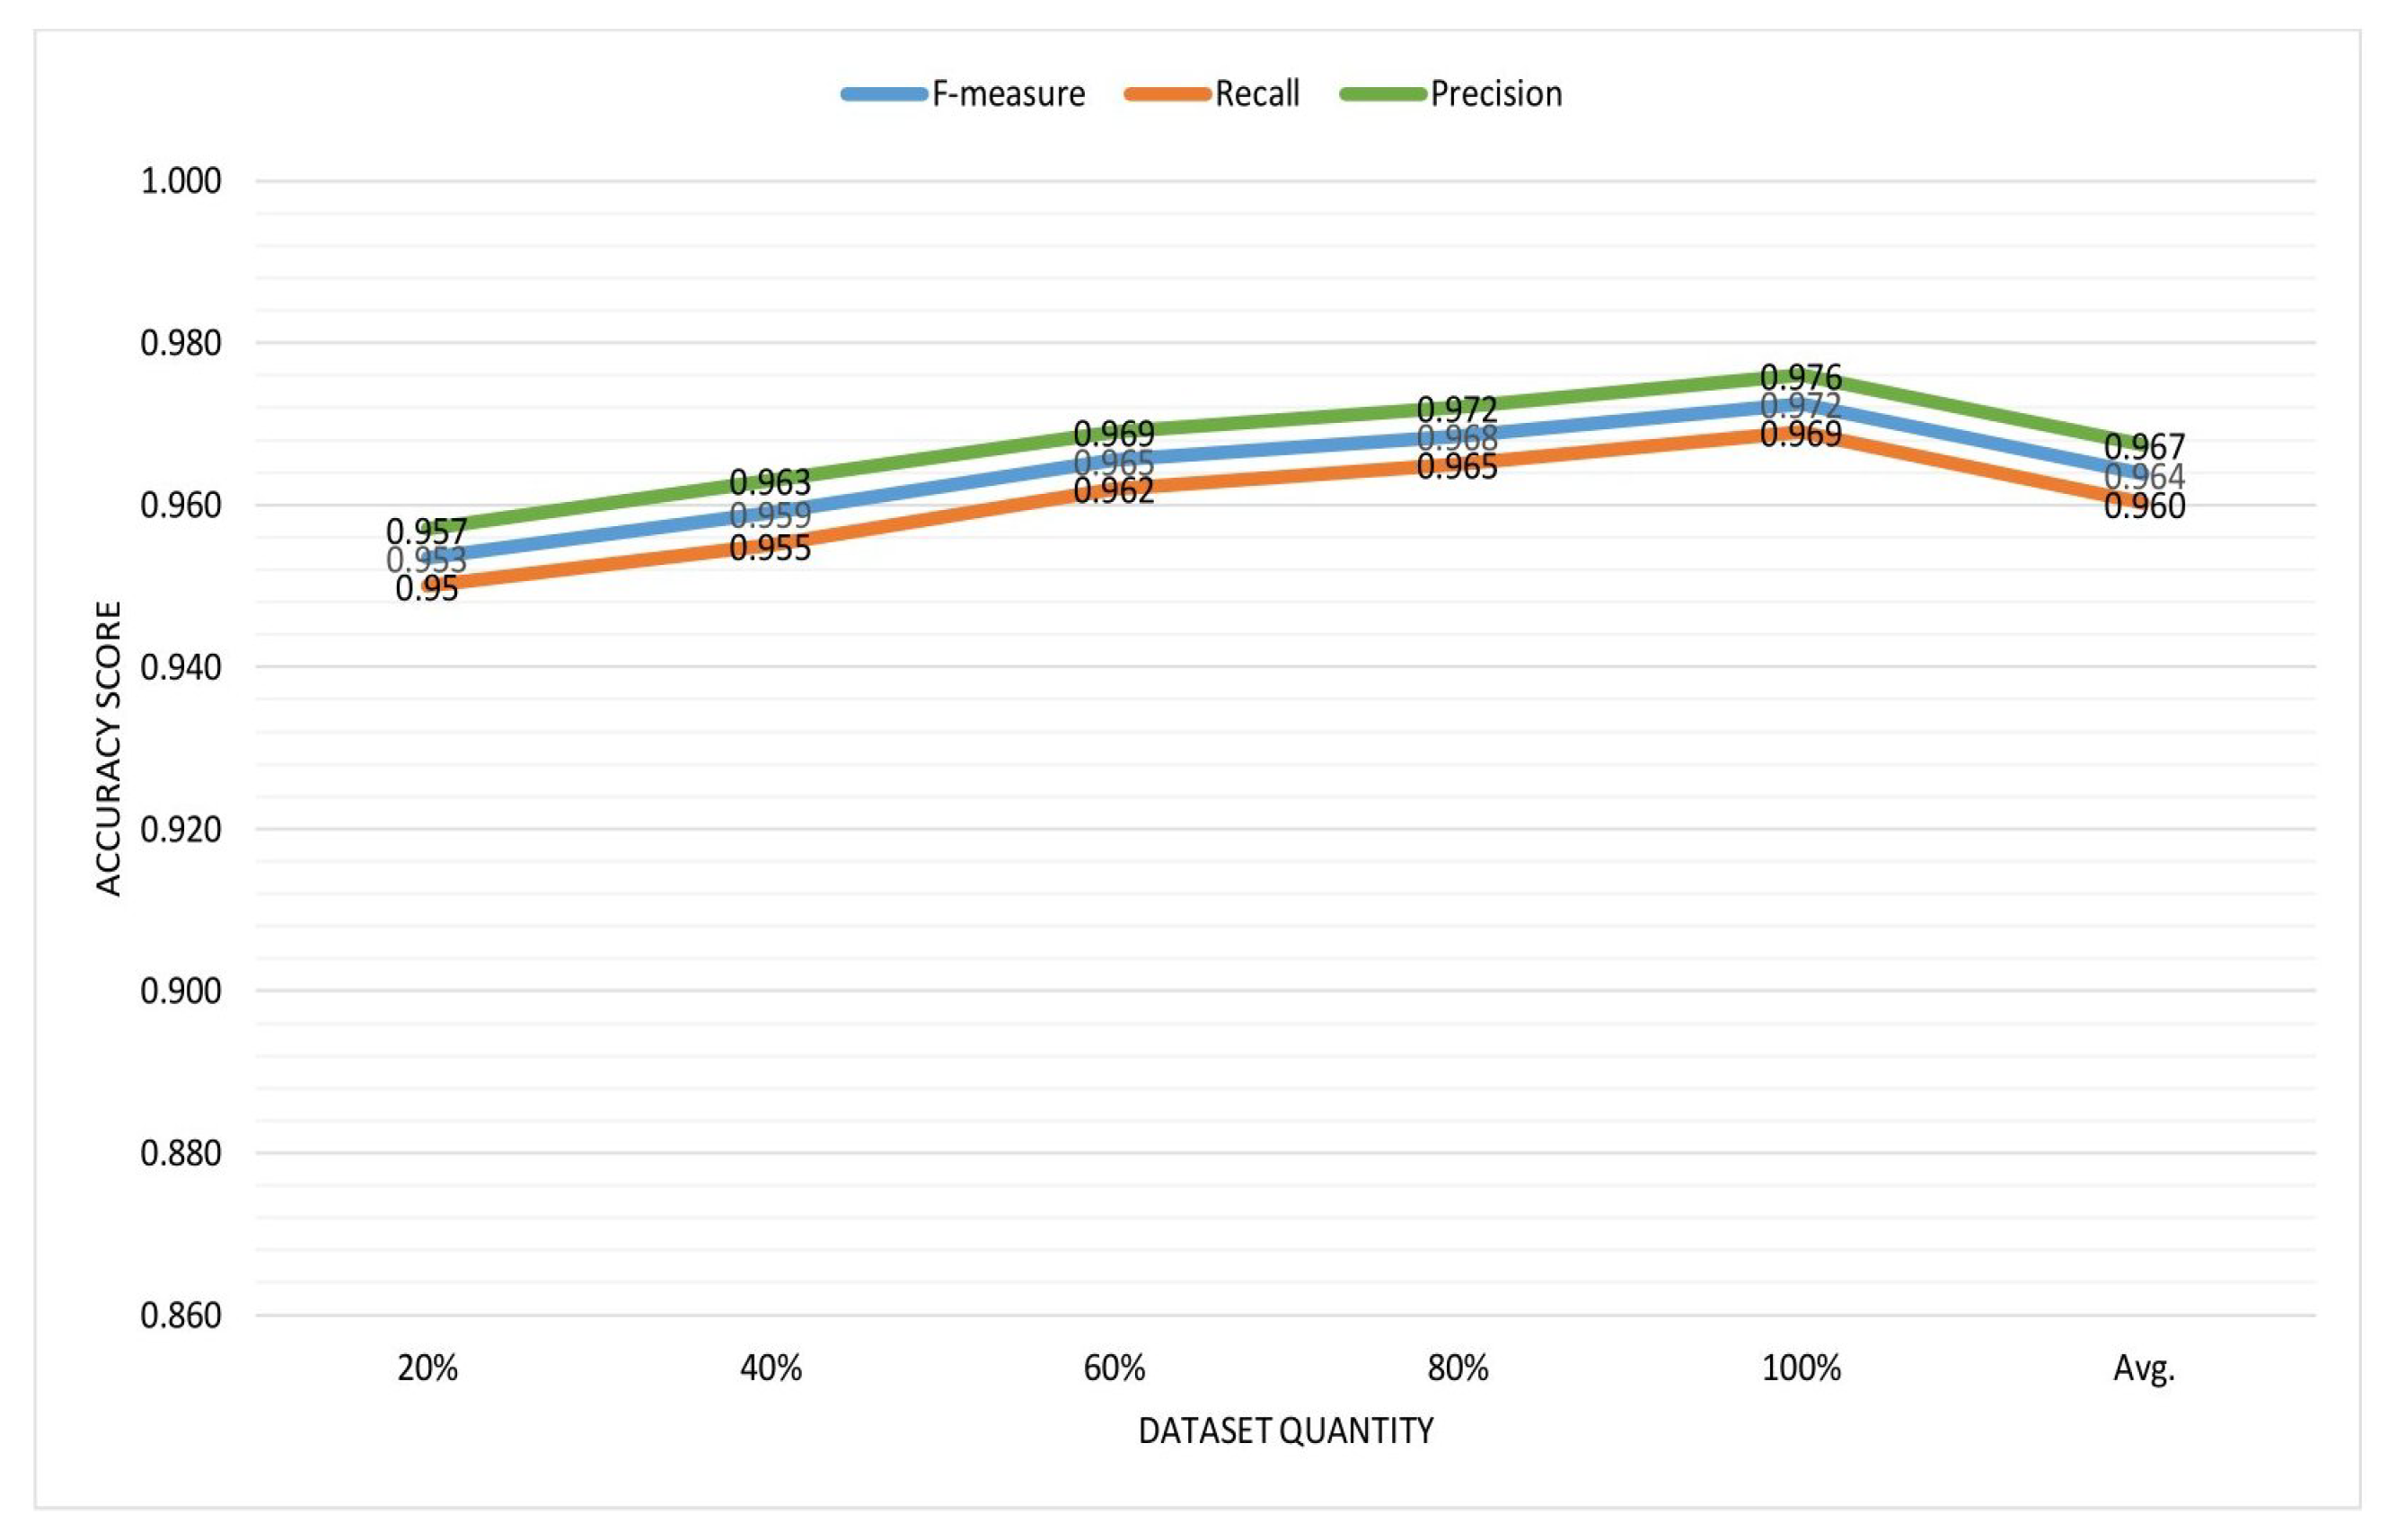
F-measure value higher the accuracy of the system. We have divided our total dataset equally into five group 20%, 40%, 60%, 80%, and 100%, to measure the accuracy metrics. Then we tested our system into two steps. The first one is for the single user. We selected 50 users and measured the performance metrics.
Table 9 represents the
,
, and
F-measure value of our system with the increasing number of dataset.
From the table we can see that
F-measure value increases with the amount of data where the average value of
F-measure,
, and
is measured as 0.962, 0.969, and 0.955, respectively.
Figure 8 shows the accuracy graph for the recommendations.
Now for the second step of evaluation, we considered 10 different groups and measured all the metrics.
Table 10 shows the resultant values where we get almost similar result as for the single user.
Figure 9 shows the accuracy graph on the recommendations for the groups.
6. Discussion and Lessons Learned
In our work, we proposed a system that considers the user’s interest profile generated from their previous activities. To generate the user’s interest profile, we used the DBSCAN clustering to form the parent category of the check-in spots. Then a collaborative filtering method is used to find the unvisited places that can also be a point of interest for a user to complete the user profile. We considered top-k users with a similarity score of more than 0.5 to identify the unvisited places. We introduced a grid-based structure to map the POIs into different grids to reduce the computational complexity. Finally, the two way of recommendation is generated. We considered the current location of the user and the physical distance between the suggested POI location and the user location for the recommendation. To provide the shortest distance we measured the manhattan distance for the single user. In the case of group recommendations, we analyzed all users’ profiles of the group to find similar interests. Then their centroid is calculated to provide the recommendations at an optimal distance from all the users of the group. We tested our system in two categories for real world users and evaluated them accordingly.
There are some features that can be added to our system for better improvement. For example, our work does not provide the facility with information about traffic congestion update on the road between the user’s location and their destination. In the future, we will consider this to provide a congestion-free path to the user.
7. Conclusions and Future Research Directions
The recommendation system is the platform of information retrieval and filtering system that intends to predict the user’s preferences. Although a lot of research has been done on this, some of them used the user’s previous activities, and some other systems give an idea of how to form a group based on their activities. Considering all those facts, in our work, we provided a system that constructs a user interest profile and then provides suggestions to the user as well as to a group of users according to their preferences. Generating a user profile based on the user’s previous activities helps to increase the system’s effectiveness. During the evaluation step, we got the F-measure values on average 0.962 and 0.964 for two different recommendations. After evaluating the result of our framework, we can say that this system improves the traveling options for the users.
Author Contributions
Specification of the individual contributions: Conceptualization, A.C.R. and M.S.A.; A.C.R. and M.S.A.; methodology, A.C.R. and M.S.A.; experiment, implementation and evaluation, A.C.R. and M.S.A.; and all authors have participated in investigation, original draft writing and proof-editing to the published version of the manuscript. All authors have read and agreed to the published version of the manuscript.
Funding
This research received no external funding.
Conflicts of Interest
The authors declare no conflict of interest.
References
- Roy, A.C.; Arefin, M.S. An Intelligent Recommendation System based on Collaborative Filtering and Grid Structure. In Advances in Intelligent Systems and Computing (AISC), Proceedings of the 5th International Conference on Internet of Things and Connected Technologies (ICIoTCT), Patna, India, 3–5 July 2020; Springer: New York, NY, USA, 2020; in press. [Google Scholar]
- AlBanna, B.; Sakr, M.; Moussa, S.; Moawad, I. Interest aware location-based recommender system using geo-tagged social media. ISPRS Int. J. Geo-Inf. 2016, 5, 245. [Google Scholar] [CrossRef]
- Jaradat, A.; Mohamad, N.A.; Asadullah, A.; Ebrahim, S. Issues in Location Based Marketing: A Review of Literature. Int. J. Sci. Res. Publ. 2015, 5, 1–4. [Google Scholar]
- Uitz, I.; Koitz, R. Consumer Acceptance of Location Based Services in the Retail Environment. Int. J. Adv. Comput. Sci. Appl. 2013, 4. [Google Scholar] [CrossRef]
- Huang, H.; Gartner, G. Current trends and challenges in location-based services. ISPRS Int. J. Geo-Inf. 2018, 7, 199. [Google Scholar] [CrossRef]
- Raper, J.; Gartner, G.; Karimi, H.; Rizos, C. A critical evaluation of location based services and their potential. J. Locat. Based Serv. 2007, 1, 5–45. [Google Scholar] [CrossRef]
- Chang, S.E.; Hsieh, Y.J.; Lee, T.R.; Liao, C.K.; Wang, S.T. A user study on the adoption of location based services. In Advances in Web and Network Technologies, and Information Management; Springer: Berlin/Heidelberg, Germany, 2007; pp. 276–286. [Google Scholar]
- Huang, H.; Gartner, G.; Krisp, J.M.; Raubal, M.; Van de Weghe, N. Location based services: Ongoing evolution and research agenda. J. Locat. Based Serv. 2018, 12, 63–93. [Google Scholar] [CrossRef]
- Saleem, M.A.; Da Costa, F.S.; Dolog, P.; Karras, P.; Pedersen, T.B.; Calders, T. Predicting visitors using location-based social networks. In Proceedings of the 2018 19th IEEE International Conference on Mobile Data Management (MDM), Aalborg, Denmark, 26–28 June 2018; IEEE: Piscataway, NJ, USA, 2018; pp. 245–250. [Google Scholar]
- Elazab, A.; Shabana, B.; Hefny, H. Location Based Services Classifications. Eng. Sci. 2018, 3, 40–48. [Google Scholar]
- Ji, B.; Lee, Y.; Yu, K.; Kwon, P. Detecting Themed Streets Using a Location Based Service Application. ISPRS Int. J. Geo-Inf. 2016, 5, 111. [Google Scholar] [CrossRef]
- Yim, J.; Ganesan, S.; Kang, B.H. Location-based mobile marketing innovations. Mob. Inf. Syst. 2017, 2017, 1303919. [Google Scholar] [CrossRef]
- Yun, H.; Han, D.; Lee, C.C. Understanding the use of location-based service applications: Do privacy concerns matter? J. Electron. Commer. Res. 2013, 14, 215–230. [Google Scholar]
- Liao, G.; Jiang, S.; Zhou, Z.; Wan, C.; Liu, X. POI recommendation of location-based social networks using tensor factorization. In Proceedings of the 2018 19th IEEE International Conference on Mobile Data Management (MDM), Aalborg, Denmark, 26–28 June 2018; IEEE: Piscataway, NJ, USA, 2018; pp. 116–124. [Google Scholar]
- Ajantha, D.; Vijay, J.; Sridhar, R. A user-location vector based approach for personalised tourism and travel recommendation. In Proceedings of the 2017 International Conference on Big Data Analytics and Computational Intelligence (ICBDAC), Chirala, India, 23–25 March 2017; IEEE: Piscataway, NJ, USA, 2017; pp. 440–446. [Google Scholar]
- Chen, H.; Arefin, M.S.; Chen, Z.; Morimoto, Y. Place recommendation based on users check-in history for location-based services. Int. J. Netw. Comput. 2013, 3, 228–243. [Google Scholar] [CrossRef]
- Kosmides, P.; Remoundou, C.; Demestichas, K.; Loumiotis, I.; Adamopoulou, E.; Theologou, M. A location recommender system for location-based social networks. In Proceedings of the 2014 International Conference on Mathematics and Computers in Sciences and in Industry, Varna, Bulgaria, 13–15 September 2014; IEEE: Piscataway, NJ, USA, 2014; pp. 277–280. [Google Scholar]
- Berjani, B.; Strufe, T. A recommendation system for spots in location-based online social networks. In Proceedings of the 4th Workshop on Social Network Systems, Salzburg, Austria, 10 April 2011; pp. 1–6. [Google Scholar]
- Lee, M.J.; Chung, C.W. A user similarity calculation based on the location for social network services. In Proceedings of the International Conference on Database Systems for Advanced Applications, Hong Kong, China, 22–25 April 2011; Springer: Berlin/Heidelberg, Germany, 2011; pp. 38–52. [Google Scholar]
- Kbaier, M.E.B.H.; Masri, H.; Krichen, S. A personalized hybrid tourism recommender system. In Proceedings of the 2017 IEEE/ACS 14th International Conference on Computer Systems and Applications (AICCSA), Hammamet, Tunisia, 30 October–3 November 2017; IEEE: Piscataway, NJ, USA, 2017; pp. 244–250. [Google Scholar]
- Singh, S.; Gupta, R.; Panjabi, S.; Tribhuvan, A.; Jeswani, J. Place Recommendation System. Int. Res. J. Eng. Technol. (IRJET) 2017, 4, 367–369. [Google Scholar]
- Bhaidkar, Y.; Bhagwat, P.; Bhalere, P.; Gujar, R.; Walunj, S. Tourist place recommendation system. Int. J. Adv. Res. Innov. Ideas Educ. (IJARIIE) 2015, 2, 3032–3037. [Google Scholar]
- Jueajan, B.; Naleg, K.; Pipanmekaporn, L.; Kamolsantiroj, S. Development of location-aware place recommendation system on Android smart phones. In Proceedings of the 2016 Fifth ICT International Student Project Conference (ICT-ISPC), Nakhon Pathom, Thailand, 27–28 May 2016; IEEE: Piscataway, NJ, USA, 2016; pp. 125–128. [Google Scholar]
- Bao, J.; Zheng, Y.; Mokbel, M.F. Location-based and preference-aware recommendation using sparse geo-social networking data. In Proceedings of the 20th International Conference on Advances in Geographic Information Systems, Redondo Beach, CA, USA, 6–9 November 2012; pp. 199–208. [Google Scholar]
- Yu, Y.; Chen, X. A survey of point-of-interest recommendation in location-based social networks. In Proceedings of the Workshops at the Twenty-Ninth AAAI Conference on Artificial Intelligence, Austin, TX, USA, 25–30 January 2015. [Google Scholar]
- Li, Z.; Huang, M.; Zhang, Y. A collaborative filtering algorithm of calculating similarity based on item rating and attributes. In Proceedings of the 2017 14th Web Information Systems and Applications Conference (WISA), Liuzhou, China, 11–12 November 2017; IEEE: Piscataway, NJ, USA, 2017; pp. 215–218. [Google Scholar]
- Prasanth, A. Intelligent Recommendation System using Semantic information for Web Information Retrieval. Adv. Comput. Sci. Technol. 2017, 10, 2367–2380. [Google Scholar]
- Gupta, J.; Gadge, J. A framework for a recommendation system based on collaborative filtering and demographics. In Proceedings of the 2014 International Conference on Circuits, Systems, Communication and Information Technology Applications (CSCITA), Mumbai, India, 4–5 April 2014; IEEE: Piscataway, NJ, USA, 2014; pp. 300–304. [Google Scholar]
- Bhanushali, R.; Chitalia, S.; Panchal, P. Advanced Recommendation System. Int. Res. J. Eng. Technol. (IRJET) 2017, 4, 537–541. [Google Scholar]
- Mu, W.; Meng, F.; Chu, D. A collaborative filtering recommendation algorithm based on user preferences on service properties. In Proceedings of the 2014 International Conference on Service Sciences, Wuxi, China, 22–23 May 2014; IEEE: Piscataway, NJ, USA, 2014; pp. 43–46. [Google Scholar]
- Zheng, Y.; Zhang, L.; Ma, Z.; Xie, X.; Ma, W.Y. Recommending friends and locations based on individual location history. ACM Trans. Web (TWEB) 2011, 5, 1–44. [Google Scholar] [CrossRef]
- Schafer, J.B.; Frankowski, D.; Herlocker, J.; Sen, S. Collaborative filtering recommender systems. In The Adaptive Web; Springer: Berlin/Heidelberg, Germany, 2007; pp. 291–324. [Google Scholar]
- Zhang, R.; Liu, Q.D.; Wei, J.X. Collaborative filtering for recommender systems. In Proceedings of the 2014 Second International Conference on Advanced Cloud and Big Data, Huangshan, China, 20–22 November 2014; IEEE: Piscataway, NJ, USA, 2014; pp. 301–308. [Google Scholar]
- Takács, G.; Pilászy, I.; Németh, B.; Tikk, D. Scalable collaborative filtering approaches for large recommender systems. J. Mach. Learn. Res. 2009, 10, 623–656. [Google Scholar]
- Sharma, R.; Gopalani, D.; Meena, Y. Collaborative filtering-based recommender system: Approaches and research challenges. In Proceedings of the 2017 3rd International Conference on Computational Intelligence & Communication Technology (CICT), Ghaziabad, India, 9–10 February 2017; IEEE: Piscataway, NJ, USA, 2017; pp. 1–6. [Google Scholar]
- Farjoo, M.; Fazlollahtabar, H.; Ashoori, M.T. Design of a Recommender System for Online Shopping using Decision Tree and Apriori Algorithm. J. Softw. Eng. Intell. Syst. 2018, 3, 236–244. [Google Scholar]
- Ilango, M.; Mohan, V. A survey of grid based clustering algorithms. Int. J. Eng. Sci. Technol. 2010, 2, 3441–3446. [Google Scholar]
- Aguilar, J.; Valdiviezo-Díaz, P.; Riofrio, G. A general framework for intelligent recommender systems. Appl. Comput. Inform. 2017, 13, 147–160. [Google Scholar] [CrossRef]
- Ramzan, B.; Bajwa, I.S.; Jamil, N.; Mirza, F. An Intelligent Data Analysis for Hotel Recommendation Systems using Machine Learning. arXiv 2019, arXiv:1910.06669. [Google Scholar]
- Gomathi, R.; Ajitha, P.; Krishna, G.H.S.; Pranay, I.H. Restaurant Recommendation System for User Preference and Services Based on Rating and Amenities. In Proceedings of the 2019 International Conference on Computational Intelligence in Data Science (ICCIDS), Chennai, India, 21–23 February 2019; IEEE: Piscataway, NJ, USA, 2019; pp. 1–6. [Google Scholar]
- Lin, K.; Chen, Y.; Li, X.; Wu, Q.; Xu, Z. Friend recommendation algorithm based on location-based social networks. In Proceedings of the 2016 7th IEEE International Conference on Software Engineering and Service Science (ICSESS), Beijing, China, 26–28 August 2016; IEEE: Piscataway, NJ, USA, 2016; pp. 233–236. [Google Scholar]
- Zhiming, C.; Arefin, M.S.; Morimoto, Y. Skyline queries for spatial objects: A method for selecting spatial objects based on surrounding environments. In Proceedings of the 2012 Third International Conference on Networking and Computing, Okinawa, Japan, 5–7 December 2012; IEEE: Piscataway, NJ, USA, 2012; pp. 215–220. [Google Scholar]
- Zeng, J.; Li, F.; Liu, H.; Wen, J.; Hirokawa, S. A restaurant recommender system based on user preference and location in mobile environment. In Proceedings of the 2016 5th IIAI International Congress on Advanced Applied Informatics (IIAI-AAI), Kumamoto, Japan, 10–14 July 2016; IEEE: Piscataway, NJ, USA, 2016; pp. 55–60. [Google Scholar]
- Wang, Z.; Yu, X.; Feng, N.; Wang, Z. An improved collaborative movie recommendation system using computational intelligence. J. Vis. Lang. Comput. 2014, 25, 667–675. [Google Scholar] [CrossRef]
© 2020 by the authors. Licensee MDPI, Basel, Switzerland. This article is an open access article distributed under the terms and conditions of the Creative Commons Attribution (CC BY) license (http://creativecommons.org/licenses/by/4.0/).


 ,
, 


