1. Introduction
The literature offers several definitions of the intrusion event, e.g., Sundaram [
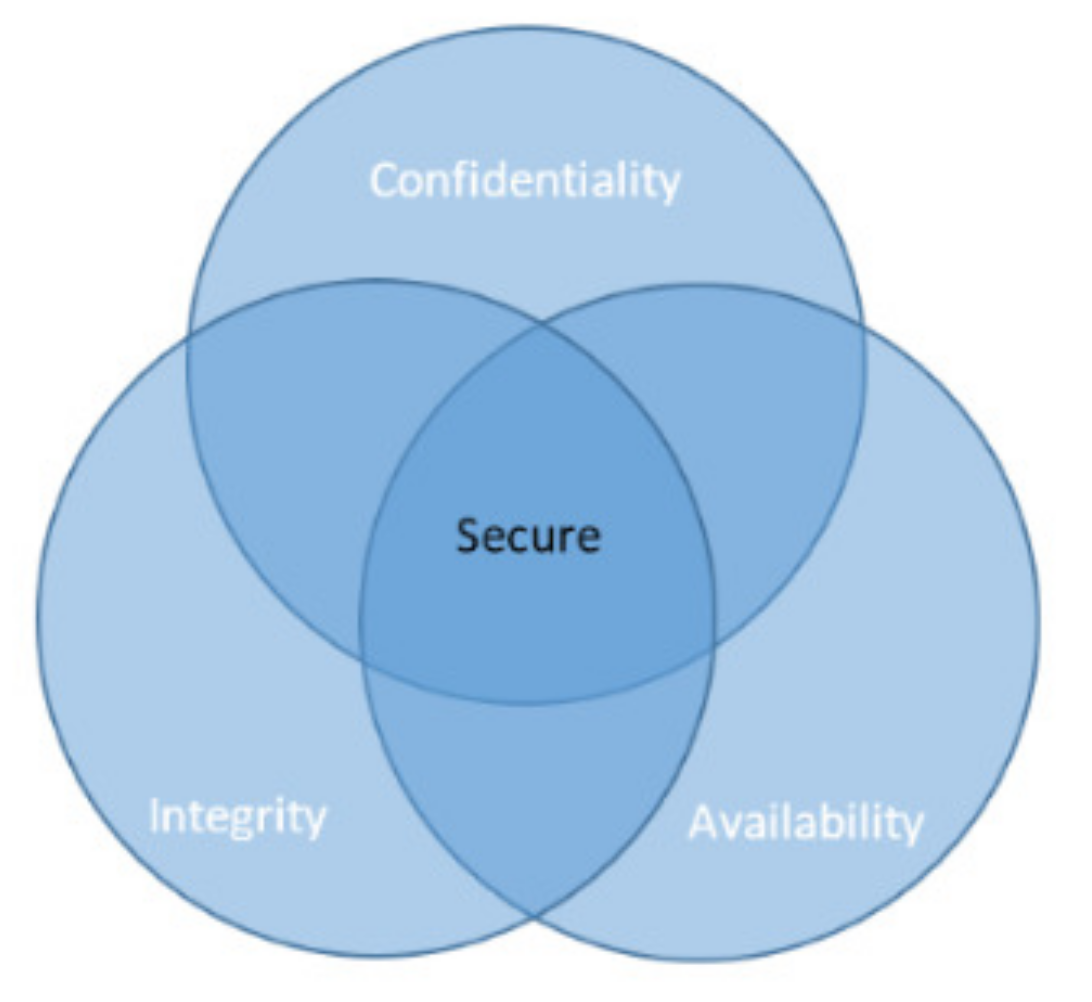
1] defined it as an attempt to bypass or compromise a specific objective, which can be a single machine or an entire network. The literature also indicates the CIA model (also called CIA triad or CIA triangle) as the security model to take into account in terms of goals to achieve [
2]. It defines the three main requirements of security, namely
confidentiality,
integrity, and
availability, as summarized in
Figure 1. The
confidentiality requirement expresses the need that a resource related to a machine/network must be accessed only by authorized users; the
integrity requirement is related to the need that a resource can be modified only by authorized users, according to their permissions; and the
availability requirement means that a resource must be available to authorized users in the times established for it, without any limitation or interruption.
In the context of network security,
Intrusion Detection Systems (
IDSs) [
3] represent the main tool, as in their different configurations and modalities they are able to analyze the events that occur in a network, with the aim of detecting the illegitimate ones. Nowadays, this activity has become crucial due to the huge number of network services, public and private, which involve critical and important areas, such as health services [
4], education [
5], financial services [
6], and so on.
One of the most crucial transversal security problems, that of privacy, was deeply investigated by Verykios et al. [
7], who provided an overview on the area of privacy-preserving data mining, whereas Narwaria and Arya [
8] provided a comparative analysis of some well-known privacy preservation techniques. However, the massive growth of network security risks is given by the contribution of different factors, such as the increase of wireless network connections [
9], the advent of the Internet of Thing (IoT) [
10], and the large development of new broadband infrastructures (optical fiber [
11], 5G [
12], etc.). Therefore, in the context of the network protection, the choice of using IDSs together with other canonical protection systems (e.g., firewalls [
13]) mainly depend on the inability of these to operate extensively, without previously defined rules.
Given this background, the literature identifies different types of IDSs: although they can operate in different manner, their common objective is the analysis and classification of each network event, distinguishing the normal activities from the intrusion ones. For instance, the literature reports intrusion detection approaches based on machine learning criteria such as gradient boosting [
14], adaptive boosting [
15], and random forests [
16]. Other proposals involve artificial neural networks [
17], probabilistic criteria [
18], or data transformation/representation [
19,
20,
21], similarly to what is done, in terms of scenario and data balance, in closely related domains [
22,
23,
24,
25,
26,
27,
28,
29,
30]. It should be noted that, besides sharing the same objectives, they also tackle analogous problems, such as the difficulty of classifying intrusion events that are very similar to normal ones in terms of characteristics or the difficulty to detect novel form of attacks (e.g., zero-days attacks [
31]).
For these reasons, after having positively evaluated the effectiveness of data transformation in other fields [
32,
33,
34], which show it to be able to achieve better characterization of the involved information and a clear reduction of the possible feature patterns, we experimented on this strategy in the IDS domain. In more detail, the proposed LFE strategy operates by introducing a series of new features calculated on the basis of the existing ones, along with a discretization of each feature value, according to a numeric range experimentally defined. The combination of these two data pre-processing steps offers a better characterization of each network event (introduction of new features) and helps to reduce the number of feature patterns by aggregating the similar ones (discretization process).
Scientific Contribution
This work represents an extension of a previous one [
32], completely rewritten and extended, formally and substantially, by updating and expanding the background and related work under the light of the recent literature, as well as providing an extensive overview of the scenario under consideration. Specifically, each provided reference is verified and updated if necessary, and further aspects—very close to the research area taken into account—are added and discussed, such as the analysis of the common classes of network attacks, and the process of assessment of the network vulnerabilities.
A novel contextualization of this work in the feature engineering technique area is also performed, underlining advantages and differences with regard to the canonical literature exploitation of such a technique. In addition, the formalization of the algorithms related to the proposed strategy is detailed, and the related impact in terms of time complexity is analyzed and discussed. A detailed description of the involved state-of-the art algorithms of classification, in terms of literature references, operating principles, and used parameters, is also provided.
Detailed and extensive information about the process of evaluation in terms of the three adopted metrics is added, with the aim to offer an in-deep analysis of the experimental results in terms of both each single metrics and their average. An overview about the overall mean performance of the proposed LFE strategy, with regard to its application in the context of all the algorithms (aimed to estimate its behavior among the most common classification algorithms in the literature), and all the network events (aimed to estimate its behavior for the different types of intrusion events), is also provided. The main contributions related to this work can then be summarized as follows:
- -
a definition of the proposed LFE strategy in the intrusion detection context, with regard to the current literature, along with a preliminary analysis of the IDS solutions and the involved network vulnerabilities, in terms of common classes of network attacks;
- -
a formalization of the LFE strategy in the context of the feature engineering technique area, presenting its implementation, advantages, and differences, with regard to the canonical literature use;
- -
a definition of a classification algorithm that exploits the LFE strategy to perform the network events classification into two classes (i.e., normal or intrusion), together with the evaluation of its asymptotic time complexity;
- -
a detailed categorization of the events included in the widely adopted NSL-KDD dataset, through the definition of a novel taxonomy, and an independent experimental evaluation of our strategy carried out separately by intrusion typology.
- -
an evaluation of the proposed LFE strategy in the context of additional datasets, aimed to evaluate its capabilities to face real-world scenarios characterized by heterogeneous type of network attacks; and
- -
an extensive validation of our LFE strategy, made by comparing it to a series of largely used solutions based on different state-of-the-art algorithms, using real-world data and three different metrics of evaluation, whose results are evaluated both individually and in terms of their average.
This work is structured as follows.
Section 2 provides related works in the domain, whereas
Section 3 includes background information, metrics for evaluation, and IDS essential concepts.
Section 4 presents the formal notation used in this work, together with the formulation of our objective.
Section 5 describes the implementation of the proposed strategy, from the feature engineering approach to the algorithm formalization and complexity analysis.
Section 6 provides information on the development environment, the adopted real-world dataset and evaluation metrics, and the validation modality.
Section 7 analyzes and discusses the experimental results, with regard to the canonical solutions.
Section 8 concludes this work by recapping the obtained results and introducing promising directions for future research.
2. Related Work
According to
Section 1, where we implicitly underline the great heterogeneity that characterizes the intrusion detection domain, in terms of both approaches and strategies, here we discuss some significant solutions in the literature.
Considering that the proposed strategy is based on the data preprocessing of the original feature space, it should be noted how this represents a common strategy in a number of works in the literature, albeit with different criteria. Such data preprocessing can involve many techniques, from the feature selection [
35] ones, aimed to select a subset of representative features to use during the evaluation model definition process, to the feature engineering [
36] ones, where the data domain knowledge is exploited to define/redefine features in order to improve the performance. An example of feature selection technique used in the context of the network anomaly intrusion detection can be found in [
37], where the authors proposed a framework aimed to improve the performance by exploiting a feature selection technique. An approach based on the mutual information used to perform the feature selection in the intrusion detection context is defined in [
38], whereas an interesting approach that combines several feature selection algorithms is presented in [
39]. Another interesting approaches of feature selection is presented in [
40], where the authors formalize such a technique in terms of a pigeon-inspired optimizer algorithm, applying it in an intrusion detection scenario. In [
41], the feature selection technique is considered in the context of the big data scenario, since the authors proposed a penalty-based wrapper objective function to evaluate the feature selection process, whereas, in [
42], the same authors faced the feature selection problem in a high-dimensional data scenario.
Several feature engineering techniques can be found in the current literature; for example, Kasongo and Sun [
43] proposed a deep learning method for the intrusion detection task, based on a feature engineering process and Wang et al. [
44] applied a feature engineering criterion that learns the hierarchical spatial-temporal aspects of the involved features through deep neural networks, in order to improve the intrusion detection performance. Recently, an interesting approach is proposed in [
45], where the authors defined a novel feature learning model for cybersecurity tasks. Kunang et al. [
46] proposed an automatic feature extraction technique based on autoencoder (i.e., a type of artificial neural network aimed to learn efficient data encodings, by following an unsupervised strategy) and support vector machine for the intrusion detection task. Recently, Ieracitano et al. [
47] combined the autoencoder technique with a statistical analysis, in order to define an intrusion detection approach.
Although they present some overlap, feature selection and feature engineering techniques have different objectives; however, the proposed strategy operates in a different manner with respect to both of them. This happens since, instead of performing a selection of the most relevant features or defining some new ones on the basis of the entire dataset via data mining techniques, we first introduce new features based on statistical metrics (minimum, maximum, average, and standard deviation), and then we discretize the value of each feature, reaching a better characterization of each event, without significant computational efforts.
Both components of the proposed strategy operate synergistically, because the introduction of new features (a process aimed to improve the event characterization) counteracts the loss of information related to the data discretization (a process aimed to reduce the potential event patterns). It should also be observed that the strategy we proposed is not in direct competition with the intrusion detection approaches in the literature, as its main objective is to improve their intrusion detection performance by preprocessing the involved data, regardless of the type of algorithm they adopted.
3. Background
To start, we can observe how the literature classifies several types of Intrusion Detection Systems (IDSs), along with the definition of the intrusion detection concept, which was first introduced by James Anderson in 1980 [
48], and later formalized by Dorothy Denning in 1987 [
49]. In the following years, many works and surveys have deepened and discussed this concept, up to the present day. In 2000, Axelsson [
50] discussed the taxonomy of intrusion detection systems, presenting a survey and their classification. In 2008, Modi et al. [
51] proposed a survey aimed to study how the different intrusions can affect the availability, confidentiality, and integrity of cloud resources and services. Another interesting work was presented in 2017 by Zarpelao et al. [
52], who extended the intrusion detection concept to the IoT scenario, where the authors tried to identify leading trends, open issues, and future research possibilities, classifying the IDSs formalized in the literature on the basis of several attributes.
3.1. Intrusion Detection Systems
The main task of an IDS is the analysis and classification of the network activity, which is aimed to discriminate the normal network events from the intrusion ones. The concept of intrusion can be related both to a software activity, such as malware [
53,
54] (e.g., spyware, virus, rootkit, etc.) and to a human activity [
55] addressed to the illegitimate exploitation of network resources.
3.1.1. Operative Ways
Although there are many ways to classify the IDSs, one of the most used in the literature classifies them into four categories: anomaly-based network IDSs, signature-based network IDSs, specification-based network IDSs, and Hybrid-based network IDSs. They are summarized as follows:
Anomaly-based network IDSs, also named behavior-based network IDSs, operate by analyzing and classifying each network event in two classes, normal or intrusion. Instead of performing a process of comparison between the new network events and a database that contains the signatures/patterns related to the known ones, the classification process exploits a heuristic or rules-based strategy aimed to detect the intrusion in terms of events not attributable to a normal network activity. It should be noted that, despite the huge research effort in this area, as well as the huge number of such systems formalized in the literature, problems to be solved continue to exist [
56];
Signature-based network IDSs, also named knowledge-based network IDSs, operate by comparing the pattern of each new network event to a database of known signatures/patterns [
57]. In [
58], the authors proposed to face the problem related to the significant overheads in terms of memory usage and execution time related to the signature/pattern matching operation by parallelizing the process on a multi-core CPU.
Specification-based network IDSs, also named stateful protocol analysis network IDSs, operate by knowing and tracing the involved protocol states with the objective to detect unexpected sequences of commands [
59]. The related disadvantages are the computational load that needs for the protocol state tracing and analysis and their inability to inspect attacks based on the same behavior of the normal network activities. An example of this category of IDSs can be found in [
60], where the protocol packets are examined to detect malicious payloads.
Hybrid-based network IDSs operate by mixing the aforementioned approaches with the goal to improve the detection performance, according to a specific objective/scenario [
61]. An example is the work proposed in [
62], where the authors formalized a hybrid of anomaly-based and specification-based IDS aimed to operate in the context of an IoT environment.
On the basis of the researchers’ experience reported in the literature, the main pros and cons of the aforementioned approaches are summarized in
Table 1.
3.1.2. Operative Placement
A further classification of the IDSs has been made by taking into account their placement in the network to be protected. In this case, the literature classifies the IDSs into the following four categories:
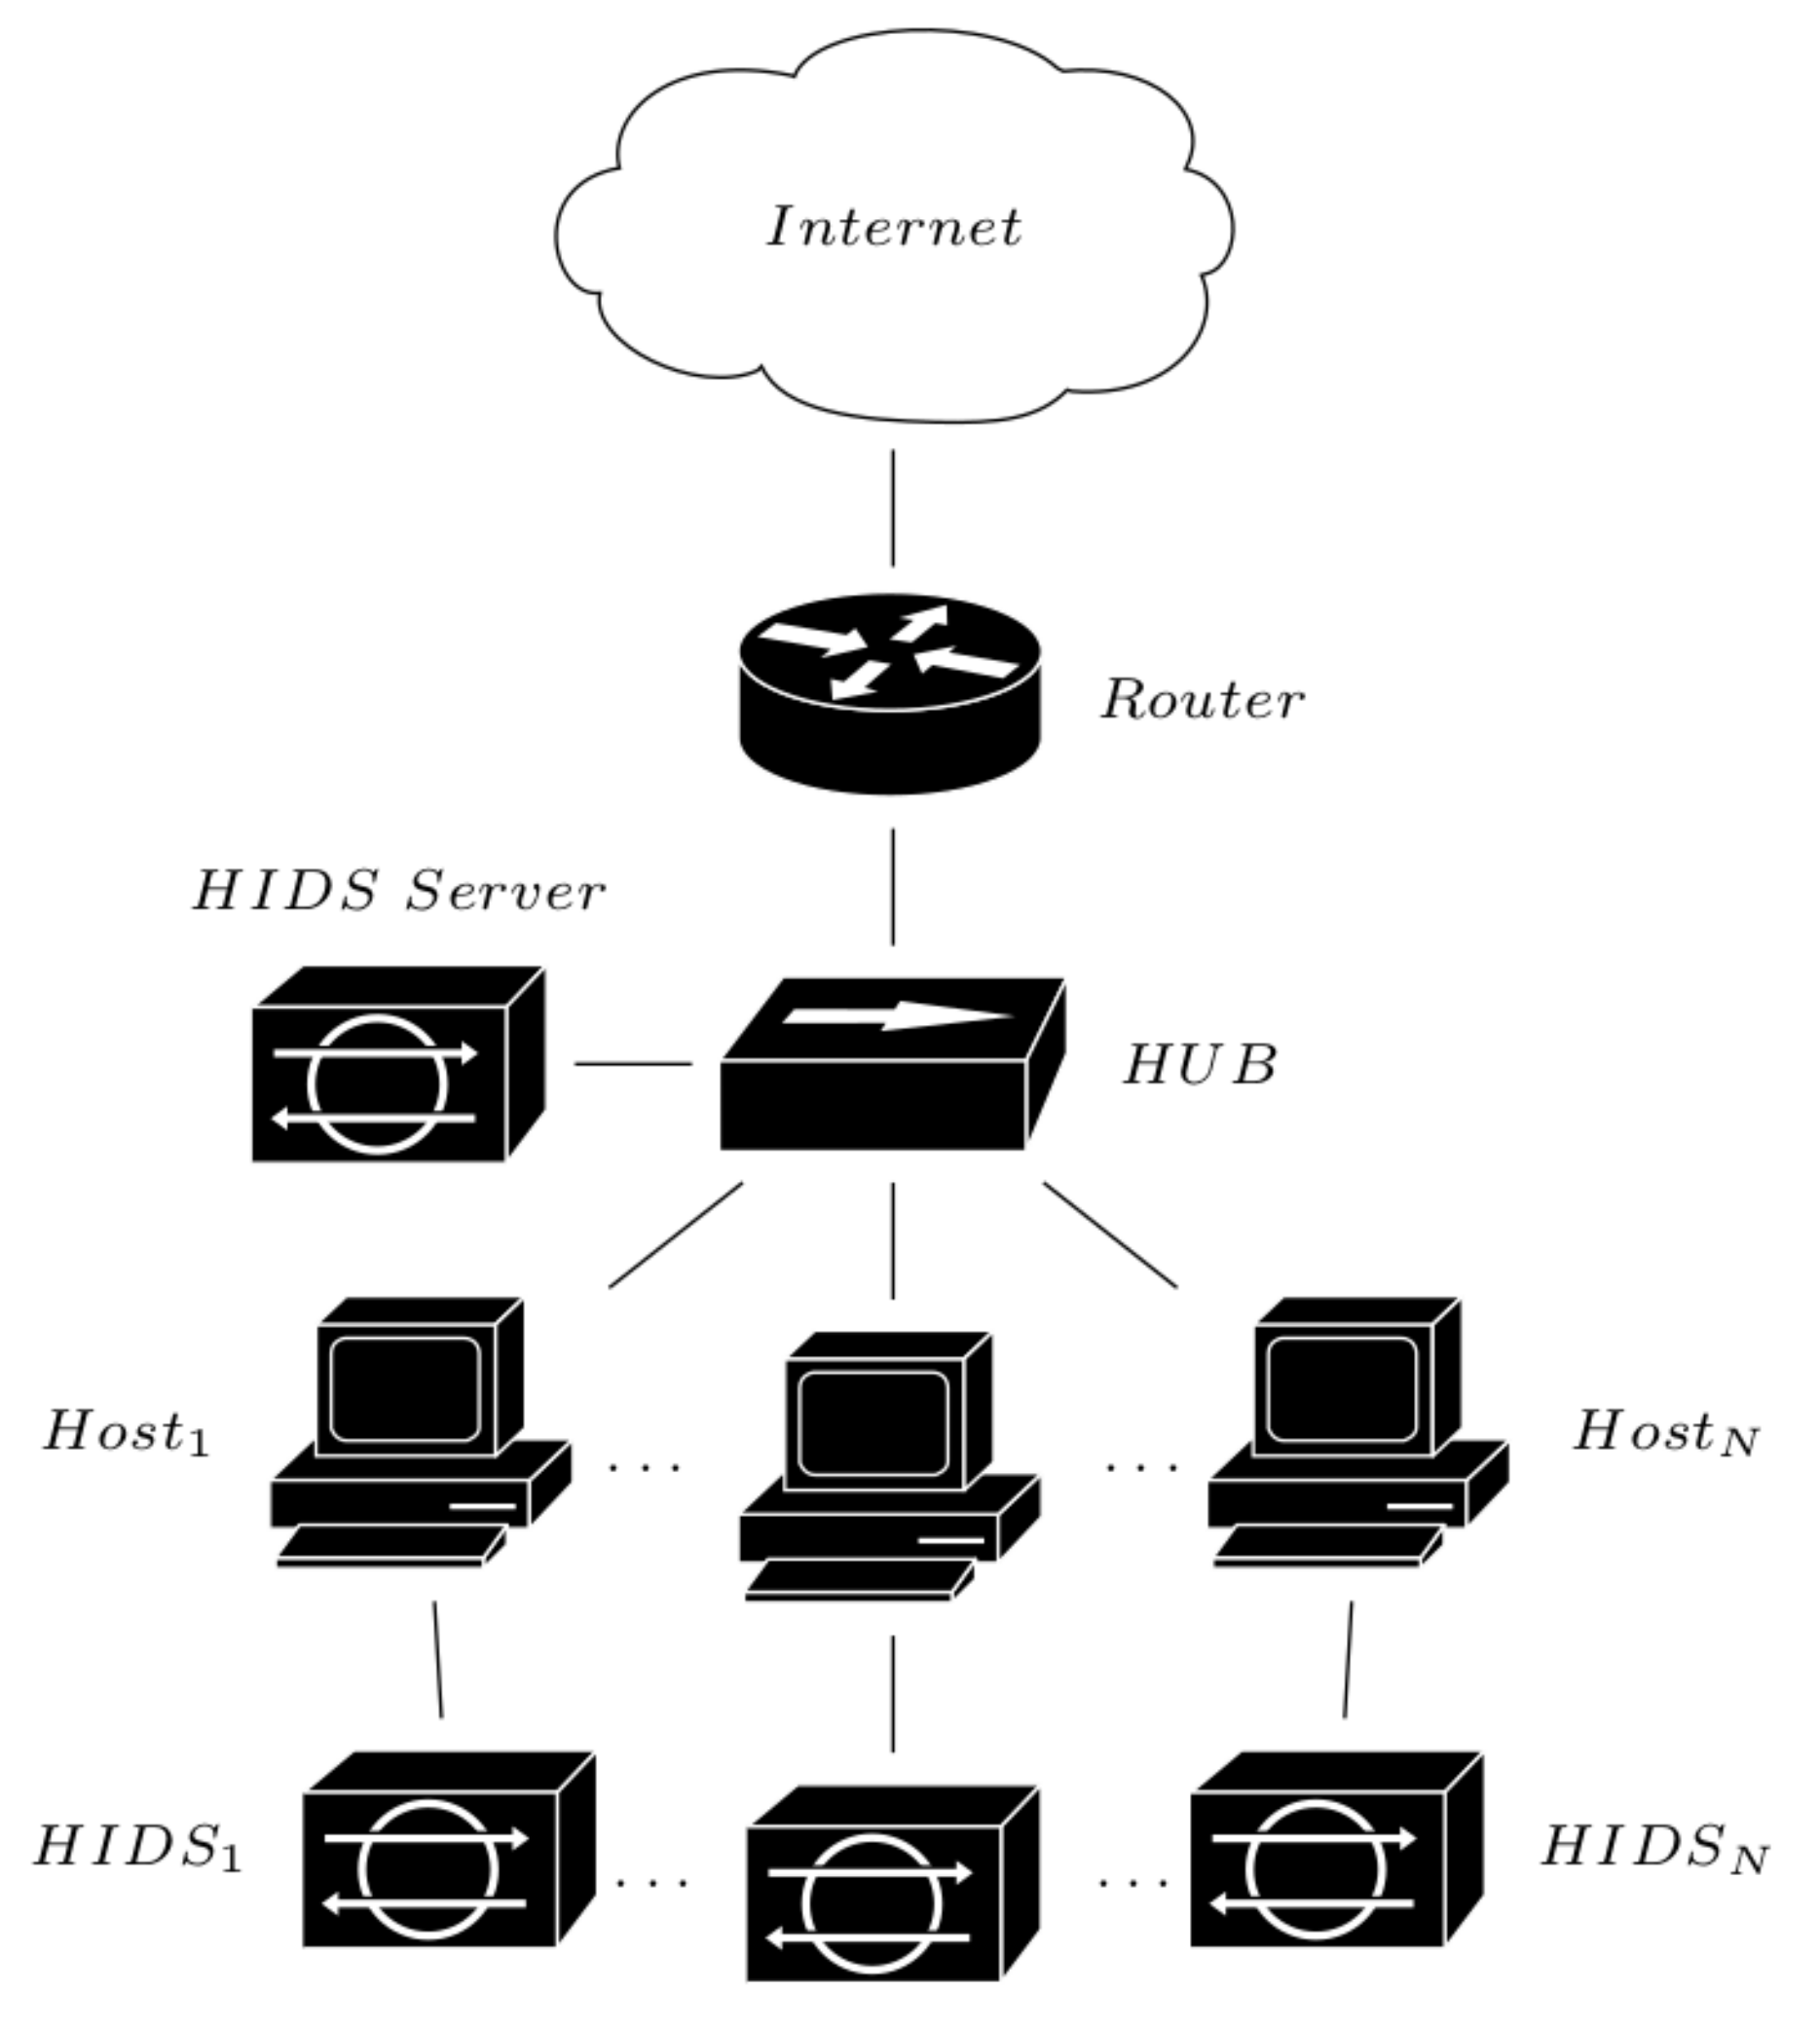
Host-based [
63]: A Host-based Intrusion Detection System (HIDS) operates by exploiting several hosts (
Figure 2) with the aim to capture the network activity. Each new network event is compared to the information stored in a database (signatures), and, when an intrusion is detected, the system responds with a series of countermeasures. The main advantage of such a configuration is related to the system scalability in terms of possibility to add other hosts to improve the detection performance. The latency between an intrusion and its detection represents the main disadvantages, as well as the high number of misidentifications of normal (false positive) and intrusions (false negative) events.
Figure 2.
IDS host-based modality.
Figure 2.
IDS host-based modality.
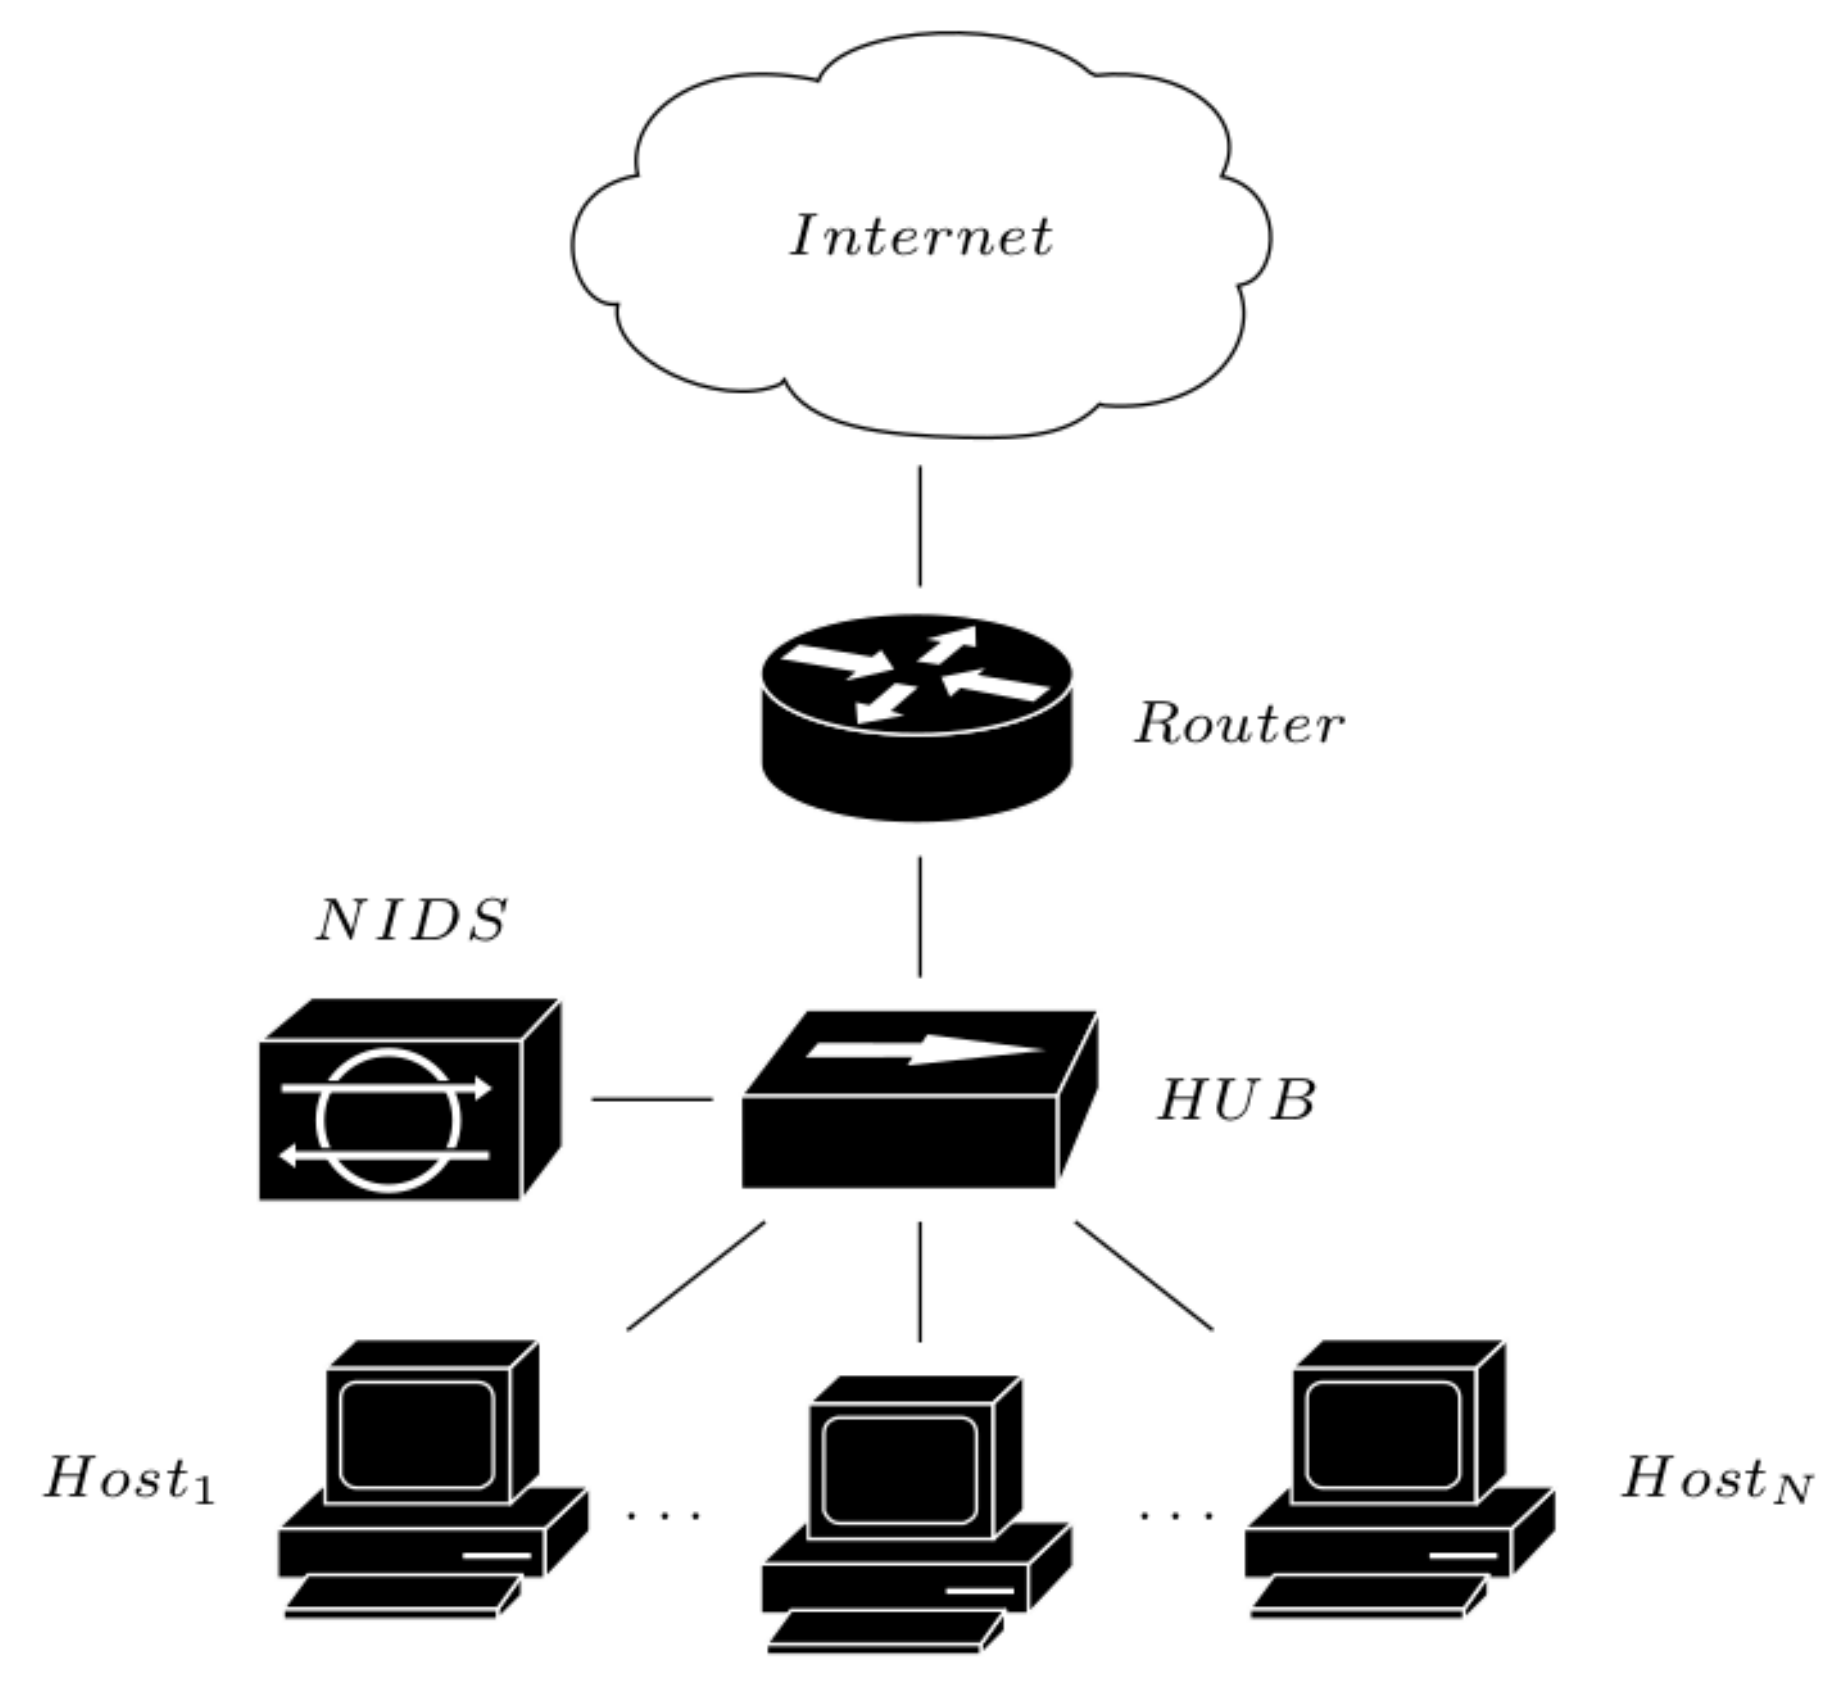
Network-based [
64]: A Network-based Intrusion Detection System (NIDS) operates by capturing and analyzing the whole network activities (
Figure 3). Each activity is then compared to the signatures stored in a database and related to known events (normal and intrusion), and only the unknown signatures will be analyzed. This hybrid approach (signature-based and analysis-based) allows us to deal both with known and unknown intrusions (e.g., zero-days attacks). The main disadvantage in this approach is instead related to its inability to operate proactively, together with that to operate with encrypted data.
Figure 3.
IDS network-based modality.
Figure 3.
IDS network-based modality.
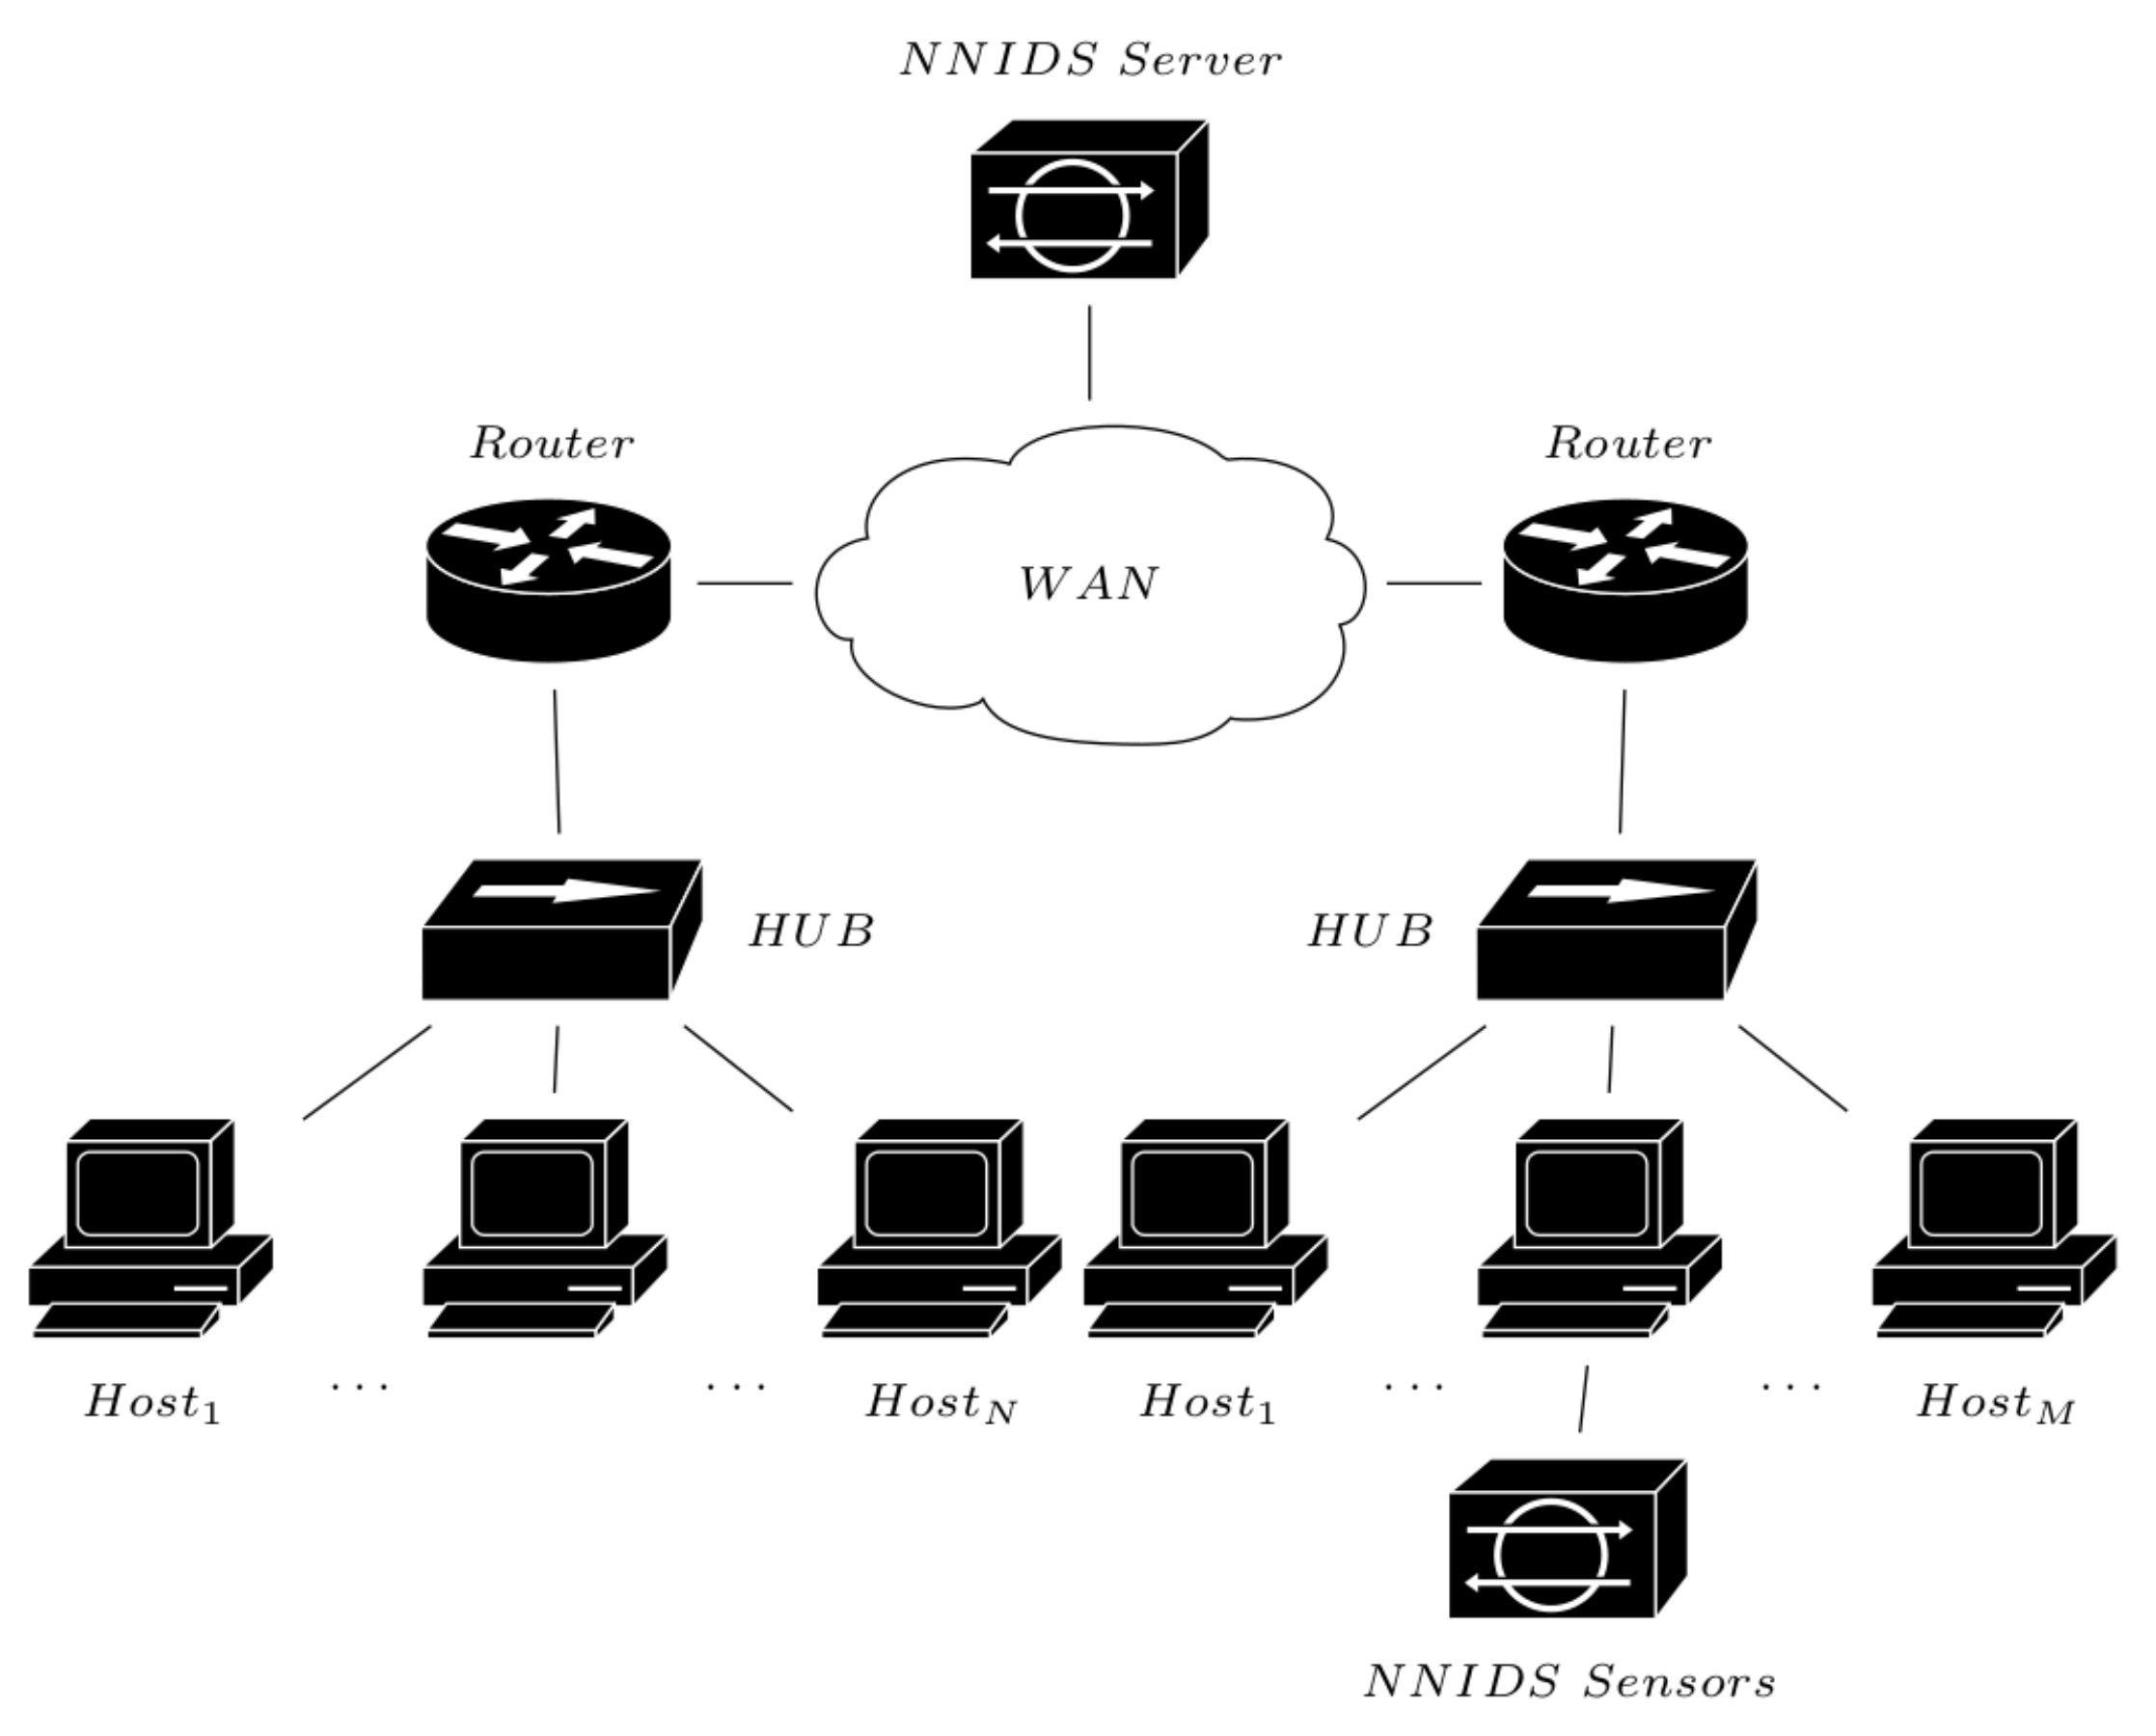
Network-node-based [
65]: A Network-Node-based Intrusion Detection System (NNIDS) operates by positioning the system in a strategic location of the network (
Figure 4), and its operative way is a combination of the HIDS and NIDS strategies; thus, it shares with them the same advantages and disadvantages.
Figure 4.
IDS network-node-based modality.
Figure 4.
IDS network-node-based modality.
Distributed-based [
66]: The Distributed-based intrusion detection systems represent hybrid solutions aimed to combine the aforementioned strategies in order to improve the performance in a specific network context.
3.1.3. Network Attacks
To place the appropriate countermeasures against the potential network attacks, the researchers need detailed knowledge of techniques, strategies, and tools used by the attackers. Such information is easily available, as it is usually in the public domain. On the basis of their behavior and potential impact on the attacked resources,
Table 2 groups the most common ones into several classes.
The aforementioned classes of attacks are exploited in order to conduct dangerous well-known attacks such as SYN flooding, IP spoofing, session hijacking, man-in-the-middle, DHCP starvation, and many more [
77]. It should be underlined that their intrinsic dangerousness arises from the fact that many of these attacks do not require any in-depth expertise, since they can be conducted using tools easily available on the Internet [
78]. By exploiting such tools, people can perform a number of dangerous activities without particular efforts, from those related to the information discovering to those aimed to the exploitation/block of network resources. In addition, the possibility to operate these attacks both by using wired and wireless networks [
79], makes it even more difficult to identify those responsible for the attacks.
It can also be observed that many common instruments/tools, which are not precisely classified as attacks, are able to perform crucial operations in an attack context. Some significant examples are simple commands such as ping, fping, arping, and traceroute and more sophisticated tools such as EtherApe [
80], able to perform network traffic sniffing [
69]. An interesting investigation about the deep-learning techniques used in order to perform automate security tasks such as the malware analysis was presented by Singla and Bertino [
81].
3.2. Performance Evaluation
The performance evaluation in the context of the IDSs must take into account several aspects, mainly for the same reason that characterizes other domains, the presence on a high degree of data imbalance [
82,
83]. Such a problem is related to the fact that most of the involved network events belong to one majority class (normal activities). Although the literature reports numerous performance evaluation metrics in this domain [
84], the common choice of most researchers is to combine more than one of these metrics [
85], in order to obtain an evaluation as correct/reliable as possible. Considering that the IDS task is usually treated as a classification problem, the evaluation metrics taken into account have to assess the performance in terms of a binary classification in two classes, normal and intrusion [
86]. Some categories of metrics largely used in the IDS context are introduced in the following:
Confusion-matrix based: The IDS evaluation is performed by using the confusion matrix values. This is a 2 × 2 matrix that contains True Negatives (TN), False Negatives (FN), True Positives (TP), and False Positive (FP), as shown in
Table 3, where such a matrix is contextualized in the intrusion detection context. Some of the metrics (largely used in the intrusion detection domain) derived from that matrix are the Matthews correlation coefficient, F-score, sensitivity, and specificity [
84].
ROC-Curve based: The IDS evaluation is performed on the basis of the Receiver Operating Characteristic (ROC) curve, where one of the most used derived metrics is the Area Under the Receiver Operating Characteristic (AUC), which is able to assess the capability of an IDS to discriminate the normal events form the intrusion ones, regardless the level of data imbalance, correctly [
87].
Additional Metrics: Other metrics are instead adopted when the problem is expressed in terms of regression instead of classification, such as the Root Mean Square Error (RMSE) and the Mean Absolute Error (MAE) [
88]. Different metrics are also aimed to evaluate secondary aspect of an IDS, taking into account, for instance, its performance in terms of computational load, memory usage, etc. [
89,
90].
5. Proposed Strategy
The Local Feature Engineering (LFE) strategy proposed in this work introduces a series of new features in the set of features
F that characterizes each network event. The addition of new features is then followed by a discretization process [
91] applied on them, which is aimed to reduce the number of potential event patterns, since the result is the aggregation of the similar ones.
Since the computational complexity related to the definition of a classification model in the intrusion detection domain [
92] is proportional both to its feature space (in terms of number of features) and its data (in terms of number of events), such a pattern reduction has a positive effect to the computational load.
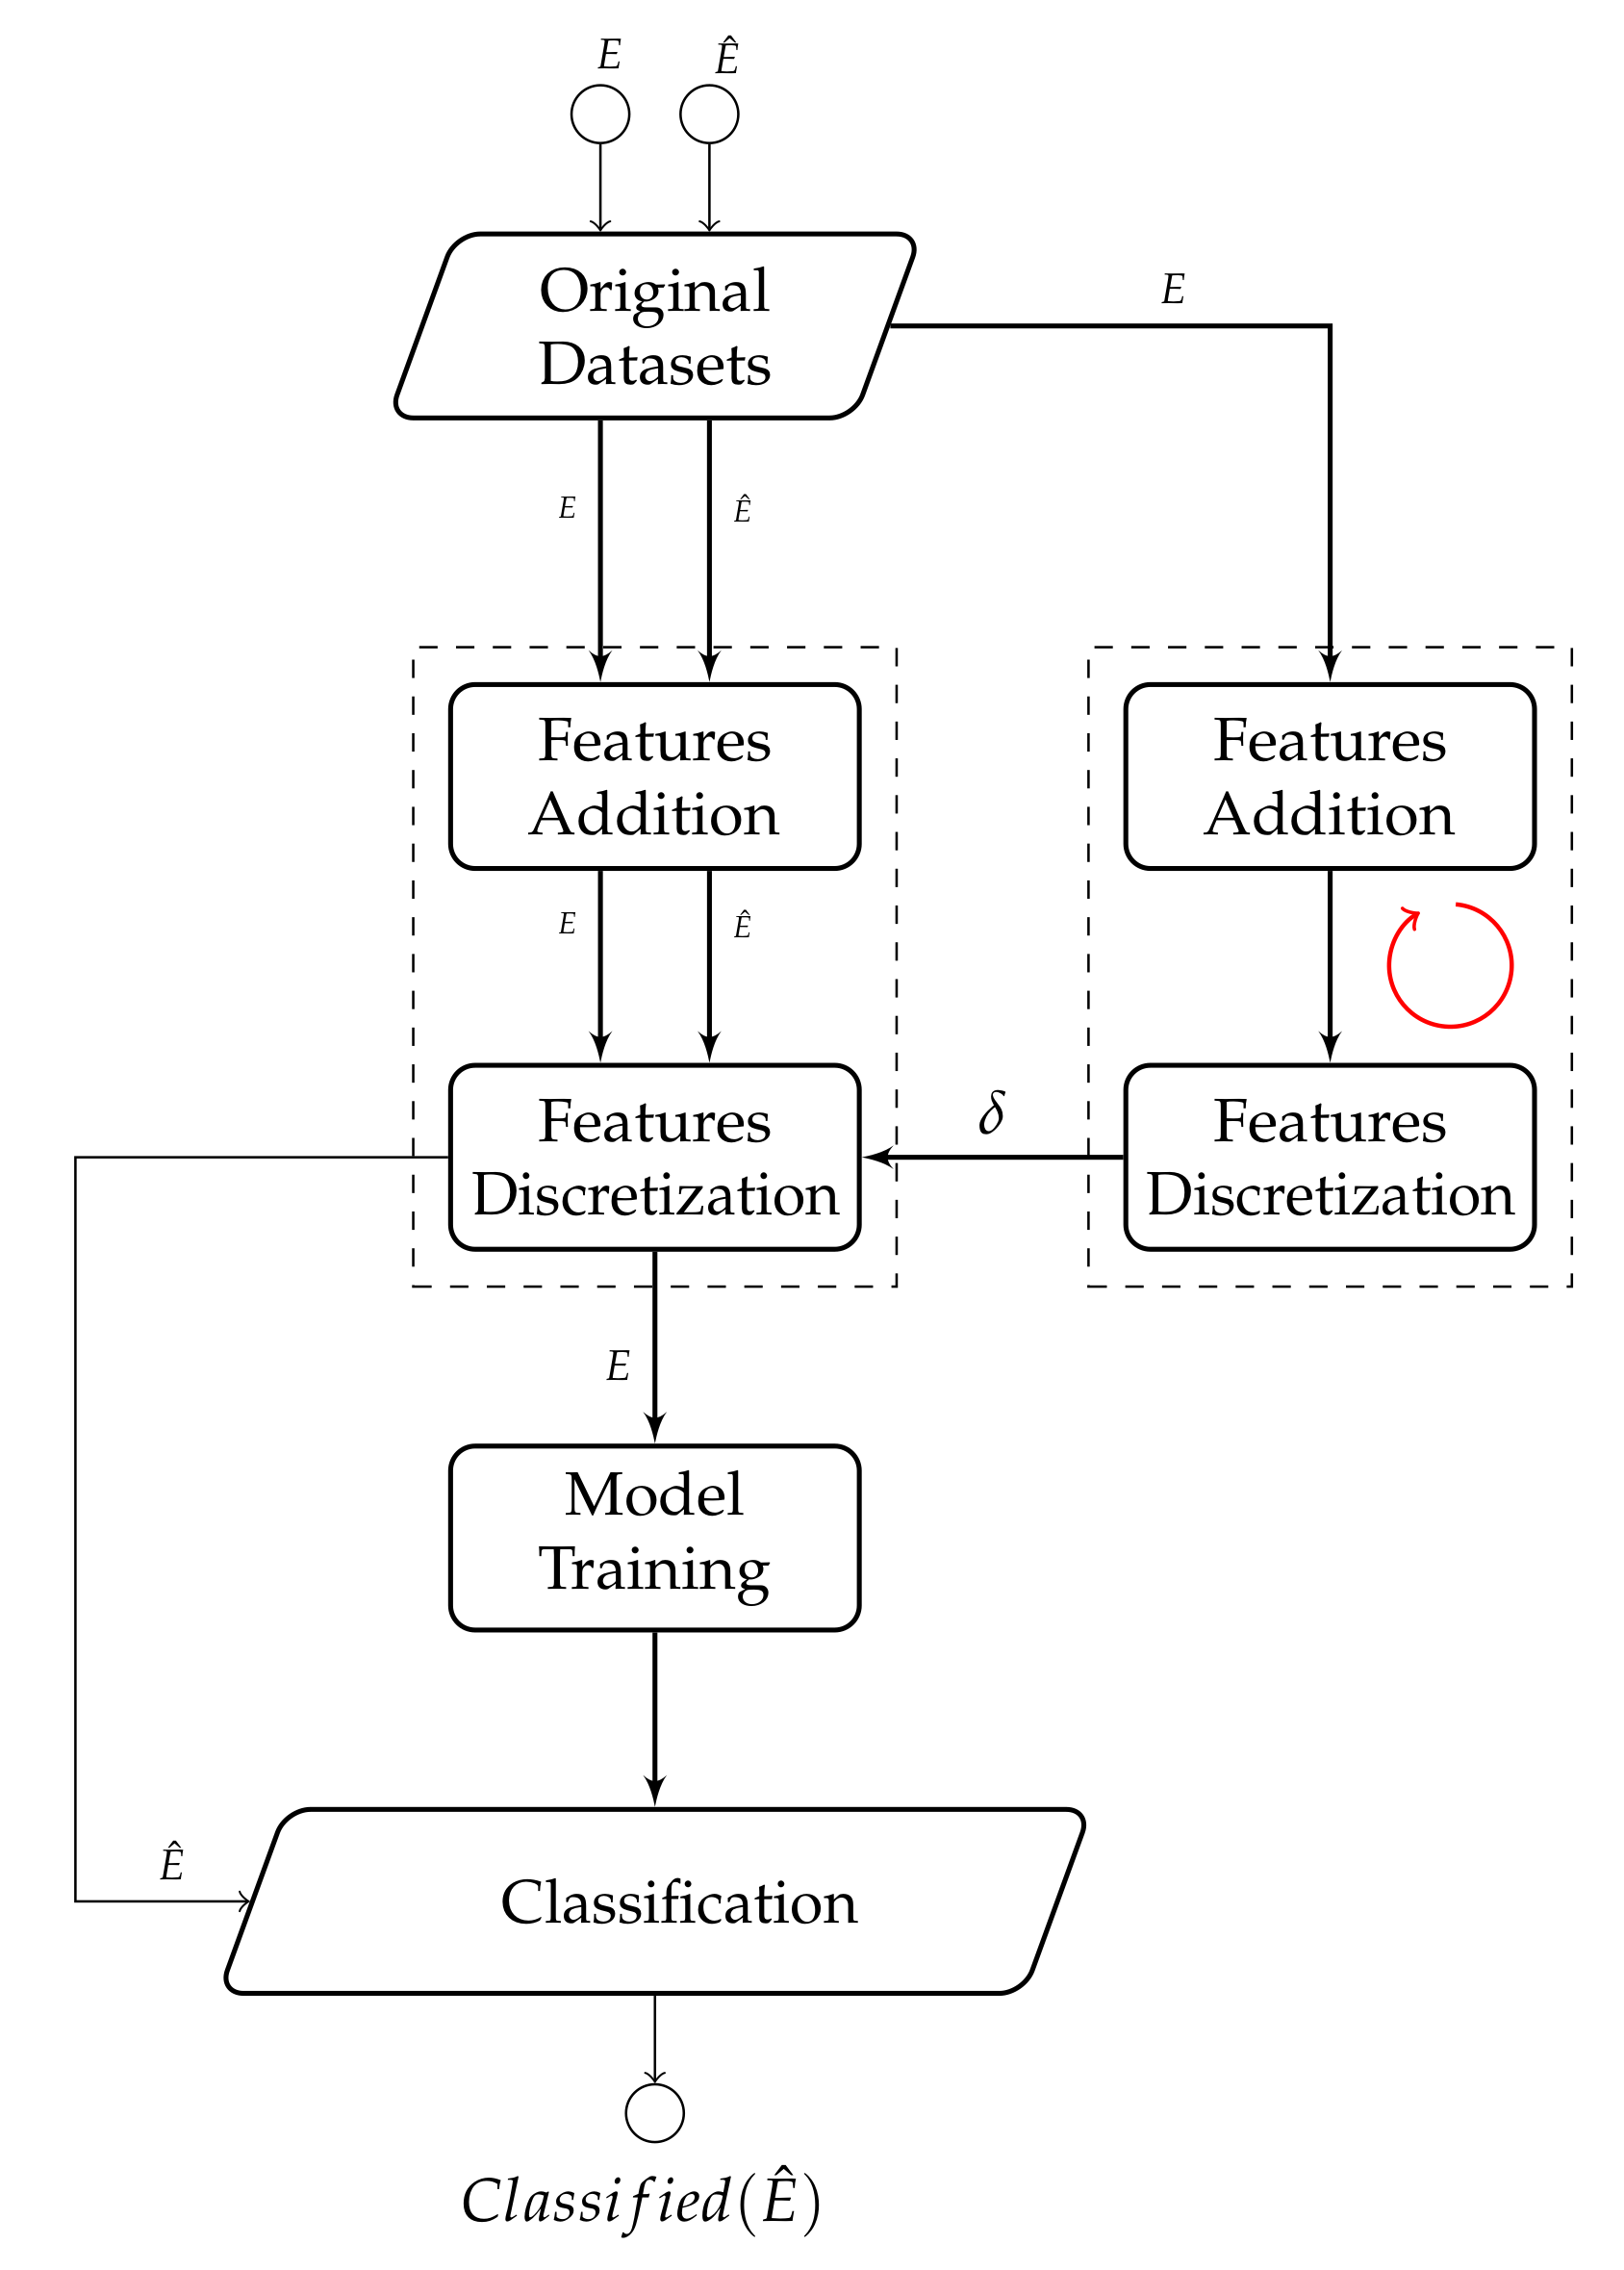
The high-level architecture of the proposed LFE strategy is shown in
Figure 5. It indicates how such a strategy is based on two different data paths: the first one is related to the preprocessing of set
E (classified events) and set
(unclassified events) through the LFE strategy (i.e., feature addition and values discretization), whereas the second one is aimed to detect the optimal
value to use for the previously mentioned discretization process. This process is denoted as ⥁, and it is performed by using only
E. As last step, the evaluation model is trained by using set
E, previously preprocessed according to the
value we defined. The unevaluated events in set
, whose features have also been preprocessed by using the same
value, are then classified on the basis of the defined evaluation model. All the implementation details are reported in
Section 5.1 and
Section 5.2.
5.1. Feature Engineering
The addition of new features that characterizes the proposed LFE strategy falls into the literature background as a
feature engineering process. Feature engineering is defined as a process aimed to improve the performance of a predictive model by exploiting the transformation of the original feature space [
36]. An example can be found in [
93], where the authors proposed a technique for automating feature engineering in classification task.
The process adopted in our approach is very close to this operative way, but, instead of transforming raw data into features, with the goal to better represent the data in the definition of a predictive model, it exploits the original features to defines the additional ones. The idea behind this choice is that there are normal and intrusion patterns that are very similar, and the addition of discriminant elements (i.e., the new features) is able to better differentiate them, allowing the prediction model to perform more reliable classifications. The new features are calculated on the basis of the existing ones and their aim is a better characterization of the event in the two considered classes (i.e., normal and intrusion).
The new features are calculated on the basis of some metrics (that are described below), with the result formalized in Equation (
2), where
denotes the set of original event features,
denotes the set of the new ones, and the new feature vector
is given by the concatenation of these two sets.
This process is applied on each instance
e and
, which are characterized by the features in set
F, respectively, related to the set of the evaluated instances in set
E and the unevaluated ones in set
. In more detail, denoting as
the new features to add to set
F, they are defined using the following calculation criteria:
=
Minimum,
=
Maximum,
=
Average,
=
Standard Deviation, as formalized in Equation (
3).
5.2. Feature Discretization
The feature discretization process is instead a process that the literature describes as the conversion of the feature values into a categorical one [
94], for instance in order to allow us the use of classification algorithms unable to operate with continuous feature values [
95], as well as to reach a better data understandability. The loss of information, which represents a disadvantage of the discretization process, is balanced by the proposed strategy through the addition of new features previously described.
As previously emphasized in
Section 2, the feature discretization process should be considered as a synergistic component of the proposed LFE strategy, since it reduces the potential event patterns, while the introduction of new features (the other LFE component) counteracts the loss of information, which represents a side effect of a discretization process.
In more detail, this process divides the value of each feature into a discrete number of non-overlapped intervals, mapping the original numerical value (continuous or discrete) into one of the intervals of a defined range. Such a process is shown in
Figure 6, which exemplifies it by considering a conversion of feature values from its original range
into a discrete range
. The resulted values
then represent the discretization of the source values
.
The feature engineering described above extends the original feature space F into the new feature space (by adding the four calculated values in set ). Then, this feature space (i.e., ) is further processed by discretizing all the feature values (continuous or discrete) according to a defined range , experimentally defined.
Denoting as
the function of discretization, this process is formalized in Equation (
4), where for simplicity we denote (from now on) the resulted set again as
F, according to the formal notation provided in
Section 4. It should be noted that this process is performed for each event
and for each event
, respectively, the training set and the set to evaluate.
5.3. Data Model
The feature engineering and discretization processes generate a new data model, which is used during both training and classification operations. Its formalization is shown in Equation (
5), where for simplification reasons we refer only to set
E. (i.e., the set that contains the evaluated events used for the evaluation model training). This means that the same formalization is also valid for set
(i.e., the set that contains the unevaluated events to classify).
5.4. Event Classification
Algorithm 1 here formalized has been designed to exploit the new data model, defined on the basis of the proposed LFE strategy.
In more detail, the algorithmic formalization of Steps 2 and 3 of Algorithm 1, which refers to the application of the LFE strategy, is shown in Algorithm 2.
Algorithm 1 takes as input a classifier
, the set of classified events
E, the set of events to classify
, and a value
that defines the range of discretization, which is defined experimentally. It returns the classification of all events in set
. The data transformation is performed at Steps 2 and 3, as detailed in Algorithm 2, where the addition of the four new features (Step 4), calculated as described in
Section 5.1, is followed by the discretization of the feature values (Step 5), and the new data model is returned at Step 8.
| Algorithm 1 LFE events classification |
 |
| Algorithm 2 LFE data transformation |
 |
The classifier model training is then performed at Step 4 of Algorithm 1 by using the new data model, whereas the classification of each event in set is performed at Steps 5–8, and the results returned at Step 9 of the same algorithm.
Computational Complexity
Here, we evaluate the computational complexity related to the proposed LFE strategy, since this provides important information in the context of real-world applications. Such an evaluation was made by analyzing the theoretical complexity of the events classification (Algorithm 1) and the events features transformation (Algorithm 2), as previously formalized. The complexity is expressed according to the
Big O notation [
96], which is aimed to define the upper bound of an algorithm, since it bounds a function only from above.
As a premise, considering that our experiments involve different classification algorithms, and that the proposed strategy has been designed to operate regardless of the adopted algorithm, we do not take into account in this evaluation the classification algorithm complexity [
97].
Generalizing as
n the total number of events to process,
Table 5 reports the significant steps of Algorithm 1, along with the involved single components complexity, and the final
Big O complexity that derives from them.
By carrying out a more detailed analysis of the operations involved in Algorithm 1 components, according to the complexity analysis presented in
Table 5, we can observe the following.
Steps 2 and 3 of Algorithm 1 are related to the operation performed by Algorithm 2, where, in the main loop, the original feature F are extracted from the processed event in a constant time , as well as the addition of the four new features , and the storing of the extended feature space. The dominant complexity related to the main loop represents the the global complexity of all the involved operations.
Steps 5–8 of Algorithm 1 are related to the loop where the event classification is performed by exploiting the evaluation model trained in Step 4. The dominant complexity of this loop is , since the storing of the classifications take a constant time .
The complexity related to the adopted algorithm of classification, training and classification time, is not taken into consideration for the reasons discussed above. This trivially means that the final complexity of the proposed LFE strategy is defined by considering the upper bound complexity that characterizes the proposed strategy and the complexity of the adopted algorithm.
In any case, it should be observed that the complexity can be further reduced by parallelizing the process on several machines, for instance using large-scale distributed computing models, such as
MapReduce [
98,
99,
100].
6. Strategy Validation
The environment used to validate the proposed LFE strategy was based on the following hardware and software: a single machine quad-core Intel i7-4510U, 2.00 GHz CPUs, 12 GB of RAM; a Linux-based operating system (kernel 3.16.0-amd64); and Python programming language with the
Scikit-learn (
http://scikit-learn.org) library.
Note that, to grant the experiments reproducibility, the seed of the pseudo-random number generator in Scikit-learn was fixed to 1.
6.1. Dataset
The main real-world dataset we used in the validation process is the NSL-KDD dataset (
https://github.com/defcom17/NSL_KDD). It essentially represents an improved version of the KDD-CUP99 dataset widely used in the past, which suffered from some issues [
101]. In more detail, the main improvements of the NSL-KDD dataset, with regard to the original KDD version, are the following:
The redundant records in the training set have been removed to avoid that a classifier can be biased by the frequency of them.
The duplicate records in the test sets have been removed to avoid that a classifier performance can be biased when the better detection rate of it is related to these records.
The new number of records in the training and test sets allows a classifier to perform the validation process without the need to select small portions of them, randomly.
The NSL-KDD dataset was selected since it is considered as a benchmark in the intrusion detection research area, allowing the researchers to compare their solutions performance with an ever-increasing number of works in this field, unlike other recent datasets. Moreover, we chose this dataset for the network scenario it provides, as we aimed to assess our performance in the context of canonical networks. The NSL-KDD dataset involves events related to the UDP, TCP, and ICMP protocols, allowing to validate approaches and strategies in a real-world network scenario, in terms of both number of events and involved protocols and attacks.
We adopted this dataset to perform an independent experimental evaluation of the proposed strategy by intrusion typology, separately. On the other hand, in
Section 7.1, we take into account two additional datasets, with the aim to evaluate such a strategy in heterogeneous scenarios (i.e., which include all types of attacks).
The numerical relevance of the NSL-KDD dataset in terms of normal and intrusion events (respectively,
and
) is reported in
Table 6. Note that the original dataset consists of two different files, i.e.
KDDTrain+ and
KDDTest+, respectively, related to the original training and test sets, as defined by the dataset authors. However, since some normal/intrusion unique events can be found in one file only, we discarded this original separation, and joined the two files as a unique full dataset for the rest of this section, thus only considering the global values IN
Table 6 (here, the original distinction between
KDDTrain+ and
KDDTest+ is reported for information purposes).
The distribution of the network events is provided in
Table 7, while their classification in the five classes (i.e., PEA, DSA, RSA, RAA, and NNA) is detailed in
Table 8. Finally,
Table 9 presents a numerical overview of the aforementioned classes of dataset events.
6.2. Metrics
We adopted three different metrics, in the validation process, to evaluate the performance of the proposed LFE strategy: (i) the
specificity [
102]; (ii) the Matthews Correlation Coefficient (MCC) [
103,
104]; and (iii) the Area Under the Receiver Operating Characteristic curve (AUC) [
105].
The first two are based on the results related to the confusion matrix described in
Section 3.2, whereas the last one is related to the Receiver Operating Characteristic (ROC) curve. The combination of these metrics provides us a reliable evaluation of the strategy effectiveness, regardless to data imbalance (i.e., the numerical difference between normal and intrusion events), according to the literature in this research area.
The formalization of the specificity metric, which is aimed to assess the performance in terms of the system capability to detect intrusions (i.e., the true negative rate), is shown in Equation (
6), according to the formal notation provided in
Section 4. Denoting as
the unclassified instances, TN reports the number of events classified as intrusion, correctly, and FP reports the number of intrusion events classified as normal, erroneously.
The formalization of the MCC metric, which respect to other confusion-matrix metrics is able to operate even with unbalanced data, is shown in Equation (
7). It provides a result in the
range, where the correctness of all the performed classification leads to
, whereas the incorrectness of all of them leads to
, and 0 indicates the typical performance reached by a random classifier.
The formalization of the AUC metric, which is able to evaluate the capability of a classifier to differentiate the normal from the intrusion events, regardless their numerical imbalance, is shown in Equation (
8). Given set
E, denoting as
all the possible score comparisons related to each event
e, the final result (in the
range) is given by the average of them, where 1 indicates the best classification performance.
6.3. Algorithms
To validate the performance of the proposed LFE strategy, its effectiveness was evaluated in the context of a series of largely used state-of-the-art classification algorithms, whose performance has been measured before and after the application of the proposed strategy in the datasets. They are Gradient Boosting (GB), Adaptive Boosting (AB), Random Forests (RF), Multilayer Perceptron (MP), and Decision Tree (DT). A brief description of how each algorithm works is shown below. Let us observe that, actually, a fine-tuning of the algorithms is not a crucial constraint, since the main objective of the proposed LFE strategy is the improvement of an algorithm performance, regardless of its optimal configuration. For these reasons, we selected default parameters for the considered algorithms, identical for each single run of the experiment, hence without the necessity of using a validation set. Such a default parameter configuration is reported, for each algorithm, in
Table 10.
Gradient Boosting: It is used to face regression and classification tasks. Its evaluation model is based on an ensemble of weak prediction models such as decision trees, which is exploited to produce the final predictions. Its way to operate is based on continuous exploitation of a weak learning method in order to obtain a sequence of hypotheses, which are reused on the difficult cases, with the aim to improve the classification performance. Some significant works in the intrusion detection area that exploit this algorithm can be found in [
14,
106].
Adaptive Boosting: Similar to gradient boosting, it works by combining multiple weak classifiers in order to obtain a strong one. Its way to operate relies on the consideration that the single classifiers may not reach to perform the classification, accurately, and thus they are grouped, and each of them learns from the other ones, progressively. Some significant works in the intrusion detection area that exploit this algorithm can be found in [
15,
107].
Random Forests: It is based on many decisions trees. Bagging and feature randomness when building each individual tree are used in order to define an uncorrelated forest of trees, which leads to best performance of classification, with respect to a single tree. Some significant works in the intrusion detection area that exploit this algorithm can be found in [
108,
109].
Multilayer Perceptron: It belongs to the class of feed-forward Artificial Neural Network (ANN), working using at least three layers (input, hidden, and output), It uses a supervised learning back-propagation technique, exploiting a non-linear activation function (except for the input nodes). Some significant works in the intrusion detection area that exploit this algorithm can be found in [
17,
110].
Decision Tree: It represents a supervised machine learning approach aimed to induct a decision tree by starting from the training data. Such a decision tree is a model that relates the information about an item to a target classification. Some significant works in the intrusion detection area that exploit this algorithm can be found in [
17,
111].
6.4. Modality
Following the LFE strategy high-level architecture presented in
Figure 5, we first transformed the classification of the events of the full dataset from categorical into numeric ones (i.e., by using 0 to classify the normal events and 1 to classify the intrusion ones).
Then, since the proposed strategy needs the experimental definition of the value to use in the context of the discretization process, we split the dataset into two subsets of same dimension, to avoid data dependency during the experiments:
The first one, called
in-sample subset, was used to perform a
k-fold cross-validation (with
), to find the optimal
value for each category (recall that we used default algorithm parameters; however, a fine-tuning of such parameters can be eventually done at this stage). The optimal values of
are shown in
Table 11.
The second one, called out-of-sample subset, was used to perform multiple runs of the pre-trained algorithms (with the previously chosen values), on unseen test data, to get the experimental results.
To find the optimal
for each algorithm–event category pair, we iterated
over the range
, with
empirically set to 300. In addition, note that, according to the problem formulation made in
Section 4, the intrusion detection task is performed as a binary classification problem, since each event can be classified only as normal or intrusion, as already anticipated in the formal notation provided in
Section 4. This follows what has been done by most of the works in the intrusion detection literature. However, the assessment of the performance related to each single class of events, instead of considering them as a whole, allows us to get information about the behavior of the LFE strategy in each attack scenario, separately.
7. NSL-KDD Results
The experimental results related to the process of comparison between the proposed strategy and the canonical use (baseline) of the state-of-the-art classification algorithms (i.e., without the LFE data preprocessing) in the context of the NSL-KDD dataset, are reported in
Table 12. In this first view of the results, the performance is expressed in terms of the average value between all the adopted three metrics of evaluation (i.e., specificity, MCC, and AUC), in a similar way to what has been done in other studies [
112], and the better average performance of the LFE strategy is denoted with +.
The statistical significance of the results was assessed through a
five by two-fold cross-validation paired t-test [
113]. Thus, we calculated the
t-values for each dataset-algorithm pair, by considering a two-tailed
t distribution with five degrees of freedom. We then considered as significant, with a
significance level, each strategy comparison (between our LFE approach and the baseline one) where
. We then computed and reported the resulting
p-values, as shown in
Table 12.
These results led us to reject the null hypothesis for almost every considered pair, with the exception of seven cases out of 35, four out of 25 in the NSL-KDD dataset (
Table 12) and three out of 10 in the CIC and UNS datasets, which are used and described in
Section 7.1, as shown in
Table 13, where the difference between us and the baseline is not statistically relevant.
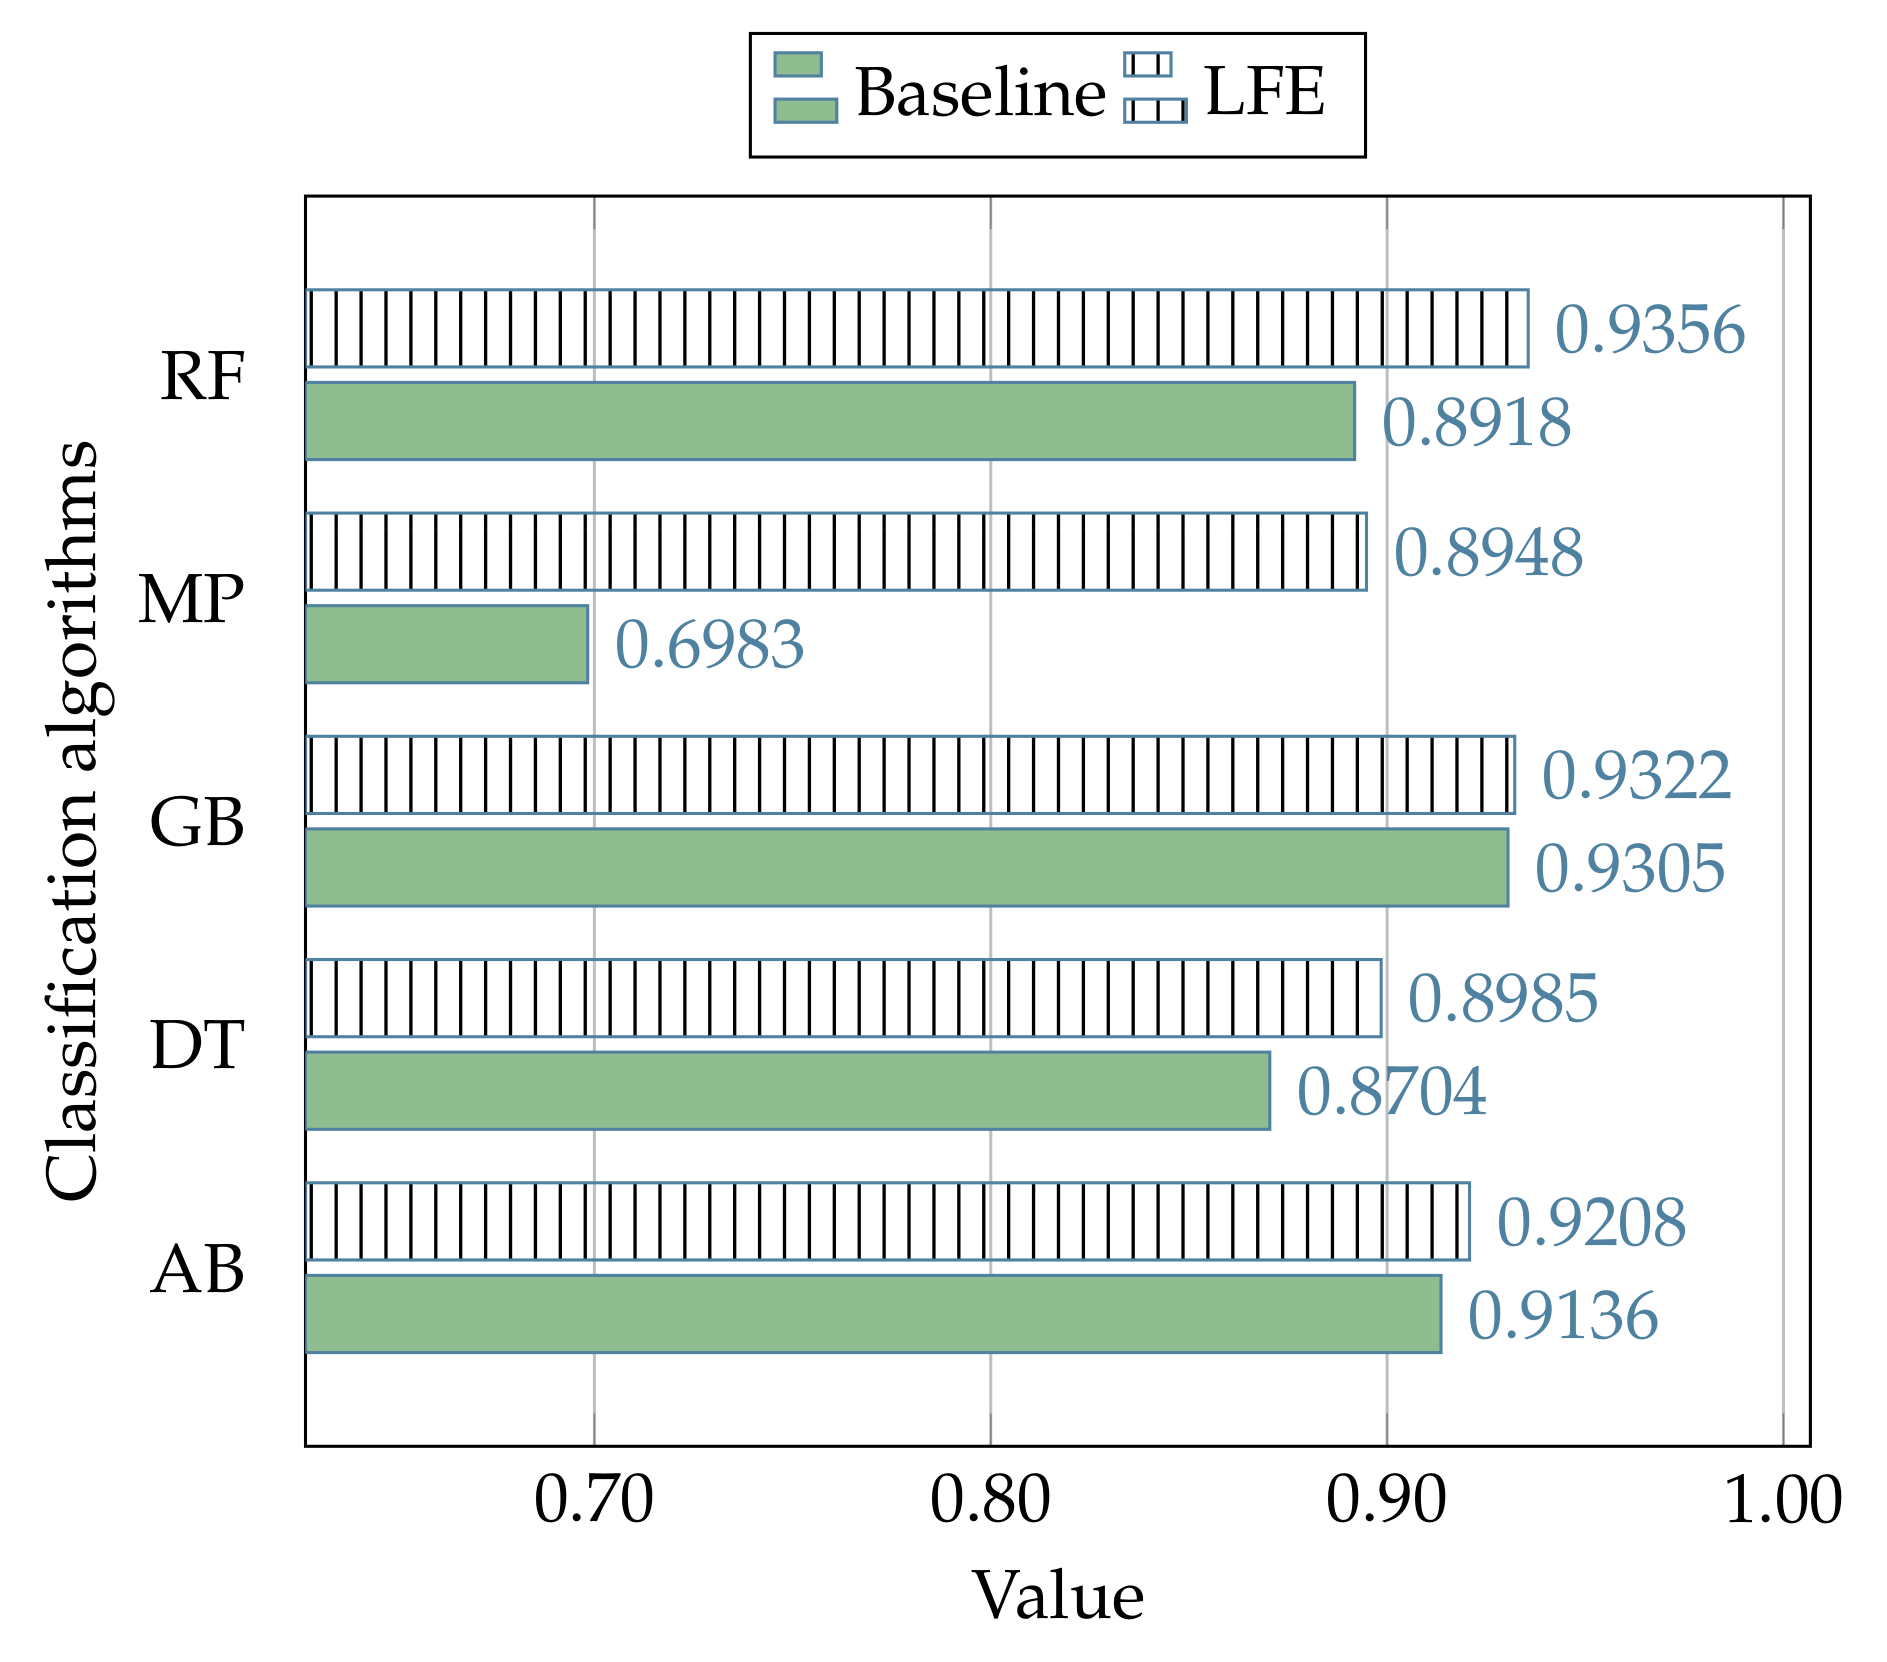
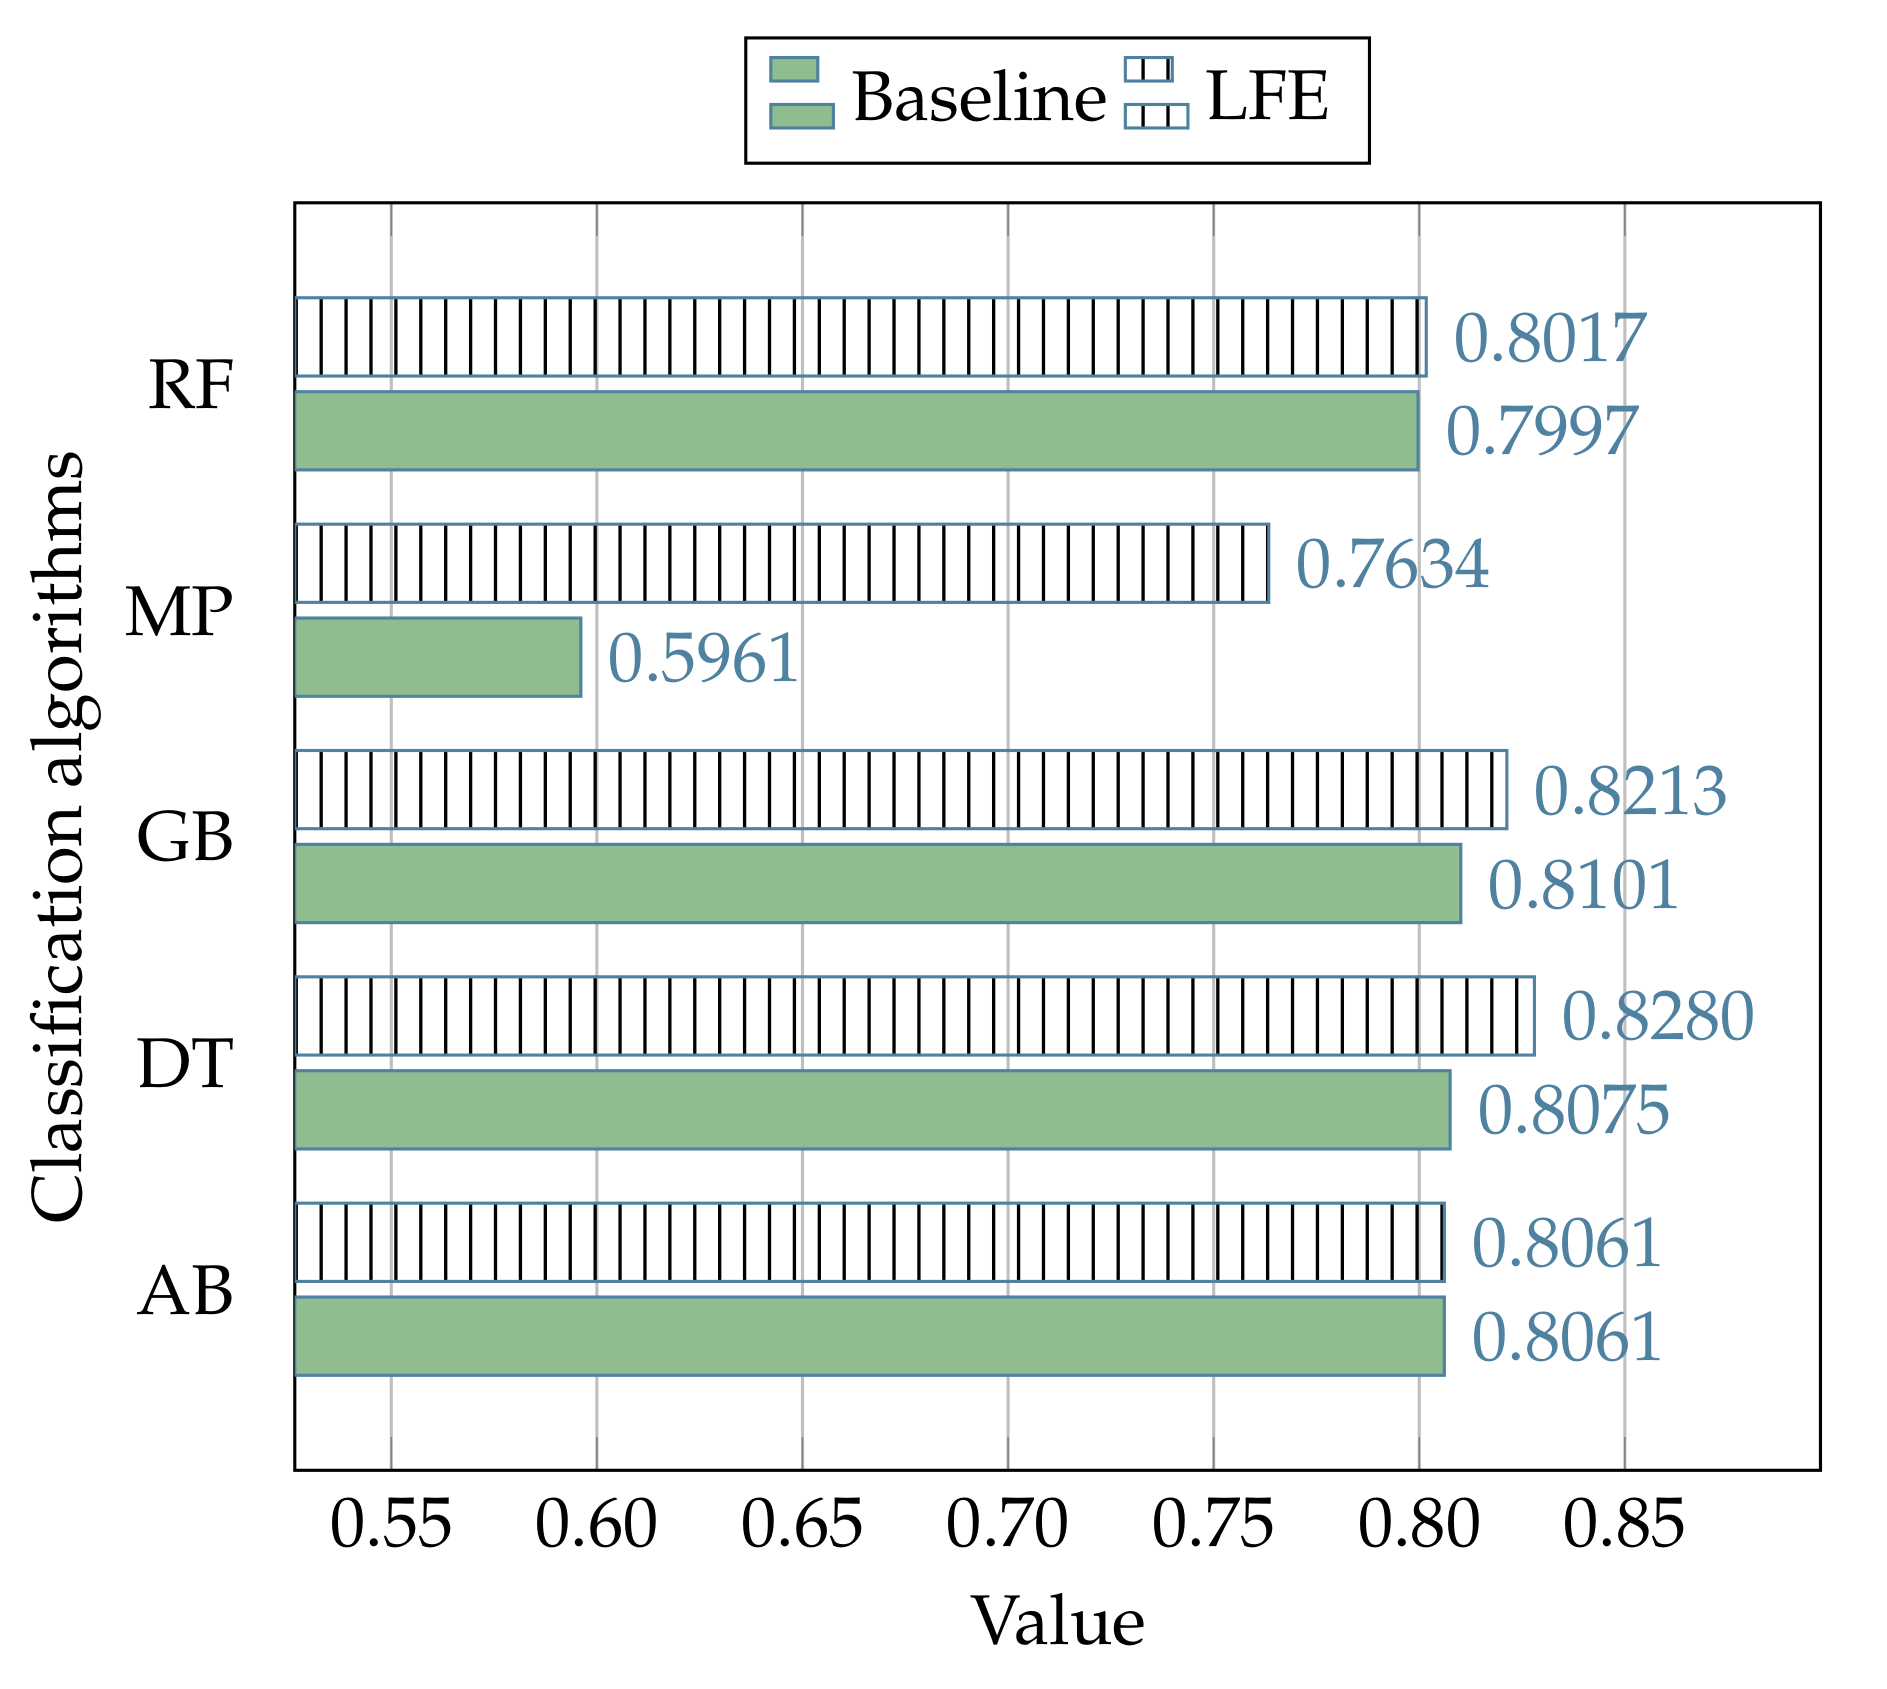
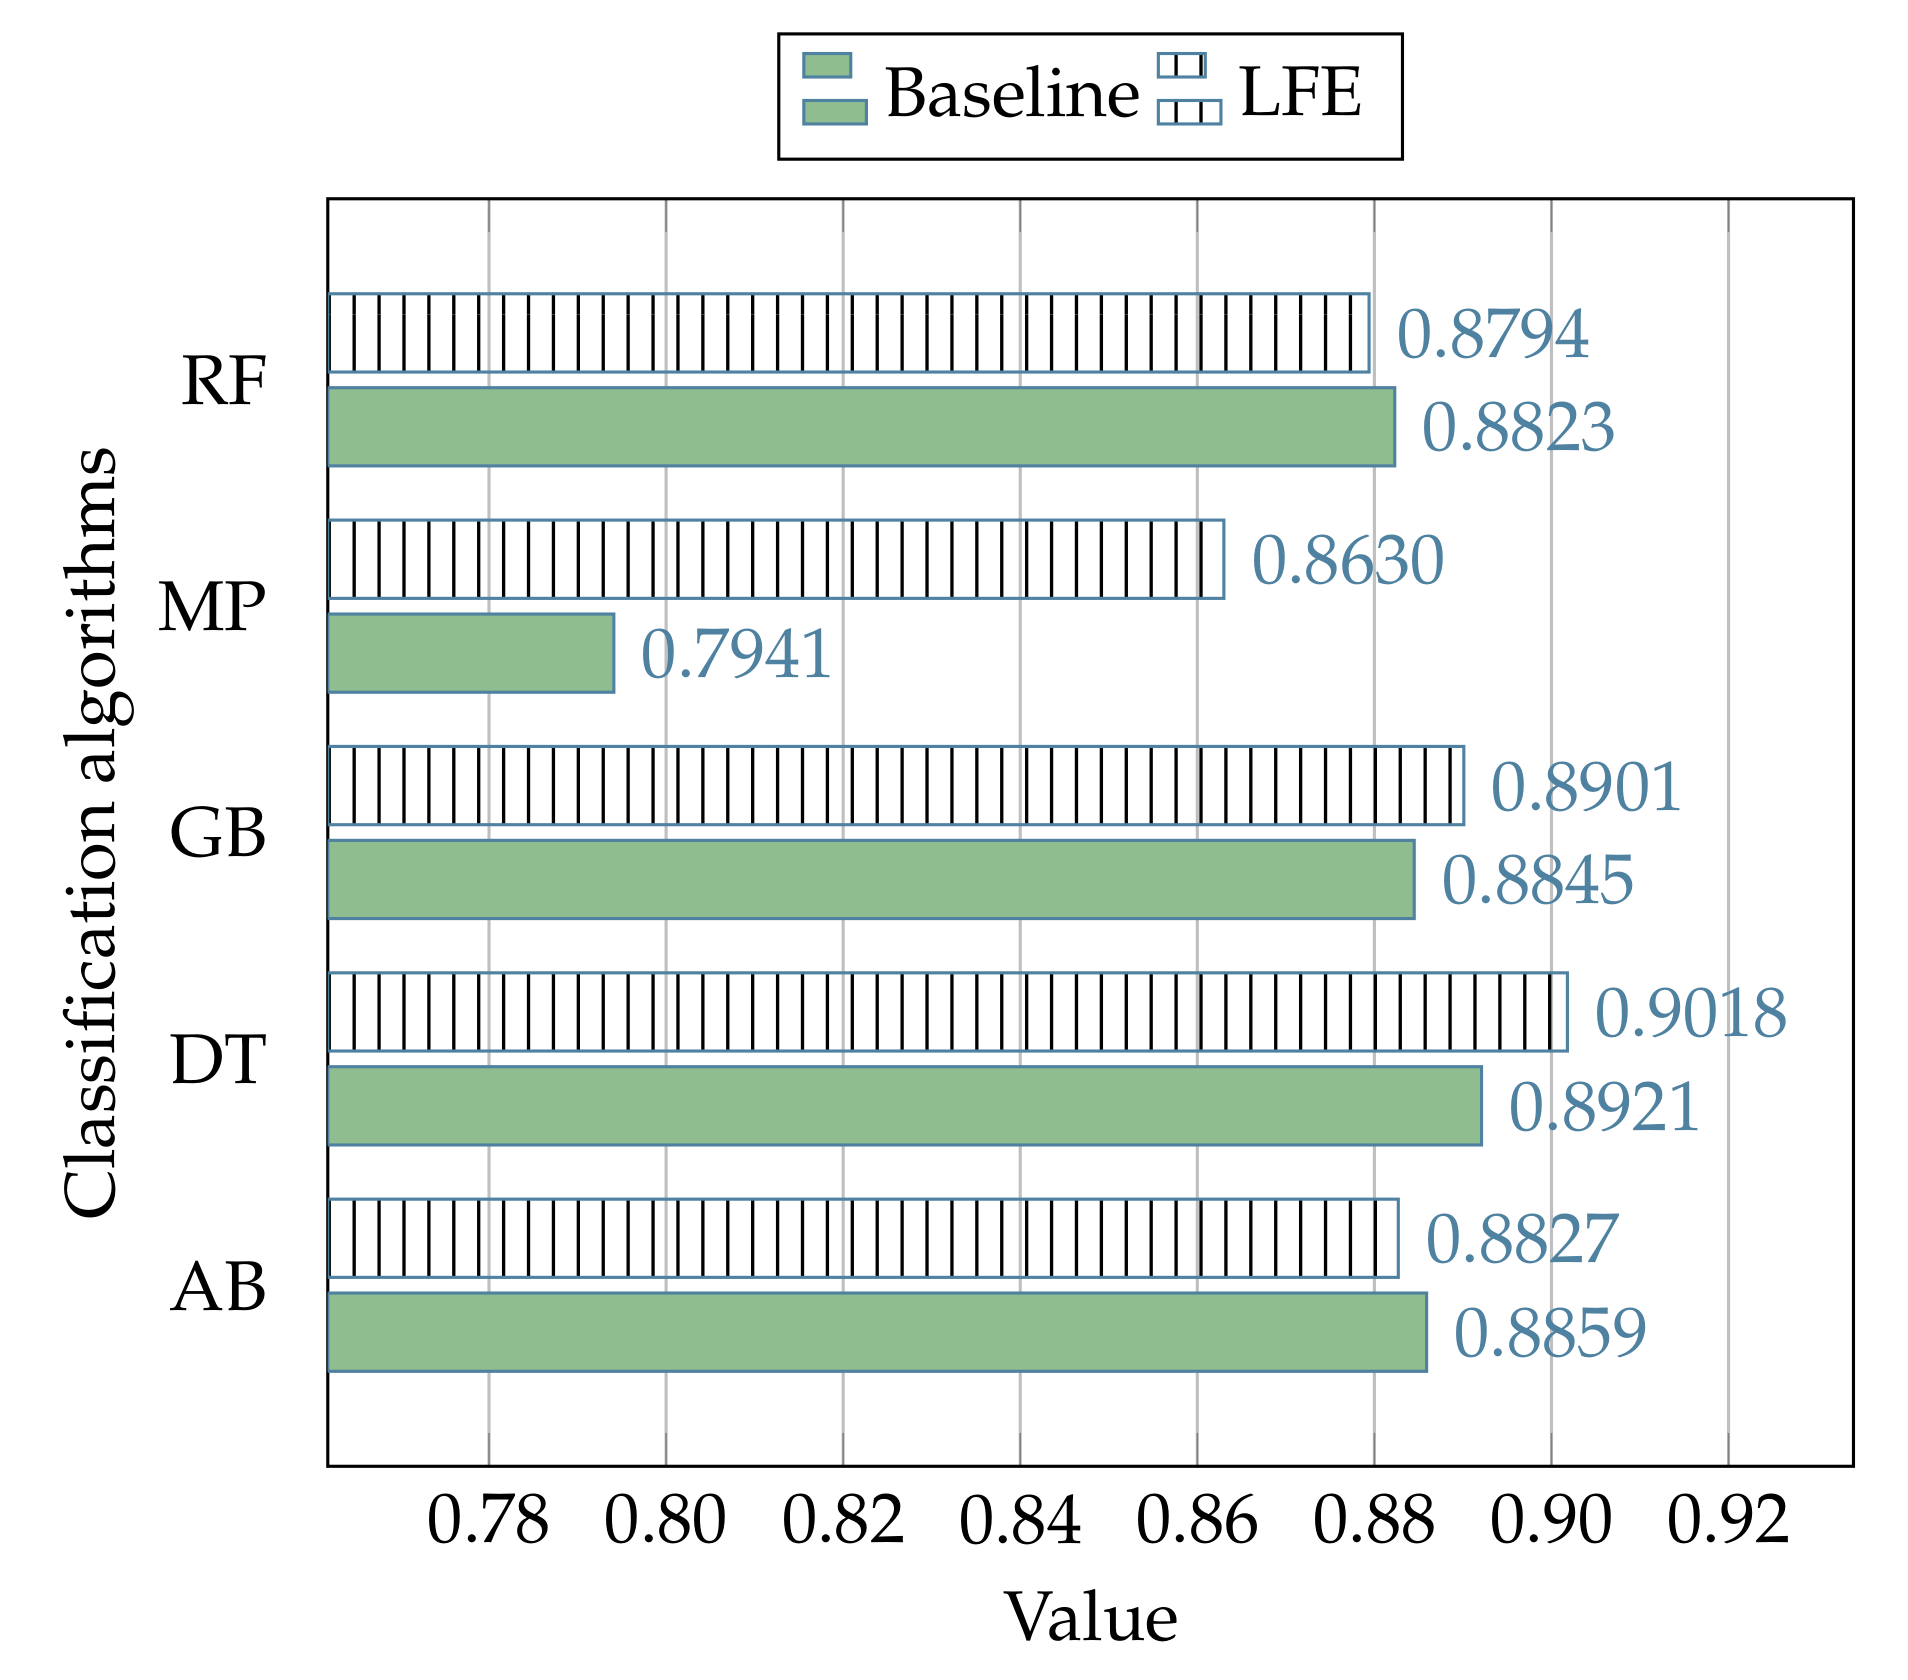
Furthermore, the table also reports the mean performance related to each of the evaluation metrics, measured in the out-of-sample subset with regard to each classification algorithm, whereas the results related to each metric are reported in
Figure 7,
Figure 8 and
Figure 9.
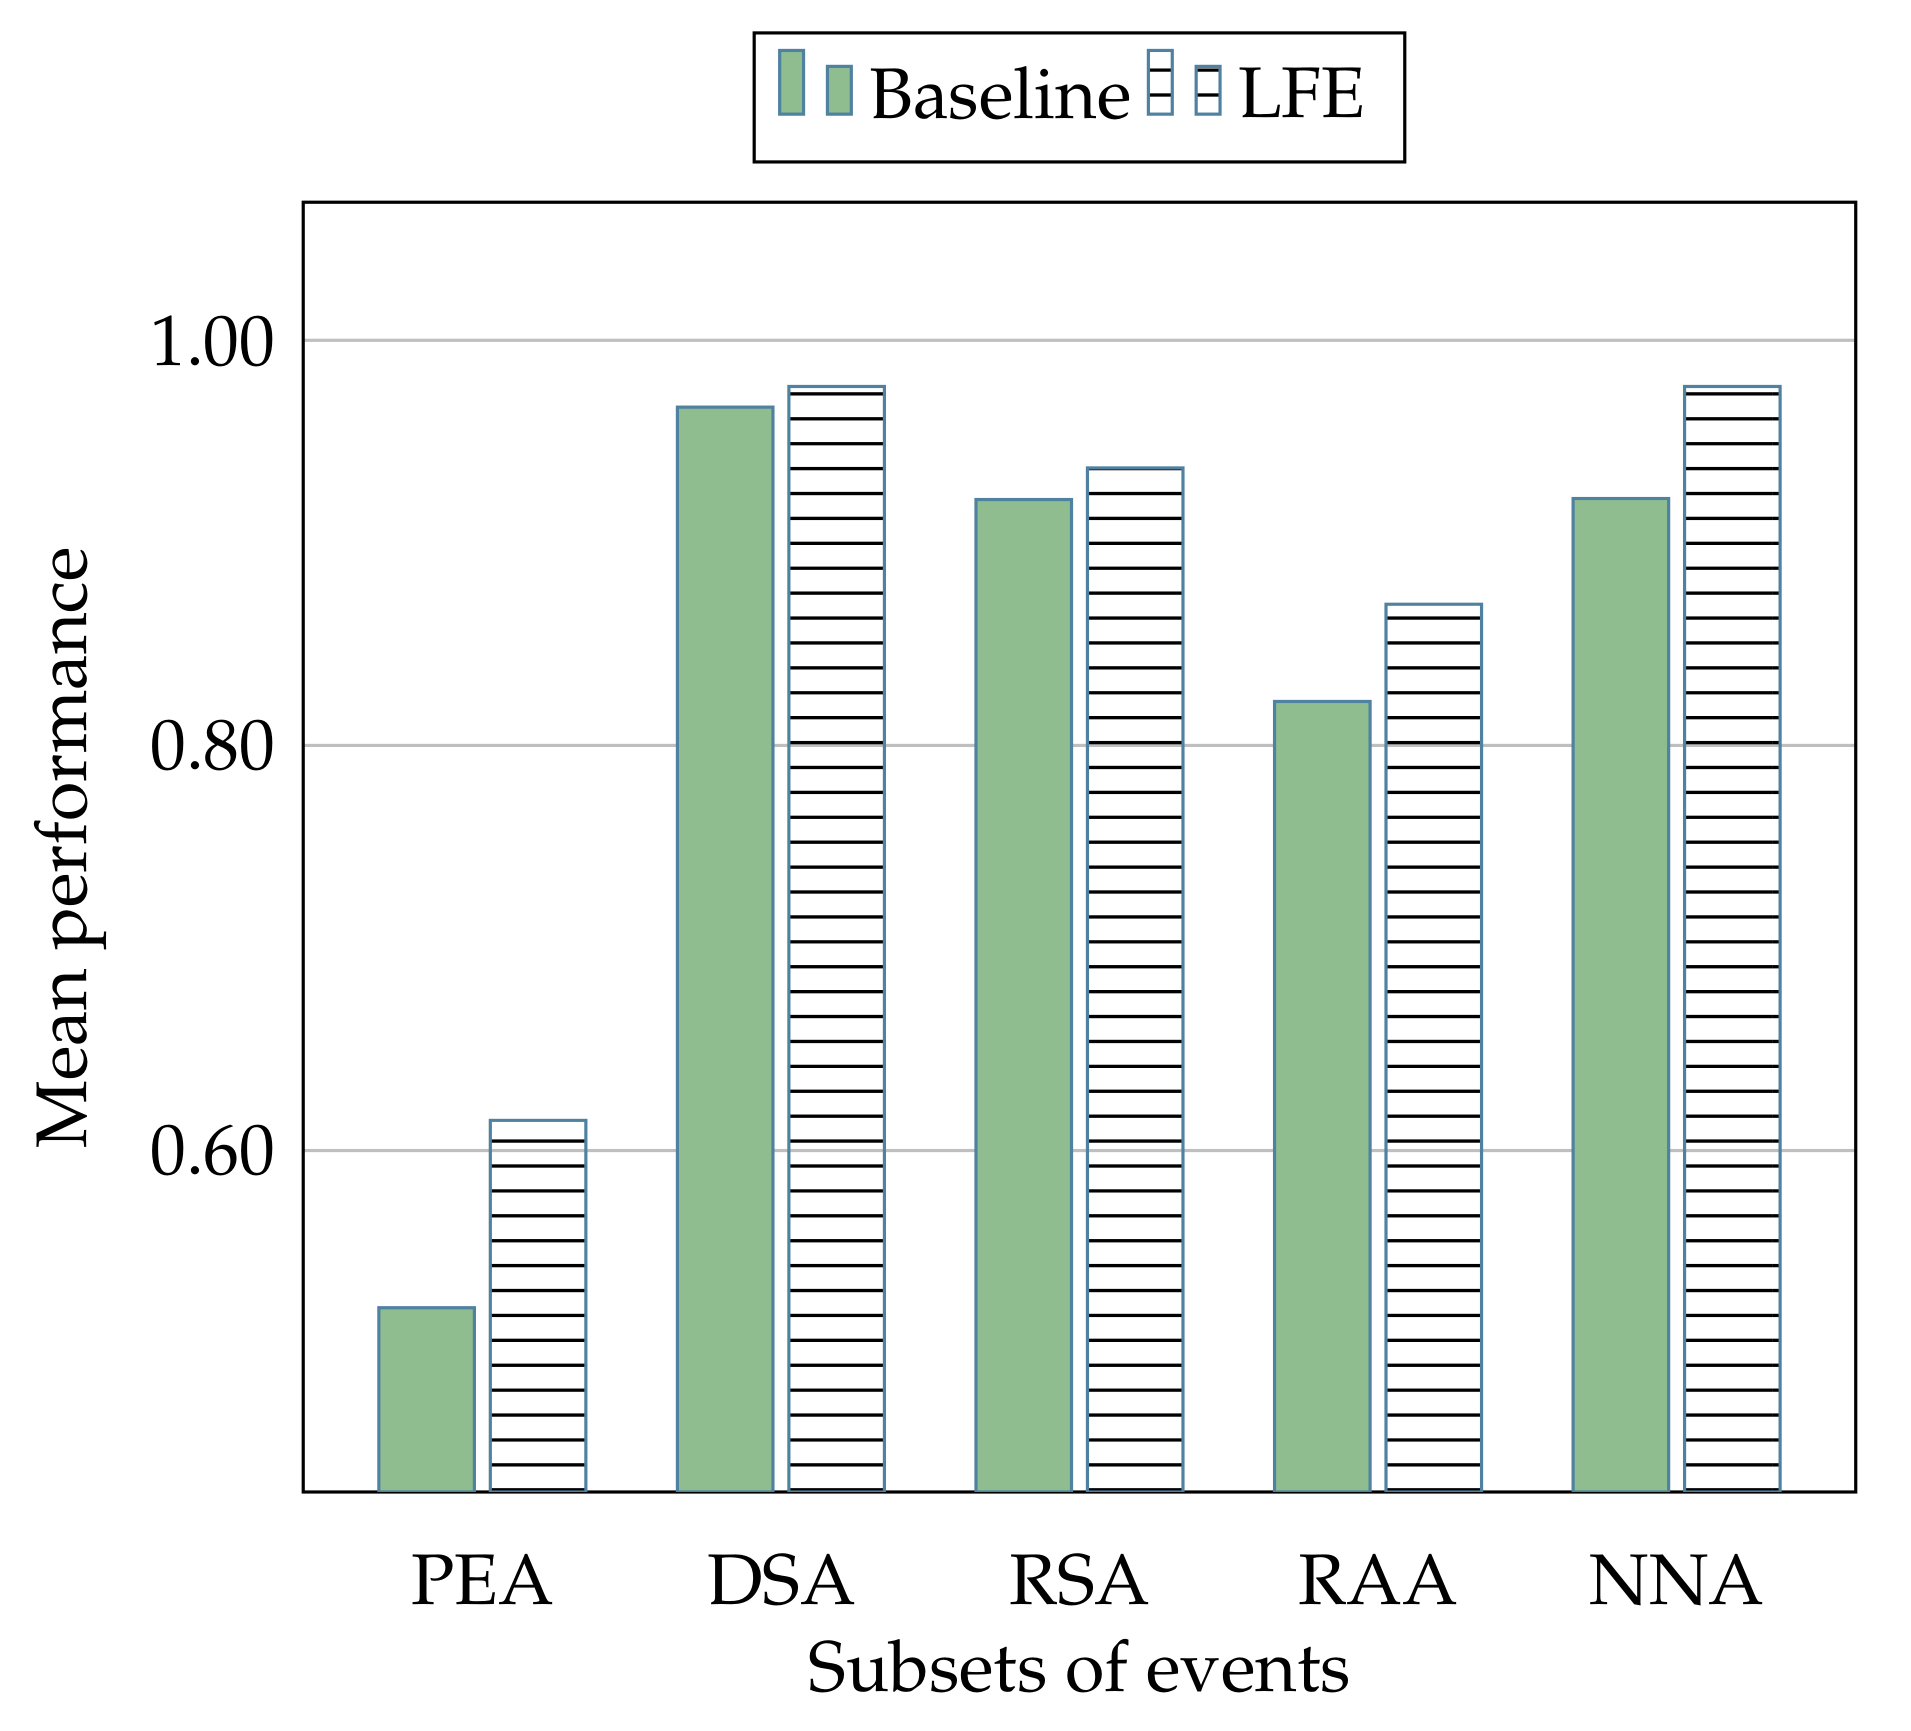
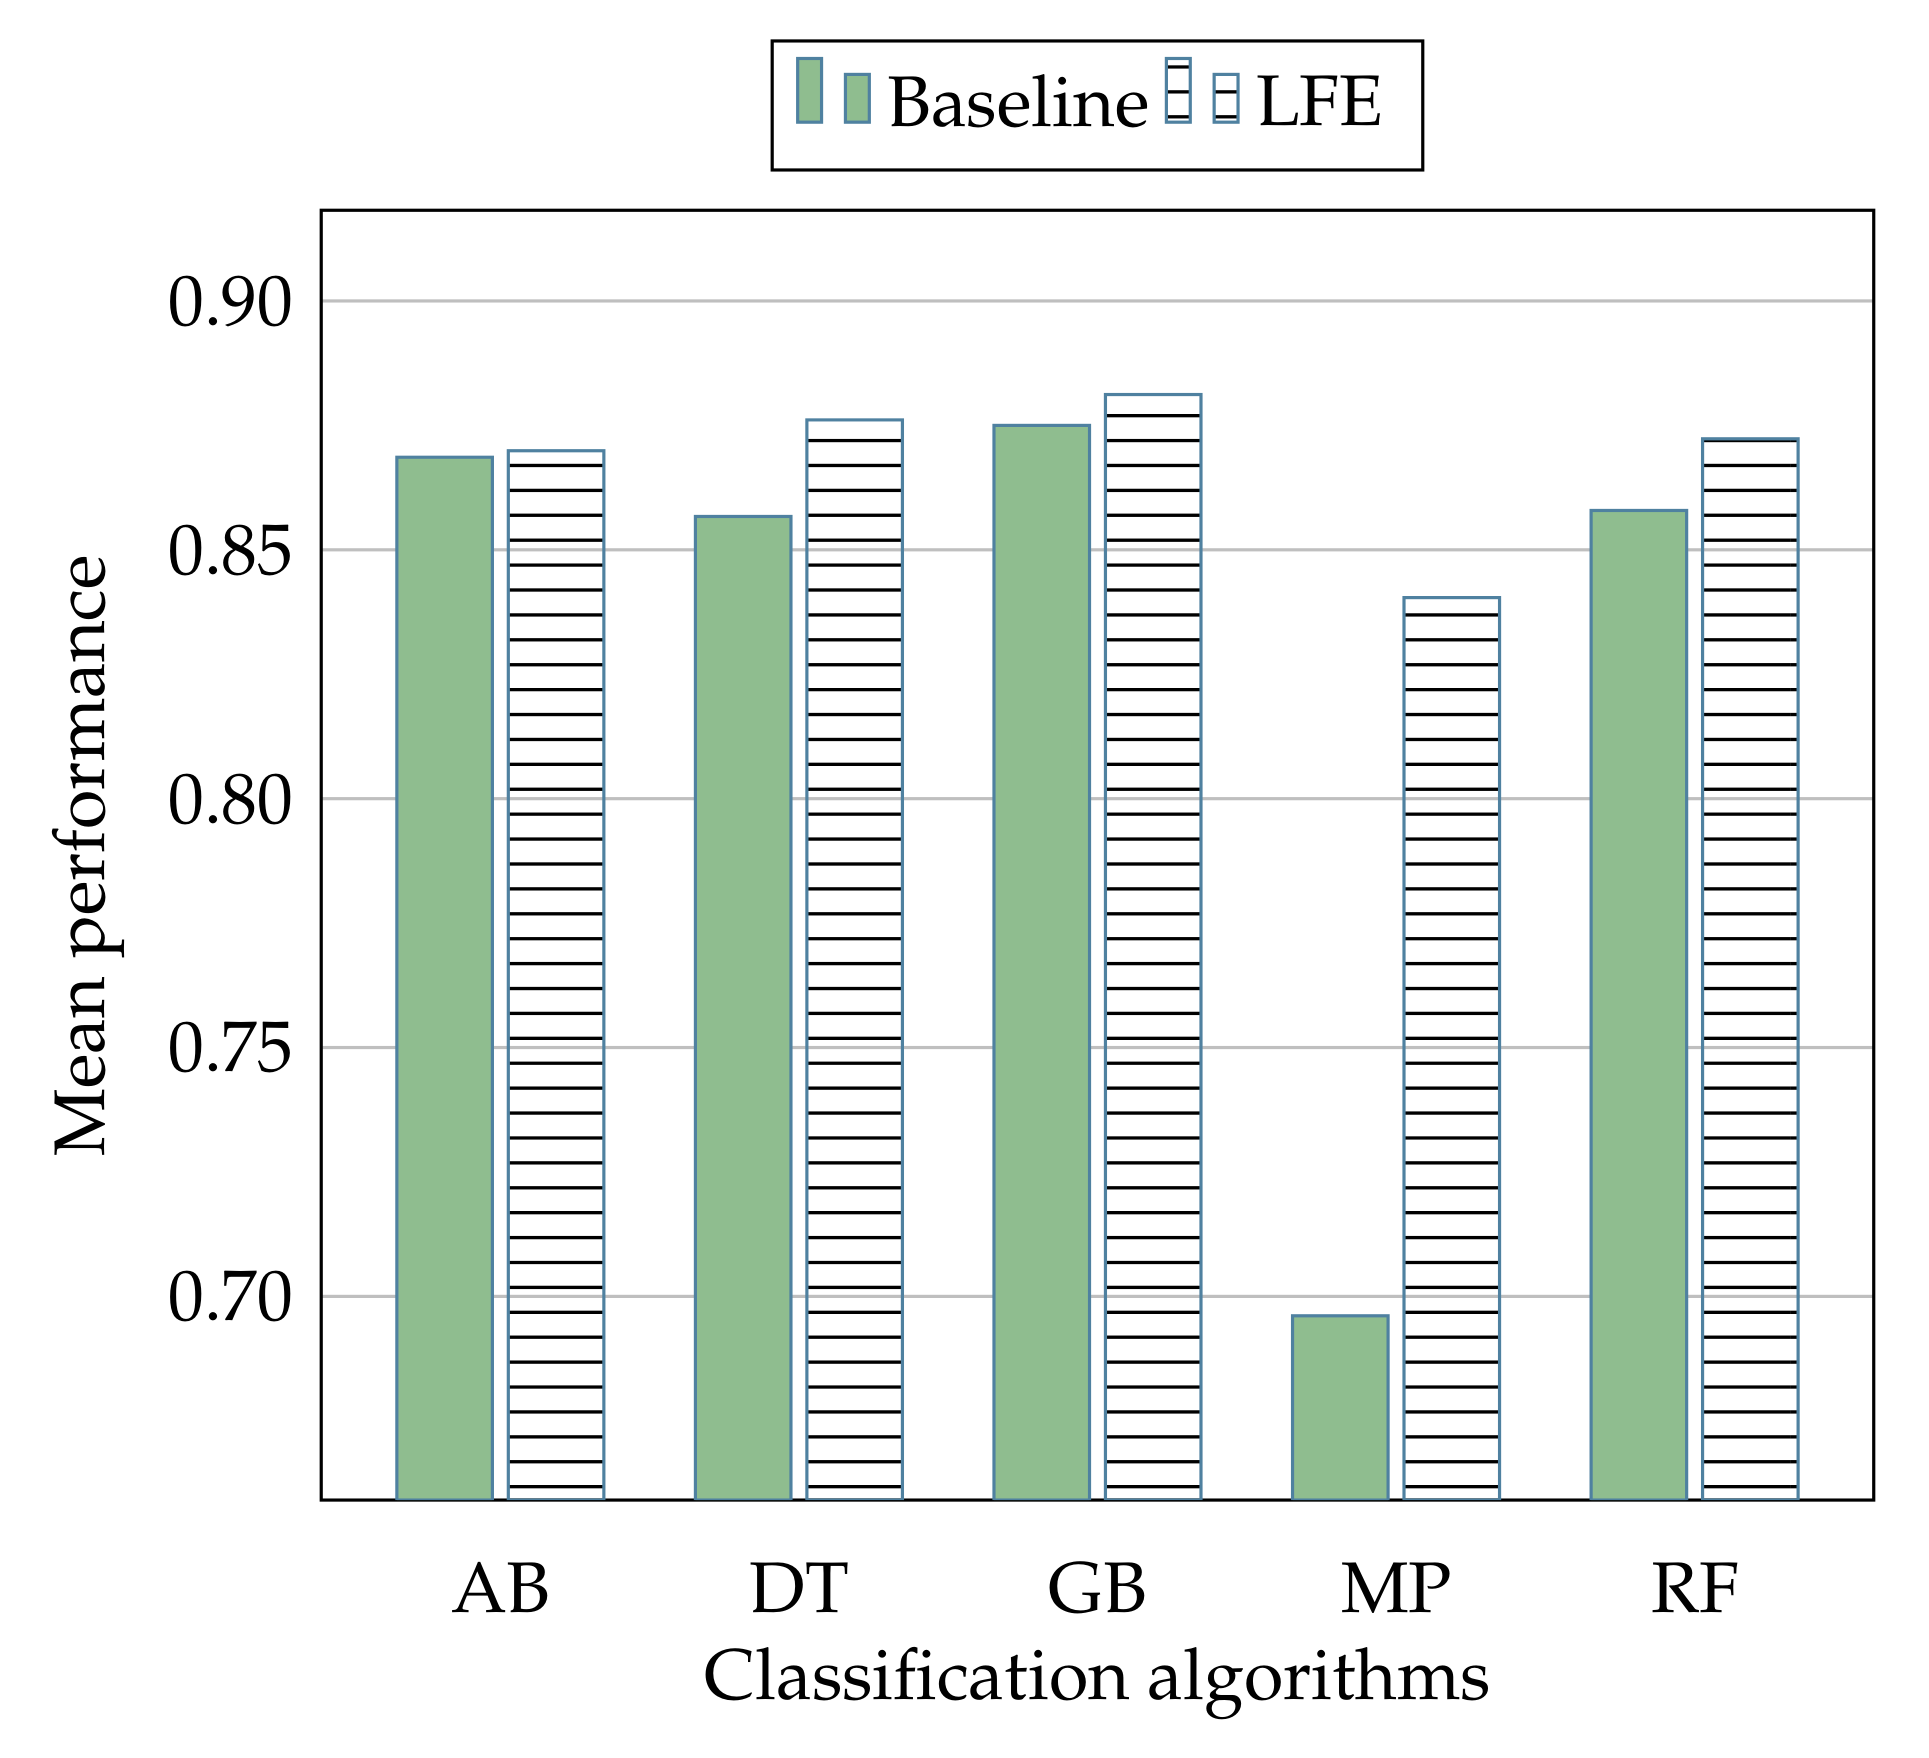
Finally,
Figure 10 and
Figure 11 show the overall mean performance in relation to all the classification algorithms, and in related to all the involved classes of events are shown, respectively.
7.1. Heterogeneous Network Scenarios
The previous validation process of the proposed LFE strategy, performed in relation to each category of events in the NSL-KDD dataset, is here extended with further experiments, which were carried out on other two datasets that involve new classes of devices and events. Differently to what we have done for the NSL-KDD dataset, where the analysis was focused on the goal to perform an in-depth evaluation of the LFE strategy behavior with regard to specific network events, here we consider these datasets in their entirety, with the aim to simulate a real-world exploitation of the LFE strategy, in order to offer an overview in terms of average performance, with respect to heterogeneous network scenarios.
The additional datasets that we used to this purpose are publicly available, and are the following:
CICIDS2017 [
114]: This dataset (hereafter, CIC) involves network activity based on the HTTP, HTTPS, FTP, SSH, and email protocols, related to normal events and several intrusion attacks such as Brute Force SSH, Brute Force FTP, Denial of Service, Infiltration, Heartbleed, Web Attack, Botnet, and Distributed Denial of Service. It is freely downloadable from the Internet (
https://www.unb.ca/cic/datasets/ids-2017.html).
The optimal values of
, shown in
Table 14, have been detected by following the same criteria reported in
Section 6.4, as well as the adopted metrics and algorithms, which are the same as those previously described, respectively, in
Section 6.2 and
Section 6.3.
The experimental results related to these datasets are shown in
Table 13.
7.2. Discussion
The average performance between all the adopted metrics shows how the proposed LFE strategy is able to outperform the canonical use of the classification algorithms, which do not involve the LFE data preprocessing, as demonstrated by the results presented in
Table 12 and
Table 13, where, respectively, the LFE strategy outperforms the canonical solutions in 19 cases out of 25, and 6 cases out of 10.
Such improvements are also evident by observing
Figure 7,
Figure 8 and
Figure 9, where the performances related to all the subsets of events in the NSL-KDD dataset are evaluated with regard to each algorithm of classification.
Another important aspect of the experimental results is related to the LFE capability to better operate in the context of different scenarios, since the out-of-sample subset of the NSL-KDD dataset involves both different type of events and different data configurations, according to the dataset characteristics reported in
Table 9.
Such a capability also emerges from the results of the experiments presented in
Section 7.1, where the performance of the proposed LFE strategy was evaluated on additional datasets characterized by heterogeneous events.
It should be noted that all the used metrics of evaluation (i.e., specificity, MCC, and AUC) are focused on the assessment of the LFE capability to detect, correctly, the intrusion events, and that their combination, together with the adoption of a k-fold cross-validation criterion, offers a reliable evaluation not significantly biased by problems such as data unbalance (MCC and AUC evaluations) or overfitting (cross-validation).
The aforementioned considerations are supported by the fact that, in addition to the specificity, we evaluated the results in terms of MCC and AUC metrics, which are able to assess the ability to discriminate the two possible final classifications of the events, normal and intrusion.
Another interesting aspect of the experimental results is related to the capability of the LFE strategy to improve the canonical classification performance, regardless the implemented algorithm, also by considering that such a strategy has been adopted, by using the same algorithm parameters used by the canonical classification solutions;
As far as the cases where the increase in performance appears less significant are concerned, it should be considered that a typical activity of an IDS involves a huge number of classification; thus, in this case as well, the improvement can be considered a very important milestone.
The LFE strategy has proven capable of improving the performance of the canonical algorithms largely used in this domain, showing its effectiveness in a number of different real-world scenarios, since it has been evaluated with a different number of events, as well as with different type of events, and different distribution of normal and intrusion events.
The information shown in
Figure 10, which reports the overall mean performance in relation to all the algorithms, offers us the measure of how much the proposed strategy is able to improve the average performance in the context of the most used algorithms in the intrusion detection literature, showing the benefits of applying the LFE strategy.
In a similar manner, as shown in
Figure 11, it provides information about the overall mean performance related to each algorithm used in all the different subset of events (i.e., PEA, DSA, RSA, RAA, and NNA), indicating a general improvement that in some cases (e.g., the MP algorithm) is really significant.
The experiments we performed in detail for each category of events (NSL-KDD dataset), along with the additional ones we performed on several datasets characterized by heterogeneous network events (CIC and UNS datasets), proved again the effectiveness of the proposed LFE strategy, as in most cases it has been able to improve the performance of the state-of-the-art algorithms taken into consideration.
In light of the previous considerations based on the experimental results, we can conclude that the validation process demonstrates that the proposed LFE strategy can be profitably used in order to improve the classification performance of the canonical algorithms largely used in the intrusion detection literature, suggesting a possible exploitation also in those solutions that involve more than a single algorithm, e.g. those based on hybrid approaches or ensemble ones.
8. Conclusions and Future Directions
Today’s scenario of modern societies, heavily dependent on the use of an ever-increasing number of network-based services, private and public, generates a huge number of network events related to these activities, which security systems, such as the IDSs, should process as quickly as possible. Unfortunately, the requested short response time in terms of events classification should go hand in hand with its reliability, since a wrong events classification leads toward a series of problems, both case of both false positives and false negatives (i.e., intrusions identified as normal events and vice versa).
For these reasons, the research activity in this area involves a large number of people and capital, with the aim to develop effective techniques and strategies able to face the problem. The challenges are mainly related to some open problems that affect this field, such as a data domain characterized by a high degree of data imbalance and the heterogeneity/dynamism of the involved network events.
The idea behind the LFE strategy proposed in this work revolves around the observation that an improvement in terms of event characterization given by the introduction of several new features, locally calculated for each network event on the basis of the original ones, combined with a process of discretization of all feature values, can lead to an improvement of the performance related to the canonical algorithm of classification largely adopted in this field. This kind of feature engineering process was validated by using real-world data, and the experimental results indicate its effectiveness, regardless of the involved algorithms and the type of events taken into account.
On the basis of the achieved improvements, the present work inspires some future research directions, in order to define additional intrusion detection approaches based on more sophisticated solutions, such as those based on hybrid-based or ensemble-based approaches, which involves more than a single algorithm of classification.
As a final note, we would like to point out that we did not consider sophisticated data pre-processing techniques, since our objective is to demonstrate the LFE strategy capability to improve the baseline algorithms performance without computational efforts, as this effect suggests an ability to also improve more complex approaches. Part of our future research will be oriented in this direction, together with the adoption of other datasets that involve different network scenarios such as Internet of Things (IoT), Industrial Internet of Things (IIoT), Internet of Health Things (IoHT), and so on.

 ,
, 


