1. Introduction
Due to the frequent occurrence of structural constructions’ safety accidents in recent years, the national property and people’s lives have suffered tremendous losses. Hence, it is deeply recognized that real-time online monitoring and health assessment of structural constructions, especially those newly built, are very important. In view of the emergence of new structural constructions, long-span bridges, and complex system buildings, the health monitoring and safety assessment of structures should be paid more attention. Structural displacement, as a key index of structural safety evaluation, can directly reflect whether the deformation of bridge structure exceeds its safety permission. It can provide effective parameters for structural damage identification and health monitoring. Displacement monitoring can be applied to wood [
1], bridges [
2], dams [
3], anti-lock brake systems [
4], stay cables [
5], and vibration analysis in vitro imaging systems [
6], etc.
For structural construction like bridges, there are still a lot of contact displacement monitoring methods in use, such as acceleration sensor and displacement meter [
7], Global Positioning System (GPS) [
8], electronic total station [
9], laser interferometer [
10], and so on. Contact monitoring methods often need to install sensors on bridges, which makes the maintenance of sensors become very difficult in the later period because of bridges’ often crossing the sea or rivers. In order to overcome these limitations, non-contact displacement monitoring methods have gradually emerged in recent years. Among them, the Digital Image Processing (DIP) method stands out for its high accuracy and simple installation of equipment. At present, the Digital Image Correlation (DIC) [
1,
4,
5,
11,
12,
13,
14,
15,
16,
17,
18,
19,
20,
21,
22] method is the mainstream for bridge displacement monitoring using DIP.
DIC, also called digital speckle correlation, is to obtain the deformation information of the Region of Interest (ROI) from two digital images before and after deformation. The image before deformation can be called the reference image and the image after deformation can be called the deformed image. The basic principle of DIC is to mesh the ROI in the reference image, treat the motion of each sub-region as a rigid motion, and calculate the correlation according to the pre-defined correlation function through a certain search method for each sub-region. In the deformed image, the location of the sub-region after deformation is the region whose cross-correlation coefficient with the sub-region in the reference image is the maximum, and then the displacement of the sub-region is obtained. By calculating all the sub-regions, the deformation information of the whole field can be obtained. The DIC method is welcomed by some scholars because it is easy to implement and its calculation accuracy is high. Despite its great advantages, the DIC method has to carry out more tedious data processing in order to obtain better measurement results. Its computational efficiency can not meet the requirements of fast measurement. In the process of a speckle image’s acquisition and transmission, there are also many factors (such as signal noise, data missing, etc.) that affect the accuracy of measurement results. Therefore, how to better apply the DIC method to the actual measurement; there are still many research works to be further improved [
4,
11,
12,
13,
14,
15,
16,
17,
18,
19,
20,
21,
22].
Target tracking [
23,
24,
25,
26], as its name implies, is to locate the position of a specific target in each frame of the image and generate the motion trajectory of the target. Setting a target board on the point which needs displacement monitoring, the displacement of the point can be known by the target board’s displacement after processing the sampled image. The target board for sampling is designed with special geometric patterns, which Light Emitting Diode (LED) lights.
Initially, many scholars set the target board as a rectangular board with special square black-and white geometric patterns and obtain the center of a window by a special algorithm. This method has high monitoring accuracy of sub-millimeters under ideal conditions. However, the target has a directional characteristic that is, when using the target as the photographed object, each of its sides must be horizontal or vertical. If it is tilted, the precision of displacement monitoring will be reduced dramatically [
25]. Another disadvantage of this method is that its calibration of the visual monitoring system designed is complex, leading to large calculation. To overcome this problem, Lu et al. [
26] changed the pattern on the target board into a circle so that the precision would not be affected even if the target board was tilted. Moreover, the computation complexity of this method is much less than the above method. In [
26], the method’s cost of erecting detection equipment is too large for bridges with a large span that need to locate more multi-targets because of its tracking only one target on a camera.
In order to overcome the limitations of DIC, target tracking technology and other existing approaches, a novel algorithm based on specific target tracking technology is proposed in this article that can measure displacements of multi-targets simultaneously and be free of complex data processing. Experiments have been conducted to test the algorithm’s various properties with images obtained by Photoshop (Adobe Photoshop CS6, Adobe Systems Incorporated, San Jose, California, USA). Results show that this method realizes accuracy, robustness, real-time, low-cost, simplicity, and self-adaptability, which sufficiently adapts the bridge displacement monitoring in theory.
The remainder of the paper is organized as follows.
Section 2 discusses the key fundamentals of target tracking technology and DIC. The proposed algorithm is described in
Section 3. The experimental results are analyzed in
Section 4.
Section 5 draws conclusions.
2. Digital Image Correlation
The basic principle of DIC is to mesh the ROI in the reference image, treat the motion of each sub-region as a rigid motion, and calculate the correlation according to the pre-defined correlation function through a certain search method for each sub-region. In the deformed image, the location of the sub-region after deformation is the region whose cross-correlation coefficient with the sub-region in the reference image is the maximum, and then the displacement of the sub-region is obtained. By calculating all the sub-regions, the deformation information of the whole field can be obtained.
In the DIC method, we need to determine a correlation coefficient function, which is a criterion to measure the matching degree between reference subset and target subset and then find out the extremum of correlation coefficient by corresponding integral pixel displacement search method to extract displacement information. About the extremum, we take the maximum value in positive correlation coefficient function and the minimum value in negative correlation coefficient function. Different expressions of correlation coefficients have different performance and its performance will directly affect the search accuracy and computation efficiency of the DIC method. Two commonly used correlation coefficient functions, Zero Normalized Cross-Correlation (ZNCC) and Zero Normalized Sum of Squared Differences (ZNSSD), are presented in Equation (
1) [
27,
28,
29]:
where
and
mean the gray level intensity of a pixel for the reference and deformed images, respectively, and
The advantages of this method are that the algorithm is simple and easy to realize, it is the whole field of view and the non-contact deformation monitoring, and the monitoring precision is high.
The disadvantages of this method are that it is a deformation monitoring method according to the speckle image of the structure. If the texture of the structure surface is good, the speckle image with a good effect can be obtained, and the results of deformation monitoring will also be good. However, when the texture of the structure surface is general or no obvious texture, it is necessary to make artificial spots, otherwise the displacement can not be monitored by this method. In addition, it can be seen from the principle that the essence of this method is to carry out a large number of repeated calculations, and the overall calculation is very large. If the image pixels are large, the correlation computation of the two images would be extremely large so it can not meet the requirements of monitoring speed at all.
3. Proposed Algorithm
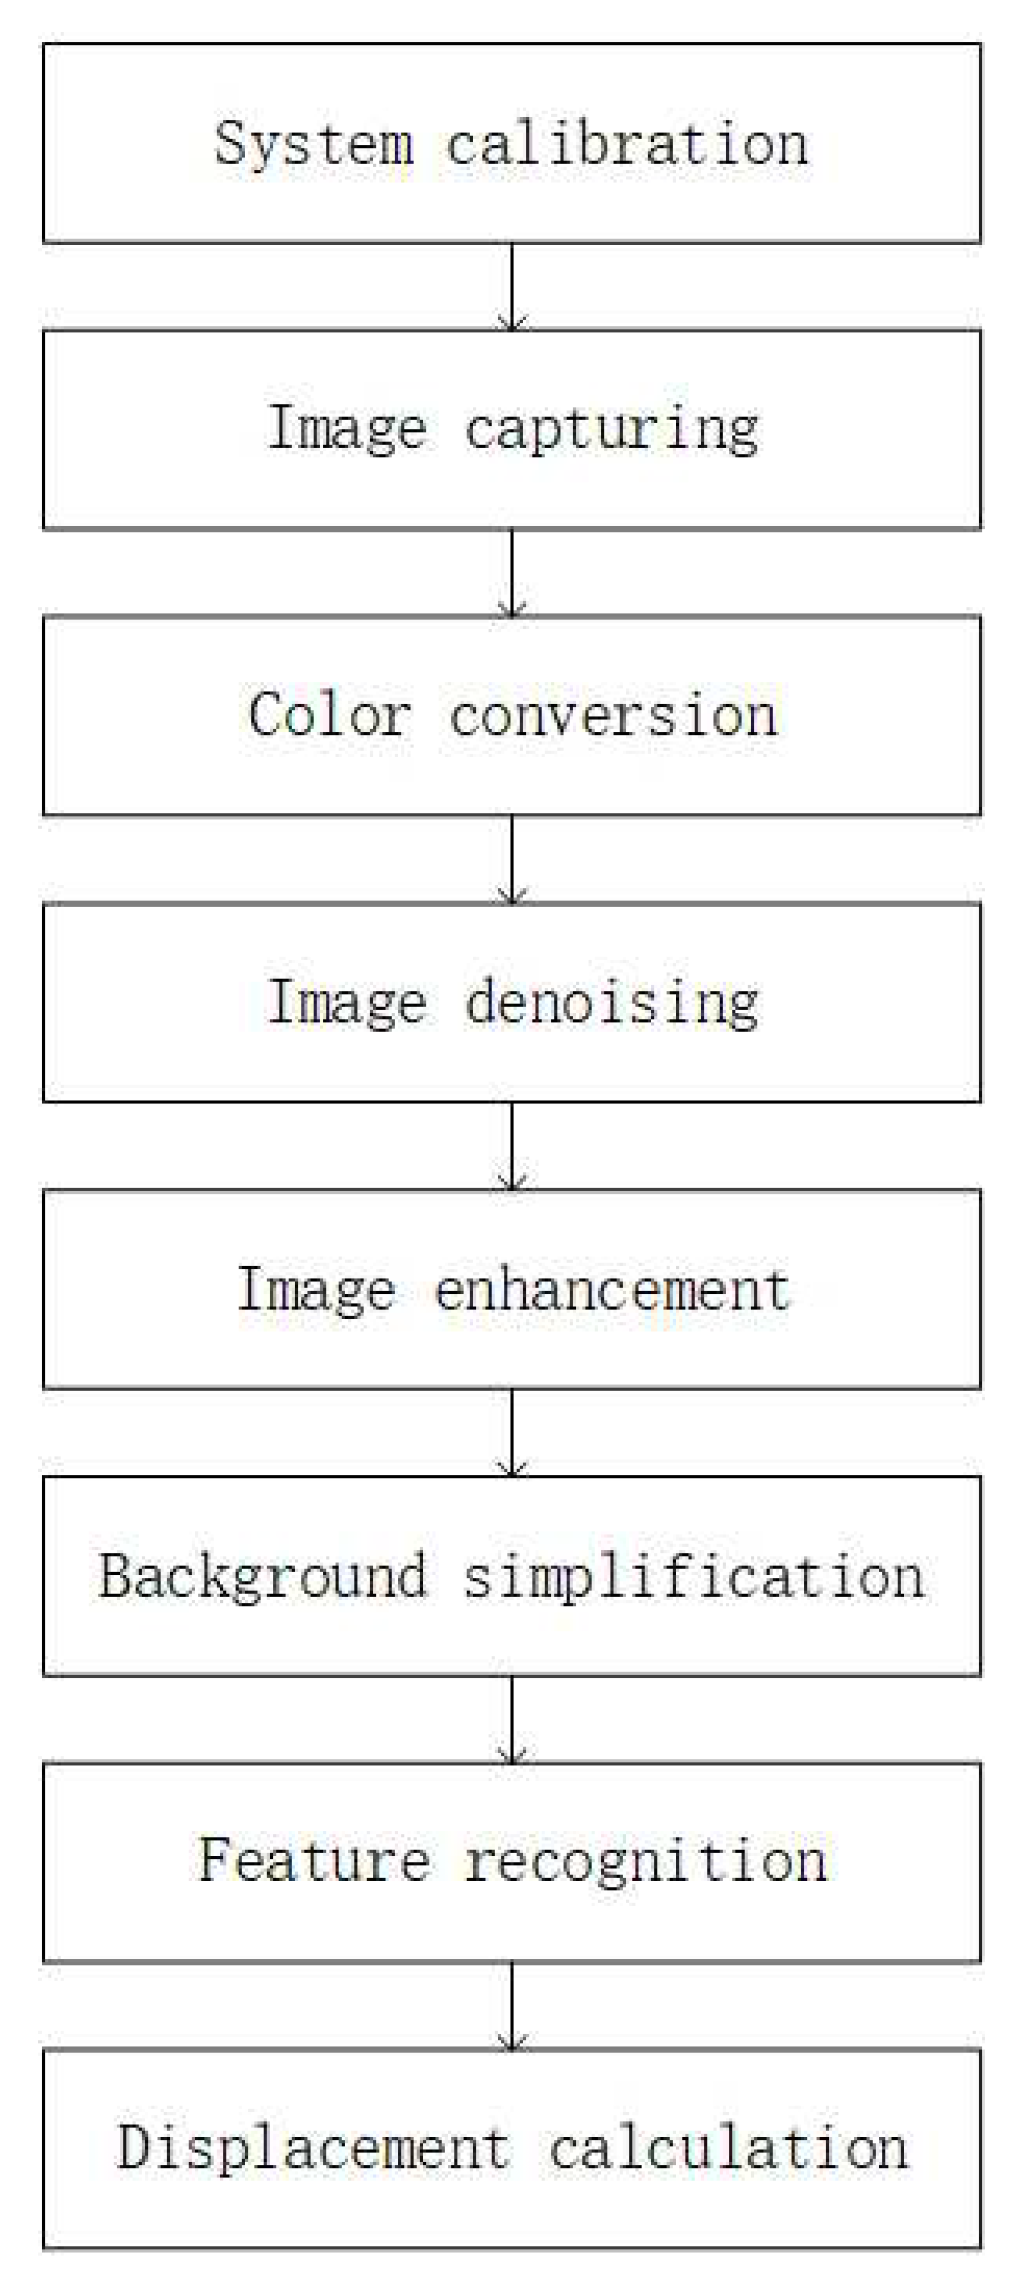
The digital image correlation method can calculate the whole field displacement. If it is used in bridge displacement monitoring, the actual environment is not suitable and the amount of calculation is very large so it is difficult to meet the monitoring speed. The algorithm proposed in this paper improves the specific target tracking technology to make it more meet the needs of actual bridge displacement monitoring. A flowchart of the proposed algorithm is shown in
Figure 1. It is mainly composed of eight modules. In each module, the algorithm in this paper is optimized to meet the real-time, robustness, and adaptability as far as possible under the premise of monitoring accuracy.
As mentioned earlier, current target tracking algorithms’ cost of erecting detection equipment is too large for bridges with a large span that need to locate more multi-targets because of its tracking only one target on a camera, and DIC has difficulty guaranteeing the accuracy and real-time because of its complicated data processing. The proposed algorithm in this paper can meet the real-time and accuracy under the premise of monitoring multiple targets.
The algorithm proceeds as follows.
System calibration is acquiring the actual distance value represented by each pixel under the current monitoring distance before the displacement monitoring. The calibration method adopted in this paper is to separate two target boards by a known distance (preferably greater than 50 m), take photos, and run the algorithm to obtain the central coordinates of the two target boards in the image. Dividing the known distance by the coordinate difference between the two target boards is the actual distance respected by each pixel.
Image capturing means using the image acquisition system of the Charge Coupled Device (CCD) camera to collect images.
Color conversion means converting the collected images into gray images for processing.
Image denoising, as its name implies, is to filter out the noise in the image with a filter. In this paper, an adaptive median filter is used for denoising. represents a sub-image whose center is at . The adaptive median filter described in detail is as follows:
denotes the minimum brightness value in .
denotes the maximum brightness value in .
denotes the median brightness value in .
denotes the brightness value at coordinates .
This adaptive median filtering algorithm works in two levels, Level A and Level B:
Level A: If , turn to Level B.
Otherwise, increase window size.
If the window size <=, repeat Level A.
Otherwise, output .
Level B: If , output .
Otherwise, output .
represents the allowable maximum adaptive filter windows size and in this paper.
Many denoising methods are applied to this algorithm and the denoising effect is similar. In this paper, the adaptive median filter is selected and other denoising methods also can be used instead.
Image enhancement uses top-hat transformation to uniform background and histogram equalization to enhance the contrast. Assuming that
is a grayscale image and
is a structural element,
b erosion of image
f at
is defined as Equation (
2) and
b dilation of image
f at
is defined as Equation (
3). Top-hat transformation is defined as Equation (
4):
Background simplification uses erosion and hole filling technology. The structural element size of erosion procedure is a disk structure with a radius of 1. Hole filling technology is explained in Equation (
5), where
A represents a binary image,
represents the complementary set of
A,
B represents a 4-connected structural element, and
represents an all-black image except for a white spot in each hole. If
, the algorithm ends at step
k of the iteration. The parallel set of
X and
A is the image after hole filling:
Feature recognition’s flowchart is shown in
Figure 2. The main principle is to take the vertices of eight directions on the edge of the region and calculate the distances from them to the center of the region, respectively. Then, the standard deviation of these eight distances is calculated and a threshold is set. If the standard deviation is less than this threshold, the region is recognized as a circle.
In this paper, the method of obtaining the center of a circle is the centroid location by first-order central moment method. It is a method of determining the centroid of image by using the geometric invariant first-order moment of a digital image. The concept of geometric moment was first proposed by Hu in 1962, and it is shown in Equation (
6):
where
means the continuous image function and
means
order moments of the continuous image function.
For this paper, the image function
is a discrete numerical image so its integral operation is replaced by summation operation.
is shown in Equation (
7):
The zero-order moment of the region represents the region’s mass and the first-order moment represents the region’s center of mass. The coordinates of the region’s center of mass can be determined by combining the two, and it is presented in Equation (
8):
where
means the coordinate of the region’s center.
Displacement calculation is to calculate the pixel displacement of the central coordinate of each circular target and determine the actual displacement distances according to the results of system calibration.
Compared with other image displacement monitoring algorithms, the algorithm in this paper has two main advantages. The first advantage is that the algorithm designs specific region detection conditions directly according to the characteristics of the target without image correlation method so it eliminates a lot of repeated calculations. When there are more pixels in the image, the advantage of this algorithm will be more obvious. The second advantage is that the algorithm can monitor multiple targets at the same time, unlike [
25,
26], where a camera can only monitor one target, which greatly reduces the cost of camera equipment. In summary, this algorithm is suitable for rapid displacement monitoring of large structures such as bridges.
4. Evaluation
In this paper, three experiments are conducted to verify the proposed algorithm’s accuracy, robustness, real-time, self-adaptability, low-cost, and simplicity mentioned above. The original pictures in the experiments are made by Photoshop and the algorithm is realized by MATLAB language (R2016a, MathWorks, Natick, MA, USA).
In the first experiment, accuracy and self-adaptability can be proved. The accuracy of the algorithm can reach a sub-pixel level and meet the daily needs of bridges. This algorithm can automatically detect the number of target boards without setting a fixed number in advance, reflecting the self-adaptability of the algorithm. This algorithm realizes multi-target simultaneous monitoring and greatly reduces the cost of monitoring and facilitates later data processing, reflecting the low-cost and simplicity of the algorithm. In the second and third experiments, robustness and real-time can be proved respectively. The robustness of the algorithm is reflected in that, when the target board is slightly contaminated, the algorithm can still identify the location of the target board and the accuracy is almost unaffected. The algorithm is implemented in a frequency domain as far as possible and each step is calculated and compared to select the shortest time-consuming sub-algorithm from sub-algorithms that can achieve the same effect. If the displacement exceeds the threshold, real-time warning can be achieved. In the fourth experiment, the algorithm is achieved by C++ language to prove its availability in the actual environment.
4.1. Accuracy Experiment
As shown in
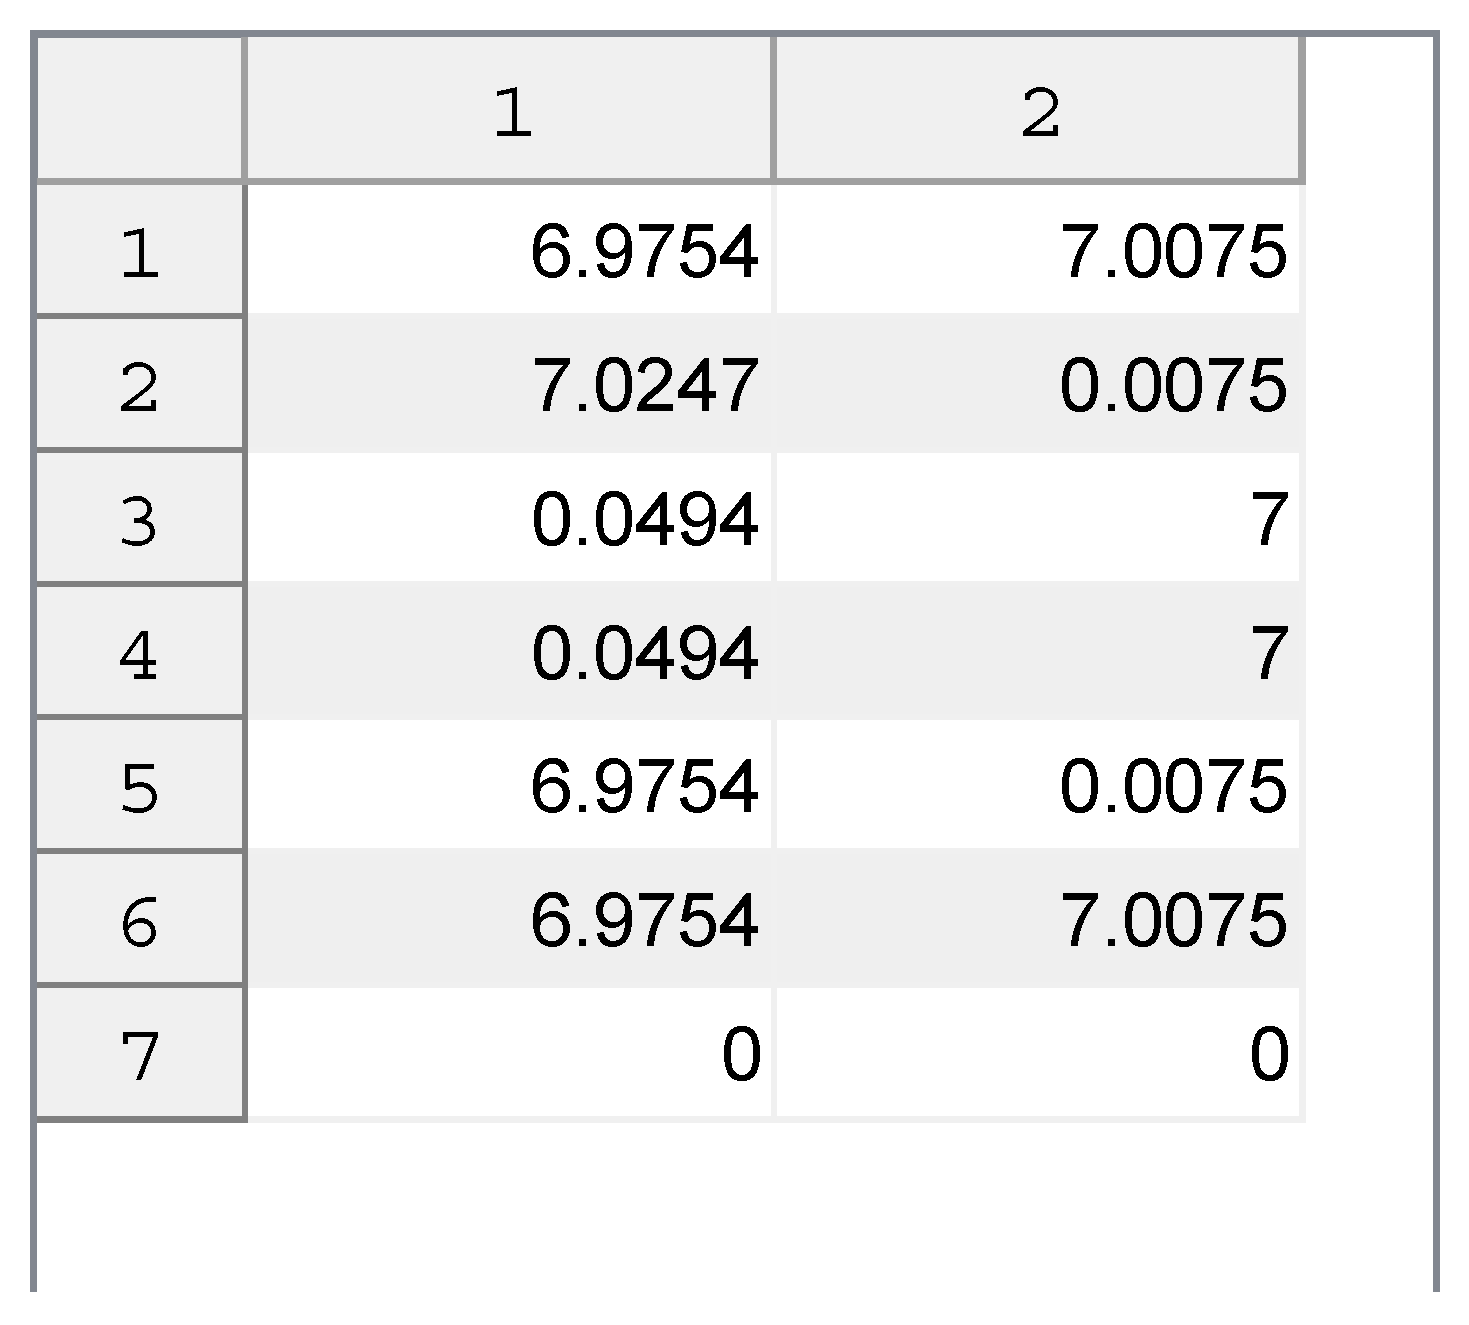
Figure 3, we used Photoshop to make the picture to simulate actual scenes. We first move the target boards in the graph by certain amounts of displacement, which is shown in
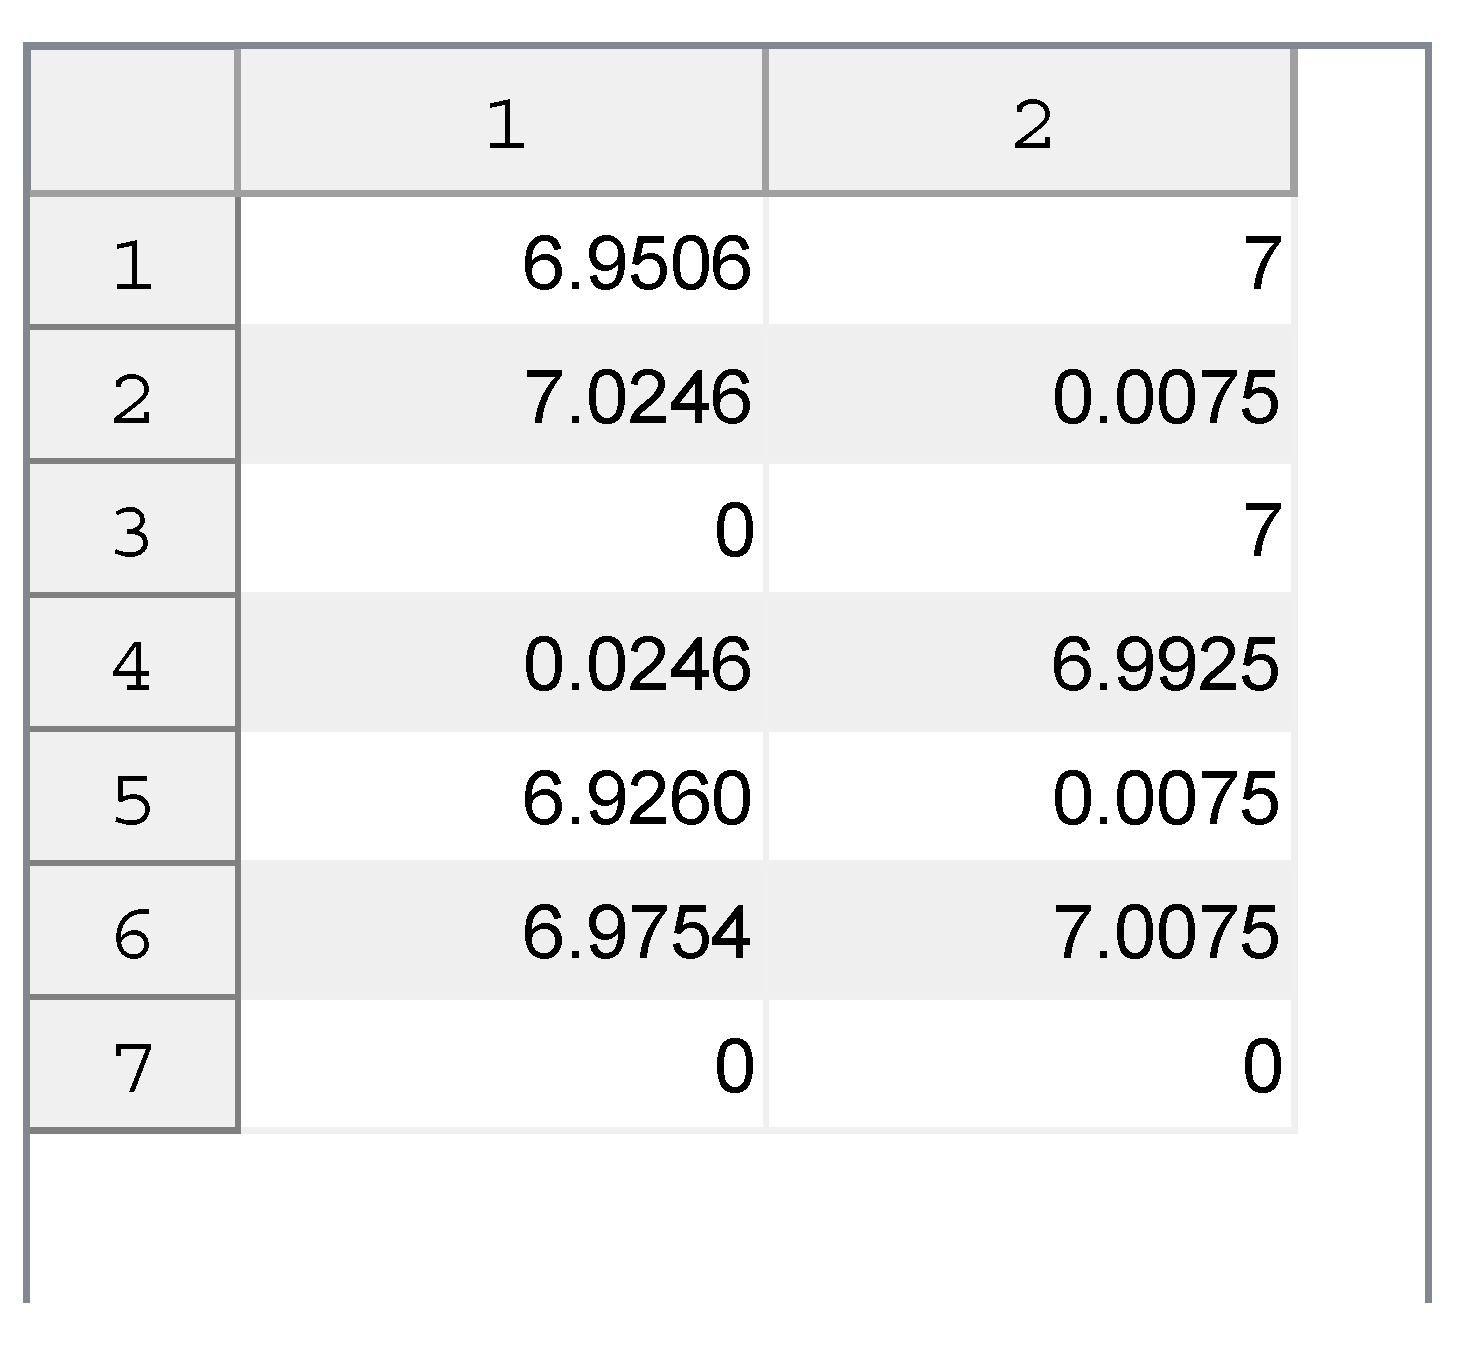
Table 1. The program calculates the target boards’ displacement values of two pictures before and after the displacement. The results of the operation are shown in
Figure 4 (The first column represents the
X coordinate of the displacement, the second column represents the
Y coordinate of the displacement, and each row represents the target board number), reflecting that the accuracy of the algorithm can reach a sub-pixel level.
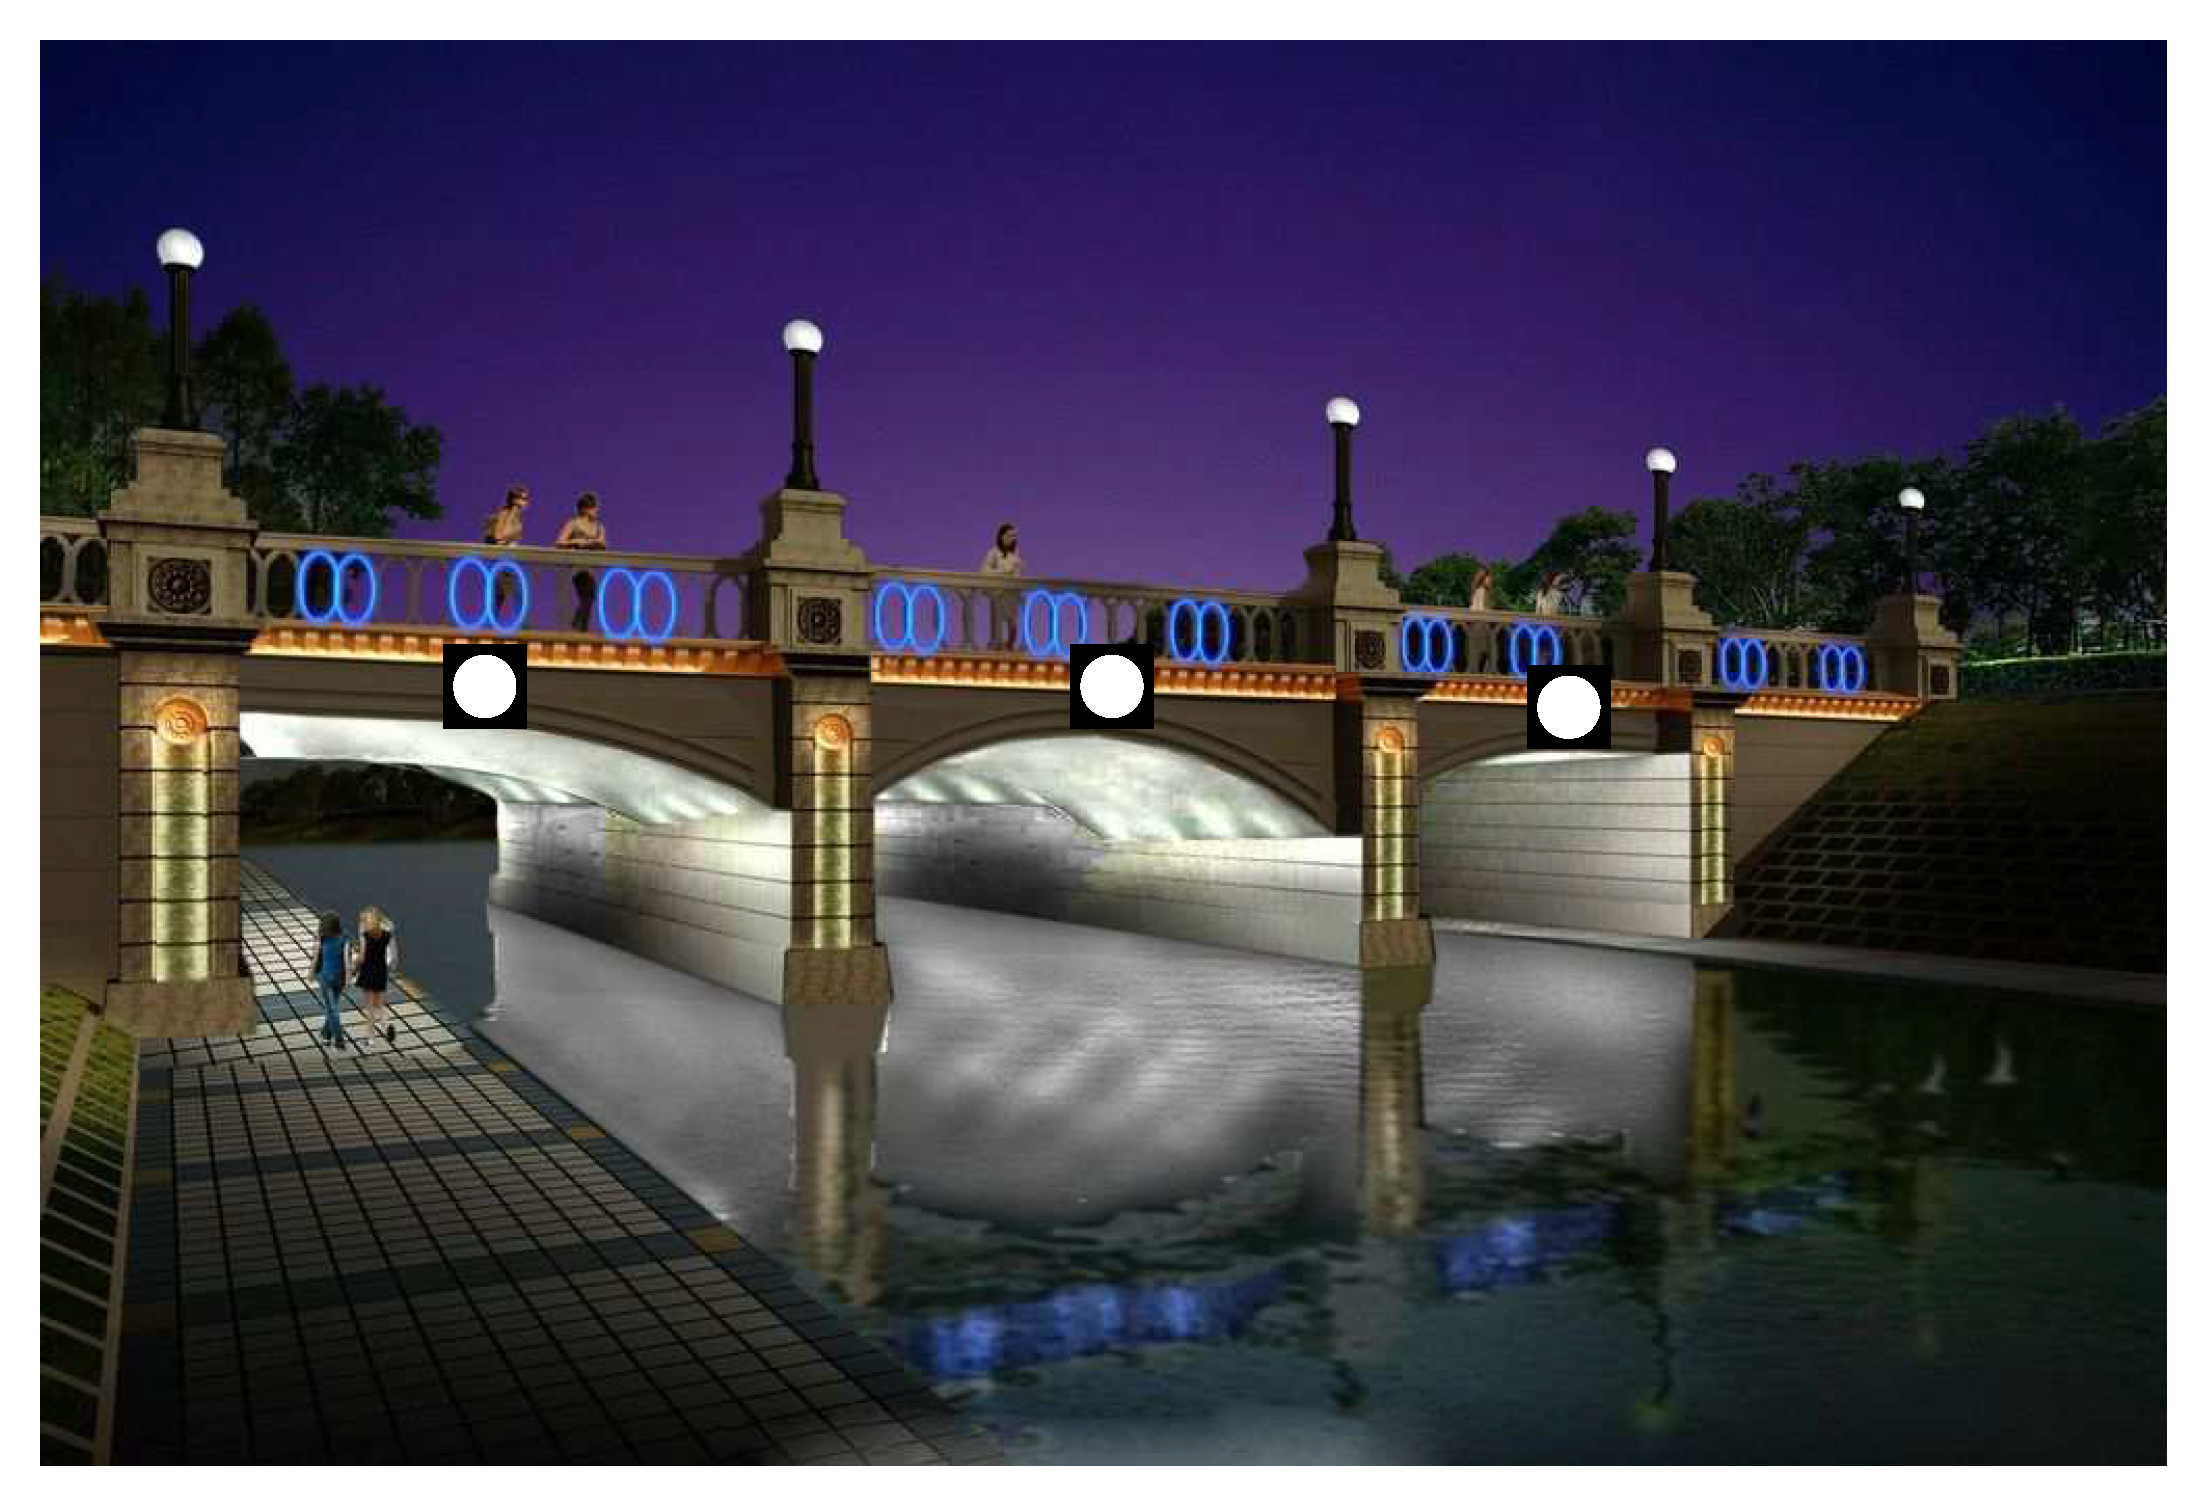
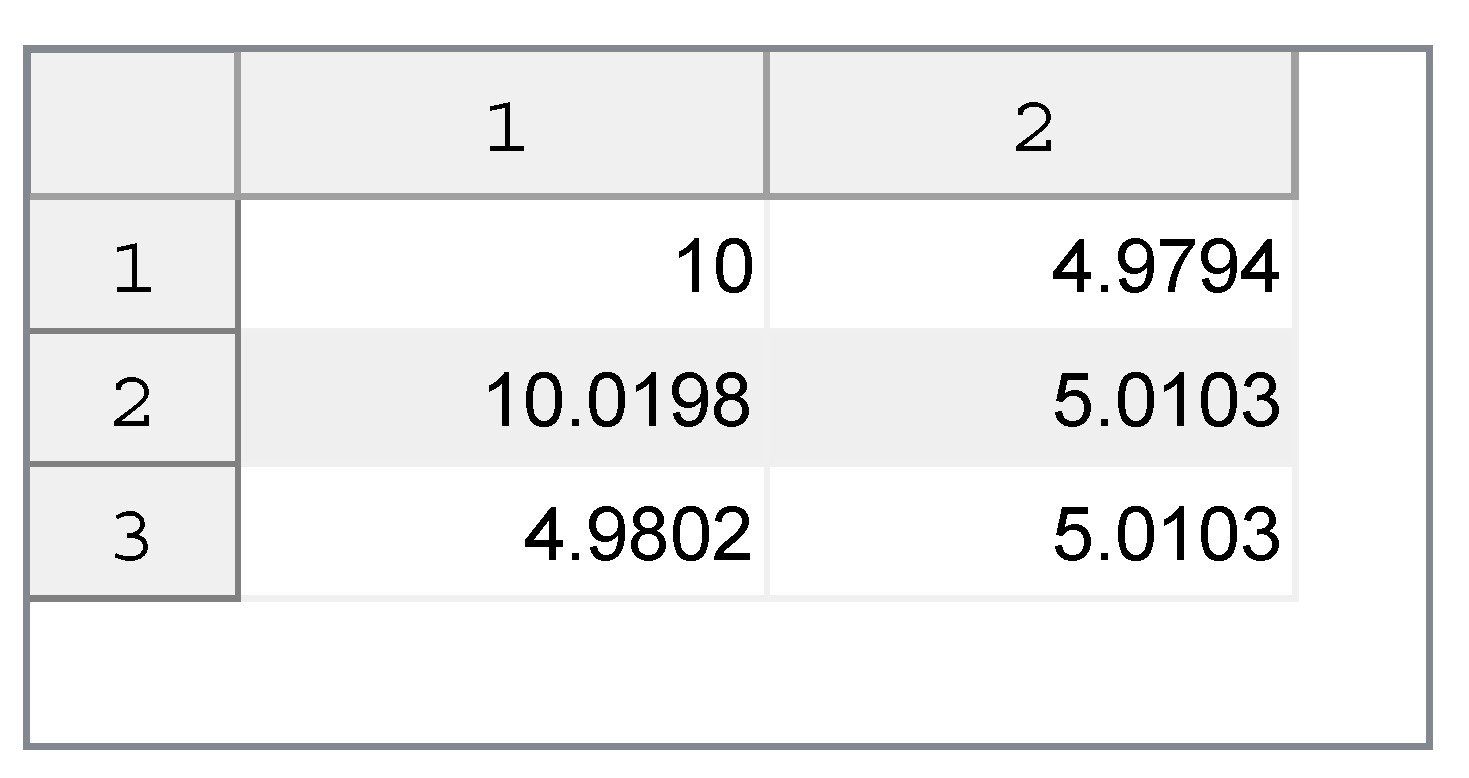
To verify the self-adaptability of the algorithm, we replaced the original picture and repeated the experiment above. The image that simulates real environments is shown in
Figure 5. The displacements set is shown in
Table 2. The operation results of the program are shown in
Figure 6.
The results of the two experiments show that the accuracy of the proposed algorithm can reach 1/10th of a pixel and self-adaptability has also been proved very well.
4.2. Robustness Experiment
To verify the robustness of the algorithm, some stains of different shapes are added to the target boards in
Figure 3. Pictures before and after displacement are shown in
Figure 7 and
Figure 8. In order to reflect the advantages of the algorithm, we set different stains between pictures before and after displacement.
Positions of target boards before and after displacement are shown in
Table 1. The operation results of the program are shown in
Figure 9. The experiment can prove the robustness of the algorithm and the accuracy is almost unaffected.
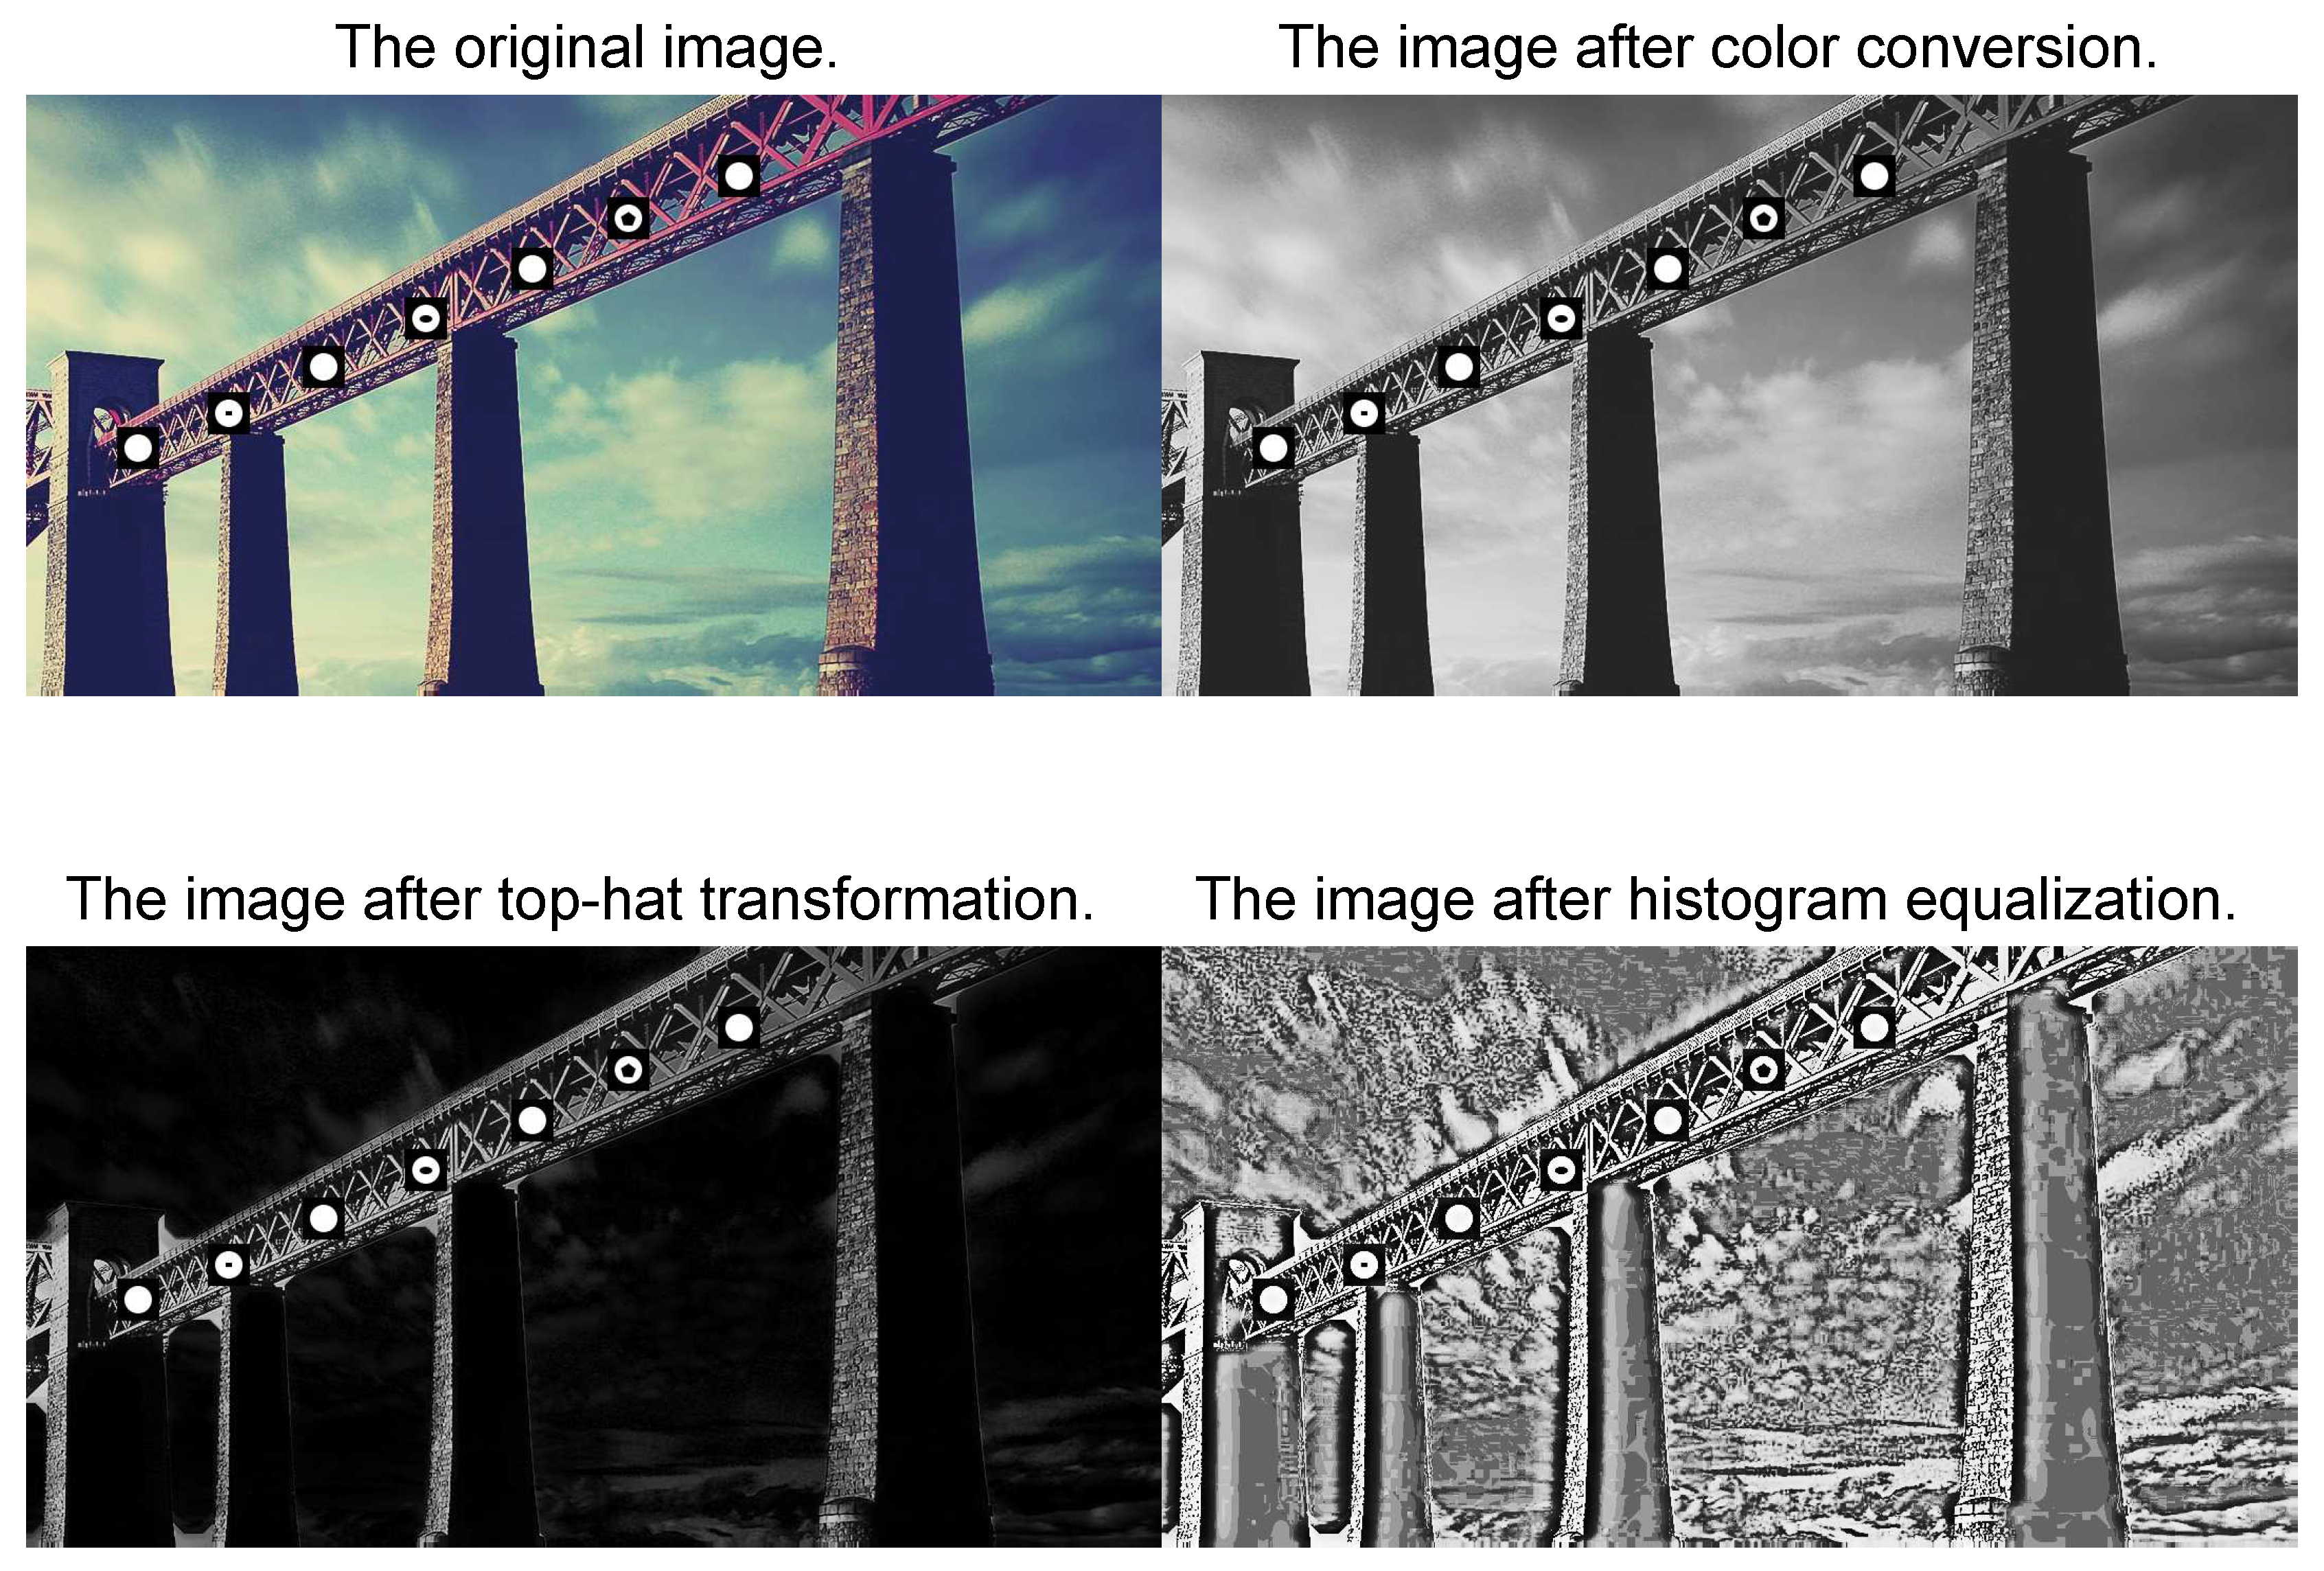
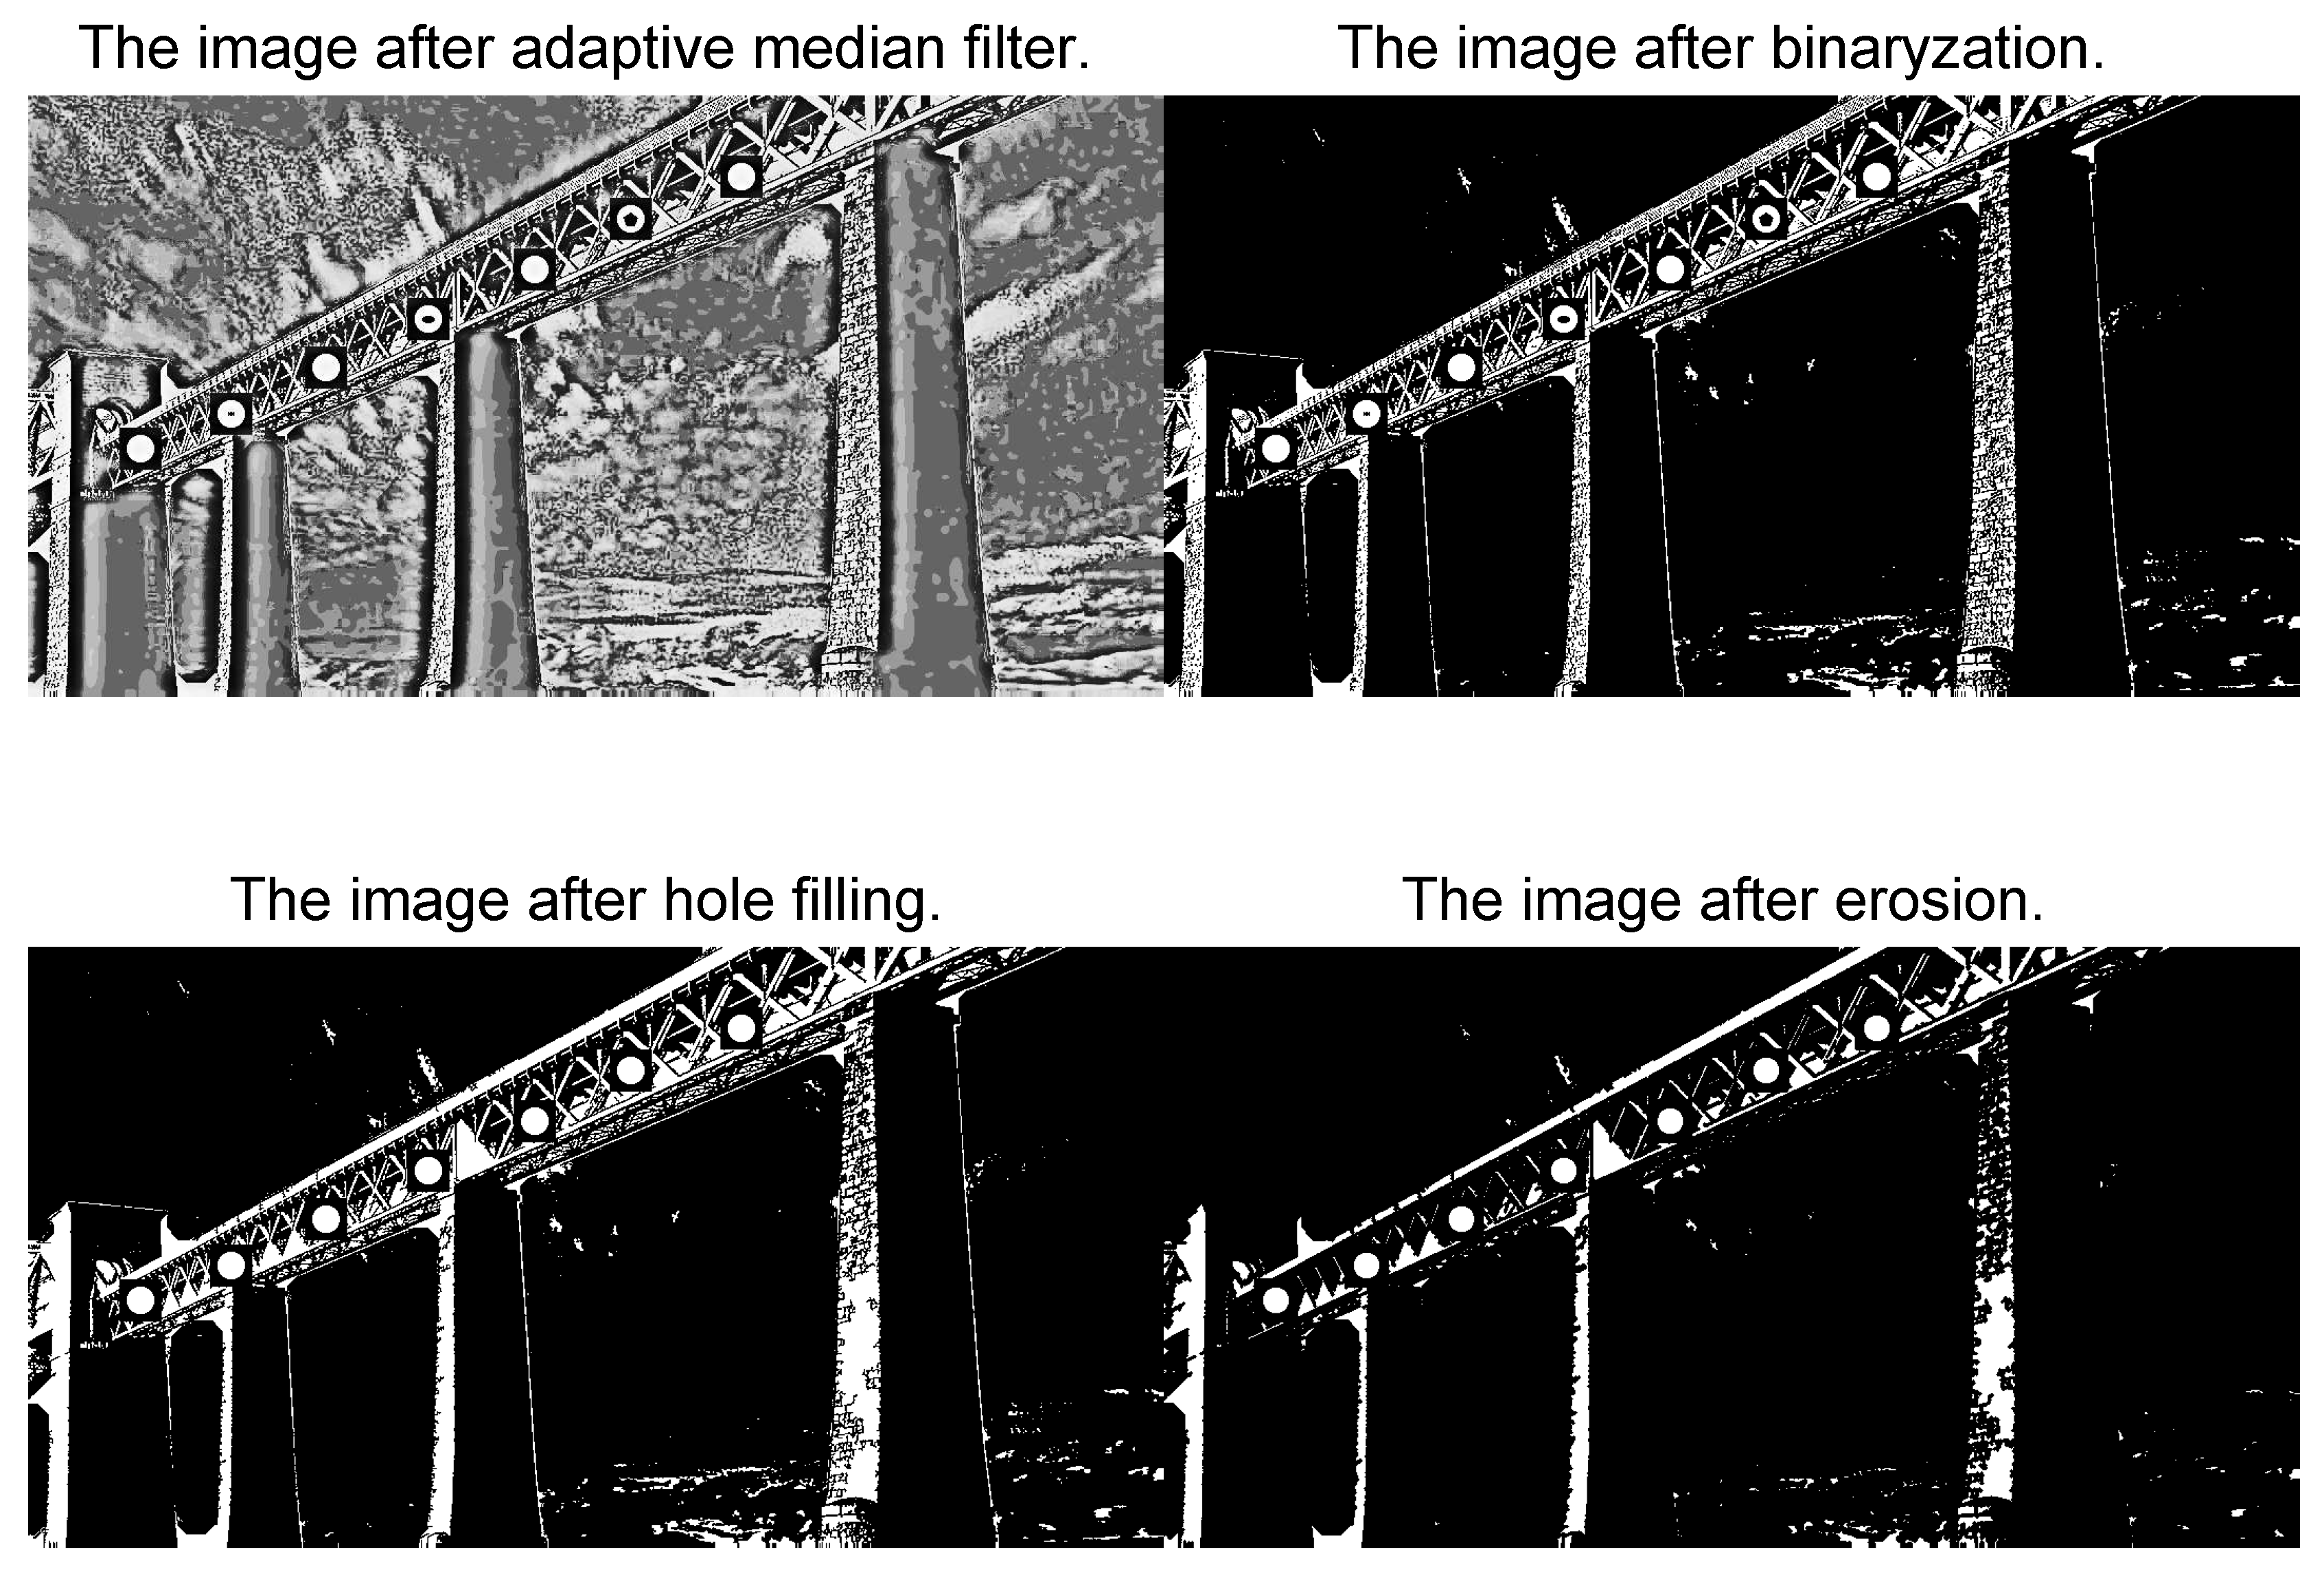
Figure 10 and
Figure 11 show the main process of image processing by the algorithm. The binarization threshold is 0.8 in this paper.
4.3. Real-Time Experiment
In this experiment, three kinds of pictures in
Figure 3,
Figure 5 and
Figure 7 are used to verify the real-time performance of the algorithm, respectively.
Figure 3,
Figure 5 and
Figure 7’s five sets of running time of the program are shown in
Table 3. The results show that the real-time performance of the algorithm can achieve timely early warning.
4.4. Actual Environment Experiment
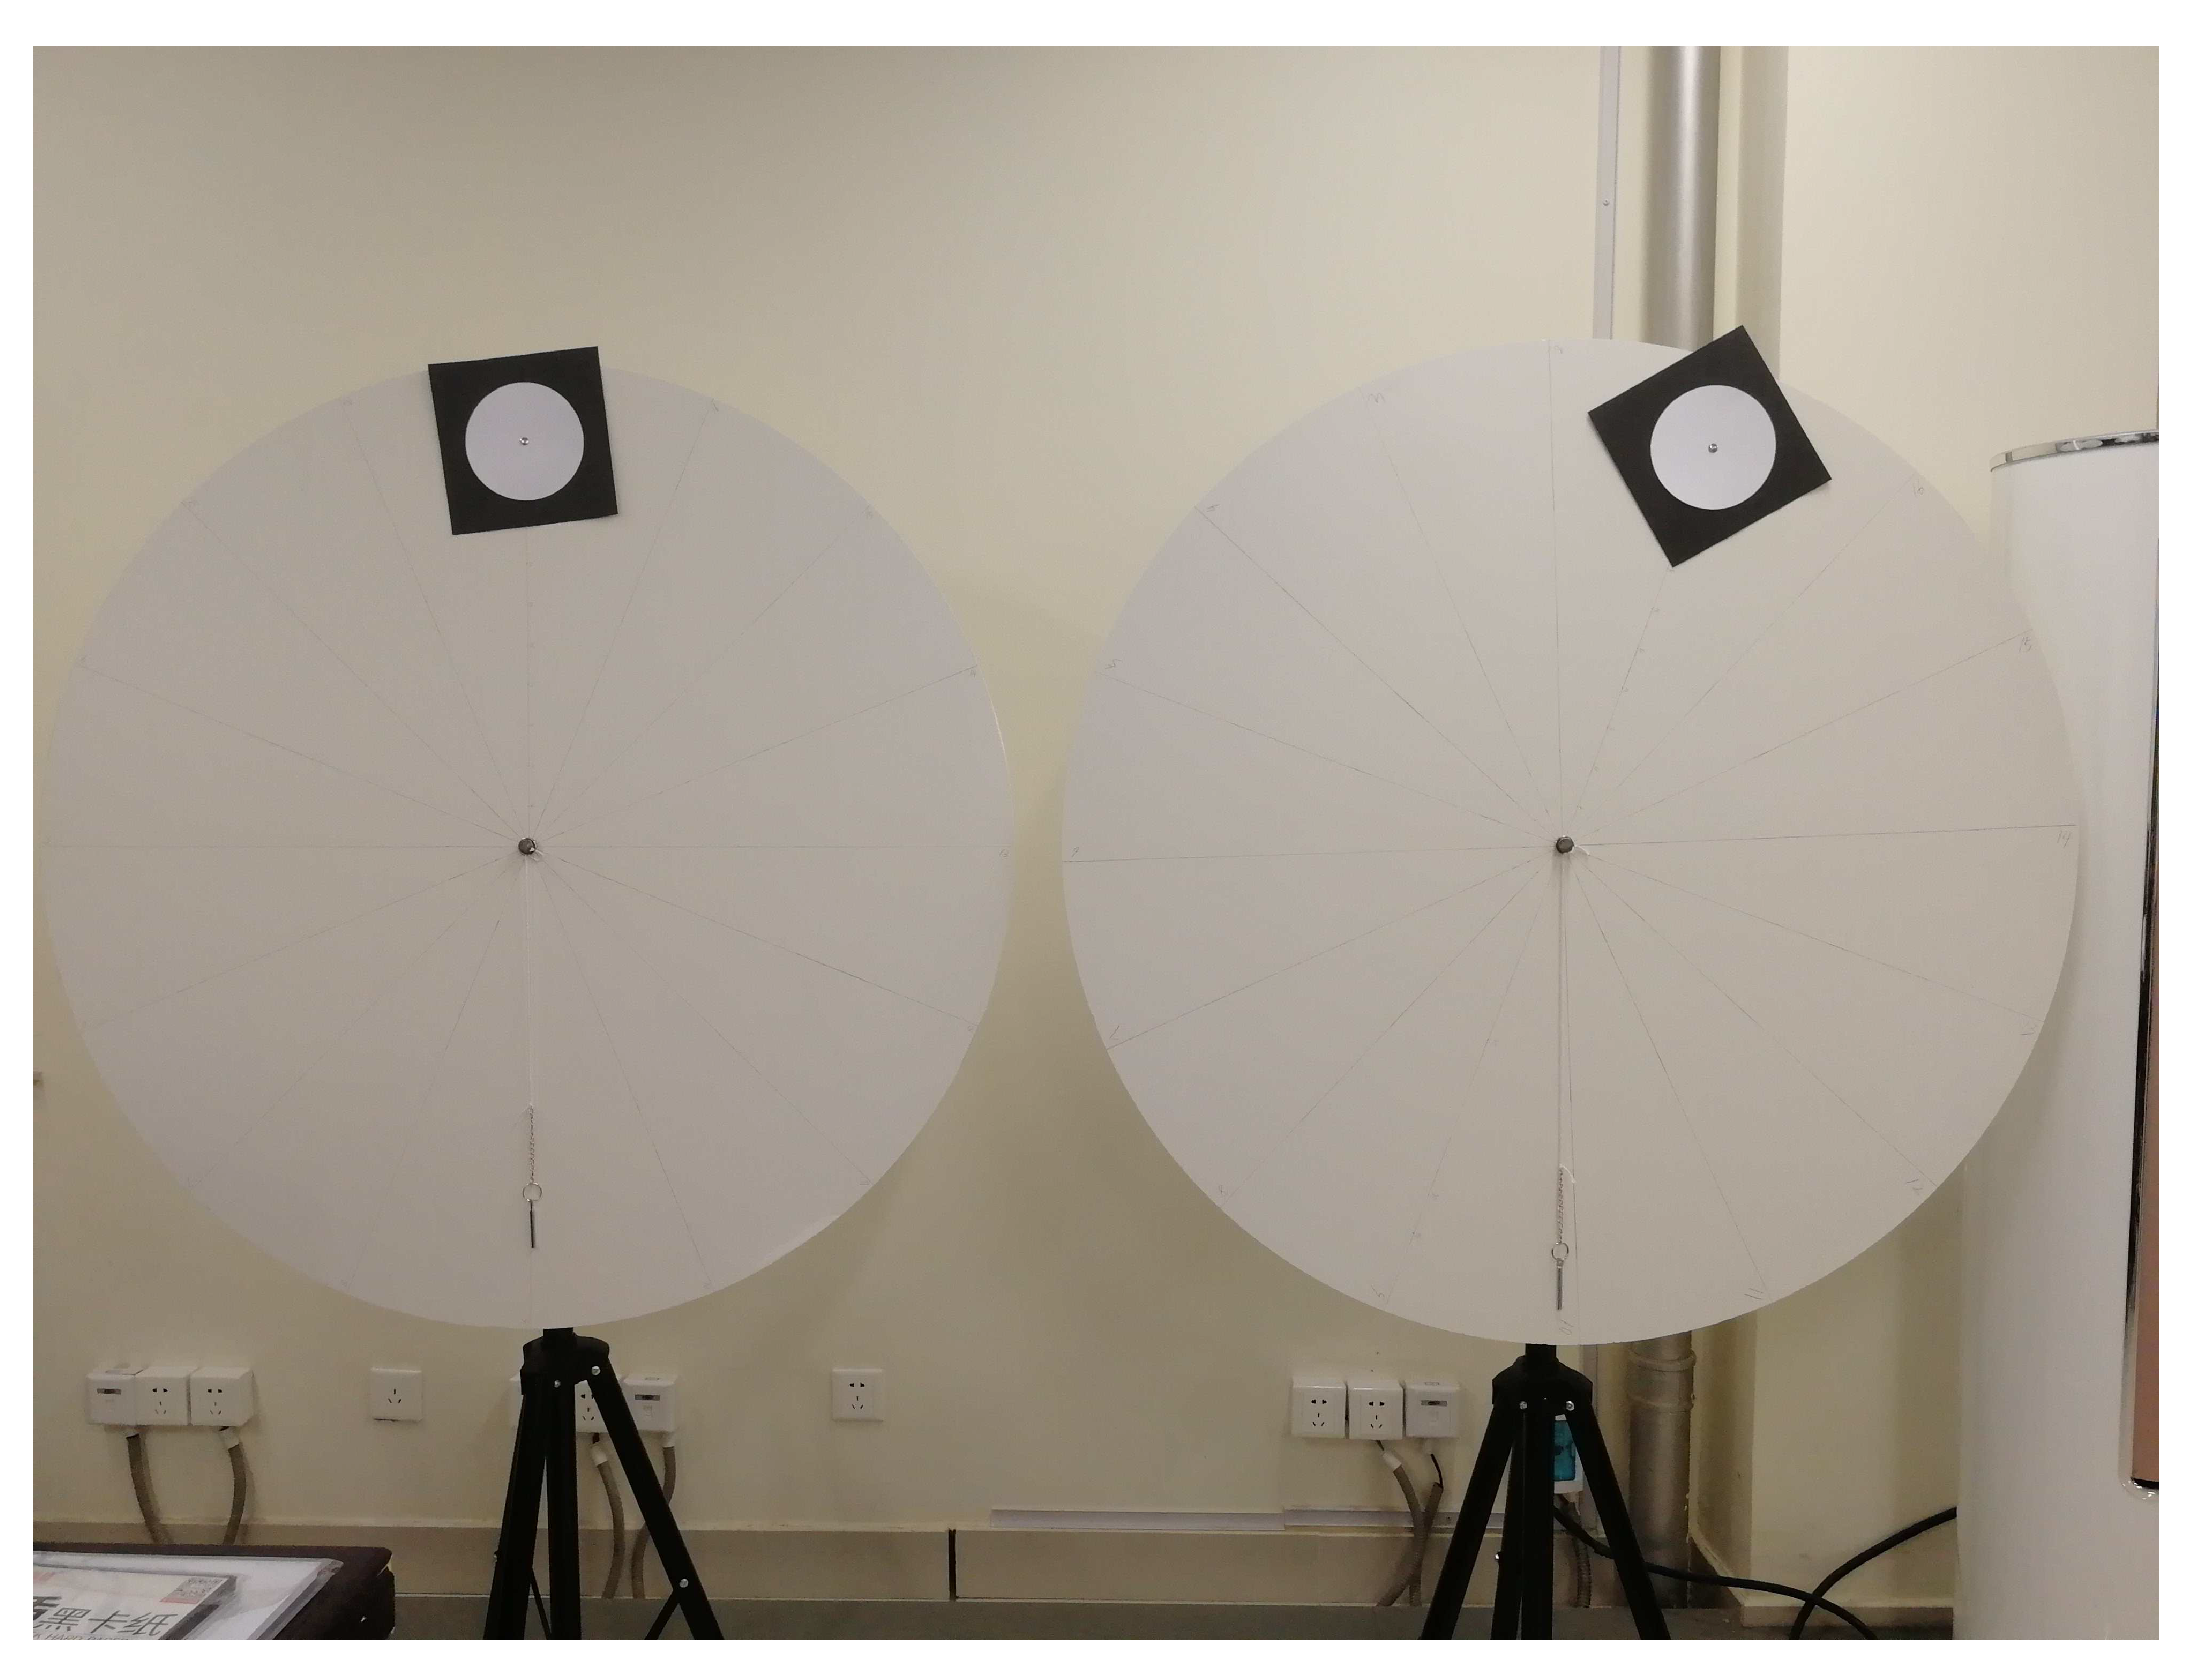
In this experiment, the algorithm in this paper was achieved by C++ language. We bought the CCD camera and the turntables and built a real-time displacement monitoring system.
The experimental principle is shown in
Figure 12. The large circle is a turntable and its background can be any. The right side of the turntable is the target board. Assuming that the distance between the center of the target board and the center of the turntable is
r, the turntable is divided into 16 equal parts according to the angle so each angle is
. Assuming that the rotation angle is
, the starting position is shown in
Figure 12 and the turntable is rotated in a counterclockwise direction. Assuming that the center of the turntable is the origin of the coordinate, the
x-axis is the horizontal direction and the
y-axis is the vertical direction, the coordinate of the center of the target board is
. The initial coordinate of the center of the target board is
so the theoretical displacement of the target board rotated for one circle with the turntable is
. In this experiment,
mm, the number of monitoring targets is 2, the radius of the target boards is 70 mm, the displacement monitoring distance is 10 m, the parameters of the CCD camera are shown in
Table 4, and the results of the real-time displacement monitoring experiment are shown in
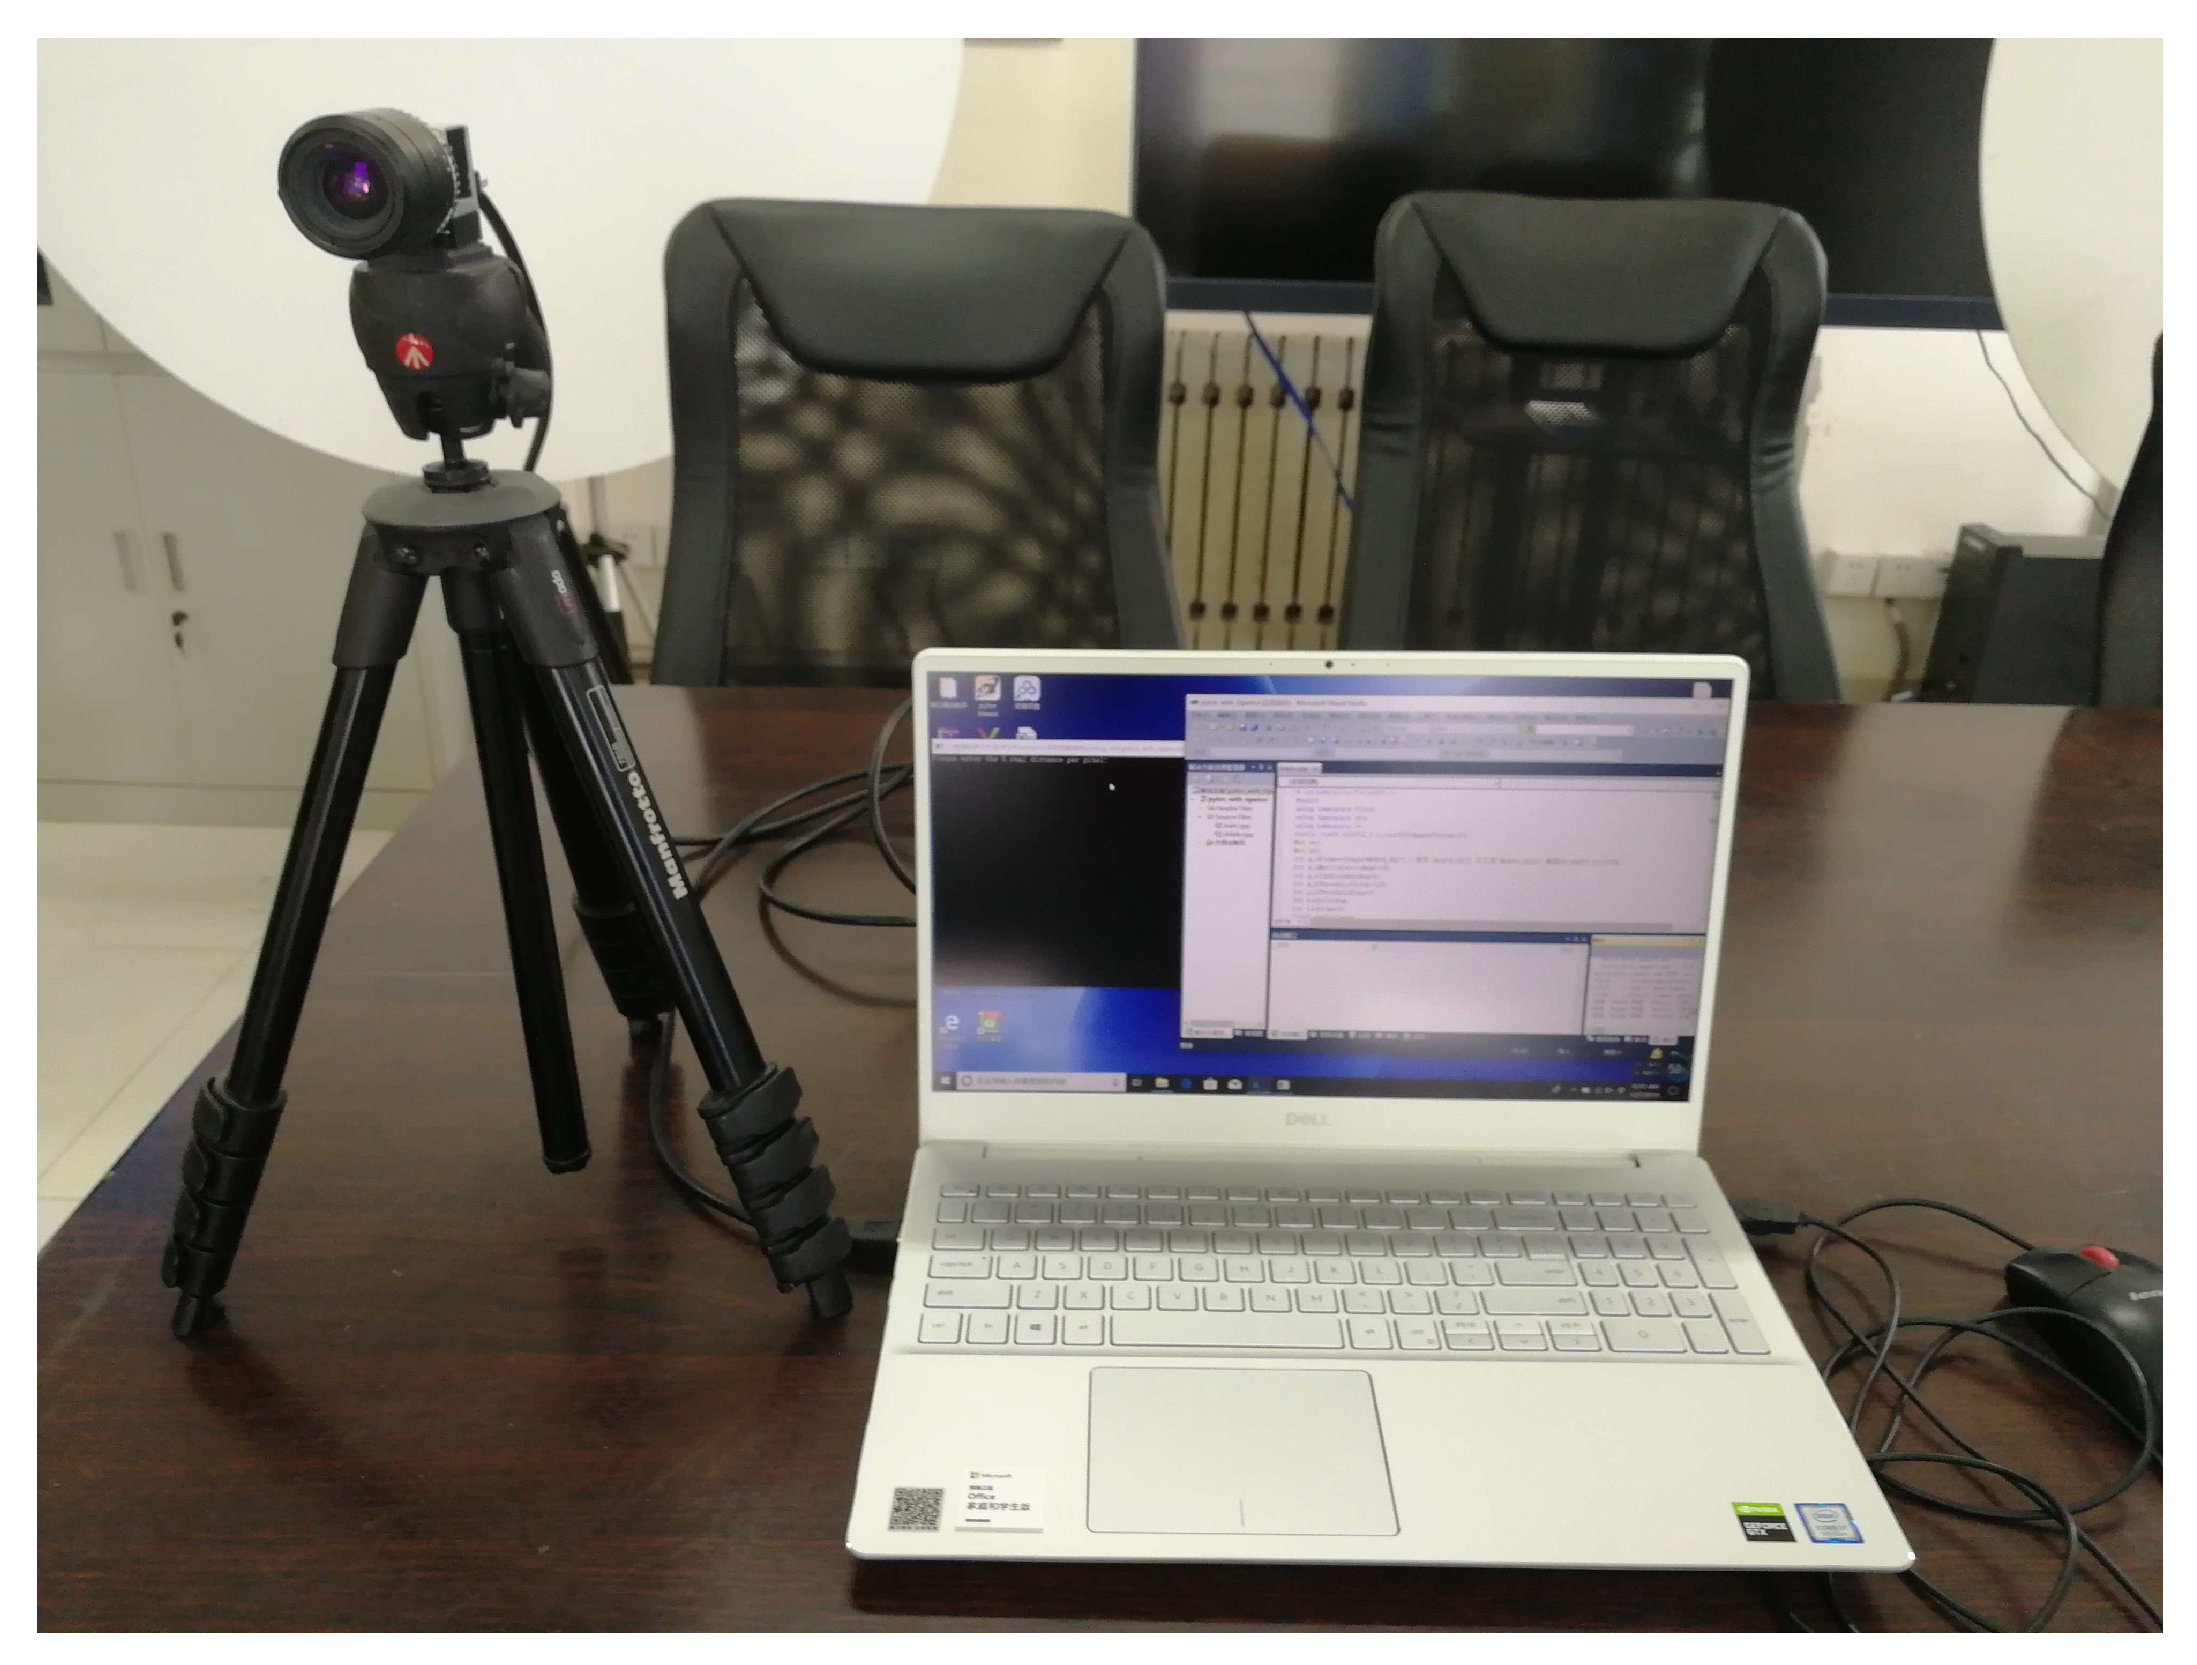
Table 5. According to the calculation, the average error of the experiment is 3 mm, which verifies the effectiveness and reliability of the proposed algorithm. The CCD camera equipment is shown in
Figure 13, and the turntable equipment is shown in
Figure 14.


