Abstract
Steganalysis is used for preventing the illegal use of steganography to ensure the security of network communication through detecting whether or not secret information is hidden in the carrier. This paper presents an approach to detect the quantization index modulation (QIM) of steganography in G.723.1 based on the analysis of the probability of occurrence of index values before and after steganography and studying the influence of adjacent index values in voice over internet protocol (VoIP). According to the change of index value distribution characteristics, this approach extracts the distribution probability matrix and the transition probability matrix as feature vectors, and uses principal component analysis (PCA) to reduce the dimensionality. Through a large amount of sample training, the support vector machine (SVM) is designed as a classifier to detect the QIM steganography. The speech samples with different embedding rates and different durations were tested to verify their impact on the accuracy of the steganalysis. The experimental results show that the proposed approach improves the accuracy and reliability of the steganalysis.
1. Introduction
Steganalysis and steganography are a pair of game relationships. Just like cryptanalysis and cryptography, they are opponents, but they are closely related and complement each other. Steganography is an important branch of information hiding technology. It embeds the secret information into the carrier (such as text, image, voice, video, etc.) according to a certain method, and transmits the confidential information to the receiver without being perceived by the third party, and completes the secret information communication. Steganography not only guarantees that secret information is transmitted securely, but also ensures the integrity of the carrier. On the contrary, steganalysis detects whether the carrier contains secret information, which can block the transmission of illegal information and ensure communication security.
With the rapid development and widespread application of steganography, it has been used by illegal criminals on the Internet, infringing individual privacy and endangering social security. For example, while voice over internet protocol (VoIP) brings convenience to people’s lives, it is also used by illegal steganography users for cybercrime (to deliver illegal information via VoIP) [1]. Under such a circumstance, this paper conducts steganalysis of the secret concealment information in the coding standard G.723.1 that commonly used in VoIP, and presents a steganalysis method based on quantization index modulation (QIM).
In the method of implementing steganography using an encoder, it is particularly preferred to adopt QIM. The reasons are as follows [2,3].
i. QIM steganography combines its own quantization with vector quantization in the process of speech coding. Encoding and concealing are integrated and completed at the same time, which forms the perfect hiding of secret information and greatly reduces the coding delay. In particular, the complementary neighbor vertex-quantization index modulation (CNV-QIM) algorithm was proposed by Xiaobo from Tsinghua University, and the information steganography performance is higher than the QI algorithm.
ii. Grouping the quantized vector codebooks and then performing QIM steganography can minimize distortion and ensure hidden voice quality. In view of the above reasons, the speech effect based on QIM steganography is very ideal, and it is very difficult to analyse its steganography.
Existing research work on steganalysis of speech encoders has achieved a lots results. In particular, the teams of Professor Li Songbin and Professor Huang Yongfeng of Tsinghua University have conducted a lot of research on speech coding steganography analysis for VoIP. They obtained some progress in G.729 [2] and G.723 [3] steganalysis. Since QIM steganography inevitably causes changes in the statistical characteristics of speech coding, steganalysis can be performed using this change. Therefore, the research in this paper is a steganalysis of the changes of some statistical features caused by QIM steganography in G.723.1 speech coding.
The rest of the paper is organized as follows: Previous related work is reviewed in Section 2. The change of the index distribution characteristics before and after QIM steganography are discussed in Section 3. In Section 4, we study the quantization method of index distribution characteristics and use PCA to reduce the dimensionality and design the SVM classifier. Experimental results and discussion are shown in Section 5. Finally, concluding remarks are given in Section 6, the following research work is also introduced in this section.
2. Related Works
The information hiding method based on QIM [4] was first proposed by Brian Chen and Gregory W. Wornell in 2001. The embedded domain classification QIM belongs to the hidden algorithm of the transform domain. It has the characteristics of small embedding capacity, small distortion, easy implementation, and good real-time performance. It was first used in image digital watermarking, and then gradually extended to image, speech steganography and steganalysis.
In terms of transforming domain, Gao et al. [5] analysed the transform domain coefficient histogram of audio after QIM steganographic, constructed the feature vector using the distance of the larger value of the histogram, and established a feature matrix. Then they proposed a QIM blind detection algorithm. The experiment proves that the method is only simple QIM is effective, and the effect of dither modulation QIM (DM-QIM) algorithm is not obvious. Malik et al. [6] observed the interference of QIM steganography on the neighbourhood correlation in the transform domain. They used the kernel density estimation method to detect the statistical variation of the probability density function, and estimated the parameter model. Then they used it for information detection. The steganalysis has a high detection rate, but the amount of calculation is large, and the missed detection rate is also high. Fu et al. [7] proposed a wavelet domain audio steganalysis method based on PCA. The audio signal is decomposed by four-stage discrete wavelet transform, and then the 36 statistical moments of the histogramand the frequency domain histogram for both the audio signal and its wavelet subbands are calculated as features. They used PCA pre-processed statistical features and radial basis functions (RBF) as a classifier. The scheme not only effectively reduces the dimensionality of the feature vector, but also simplifies the design of the classifier, and maintains the detection performance. It can be used to detect the wavelet domain LSB embedding of the audio signal, the QIM method and the addition method (AM). Liu et al. [8] proposed a general steganalysis method based on Fourier spectrum statistics and Mel cepstrum coefficients, derived from the second order derivative of the audio signal. Then he also designed a Steganalysis way based on wavelet transform spectrum and Mel Cepstrum. Because the speech is compressed and encoded, the distortion is serious, and the characteristics of the carrier speech cannot be effectively reflected. Therefore, the detection rate is not high, but the detection of the least significant bit steganography is good. In addition, the literature [9,10] also propose a blind detection method for steganography of images and audio from different angles, which achieve better detection results.
Support Vetor Machine (SVM) were proposed by Corinna Cortes and Vapnik in 1995 and are widely used in the steganalysis because of their advantages as classifiers. Some researchers have improved the vector machine and achieved better steganalysis. Wang et al. [11] proposed a steganalysis method based on the optimized feature weighted SVM. The feature weighted kernel function is used to construct the feature weighted SVM. It improves classification accuracy of the SVM classifier by optimizing the feature selection and weighting processing. It effectively reduces the time complexity of the algorithm and has an efficient steganalysis capability. Chen et al. [12] proposed a steganalysis method based on improved SVM. This method improves the steganalysis speed and detection accuracy of images. Researchers have combined the steganalysis method with the SVM to improve the efficiency and accuracy. Wang et al. proposed an audio steganalysis method based on fuzzy C-means clustering and single-class SVM [13], which further solved the limitations of some potentially unknown steganography methods. The method first extracts the features of the audio that need to be trained, performs fuzzy C-means clustering on these features, and finally trains and detects through a plurality of hypersphere single-class SVM. Experiments show that the method is suitable for steganalysis of unknown steganography methods, and it also improves the accuracy of steganalysis compared with other clustering methods. The literature [14,15] also propose detection method based on SVM for steganography from different angles, they also improve a lot in the detection rate. Li Songbin et al. [2] studied the significant changes caused by QIM steganography in G.729. It was found that the steganography would change the quantization index of the linear predictive coding (LPC) filter in the code stream. The statistical model is designed to realize the most feature extraction of the distribution characteristics of codewords. Combined with SVM, an integrated classifier system for steganographic detection is constructed to realize the fast and effective detection. Another study analyses that QIM steganography changes the distribution characteristics of phoneme in compressed speech streams. It constructs a phoneme vector space model and a phoneme state transition model, quantifies the phoneme distribution characteristics, and builds the steganographic detector [3,16] using SVM. The method has high detection accuracy. It also can extract features in the compressed domain without decoding. It saves time for decoding speech. According to the changes of the characteristics after steganography, different feature selection may have different detection effects. Li et al. [17] found the pitch modulation steganography will change the correlation characteristics of the adjacent speech frame adaptive codebook in the compressed speech stream. In order to quantify the correlation characteristics, the codebook correlation network model is designed. Finally, a steganographic detector is constructed based on the obtained feature vector and SVM, it realizes fast and effective detection of pitch modulation information hiding.
In a word, the steganography method based on QIM has the advantages of simple implementation, low algorithm complexity, small speech distortion, good concealment and robustness, etc., which is more and more favored by researchers. Steganalysis methods have emerged one after another, but the research progress is still relatively backward and needs to be continuously improved. Based on the above research background, this paper analyses the long-term characteristics of index distribution and the correlation between indexes.
The contributions and novelty of this study are as follows. A method of speech steganalysis in G.723.1 based on QIM is proposed to improve the accuracy and reliability of the steganalysis algorithm. The algorithm of this paper mainly focuses on the steganalysis of the CNV-QIM method with good steganography effect. After constructing the classifier with PCA dimensionality reduction and SVM, the information steganography of different durations and different embedding rates is analysed. A first-class detection (ACD) and second-class detection (SCD) are proposed to prove the efficiency of the steganalysis. Finally, the accuracy and reliability are improved.
3. The Effect of Index Distribution
QIM steganography is related to the linear vector quantization of speech coding, so the linear predictive vector quantization process is first described.
3.1. Vector Quantization of G.723.1
When being encoded, the speech signal is first passed through the high-pass filtering, frame segmentation and other processing processes. Then, the Levinson–Durbin algorithm is used to calculate 4 sub-frames of each input speech frame. It gets 4 sets of 10th order linear predictive coding (LPC) coefficients. The synthesis filter of LPC is defined as Equation (1) [3].
where is the j-th order LPC prediction coefficient, and is a subframe index with values of 0, 1, 2, and 3.
In order to facilitate quantization, LPC coefficient is usually converted into line spectrum pair (LSP) coefficient which also known as line spectrum frequency (LSF). The LSP coefficients are divided into two 3-dimensionalityal vectors and one 4-dimensionalityal vector. The three split vectors are respectively recorded as , , and , and the corresponding codebooks are , , and . Each codebook has a codeword space of size . According to the minimum error criterion, each split vector selects the optimal codeword from corresponding codebook. The optimal codeword is the codeword index, which is the quantized result.
3.2. QIM Steganography
The core of QIM steganography is the codebook division algorithm. It divides the codebook into several parts, and each part is mutually exclusive. A codebook is which is divided into subcodebooks . The subcodebook satisfies the conditions in Equation (2).
CNV-QIM algorithm was first used in QIM steganography in literature [18], which divided into and . CNV-QIM is a hidden method with good concealment. When the embedded information bits is “0” and “1”, the subcodebooks for finding the optimal codewords are and respectively. At the receiving end, by judging the codebook or , you can know the embedded information “0” or “1”. The binary codebook flow chart is shown in Figure 1 [19].
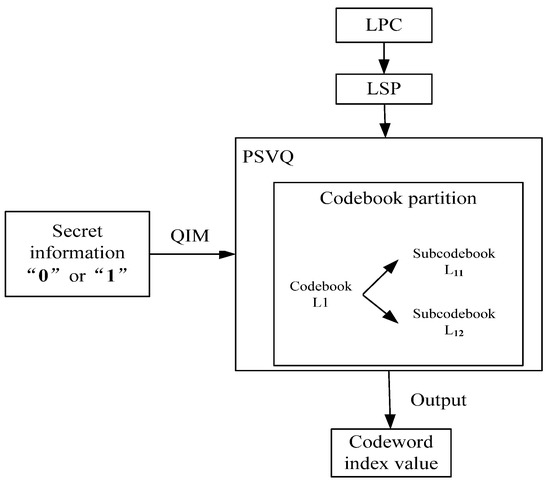
Figure 1.
Binary codebook flow chart.
For the G.723.1 speech coder, , denote two different codewords of the codebook . , are positive integers, . In CNV-QIM algorithm, and are divided into two different subcodebooks in PSVQ (Predictive Split Vector Quantization). They are marked as 0 and marked as 1, and the codeword and its neighbour vertices must be located in two subcodebooks respectively, which reduces distortion due to steganography.
3.3. Codewords Distribution Features
CNV-QIM steganography changed the search range of codewords. When steganography is not performed, the split vector searches for an optimal codeword in one codebook. After steganography, the codebook is divided into two subcodebooks. The split vector searches for the optimal codeword in its corresponding subcodebook. The corresponding codeword index will also change. If N speech frames in G.723.1 are input, the quantization index sequence (QIS) in this speech output can be expressed as Equation (3).
In Table 1, each column of data represents three QIS of one frame of speech output, and each row of data represents the value of the QISi of N-frame speech.

Table 1.
Quantized index sequence.
Steganography will change QIS of speech. In order to show the change of QIS more intuitively, we select 100 frames of speech. The “cover” sample represents the carrier sample before steganography, and the “stego” sample represents the carrier sample after speech steganography. We take QIS1 as an example to demonstrate the results are shown in Figure 2.
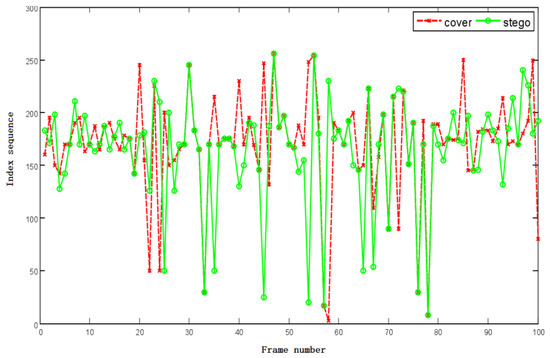
Figure 2.
Quantization sequence distribution.
It can be seen that the index values of the “cover” and the “stego” are not completely coincident. The points with the same position indicate that the optimal code word for both is the same, and the points with different positions indicate that the optimal code words are different. Some points have small differences, and the location of some points is very different. This represents the degree of difference in the output index values.
In Figure 2, the changes in the QIS are manifested in following two aspects.
- The probability of each index value between 0 and 255 has changed on the vertical axis.
- From the view of the horizontal axis, the neighbour frames have a certain correlation duo to the speech signal has short-term invariance.
Through the statistical knowledge, the distribution characteristics of the index values are quantified. The QIM steganography can be analysed.
4. Quantitative Model
QIM steganography changes the frequency of occurrence of index values and the correlation of index values. Index distribution characteristics is good for steganalysis [3].
4.1. Indexed Probability Model
The QIS of N frame speech is denoted as
Any one of the index values in the index sequence can get any integer value between 0 and 255, which can be expressed as
where indicates the number of occurrences of the index in N speech frames. It can calculate the probability distribution matrix A according to the index.
The A is N × 256, which represents the probability of the index value. It shows the long-term characteristics of the index distribution.
4.2. Transition Probability Matrix Model
According to the speech generation model and the statistical law, the process of selecting the optimal code word can be regarded as a discrete time random process. Assuming that each code word is related to its previous code word. The relationship is defined as follows [3].
The speech signal has short-term stability in a certain period of time (10~30 ms). There is also a certain correlation between adjacent sub-frames. The QIS can be regarded as a first-order Markov chain, and the correlation is quantized by using the Markov transition probability [3].
The Markov transition probability mij is defined as
where . After the transition probability is obtained, the Markov transition probability matrix M can be expressed as
M characterizes the correlation between indexes, and the dimensionality of the M is 256 256.
4.3. PCA Dimensionality Reduction
The steganographic detection feature has too many dimensionalities, which not only increases the classifier training time and prediction time, but also even causes “dimensionality disaster” [19]. At the same time, the training error will be too small which is not conducive to the classifier to estimate the statistical properties of the sample. In order to greatly reduce the amount of calculation, The A and M are subjected to dimensionality reduction by the PCA.
The principal component analysis method first appeared in 1901 and was originally applied to non-random variables. With the advancement of science and technology and the development of computer software, the principal component analysis method has been extended to more fields, such as system evaluation, principal component regression analysis, selection of variable subsets, etc. PCA is based on the loss of information as little as possible, and uses the idea of dimensionality reduction to manage a large number of variables with correlation, which greatly reduces the amount of calculation, and the obtained variables are more effective for analyzing problems. These variables that reflect most of the characteristics of the original data are called principal components, and the information contained in each principal component does not overlap each other. The PCA calculation step [7] is as follows.
Primitive matrix
Calculating the covariance matrix
where
The covariance matrix C can be expressed as
where
The eigenvalues of C and the corresponding eigenvectors are calculated. The feature vector here is the principal component. The selection of principal components is based on the contribution rate introduced. The cumulative contribution rate is required to be more than 85%, which can reflect most of the characteristics of the original data. It is found through experiments that when the number of selected feature values is 120, the contribution rate can reach more than 85%.
In order to test the impact of PCA dimensionality reduction, we carry out the following experiments. We randomly select 100 frames of speech and respectively calculate the change rate of A and M. The results are expressed in γ1 and γ2 respectively. The change rates are shown in Figure 3 [18].

Figure 3.
Change rate γ1 and γ2.
As can be seen from Figure 3, the rate of change γ1 and γ2 are both above 65%. Obviously, the dimensionality matrix is very sensitive to QIM steganography. It is fully shown that the matrix not only makes the calculation work simple but also can well reflect the long-term characteristics and the correlation after the dimensionality reduction.
5. Experiment and Results Analysis
In order to verify the method proposed in this paper, we built a test environment and tested it.
5.1. Experimental Environment
The experiment environment is shown in Figure 4. Sample data is encoded by the G.723.1 speech encoder and steganographed by CNV-QIM. After the packet is sealed, it is transmitted to the receiving end via VoIP network. On the receiving end, the corresponding feature vector is constructed. The classification model is obtained by learning and training a large number of common carrier samples and those containing dense carrier samples. The classification results are obtained [20].
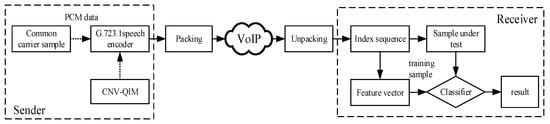
Figure 4.
Experimental environment.
The computer system used in experiment is Window7 Professional Service Pack 1, and the processor parameter is Intel(R) Core(TM) i3-6100 CPU@3.70 GHz. Software mainly used are Visual Studio 2012 and Matlab 2016 software. Embedding secret information uses the G.723.1 speech coder with the method of [21]. The experimental sample includes five categories, namely Chinese male voice (CM), Chinese women voice (CW), English male voice (EM), English women voice (EW), and hybrid voice (Hybrid). Samples of each category are prepared for a total of 100 speech segments of 9 seconds and a total of 500. After steganography, the total number of samples reaches.
5.2. Classifier Selection
Classifiers can be divided into discriminating classifiers and generating classifiers, and the discriminant classifiers are more flexible in the identification of features and the detection speed is faster. Discriminant methods classify samples based on probability density or discriminant functions, such as SVM. SVM is based on statistical learning theory and follows the principle of minimizing structural risks. It first trains samples to obtain a set of classification features, and then judges the actual input to minimize the error from the ideal classification result, which can be solved smoothly Regression problems, classification problems in pattern recognition, discriminant analysis, etc. It is widely used in subject areas such as prediction and comprehensive evaluation.
This paper uses SVM as the classifier to detect steganography. The classifier will judge sample category based on the classification model. And the Lib-support-vector-machine(LIBSVM) software package developed by Lin [22] from Taiwan University is used. The learning process and decision process of the classifier are shown in Figure 5.
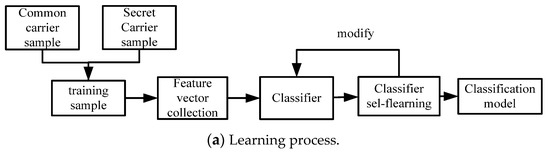
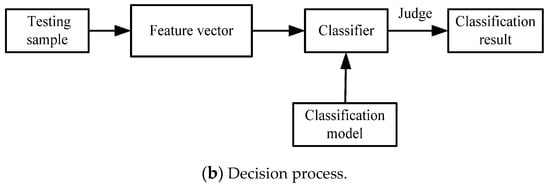
Figure 5.
Support vector machine detection process.
Experiments were conducted on five categories of Chinese male voice (CM), Chinese women voice (CW), English male voice (EM), English women voice (EW), and hybrid voice (Hybrid). For each of the above data sets, 80% of the “original carrier” and the corresponding “density carrier” samples were selected for the training sets, and the remaining 20% of the samples were used as the test sets. To test the performance of the steganalysis algorithm, the specific process is shown in Figure 6 [18].
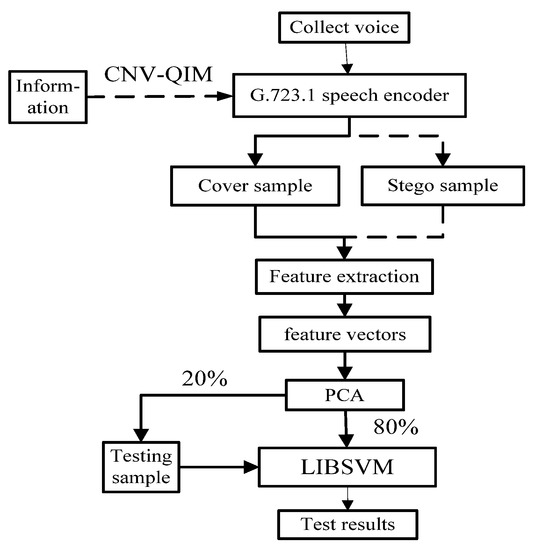
Figure 6.
Steganalysis process.
5.3. Results Analysis
The steganalysis experiments are performed on five kinds of speech segments: CM, CW, EM, EW and Hybrid:
- Through the true positive rate (TPR), the false positive rate (FPR) and the probability (Pr), ACD and SCD are also performed on the five types of speech segments. The experimental results are compared with the steganalysis results of the detection based on Mel frequency cepstrum coefficient (MFCC) method in the literature [8].
- The paper analyzes the ACD and SCD of speech segments which includes different durations and different steganographic embedding rates. At the same time, the paper also analyzes the advantages and disadvantages of ACD and SCD to detect these two situations.
5.3.1. Performance
This paper uses TPR, FPR, and Pr to evaluate the accuracy and reliability of the steganalysis algorithm. The higher the TPR, the lower the FPR, and the higher the Pr, the better the accuracy of the steganalysis method.
CNV-QIM is a hidden method with good concealment. In order to test the detection and analysis performance of the CNV-QIM steganography algorithm, Table 2 shows the results of PCA pretreatment. The dimensionality feature vector is reduced from 256 to 120, and the reduction in the number of features simplifies the design of the classifier. We choose a voice message with an embedding rate of 100%. In this paper, the probability distribution matrix and the transfer probability matrix of G.723.1 speech were calculated to obtain the average TPR, FPR and Pr of CM, CW, EM, EW and Hybrid, respectively. As is shown in Table 3. It can be seen that the ACD and SCD were all over 93%, and the FPR was all less than 8%. This proves that the method proposed in this paper is very effective. For the five types of samples, Pr is all over 93%, which proves that the algorithm has good accuracy and reliability [23,24].
Table 2.
PCA test results (%). FV denotes feature vector, and DR expresses detection rate.
Table 3.
Average values of a first-class detection (ACD) and second-class detection (SCD) results (%).
Steganalysis method based on Fourier spectral statistics and Mel cepstrum coefficients for second derivatives of audio signals is proposed in the literature [8] (MFCC). This kind of steganalysis method is of great importance in recent years. The method can achieve better detection results for many speech steganography algorithms. CNV-QIM is a hidden method with good concealment. In order to show the superiority of the method in this paper, this paper makes an experimental comparison of these two algorithms. The comparison results are shown in Figure 7.
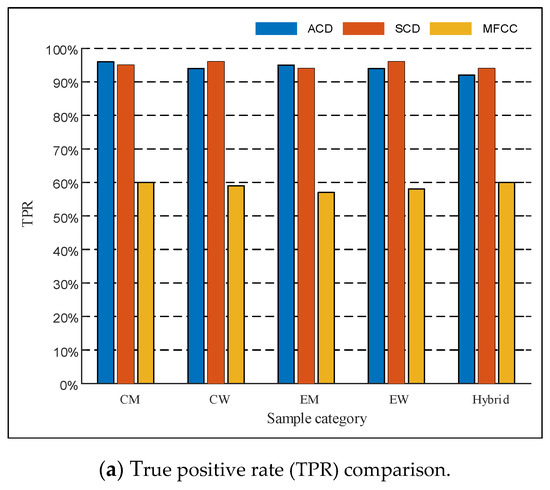
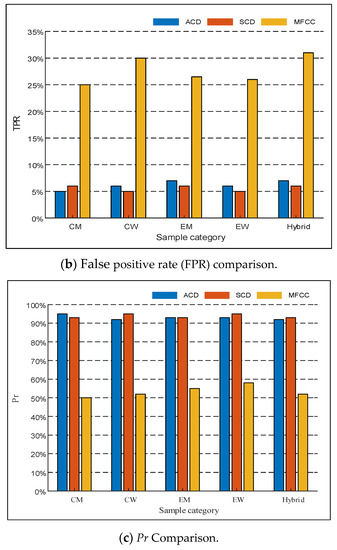
Figure 7.
Comparison of detection algorithms.
We can see from the above figure that the TPR and Pr of both ACD and SCD are higher than the MFCC method, and the TPR of ACD and SCD is significantly lower than the MFCC method, it is indicated that the method proposed in this paper is better in accuracy and reliability. Comparing the above three figures, another advantage of the method of this paper is that it can adapt to different languages. We know that our method is superior to MFCC in terms of performance in the face of different sets of voice data.
5.3.2. Embedding Rate
Since different embedding rates during information steganography will affect the result of steganalysis, we use five different types of embedding rates for 10%, 30%, 50%, 80%, and 100%. The average detection rate (%) of ACD and SCD is shown in Table 4.
Table 4.
Average detection rates for ACD and SCD of different embedding rates (%).
In order to more intuitively compare the performance of the two types of detection, the relationship between the average detection rate of the five data sets and the embedding rate of the speech segment is shown in Figure 8.
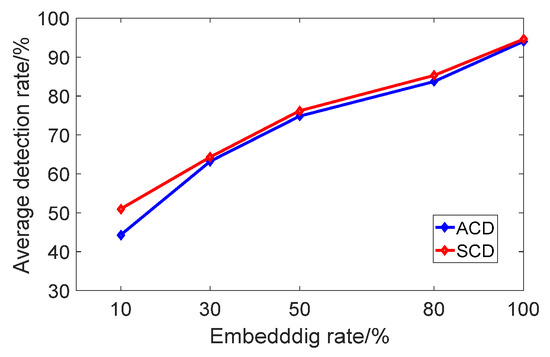
Figure 8.
Average detection rate with different embedding rates.
Figure 8 shows that the average detection rate of ACD and SCD is proportional to the embedding rate. The higher the embedding rate, the higher the accuracy. When the embedding rate is lower than 30%, the average detection rate of ACD is significantly lower than SCD. This shows the steganalysis performance of SCD is better. When the embedding rate is higher than 30%, the detection effect of ACD and SCD is equivalent. In the actual analysis, one of them can be used for analysis, which not only guarantees the accuracy but also can improve the detection efficiency.
5.3.3. Voice Duration
In order to test the detection effect for different duration speech, speech segments with 100% embedding rate are prepared for each type of sample. Experiments are carried out for different durations. The average detection rate of ACD and SCD is shown in Table 5 [21].
Table 5.
Average detection rates for ACD and SCD (%).
In order to more intuitively compare the performance of the two types of detection, Figure 9 shows the relationship between the average detection rate of the five data sets and the duration of the speech segment. It can be seen from Figure 9 that the longer the duration, the higher the average detection rate of ACD and SCD. The longer the speech duration, the more embedded secret information. This results in a significant change in A and M, and thus the detection rate is higher. When the length of the test reached 3 s or more, the average accuracy of ACD reached more than 85%. When the length reached 2.4 s or more, the average accuracy of SCD reached more than 85%. It shows that ACD is more sensitive to different duration, and SCD is more suitable for detection of different durations.
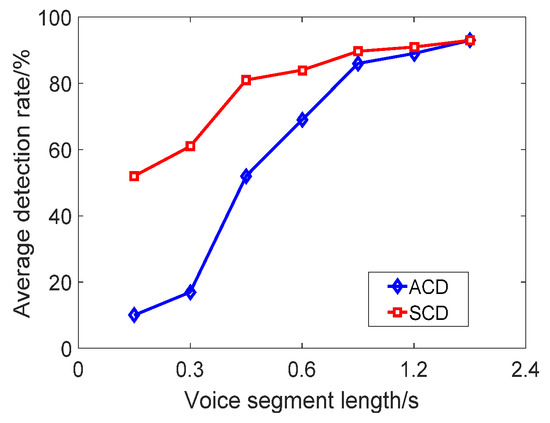
Figure 9.
Average detection rate of speech steganography with different duration.
6. Conclusions
In this paper, a method of steganalysis in G.723.1 speech information based on QIM is proposed. The method analyzes the index distribution characteristics after CNV-QIM steganography. Dimensionality reduction is carried out by PCA which greatly reduces the calculation and makes the classifier more effective in distinguishing features. Experimental results show that this method improves the accuracy and reliability of CNV-QIM steganography analysis. At the same time, the influence of different embedding rate and different duration on the detection results was compared. The higher the embedding rate, the higher the detection accuracy. The longer the time, the higher the accuracy. In practical application, most of the speech information with different length and different steganographic embedding rate is involved. Therefore, how to improve the accuracy and reliability of speech steganalysis with low length and low embedding rate still faces many challenges. This is also the focus of our next research.
Author Contributions
Z.W., R.L., P.Y. and C.L. conducted the research along with analysis and results. All authors have read and agreed to the published version of the manuscript.
Funding
This work was supported in part by the joint funds of National Natural Science Foundation of China and Civil Aviation Administration of China (U1933108), the Key Program of Natural Science Foundation of Tianjin (17JCZDJC30900), the Scientific Research Project of Tianjin Municipal Education Commission (2019KJ117), and the Fundamental Research Funds for the Central Universities of China (3122018D34007, 3122018C003).
Conflicts of Interest
The authors declare no conflict of interest.
References
- Zhang, T.; Wang, Y.M. Information hiding technology and its application security. ZTE Commun. 2002, 8, 42–45. Available online: https://www.zte.com.cn/china/about/magazine/zte-communications/2002/2/cn_307/149979.html (accessed on 19 January 2020).
- Li, S.B.; Sun, D.H.; Yuan, J.; Huang, Y.F. A compressed speech stream steganalysis method based on codeword distribution characteristics in G.729A. Chin. J. Electron. 2012, 40, 842–846. (In Chinese) [Google Scholar]
- Li, S.B.; Huang, Y.F.; Lu, J.C. Low-rate speech coding QIM steganographic detection based on statistical model and SVM. Chin. J. Comput. 2013, 36, 1168–1176. Available online: http://cjc.ict.ac.cn/qwjs/view.asp?id=3865 (accessed on 19 January 2020). [CrossRef]
- Chen, B.; Wornell, G.W. Quantization Index Modulation: A Class of Provably Good Methods for Digital Watermarking and Information Embedding. IEEE Trans. Inf. Theory 2001, 47, 1423–1443. [Google Scholar] [CrossRef]
- Gao, H.Y. A Blind Steganalysis Algorithm of QIM-Based Hiding. In Proceedings of the 2008 International Conference on Intelligent Information Hiding and Multimedia Signal Processing, Harbin, China, 15–17 August 2008; pp. 273–276. [Google Scholar]
- Malik, H.; Subbalakshmi, K.P.; Chandramouli, R. Steganalysis of QIM-based data hiding using kernel density estimation. In Proceedings of the 9th workshop on Multimedia & Security, Dallas, TX, USA, 20–21 September 2007. [Google Scholar]
- Fu, J.W.; Qi, Y.C.; Yuan, J.S. Wavelet domain audio steganalysis based on statistical moments and PCA. In Proceedings of the 2007 International Conference on Wavelet Analysis and Pattern Recognition, Beijing, China, 2–4 November 2007; pp. 1619–1623. [Google Scholar]
- Liu, Q.Z.; Sung, A.H.; Qiao, M. Temporal Derivative-Based Spectrum and Mel-Cepstrum Audio Steganalysis. IEEE Trans. Inf. Forensic. Secur. 2009, 4, 359–368. [Google Scholar]
- Sun, J.F.; Tang, G.M. Blind detection of QIM steganography for audio jitter modulation. Comput. Eng. Appl. 2011, 47, 74–76. Available online: http://cea.ceaj.org/CN/10.3778/j.issn.1002-8331.2011.01.021# (accessed on 19 January 2020).
- Zhong, S.P.; Xu, Q.F.; Guo, W.Z.; Liao, B. Blind steganographic detection using Hilbert scan sequence short weight code statistics. J. Commun. 2013, 34, 51–60. Available online: http://www.infocomm-journal.com/txxb/CN/Y2013/V34/I1/6 (accessed on 19 January 2020).
- Wang, H.T.; Zhang, Z.; Yang, X.Y.; Lin, Z.Q. A kind of steganalysis method based on optimized feature weighted SVM. Appl. Res. Comput. 2013, 30, 2105–2107. Available online: http://www.arocmag.com/article/01-2013-07-046.html (accessed on 19 January 2020).
- Chen, X.N.; Zhang, M.Q.; Ma, L. A method of steganalysis based on improved SVM. Comput. Eng. Appl. 2010, 4, 97–99. Available online: http://cea.ceaj.org/CN/abstract/abstract16983.shtml# (accessed on 19 January 2020).
- Wang, Y.J.; Jiang, W.W. A method of steganalysisi based on fuzzy C-means clustering and single class SVM. J. Comput. Appl. 2016, 36, 647–652. Available online: http://www.joca.cn/CN/abstract/abstract19092.shtml (accessed on 19 January 2020).
- Chen, G.X.; Liao, Z.S.; Wang, D.S. SVM steganalysis algorithm based on correlation and texture metrics. J. Tsinghua Univ. (Sci. Technol.) 2009, 8, 1233–1236. [Google Scholar]
- Xian, Y.; Pan, F.; Shen, J. Based on feature fusion weighted SVM audio steganographic analysis algorithm. Netw. Secur. Technol. Appl. 2014, 9, 45–46. [Google Scholar]
- Li, S.B.; Tao, H.Z.; Huang, Y.F. Detection of quantization index modulation steganography in G.723.1 bit stream based on quantization index sequence analysis. J. Zhejiang Univ. Sci. C 2012, 13, 624–634. [Google Scholar] [CrossRef]
- Li, S.B.; Jia, Y.Z.; Fu, J.Y.; Dai, Q.X. Pitch modulation information hiding detection based on codebook association network. Chin. J. Comput. 2014, 37, 2107–2117. Available online: http://cjc.ict.ac.cn/qwjs/view.asp?id=4353 (accessed on 19 January 2020).
- Gu, X.Y.; Guo, J.C.; Tian, Y.H.; Li, C.Y. Feature selection algorithm for spatial steganographic detection based on conditional mutual information. J. Tianjin Univ. (Sci. Technol.) 2017, 50, 961–966. Available online: http://journals.tju.edu.cn/zrb/oa/darticle.aspx?type=view&id=201709010 (accessed on 19 January 2020).
- Yin, P.P. Steganalysis Method for G.723.1 Speech Based on Quantization Index Modulation. Master’s Thesis, Civil Aviation University of China, Tianjin, China, 2017. [Google Scholar]
- Wu, Z. Information Hiding in Speech Signals for Secure Communication; Syngress Publishing: Amsterdam, The Netherlands, 2014. [Google Scholar]
- Xiao, B.; Huang, Y.F.; Tang, S.Y. An approach to information hiding in low bit-rate speech stream. In Proceedings of the IEEE GLOBECOM 2008—2008 IEEE Global Telecommunications Conference, New Orleans, LO, USA, 30 November–4 December 2008; pp. 1940–1944. [Google Scholar]
- Chang, C.C.; Lin, C.J. LIBSVM: A library for support vector machines. ACM Trans. Intell. Syst. Technol. 2011, 2, 27. [Google Scholar] [CrossRef]
- Li, S.B.; Jia, Y.; Kuo, C.-C.J. Steganalysis of QIM Steganography in Low-Bit-Rate Speech Signals. IEEE/ACM Trans. Audio Speech Lang. Process. 2017, 25, 1011–1022. [Google Scholar] [CrossRef]
- Tian, H.; Liu, J.; Li, S. Improving security of quantization-index-modulation steganography in low bit-rate speech streams. Multimed. Syst. 2014, 20, 143–154. [Google Scholar] [CrossRef]
© 2020 by the authors. Licensee MDPI, Basel, Switzerland. This article is an open access article distributed under the terms and conditions of the Creative Commons Attribution (CC BY) license (http://creativecommons.org/licenses/by/4.0/).