1. Introduction
Network troubleshooting is a time-consuming task that is most often an iterative process where the same, or quite similar steps need to be executed [
1]. After detecting the issue—sometimes even this is hard to accomplish—we should locate the problem by looking for problematic points in the network. In the best-case scenario, we can locate only one point for the failure and then dig deeper to find out the root cause of the problem. Upon finding the root cause, we should devise a plan to resolve it and check back on the network to find out if it permanently fixed the problem and did not cause any more errors [
1]. Doing this process manually is a tedious job; thus, it is best to use automated methods.
In traditional networks, failure localization is hindered by the heterogeneous nature of equipment used in the network: Data forwarding equipment and middle boxes (that do network address translation (NAT), intrustion prevention system (IPS), intrusion detection system (IDS), firewall, etc. functionalities) can be accessed via their proprietary interfaces. As network middle boxes are replaced with control applications, and switch control interfaces are standardized, the picture gets a bit different in software-defined networking (SDN)-enabled networks, of which OpenFlow [
2] is the most widespread implementation. We can still have hardware failures (e.g., port or link errors) that cause packets to be lost, but configuration errors now arise most probably as results of software-related issues [
3,
4]. In data forwarding equipment, we find firmware errors and control software issues. In the latter cases, we would find missing or incorrect forwarding entries that cause the network to forward packets to unwanted directions. We can only detect these kinds of errors when we have a baseline of the error-free operation. Such a baseline operation can be captured on a live network when it is presumed to be running in a correct state. Another way is to use a formal specification of the network. In both cases, we can test the current network forwarding and compare it with the correct state. The actual forwarding behavior of the network can be observed by passively logging forwarding properties, but actively injecting traffic—the properties of which we can specify—into the network can yield better results [
5]. When active tests do not cause significant increase in network load, they can reveal issues much more quickly and in more detail.
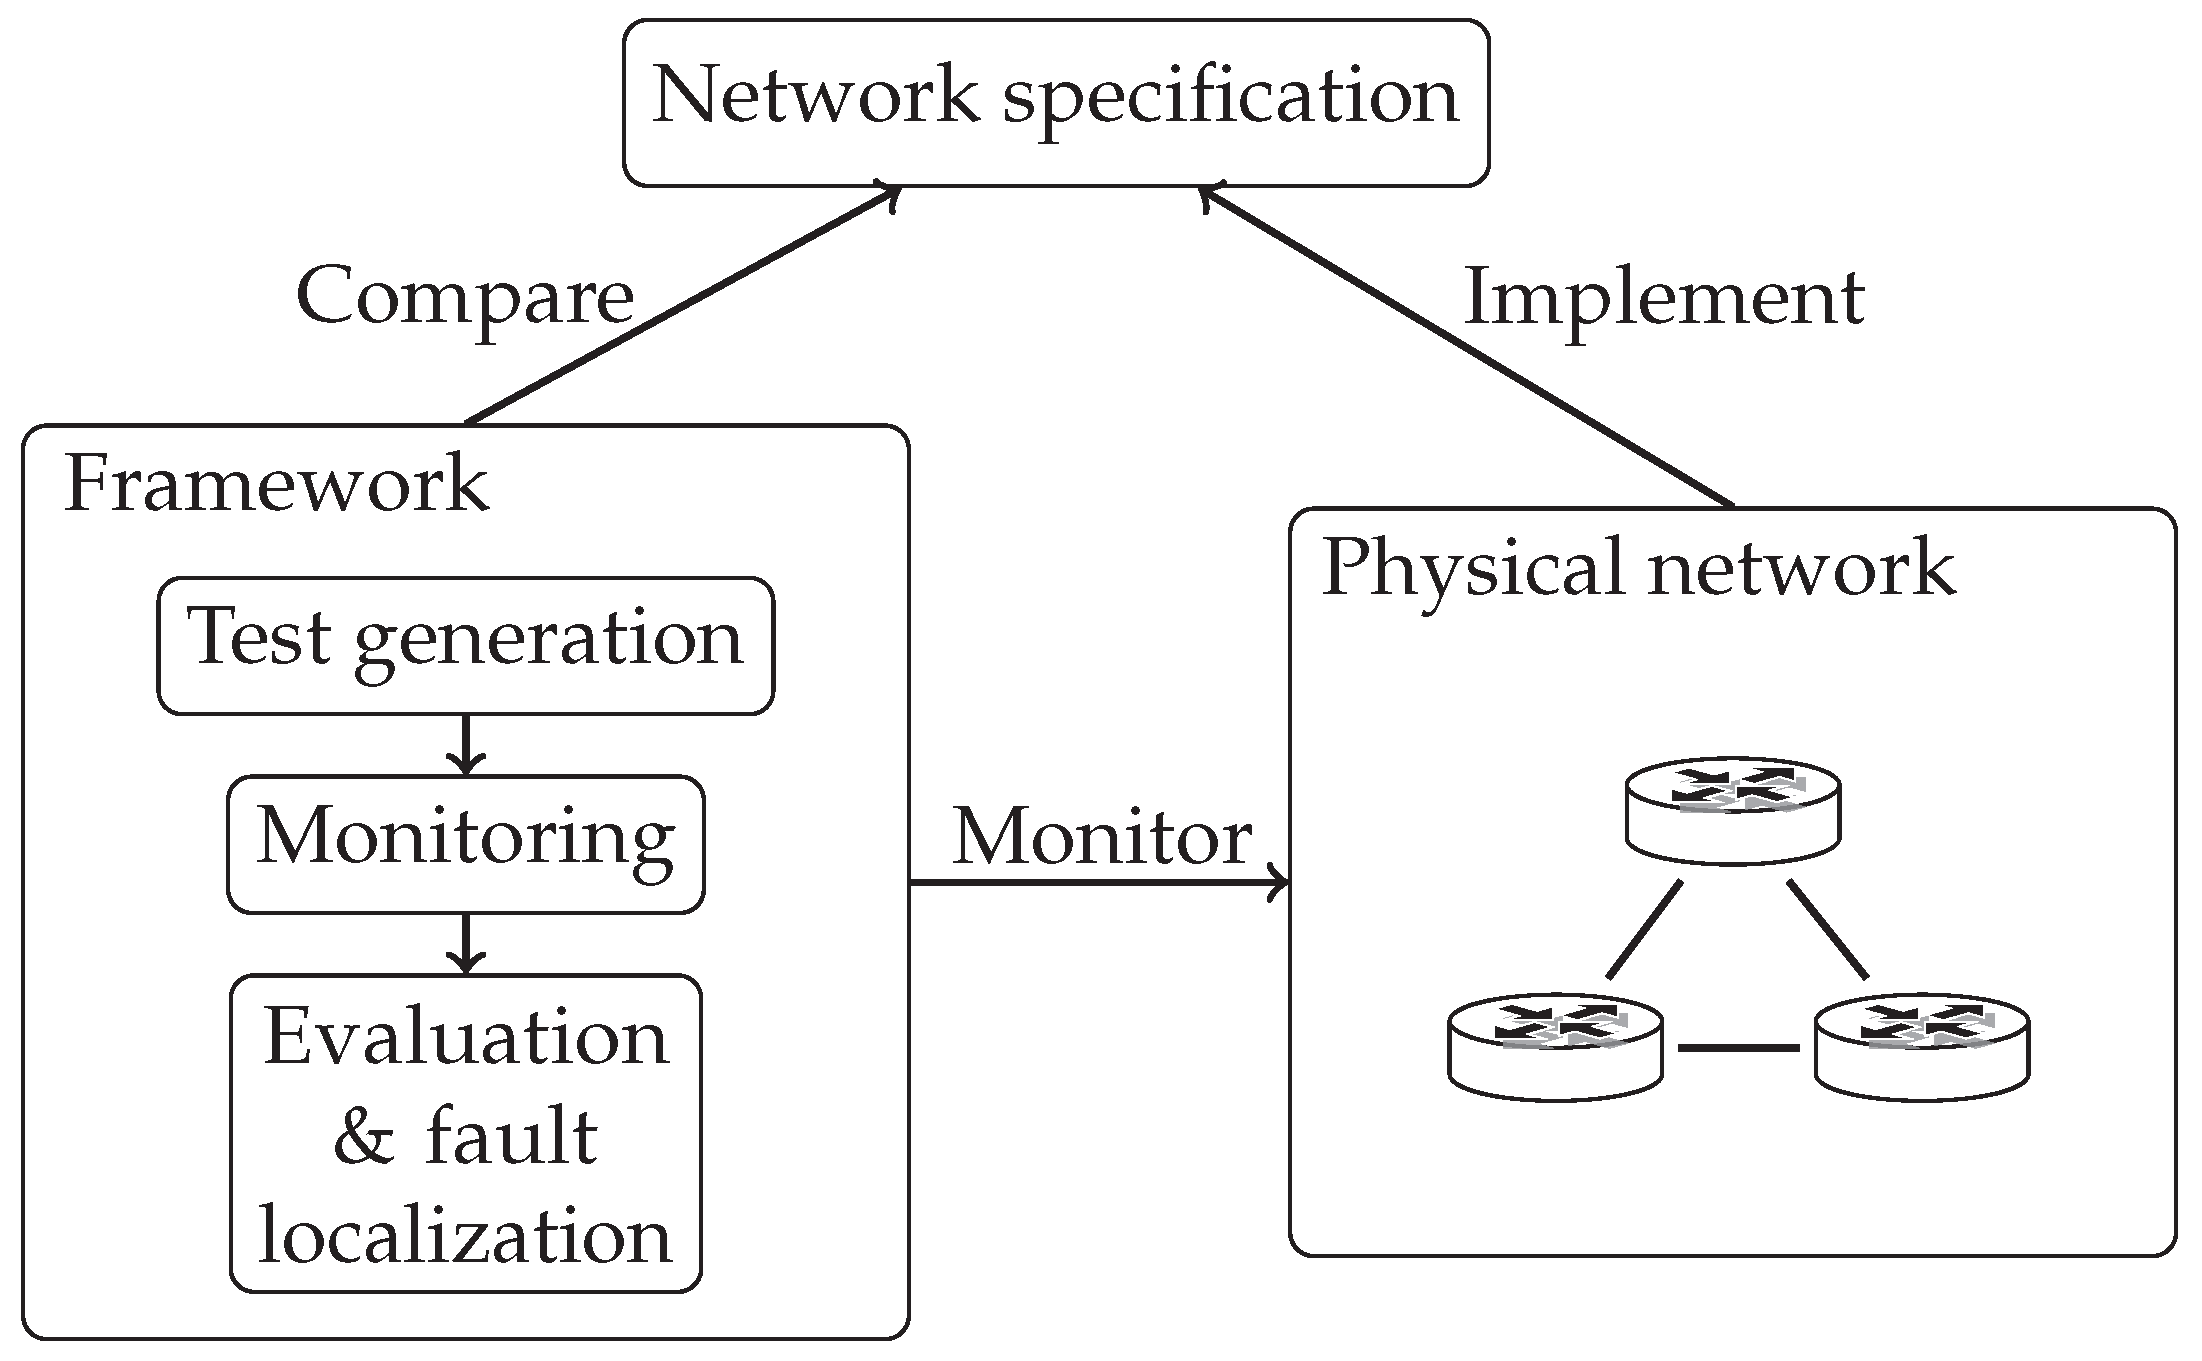
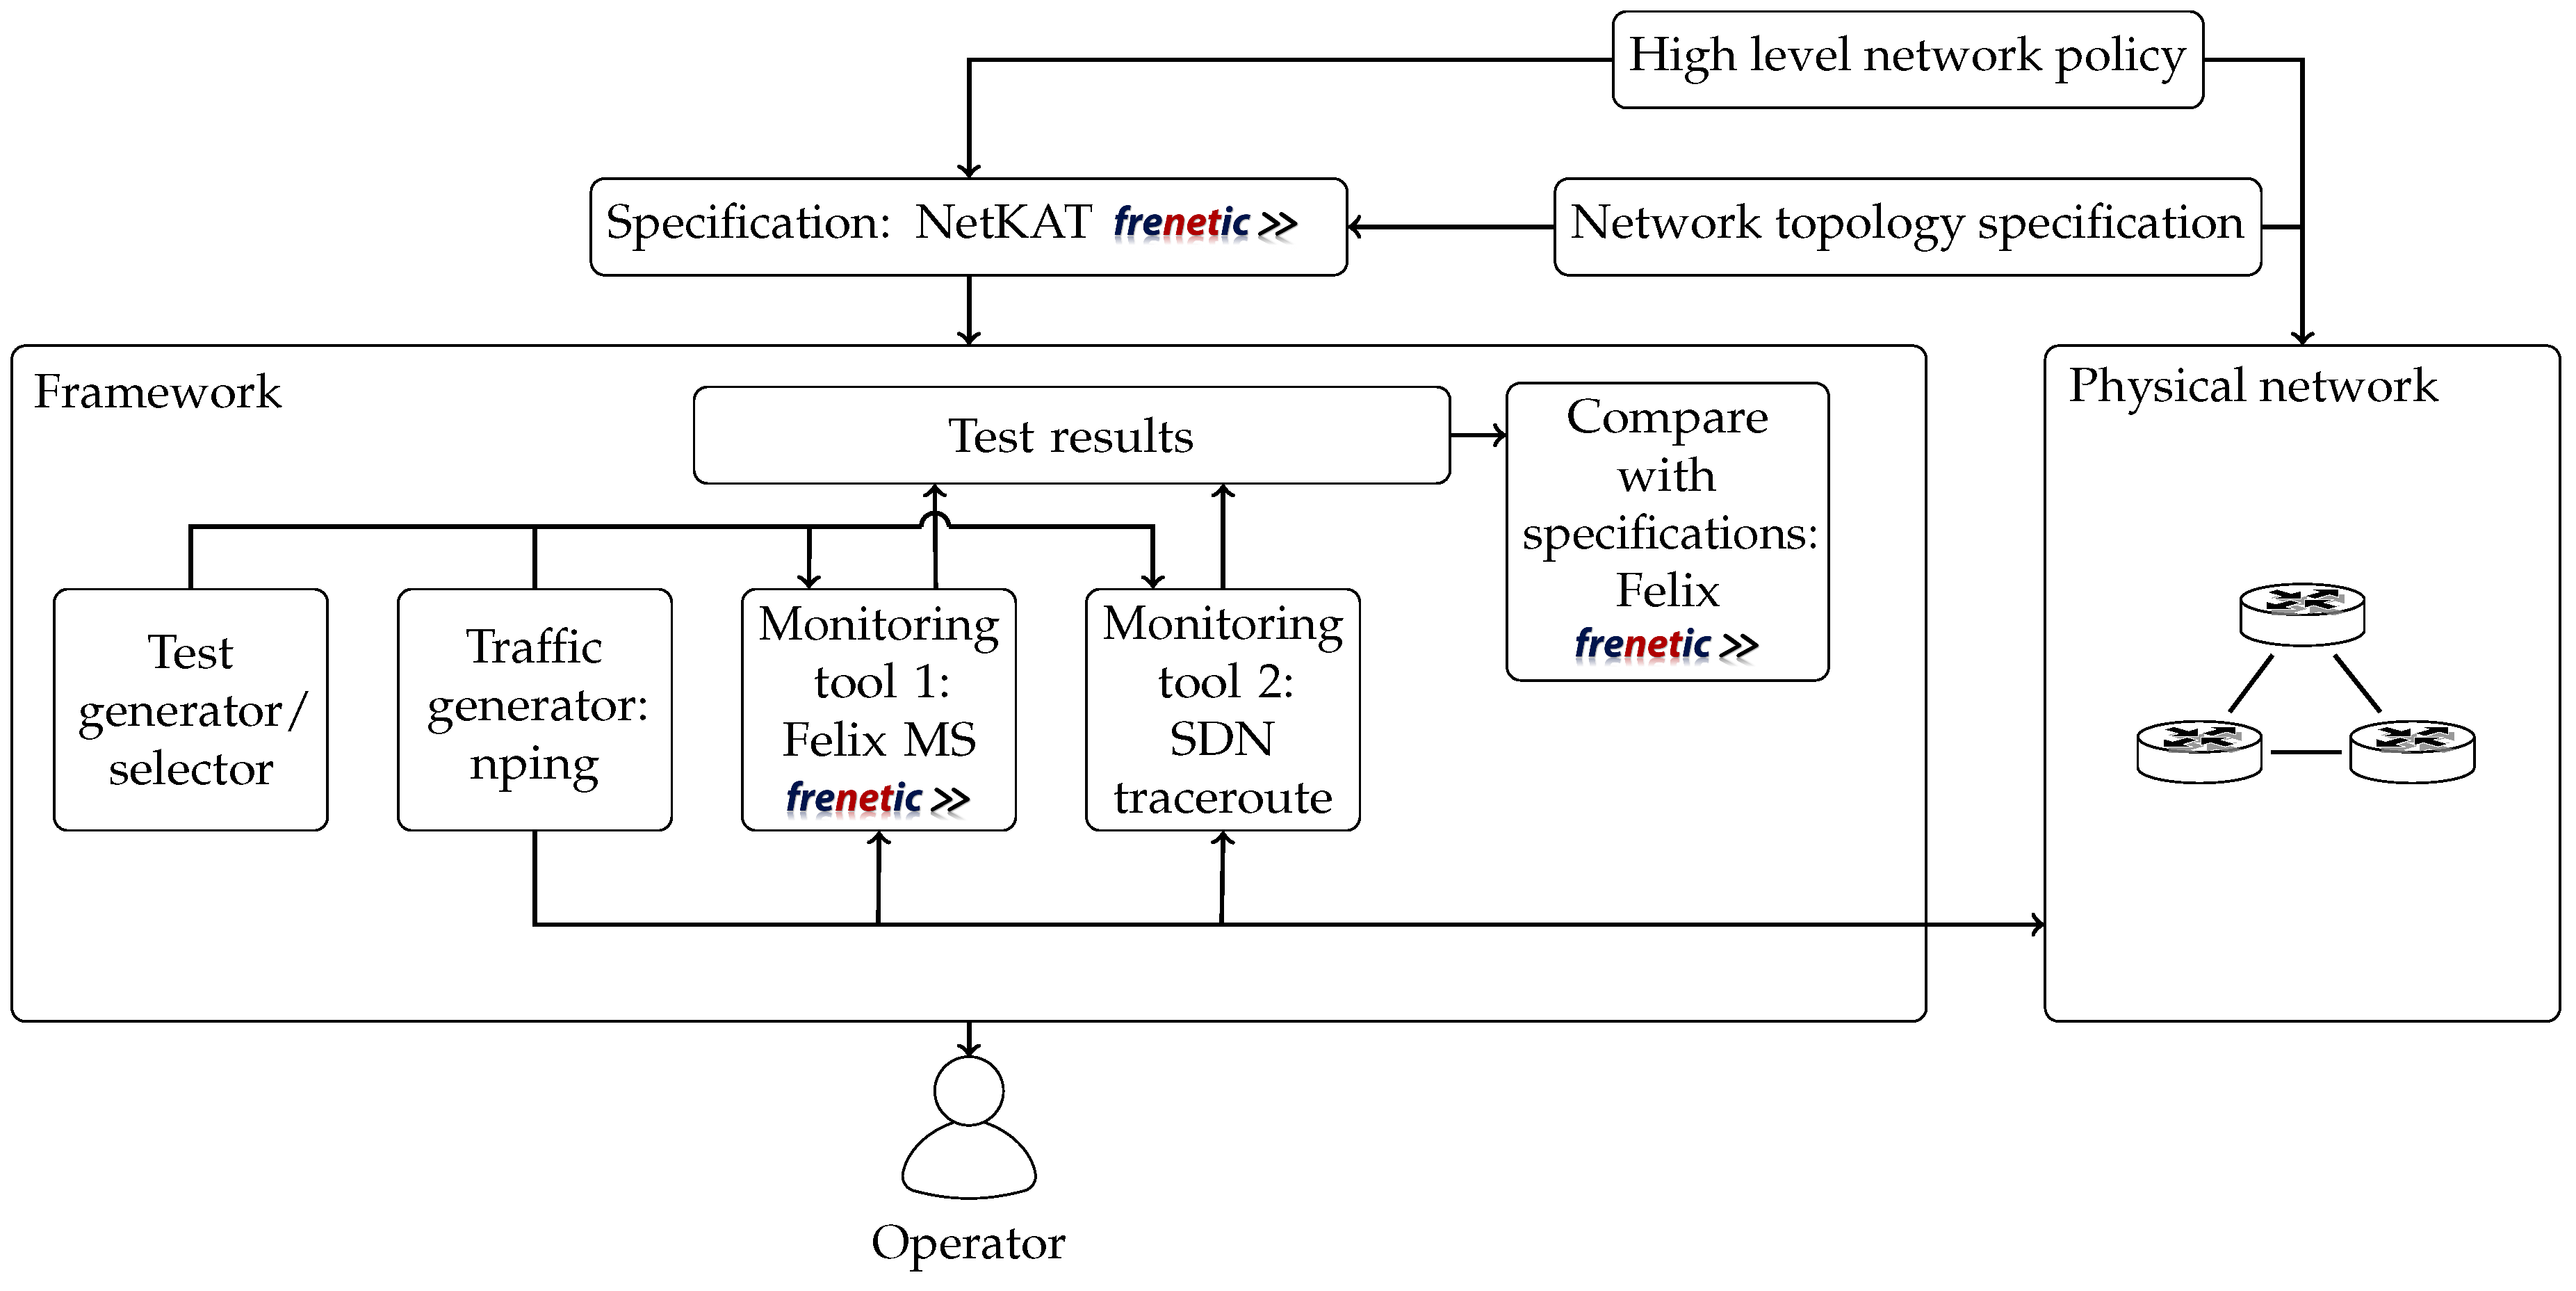
Based on these observations, our aim is to develop such a framework that leverages the benefits of using an SDN-enabled network, all the while actively testing the network for issues and comparing current behavior to our baseline, as depicted by
Figure 1. We chose our baseline as being a formal specification of the network. Such specifications in cases of both network topology and high level policies should be readily available for proper network management in any case. Since active testing is superior to passive monitoring, we chose to incorporate that concept as well. In order to achieve our goal, we outline a framework that is able to satisfy the following criteria:
(i) read formal network specifications;
(ii) generate test cases based on them;
(iii) actively monitor network traffic in accordance with given test cases; and
(iv) evaluate test results and localize faults. In this environment, there are different jobs for our framework to handle. The first is to instrument the tools that provide monitoring functions. In order to achieve this, we need to wrap the selected tools in such a way that the framework would be able to access them: Handle their life cycle events, send them inputs, and query them. Automatic test generation and selection is another task where a list of paths should be created that covers the network. In accordance with test cases, the framework should control monitoring tools to collect traffic information flowing through the selected path. The evaluation and localization phase should then find out whether traffic on the monitored path is in compliance with the network specification. If not, it should identify the smallest subset of network components that can cause the issue. In this sense, we can think of the framework like a controller in SDN-enabled networks. SDN controllers instrument network-forwarding equipment according to live events or predefined rules, and they are extensible in two ways. They enable the implementation of separate modules that are specialized to perform certain tasks as well as support defining the overarching forwarding capabilities by relying on these building-block modules. Our framework does a similar job with network monitoring and troubleshooting tools. It gives an interface for connecting tools in an extensible way and instruments them to realize network failure detection and localization.
The basic concept of our framework is the following. First, it interprets the network specification and creates test cases from it by finding out what type of traffic between which endpoints passes through a certain path in the network. Then it selects a path from the generated list and starts monitoring it by actively injecting packets to emulate the selected traffic type. As it gathers data on the tested path, it compares that with its knowledge of the network and marks those points that are suspicious of failing. It continues iterating on the test list by selecting a new path from it.
For the above reasons, in the proof-of-concept implementation of our framework, we selected such a formal language for the network specification that supports reasoning about network properties. We chose our monitoring tools in such a combination where they can perform active tests, e.g., generate traffic that targets the selected path in the network, and both measure packet forwarding at the end points and capture the route that packets take. We prepared the framework’s evaluation and fault localization step to be able to compare test results with the formal specification, so we applied tools that can interpret test results in conjunction with formal network description. Our proof-of-concept implementation thus became an integrated application in which we incorporate available reasoning and monitoring tools. As
Figure 2 shows, the framework takes a network specification compiled from high level descriptions and supplies it to our execution and evaluation framework that can run tests, monitor network behavior, and analyze results on its own.
As for the network specification, we chose to build our solution around the NetKAT (Kleene algebra with tests) language [
6]. It is a formal language designed within the Frenetic project [
7] specifically for the purpose of describing networks—it can encode both topology and policy information—and to reason about network properties. Other works dealing with network behavior modeling concentrate too much on controller implementation and can thus describe only low level behavior. While some are able to verify properties of correct behavior [
8], they lack the ability of reasoning about different forwarding properties. Other methods concentrate more on creating efficient forwarding tables [
9], while yet other methods are too complex for the task at hand [
10]. Merlin, a regular expression-based language [
11] similar to NetKAT, was also developed to extend Frenetic. However, it puts more emphasis on solving the problem of determining a placement strategy for network devices based on required bandwidth. These tools might still be adaptable for our use-case but with much more work, since NetKAT has the additional benefit that tools developed together with the language make it possible to create low-level policies—that can be used by our framework—from high-level ones. This enables our framework to adapt to any network NatKAT is able to describe. We give a short summary about the Frenetic project and the language in
Section 2.1.
We opted to use a simple method for generating test cases that applies the Felix tool [
12] and is talked about in
Section 3 in more detail. We note that there are specific tools for the purpose of finding test paths in networks adhering to the SDN concept to achieve the best test coverage [
13,
14,
15,
16]. These could also be integrated with our framework to enhance test path generation capabilities, but this was not a goal for the current iteration of our work. We chose to use two tools that are able to inspect network behavior in ways that complement each other while putting less strain on the network and adding only non-invasive modifications to standard behavior: Felix’s measurement service [
12] and SDN Traceroute [
17]. The former is able to analyze packet counts at hosts but is only able to passively monitor the network; thus, we incorporated a traffic generator as well. The latter tool, SDN traceroute, can actively trace paths taken by custom-built packets through the network. We summarize the capabilities of these two tools in
Section 2.2 and
Section 2.3, respectively. As we later show, combining these separate tools using a single framework has synergies—e.g., additional information can be uncovered regarding network issues—that would not be available when using them disjointly. We note that other tools, e.g., sTrace [
18], could be used for monitoring also.
Data gathered using the above tests are collected into a storage component from where they can be read and analyzed. Comparing test results with expected behavior can reveal nonconformities in the physical network as well as narrowing down the location of the error to a subset of links and ports present in the network. For the sake of comparing measured data to specification, we instrumented the Felix tool [
12] that can devise test end points for paths in the network. Paths in this case are defined with Felix’s own query language that is slightly different than the standard NetKAT language. We give a summary about this tool also in
Section 2.2. This component of our framework is also responsible for interpreting the collected data. Since information about issues is collected from different parts of the network, the framework is able to correlate them and prioritize them based on their occurrences.
As stated above, our contributions are thus threefold. First, using the controller of troubleshooting tools concept, we introduce a framework that is capable of instrumenting existing tools to perform active and passive network monitoring in an automated manner. Second, we show a method for comparing the result these tests give to a network specification, thus validating adherence to it, and when the physical network differs from its specification, we show possible failure locations. Finally, we demonstrate the use of our framework on three use-cases and discuss performance-related aspects. In accordance with these, the rest of this paper is organized as follows.
Section 2 gives a summary of the used concepts and tools. In
Section 3, we show the details of the operation of our framework and evaluate our proof-of-concept implementation on different failures discussed in
Section 4. In
Section 5, we discuss our results and possible future works.
Section 6 gives a short summary about novel troubleshooting tools and how they compare to our implementation. Finally, we list implementation details in
Section 7.
2. Background
Since we are implementing a complex scenario and also want to demonstrate the integration of different tools, it is essential to first discuss the main building blocks in short. This section first shows the details of the NetKAT language and how it is used to describe network behavior and later presents Felix, the engine for our evaluation phase. The two used monitoring tools that measure packet-forwarding properties are also shortly described at the end of the section.
2.1. Formal Description of Networks
Having an easily configurable controller is key in operating software-defined networks successfully. In order to achieve this goal, the Frenetic project developed their controller platform around a new formal language, NetKAT. It was specified in a way to make network description simple and allow reasoning about the properties of the described network as well [
6]. The language differs from previous approaches for describing networks in that it can incorporate information on both network topology and forwarding behavior. This is supported on both a very high level as well as lower levels. The Frenetic project developed tools that are able to parse high level topology and policy descriptions and—through a series of steps—compile them into low-level instructions, at the end transforming them directly to OpenFlow flow table entries. In the following, we first introduce the language in more detail, then we shortly present how the compilation from high-level description to low-level instructions works.
The NetKAT Language
The language’s concept builds on the assumption that computer networks—under certain conditions—can be modeled with finite state machines and thus can be described by a language using regular expressions. Language rules are based on the Kleene algebra and use KAT (Kleene Algebra with Tests) expressions as building blocks [
6]. In NetKAT’s view, as detailed in
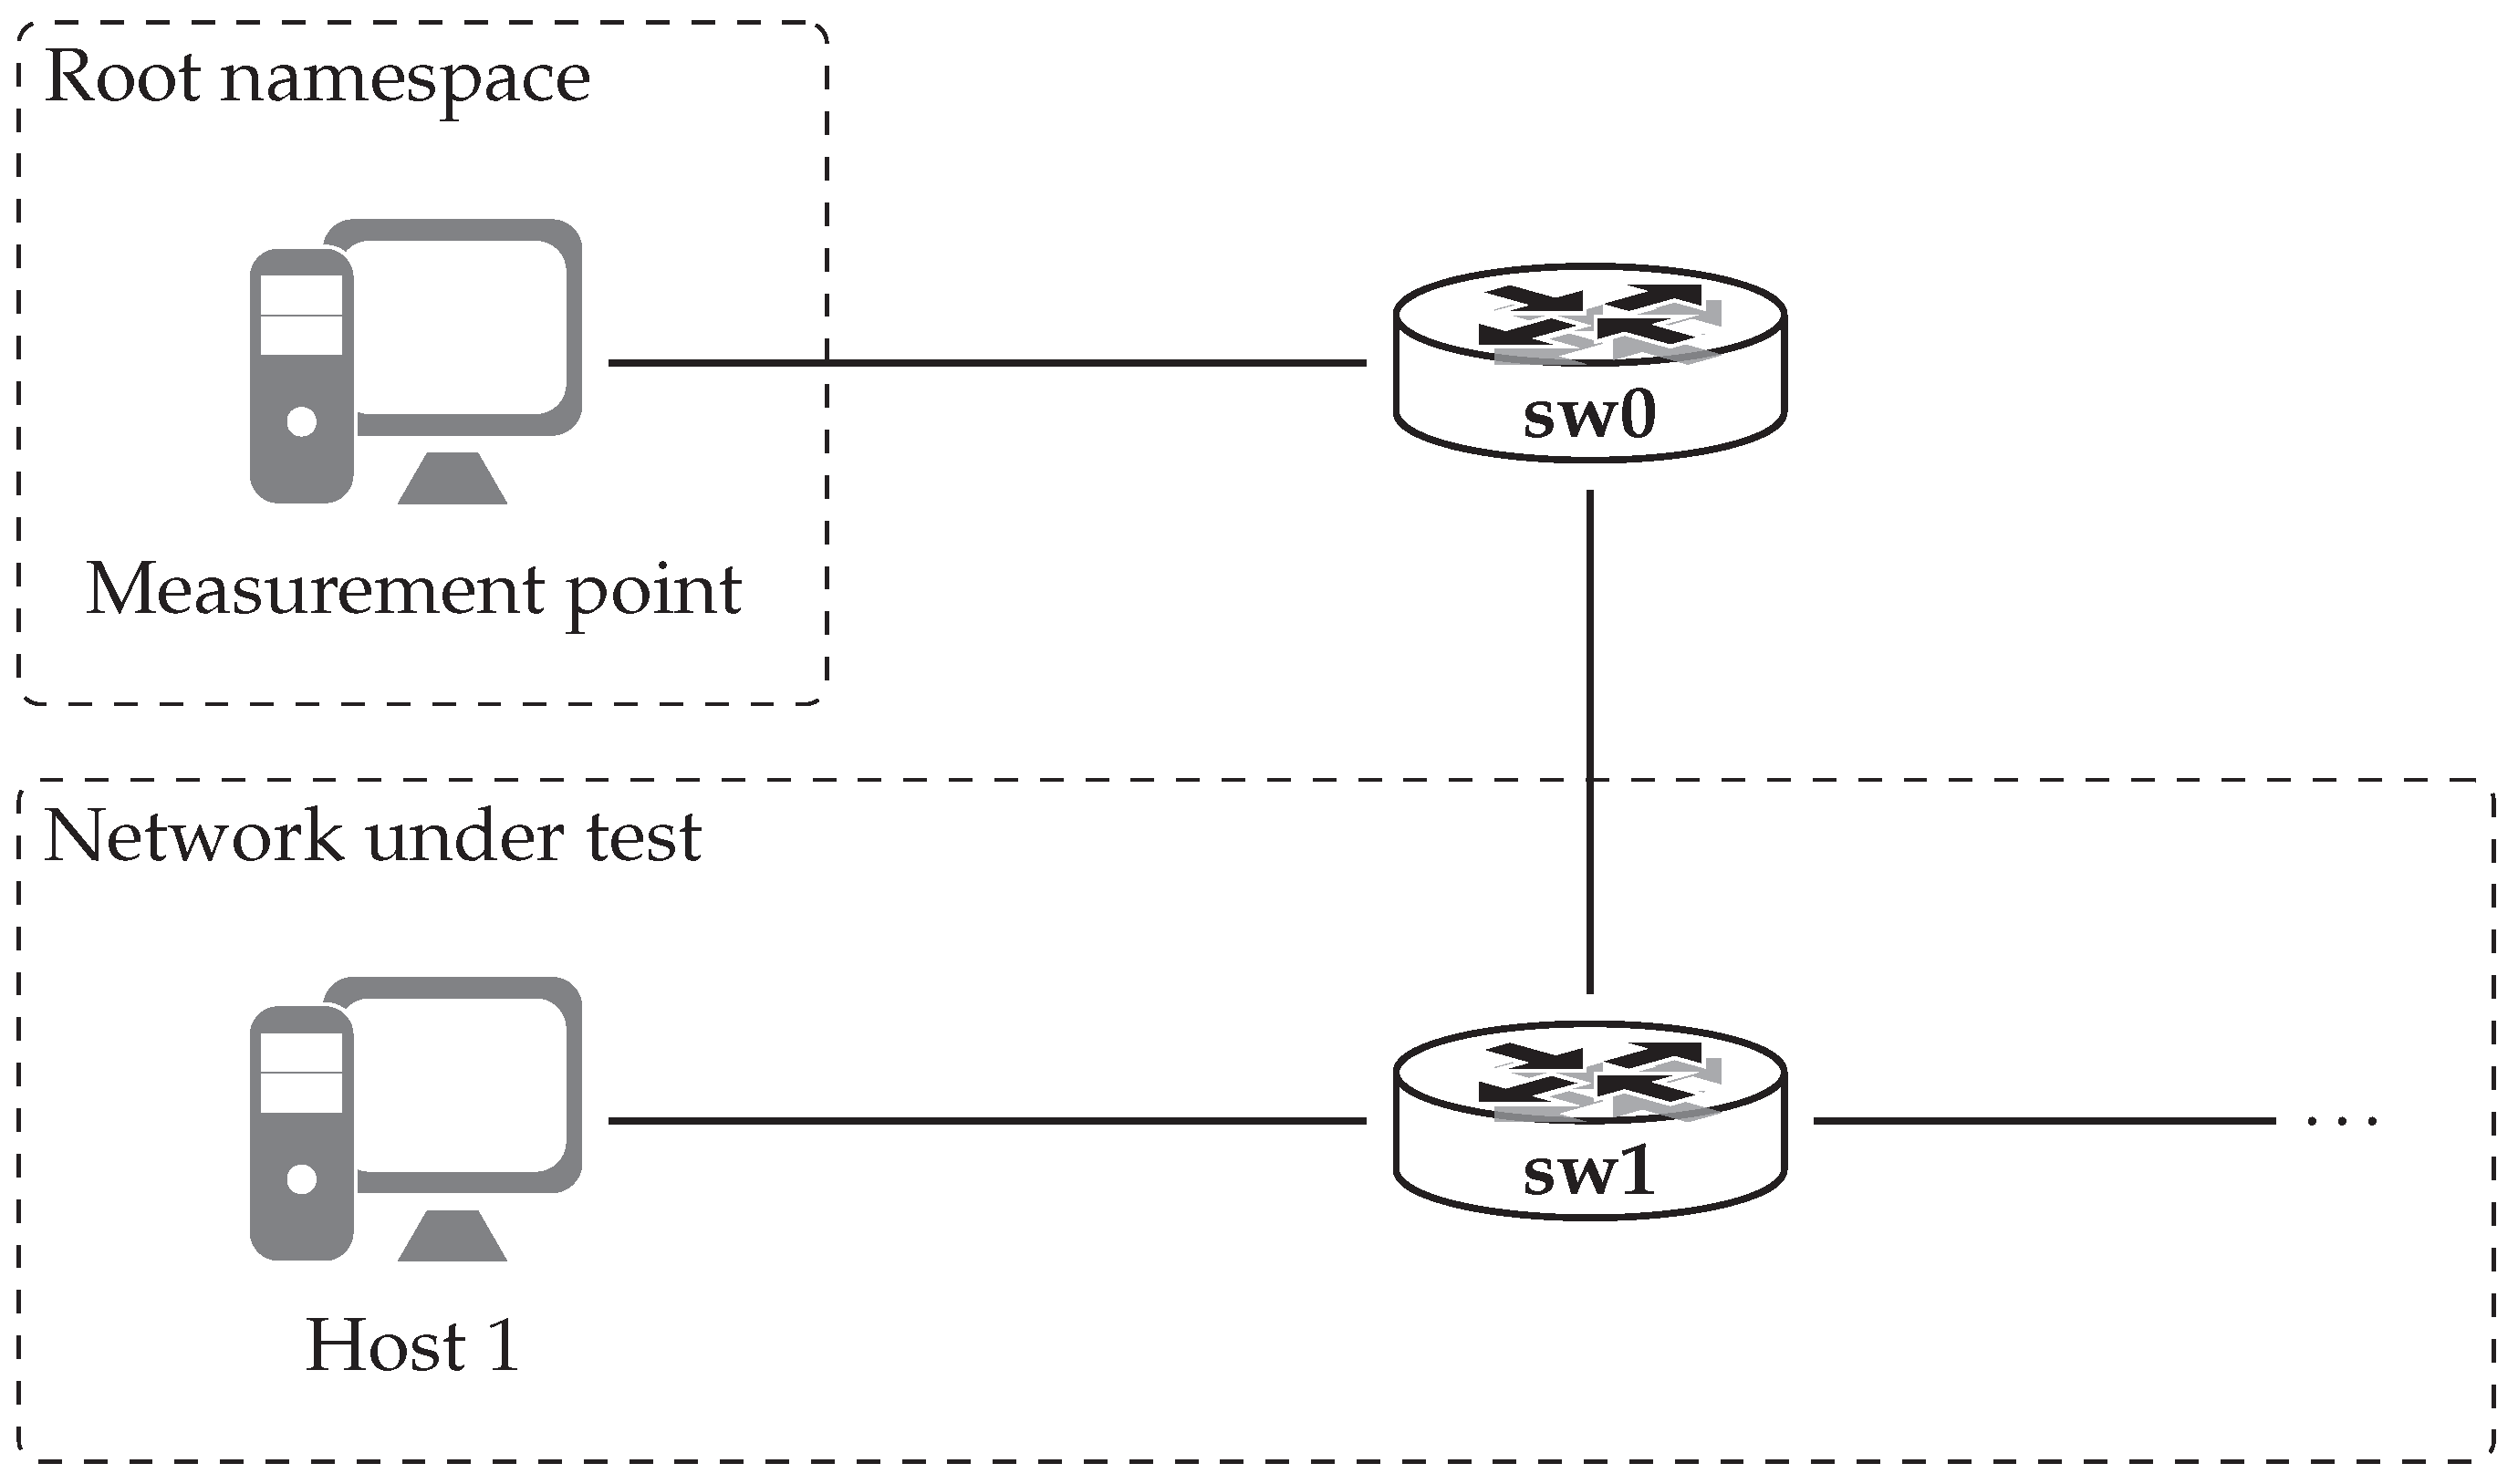
Table 1, packets are considered as records consisting of header fields on which we can execute different operations. These header fields are the usual packet header fields complemented with two additional ones: Switch and port. With predicate operations, we can write primitive actions (like dropping a packet or negating a header field), while policy operations let us modify packets as well as provide an interface for more advanced composition of predicates. For example, the + operator describes branches in the forwarding and the · operator describes consecutive network nodes or processing events. The = testing operator is also defined, which is used for filtering packets matching specified header fields or switch identifiers. The ← assignment operator is used for assigning new values to fields. Using this interpretation, the following expressions describe the topology containing a single link shown in
Figure 3:
Here we have two expressions that describe forwarding on the link. The first one specifies the
Switch 1 to
Switch 2 direction, while the second gives the reverse direction. If we imagine the network as an entity that performs transformations on packets, we can easily understand the idea behind the notation. First, with
, we select packets that arrive to port 2 of Switch 1. Then we describe the transformation that a link applies to these packets: It modifies the
(switch) filed to 2 and
(port) to 1.
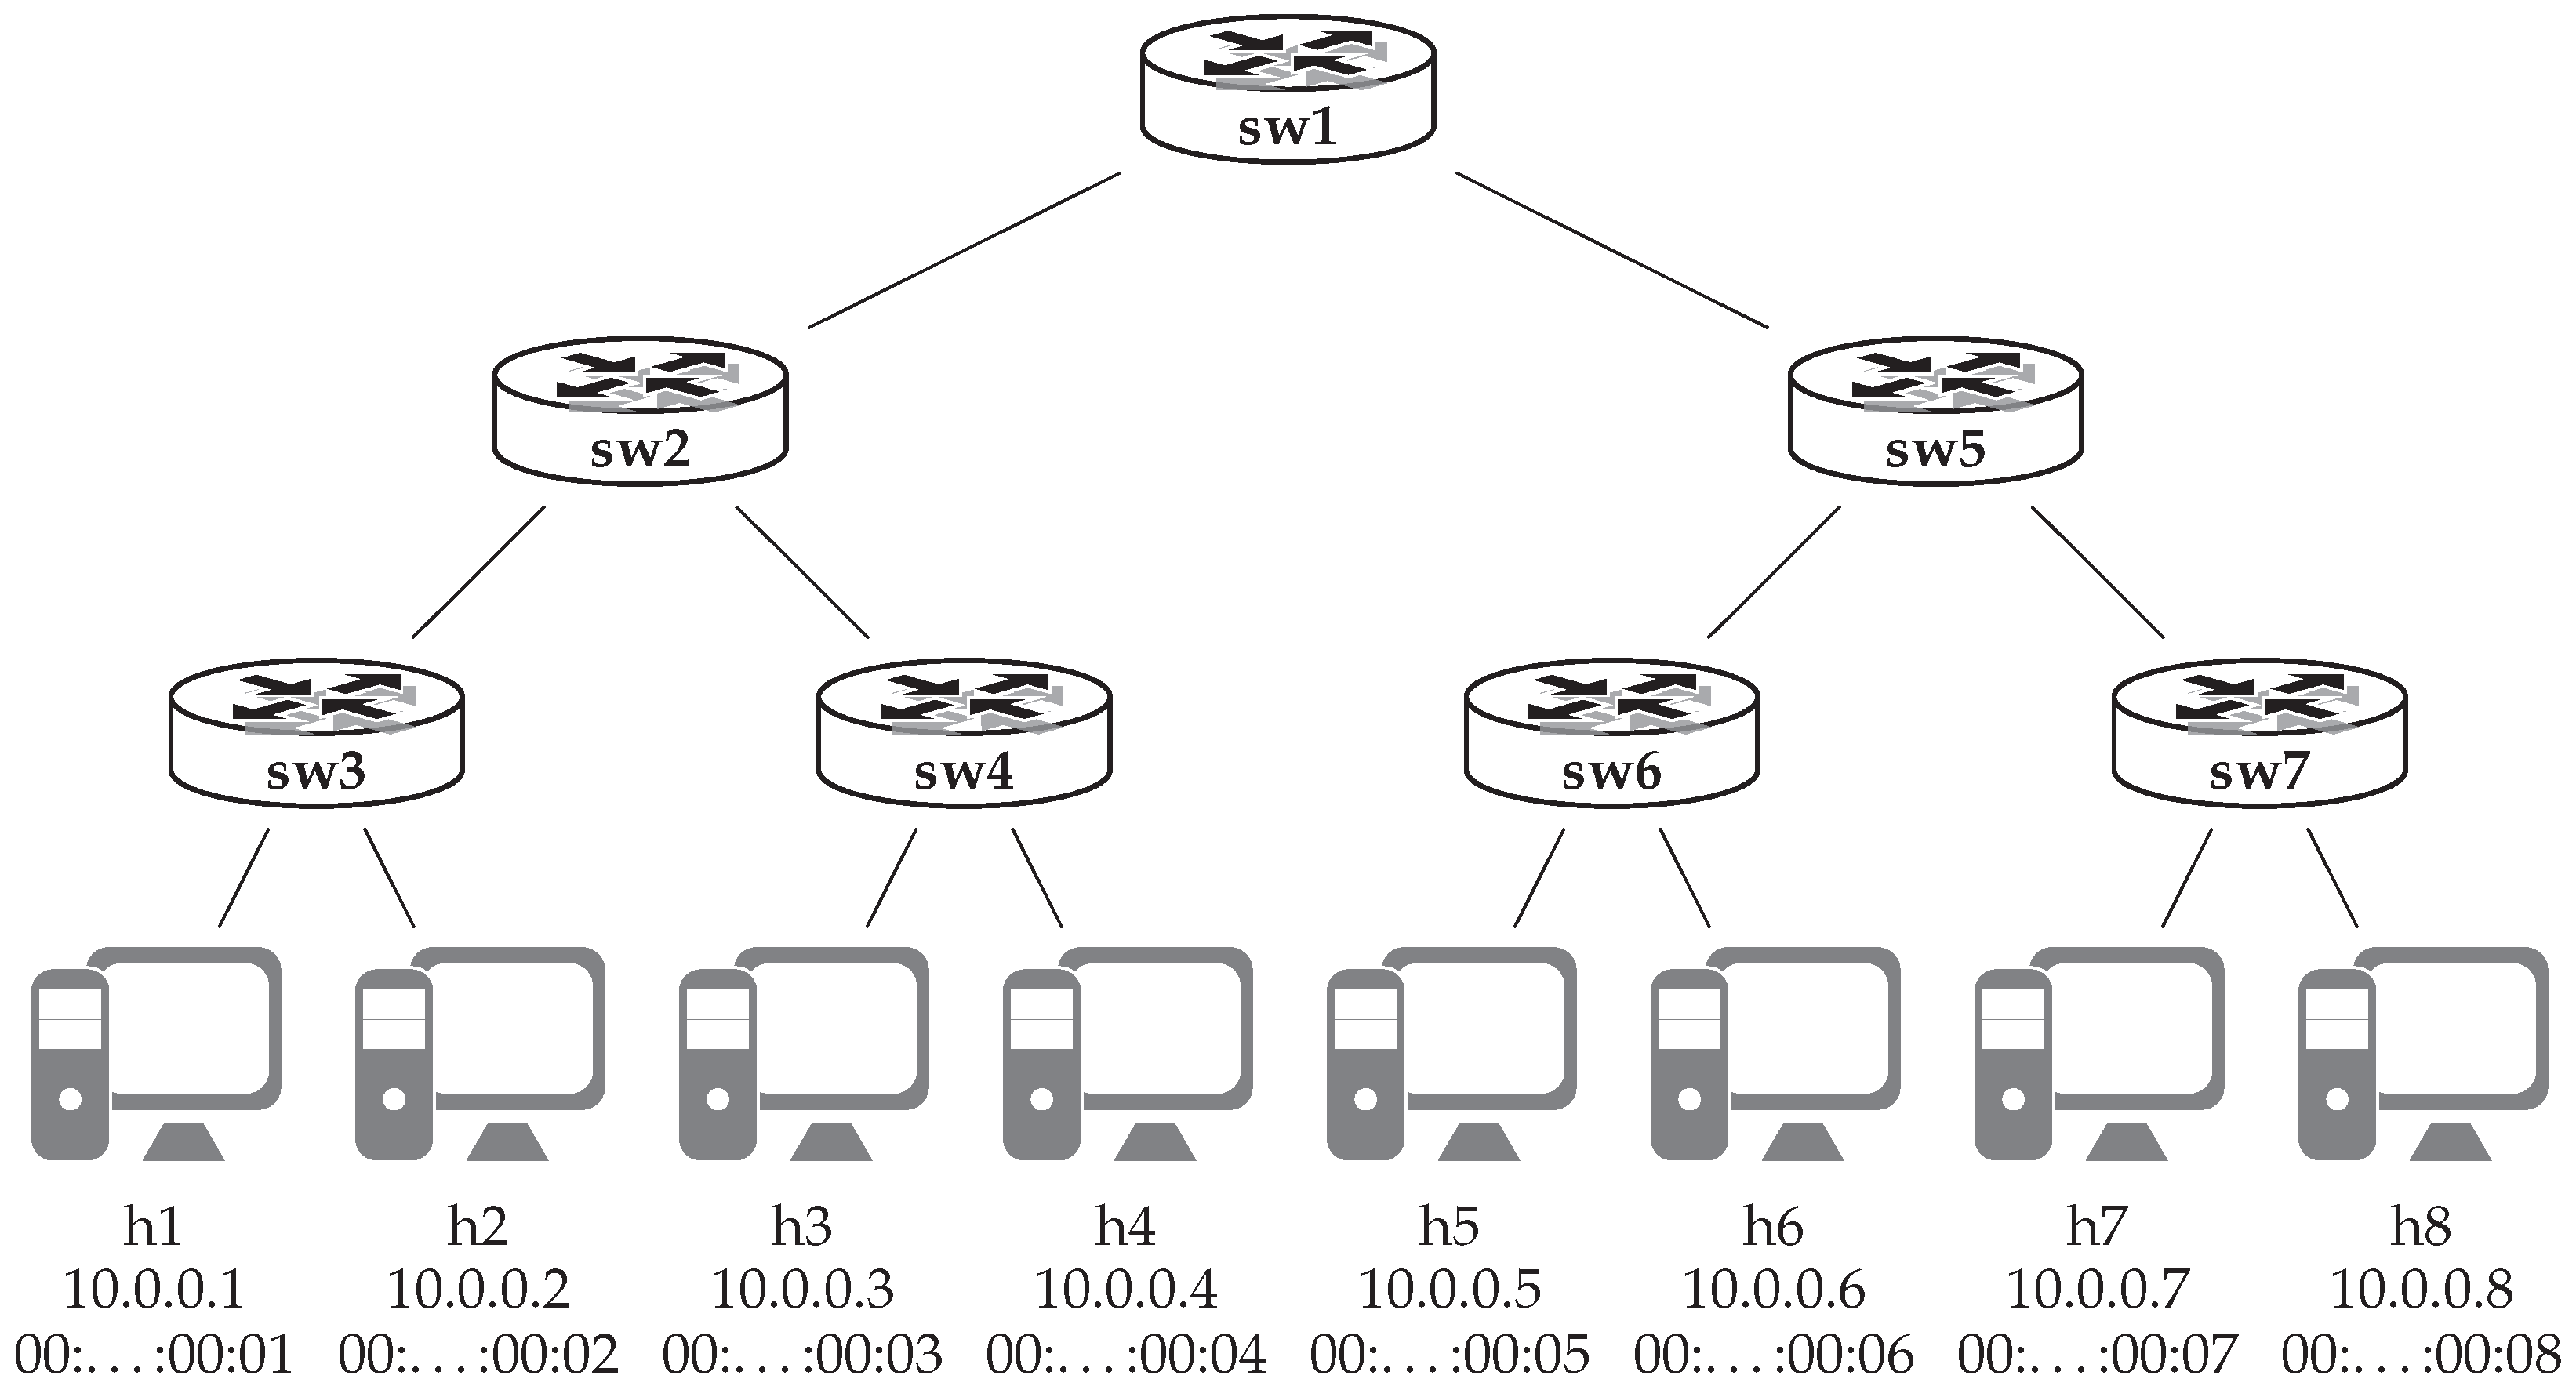
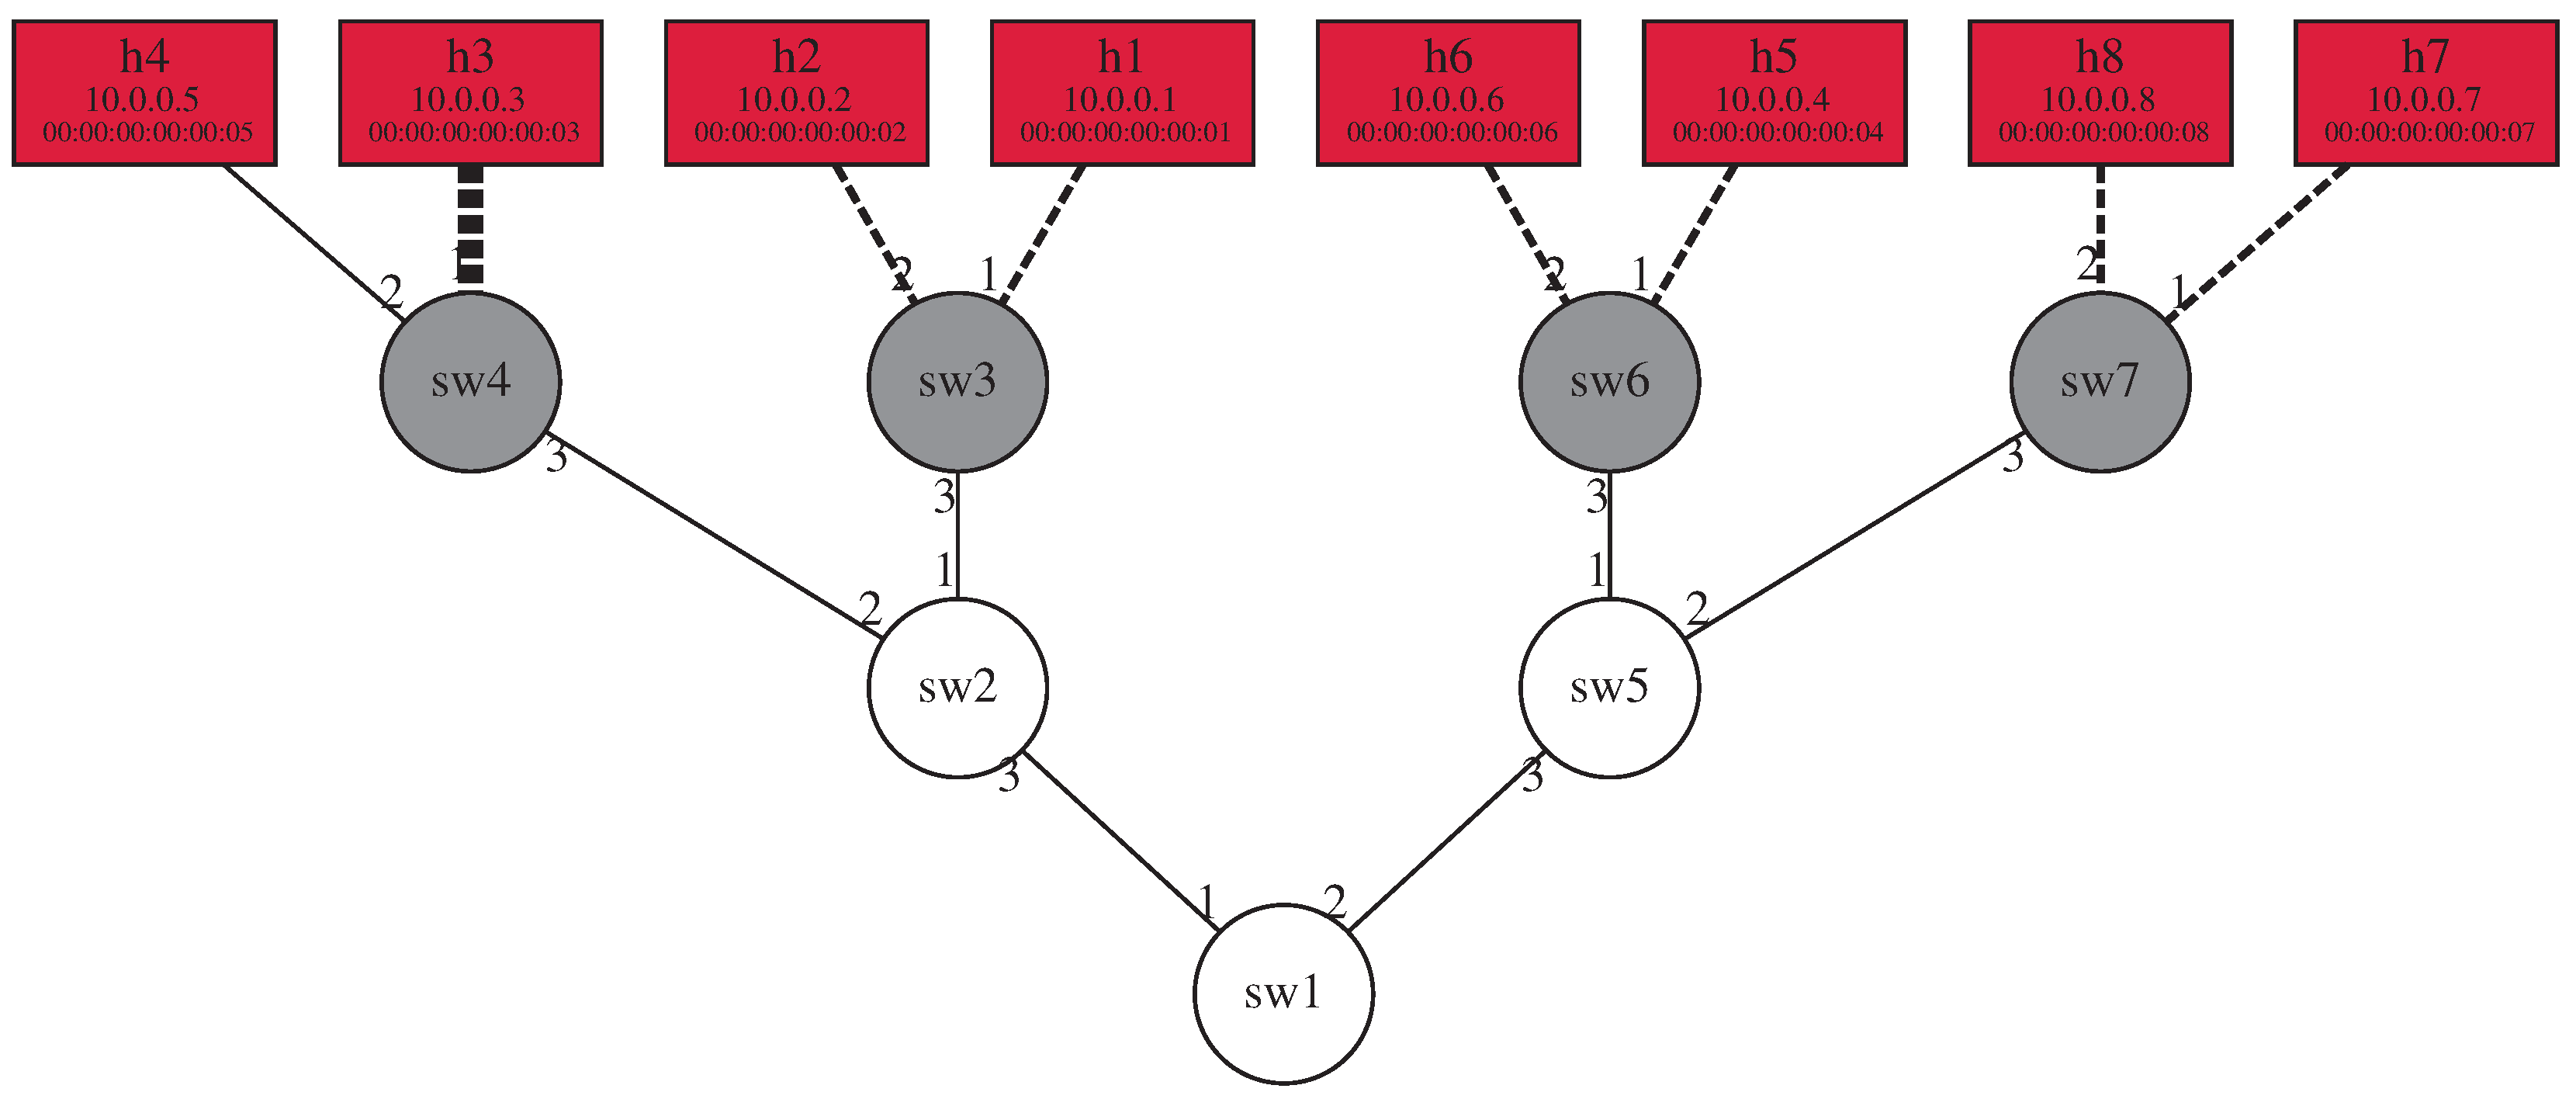
For a bit more complex network, let us take a look at the one shown in
Figure 4. Based on the above example, the topology can be given with the following expression:
The equation does no extraordinary feat, it simply lists each link in the network the same way as in the example before. Network hosts can be defined as well by listing their connection points to switches. If we do so,
t, the complete network topology, can be given by taking the conjunction of the expressions defining the hosts and the
network:
Thus, we start traffic from a host, then traffic traverses the network, and at the end, it reaches another host. Here, hosts are identified by the position they occupy in the list, e.g.,
host 1 is connected to
switch 1 port 1. We can incorporate layer 2 and layer 3 addresses as well, in order to complement the expression. In this case, we have to distinguish between the directions that specify incoming and outgoing traffic. Thus, the list of hosts would comprise the disjunction of the two subexpressions, while
t describes cases where traffic originates from
and terminates at
:
A simple forwarding policy for the network can be defined with a short NetKAT expression giving us a low-level network policy. In the below equation, the first two parenthesized expressions define the routes packets that should be taken towards
host 1 and
host 2, respectively. In our sample case, every switch should forward packets destined for
host 1 on
port 1 and they should send out packets targeting
host 2 on
port 2. In the case of
host 3—defined by the rest of the expression—we can use a different method where we define forwarding ports for every switch individually, e.g.,
switch 1 should send packets for
host 3 on
port 1 (see the third parenthesized expression):
We can complement these rules on a high level, for example, with a rule that restricts operation only for UDP traffic. Thus, rule
modifies rule
p, which deals with traffic in general, in a way that it is executed only when the type of the traffic is UDP. Using this, network operation can now be written as taking the sequential composition of a series made from the policy and the network topology with the predicate for
being at the beginning and
at the end. Or, by simplifying it with the Kleene star operator, which repeats the preceding expression zero or more times:
At this point, we can use NatKAT’s ability to reason about network properties. Such properties can be whether hosts are able to reach each other or if they are separated in certain ways. Waypointing—e.g., untrusted traffic traversing an intrusion prevention system—can also be tested as well as traffic slicing. In that latter case, the network could be split into slices having their own subpolicies that can be combined into a single network-wide policy. Let us see an example now for verifying that UDP traffic from
host 1 to
host 2 can traverse the network. Solving the following inclusion would mean that our assumption (UDP traffic can pass through the network) is included in the network behavior (axioms for the deduction are detailed in [
6]):
From the above examples, we can see that describing network topologies is quite an easy feat even on a low level. The process can be done programmatically, and we leverage this feature in the implementation of our framework as well. Policies, in cases of complex networks, can be harder to build, though. Every network should have a high-level policy that describes the grand scheme of network operation, but deriving low-level instructions from this is a tough job. Fortunately, Frenetic is so ambitious that it is able to compile such high-level forwarding descriptions into low-level policies and eventually turn them into OpenFlow flow table entries. We highlight the main considerations of the steps taken by the process in the following.
The Compilation Process
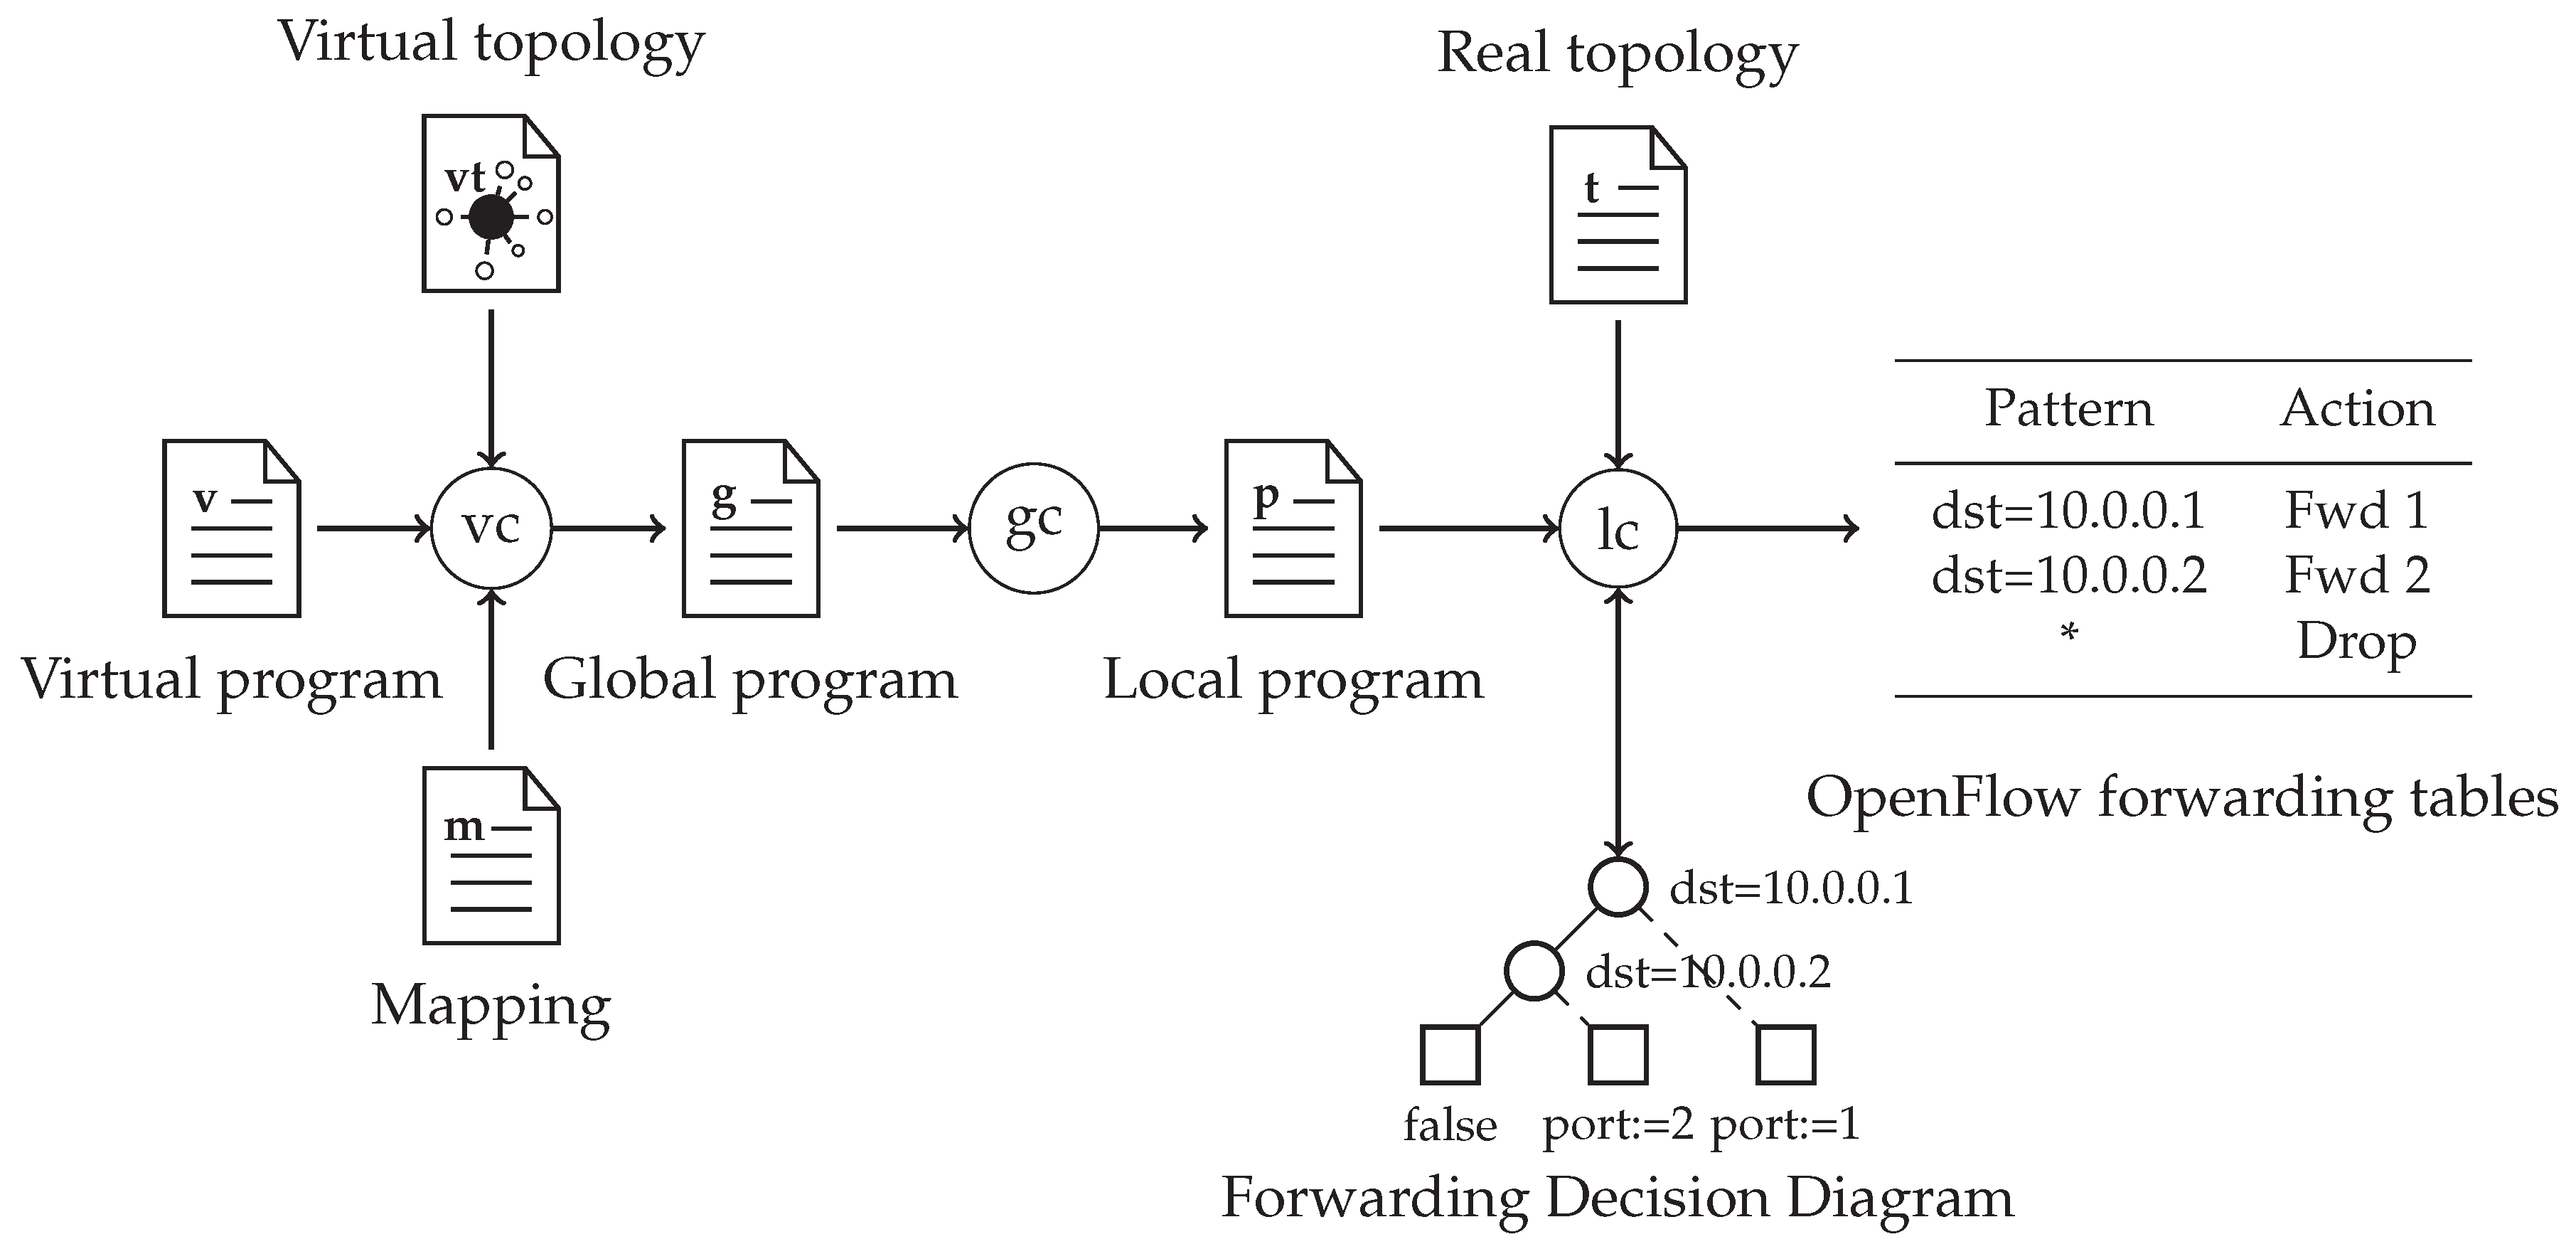
The process applies a three-stage workflow [
19] to transform high-level network specifications into low-level instructions, as shown in
Figure 5. In the first stage, a
v virtual program specifies the high-level forwarding behavior of the network on a
virtual topology. The virtual topology can be a simplification of the real network, e.g., a big switch that is directly connected to every host in the network. This separation of virtual and physical network descriptions has the benefit that changes in the physical network will have no effect on the specification of high-level forwarding behavior. The
virtual compiler then takes
v and
, together with an
m mapping between the real and virtual networks and distills them into a
g global program. This defines routes between virtual ports using physical paths. A global program can combine expressions specifying processing jobs in switches and defining network topology. It can also contain additional state information that cannot be added on a lower level. After this, the
global compiler produces a
p local program from
g that lists the low-level policy rules of the network in the form discussed above. In the last stage of the compilation process, the
local compilation step takes the
p network policy and the
t physical topology together with network inputs and outputs and combines them using the formula discussed above:
. In the end, the compilation creates OpenFlow forwarding tables for each switch with the help of forwarding decision diagrams.
Since a broad range of networks can be described by the NetKAT language, we believe it is optimal to be used as a method for formally specifying networks for our framework. Using the language axioms, we can deduce forwarding behavior based on specifications written in NetKAT. Our framework thus needs to discover path information from the specification, and while it would be possible to use a proprietary engine for this purpose, we decided to use the one that has been developed within the scope of the Frenetic project. The tool is called Felix, and it is able to generate test cases for paths in a network and monitor forwarding behavior at the hosts. We give more details in the following section about this tool.
2.2. Host Monitoring with Felix
In conjunction with the above aspects of the Frenetic controller, a network monitoring tool was also developed [
12]. The main idea behind the tool is to put the least strain possible on network equipment during monitoring. It is split into different components. The first one is the
Felix compiler, which is a decision service that is able to determine the type of traffic in which hosts should be monitored when checking a path in the network. Parallel to this, a
measurement service runs on each host of the monitored network and logs incoming and outgoing packets. Lastly, a
controller is responsible for connecting the previous two. In the following, we give a summary about the first two, since in our work, the controller was replaced by our framework.
Felix Compiler
Felix is able to parse network descriptions and, based on a path definition, compute the parameters of the traffic passing through the path at hand. Thus, in order to find out these parameters, we need to supply Felix with network inputs and outputs, policy and topology NetKAT descriptions, as well as a path definition. The first four can be obtained as discussed above, while the last one should be supplied manually. The path definition—or query in Felix terminology—can define links in the network, and its syntax is given by
Table 2. A filter expression defines the input and output behavior like end points of a link. Other operators can be used for combining such links into a path.
Let us take an example of how Felix works on the network shown in
Figure 4. Assume that we would like to check the path
switch 3 → switch 4 → switch 2. We have already defined the network topology in the previous section; thus, we only need to create an expression that specifies the selected path. Our first guess could be listing the links in the path as
does below. However, this way, we specify a path that starts at exactly
switch 3. Unfortunately, this point cannot be the start of any traffic in the network we specified, since traffic can originate only from network inputs, and
switch 3 is not one of those. Thus, we have to add a wildcard expression that matches any link preceding the first one, as given by query
:
As a response, we receive only one host pair. The reason for this amount is that only the traffic between these two uses the given path. In the result, we find an
host that specifies the properties of the starting point and a
host that gives the destination of the traffic. In the below expression,
means that packets sent to
host 2 should be monitored on the host connected to
port 1 of
switch 1. Similarly,
specifies the receiving side:
Likewise, if we were to test the link between switches 2 and 5, we would write a slightly different path query. This case would now supply us with more host pairs:
As we defined the path with a certain direction, we still receive host pairs generating and receiving traffic only in that direction. In order to test both directions, we could reverse the order of links and combine it with the previous one using the union operator. This way, as expected, results give us host pairs for both directions:
Felix Measurement Service
On its own, the compiler is not able to detect packet forwarding behavior in the network. Thus, an additional tool joins Felix in monitoring packet forwarding. The measurement service creates iptables entries for selected flows on hosts given by Felix (in the form or – pairs) and uses them to count the number of packets matching flow properties. It allows packet filtering based on source and destination address, and protocol, as the compiler can determine these parameters.
In this layout, the combination of the two components (compiler and measurement service) cannot determine whether the traffic goes through the same path as the specification dictates. It assumes that if the complete sent traffic arrives to the destination, then the given path correctly performs the packet forwarding. This inadequacy supports our cause to integrate the tool with a different one that can supplement it. We give a brief description of our chosen tool, for this purpose, in the following section.
2.3. Trace Logging with SDN Traceroute
Since SDN uses different concepts than traditional networks, we can have a better success in tracing paths a packet takes when using a more adapt tool than the standard traceroute for route discovery. SDN traceroute [
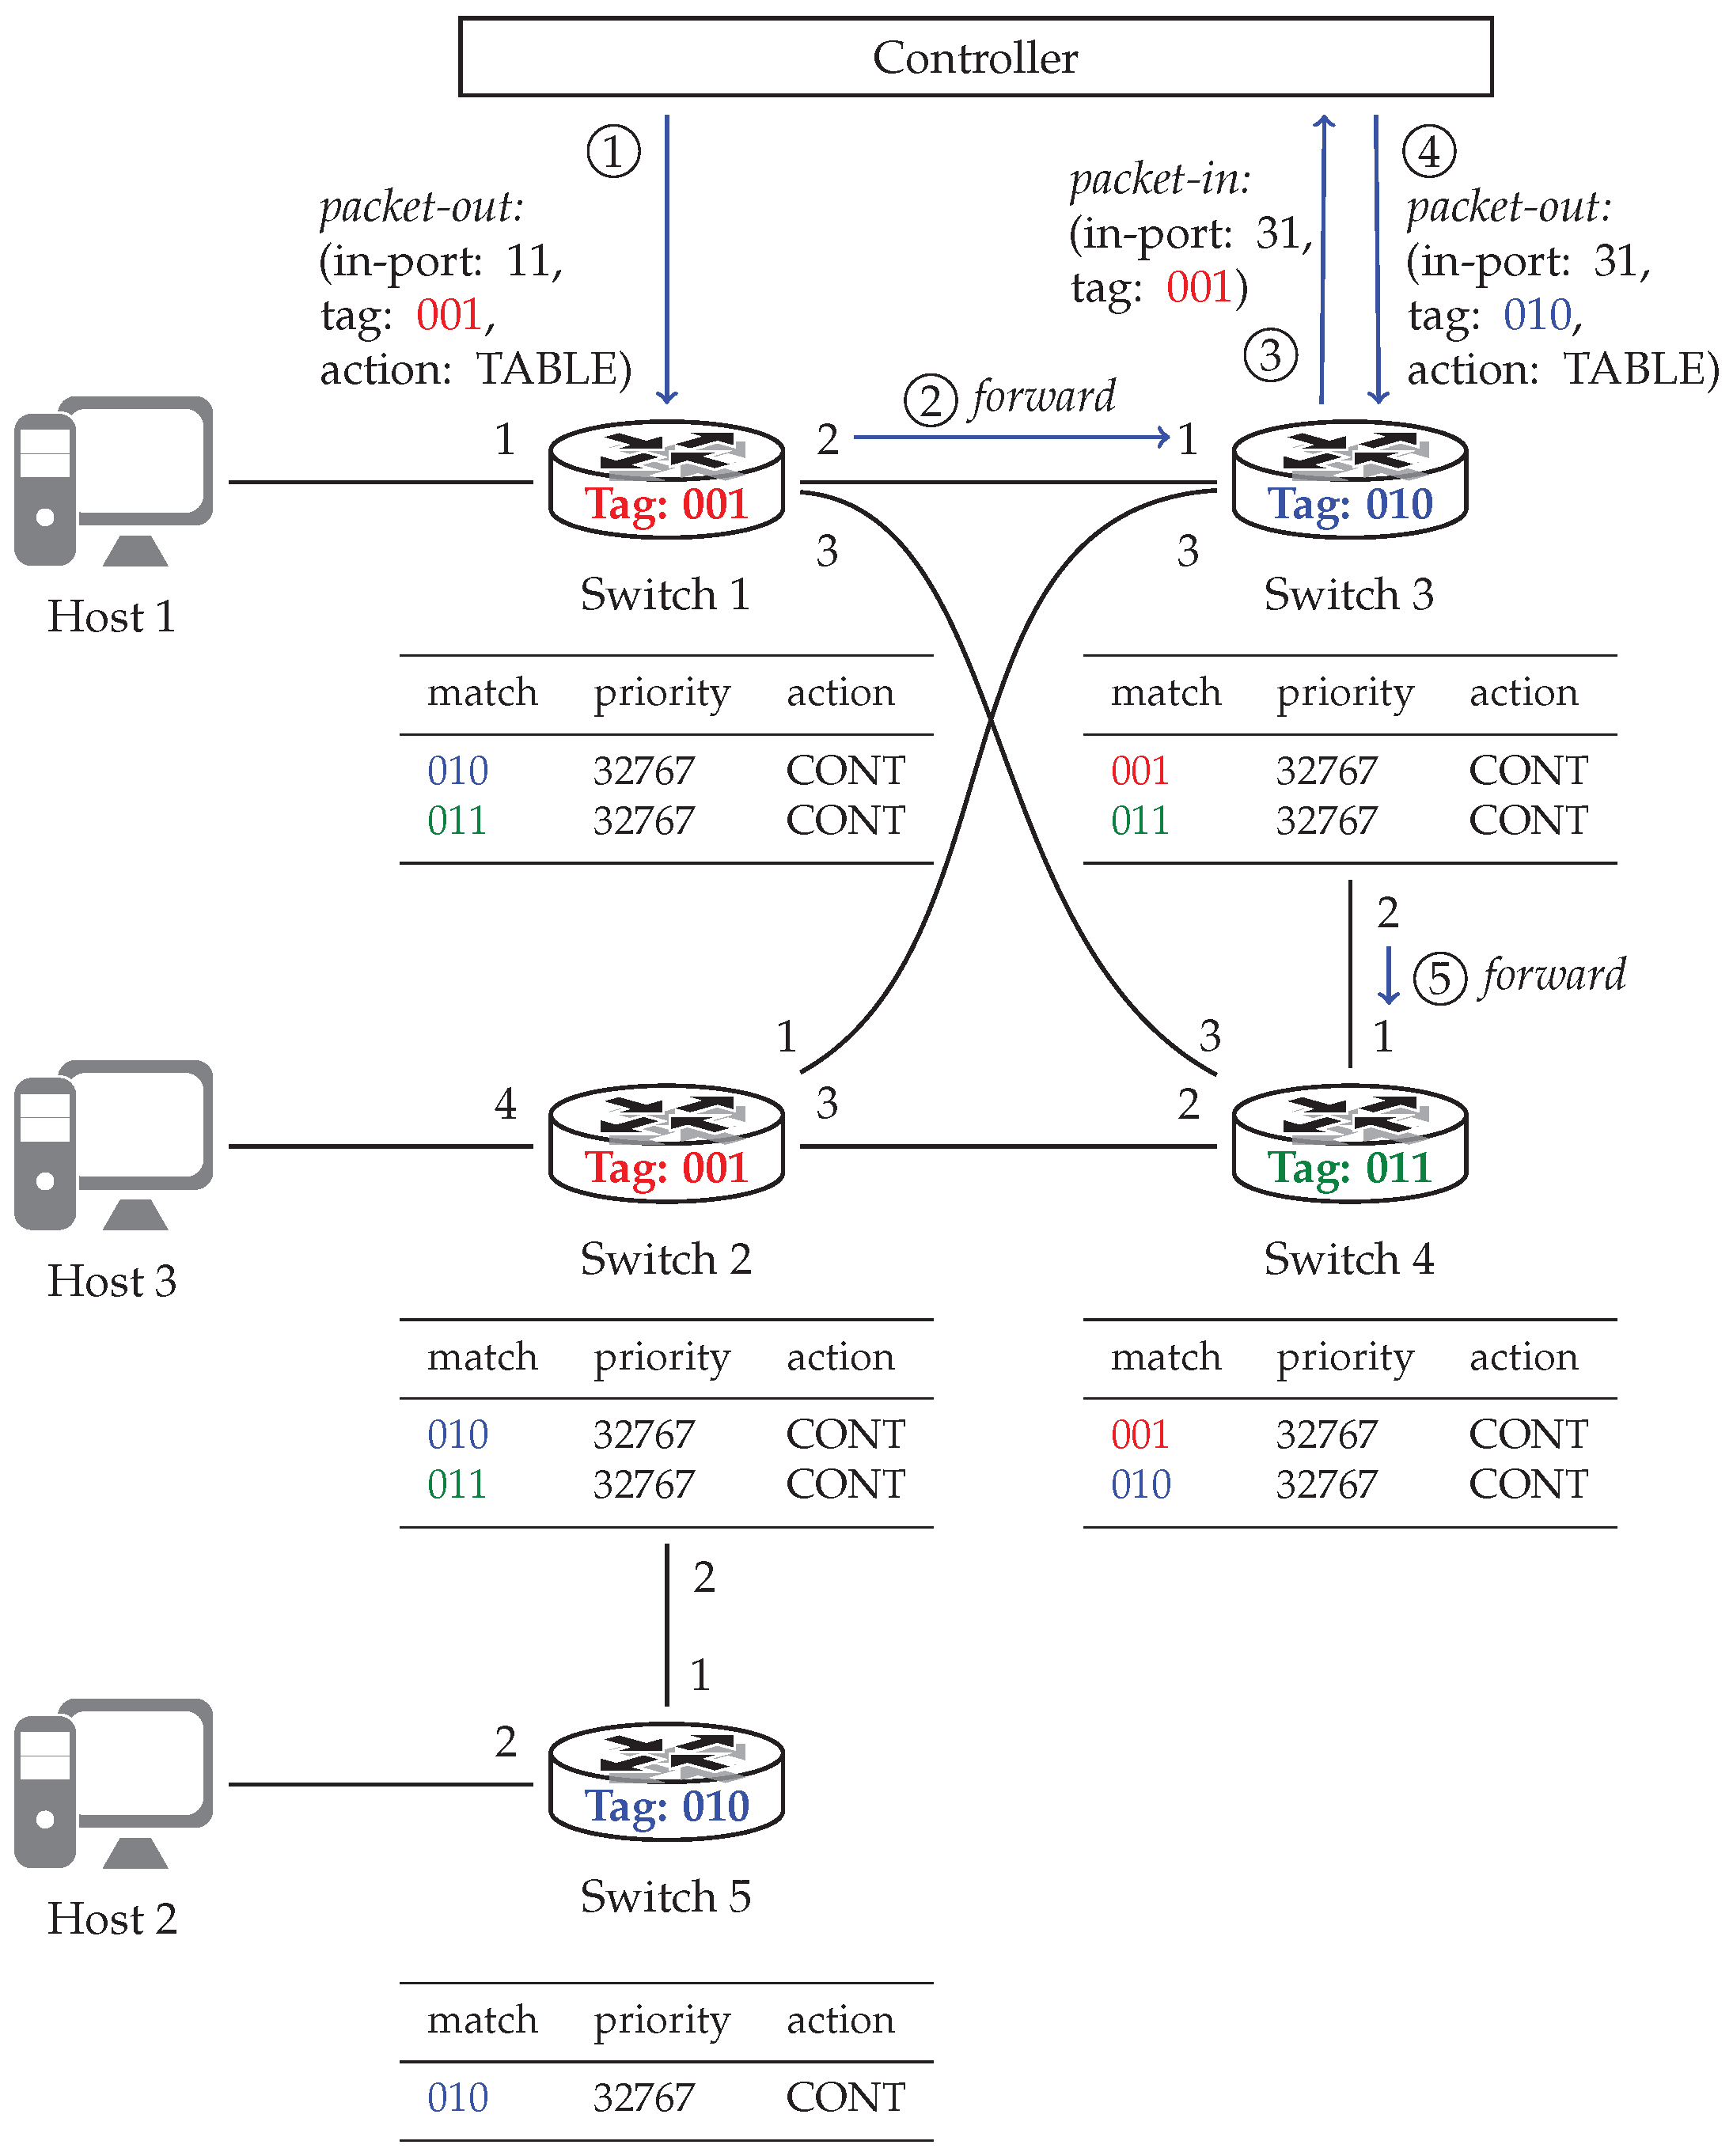
17] is a controller application that can install non-invasive rules into each connected network switch. These filter-marked packets, and thus the controller, can analyze gathered data and recreate the path the packets took. At first, SDN traceroute maps the network and discovers connections among switches. Using this information, it assigns a color to every switch so that neighboring switches get different colors. A field in the packet header—that is large enough and otherwise unused—is used for storing the color tag. After this, OpenFlow rules, with the highest priority, are installed to every switch that match every color in the network except for the color assigned to the switch at hand. At this point, the algorithm illustrated in
Figure 6 kicks in. The figure shows our previous sample network with a possible coloring. Assuming we want to trace the path from
host 1 to
host 3, we have to specify the switch that connects to the first host. Based on our packet specifications and the given switch, the controller creates a packet tagged with the color of this switch and sends it to the switch, in this case,
switch 1 (see step ①). Since the switch has no high priority rules that match the tag, it uses its forwarding rules to send out the packet in accordance with the network policy (step ②). Here the packet color matches one of the rules set by SDN traceroute, and thus, the switch sends the packet to the network controller (③), which registers the switch as the next element in the packet’s route. Following this, SDN traceroute replaces the color in the packet to match that of the second switch and sends it back to the switch (④). After this, the cycle starts anew, e.g., step ④ corresponds to step ① and step ⑤ to step ②. By the time the packet traverses the network, the controller has registered the complete path the packet had taken and reports it to the user.
The above operation clearly shows that although SDN traceroute can log the trace of a packet, it lacks automatic configuration options in a sense that the starting switch and packet parameters should be supplied manually. It can also be seen that the tool is unable to give any information about links connecting hosts and switches. We argue that the combination of the SDN traceroute and Felix tools can be a strong option for localizing failures in networks, especially when aided with a logic that can collect information about network paths from Felix and then use it to assemble test cases, execute the tools based on them, and evaluate results in an automatic manner. Thus, the next section gives the details of our framework that integrate the above tools and realize automatic failure detection by applying them.
3. Results
As suggested by the above description of the two major tools that we use, they can complement each other. Where one of them has shortcomings, the other proves to be an adequate tool. In order to integrate them, we identified the following missing features. Felix should be supplied with queries and offers no facilities to make network testing an automatic process. It also lacks the option to test whether packets truly traversed the path given by the network specification. SDN traceroute can fill in this latter inadequacy but lacks automatic connection setup with switches, automatic execution, and automatic discovery of the first switch, as well as not being able to say anything about links between switches and hosts. It is also unable to validate whether the discovered route matches the one given by the network policy.
In order to remedy these problems, we implemented a framework using the concept of
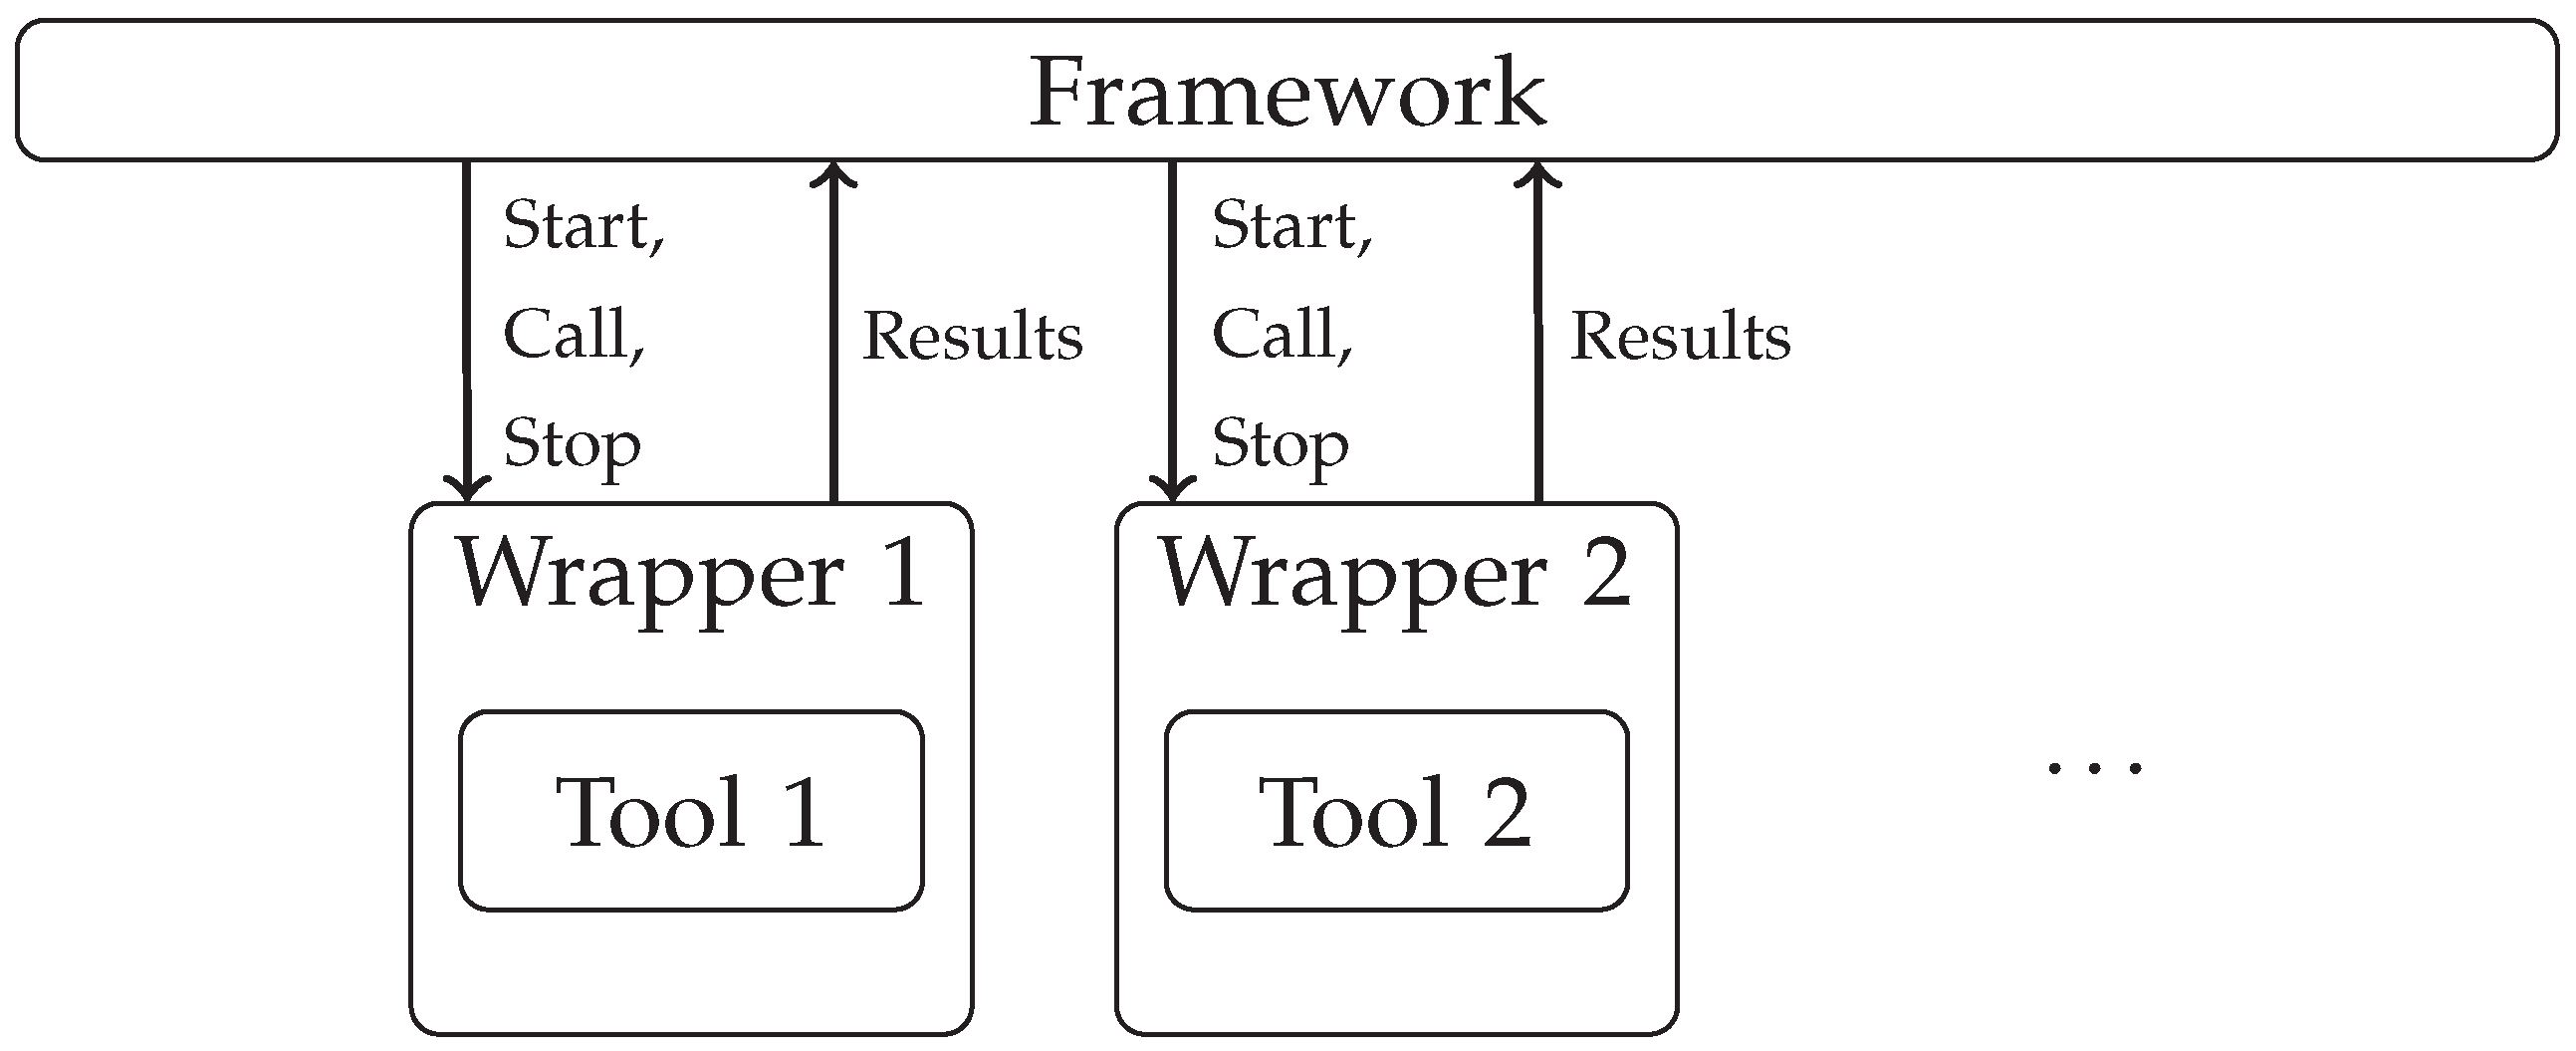
a controller for troubleshooting tools. Thus, the framework is able to call external tools via a unified interface and handle the data flow among them. Direct control of the tools is realized by wrapper components, and these wrappers are instructed by the framework as shown by
Figure 7. The framework handles life cycle management of the components via the unified control interface and is able to start, call, and stop components. The framework offers an asynchronous notification system that gets notified whenever a component generates output. The framework scheduler than schedules the calls of all those components that are subscribed to be notified for the event. Specifying the input and output data formats is the responsibility of each component. In the case of our integration of Felix and SDN traceroute, we opted to use NetKAT expressions in the processing chain; thus, the wrapper component for SDN traceroute handles conversion from NetKAT to SDN traceroute’s own input format. With this implementation, the framework is able to involve yet other tools, logging and displaying features as well.
Additionally to providing a call mechanism towards the framework, the wrappers can extend the functionality of the tools they handle. In its unwrapped form, the Felix compiler tool has a command line interface that can only be called interactively, which is unfit for automation purposes. In the tool’s case, our wrapping method made it possible for the framework to inject the required network and path specifications to the tool and receive its responses in a structured form. The measurement service tool did not provide any options for automatically setting up monitoring software on the hosts. Our wrapping solution solved this problem as well as provided higher level options to query the monitoring software instances. Dealing with SDN traceroute proved to be a similar case where the tool’s wrapper took control of starting the tool in a separated Docker environment and configuring it. By making the NetKAT network specification available to the wrapper, we were able to solve two insufficiencies of the original tool. First, the wrapper was made capable of connecting available network switches with SDN traceroute. Second, it alleviated the problems of manually specifying the switch where a certain route test should originate from.
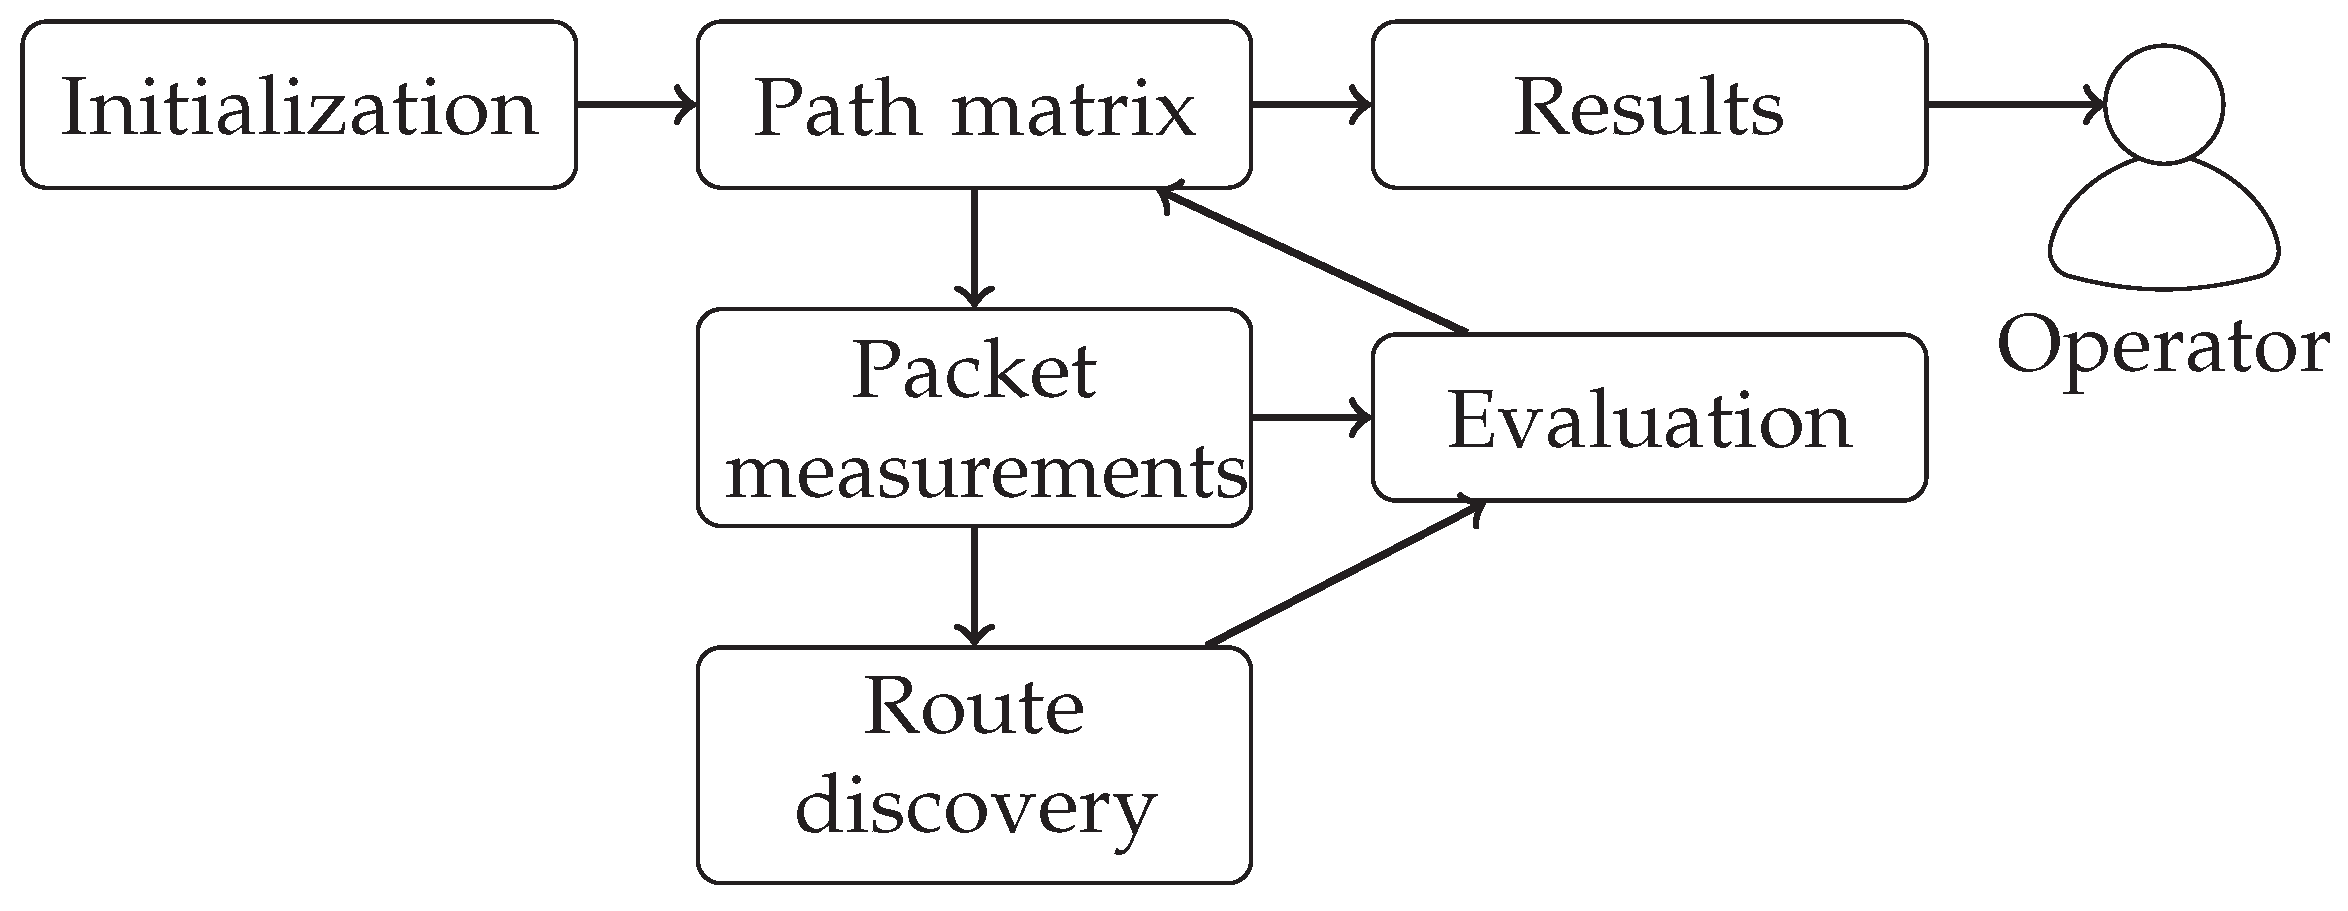
Figure 8 shows the basic steps that the framework follows in order to localize failures in a network. In the
initialization phase, it performs basic tests on the network specification and stores the results in a component, named the
Path matrix, which plays a key role during the execution. Based on the data gathered from the network specification, the framework starts testing the physical network with
packet measurements where connectivity between hosts is checked. At the
evaluation phase, the framework analyzes the results and stores them in the Path matrix. At the same time, a
route discovery is performed to check which exact path the traffic takes; the results are stored again at the Path matrix after evaluating them. As
results, the framework displays possible points of failure to a human
operator as a last step. In the following, we detail the above phases.
Initialization
In this phase, the framework calls Felix to determine for every link in the network which paths they belong to. It defines paths as sets of links between two given hosts. In order to gain knowledge about the network, first the predefined network topology and policy are read. Remember, creating a network topology in NetKAT is easy, and network policy can also be determined based on a high-level specification using the Frenetic compilation steps, as per
Section 2.1. When the network specification is available, the framework generates Felix query expressions based on it for every link in the network. This set of queries is then supplied to Felix together with the specification. In return, Felix gives the framework a list of host pairs among which traffic can pass through the given links. We store this information with the Path matrix component. For the queries, we use the following form (as discussed in
Section 2.2):
The phase is also used for performing the initialization of the measurement service and the SDN traceroute tools via their respective wrapper components. Initialization of the measurement service involves starting the appropriate software components on each host and configuring them to filter specific packets. As discussed above, these tasks are completed automatically on the remote hosts, as well as initiating the SDN traceroute tool.
Path Matrix
As a major part of framework functionality, we implemented the data storing features in a component called the path matrix. Its role is to store link-related data and provide the apparatus for different queries. Two kinds of information can be stored within the component:
Route information: For every host pair, the component stores the links that are involved in relaying packets between the two end points. The framework uses data acquired in the initialization step to compile such information;
Test information: For every link, the component stores the test results gained while testing the network during the packet measurement and route discovery steps. Test results define if testing a host pair was successful or not.
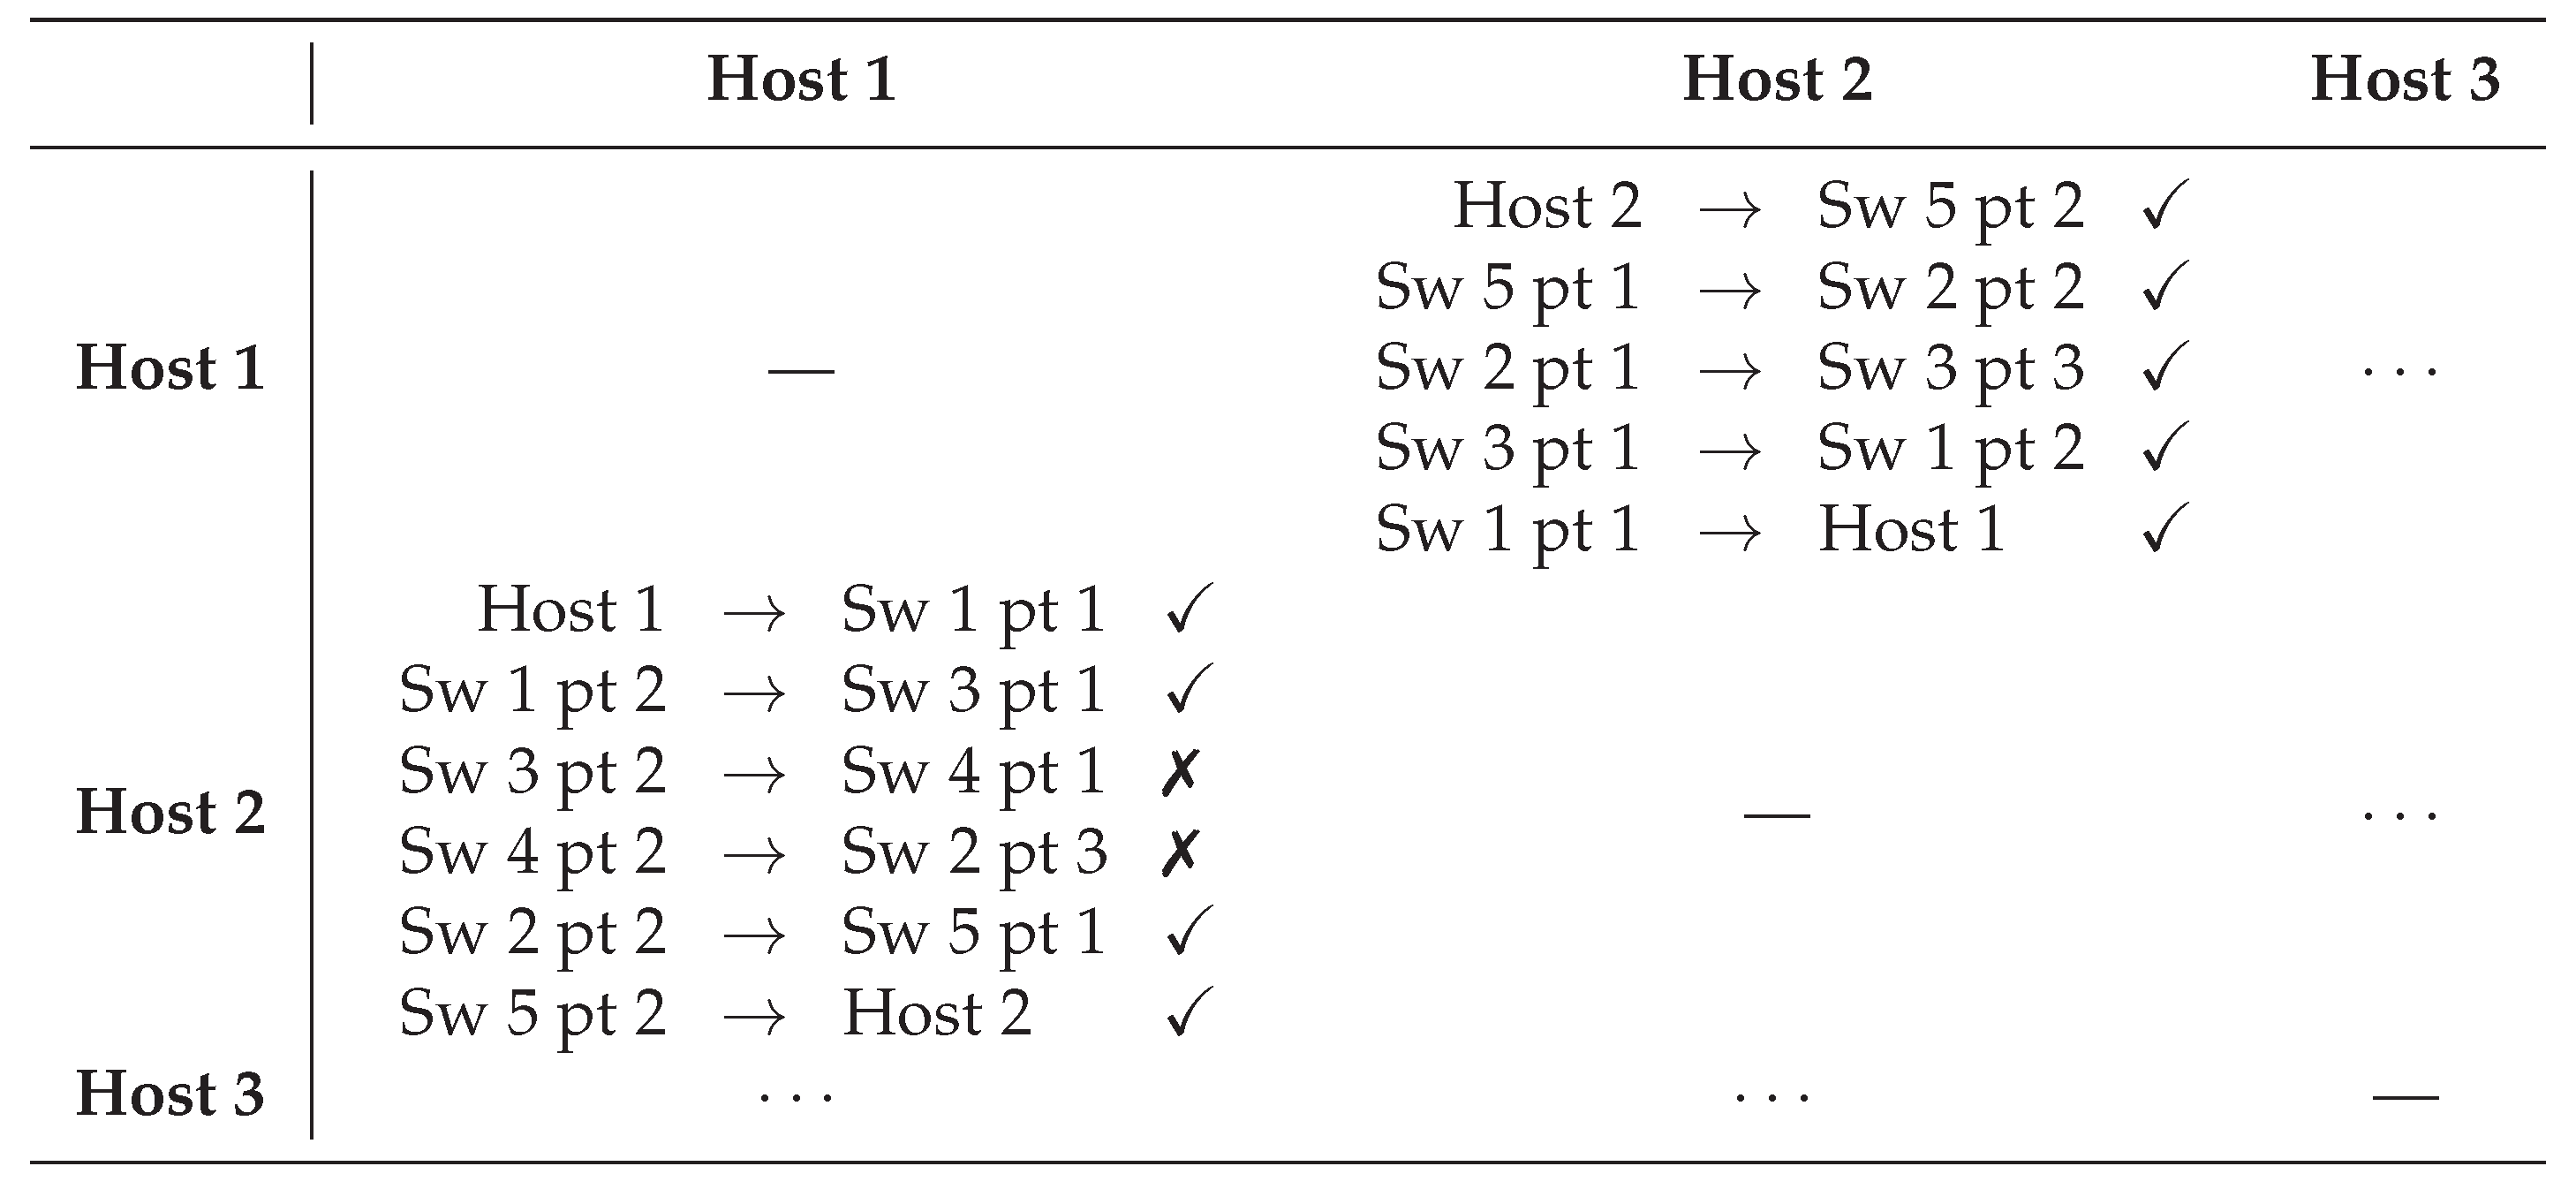
Figure 9 shows a sample of the data stored by the Path matrix component when testing the network of
Figure 4. In this sample case, the results show that testing the path from
host 1 to
host 2 proved to be unsuccessful, while the reverse direction works as expected. If we analyze the results, we can see that packets from
host 1 reach
host 2, but they skip
switch 4. The simplest explanation for this behavior would be that packet forwarding in the physical network does not match the specification and the network forwards packets via the link between switches 3 and 2 instead of routing them via
switch 4.
We made host connection information acquirable from the component. In this case, it lists each possible host pair in the network and, based on stored data, relays information about whether the end points are connected or not. These data are used later by the framework for generating test cases. While the Path matrix component assigns information to links, results can be accessed on a port basis, as each link is identified by its two end points. We designed a method to access this information as well, in the case of possible failures: The component relays a list of ports that are suspicious as being faulty. Data accessed this way are used when summarizing results for the operator.
Packet Measurements and Evaluation
In this phase, the framework first queries the Path matrix component for a list of host pairs. It selects those pairs that should be able to reach each other based on the network specification. The framework then iterates this list by taking one host pair at a time. First it executes a baseline measurement using the measurement service on both members of the host pair, then it injects traffic at the first member of the host pair.
For injecting the traffic, we used a wrapped version of a third party tool, called nping, which is able to send packets from a host to another using different protocols. The wrapper makes the tool able to be executed on remote hosts also. In our proof-of-concept implementation, we assumed that packets traverse the same path independently of their protocol, and thus, we used internet control message protocol (ICMP) packets. Note that NetKAT can describe different forwarding paths for packets with different protocols, and Felix is also able to make decisions based on this. Our framework could have taken advantage of this feature also, but it would have increased the complexity of our failure detection; thus, we opted not to use it.
When traffic injection completes, the framework repeats the packet count measurement and compares it with its baseline. When it identifies that the increase in packet counts corresponds to the number of the injected packets, it assumes that the path between the two end points works correctly. Thus, it updates each link’s state in the Path matrix between these two end points to correct. Otherwise, it sets the states of all these links to incorrect.
Route Discovery and Evaluation
Since the tools in the previous phase cannot detect the path taken by the injected packets, the framework has to run another tool that can determine it. It uses SDN traceroute for the job. It determines the first switch in the link with the help of the NetKAT specification and configures SDN traceroute to send its monitoring packet there. It then follows up on the output—the discovered path—of SDN traceroute and compares that with the path that the network specification indicates. In order to do so, the framework queries Felix again, with the exact route supplied by SDN traceroute. The output of SDN traceroute identifies the switches that pop up during the trace, so the framework formulates Felix link expressions based on that. The framework uses Felix’s answers in a somewhat “reversed” way where it inspects if the currently tested host pair is among those returned by Felix. If so, it is safe to assume that traffic passed through the same route given by the specification. In this case, the framework sets the state of the links in this path (except for the links connecting the hosts with switches) to correct. Otherwise, the path diverges somewhere form the specification. To determine this, the framework creates a series of Felix queries that take longer and longer parts of the SDN traceroute path and validate whether that is part of the route. It uses the following Felix query expression to achieve this:
The framework uses the same approach as before to test the point at which the operation of the physical network does not match the specification. At the first segment of the route where the output of SDN traceroute and Felix disagree, it locates the first link that is not part of the route. At this point, the framework sets every link’s state to correct except for the one preceding the diverging link, which it marks as incorrect. It does not change the state of the rest of the links on the path, since tests do not reveal any information about them at this point.
The framework can also identify cases when the monitoring packet did not reach the target host. In these cases, it uses the above query expression and the complete trace that SDN traceroute returned. If Felix can identify the currently tested host pair based on the query expression, then the framework can safely assume that the path returned by SDN traceroute is only a section of the complete path between the two end points.
Results
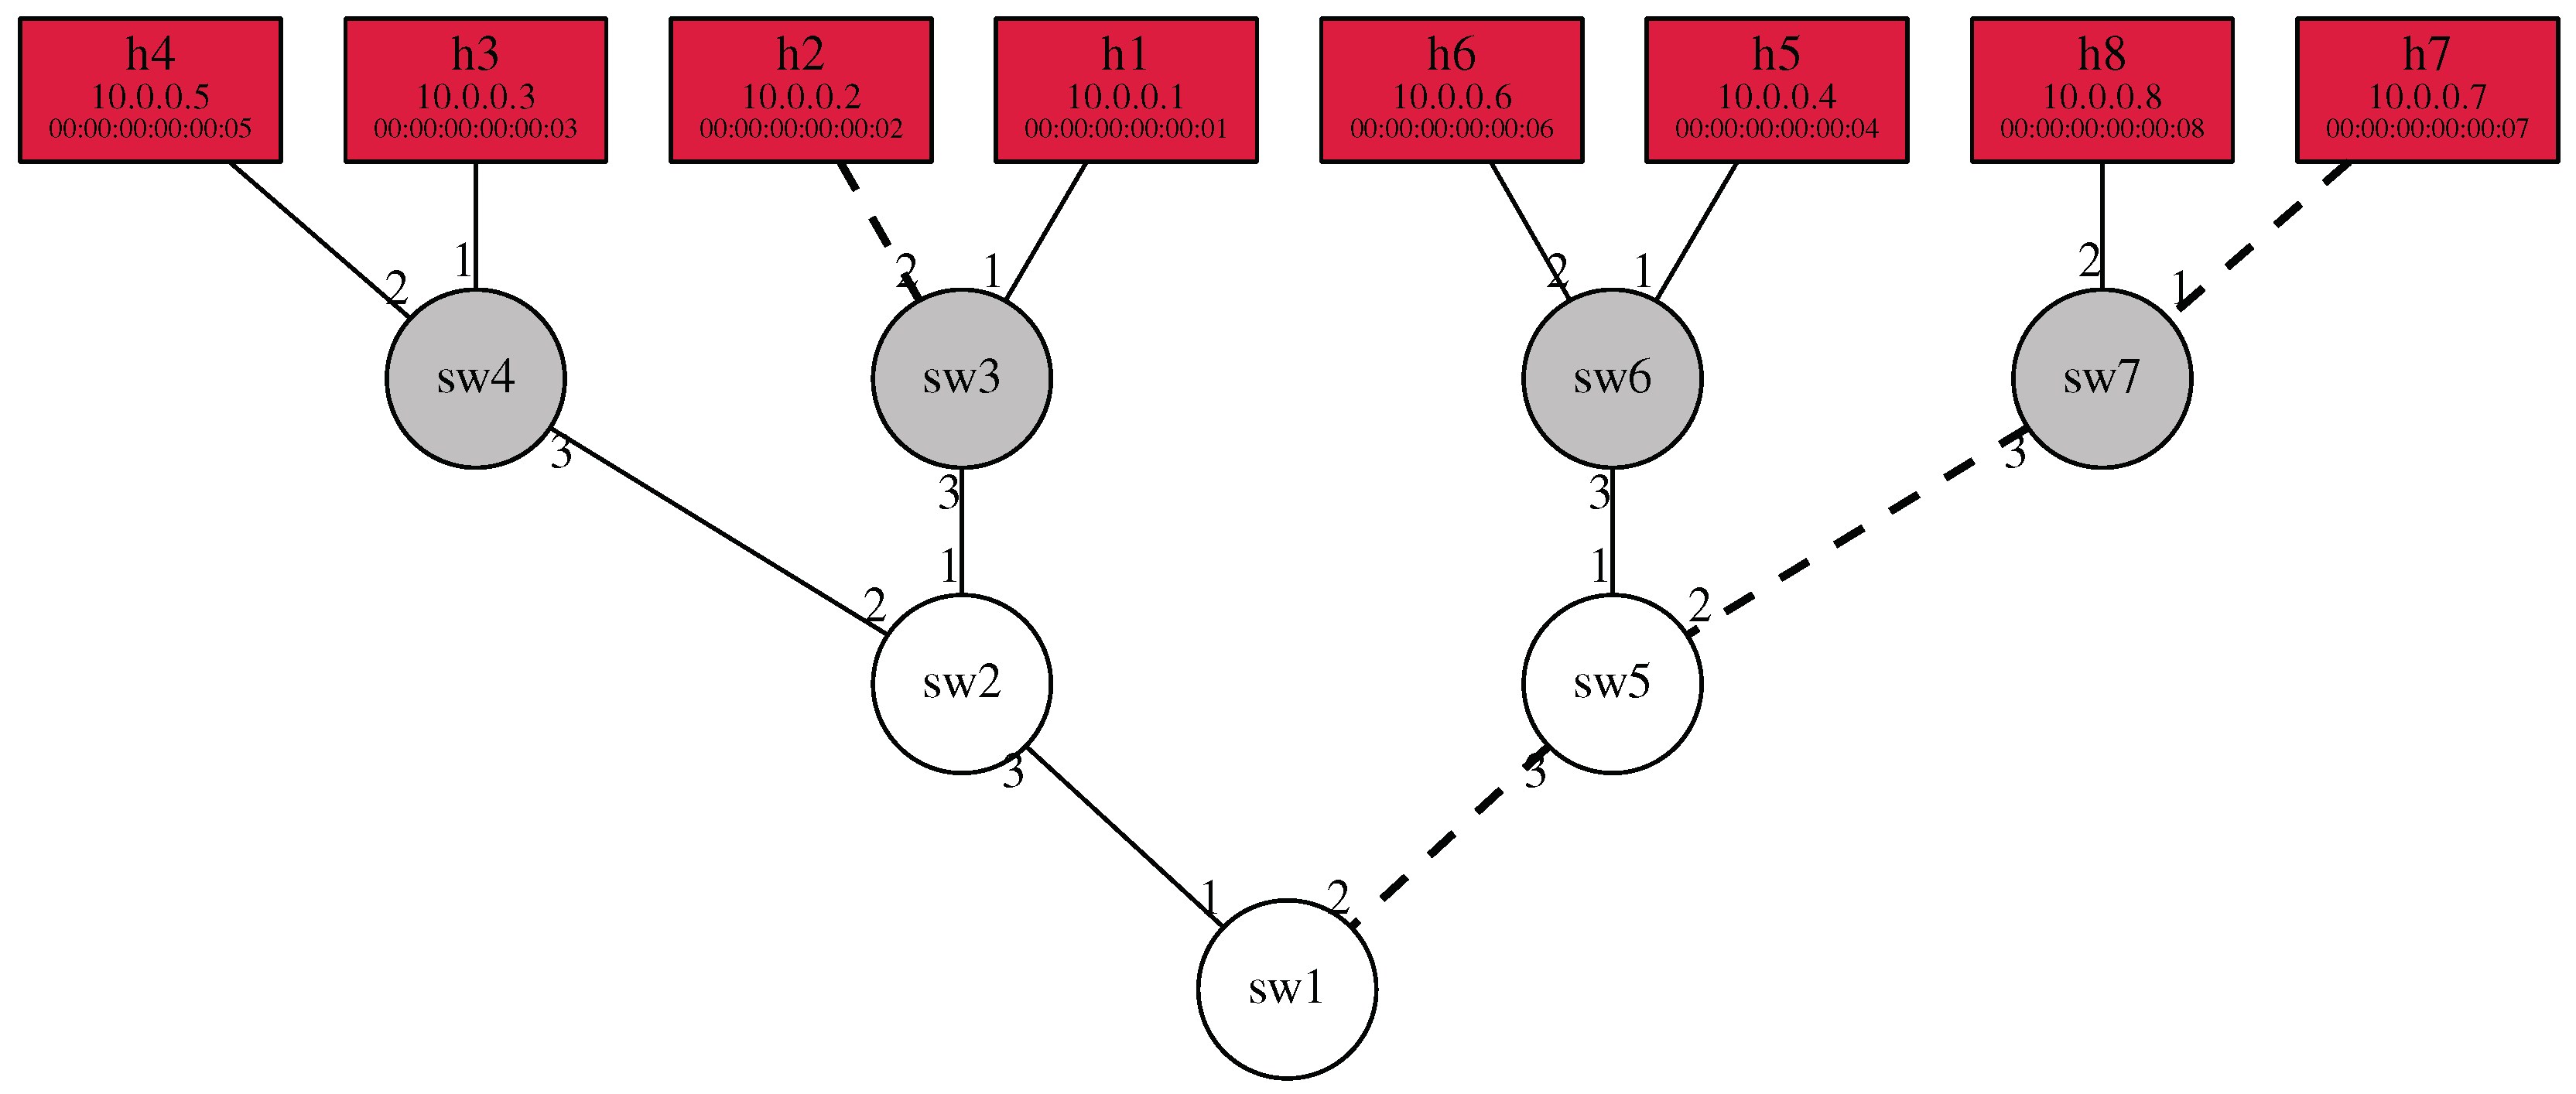
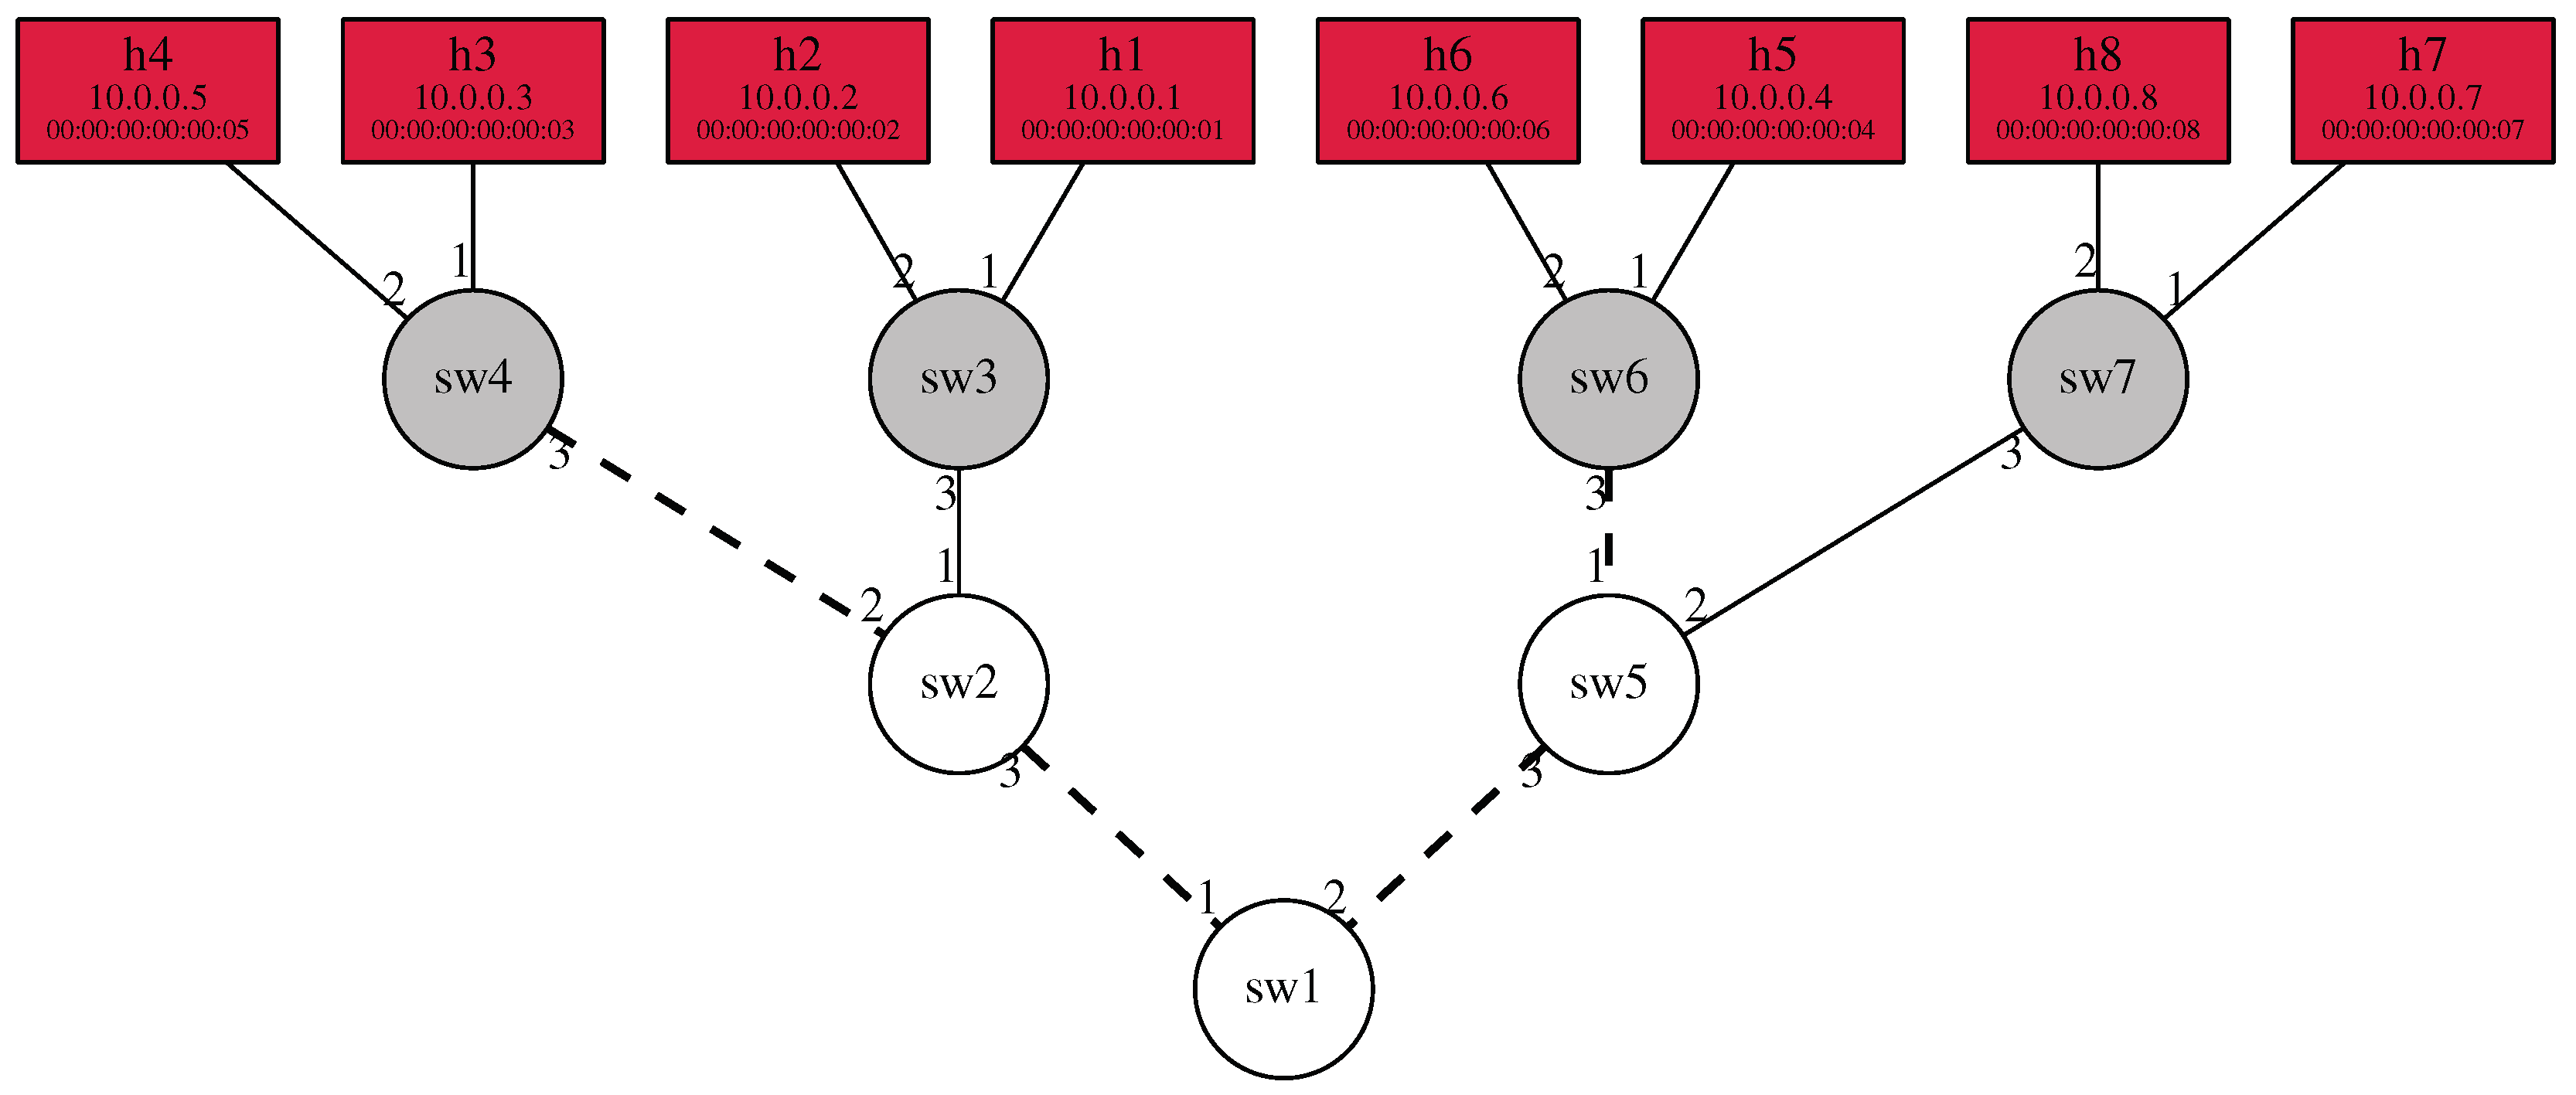
As the execution progresses by processing new host pairs, the Path matrix component is updated with new information at each iteration. The current state of possible port or link failures is relayed to a human operator in real time by the framework. Failing links are identified on the graphical representation of the network with dashed lines, as
Figure 10 shows. This display method acts as a sort of heat map where the thickness of a line grows in proportion with the rate of failing test cases compared with passing test cases. In order to better understand the nature of the failure, a summary of failing and passing test cases with respect to network links is also displayed in a table format. Using this, the operator can determine whether issues affect only certain flows at a given switch port or every one of them.
6. Related Work
DYSWIS
The DYSWIS (Do You See What I See) tool [
20] handles troubleshooting-related issues in VoIP service provided in traditional networks. It can perform active and passive tests at multiple points in the network in order to automatically locate errors. The tool uses two types of special network nodes. The detection nodes detect errors applying passive traffic monitoring and active testing. The diagnostic nodes find out the root causes by examining historical data of similar errors. The first type of nodes can apply standard or custom-made testing tools like ping or traceroute or more complex ones. The latter nodes are able to draw conclusions based on the observed symptoms and instruct other nodes to perform specific tests.
The special network nodes work in a distributed manner, and when one of them detects an issue, it combines data from earlier cases and current observations made by other nodes. An estimation of the root cause is then given by an inference process using a rule-based system where the rules describe the dependencies among the network components. The combined view of the whole network can help the tool to narrow down the location of the issue at hand. Executing more steps of testing and comparing the results with historical data narrows down the failure mode and location even more. Eventually, an operator is notified who is responsible for interpreting the end results and applying fixes.
Our framework also applies external tools to test the network, but our main focus was on SDN. In our case, parts of the monitoring tool run in a distributed manner on hosts, while the core part runs at a centralized location. We did not compare current network operation to historical data but to a formal specification of the network.
Differential Provenance
The problem of network failure detection and root cause analysis is tackled in a different way in the case of DiffProb [
21]. The tool is able to detect SDN and Map Reduce related issues. The first case includes the detection of erroneous flow entries, inconsistencies affecting multiple controllers, unexpected timeout of rules, and multiple erroneous flow entries, while the latter lists configuration change and code change problems.
The tool uses the concept of differential provenance. A provenance graph is a DAG (Directed Acyclic Graph) that shows the relationship among network events. Nodes of the graph are the events, and two nodes are connected by a graph edge when the event signified by one of the nodes is a direct consequence of the other. With such a graph and appropriately selected methods, steps (network events) resulting in errors can be retraced to the root cause. The authors argue that their method of retracing errors to their origin works with any error type.
To achieve their goal, they used two provenance graphs, one that is captured when the network is in a faulty state and the other that is comparable (similar enough) to the first graph but was recorded as a baseline when the network was in a correct state or in a similar network having the same characteristics as the one under investigation. A reference event is chosen that keeps the network in a correct state and is similar enough to the event under scrutiny. With the reference event, a reference graph is built. When finding events that are similar enough, most of the nodes in the two graphs will be common, and this makes the root cause localization much simpler. The difference between two graphs is still big enough that they cannot be directly compared. Since nodes describe only similar cases, when we move further away in the graph, these small differences add up, and they might cause serious differences at the end until the point that the difference might be so big that comparing the two graphs would be totally pointless.
In order to tackle this problem, a proprietary algorithm is used that first selects two “seed” nodes: One that caused the error signal, and the other that is the reference event. The algorithm conceptually turns back the network state of the provenance graph containing the network failure until it reaches an adequate point. Then, it replaces a “bad” node with a “good” node. At this point, a new provenance graph is “grown” from the replaced node by advancing the network state. By repeating this process, the base provenance graph containing the failure becomes more and more similar to the correct graph until they become exactly the same. After this, the algorithm gives the steps that cause the differences between the two graphs (ideally, there is only one). These steps give the best estimation about the root cause of the failure.
With this tool network, events are passively collected; thus, it has no means to direct which parts of the network get tested, while the baseline of correct operation is again set by historical data.
Trumpet
The Trumpet tool [
22] targets data center use-cases where fine grained time resolution of event history is beneficial. With this approach, the possibility of detecting temporary congestion or unbalance among the servers can be increased. The tool still provides statistics aggregated on a longer timescale for operators to analyze network performance.
The tool applies active monitoring and, based on that, it can automatically intervene with the network behavior in order to solve the problem. It runs on the end devices of the network and leverages their significant compute capacity and easy programmability. Trumpet can monitor network-level events defined by users. With its proprietary predicate-based language, network events such as one data flow causing others to congest, aggregated traffic arriving to a host reaching a given limit or packet loss occurring in bursts can be checked. These network-level events definitions are sent to an event manager that runs on a central controller. This in turn installs the definitions to the end devices. On these devices, a trigger event is generated in the packet monitor software instance when the defined conditions are met. A signal is then sent to the manager entity that can aggregate all such signals from every host. Based on the aggregated network view, the manager is able to check the existence of the requested network level event.
Trumpet uses active probing but has a different goal than ours. It focuses on collecting monitoring data in the shortest timespan based on network events. The tool needs to be configured to monitor certain events, while our framework is able to generate network-wide tests on its own.
SDNProbe
A recent tool discussed in [
16] proposes the most similar solution to ours. It discovers connections in an SDN by accessing network controller information and, based on this, creates random paths in the network to be tested. Then, a minimum set of test packets is generated by the controller to traverse these paths. The packets are collected at the target end of the path, and analysis of correct behavior is performed also at the controller side. If a path is identified as being faulty, it is split into separate sections, which are then retested. This process is repeated until only a single node is located as the cause of the issue.
Test packet generation is based on solving the minimum legal path cover problem, which creates the minimum set of paths that cover legal paths in the network. The approach has the clear advantage over ours that it tests fewer paths in the network while still checking each legal path. The result of this is shorter execution time and less strain on the network. Our method of generating test paths could be modified in a similar manner while still retaining host checking capabilities that SDNProbe lacks. This would involve changing the method of initializing and querying the Path matrix component to handle groups of hosts that can be tested using a shared path. By using network topology and policy information together, NetKAT is certainly able to handle queries about shared paths or segments. To a certain extent, Felix can supply this information using more complex queries and post-processing. Such modifications would, however, make the initialization process much slower. By providing deeper integration with the NetKAT language and creating a custom-built reasoning engine, we could alleviate this issue. This latter approach, on the other hand, is orthogonal to our aims of building a modular troubleshooting controller on existing components. With the extension of current implementation, we would also be able to test such host pairs that should not be allowed to have access to each other (in cases of network slicing). This would not be feasible with SDNProbe, however, since it concentrates solely on legal network paths.
Epoxide
Epoxide is an execution framework that is able to reuse different existing troubleshooting tools and connect them in a formalized manner [
23,
24,
25]. In order to realize this, it provides a framework for executing any external command line tool and offers an interface for wrapping them. The tool is capable of executing diverse troubleshooting scenarios, but it lacks the ability to detect failures in a complex SDN scenario.
As we can see from the above cases, most state-of-the-art tools are still used for giving advice to operators on different levels and help them to locate root-causes. Automatic intervention in network state is still limited; on their own, they do not provide means for incorporating such abilities.


