Abstract
A conventional Wireless Sensor Network (WSN) cannot have an infinite lifetime without a battery recharge or replacement. Energy Harvesting (EH), from environmental energy sources, is a promising technology to provide sustainable powering for a WSN. In this paper, we propose and investigate a novel predictive energy management framework that combines the Maximal Power Transferring Tracking (MPTT) algorithm, a predictive energy allocation strategy, and a high efficiency transmission power control mechanism: First, the MPTT optimal working point guarantees minimum power loss of the EH-WSN system; Then, by exactly predicting the upcoming available energy, the power allocation strategy regulates EH-nodes’ duty cycle accurately to minimize the power failure time; Ultimately, the transmission power control module further improves energy efficiency by dynamically selecting the optimum matching transmission power level with minimum energy consumption. A wind energy powered wireless sensor system has been equipped and tested to validate the effectiveness of the proposed scheme. Results indicate that compared with other predictive energy managers, the proposed mechanism incurs relatively low power failure time while maintaining a high-energy conversion rate.
1. Introduction
The Internet of Things (IoT) is an emerging paradigm that aims to provide reliable access to heterogeneous and distributed data and may represent a good solution for the smart lives of the future. However, this new paradigm raises a number of scientific and technological challenges related to sensor technology that must be addressed comprehensively, of which the Wireless Sensor Network (WSN) issue has attracted much attention. Generally, the limited available lifetime is a key bottleneck for most battery-powered WSN, therefore, harvesting energy from the environment has been widely investigated to ensure the sustainability of WSN. As for this Energy Harvesting-WSN (EH-WSN), many studies have been carried out and achieved some accomplishment [1,2,3]. However, there are still existing problems: For many long-term applications, replacing the batteries of every EH-nodes is not a feasible solution if they are deployed in a harsh environment or if the network has a large size. A promising approach to tackle this is to enable the nodes to be entirely powered by the energy harvested in their environment.
For a typical EH-WSN, each node is equipped with at least one energy harvester and one or more energy storage devices. The purpose of storage device is to buffer energy to allow the node surviving periods when the harvested energy is not enough. To achieve prolonged lifespan with dynamic ambient power, an energy management strategy is indispensable in an EH-WSN system, with its main purpose to matching the system energy consumption with the ambient energy generation, which enables “Energy Neutral Operation (ENO)” [4].
On the whole, the main research issue of power management in EH-WSN lies in two aspects: How to maximize the harvested energy and how to maximize the energy utilization efficiency. Hence, harvesting circuits designed for different energy sources has been deeply researched and the Maximal Power Point Tracking (MPPT) algorithm has been implemented in some studies [5,6]. However, concerning the conventional harvesting module, which is always cumbersome and massy, EH-WSN systems with small physical size and constrained energy storage capacity (supercapacitor) are more suitable for future smart applications (such as smart forest and smart agriculture) [7,8], and it is also our focus. Concerning this light-weighted smart EH-WSN, power management faces great challenges due to the small capacity of the supercapacitor and an ultralow energy harvesting rate, therefore the existing harvesting method and energy allocation strategy should adapt to the individual characteristic of environmental energy source, calculate the optimal working point efficiently, and reallocate the energy effectively.
Besides the energy uncertainty, another concern is the interconnections of EH-nodes. For a smart EH-node with constrained resource, it is nontrivial to achieve energy efficient communication over varying wireless channel. Thus, the Transmission Power Control (TPC) function is needed to regulate the wireless transmission power based on the link quality. Here two indexes: Received Signal Strength Index (RSSI) and Packet Error Rate (PER), are often used as the indicator of wireless link quality [9,10]. Therefore, by periodically exploring the link quality, the transmission power can be updated to maintain a stable RSSI or PER at the receiver.
Unlike traditional EH systems, smart EH-WSN has more constrained resources. With variable environment (available ambient energy and wireless channel condition) and scarce hardware capability, designing a specialized power manager to achieve a low power failure rate and high energy-utilization efficiency becomes a challenging issue for a smart EH-WSN system. Here we study a novel predictive power management framework, which combines optimal working point, predictive energy allocation, and best-matching transmission power control for the EH-WSN system. The optimization purposes are to minimize the power failure time, as well as maximize the energy utilization efficiency under energy harvesting constraints. To the best of our knowledge, this is the first work to analyze energy management optimization in EH-WSN jointly from the above three perspectives.
2. Motivation and Related Work
Recently, there are several works in which the authors use MPPT, incoming energy prediction and TPC techniques to optimize EH-WSN’s performance:
2.1. MPPT Mechanism
In a typical application of EH-WSN, power is harvested from the energy sources to a converter usually in DC-DC type and then from the converter to the energy storage. The charge controller with MPPT keeps track of the output of the energy sources and comparing it with the storage’s voltage. Continuously, it figures out the best power that the sources can potentially put out in order to charge the storage. Saroj Mondal et al. presented a fully integrated photovoltaic power harvesting system with a low-overhead adaptive MPPT scheme for powering an IoT node [11]. The proposed scheme tracked the maximum power point within 12 us by utilizing an inherent negative feedback loop, within a tracking error of 0.6%. Using a commercially available solar cell of area 11.3 cm2, the proposed system could provide 833 uW power with a light intensity of 600 lux. Amzar Omairi et al. introduced a Semi-Pilot Cell Fractional Open-Circuit Voltage MPPT concept, it featured less complicated configuration with reduced hardware requirements and lower cost, the comparison result has shown improvement in providing precise calculation of the new maximum power point whenever there is an irradiance change [12]. Christos Konstantopoulos et al. designed a self-powered battery-less electric potential wireless sensor that harvests near-maximum energy from the avocado plant and transmits a signal tens of meters away. By designing the DC-DC power converter to operate in the input voltage range 0.5–0.7 V, the power generated by the plant kept close to the corresponding MPP in the time-varying power-voltage curves during the day [13]. Base on all those studies, we find that although the energy sources could work at its MPP, however, the DC-DC converter usually may not work with its maximum efficiency, so the overall energy harvested into the storage also may not be the maximal value. Hence, we need to solve an improved problem: Maximum Power Transfer Tracking (MPTT).
2.2. Predictive Energy Management
Trong Nhan Le et al. proposed a predictive wake-up power manager for wireless nodes powered by periodic energy sources [14]. The main improvement was that the average number of wake-up variations has significantly reduced. Fayçal Ait Aoudia et al. presented a gradual power manager for EH-WSN powered by pseudo-periodic energy sources [15], it was able to supply high average throughput while maintaining a low throughput variability with respect to time. Paper [16] investigated how to design a wireless powered sensor network with minimal power requirements optimally: it formulated an optimization problem to minimize the total energy consumption at two remote radio units by jointly optimizing the energy beam forming and the time assignment.
In general, existing energy managements can be categorized into two main types: non-predictive and predictive. Non-predictive scheme assigns workload according to the residual energy of the storage device. As a conservative way of workload assignment, low energy utilization is ordinary. On the contrary, the innovation of ambient energy predictor has made it feasible to anticipate and pre-allocate the future incoming energy. Thus, the predictive energy allocation algorithm obviously supports higher energy consuming rate comparing with the non-predictive allocation algorithm. However, it has more power failure risk at the meantime, in fact energy predictor is error prone in practical deployment and its working applicability is affected by many factors, such as temperature, humidness and gas composition, etc.: If it ever predicts the incoming energy, the power allocation mechanism will assign a higher power consumption rate to the node, which potentially leads to power failure of the system.
2.3. Transmission Power Control
TPC is an efficient technique of power management in a wireless communication system. It needs interactive information between the sender and receiver. By periodically probing the channel condition (RSSI or PER), the sender can track the wireless link quality and select an efficient and effective transmission power.
Yunquan Dong et al. investigated the weighted-sum distortion minimization problem in transmitting two correlated Gaussian sources over Gaussian channels using two EH-nodes. They developed an off-line and an online power control policies to optimize the transmission power of two nodes [17]. Alyssa Kody et al. considered an EH-node equipped with a piezoelectric vibration energy harvester, which is excited by a series of periodic base acceleration impulses. They maximized the bits of data transmitted from the node over a fixed period through the control of transmission power and transducer current [18].
In addition to the above literatures, there are still some deep studies focused on the TPC problem [19,20]. Nevertheless, due to the dynamic voltage of supercapacitor, a voltage regulator is needed to supply stable voltage to the wireless sensor node. The power dissipation of this regulator should also be taken into consideration when choosing the optimal working point. Therefore, it is unclear whether the TPC technique can still achieve the best energy efficiency.
2.4. Joint Optimization Design
Based on the above related works, some researchers continue to work on the strategy of combining different techniques together to jointly optimize the performance of EH-WSN: wireless energy harvesting, wake-up radio scheme, and error control coding are investigated as enabling solutions to enhance the performance of WSN while reducing its carbon footprint in reference [21], it formulates the data-utility lifetime trade-off problem by taking an approximated lifetime function as well as the energy harvesting, wake up radio duty cycling, and retransmissions into the utility function. Castagnetti et al. propose a global power management approach for EH-nodes. It is based on a joint duty-cycle optimization and transmission power control. By simultaneously adapting both parameters, the node can maximize the number of transmitted packets while respecting the limited and time-varying amount of available energy [22]. Stefano Basagni et al. propose a strategy, named wake-up and harvesting-based energy predictive forwarding, leverages the combination of prediction-based techniques and Markov Decision Processes to allow each node in the network to take pro-active forwarding and energy allocation decisions [23], results show that this approach delivers up to 72% more packets, 1.6 times faster, and consuming 58% less energy than EHWA. Especially reference [24] presents a power management technique for improving the efficiency of harvesting energy from air-flows in WSN application. The architecture consists of a two-stage energy conversion circuit: an AC-DC converter followed by a DC-DC buck-boost regulator with MPPT capability. The key feature is the adaptive hybrid voltage rectifier, which exploits both passive and active topologies combined with power prediction algorithms.
However, all these studies do not consider both the energy harvesting and consuming together as a whole, so in order to maximize the entire energy efficiency of EH-WSN system while keeping the network service acceptable, joint optimization of MPPT parameters, predictive energy allocation algorithm and TPC settings are definitely essential and extremely important.
3. System Model
In this section, we present the EH-WSN system model, including the hardware model, the wireless link model, and the energy consumption model.
3.1. Hardware Model
Recently, scientific explorations show that wind energy could become a potential source to harvest for powering small autonomous sensors [25,26]. Such EH-sensor does not need harsh working conditions and provide a new sight for EH-WSN in the forest. Accordingly, we conduct the research and design of a prototype wind-powered wireless sensor node, with its block diagram shown below in Figure 1.
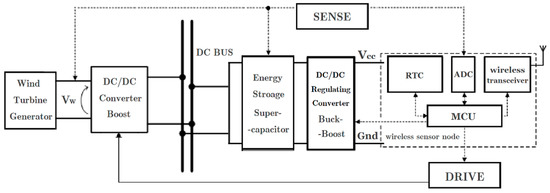
Figure 1.
Block diagram of the proposed Energy Harvesting (EH)-node.
The wind-powered sensor node consists of three main blocks: (i) energy harvester incorporating the wind turbine coupled to an electrical generator; (ii) power management unit, which contains power conditioning circuit and energy storage; (iii) wireless sensor node itself. As shown above, a small Wind Turbine Generator (WTG) harvests the wind energy into electrical energy, a Boost converter continuously tracks its optimal working point and transfers the energy onto a DC Bus (here only one set of harvester is mounted), and then a storage device (supercapacitor) would be charged gradually. Simultaneously this supercapacitor could power the followed TPC-enabled wireless sensor node through a Buck-Boost converter. Note all the drive signals of DC-DC converters are controlled by the wireless node. A detailed description of each block is analyzed as follows.
3.1.1. WTG
Similar to our previous study [27], a plastic four-bladed horizontal-axis wind turbine is used here, which has a radius of 6 cm and an AC peak voltage of 5.5 V. In addition, it is known: as for a fixed airflow speed, there exists a load value, which could maximize the power generated by the WTG. Therefore, we have tested this WTG under common wind speed and worked out that the load value with maximal output lies between 370 Ω and 420 Ω. Thus, we choose a trade-off value of 400 Ω as (the optimal load resistance maximizing the power generation); i.e., once the external followed-up load matches with , the output power of WTG is always maximized towards any incoming wind speed.
3.1.2. MPTT Unit
The aim of the MPTT unit is to consistently match the source (WTG) impedance and the load (supercapacitor, DC-DC regulator, and sensor node) impedance. Only this can achieve optimal power conversion efficiency. Therefore, we should design an energy harvesting circuit with a constant input resistance around 400 Ω while transferring energy into the supercapacitor. As for the paper, a Boost converter is chosen to accomplish this purpose. It works in a fixed-frequency discontinuous current mode, as shown in Figure 2. The driving signal of NMOS1 is controlled by the wireless sensor node.
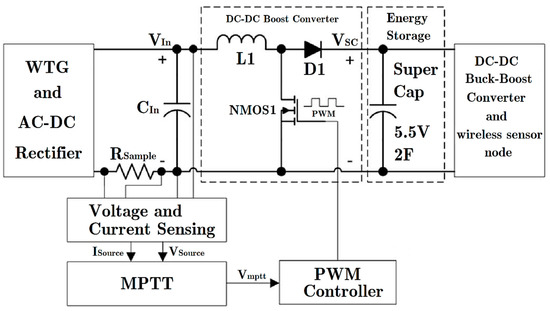
Figure 2.
Overview of DC-DC Boost converter with Maximal Power Transferring Tracking (MPTT).
3.1.3. TPC-Enabled Buck-Boost Converter
The variation of supercapacitor voltage would change from 0 V to the nominal voltage (usually 5.5 V), so a Buck-Boost converter is essential to regulate the output voltage to (usually 2.4 V for low-power electronics), it also optimizes the power efficiency of wireless sensor node.
Furthermore, different transmission power of the wireless unit requires different supply power, such as 20 mA for +7 dBm, 29 mA for +13 dBm, 87 mA for +17 dBm, et al. (LoRa SX1278, Semtech Corporation, Camarillo, CA, USA). Thus, the operation process of DC-DC regulator should be precisely managed to improve the conversion efficiency and reduce the dissipation. A TPC-Enabled DC-DC converter circuit is shown in Figure 3. In addition, the NMOS2 controller is also controlled by the wireless node.
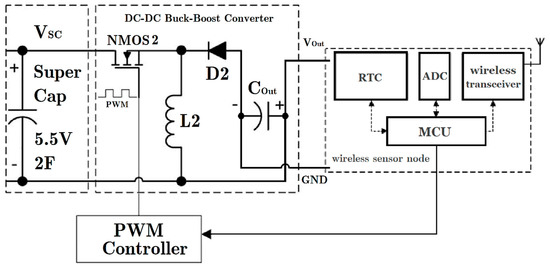
Figure 3.
DC-DC Buck-Boost power supply circuit for wireless node.
3.2. Wireless Link Model
In this section, the path loss based model [28] is adopted to setup the wireless link. In radio propagation, the signal needs to overcome path loss to reach the receiver. This transmission loss is always related with the distance from the sender to the receiver and their ambient environment, such as obstacles, transmission medium, etc.
At the receiver side, the wireless transceiver continues measuring the received signal strength . Therefore, the Signal to Noise Ratio (SNR) can be expressed in Equation (1), where is the transmission power and is the noise strength. The receiver can feedback the received signal indicator value through the handshake packets. In this way, the sender can track the variation of path loss and select an efficient transmission power.
Here is the communication range, is the wavelength and the spreading factor. With a proprietary Chirp Spread Spectrum modulation scheme, the bit error rate can be indicated as a function of SNR, as shown in Equation (2), where alpha and beta depend on the specific configuration of the SF and coding rate [29].
Due to the assumption that the bit errors are distributed randomly and independently, the packet error rate can be deduced in Equation (3), where l is the packet size:
If a packet is not acknowledged, the sender will resend the packet. The average retransmissions of a packet can be described as:
3.3. Power Consumption Model
The wind powered EH-WSN system operates under a cyclic workload with period . The energy consumption is calculated by both the power mode of the hardware (e.g., wireless communication mode) and the active operating time in that mode. Duty cycle is just the ratio of active time to period , as defined in Equation (5). By duty cycling, the power consumption of load is scaled, as defined in Equation (6). and are the active power and sleep power of the system, respectively. Here is a variable subject to the wireless transmission power level, which would be determined by the TPC module in Section 4. (For simplicity we consider is completely determined by the radio unit, whereas the power consumption of MCU, sensors, and other modules are out of the scope).
and represents the leakage power of supercapacitor: , where is its leakage resistance. Correspondingly is the total power dissipation of DC-DC converters that will be analyzed below.
3.3.1. Energy Consumption of Boost Converter
In order to facilitate low-power operation, all the power converters have been made to operate in the discontinuous conduction mode (DCM) in this work. As demonstrated by [30], the Boost converter operating in fixed-frequency DCM has a constant input equivalent resistance on average, given by:
where is its working period, is the inductance value, is the time of inductor current ramps up from zero to peak. Therefore, the fixed resistance value is only dependent on and two time parameters. Choosing the values of , and seemingly has three degrees of freedom. However, there is still the following constraint to satisfy:
The above Equation (8) implies that two of the three parameters can be set randomly. Nevertheless, the best way of fully utilizing this possibility is to choose the values that could minimize the power dissipation of Boost converter, as well as maximize the energy conversion efficiency.
Commonly the power dissipation in DC-DC converter is composed of two parts:
means the power dissipation due to the electric current flows through the equivalent resistance of all elements in the converter. is the dissipation of gate capacitance of MOSFET switches: opening and closing switches by turns requires repeated charging of the gate capacitances. Hence, we can deduce the conduction consumption of this PWM converter:
where is the output current (i.e., the supercapacitor charging current) of Boost converter. , and are the turn-on resistance of NMOS1, the equivalent series resistance of inductor L1, and the equivalent series resistance of supercapacitor. is the duty ratio and is the ripple of electric current flowing through L1, which could be described as follows:
here is the output supercapacitor voltage, and is the input voltage of Boost converter.
Then the gate-switch power dissipation can be defined as the product of the input voltage, the switching frequency, and the gate charge of NMOS1, as shown below:
is just the gate charge of NMOS1, is its switching frequency.
3.3.2. Energy Consumption of Buck-Boost Converter
The conduction consumption of this PWM converter is deduced as:
where is the drain-source on-state resistance of the MOSFET NMOS2, is the peak value of current flowing through inductor L2, is the parasitic equivalent series resistance of L2, is the time of the inductor current ramps up from zero to peak and is the time of the inductor current ramps down from peak to zero, is the converter’s working cycle, is the ideality factor of the diode D2, is the thermal voltage of D2, and is the reverse bias saturation current of D2.
As well, the gate-switch power dissipation of Buck-Boost converter is:
is the gate charge of NMOS2, is the input voltage of Buck-Boost converter.
Almost all manufacturing parameters (i.e., , etc.) can be obtained from the datasheets of every detailed component. Moreover, as can be seen above, power consumption in DC-DC converters is affected by miscellaneous parameters. These are composed of both the manufacturing parameters, which cannot be modified at working time, and load-dependent parameters, such as the output voltage and current of the DC-DC converters, which can be modified by advanced power management techniques to matching the run-time workload. As a matter of convenience, charging/discharging efficiency of the supercapacitor is not considered here. So referring to the method designed in [31], a simplified and synthetic power consumption model can be described as follow:
where , are the output currents of each converter, , are the DC-DC converters’ configuration parameters which control a tradeoff between load independent power consumption and load dependent power consumption (e.g., the time interval and the gate width of NMOS1, NMOS2), and , …, are constants represent for all the rest manufacture-related parameters. Since TPC module causes a drastic change of workload from one transmission mode to another, then parameters and would vary with the specific applications of TPC-enabled EH-WSN system, thus the energy-conversion efficiency changes accordingly. Therefore, an advanced power management incorporates both the energy harvesting and TPC mechanism, which must be researched and designed.
4. Predictive Power Manager for EH-WSN
In this section, we present a novel predictive power management framework. It contains three parts: (1) optimal work point tracking, (2) predictive energy allocation, and (3) energy efficient TPC.
4.1. Optimal Working Point
As can be seen above, the total power loss in a wind-powered WSN system is composed of two parts: DC-DC dissipation and supercapacitor leakage . The DC-DC power loss relates to the output current and . The leakage power is determined by supercapacitor voltage . Among these parameters, is task-specific and primarily decided by the transmission power . could be calculated by . must be set to and it is always a constant voltage, it can be computed by . Therefore, configuring the DC-DC converters to maximize the harvested energy and minimize the total energy dissipation simultaneously is of great importance for the proposed EH-WSN, it can be analyzed as follows:
First, Step 1 refines the configuration of Boost converter (i.e., decides the optimal value of parameters , and to match , which is to accomplish maximal energy harvesting; then Step 2 calculates the tradeoff parameters of two converters by considering the energy efficiency under TPC scheme; finally Step 3 computes the corresponding and the remaining parameters.
4.1.1. Step 1
The Boost converter’s configuration should be set according to the expected input energy level and desired equivalent resistance. So we assume the values of and to be 2.75 V and 20 mW, respectively, this is based on the power obtained by the WTG, which operates with the lowest wind speed under . Similar to the method in our previous study [27], an inductor of = 220 µH is chosen. Then the other two parameters or can be optimally set according to Equation (10) temporarily. Also, remember that it should abide by the component’s hardware restriction.
4.1.2. Step 2
Here can be seen as a constant value due to the application of Step 1. Thus it can be known that in the above Equation (15) there are three variables left: , WBuck-Boost and . Then we could minimize to improve the system-wide energy conversion efficiency by optimizing parameters and WBuck-Boost based on a given TPC schedule . Notice that the values of and WBuck-Boost should be constrained between an interval [, ]. Therefore, the problem would be simplified in this way: for a given TPC schedule, we want to find the values of and WBuck-Boost within [, ] that minimizing Equation (15). Here the downhill simplex method is adopted. The proposed Algorithm 1, called DC-TPC, along with the Algorithm 2, are shown below.
| Algorithm 1 DC-TPC calculation |
| 1 BEGIN |
| 2 Input multiple TPC-based current, = 1,…,N, # of levels, |
| 3 While () Do |
| 4 ← GetOptimal W(, ); |
| 5 If ] |
| 6 Then |
| 7 Else If ( < ) = |
| 8 Else = |
| 9 Return |
| 10 |
| 11 END |
| Algorithm 2 calculation algorithm |
| 1 BEGIN |
| 2 multiple TPC-based current, = 1,…,N, # of levels, |
| 3 : maximum number of evaluations, |
| 4 = 1 |
| 5 Initialization: Generate an initial set of 3 points (), representing the vertices of the initial simplex, in which is a vector [, ] and so forth |
| 6 While () Do |
| 7 Identify the vertices with the maximum, minimum value of the function , for the purpose of explanation, let’s assume |
| 8 Reflection: The highest point is then reflected to the opposite side (point ) along the line of the original simplex |
| 9 If |
| 10 Expansion: the reflected point is further extended to |
| 11 in the same direction according to: |
| 12 |
| 13 Go to line 18 |
| 14 Else if |
| 15 Contraction: the reflected point is further contracted to according to: |
| 16 |
| 17 Go to line 18 |
| 18 if |
| 19 Collapse: the entire simplex collapses by 50% |
| 20 in each dimension towards |
| 21 Else go to line 7 with the new simplex |
| 22 |
| 23 Else go to line 7 with the new simplex |
| 24 |
| 25 Return with which minimize |
| 26 END |
Once the optimal values of and have worked out, we should regulate accordingly, which is just the parameter in the Boost converter, and also , which is the gate width of NMOS2 (); i.e., (). Therefore, we can improve the whole system’s energy conversion efficiency under different wireless transmission power.
4.1.3. Step 3
Based on the former two steps, TBoost would be deduced accurately, so as VSC and Pleak. Thus, the two converters have harvested the maximal wind energy and consumed the minimal dissipation actually. This procedure can also be considered as the Maximum Power Transfer Tracking (MPTT). In other words, the operation of optimal working point has been completely accomplished.
4.2. Predictive Energy Allocation
As a promising countermeasure to reduce the impact of ambient power variation, the energy allocation algorithm adaptively assigns workload in a cyclic manner, with a period of every (, recall that is the period of the workload). Otherwise, the energy prediction algorithm is able to envision the future incoming energy with invocation round (). Because of the heavier computational workload caused by the prediction algorithm, we should call the allocation algorithm more frequently to reduce energy overhead (In references [32,33], predictors are usually called every 30 or 60 min, sometimes even longer, while the invocation time of the energy allocation algorithms ranges from 1 to 10 min).
Considering reference [4], the proposed energy allocation algorithm enables “ENO” by matching the average consumption power to the average harvesting power :
Here should be calculated by Equation (6), in which and during every have been obtained from the former MPTT operation, and can be recognized as the power consumption of the wireless transferring unit for easy computation; i.e., just represents the average transmission power in periods, while is set to zero for simplicity (micro controller’s current consumption is less than 12 uA in sleep mode [34]). Hence, the energy allocation mechanism only has to regulate to satisfy the “ENO” working constraint.
As for the wind energy prediction method, there already exists few studies [24]. However, energy prediction for EH-WSN has not been extensively explored, which calls for further research. Here we propose an energy harvesting prediction algorithm based on Weather-Conditioned Selective Additive Decomposition model (WCSAD): We first set the weather conditions of every day into three categories: Strong breeze, Moderate breeze, and Breeze; then we proceed to forecast the weather that only belongs to the same sort. In addition, we combine both the season variations during all the year and weather changes over one day together to calculate the energy that could be harvested in the next EH-rounds.
Firstly, the EH-nodes need to record the harvested energy in work round of day , hence for the three categories there should be three matrixes that saves days data independently. The average harvested energy in three kinds are:
where , and are the harvested energy in Strong breeze days, Moderate breeze days, and Breeze days, respectively. Equation (17) should be updated every 24 h to ensure the weather classification process. The detailed calculation rules are shown below in Algorithm 3.
| Algorithm 3 Harvested energy classification algorithm for different weather conditions |
| 1 BEGIN |
| 2 If () |
| 3 {day is a Strong breeze day, update } |
| 4 Else if () |
| 5 {day is a Breeze day, update } |
| 6 Else |
| 7 {day is a Moderate breeze day, update } |
| 8 END |
Here is a parameter concerns the seasonal changes:
is just a tuning coefficient. After these corresponding classifications of former days, then we can start to predict the up-coming energy, which would be harvested during work round in the present day. The prediction value equals:
here are other adjustment coefficients. The four items in the above formula intend to represent the applicable harvesting energy’s dynamic changes caused by different EH-rounds in different days. is a weighted sum of corresponding rounds’ harvested energy in the past reference days that belong to the same weather kind: . is also a debug parameter. just shows the corresponding round’ energy in the last time with the same weather kind, in turn stands for the day before last time within the same weather type.
By default, we can take present day’ weather type as the same as yesterday. However, a detecting mechanism is also designed to test the default hypothesis: we set up four testing points in a single day and we compute the average harvested energy during the time from the beginning of the day to the test point moment, if the value has a great difference with the last day’s data, we should regulate the weather type immediately.
In this section, we discuss the proposed WCSAD energy prediction model, of which the aim is to reduce the computational complexity while maintaining similar accuracy as compared to the other models.
4.3. Transmission Power Control
We are here to solve the problem of energy efficient wireless communication. As stated in Section 3, it is sensible to furtherly improve energy efficiency with dynamic transmission power. Algorithm 4 introduces the best-matching TPC with high-efficiency. The main purpose of this mechanism is to adaptively choose an energy efficient transmission power according to the wireless link quality.
| Algorithm 4 Energy Efficient Transmission Power Control |
| 1 BEGIN |
| 2 Input {}, , . |
| 3 RSSI = post-backed message from the receiver; |
| 4 then can be deduced from a function with RSSI; |
| 5 for do |
| 6 ; |
| 7 ; |
| 8 ; |
| 9 ; |
| 10 end for |
| 11 Output ; |
| 12 END |
In a case where one connection is established, the receiver should measure the wireless link’s RSSI value and post back to the sender. Based on the datasheet of the wireless unit [35], received signal strength can be computed from this RSSI value through a specific equation. Thus, every available transmission power’s SNR can be estimated.
For the purpose of selecting the optimal wireless transmission power, we adopt a specific metric: energy per useful received bit , to evaluate the energy efficiency of transmission power. is defined in line 9 of Algorithm 4, IO2 is the corresponding electric current of wireless sensor node and Rate is its communication rate. To choose the transmission power with highest energy efficiency, Algorithm 4 investigates an integrated method by considering the Buck-Boost converter’s power consumption together during the wireless communication. When finding the optimal from the candidate sequence, Algorithm 1 would be calculated automatically and output the other operation parameters.
5. Experimental Results
The entire wind-powered sensor node is a comprehensive system, which is composed of some unique sub-units. For deep learning of the whole system’s working efficiency, it is important to analyze the capability of each subsystem, and perform energy flow comparison at each energy transfer stage. The proposed concept for this EH-node with predictive power manager technique has been implemented in hardware prototype for laboratory testing. Some detailed components are shown below in Table 1.

Table 1.
Catalog of hardware components.
The designed EH-WSN system is connected with a commercially wireless node supplied by Arduino with LoRa, as shown in Figure 4. The WTG tail could adjust the wind-front direction to face the incoming wind at the right angle. As such, the wind incident angle is always perpendicular to the turbine plane. The LoRa node uses the ESP8266 32-bit ultralow-power microcontroller, and it is paired with the SX1278 RF transceiver that is also designed for low-power application. A 2 F & 5.5 V supercapacitor bank of Panasonic is chosen as the energy storage. Since the microcontroller’s strong computation capability, it is very convenient to make use of it to achieve a more accurate and faster MPTT scheme than a dedicated MPPT analog circuit.
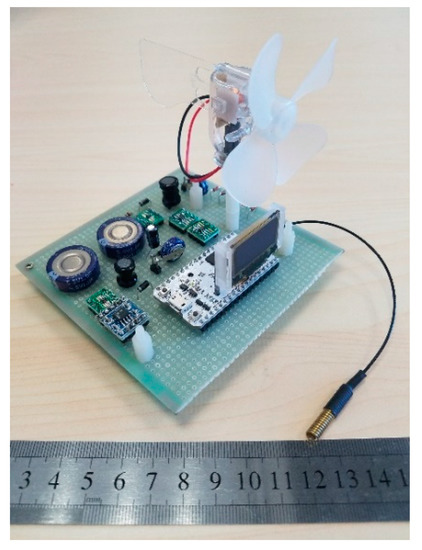
Figure 4.
Hardware prototype of the Wind-powered sensor node.
5.1. MPTT Testing
The experimental tests are conducted in accordance with the wind condition of the deployment ground illustrated in Figure 5 where the average wind speed is given as 4.5 m/s, and we record the variation of WTG’s output power under different wind speed when its subsequent load value changes, as shown below in Figure 6. Apparently, when ROptimal = 400 Ω WTG generates the maximal electrical power. Therefore, if algorithm DC-TPC works out the parameters WBoost and WBuck-Boost, thus the optimal working point could be achieved.
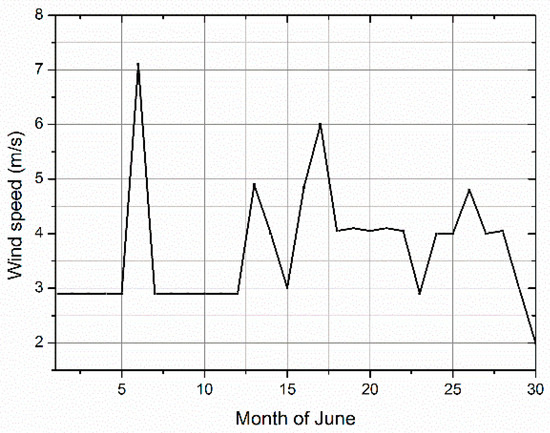
Figure 5.
Wind speed measurement record (2018.06, Nanjing, Jiangsu, China).
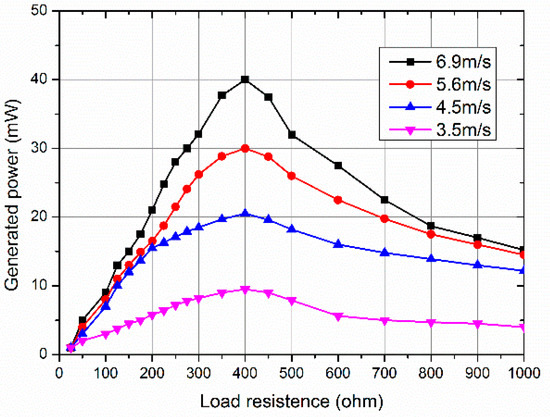
Figure 6.
The variation of Wind Turbine Generator (WTG) output power under different wind speed V.S. Its subsequent workload.
Figure 7 shows the variation of EH-WSN’s overall power loss PD_system with supercapacitor voltage VSC and load current IO2 according to Equation (15). [Note: for the convenience of analysis and comparison, the prediction mechanism in this step is prohibited, the TPC module sets to be a given quantity, and the values of C1, …, C8, are (15, 0.25, 0.004, 0.09, 11, 0.12, 0.004, 0.075)]. As can be seen here, the power dissipation is minimized when VSC changes near VDD = 2.4 V.
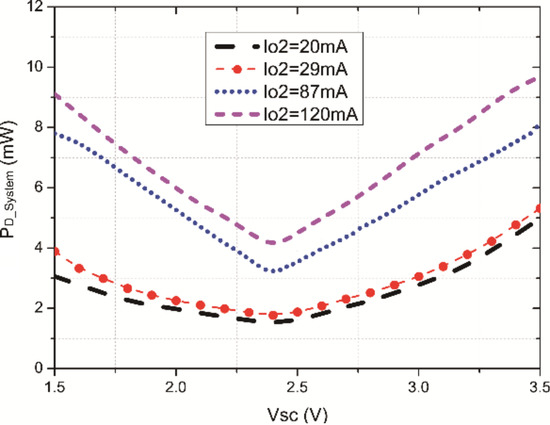
Figure 7.
PD_system with VSC and IO2.
Next, there are three exams to be conducted, which is to differentiate the performance of the MPTT scheme in powering the load. The followed electrical load is at first powered with an EH system but without the MPTT scheme, then with EH system carried on MPTT (IO2 = 20 mA), and finally with EH system running MPTT (IO2 120 mA). The duration for each period is 180 s, and the supercapacitor voltage variation under these conditions is compared in Figure 8.
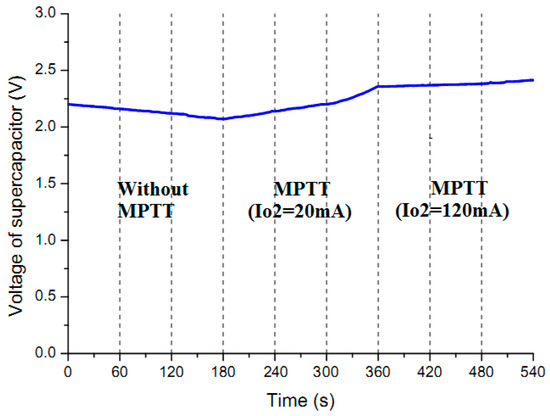
Figure 8.
Voltage variation of supercapacitor under three different operation modes.
From the above figure we can find that the supercapacitor voltage VSC keeps decreasing during the period when algorithm DC-TPC is not running. On the contrary, VSC could keep nearly balance in the mode with MPTT but IO2 = 120 mA, this demonstrates that the harvested wind energy could make the node self-sustainable in a continuous input situation. Finally, within the MPTT (IO2 = 20 mA) mode our system yields the most superior performance, which shows a powerful survivability to make VSC rise from 2.17 to 2.37 V. Therefore, the MPTT mechanism is obviously applicable for the conditions of harvesting conventional wind energy.
5.2. Prediction Algorithm Analysis
We evaluate the performance of WCSAD by comparing the amount of energy actually harvested during each timeslot against the predicted energy intake. To this end, we implement WCSAD into the wind-powered sensor node and execute an outdoor 7 day continuous running. The invoked duty-cycle is set to be 30 min, parameters υ, τ, ε and ω are 0.6, 0.45, 0.55 and 0.62, respectively, D is considered as 5 regarding the tradeoff between computational accuracy and limited working resources. The predictor error has been compared with WCMA [36] and the selective statistical range is from slot 3 to slot 28, i.e., from 07:30 to 20:00, the result is shown in Figure 9.
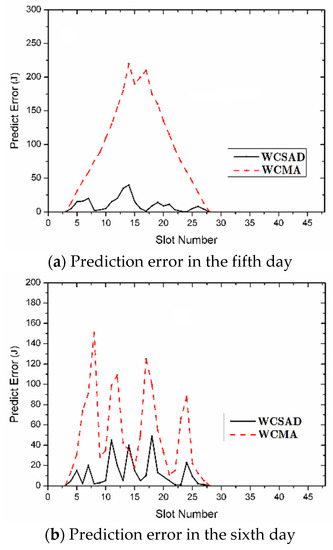
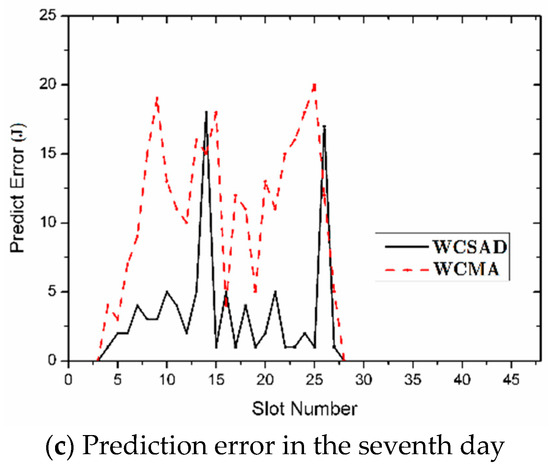
Figure 9.
Error comparison result between Weather-Conditioned Selective Additive Decomposition (WCSAD) and WCMA.
Here in the test the wind speed keeps in hybrid magnitude from day 1 to day 4, however, in the 5th day the air turns to breeze, therefore the harvested energy decreases dramatically, but at last, the 6th day and 7th day just take on a strong breeze. As a result of the severe change between the 5th day and its previous days, WCMA cannot adapt to this variation and leads to a major error in Figure 9a, while WCSAD considers the past data of the harvested energy for reference ingeniously and keeps the error under 15%. In Figure 9b, WCMA slightly eases the impact of weather variation but still cannot offer a predictive value with high confidence, however, WCSAD maintains the accuracy as in the previous. In Figure 9c, the wind category keeps near the same with the day before, thus WCMA and WCSAD both gain a relatively low error rate, whereas WCSAD performs even better with the highest error of only 5%.
As can be seen from the above analysis, the WCSAD algorithm shows ideal predictive accuracy and can provide reliable support for the “ENO” working requirement.
5.3. TPC Execution
In this section, we evaluate the performance of proposed TPC. We take the wind-powered sensor node serving as a sender. An unlimited power supply sink is responsible for receiving messages and returning the RSSI data every minute. The programmable transmission power level ranges from 0 to +20 dBm with a step size of 1 dBm and the corresponding power consumption Ptran comes from the hardware measurement in the existing literature [29]. The noise power Pnoise is considered Gaussian White Noise with a mean of −105 dBm and a standard deviation of 1.5 dBm. The transmission rate is 9.6 kbps and the data packet size is 32 bytes. The energy per useful bit Eu is used for evaluating.
We validate the effectiveness of our TPC module by using two comparisons. The existing RSS-based transmission power controller [17] is implemented as a reference, which is referred as a fixed-RSS scheme. The fixed transmission power scheme is also implemented, which is referred to as a fixed-TX scheme. The wind-harvesting IoT device and the sink are placed in outdoor park surroundings.
Figure 10 demonstrates the average transmission energy of 10,080 packets (one packet per minute during 7 days). We can see that the proposed method achieves the lowest energy consumption compared with the other TPC strategies no matter the distance. Compared with the fixed-TX scheme, our proposed module achieves energy reduction around 30%. Compared with the fixed-RSS scheme, our proposed module lowers the transmission energy consumption around 15%. The wireless path loss and the background noise are always time varying, a fixed RSSI value or transmission power definitely cannot guarantee the optimal transmission energy efficiency. The proposed TPC module is effective in dynamically selecting the optimal transmission power along with the lowest energy cost Eu.
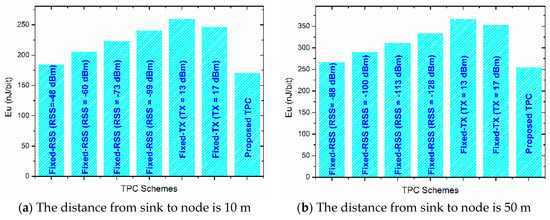
Figure 10.
Average transmission cost for different schemes.
5.4. Power Conversion Efficiency of the Whole System
The Line diagram in Figure 11 is to illustrate the input and output power available for each subsystem so that the power-conversion efficiency can be resolved. Every value is measured and calculated at the input and output of every subsystem. The data in blue color represents the value of the reference system [24], while the data in red is ours. The test starts from the input with a wind speed of 4.5 m/s where 128.2 mW of raw wind power is supplied to the wind turbine with an efficiency of 39% and 50 mW of mechanical power is available for harvesting. Due to the standard diode-based full-bridge rectifier, 65% of the raw electrical power (ac) is generated at the output of the wind turbine generator. Thus, approximately 20 mW is converted into raw electrical power (dc) of 13 mW. Then after the supercapacitor-charging period (85 min), the energy stored in our system is 19.88 J. In contrast, the reference system has a higher rectifier conversion efficiency because of its smart adaptive strategy. Whereas it adopts a traditional MPTT scheme and gains a lower bit output. However, our system gains significant enhancement in the next stages with a best-matching TPC based converter, where the wireless sensor node has survived for 1.5 h other than the referenced 1.2 h under the working cycle mentioned in a prior achievement [37]. Moreover, certainly in this “ENO” process, the prediction module takes effect as a foundation stone while consuming a neglectable amount of energy.

Figure 11.
Line diagram of the power distributed in the proposed wind-powered sensor.
5.5. Power Failure Time Detection
The predictive power management algorithm has a risk of over-assigning energy that possibly leads to power shortage. Therefore, we need to further investigate the power failure time tf. In this section, we compare the proposed system with D-PEA and sta-PEA in reference [38], the test scenario is just the same as step B, and the duty cycle ratio DC’s dynamic variation is shown in Figure 12 primarily (for a direct perception, we classify the ratio into 5 sorts: 0%, 25%, 50%, 75%, and 100%):
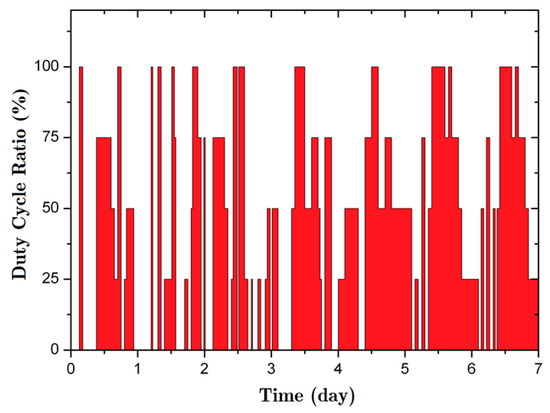
Figure 12.
Changes of duty cycle ratio (with 20% initial electricity).
The figure shows the detailed work/sleep ratio variations from day 1 to day 7, apparently the ratio rises to 100% under a continuous wind blowing and drops to 0% when in breezeless, the average ratio is lower than 40% in the first four days due to the incomplete work of WCSAD, and improves to over 60% in the last three days because of the prediction management’s proper functioning. From these data, we could infer that the proposed energy management algorithm can effectively charge the EH-node that is given at a lower initial energy, and make it work reliably.
Then we detect and compare the power failure time, here we consider that system power failure is caused by the depletion of the supercapacitor’s remaining energy; i.e., its terminal voltage VSC drops below the start-up threshold of Buck-Boost converter (0.85 V). Figure 13 shows the measurement result.
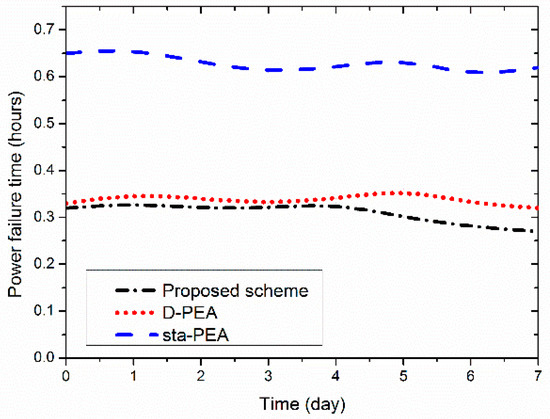
Figure 13.
Power failure time tf.
We can see that D-PEA and the proposed scheme achieve consistently lower tf compared with sta-PEA. The performance margin increases with the time elapsed particularly for our proposed strategy because of the three efficient and effective integrated submodules. It demonstrates that the proposed scheme can best react to the changing wind speed and avoid depleting the energy storage device.
6. Conclusions
In this paper, a predictive power management framework for improving the energy efficiency of a wind-powered WSN is presented. Specifically, a prototype of the EH-WSN, a DC-DC converter based MPTT technique; a wind-energy prediction algorithm, and an energy efficient TPC strategy have been proposed. The key features of the proposed solution are: (i) dynamic impedance matching, (ii) adaptive energy-dissipation minimization, (iii) predictive energy allocation, and (iv) transmission power auto-regulation. The experiment result has demonstrated a system-wide optimal energy conversion and utilization has been accomplished. With a wind speed of 4.5 m/s, the system is truly self-sustainable and perform powerful survivability.
Future work will focus on the proposal of the cross layer optimization problem for EH-WSN and consider cognitive radio network issues.
Author Contributions
The work presented in this paper represents a collaborative effort by all authors, whereas Y.W. wrote the main paper. B.L. and F.Z. discussed the proposed main problem and algorithms. Both authors have read and approved the final manuscript.
Funding
This research was funded by [National Natural Science Foundation of China] grant number [No. 31700478, No. 31670554].
Acknowledgments
The authors also gratefully acknowledge the helpful comments and suggestions of the reviewers, which have improved the presentation.
Conflicts of Interest
The authors declare no conflict of interest.
References
- Shin, M.; Joe, I. Energy management algorithm for solar-powered energy harvesting wireless sensor node for Internet of Things. IET Commun. 2016, 10, 1508–1521. [Google Scholar] [CrossRef]
- Stankovic, J.A. Research directions for the internet of things. IEEE Internet Things J. 2014, 1, 3–9. [Google Scholar] [CrossRef]
- Lee, S.; Kwon, B.; Lee, S.; Bovik, A.C. BUCKET: Scheduling of Solar-Powered Sensor Networks via Cross-Layer Optimization. IEEE Sens. J. 2015, 15, 1489–1503. [Google Scholar] [CrossRef]
- Le, T.N.; Pegatoquet, A.; Berder, O.; Sentieys, O.; Carer, A. Energy-Neutral Design Framework for Supercapacitor-Based Autonomous Wireless Sensor Networks. ACM J. Emerg. Technol. Comput. Syst. 2015, 12, 19. [Google Scholar] [CrossRef]
- Erbay, C.; Carreon-Bautista, S.; Sanchez-Sinencio, E.; Han, A. High Performance Monolithic Power Management System with Dynamic Maximum Power Point Tracking for Microbial Fuel Cells. Environ. Sci. Technol. 2014, 48, 13992–13999. [Google Scholar] [CrossRef] [PubMed]
- Tsai, D.; Wu, H.; Wei, C. A low-power-consumption boost converter with maximum power tracking algorithm for indoor photovoltaic energy harvesting. In Proceedings of the 2017 IEEE Wireless Power Transfer Conference (WPTC), Taipei, Taiwan, 10–12 May 2017; pp. 1–3. [Google Scholar]
- Ongaro, F.; Saggini, S. Li-Ion Battery-Supercapacitor Hybrid Storage System for a Long Lifetime, Photovoltaic based Wireless Sensor Network. IEEE Trans. Power Electron. 2012, 27, 3944–3952. [Google Scholar] [CrossRef]
- Yang, F.; Wang, K.; Huang, Y. Energy-Neutral Communication Protocol for Very Low Power Microbial Fuel Cell Based Wireless Sensor Network. IEEE Sens. J. 2015, 15, 2306–2315. [Google Scholar] [CrossRef]
- Lin, S.; Zhang, J.; Zhou, G.; Gu, L.; Stankovic, J.A.; He, T. ATPC: Adaptive transmission power control for wireless sensor networks. In Proceedings of the 4th ACM Conference on Embedded Networked Sensor Systems, Boulder, CO, USA, 31 October–3 November 2006; pp. 223–236. [Google Scholar]
- Hsia, K.; Hung, C.; Chang, H.T.; Lai, Y. Transmission Power Control for Wireless Sensor Network. J. Robot. Netw. Artif. Life 2017, 3, 279–282. [Google Scholar] [CrossRef]
- Mondal, S.; Paily, R. On-Chip Photovoltaic Power Harvesting System with Low-Overhead Adaptive MPPT for IoT nodes. IEEE Internet Things J. 2017, 4, 1624–1633. [Google Scholar] [CrossRef]
- Omairi, A.; Ismail, Z.H.; Danapalasingam, K.A.; Ibrahim, M. Power Harvesting in Wireless Sensor Networks and Its Adaptation with Maximum Power Point Tracking: Current Technology and Future Directions. IEEE Internet Things J. 2017, 4, 2104–2115. [Google Scholar] [CrossRef]
- Konstantopoulos, C.; Koutroulis, E.; Mitianoudis, N.; Bletsas, A. Converting a Plant to a Battery and Wireless Sensor with Scatter Radio and Ultra-Low Cost. IEEE Trans. Instrum. Meas. 2016, 65, 388–398. [Google Scholar] [CrossRef]
- Le, T.N.; Pegatoquet, A.; Berder, O.; Sentieys, O. Energy-Efficient Power Manager and MAC Protocol for Multi-Hop Wireless Sensor Networks Powered by Periodic Energy Harvesting Sources. IEEE Sens. J. 2015, 15, 7208–7220. [Google Scholar] [CrossRef]
- Aoudia, F.A.; Gautier, M.; Berder, O. Fuzzy power management for energy harvesting Wireless Sensor Nodes. In Proceedings of the 2016 IEEE International Conference on Communications (ICC), Kuala Lumpur, Malaysia, 22–27 May 2016; pp. 1–6. [Google Scholar]
- Peng, S.; Low, C.P. Prediction free energy neutral power management for energy harvesting wireless sensor nodes. Ad Hoc Netw. 2014, 13, 351–367. [Google Scholar] [CrossRef]
- Dong, Y.; Chen, Z.; Wang, J.; Shim, B. Optimal Power Control for Transmitting Correlated Sources with Energy Harvesting Constraints. IEEE Trans. Wirel. Commun. 2018, 17, 461–476. [Google Scholar] [CrossRef]
- Kody, A.; Scruggs, J. Optimal packet scheduling for a piezoelectric energy harvesting node. In Proceedings of the 2017 IEEE 56th Annual Conference on Decision and Control (CDC), Melbourne, Australia, 12–15 December 2017; pp. 133–138. [Google Scholar]
- Biason, A.; Zorzi, M. Joint Transmission and Energy Transfer Policies for Energy Harvesting Devices with Finite Batteries. IEEE J. Sel. Areas Commun. 2015, 33, 2626–2640. [Google Scholar] [CrossRef]
- Ulukus, S.; Yener, A.; Erkip, E.; Simeone, O.; Zorzi, M.; Grover, P.; Huang, K. Energy Harvesting Wireless Communications: A Review of Recent Advances. IEEE J. Sel. Areas Commun. 2015, 33, 360–381. [Google Scholar] [CrossRef]
- Mahapatra, C.; Sheng, Z.; Kamalinejad, P.; Leung, V.C.M.; Mirabbasi, S. Optimal Power Control in Green Wireless Sensor Networks With Wireless Energy Harvesting, Wake-Up Radio and Transmission Control. IEEE Access 2017, 5, 501–518. [Google Scholar] [CrossRef]
- Castagnetti, A.; Pegatoquet, A.; Le, T.N.; Auguin, M. A Joint Duty-Cycle and Transmission Power Management for Energy Harvesting WSN. IEEE Trans. Ind. Inform. 2014, 10, 928–936. [Google Scholar] [CrossRef]
- Basagni, S.; di Valerio, V.; Koutsandria, G.; Petrioli, C.; Spenza, D. WHARP: A Wake-Up Radio and Harvesting-Based Forwarding Strategy for Green Wireless Networks. In Proceedings of the 2017 IEEE 14th International Conference on Mobile Ad Hoc and Sensor Systems (MASS), Orlando, FL, USA, 22–25 October 2017; pp. 257–265. [Google Scholar]
- Porcarelli, D.; Spenza, D.; Brunelli, D.; Cammarano, A.; Petrioli, C.; Benini, L. Adaptive Rectifier Driven by Power Intake Predictors for Wind Energy Harvesting Sensor Networks. IEEE J. Emerg. Sel. Top. Power Electron. 2015, 3, 471–482. [Google Scholar] [CrossRef]
- Tan, Y.K.; Panda, S.K. Self-Autonomous Wireless Sensor Nodes with Wind Energy Harvesting for Remote Sensing of Wind-Driven Wildfire Spread. IEEE Trans. Instrum. Meas. 2011, 60, 1367–1377. [Google Scholar] [CrossRef]
- Lee, Y.; Blaauw, D.; Sylvester, D. Ultralow Power Circuit Design for Wireless Sensor Nodes for Structural Health Monitoring. Proc. IEEE 2016, 104, 1529–1546. [Google Scholar] [CrossRef]
- Wu, Y.; Liu, W. Efficient power management for wireless sensor node with wind energy harvesting. Int. J. Sens. Netw. 2012, 12, 223–231. [Google Scholar] [CrossRef]
- Jörke, P.; Böcker, S.; Liedmann, F.; Wietfeld, C. Urban channel models for smart city IoT-networks based on empirical measurements of LoRa-links at 433 and 868 MHz. In Proceedings of the 2017 IEEE 28th Annual International Symposium on Personal, Indoor, and Mobile Radio Communications (PIMRC), Montreal, QC, Canada, 8–13 October 2017; pp. 1–6. [Google Scholar]
- Lee, W.; Schubert, M.J.W.; Ooi, B.; Ho, S.J. Multi-Source Energy Harvesting and Storage for Floating Wireless Sensor Network Nodes With Long Range Communication Capability. IEEE Trans. Ind. Appl. 2018, 54, 2606–26015. [Google Scholar] [CrossRef]
- Kazimierczuk, M.K. Pulse-Width Modulated DC-DC Power Converters, 2nd ed.; John Wiley & Sons, Ltd.: Chichester, UK, 2016. [Google Scholar]
- Choi, Y.; Chang, N.; Kim, T. DC–DC converter-aware power management for low-power embedded systems. IEEE Trans. Comput.-Aided Des. Integr. Circuits Syst. 2007, 26, 1367–1381. [Google Scholar] [CrossRef]
- Kansal, A.; Hsu, J.; Zahedi, S.; Srivastava, M.B. Power management in energy harvesting sensor networks. ACM Trans. Embed. Comput. Syst. 2007, 6, 32. [Google Scholar] [CrossRef]
- Zhong, S.; Wang, X. Energy Allocation and Utilization for Wirelessly Powered IoT Networks. IEEE Internet Things J. 2018, 5, 2781–2792. [Google Scholar] [CrossRef]
- Espressif Systems. ESP8266 Datasheet. 2018. Available online: https://www.espressif.com/sites/default/files/documentation/0a-esp8266ex_datasheet_en.pdf (accessed on 3 September 2018).
- Semtech Corporation. SX1278 Datasheet. 2016. Available online: https://www.semtech.com/uploads/documents/DS_SX1276-7-8-9_W_APP_V5.pdf (accessed on 3 September 2018).
- Piorno, J.R.; Bergonzini, C.; Atienza, D.; Rosing, T.S. Prediction and management in energy harvested wireless sensor nodes. In Proceedings of the 2009 1st International Conference on Wireless Communication, Vehicular Technology, Information Theory and Aerospace & Electronics Systems Technology, Aalborg, Denmark, 17–20 May 2009; pp. 6–10. [Google Scholar]
- Wu, Y.; Li, B.; Zhu, Y.; Liu, W. Energy-Neutral Communication Protocol for Living-Tree Bioenergy-Powered Wireless Sensor Network. Mob. Inf. Syst. 2018, 2018, 5294026. [Google Scholar] [CrossRef]
- Ju, Q.; Zhang, Y. Predictive Power Management for Internet of Battery-Less Things. IEEE Trans. Power Electron. 2018, 33, 299–312. [Google Scholar] [CrossRef]
© 2018 by the authors. Licensee MDPI, Basel, Switzerland. This article is an open access article distributed under the terms and conditions of the Creative Commons Attribution (CC BY) license (http://creativecommons.org/licenses/by/4.0/).