Preliminary Studies on Validation of Calu-3 Cell Line as a Model for Screening Respiratory Mucosa Irritation and Toxicity

Abstract
:
1. Introduction
2. Experimental Section
2.1. Chemicals
2.2. Cell Culture
2.3. Chemical Exposure to Calu-3 Cells

| S/N | Chemical Name | Chemical Class | European Union Irritation Class | CAS Number | Log p * | ||
|---|---|---|---|---|---|---|---|
| Non-Irritating | R36 Irritating to Eye | R41 Risk of Serious Damage to Eye | Octanol–Water | ||||
| 1 | PEG 400 | Alcohol | √ | 25322-68-3 | −1.21 | ||
| 2 | 3-Methoxy-1,2-propanediol | Alcohol | √ | 623-39-2 | −1.20 | ||
| 3 | Glycerol | Alcohol | √ | 56-81-5 | −1.76 | ||
| 4 | PEG 600 | Alcohol | √ | 25322-68-3 | −1.21 | ||
| 5 | 2-Methyl-1-pentanol | Alcohol | √ | 105-30-6 | 1.75 | ||
| 6 | Anhydrous ethanol | Alcohol | √ | 64-17-5 | −0.30 | ||
| 7 | Cyclohexanol | Alcohol | √ | 108-93-0 | 1.23 | ||
| 8 | Tween 20 | Surfactant | √ | 9005-64-5 | 2.39 | ||
| 9 | Sodium dodecyl sulphate USP | Surfactant | √ | 151-21-3 | 1.60 | ||
| 10 | Triton X-100 | Surfactant | √ | 9002-93-1 | 4.15 | ||
| 11 | Cetylpyridinium bromide | Surfactant | √ | 140-72-7 | 1.83 | ||
| 12 | Toluene | Heterocyclic | √ | 108-88-3 | 2.73 | ||
| 13 | Imidazole | Heterocyclic | √ | 288-32-4 | −0.08 | ||
| 14 | Methyl isobutyl ketone | Ketone | √ | 108-10-1 | 1.31 | ||
| 15 | Acetone | Ketone | √ | 67-64-1 | −0.24 | ||
| 16 | Sodium hydroxide | Inorganic chemical | √ | 1310-73-2 | 0 | ||
| 17 | Sodium oxalate | Carboxylic acid salt | √ | 62-76-0 | −0.26 | ||
| 18 | 4-Fluoroaniline | Amine | √ | 371-40-4 | 1.15 | ||
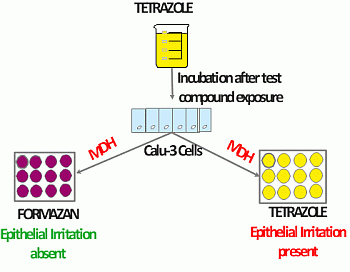
2.4. MTT Assay
2.5. Data Analysis
3. Results and Discussion
3.1. Results
| S/N | Test Compounds | Chemical Class | European Union Class | Calu-3 %Viability ± SD |
|---|---|---|---|---|
| 1 | PEG400 | Alcohol | NI | 91.5 ± 4.6 |
| 2 | 3-Methoxy-1,2-propanediol | Alcohol | NI | 92.6 ± 4.1 |
| 3 | Glycerol | Alcohol | NI | 85.6 ± 8.7 |
| 4 | PEG600 | Alcohol | NI | 85.9 ± 13.4 |
| 5 | 2-Methyl-1-pentanol | Alcohol | NI | 95.0 ± 13.1 |
| 6 | Anhydrous ethanol | Alcohol | NI | 99.1 ± 3.9 |
| 7 | Cyclohexanol | Alcohol | R41 | 89.9 ± 14.3 |
| 8 | Tween20 | Surfactant | NI | 57.1 ± 8.1 |
| 9 | Sodium dodecyl sulphate USP | Surfactant | R36 | 4.3 ± 0.1 |
| 10 | Triton X-100 | Surfactant | R36 | 3.5 ± 0.5 |
| 11 | Cetylpyridinium bromide | Surfactant | R41 | 8.1 ± 1.1 |
| 12 | Toluene | Heterocyclic | NI | 85.7 ± 13.0 |
| 13 | Imidazole | Heterocyclic | R41 | 106.9 ± 10.8 |
| 14 | Methyl isobutyl ketone | Ketone | NI | 73.2 ± 7.4 |
| 15 | Acetone | Ketone | R36 | 100.4 ± 13.7 |
| 16 | Sodium hydroxide | Inorganic chemical | R41 | 4.6 ± 0.4 |
| 17 | Sodium oxalate | Carboxylic acid salt | R41 | 65.4 ± 4.0 |
| 18 | 4-Fluoroaniline | Amine | R41 | 114.9 ± 5.9 |
| S/N | Chemical | Chemical Class | European Union Class | Calu-3 %Viability ± SD |
|---|---|---|---|---|
| 1 | PEG400 | Alcohol | NI | 92.2 ± 15.9 |
| 2 | 3-Methoxy-1,2-propanediol | Alcohol | NI | 90.7 ± 4.3 |
| 3 | Glycerol | Alcohol | NI | 86.5 ± 7.0 |
| 4 | PEG600 | Alcohol | NI | 81.7 ± 10.8 |
| 5 | 2-Methyl-1-pentanol | Alcohol | NI | 2.9 ± 0.2 |
| 6 | Anhydrous ethanol | Alcohol | NI | 90.3 ± 8.0 |
| 7 | Cyclohexanol | Alcohol | R41 | 78.7 ± 11.7 |
| 8 | Tween20 | Surfactant | NI | 43.9 ± 2.5 |
| 9 | Sodium dodecyl sulphate USP | Surfactant | R36 | 9.0 ± 0.1 |
| 10 | Triton X-100 | Surfactant | R36 | 4.5 ± 0.1 |
| 11 | Cetylpyridinium bromide | Surfactant | R41 | 5.4 ± 0.6 |
| 12 | Toluene | Heterocyclic | NI | 109.8 ± 6.6 |
| 13 | Imidazole | Heterocyclic | R41 | 95.4 ± 2.9 |
| 14 | Methyl isobutyl ketone | Ketone | NI | 90.3 ± 7.1 |
| 15 | Acetone | Ketone | R36 | 95.4 ± 16.5 |
| 16 | Sodium hydroxide | Inorganic chemical | R41 | 14.9 ± 1.2 |
| 17 | Sodium oxalate | Carboxylic acid salt | R41 | 64.5 ± 11.5 |
| 18 | 4-Fluoroaniline | Amine | R41 | 75.6 ± 10.9 |
| European Union Classification | Calu-3 Result | |||
|---|---|---|---|---|
| 0.2% Test Solutions | 1.0% Test Solutions | |||
| Irritants | Non-Irritants | Irritants | Non-Irritants | |
| Non-Irritants (9) | 0 | 9 | 2 | 7 |
| Irritants (9) | 4 | 5 | 4 | 5 |
| Groups | Sensitivity * | Specificity ** | Concordance *** |
|---|---|---|---|
| 1.0% at 60 min treatment | 44% | 78% | 61% |
| 0.2% at 60 min treatment | 44% | 100% | 72% |
3.2. Discussion
| Methods | Sensitivity % | Specificity % | Concordance% | Source |
|---|---|---|---|---|
| BCOP | 75–84 | 79–81 | 79–81 | [29] |
| SMI (mucus endpoint) | 75 | 100 | 68 | [4] |
| Calu-3 cell model (0.2% at 60 min) | 44 | 100 | 72 |
4. Conclusions
Acknowledgments
Author Contributions
Conflicts of Interest
References
- Ferdowsian, H.R.; Beck, N. Ethical and scientific considerations regarding animal testing and research. PLoS One 2011, 6, e24059. [Google Scholar] [CrossRef]
- European Union: Final ban on animal experiments for cosmetic ingredients implemented. Available online: http://www.altex.ch/News.17.html?ncat=1&eid=288 (accessed on 12 January 2014).
- Zuckerman, D.; Booker, N.; Nagda, S. Public health implications of differences in U.S. and European Union regulatory policies for breast implants. Reprod. Health Matters 2012, 20, 102–111. [Google Scholar] [CrossRef]
- Selgrade, M.K.; Sullivan, K.S.; Boyles, R.R.; Dederick, E.; Serex, T.L.; Loveless, S.E. Decision trees for evaluating skin and respiratory sensitizing potential of chemicals in accordance with European regulations. Regul. Toxicol. Pharmacol. 2012, 63, 371–380. [Google Scholar] [CrossRef]
- Verstraelen, S.; Jacobs, A.; de Wever, B.; Vanparys, P. Improvement of the Bovine Corneal Opacity and Permeability (BCOP) assay as an in vitro alternative to the Draize rabbit eye irritation test. Toxicol. in Vitro 2013, 27, 1298–1311. [Google Scholar] [CrossRef]
- Wilhelmus, K.R. The Draize eye test. Surv. Ophthalmol. 2001, 45, 493–515. [Google Scholar] [CrossRef]
- Belser, J.A.; Gustin, K.M.; Maines, T.R.; Pantin-Jackwood, M.J.; Katz, J.M.; Tumpey, T.M. Influenza virus respiratory infection and transmission following ocular inoculation in ferrets. PLoS Pathog. 2012, 8, e1002569. [Google Scholar] [CrossRef]
- De Jonghe, S.; Lammens, L.; Raoof, A.; Steemans, K.; Broeckaert, F.; Verbeeck, J.; van Goethem, F.; Hanton, G. Miscellaneous: P17: Lethal rhinitis/sinusitis in rodents by aspiration of formulation in gavage studies: Importance of evaluation of the nose. Exp. Toxicol. Pathol. 2009, 61, 410. [Google Scholar]
- Lenoir, J.; Bachert, C.; Remon, J.-P.; Adriaens, E. The slug mucosal irritation (SMI) assay: A tool for the evaluation of nasal discomfort. Toxicol. in Vitro 2013, 27, 1954–1961. [Google Scholar] [CrossRef]
- Adriaens, E.; Bytheway, H.; de Wever, B.; Eschrich, D.; Guest, R.; Hansen, E.; Vanparys, P.; Schoeters, G.; Warren, N.; Weltens, R.; et al. Successful prevalidation of the slug mucosal irritation test to assess the eye irritation potency of chemicals. Toxicol. in Vitro 2008, 22, 1285–1296. [Google Scholar]
- Cater, K.C.; Harbell, J.W. Comparison of in vitro eye irritation potential by Bovine Corneal Opacity and Permeability (BCOP) assay to erythema scores in human eye sting test of surfactant-based formulations. Cutan. Ocul. Toxicol. 2008, 27, 77–85. [Google Scholar] [CrossRef]
- Adriaens, E.; Remon, J.P. Evaluation of an alternative mucosal irritation test using slugs. Toxicol. Appl. Pharmacol. 2002, 182, 169–175. [Google Scholar] [CrossRef]
- Shao, D.; Massoud, E.; Clarke, D.; Cowley, E.; Renton, K.; Agu, R.U. Optimization of human nasal epithelium primary culture conditions for optimal proton oligopeptide and organic cation transporters expression in vitro. Int. J. Pharm. 2013, 441, 334–342. [Google Scholar] [CrossRef]
- Macdonald, C.; Shao, D.; Oli, A.; Agu, R.U. Characterization of Calu-3 cell monolayers as a model of bronchial epithelial transport: Organic cation interaction studies. J. Drug Target. 2013, 21, 97–106. [Google Scholar] [CrossRef]
- Roomi, M.W.; Kalinovsky, T.; Niedzwiecki, A.; Rath, M. Modulation of u-PA, MMPs and their inhibitors by a novel nutrient mixture in human lung cancer and mesothelioma cell lines. Int. J. Oncol. 2013, 42, 1883–1889. [Google Scholar]
- Forbes, B.; Ehrhardt, C. Human respiratory epithelial cell culture for drug delivery applications. Eur. J. Pharm. Biopharm. 2005, 60, 193–205. [Google Scholar] [CrossRef]
- Sporty, J.L.; Horálková, L.; Ehrhardt, C. In vitro cell culture models for the assessment of pulmonary drug disposition. Expert Opin. Drug Metab. Toxicol. 2008, 4, 333–345. [Google Scholar] [CrossRef]
- McCarthy, J.; Inkielewicz-Stępniak, I.; Corbalan, J.J.; Radomski, M.W. Mechanisms of toxicity of amorphous silica nanoparticles on human lung submucosal cells in vitro: Protective effects of fisetin. Chem. Res. Toxicol. 2012, 25, 2227–2235. [Google Scholar] [CrossRef]
- LOGKOW—Sangster Research Laboratories—Search. Available online: http://logkow.cisti.nrc.ca/logkow/search.html (accessed on 14 November 2013).
- Chemicalize. Available online: http://www.chemicalize.org/ (accessed on 14 November 2013).
- Mosmann, T. Rapid colorimetric assay for cellular growth and survival: Application to proliferation and cytotoxicity assays. J. Immunol. Methods 1983, 65, 55–63. [Google Scholar] [CrossRef]
- Adriaens, E.; Dierckens, K.; Bauters, T.G.; Nelis, H.J.; van Goethem, F.; Vanparys, P.; Remon, J.P. The mucosal toxicity of different benzalkonium chloride analogues evaluated with an alternative test using slugs. Pharm. Res. 2001, 18, 937–942. [Google Scholar] [CrossRef]
- Wang, C.; Deng, Q.; Han, D.; Zhang, L. Effects of benzalkonium chloride and potassium sorbate on airway ciliary activity. ORL 2012, 74, 149–153. [Google Scholar] [CrossRef]
- Epstein, S.P.; Chen, D.; Asbell, P.A. Evaluation of biomarkers of inflammation in response to benzalkonium chloride on corneal and conjunctival epithelial cells. J. Ocul. Pharmacol. Ther. 2009, 25, 415–424. [Google Scholar] [CrossRef]
- EUR—Lex-Recherche Simple. Available online: http://eur-lex.europa.eu/LexUriServ/LexUriServ.do?uri=CELEX:32012R0640:EN:NOT (accessed on 18 November 2013).
- Rovida, C.; Martin, S.F.; Vivier, M.; Weltzien, H.U.; Roggen, E. Advanced tests for skin and respiratory sensitization assessment. ALTEX 2013, 30, 231–252. [Google Scholar] [CrossRef]
- Barile, F.A. Validating and troubleshooting ocular in vitro toxicology tests. J. Pharmacol. Toxicol. Methods 2010, 61, 136–145. [Google Scholar] [CrossRef]
- Roggen, E.L.; Soni, N.K.; Verheyen, G.R. Respiratory immunotoxicity: An in vitro assessment. Toxicol. in Vitro 2006, 20, 1249–1264. [Google Scholar] [CrossRef]
- Donahue, D.A.; Kaufman, L.E.; Avalos, J.; Simion, F.A.; Cerven, D.R. Survey of ocular irritation predictive capacity using Chorioallantoic Membrane Vascular Assay (CAMVA) and Bovine Corneal Opacity and Permeability (BCOP) test historical data for 319 personal care products over fourteen years. Toxicol. in Vitro 2011, 25, 563–572. [Google Scholar] [CrossRef]
- Gautheron, P.; Giroux, J.; Cottin, M.; Audegond, L.; Morilla, A.; Mayordomo-Blanco, L.; Tortajada, A.; Haynes, G.; Vericat, J.A.; Pirovano, R.; et al. Interlaboratory assessment of the bovine corneal opacity and permeability (BCOP) assay. Toxicol. in Vitro 1994, 8, 381–392. [Google Scholar] [CrossRef]
- Alvarez-Figueroa, M.J.; Pessoa-Mahana, C.D.; Palavecino-González, M.E.; Mella-Raipán, J.; Espinosa-Bustos, C.; Lagos-Muñoz, M.E. Evaluation of the membrane permeability (PAMPA and skin) of benzimidazoles with potential cannabinoid activity and their relation with the Biopharmaceutics Classification System (BCS). AAPS PharmSciTech 2011, 12, 573–578. [Google Scholar] [CrossRef]
© 2014 by the authors; licensee MDPI, Basel, Switzerland. This article is an open access article distributed under the terms and conditions of the Creative Commons Attribution license (http://creativecommons.org/licenses/by/3.0/).
Share and Cite
Ihekwereme, C.; Esimone, C.; Shao, D.; Agu, R.U. Preliminary Studies on Validation of Calu-3 Cell Line as a Model for Screening Respiratory Mucosa Irritation and Toxicity. Pharmaceutics 2014, 6, 268-280. https://doi.org/10.3390/pharmaceutics6020268
Ihekwereme C, Esimone C, Shao D, Agu RU. Preliminary Studies on Validation of Calu-3 Cell Line as a Model for Screening Respiratory Mucosa Irritation and Toxicity. Pharmaceutics. 2014; 6(2):268-280. https://doi.org/10.3390/pharmaceutics6020268
Chicago/Turabian StyleIhekwereme, Chibueze, Charles Esimone, Di Shao, and Remigius U. Agu. 2014. "Preliminary Studies on Validation of Calu-3 Cell Line as a Model for Screening Respiratory Mucosa Irritation and Toxicity" Pharmaceutics 6, no. 2: 268-280. https://doi.org/10.3390/pharmaceutics6020268
APA StyleIhekwereme, C., Esimone, C., Shao, D., & Agu, R. U. (2014). Preliminary Studies on Validation of Calu-3 Cell Line as a Model for Screening Respiratory Mucosa Irritation and Toxicity. Pharmaceutics, 6(2), 268-280. https://doi.org/10.3390/pharmaceutics6020268