1. Introduction
Ridaforolimus, also known as deforolimus, AP-23573, and MK8669, is a non-prodrug rapamycin analog (
Figure 1A). It is a large lipophilic (MW: 990 g/mol; XlogP: 5.9) carboxylic lactone-lactam macrolide antibiotic with potent anti-proliferative and immunosuppressive effects. Ridaforolimus inhibits the mammalian target of rapamycin (mTOR), a serine/threonine kinase that is expressed throughout most mammalian cells and that is involved in a variety of cell signaling cascades [
1]. Inappropriate activation of mTOR has been implicated in the pathogenesis of a range of cancers and can account for tumor proliferation and growth [
1]. Ridaforolimus has been shown to inhibit mTOR and has demonstrated anti-proliferative activity against several cancer types
in vitro and
in vivo [
2].
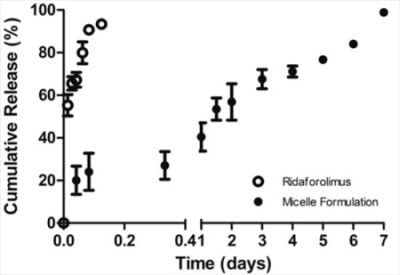
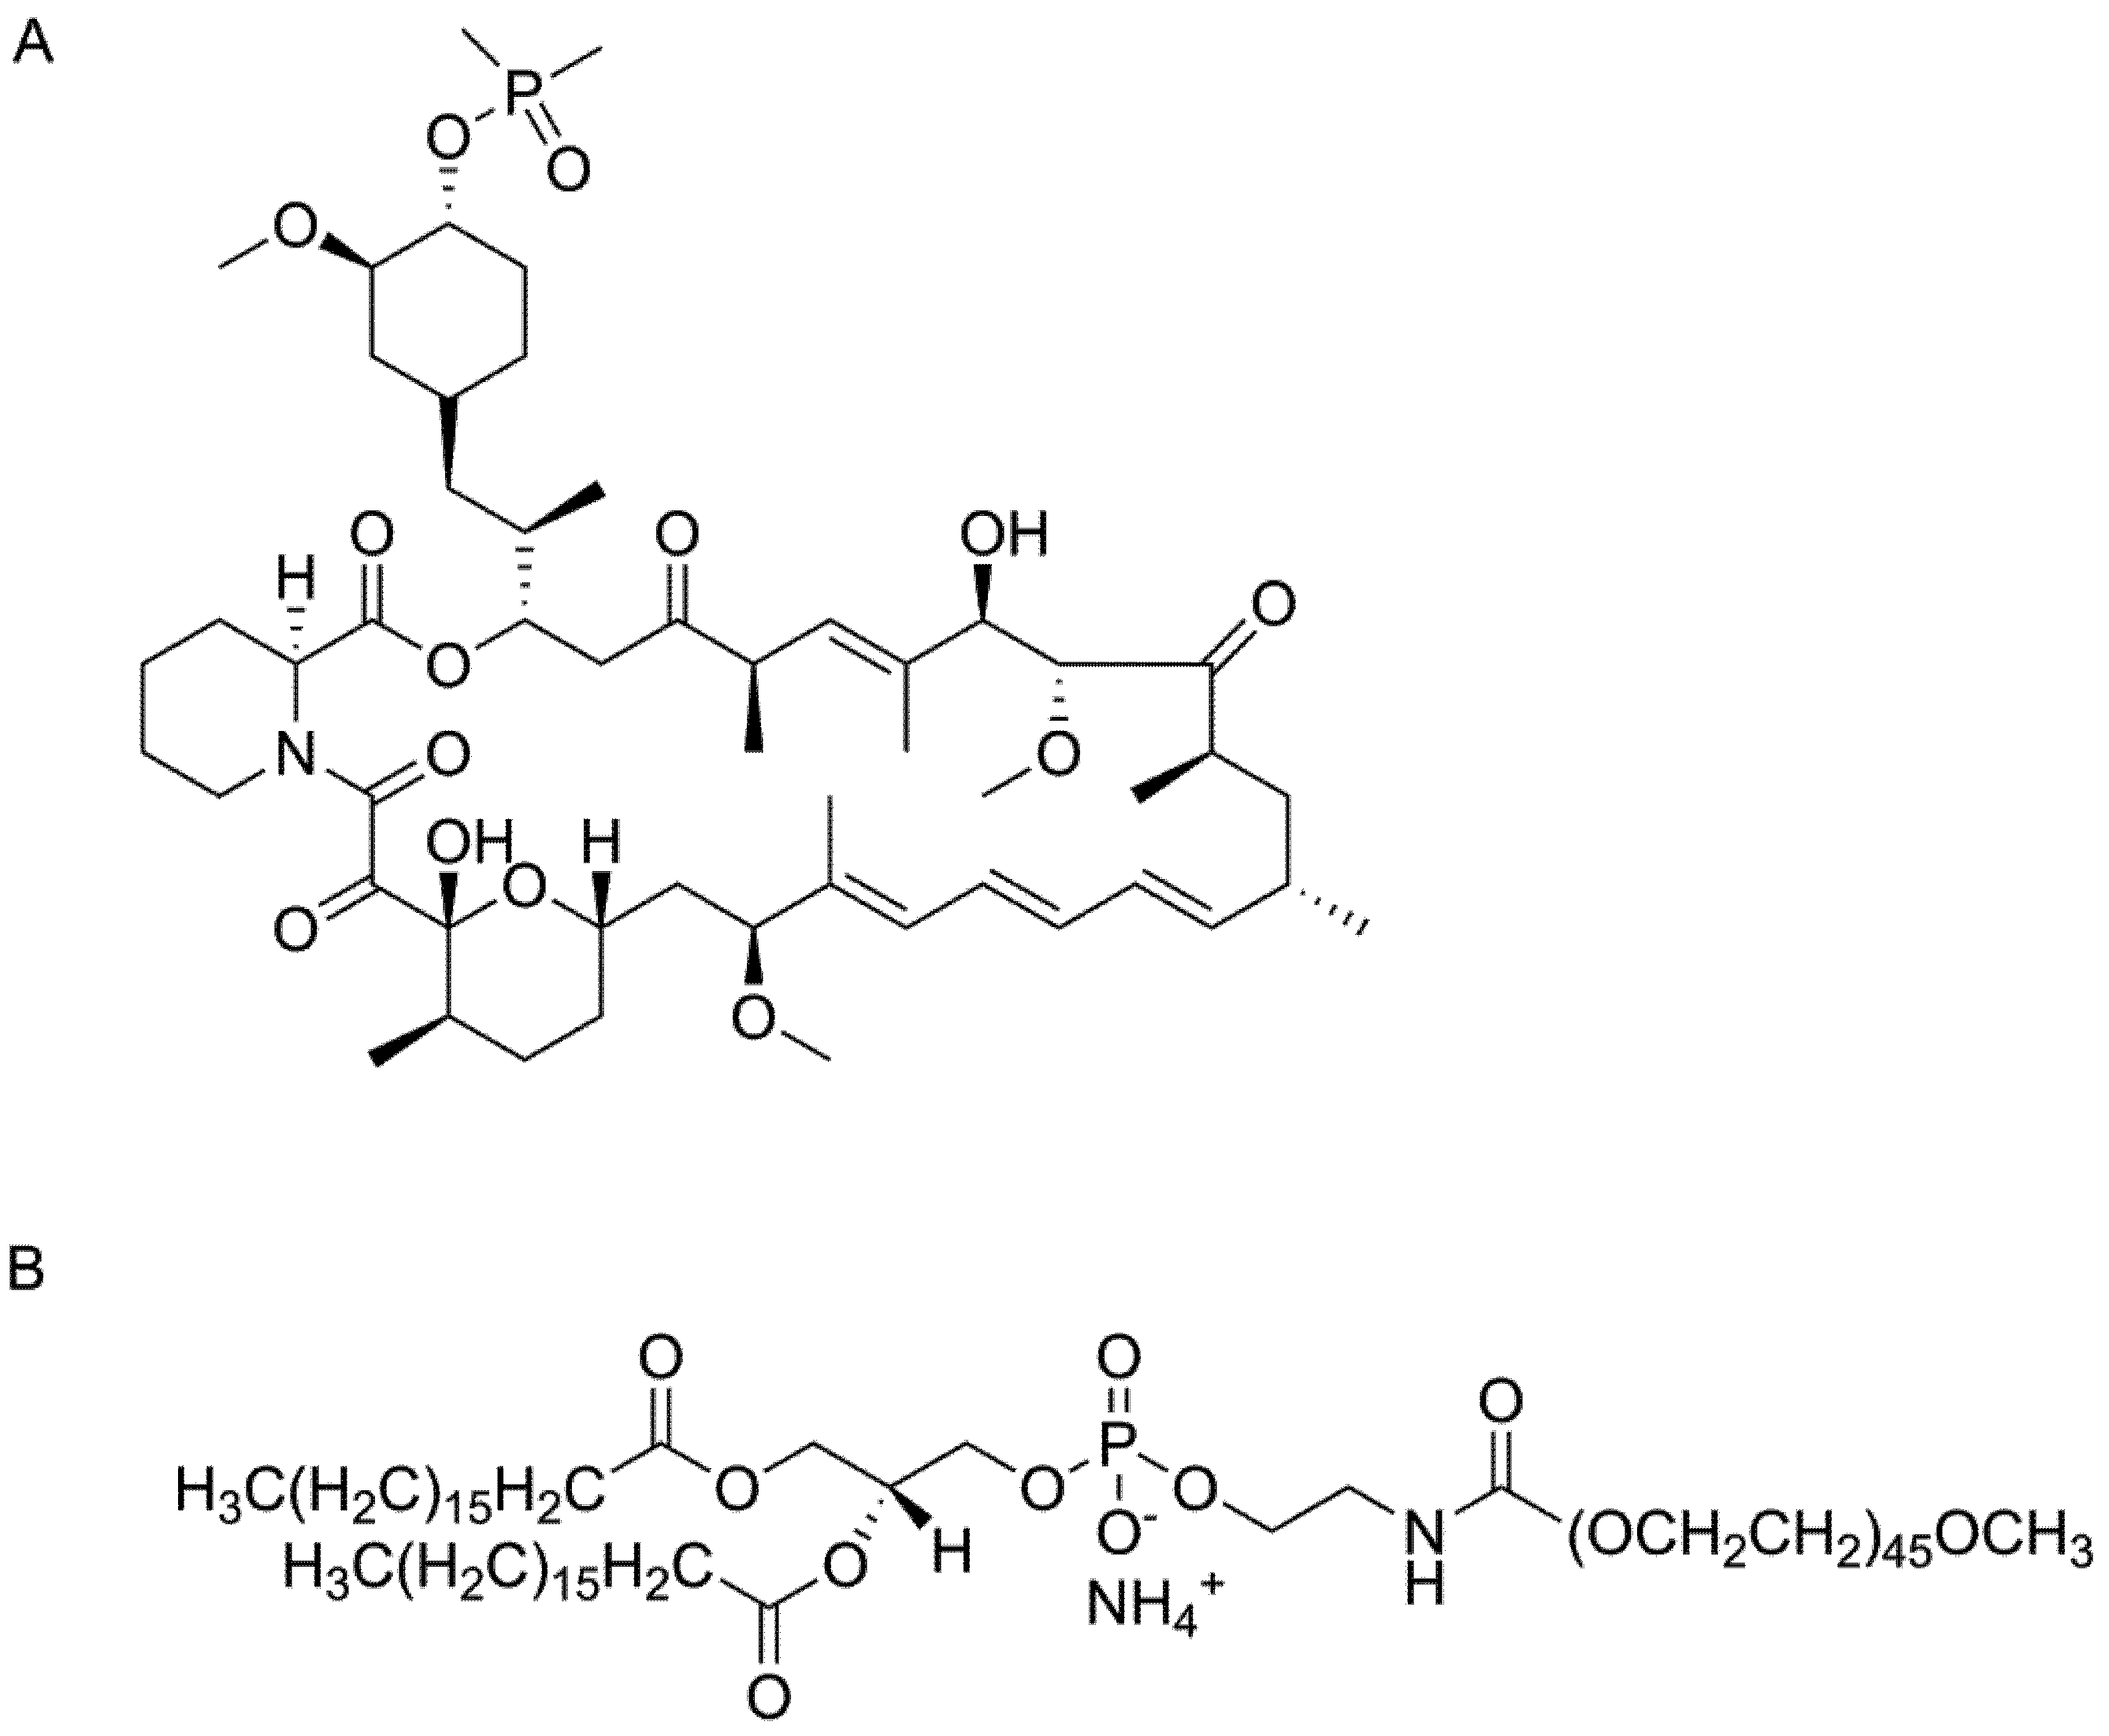
Figure 1.
Chemical structure of (A) ridaforolimus and (B) DSPE-PEG2000.
Figure 1.
Chemical structure of (A) ridaforolimus and (B) DSPE-PEG2000.
Ridaforolimus is currently undergoing numerous clinical trials for a range of cancers both as a monotherapy and in combination with other chemotherapeutics including a Phase III clinical trial for metastatic soft-tissue and bone sarcoma. Formulations being evaluated in these clinical trials include an intravenous formulation given as an infusion and an oral formulation. The pharmacokinetic results from these studies suggest ridaforolimus follows non-linear kinetics following oral and intravenous administration as indicated by non-linear increases in area under the curve (AUC) and concentration maximum (
Cmax) with increases in dose [
3]. Changes in clearance (CL) and volume of distribution at steady state (
Vss) are also reported to change with dose [
3]. It has been suggested that this nonlinearity is consistent with saturation of the red blood cell compartment which contains a substantial amount of FKBP-12, the binding protein of ridaforolimus and other rapamycin analogs [
4]. This strong partitioning of ridaforolimus to the red blood cell compartment may hinder the accessibility of ridaforolimus into solid tumor sites [
5].
Ridaforolimus and other derivatives of rapamycin including temsirolimus and everolimus differ from rapamycin at the C-42 position. In the case of ridaforolimus, the C-42 position consists of a dimethylphosphinate substitution, which increases the aqueous solubility of ridaforolimus (
ca. 200 μg/mL) in comparison to rapamycin (
ca. 2.6 μg/mL) [
6]. Although improved in relation to rapamycin, the solubility of ridaforolimus is still poor and has likely hindered development of clinical intravenous formulations. This cannot be verified, however, as the only formulation information published to our knowledge includes that of animal studies where ridaforolimus was solubilized in a complicated vehicle of dimethyl acetamide/polysorbate 80/polyethylene glycol-400/water (10/10/40/40,
v/
v/
v/
v) [
7].
Further increasing the solubility of ridaforolimus through the use of nanocarrier technology may decrease the amount of ridaforolimus that partitions to the erythrocyte compartment and thereby allow for easier prediction of pharmacokinetic parameters. A specific class of nanocarriers that has a large solubilization capacity for poorly water soluble molecules are the pegylated phospholipid (PPL) micelles [
8]. These self-assembled micelles are capable of solubilizing a wide range of hydrophobic molecules, and they are a potential tool for the safe formulation and delivery of antitumor agents to tumors without the inclusion of potentially harmful surfactants and excipients [
5,
8,
9]. Due to their nanoscopic dimensions (typically <70 nm), PPL micelles can leave leaky vasculature, accumulating in tumors via the enhanced permeability and retention effect (EPR), where they remain due to poor lymphatic clearance [
8]. An outer coat of poly(ethylene glycol) (PEG) imparts “stealth” characteristics to micelles, allowing them to circulate for long periods of time and avoid the mononuclear phagocyte system (MPS). These effects potentially reduce non-specific toxicities of the chemotherapeutic. Therefore, encapsulation of ridaforolimus in a micelle nanocarrier may limit its systemic toxicities specifically its dose-limiting toxicity of mucositis [
3].
Previous investigations have confirmed that micelle formulations of poly(ethylene glycol)-block-poly(caprolactone) (PEG-b-PCL) can substantially increase the solubility and circulation time of rapamycin, while also greatly reducing the non-specific toxicity [
5]. We hypothesize that encapsulation of ridaforolimus in the PPL micelle polymer 1,2-distearoyl-
sn-glycero-3-phosphoethanolamine-
N-methoxy-poly(ethylene glycol 2000) (DSPE-PEG
2000) may allow for improved solubility while limiting the partition to erythrocytes. DSPE-PEG
2000 (
Figure 1B), was chosen due to its promising kinetic and thermodynamic stability and biocompatibility DSPE-PEG
2000 has received regulatory approval in the US and/or Europe in three formulations of doxorubicin (Doxil, LipoDox and Thermodox). Herein, we report the pharmacokinetics of a DSPE-PEG
2000 formulation of ridaforolimus in rats. To our knowledge, this is the first report of the pharmacokinetics of ridaforolimus in rats and the first attempt to solubilize ridaforolimus in any type of nanocarrier.
3. Experimental Section
3.1. Chemical and Reagents
Ridaforolimus was purchased from LC Labs (Woburn, WA, USA). 1,2-distearoyl-sn-glycero-3-phosphoethanolamine-N-[methoxy(polyethylene glycol)-2000] (DSPE-PEG2000) copolymer was purchased from Avanti Polar Lipids (Alabaster, AL, USA). HPLC-grade methanol and water were purchased from J.T. Baker (Philipsburg, NJ, USA). Other chemicals were of analytical grade. Healthy male Sprague-Dawley rats were obtained from Simonsen Labs (Gilroy, CA, USA). Ethical approval for animal experiments was obtained from Institutional Animal Care and Use Committee of Washington State University
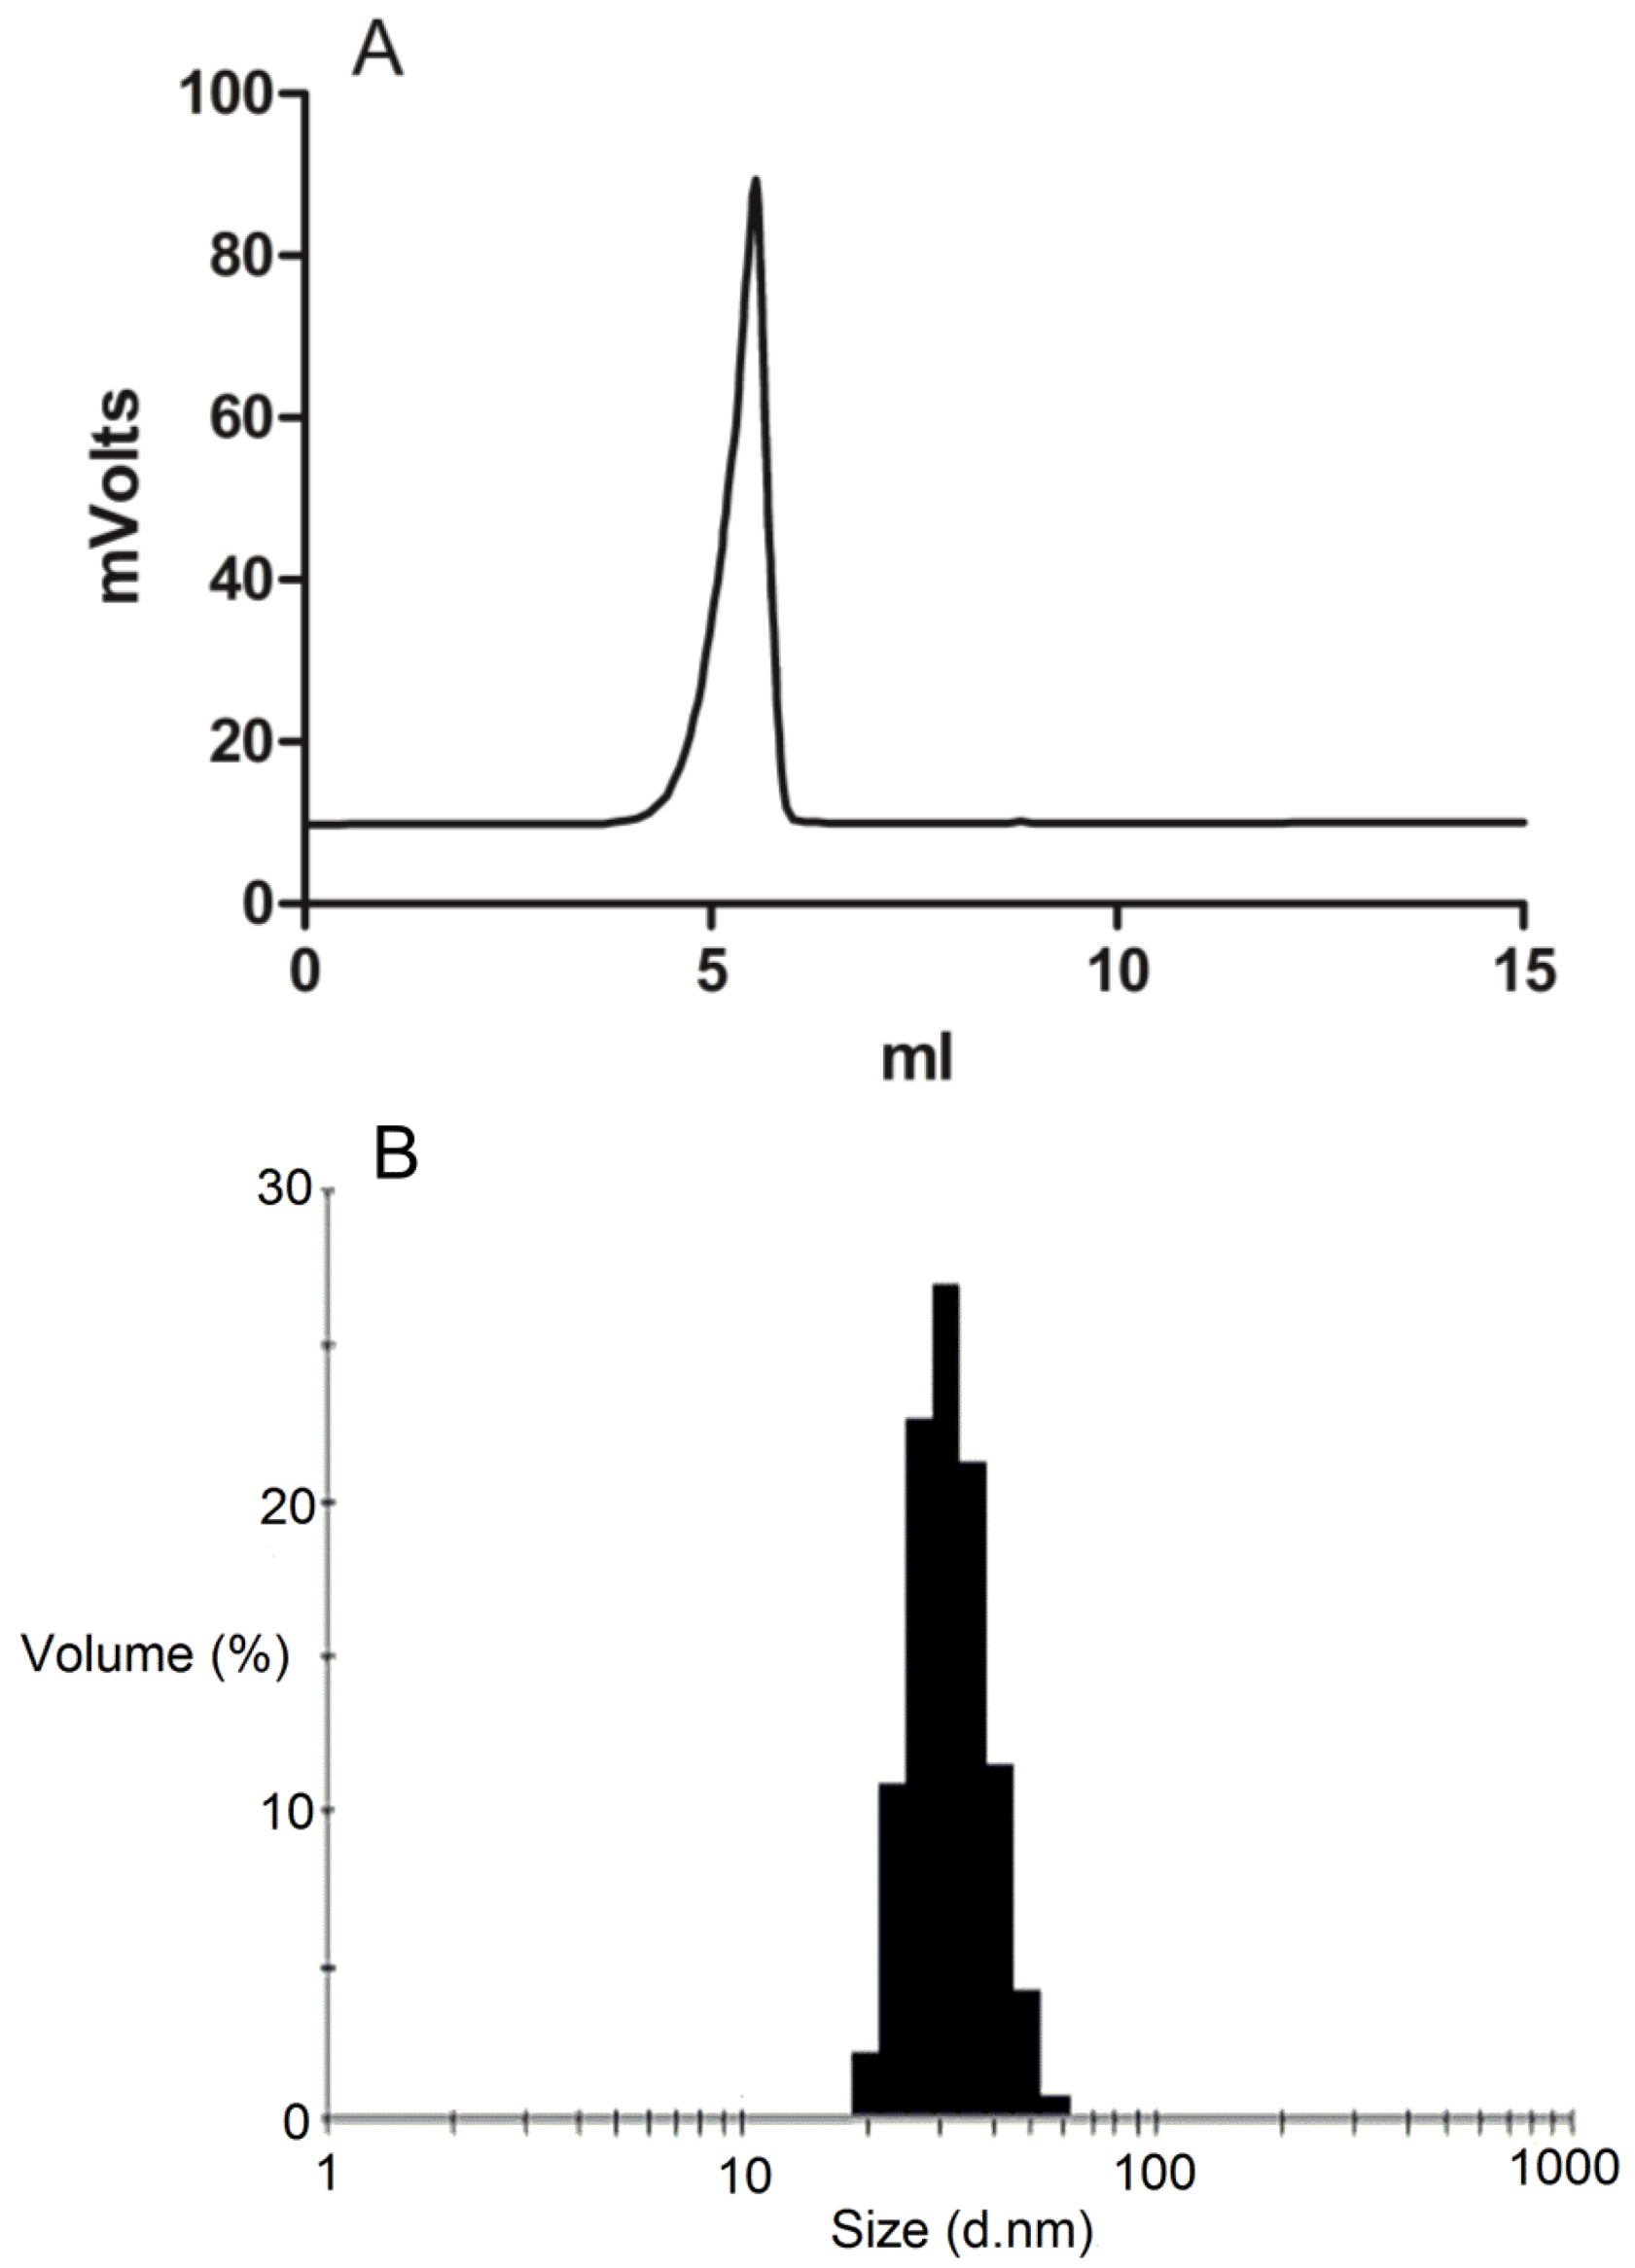
3.3. Micelle Characterization
The formation of DSPE-PEG2000 micelles was determined by gel permeation chromatography (GPC) using a Shimadzu 2010CHT system with 0.8 mL/min ddH2O as the mobile phase on a Shodex OHpak-803 HQ column (Showa Denko America, NY, USA) thermostated at 40 °C An evaporative light scattering detector (ELSD-LTII, Shimadzu, Lenexa, KS, USA) was used to detect the particles. Narrow molecular weight distribution polyethylene glycols (Scientific Polymer Products, Ontario, NY, USA) were used as standards for GPC analysis. To confirm the drug was encapsulated in the micelles, GPC peak fractions were collected and dried by Speed-Vac. The dried micelle fractions were redissolved in methanol and then analyzed by reversed-phase HPLC.
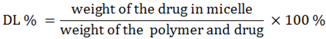
The drug loading efficiency (DL%) and encapsulation efficiency (EE%) of ridaforolimus in DSPE-PEG
2000 micelles were calculated according to the following equations:
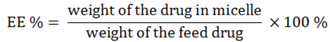
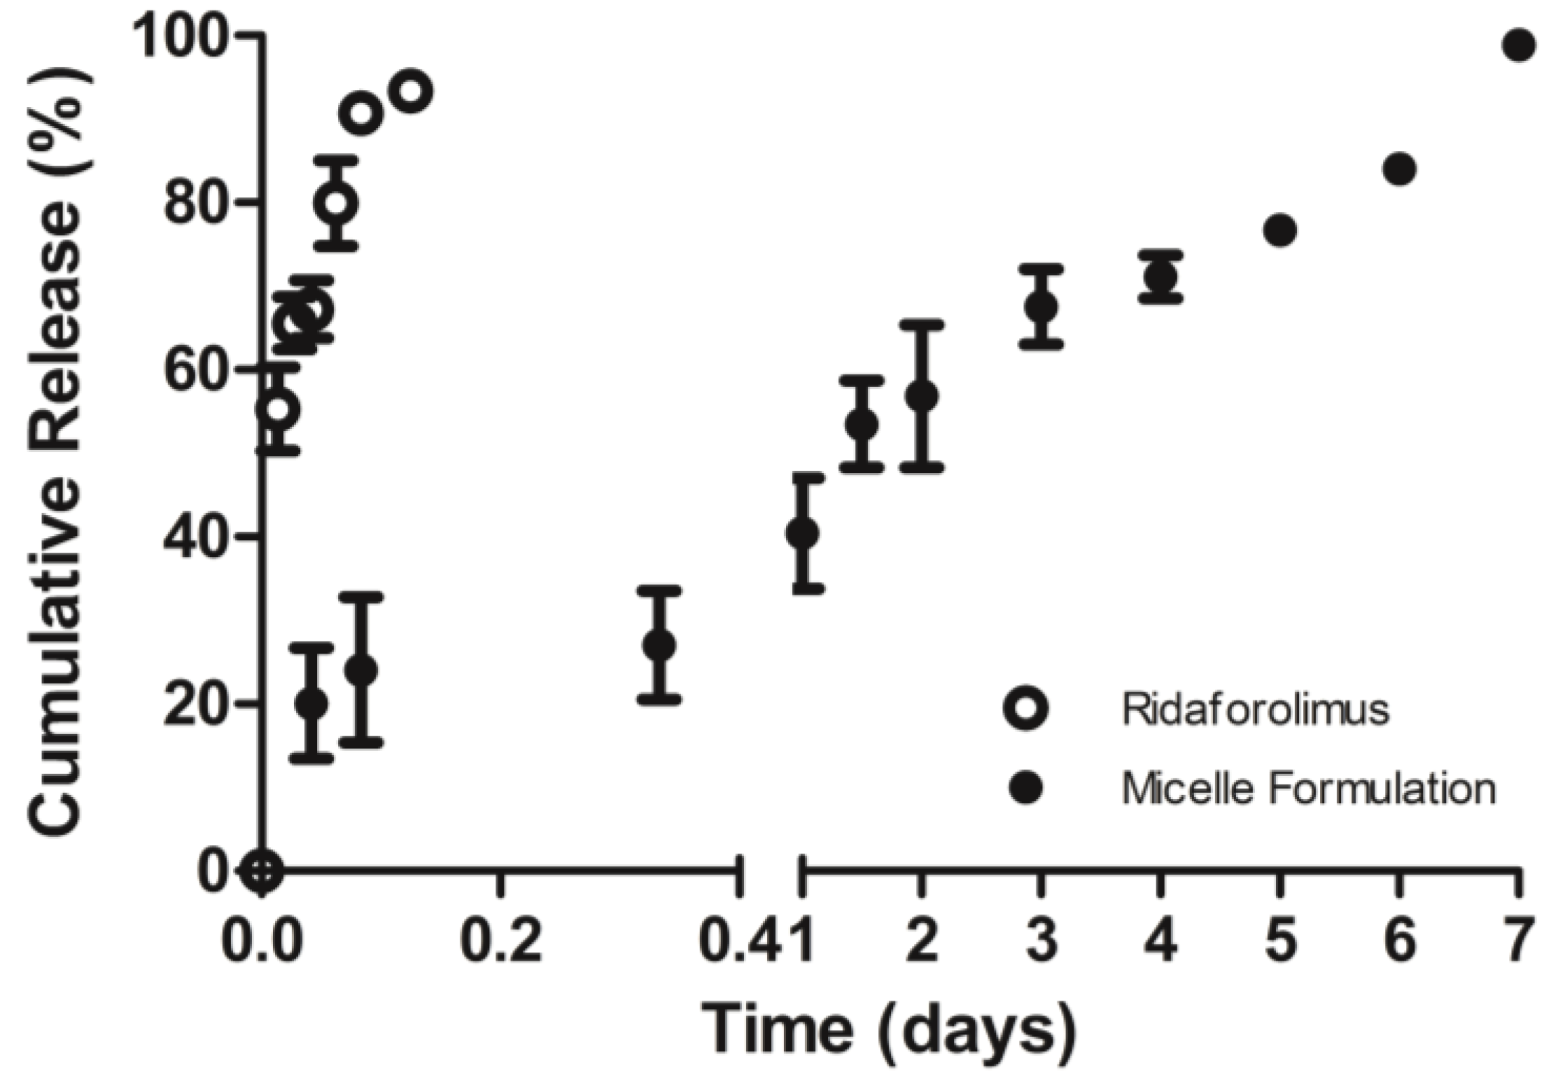
The in vitro release of the drug from DSPE-PEG2000 micelles into PBS (pH 7.4) was done by a dialysis method. Dialysis was carried out at 37 °C under sink condition using a 10-kDa MWCO dialysis tubing (SnakeSkin®, Thermo Scientific Inc., Rockford, IL, USA). The initial volume of drug-loaded micelles in the dialysis tubing was 2 mL and the sink solution was 4 L. The PBS was changed several times per day to maintain sink conditions. After pre-determined time intervals, samples were withdrawn from the dialysis bag and analyzed by a reversed phase HPLC column (TSK-GEL® ODS-100Z, Tosoh Bioscience) at 50 °C with UV detection at 290 nm.
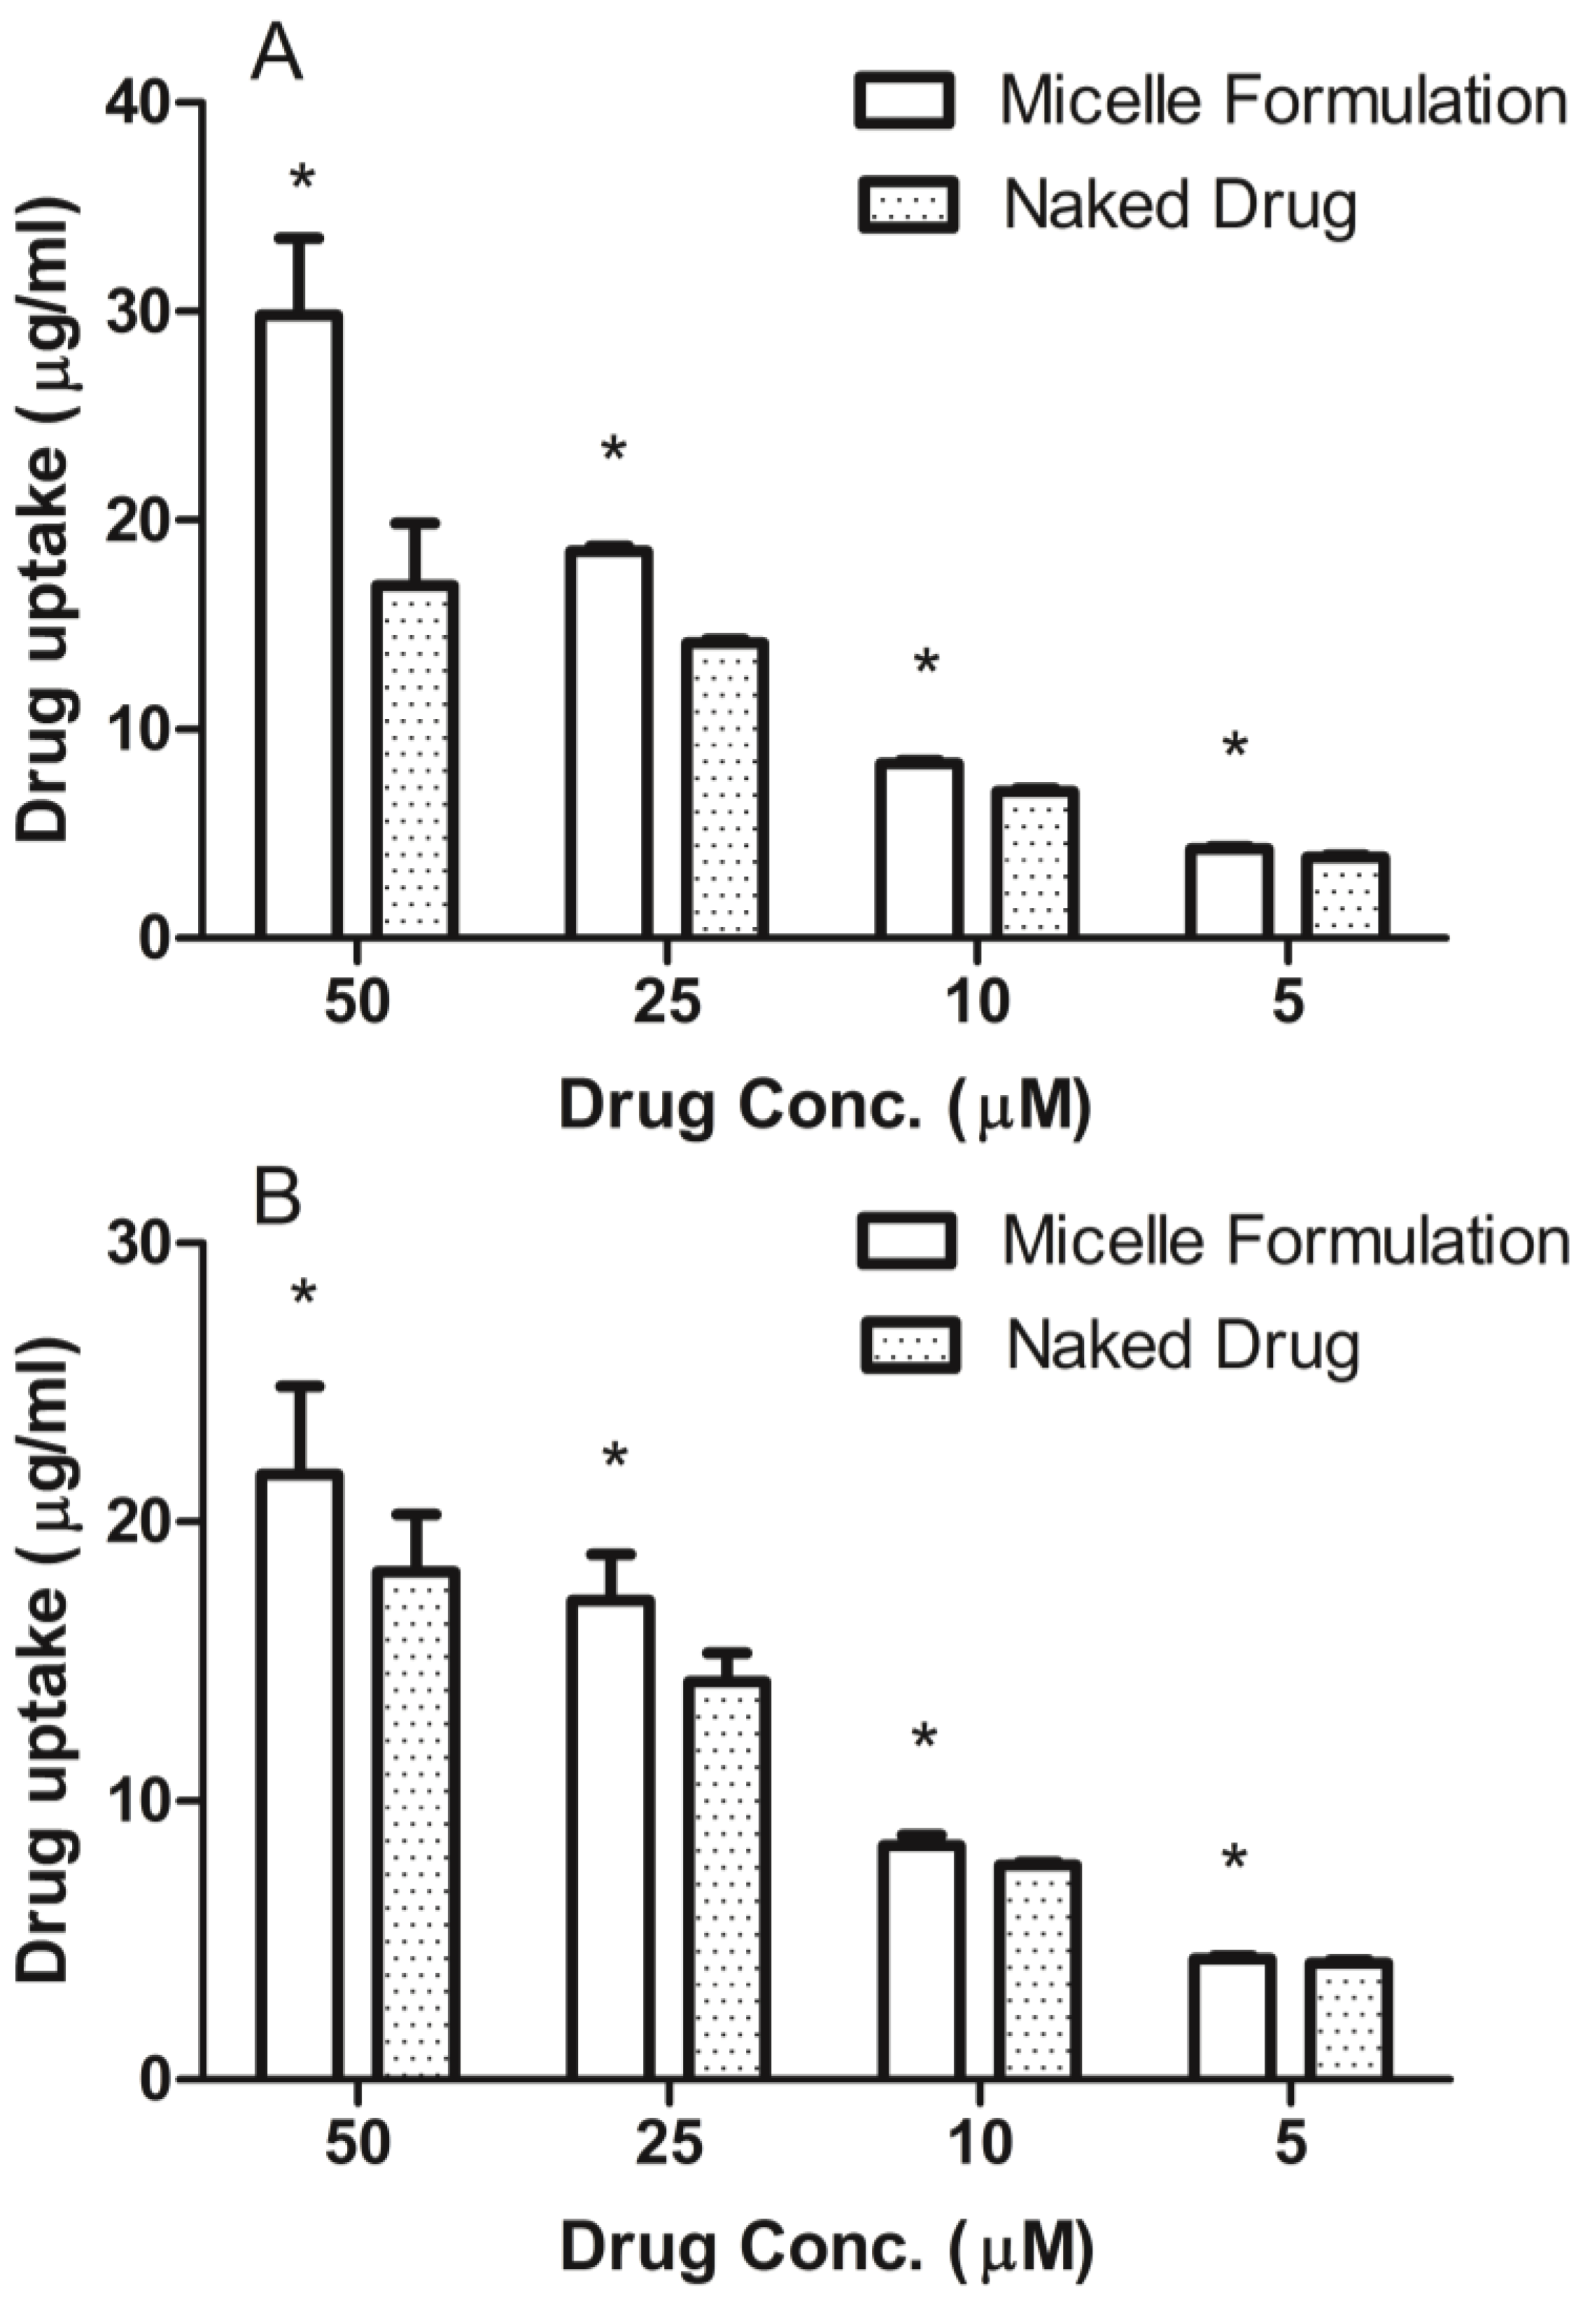
3.4. Cellular Uptake of DSPE-PEG2000 Micelles
Prostate cancer cell line, DU145, was maintained in RPMI-1640 medium and head and neck cancer cell line, MDA-1986, was kept in Dulbecco Modified Eagle Medium (DMEM). Both medium were supplemented with 10% fetal bovine serum (Hyclone Laboratory Inc., Logan, UT, USA). Cells were plated in 96-well flat-bottomed plates at a concentration of 10,000 cells per 90 μL of growth medium. After the cells attached to the surface, ridaforolimus dissolved in DMSO or encapsulated in DSPE-PEG2000 micelles was added at concentrations of 0, 5, 10, 25, 50 µM. After a 6-h treatment, the cell culture medium was removed and analyzed for extracellular drug content by HPLC.
3.5. LC/MS Analysis of Ridaforolimus
The LC/MS system was a Shimadzu LCMS-2010 EV liquid chromatograph mass spectrometer system (Kyoto, Japan) connected to the LC portion consisting of two LC-10AD pumps, a SIL-10AD VP auto injector, a SPD-10A VP UV detector, and a SCL-10A VP system controller was used. Data analysis was accomplished using Shimadzu LCMS Solutions Version 3 software. A Phenomenex
® Luna C
18 (2) analytical column (250 × 4.6 mm; 5 µm) was used with a mobile phase of methanol, water, and formic acid (90:10:0.1,
v/
v/
v) modified with 2 mM ammonium acetate at a flow rate of 0.5 mL/min. Pterostilbene was used as an internal standard. Positive selective ion monitoring (SIM) was used for detection of ridaforolimus at
m/
z 1012.60 (sodium adduct) and pterostilbene at
m/
z 257. Sodium adduct formation of other immunosuppressants have been reported [
14,
15]. This LC/MS method was linear over 0.05–10 μg/mL concentration range with a lower limit of quantitation (LLOQ) of 0.05 μg/mL. Interday precision and accuracy for the method were within the acceptance criteria of <15%.
3.6. Surgical Procedures
Male Sprague-Dawley rats (~250 g) were obtained from Simonsen Labs (Gilroy, CA, USA) and given food (Purina Rat Chow 5001) and water ad libitum in our animal facility for at least 3 days before use. Rats were housed in temperature-controlled rooms with a 12 h light/dark cycle. The day before the pharmacokinetic experiment, the right jugular veins of the rats were catheterized with sterile silastic cannula (Dow Corning, Midland, MI, USA) under isoflurane anesthesia. After cannulation, the Intramedic PE-50 polyethylene tubing (Becton, Dickinson and Company, Franklin Lakes, NJ, USA) connected to the cannula was exteriorized through the dorsal skin. The cannula was flushed with 0.9% saline. The animals were transferred to metabolic cages and fasted overnight. Animal use protocols were approved by The Institutional Animal Care and Use Committee at Washington State University.
3.7. Pharmacokinetic Study
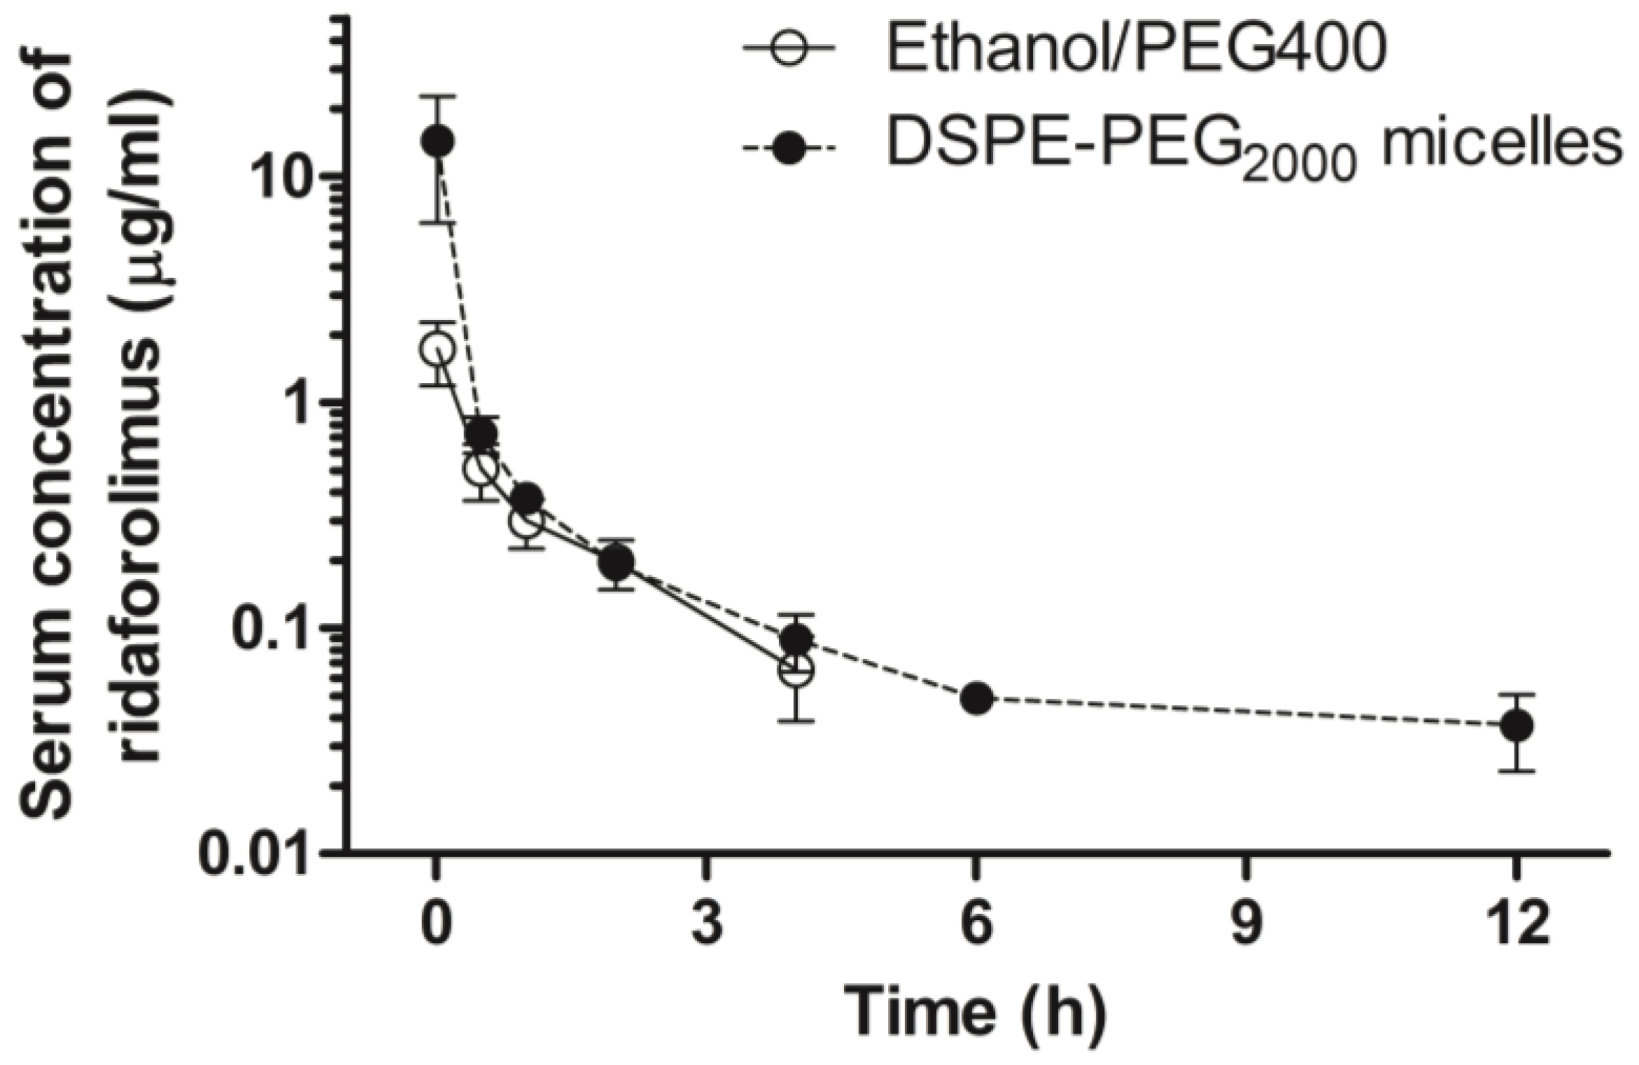
On the days of the experiment, animals were intravenously administered a single bolus injection of either ridaforolimus in ethanol/PEG 400 (10 mg/kg,
n = 7) or the ridaforolimus in DSPE-PEG
2000 (10 mg/kg,
n = 7). These dosages were based on dose varying studies previously conducted in our laboratory with the structurally similar compound, rapamycin, and are in accordance with animal studies of ridaforolimus [
5,
7].
After dosing, serial blood samples (~0.30 mL) were collected from the cannula at 0, 1 min, and 30 min, then 1, 2, 4, 6, 12, 24, and 48 h after intravenous administration, and the cannula flushed with 0.9% saline. After dosing and after each serial blood sampling, blinded observers were present to record any visible behavior, bleeding, or change in overall appearance of the animal as signs of acute tolerability. Each blood sample was collected and following centrifugation, the serum was collected and stored at −70 °C until analyzed.
3.8. Sample Preparation
To extract ridaforolimus from serum samples, an ethyl acetate extraction was used. To 100 µL of serum sample, 10 µL of IS (100 µg/mL), 200 µL HPLC-grade water, and 1 mL of ethyl acetate were added. Samples were vortexed for 30 s, centrifuged at 5000 rpm for 5 min, and the organic phase transferred to a new sample tube and dried under a stream of nitrogen gas. Dried samples were reconstituted with 100 µL of mobile phase and 10 µL injected into the LC/MS system.
3.9. Pharmacokinetic Analysis
Pharmacokinetic analysis was completed using data from individual rats for which the mean and standard error of the mean (SEM) were calculated for each group except for
Tmax which was represented as median and range. Pharmacokinetic parameters were estimated through noncompartmental analysis by the methods of Gibaldi
et al. [
16]. The apparent terminal elimination rate constant (
ke) was estimated from the slope of the log–linear phase of declining serum concentration
vs. time plot. The half-life (
t1/2) was calculated using the following equation:
t1/2 = 0.693/
ke. The area under the concentration time curve (AUC
0→Clast) was calculated using the linear/logarithmic trapezoidal method. Summation of AUC
0→Clast and the concentration at the last measured point divided by
ke yielded AUC
0→∞. Mean residence time (MRT) was calculated by dividing AUMC
0→∞ by AUC
0→∞, clearance (CL) by dividing dose by AUC
0→∞, and volume of distribution (V
ss) by multiplying MRT by CL.
3.10. Statistical Analysis
Quantification was based on calibration curves constructed using peak area ratio (PAR) of ridaforolimus to internal standard, against ridaforolimus concentrations using unweighted least squares linear regression. Pharmacokinetic analysis was performed using data from individual rats for which the mean and standard error of the mean (SEM) were calculated for each group. The data were analyzed for statistical significance in Microsoft Excel® using student’s t-test with a value of p < 0.05 being considered statistically significant.


