Article

Intra-Subject Variability in Pharmacokinetics and Pharmacodynamics of Basal Insulin at Two Single-Dose Levels: Findings from Euglycemic Glucose Clamp Bioequivalence Studies of Insulin Degludec


1
Department of Endocrinology and Metabolism, West China Hospital of Sichuan University, Chengdu 610041, China
2
Clinical Trial Center, West China Hospital of Sichuan University, Chengdu 610041, China
3
Health Management Center, West China Hospital of Sichuan University, Chengdu 610041, China
*
Author to whom correspondence should be addressed.
Pharmaceutics 2026, 18(9), 1051; https://doi.org/10.3390/pharmaceutics18091051
Submission received: 28 June 2026 / Revised: 15 August 2026 / Accepted: 21 August 2026 / Published: 25 August 2026
(This article belongs to the Section Pharmacokinetics and Pharmacodynamics)

Abstract

Background/Objectives: Standard protocols for euglycemic clamp studies involving long-acting insulin formulations typically recommend a dosage range of 0.4~0.6 U/kg for a single dose. This investigation aimed to evaluate the bioequivalence of an insulin degludec (IDeg) biosimilar versus its reference product, while simultaneously analyzing intra-subject variability in pharmacokinetic (PK) and pharmacodynamic (PD) metrics at doses of 0.4 U/kg and 0.5 U/kg in healthy Chinese adults. Methods: This randomized, single-dose, crossover euglycemic clamp study involved 52 participants who received either 0.4 U/kg (Group A, n = 26) or 0.5 U/kg (Group B, n = 26) of both formulations. Key outcomes measured included AUCIDeg,0–24h, Cmax,IDeg, and AUCGIR,0–24h. Secondary endpoints encompassed AUC of IDeg or GIR at specified intervals and time-related metrics. Intra-subject variability (intra-CV) was assessed for PK/PD parameters. Results: All subjects completed the study without dropping out. Baseline demographics showed no significant disparities between groups. Bioequivalence criteria were satisfied for all PK/PD endpoints, with 90% confidence intervals (CIs) falling within the 0.80~1.25 range, with the exception of AUCGIR,0–12h at the 0.4 U/kg dose (90% CI: 0.944~1.333). Notably, the 0.4 U/kg dose exhibited significantly higher intra-CV for AUCGIR,0–24h (24.9% vs. 20.2%, p = 0.049) and AUCGIR,0–12h (37.6% vs. 27.6%, p = 0.005) compared to the 0.5 U/kg dose. Conclusions: Applying a 0.5 U/kg dose reduced intra-subject PD variability and improved equivalence likelihood for secondary endpoints, indicating that a higher single dose might be optimal in bioequivalence study design.

1. Introduction

Insulin remains the cornerstone of diabetes mellitus management, yet the market is heavily consolidated, with three major global corporations controlling approximately 99% of the market value and 96% of the volume [1]. Consequently, insulin costs remain prohibitively high in many regions. Data from 11 countries indicate that the average annual cost per individual is US$35.40 in the public sector and US$95.71 in the private sector [2]. As of 2019, insulin availability in low- and middle-income countries ranged between 55% and 80% [3]. The introduction of biosimilar insulins presents a viable pathway to alleviate the financial burden of insulin therapy [4,5,6]. Regulatory bodies, including the US Food and Drug Administration (FDA) [7,8] and the European Medicines Agency (EMA) [9], mandate that the pharmacokinetic (PK) and pharmacodynamic (PD) equivalence of a biosimilar must be established against the reference product using the euglycemic clamp technique prior to market approval.
Selecting the appropriate insulin dose is pivotal for the success of euglycemic clamp studies. Historical data reveal a wide variance in insulin dosing for these studies, ranging from as low as 0.05 U/kg [10] to as high as 2.22 U/kg [11]. Suboptimal dosing can lead to methodological flaws; for instance, lower doses may elicit only minimal glucose infusion rate (GIR) responses [12]. Studies utilizing lower doses (e.g., 0.3 U/kg for insulin glargine) [13,14] have occasionally yielded irreproducible results, a phenomenon often attributed to elevated intra-subject variability. Furthermore, clinical observations suggest that subcutaneous insulin administration does not always produce a consistent metabolic response, even under controlled conditions. Moreover, few studies [15,16,17,18] have investigated variability in absorption profiles following subcutaneous injection, with most research focusing on differences among various insulin types. Even fewer studies [16,19] have examined variations in glucose-lowering efficacy. Consequently, there is a paucity of data regarding how varying insulin doses impact time-based patterns and their associated glucose-lowering effects, particularly for basal insulin formulations.
Euglycemic clamp studies typically employ a crossover design to assess bioequivalence. The required sample size is heavily influenced by the intra-subject variability of the endpoints [20,21]; minimal GIR responses can inflate the variability of PD parameters, necessitating larger sample sizes and increased resources. Conversely, high-dose insulin clamps present their own challenges, such as managing rapid blood glucose fluctuations [12]. Even a single episode of hypoglycemia [12] or insufficient suppression of endogenous insulin [22] can compromise the validity of the clamp.
While EMA guidance [9] suggests a dose range of 0.4~0.6 U/kg for long-acting insulins, direct data comparing the impact of specific dose selections (e.g., 0.4 vs. 0.5 U/kg) on intra-subject variability and bioequivalence outcomes remain scarce. To address this gap, the current study analyzes the PK/PD bioequivalence and intra-subject variability of insulin degludec (IDeg) at doses of 0.4 and 0.5 U/kg in healthy Chinese subjects following a single subcutaneous injection.

2. Materials and Methods

2.1. Subject and Study Design

Participants receiving a dose of 0.4 U/kg were assigned to Group A, while those administered 0.5 U/kg were placed in Group B. Eligibility criteria were strictly defined: individuals aged 18–45 years, with a body mass index (BMI) between 18 and 26 kg/m2, normal glucose tolerance (fasting glucose < 6.1 mmol/L and 2-h post-load glucose < 7.8 mmol/L), and no history of hypertension, diabetes mellitus, or substance abuse. Health status was verified through comprehensive medical history reviews, laboratory tests (hematology, biochemistry, urinalysis, coagulation), physical examinations, and electrocardiograms. Smokers (≥5 cigarettes/day) and pregnant or lactating women were excluded.
The study protocol comprised a screening visit, two dosing periods separated by a washout interval of at least 14 days, and a follow-up visit (see Figure 1). On day 1, subjects were randomized 1:1 to either the TR or RT treatment sequence. They were admitted to the research unit at 18:00 the day prior to dosing. Following an overnight fast, each participant received a single subcutaneous injection of IDeg into the abdominal wall at the assigned dose (0.4 U/kg or 0.5 U/kg).

2.2. Euglycemic Clamp Procedure

On the morning of the dosing day, two venous catheters were inserted: one for blood sampling and another for the infusion of 20% dextrose. Baseline blood glucose (BG) was established as the mean of measurements taken at −30, −20, and −10 min pre-dose. Post-administration, BG was monitored every 10 min (0~8 h), every 20 min (8~16 h), and every 30 min (16~24 h) using a Biosen C_line glucose analyzer (EKF Diagnostics, Barleben, Germany). The 20% dextrose infusion was triggered when BG dropped by ≥0.28 mmol/L from baseline and was continuously titrated to maintain BG at a target level (0.28 mmol/L below baseline). The clamp was maintained for 24 h.

2.3. Blood Sampling and Bioanalysis for PK and C-Peptide

Blood samples (4 mL for PK and 2 mL for C-peptide) were collected at predefined intervals as previously described [23]. IDeg concentrations in plasma were quantified using a validated liquid chromatography-tandem mass spectrometry (LC-MS/MS) method with a quantification range of 0.25 to 50.0 ng/mL, a precision of ≤5.7%, and an inter-assay variation ranging from −0.3% to 2.0%. C-peptide levels in serum were measured using a qualified enzyme-linked immunosorbent assay (ELISA) method, which had a quantification range of 30 to 2400 pmol/L, an intra-assay variation of <5%, and an inter-assay variation of <9%.

2.4. Pharmacokinetic and Pharmacodynamic Estimates

Primary PK metrics included the area under the curve (AUC) from 0 to 24 h (AUCIDeg,0–24h) and peak concentration (Cmax,IDeg). Secondary PK parameters included AUC at various intervals (0–2 h, 12–24 h, 0–120 h), time to maximum concentration (Tmax), and half-life (t1/2). The primary PD endpoint was the AUC of the glucose infusion rate (GIR) over 24 h (AUCGIR,0–24h). Secondary PD parameters included AUCGIR at specified intervals, maximum GIR (GIRmax), and time to GIRmax (tGIRmax). Calculations were performed using Phoenix WinNonlin (v8.1).

2.5. Sample Size and Statistical Analysis

Assuming a maximum intra-subject variation of 20.5%, a sample size of 26 was calculated to achieve 91% power at a 5% significance level using a two one-sided test procedure. This calculation was based on an expected true mean ratio of biosimilar IDeg (BioIDeg) to the reference product (Tresiba, Novo Nordisk, Bagsværd, Denmark) of 0.95, with equivalence limits set between 0.80 and 1.25. Primary PK and PD parameters were log-transformed and analyzed via a linear mixed model including treatment, sequence, and period as fixed effects. Bioequivalence was confirmed if the 90% CIs for the least squares geometric mean (LS- geometric mean) ratio fell within 80~125% [7,8,9]. Time-related parameters were assessed using the Wilcoxon signed-rank test. Clamp quality was evaluated using the coefficient of variation of BG (CVBG) and mean absolute relative deviation (MARD) [24]. The intra-subject variability (intra-CV) was calculated using the following equation: i n t r a   C V % = ( e x p ( σ 2 ) 1 ) [18]. An F-test was used to compare the intra-CV between the two dose levels. Analyses were conducted using SPSS (v27.0), with statistical significance set at p < 0.05.

3. Results

3.1. Subject Disposition and Demographics

As illustrated in Figure 1, 52 participants were enrolled and equally distributed between Group A and Group B. All subjects completed the study. Table 1 confirms that there were no statistically significant differences between the groups regarding gender distribution (34.6% vs. 26.9% female, p = 0.764), age (26.5 ± 2.8 vs. 28.4 ± 6.1 years, p = 0.155), weight (60.5 ± 9.0 vs. 61.7 ± 9.0 kg, p = 0.618), height (166.7 ± 6.5 vs. 168.0 ± 8.8 cm, p = 0.526), or BMI (21.7 ± 2.0 vs. 21.8 ± 2.0 kg/m2, p = 0.811).

3.2. Euglycemic Clamp Quality Assessment

Table 2 indicates that baseline BG (Group A: 4.48 ± 0.27 vs. 4.44 ± 0.27 mmol/L; Group B: 4.65 ± 0.28 vs. 4.69 ± 0.32 mmol/L), target BG (Group A: 4.20 ± 0.27 vs. 4.16 ± 0.27 mmol/L; Group B: 4.37 ± 0.28 vs. 4.41 ± 0.32 mmol/L), and clamped BG levels (Group A: 4.22 ± 0.25 vs. 4.20 ± 0.25 mmol/L; Group B: 4.40 ± 0.27 vs. 4.42 ± 0.28 mmol/L) were comparable between the two formulations across both groups. In addition, the clamped BG levels were close to the target values. Similarly, comparable CVBG (Group A: 3.31 ± 0.71 vs. 3.61 ± 1.19; Group B: 3.15 ± 0.58 vs. 3.02 ± 0.61) and MARD (Group A: 2.77 ± 0.79 vs. 2.94 ± 0.80; Group B: 2.56 ± 0.51 vs. 2.51 ± 0.61) values were observed between the two drugs, with both measures remaining relatively low. Baseline C-peptide levels (Group A: 385 vs. 405 pmol/L; Group B: 380 vs. 364 pmol/L) were analogous between the two formulations across the groups, and a comparable reduction in C-peptide (Group A: 51.2% vs. 44.7%; Group B: 37.7% vs. 37.8%) was detected across treatments in both groups A and B. No significant increase in post-dose C-peptide (e.g., by a 0.5-fold increase from baseline) was observed.

3.3. PK/PD Parameters of IDeg at Two Dose Levels

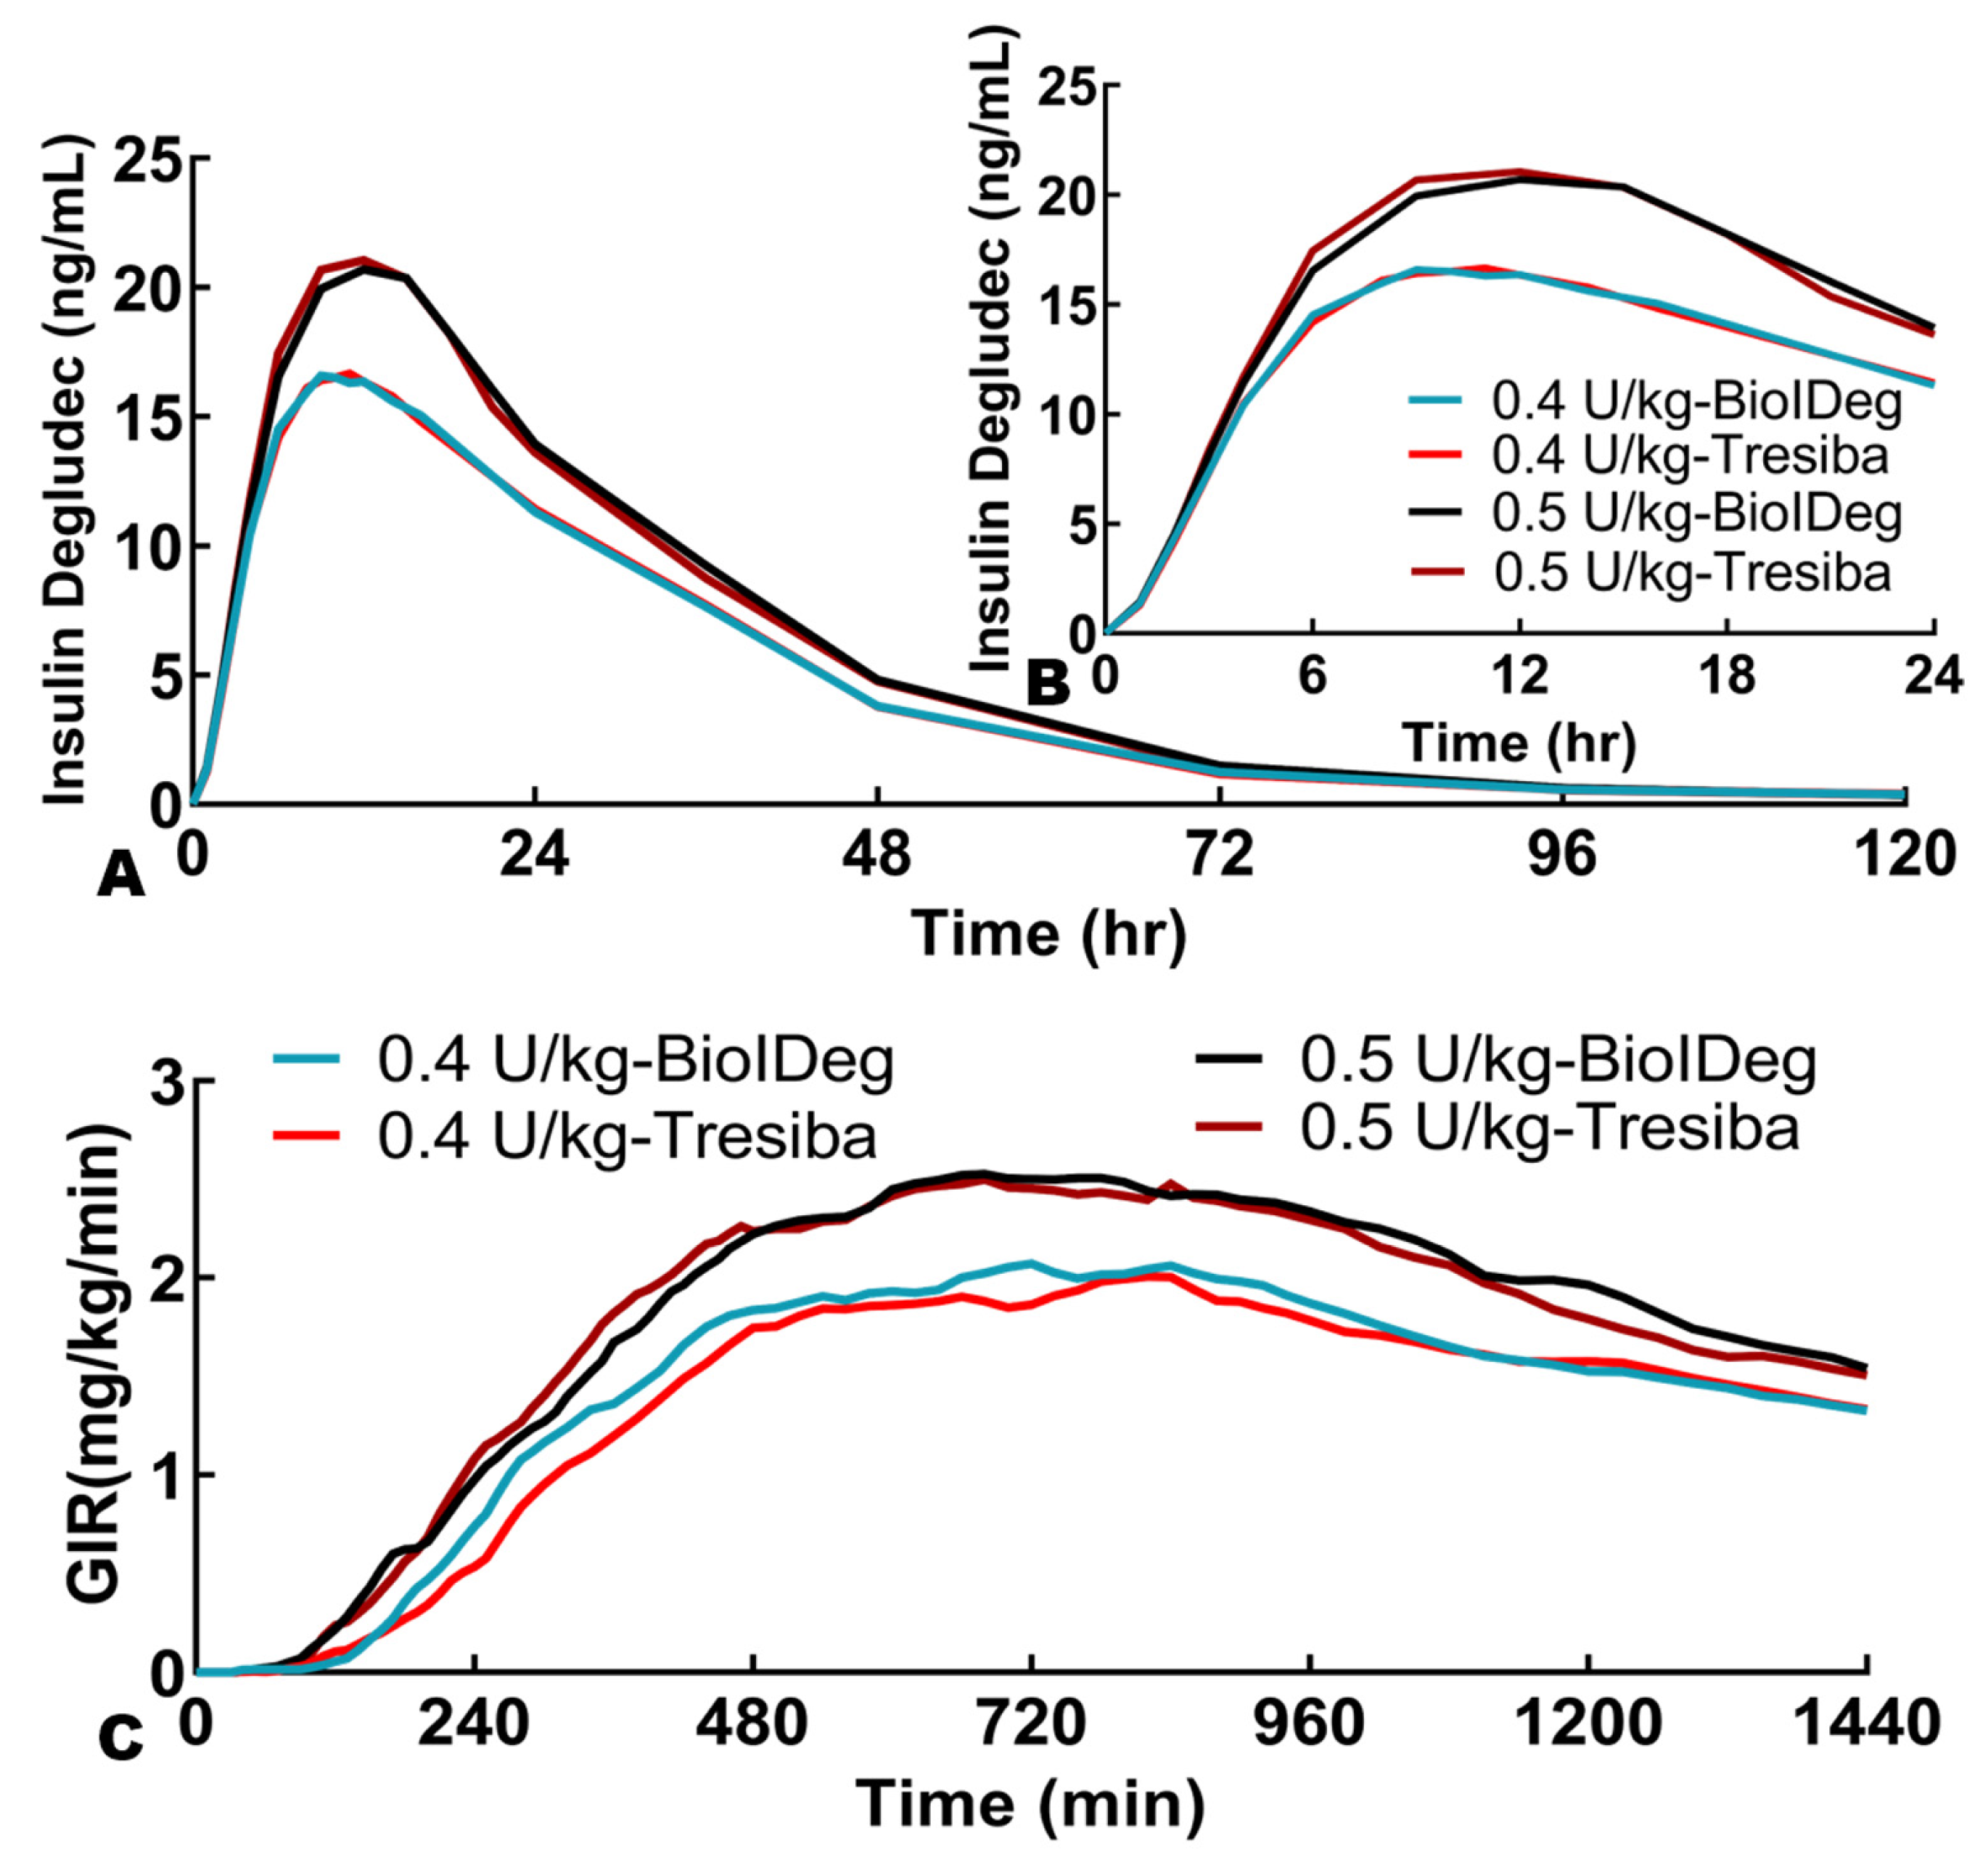
Figure 2A,B illustrate the PK profiles of IDeg. Following subcutaneous injection, both dose levels exhibited similar concentration-time curves across the two formulations. The LS-geometric mean ratios of BioIDeg to Tresiba for both primary and secondary PK endpoints were all close to 1, with a range of 0.981~1.003 (Table 3); moreover, the corresponding 90% CIs were entirely within the acceptable range of 0.80 to 1.25. No differences were detected in Tmax (group A: 11.0 vs. 11.0 h; group B: 11.6 vs. 11.5 h) and t1/2 (group A: 14.8 vs. 13.5 h; group B: 16.1 vs. 15.5 h).
Figure 2C shows similar GIR-time profiles for the two formulations at 0.4 U/kg and 0.5 U/kg doses. For AUCGIR 0–24h, the LS-geometric mean ratios of BioIDeg to Tresiba were near 1 at both doses, with 90% CIs within the 0.80~1.25 equivalence range. Regarding the secondary pharmacodynamic parameter AUCGIR,0–12h, the 90% CI of the LS-geometric mean ratio was 0.944~1.333 at 0.4 U/kg (outside the equivalence range) but 0.856~1.132 at 0.5 U/kg (meeting equivalence criteria). The 90% CIs of the LS-geometric mean ratio for other PD parameters (AUCGIR, 12–24h and GIRmax) were within acceptable limits. No significant differences in tGIRmax (group A: 820 vs. 830 min; group B: 740 vs. 685 min) were observed between formulations at the same dose.

3.4. Comparisons of Intra-CV of PK/PD Parameters

As detailed in Table 4, intra-CV for PK parameters was largely comparable between formulations, with the only statistically significant difference found in AUCIDeg,0–120h (p = 0.033). However, this absolute difference was clinically negligible (<5%). In contrast, PD parameters showed notable dose-dependent differences. The 0.4 U/kg dose was associated with significantly higher intra-CV for AUCGIR,0–24h (24.9% vs. 20.2%, p = 0.049) and AUCGIR,0–12h (37.6% vs. 27.6%, p = 0.005) compared to the 0.5 U/kg dose.
Based on the observed intra-CV for AUCGIR, 0–24h (24.9% for 0.4 U/kg vs. 20.2% for 0.5 U/kg), a retrospective power analysis indicates that to achieve >90% power, a study using the 0.4 U/kg dose would require approximately 32 subjects, whereas the 0.5 U/kg dose would only require 24 subjects.

4. Discussion

This study evaluated the PK/PD similarity between a biosimilar IDeg formulation and its reference product in healthy Chinese participants, specifically focusing on the impact of dose selection (0.4 vs. 0.5 U/kg) on bioequivalence and intra-subject variability. The euglycemic clamp technique, recognized as the gold standard for PK/PD evaluation of insulin products [25], relies on high-quality performance to provide accurate estimates. The quality was confirmed by a mean CVBG below 5% and mean MARD under 3%, alongside sustained C-peptide suppression, ensuring reliable data for PK/PD assessment.
Insulin biosimilars play a vital role in improving patient access to cost-effective treatment options [4,5,6]. Local regulations require Phase I euglycemic clamp studies, with the EMA guidelines recommending a dosage range of 0.4~0.6 U/kg for long-acting insulin preparations [9]. The 90% CIs for the LS-geometric mean ratios for primary PK/PD endpoints were within the equivalence range of 0.80~1.25 at doses of 0.4 U/kg and 0.5 U/kg, demonstrating PK/PD similarity at both dose levels. Specifically, the 0.4 U/kg dose failed to demonstrate equivalence for AUCGIR,0–12h, whereas the 0.5 U/kg dose succeeded. Although no significant discrepancies were observed in bioequivalence evaluations between the two doses, a higher dose may enhance the likelihood of meeting equivalence criteria for secondary PD parameters. The upward trends in IDeg and GIR profiles at doses of 0.5 U/kg compared with those of 0.4 U/kg aligned with previous literature [26,27], though a shorter half-life (t1/2) was noted compared with previously reported values of 24~25 h [27,28], likely due to the single-dose design of this study. In the present work, Cmax,IDeg, Tmax, and t1/2 are used to characterize the PK profiles; however, these may not fully represent the terminal phase due to the ‘flip-flop phenomenon’. Flip-flop pharmacokinetics, common with extravascular drug administration, arises when absorption is slower than elimination. Overlooking this phenomenon can hinder the precise measurement and reliable interpretation of key PK parameters, such as underestimating the true elimination half-life and misclassifying drug disposition traits [29]. Given the scarcity of comprehensive intravenous (I.V.) PK data for IDeg, which directly reveals systemic elimination without absorption interference, IDeg’s subcutaneous PK profiles should be interpreted cautiously.
Intra-CV for most PK parameters was comparable, with statistical significance observed only in AUCIDeg,0–120h, considered clinically irrelevant due to its negligible impact on sample size estimation. Nonetheless, there was a notable increase in intra-CV for AUCGIR,0–24h, and AUCGIR,0–12h in group A. Dose-dependent increases by 20%~50% were observed in AUCGIR,0–12h, AUCGIR,0–24h, AUCGIR,12–24h, and GIRmax at 0.5 U/kg dose compared to 0.4 U/kg dose, highlighting the dose’s influence on PD response parameters. Our observation that the lower dose failed to demonstrate equivalence for a secondary endpoint (AUCGIR,0–12h) underscores the concept that variability acts as a limiting factor, as previously reviewed by Vora and Heise [30]. The primary factors influencing variability in PD parameters include insulin absorption and metabolism in vivo, as well as insulin sensitivity [30,31]. This study observed a 19% reduction in the intra-CV of AUCGIR,0–24h when switching IDeg dose from 0.4 U/kg to 0.5 U/kg, with comparable intra-CVs in AUCIDeg,0–24h (7.8% vs. 8.0%). The observed reduction in intra-CV at the 0.5 U/kg dose can be rationalized by the insulin dose–GIR response principle. Similar to the formula, C V = σ μ , a smaller mean GIR response (μ) results in a larger CV for a given standard deviation of error. This phenomenon aligns with that lower insulin doses may elicit a diminished GIR response, magnifying the PD variability [12], and our findings align with this expectation as demonstrated by our data (intra-CV of AUCGIR,0–24h: 24.9% vs. 20.2%, p = 0.049). Among the PK/PD parameters, the highest variability was noted in AUC0–12h. After subcutaneous administration, IDeg dissolves into the bloodstream gradually, with absorption rates varying most across subjects during the initial 12 h. This variability in IDeg absorption was amplified by the differences in GIR response, especially at lower doses.
This single-dose euglycemic clamp study suggests that IDeg’s early absorption kinetics (0~12 h post-dose) may show dose dependence, with lower variability at higher doses (AUCIDeg,0–12h: 11.9% vs. 9.8%, p = 0.066), though not statistically significant—aligning with Haahr and Heise [28]. Beyond 12 h, IDeg levels stabilize, resulting in consistent PK/PD profiles, as indicated by the reduced intra-CV of AUCIDeg,12–24h and AUCGIR,12–24h. These results imply higher insulin doses could decrease early-phase PD variability and improve the feasibility of bioequivalence assessments through single-dose euglycemic clamp studies.
While both doses showed bioequivalence for the primary endpoint, choosing the 0.5 U/kg dose has broader implications. To ensure over 90% power for detecting bioequivalence, sample size correlates with the square of the intra-CV. With AUCGIR,0–24h intra-CV values of 24.9% (0.4 U/kg) versus 20.2% (0.5 U/kg), retrospective power analysis indicates a 0.4 U/kg study would need roughly 30% more participants to match the 0.5 U/kg dose’s statistical power. This increases operational complexity, costs, and participant burden. Thus, selecting 0.5 U/kg is not just a minor enhancement but a strategic optimization improving economic efficiency.
This study has several limitations: (1) Sample size calculations used an assumed maximum intra-CV of 20.5%, but the observed maximum intra-CV for the primary PD parameter was 24.9%; a larger sample size would improve statistical power. (2) Only two dose levels were tested; future research should assess additional doses (e.g., 0.6 U/kg). (3) Results apply only to euglycemic clamps with a single dose. For steady-state euglycemic clamps, we hypothesize that dosage selection does not significantly affect intra-CV of PK/PD parameters due to stable insulin levels under those conditions; this requires verification in future studies. (4) The study involved only healthy Chinese volunteers, despite IDeg being mainly prescribed to individuals with diabetes. Research shows type 1 diabetes duration does not significantly affect IDeg’s PK [32]. Thus, PK profiles in healthy volunteers may reflect those in the diabetic population, as the drug maintains consistent release irrespective of underlying metabolic or tissue pathology. However, recent clamp studies show BMI and adiposity correlate negatively with GIR [33,34], suggesting that healthy volunteer data may overestimate the glucose-lowering potency in obese type 2 diabetics or type 1 diabetics with insulin resistance. Some results may not apply to diabetic patients.

5. Conclusions

In conclusion, our study provides empirical evidence that a higher single dose is optimal for euglycemic clamp studies assessing basal insulin analogs in healthy Chinese subjects. Compared with 0.4 U/kg, the 0.5 U/kg dose not only ensures bioequivalence but also significantly reduces intra-subject pharmacodynamic variability. This finding has direct implications for the design of future bioequivalence trials, suggesting that adopting a relatively higher dose within the EMA-recommended range can enhance the robustness of PD assessments and increase the likelihood of trial success.

Author Contributions

Conceptualization, H.L. and Y.Y.; methodology, H.L.; validation, H.L., H.T. and J.L.; formal analysis, H.L.; investigation, H.L., T.L., X.C., H.Y. and Y.M.; data curation, H.L. and T.L.; writing—original draft preparation, H.L.; writing—review and editing, Y.Y.; visualization, Y.Y.; supervision, Y.Y. All authors have read and agreed to the published version of the manuscript.

Funding

This study is funded by “Qimingxing” Research Fund for Young Talents (No.HXQMX0153). The data in the present study were collected from two clinical trials (registry number: CTR20192122 & CTR20211914).

Institutional Review Board Statement

This study was conducted in accordance with the principles of the Declaration of Helsinki and Good Clinical Practice. The protocol was approved by the Ethics Committee of the West China Hospital of Sichuan University (Chengdu, China). The date of the trial (CTR20192122) ethical approval was 8 September 2019, with the code of No. 161 in 2019. The date of the trial (CTR20211914) ethical approval was 10 June 2021, with the code of No. 141 in 2021. Written informed consent from all participants was obtained before this study.

Informed Consent Statement

Informed consent was obtained from all subjects involved in the study.

Data Availability Statement

The data presented in this study are available on request from the corresponding author.

Acknowledgments

The authors would like to thank all the participants in this study.

Conflicts of Interest

The authors declare no conflicts of interest.

References

  1. Schultz, K. The Global Diabetes Care Market; Novo Nordisk: Bagsværd, Denmark, 2011. [Google Scholar]
  2. Beran, D.; Ewen, M.; Laing, R. Constraints and challenges in access to insulin: A global perspective. Lancet Diabetes Endocrinol. 2016, 4, 275–285. [Google Scholar] [CrossRef] [Scilit]
  3. Beran, D.; Lazo-Porras, M.; Mba, C.M.; Mbanya, J.C. A global perspective on the issue of access to insulin. Diabetologia 2021, 64, 954–962. [Google Scholar] [CrossRef] [Scilit]
  4. Nagel, K.E.; Ramachandran, R.; Lipska, K.J. Lessons From Insulin: Policy Prescriptions for Affordable Diabetes and Obesity Medications. Diabetes Care 2024, 47, 1246–1256. [Google Scholar] [CrossRef] [Scilit]
  5. Heinemann, L.; Davies, M.; Home, P.; Forst, T.; Vilsbøll, T.; Schnell, O. Understanding Biosimilar Insulins—Development, Manufacturing, and Clinical Trials. J. Diabetes Sci. Technol. 2023, 17, 1649–1661. [Google Scholar] [CrossRef] [Scilit]
  6. Luukkanen, S.V.; Tolonen, H.M.; Airaksinen, M.; Saarukka, L.S.M. The Price and Market Share Evolution of the Original Biologics and Their Biosimilars in Finland. BioDrugs 2022, 36, 537–547. [Google Scholar] [CrossRef] [Scilit]
  7. Food and Drug Administration. Bioavailability and Bioequivalence Studies Submitted in NDAs or INDs—General Considerations. March 2014. Available online: https://www.fda.gov/regulatory-information/search-fda-guidance-documents/bioavailability-and-bioequivalence-studies-submitted-ndas-or-inds-general-considerations (accessed on 27 January 2021).
  8. Food and Drug Administration; Center for Drug Evaluation and Research. The Future of Insulin Biosimilars: Increasing Access and Facilitating the Efficient Development of Biosimilar and Interchangeable Insulin Products. 2019. Available online: https://www.fda.gov/media/124409/download (accessed on 27 January 2021).
  9. European Medicines Agency. Non-Clinical and Clinical Development of Similar Biological Medicinal Products Containing Recombinant Human Insulin and Insulin Analogues—Scientific Guideline. Available online: https://www.ema.europa.eu/en/non-clinical-clinical-development-similar-biological-medicinal-products-containing-recombinant-human-insulin-insulin-analogues-scientific-guideline (accessed on 27 January 2021).
  10. Woodworth, J.R.; Howey, D.C.; Bowsher, R.R.; Brunelle, R.L. Relating glucose clamp profiles to reduction of blood glucose after insulin administration. Diabetes Technol. Ther. 2004, 6, 147–153. [Google Scholar] [CrossRef] [Scilit]
  11. Sinha, V.P.; Choi, S.L.; Soon, D.K.; Mace, K.F.; Yeo, K.P.; Lim, S.T.; Howey, D.C. Single-dose pharmacokinetics and glucodynamics of the novel, long-acting basal insulin LY2605541 in healthy subjects. J. Clin. Pharmacol. 2014, 54, 792–799. [Google Scholar] [CrossRef] [Scilit]
  12. Heise, T.; Zijlstra, E.; Nosek, L.; Heckermann, S.; Plum-Mörschel, L.; Forst, T. Euglycaemic glucose clamp: What it can and cannot do, and how to do it. Diabetes Obes. Metab. 2016, 18, 962–972. [Google Scholar] [CrossRef] [Scilit]
  13. Lepore, M.; Pampanelli, S.; Fanelli, C.; Porcellati, F.; Bartocci, L.; Di Vincenzo, A.; Cordoni, C.; Costa, E.; Brunetti, P.; Bolli, G.B. Pharmacokinetics and pharmacodynamics of subcutaneous injection of long-acting human insulin analog glargine, NPH insulin, and ultralente human insulin and continuous subcutaneous infusion of insulin lispro. Diabetes 2000, 49, 2142–2148. [Google Scholar] [CrossRef] [Scilit]
  14. Porcellati, F.; Rossetti, P.; Ricci, N.B.; Pampanelli, S.; Torlone, E.; Campos, S.H.; Andreoli, A.M.; Bolli, G.B.; Fanelli, C.G. Pharmacokinetics and pharmacodynamics of the long-acting insulin analog glargine after 1 week of use compared with its first administration in subjects with type 1 diabetes. Diabetes Care 2007, 30, 1261–1263. [Google Scholar] [CrossRef] [Scilit]
  15. Li, T.; Liu, H.; Yu, H.; Qiao, J.; Sun, L.; Yu, Y. Interindividual Variability in the Pharmacodynamic and Pharmacokinetic Characteristics of Recombinant Human Insulin and Insulin Aspart. Clin. Ther. 2021, 43, 594–601.e1. [Google Scholar] [CrossRef] [Scilit]
  16. Tone, A.; Iseda, I.; Higuchi, C.; Tsukamoto, K.; Katayama, A.; Matsushita, Y.; Hida, K.; Wada, J.; Shikata, K. Comparison of insulin detemir and insulin glargine on glycemic variability in patients with type 1 and type 2 diabetes. Exp. Clin. Endocrinol. Diabetes 2010, 118, 320–324. [Google Scholar] [CrossRef] [Scilit]
  17. Heinemann, L.; Weyer, C.; Rauhaus, M.; Heinrichs, S.; Heise, T. Variability of the metabolic effect of soluble insulin and the rapid-acting insulin analog insulin aspart. Diabetes Care 1998, 21, 1910–1914. [Google Scholar] [CrossRef] [Scilit]
  18. Scholtz, H.E.; Pretorius, S.G.; Wessels, D.H.; Becker, R.H. Pharmacokinetic and glucodynamic variability: Assessment of insulin glargine, NPH insulin and insulin ultralente in healthy volunteers using a euglycaemic clamp technique. Diabetologia 2005, 48, 1988–1995. [Google Scholar] [CrossRef] [Scilit]
  19. Heise, T.; Hermanski, L.; Nosek, L.; Feldman, A.; Rasmussen, S.; Haahr, H. Insulin degludec: Four times lower pharmacodynamic variability than insulin glargine under steady-state conditions in type 1 diabetes. Diabetes Obes. Metab. 2012, 14, 859–864. [Google Scholar] [CrossRef] [Scilit]
  20. Jansen, M.S.; Groenwold, R.H.H.; Dekkers, O.M. The power of sample size calculations. Eur. J. Endocrinol. 2024, 191, E5–E9. [Google Scholar] [CrossRef] [Scilit]
  21. Eng, J. Sample size estimation: How many individuals should be studied? Radiology 2003, 227, 309–313. [Google Scholar] [CrossRef] [Scilit]
  22. Liu, H.; Yu, H.; Sun, L.; Qiao, J.; Li, J.; Tan, H.; Yu, Y. Effects of Unsuppressed Endogenous Insulin on Pharmacokinetics and/or Pharmacodynamics of Study Insulin in the Healthy: A Retrospective Study. Clin. Pharmacol. Drug Dev. 2022, 11, 930–937. [Google Scholar] [CrossRef] [Scilit]
  23. Liu, H.; Li, T.; Yu, H.; Chen, X.; Li, J.; Tan, H.; Jia, D.; Yu, Y. A phase-I randomized euglycemic clamp study to demonstrate the pharmacokinetic and pharmacodynamic equivalence of an insulin degludec biosimilar (B01411) with the reference product in healthy Chinese volunteers. Expert Opin. Investig. Drugs 2023, 32, 773–781. [Google Scholar] [CrossRef] [Scilit]
  24. Benesch, C.; Heise, T.; Klein, O.; Heinemann, L.; Arnolds, S. How to Assess the Quality of Glucose Clamps? Evaluation of Clamps Performed with ClampArt, a Novel Automated Clamp Device. J. Diabetes Sci. Technol. 2015, 9, 792–800. [Google Scholar] [CrossRef] [Scilit]
  25. Bequette, B.W. Glucose clamp algorithms and insulin time-action profiles. J. Diabetes Sci. Technol. 2009, 3, 1005–1013. [Google Scholar] [CrossRef] [Scilit]
  26. Owens, D.; Bailey, T.S.; Fanelli, C.G.; Yale, J.F.; Bolli, G.B. Clinical relevance of pharmacokinetic and pharmacodynamic profiles of insulin degludec (100, 200 U/mL) and insulin glargine (100, 300 U/mL)—A review of evidence and clinical interpretation. Diabetes Metab. 2019, 45, 330–340. [Google Scholar] [CrossRef] [Scilit]
  27. Heise, T.; Hövelmann, U.; Nosek, L.; Hermanski, L.; Bøttcher, S.G.; Haahr, H. Comparison of the pharmacokinetic and pharmacodynamic profiles of insulin degludec and insulin glargine. Expert Opin. Drug Metab. Toxicol. 2015, 11, 1193–1201. [Google Scholar] [CrossRef] [Scilit]
  28. Haahr, H.; Heise, T. A review of the pharmacological properties of insulin degludec and their clinical relevance. Clin. Pharmacokinet. 2014, 53, 787–800. [Google Scholar] [CrossRef] [Scilit]
  29. Yáñez, J.A.; Remsberg, C.M.; Sayre, C.L.; Forrest, M.L.; Davies, N.M. Flip-flop pharmacokinetics--delivering a reversal of disposition: Challenges and opportunities during drug development. Ther. Deliv. 2011, 2, 643–672. [Google Scholar] [CrossRef] [Scilit]
  30. Vora, J.; Heise, T. Variability of glucose-lowering effect as a limiting factor in optimizing basal insulin therapy: A review. Diabetes Obes. Metab. 2013, 15, 701–712. [Google Scholar] [CrossRef] [Scilit]
  31. Galloway, J.A.; Spradlin, C.T.; Nelson, R.L.; Wentworth, S.M.; Davidson, J.A.; Swarner, J.L. Factors influencing the absorption, serum insulin concentration, and blood glucose responses after injections of regular insulin and various insulin mixtures. Diabetes Care 1981, 43, 366–376. [Google Scholar] [CrossRef] [Scilit]
  32. Korsatko, S.; Deller, S.; Mader, J.K.; Glettler, K.; Koehler, G.; Treiber, G.; Urschitz, M.; Wolf, M.; Hastrup, H.; Søndergaard, F.; et al. Ultra-long pharmacokinetic properties of insulin degludec are comparable in elderly subjects and younger adults with type 1 diabetes mellitus. Drugs Aging 2014, 31, 47–53. [Google Scholar] [CrossRef] [Scilit]
  33. Li, T.; Liu, H.; Li, S.; Yu, H.; Li, J.; Tan, H.; Yu, Y. The Effect of BMI on Pharmacokinetic and Pharmacodynamic Parameters of Insulin Degludec: Results from an Euglycemic Glucose Clamp Study. Clin. Pharmacokinet. 2023, 62, 449–456. [Google Scholar] [CrossRef] [Scilit]
  34. Su, R.; Wan, L.; Tao, Y.; Zhu, M.; Pu, J.; Li, Z.; Chen, Y.; Tang, C. Study on bioequivalence and influence of obesity-related indicators on pharmacokinetics and pharmacodynamics for insulin degludec in healthy subjects. Sci. Rep. 2024, 14, 24687. [Google Scholar] [CrossRef] [Scilit]
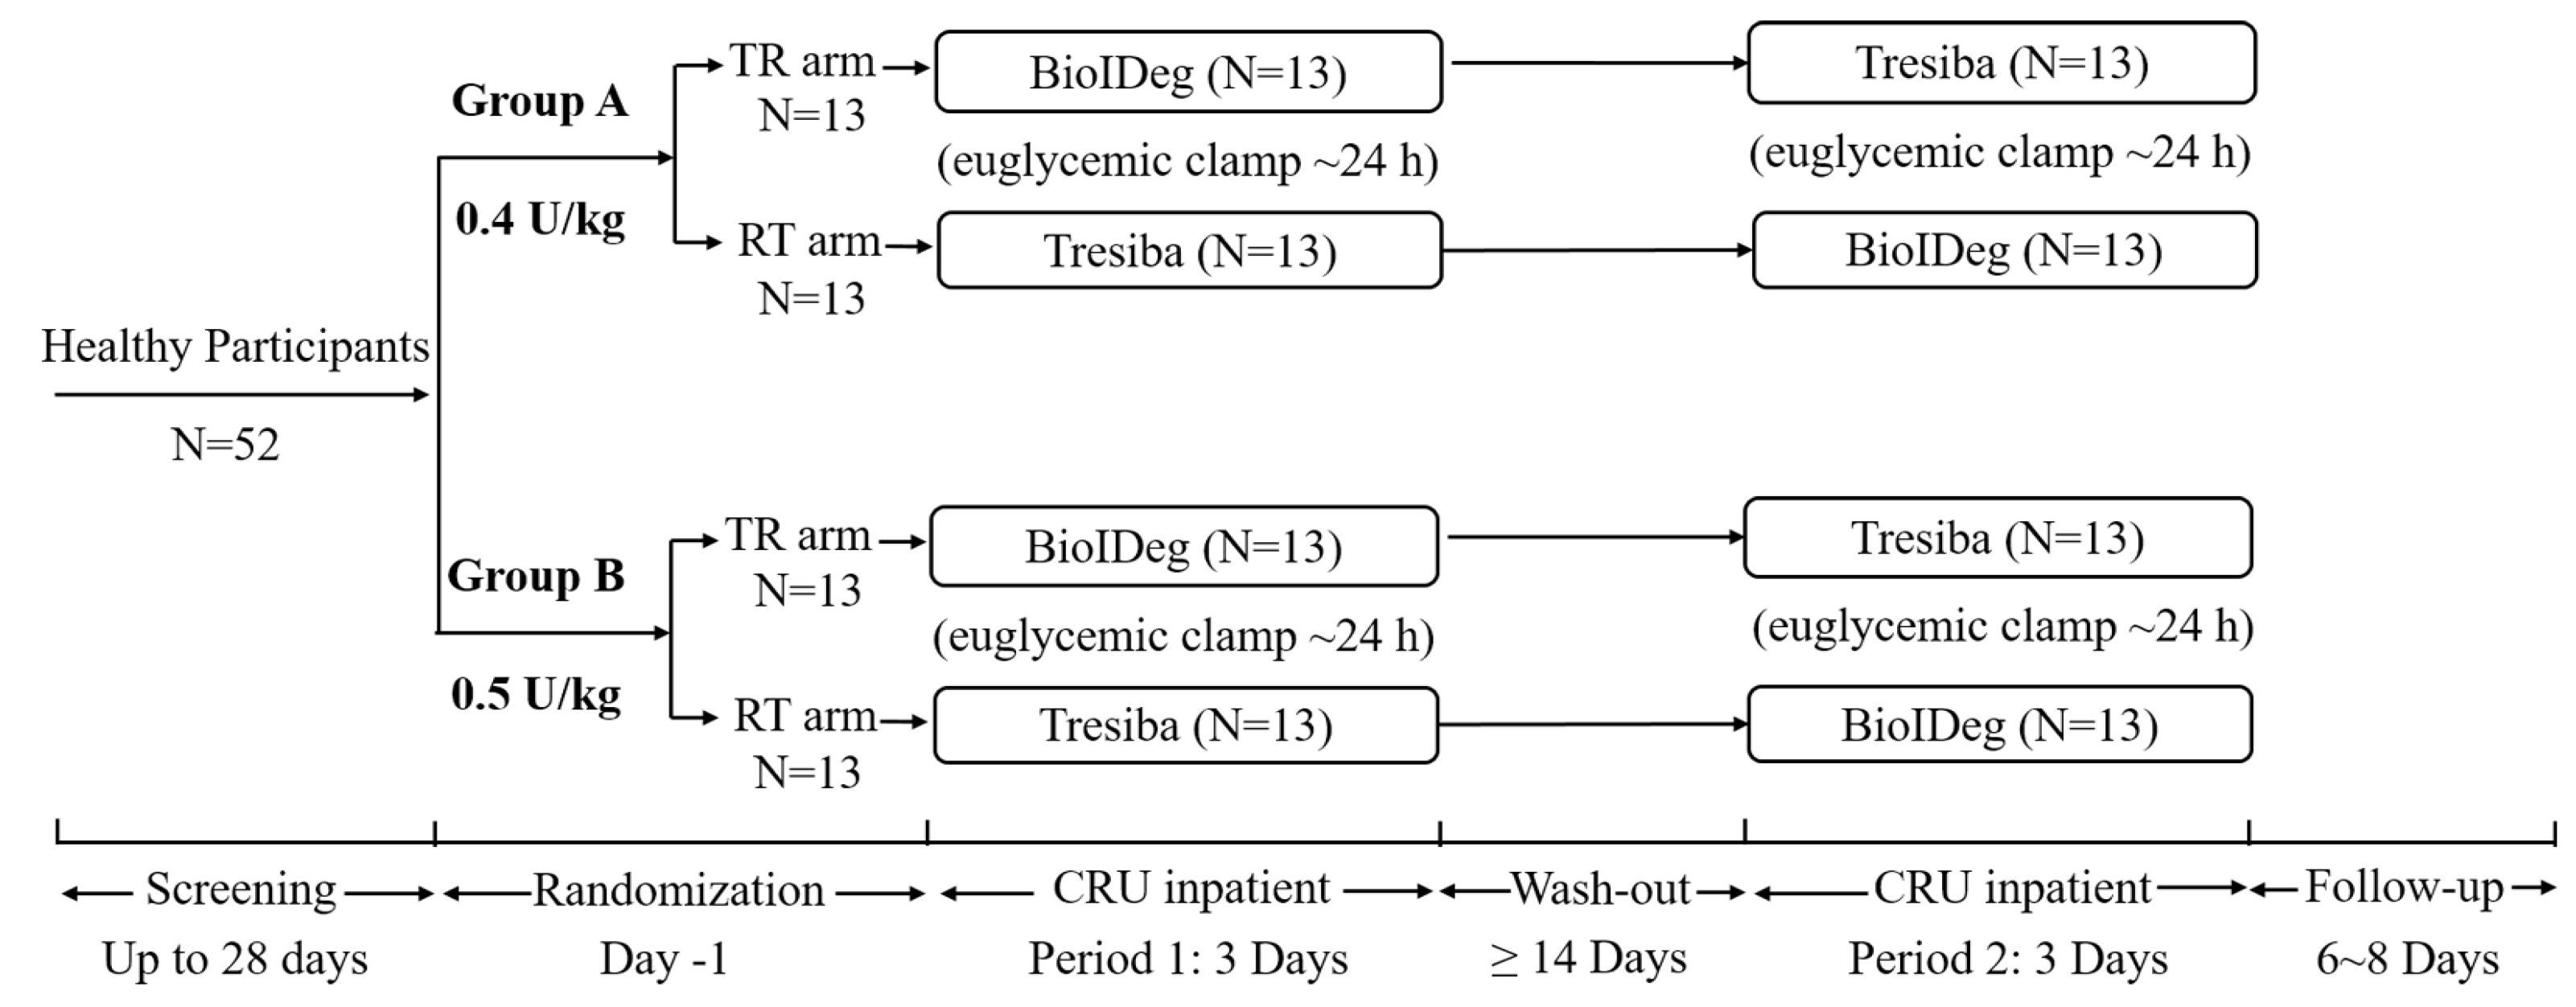
Figure 1. Study design/BioIDeg: biosimilar insulin degludec; CRU: clinical research unit.
Pharmaceutics 18 01051 g001
Figure 2. Time profiles of mean values of insulin degludec (IDeg) concentrations of two formulations at two dose levels (0.4 and 0.5 U/kg) from 0 to 120 h (A), and 0 to 24 h (B). Time profiles of mean values of glucose infusion rate (GIR) of two formulations at two dose levels (0.4 and 0.5 U/kg) from 0 to 24 h (C).
Pharmaceutics 18 01051 g002
Table 1. Subject disposition and demographic information of groups A and B.
Group A (0.4 U/kg)Group B (0.5 U/kg)p
Number (n, female proportion)26, 34.6%26, 26.9%0.764
Age (year) a26.5 ± 2.828.4 ± 6.10.155
Weight (kg) a60.5 ± 9.061.7 ± 9.00.618
Height (cm) a166.7 ± 6.5168.0 ± 8.80.526
BMI (kg/m2) a21.7 ± 2.021.8 ± 2.00.811
TR treatment arm (n, %)13, 50%13, 50%1.000
a Mean ± standard deviation. BMI: body mass index.
Table 2. Clamp information of groups A and B.
Group A (0.4 U/kg)Group B (0.5 U/kg)
BioIDegTresibapBioIDegTresibap
Basal BG (mmol/L) a4.48 ± 0.274.44 ± 0.270.5834.65 ± 0.284.69 ± 0.320.634
Target BG (mmol/L) a4.20 ± 0.274.16 ± 0.270.5864.37 ± 0.284.41 ± 0.320.634
‘Clamped’ BG (mmol/L) a4.22 ± 0.254.20 ± 0.250.6924.40 ± 0.274.42 ± 0.280.739
CVBG (%) a3.31 ± 0.713.61 ± 1.190.2773.15 ± 0.583.02 ± 0.610.750
MARD (%) a2.77 ± 0.792.94 ± 0.800.4402.56 ± 0.512.51 ± 0.610.405
Basal C-peptide (pmol/L) b385 (134)405 (131)0.953380 (260)364 (216)0.831
Post-dose C-peptide (pmol/L) b187 (118)194 (80)0.552204 (157)219 (209)0.761
C-peptide reduction (%) b51.2 (18.7)44.7 (17.1)0.21137.7 (20.9)37.8 (15.8)0.959
a Mean ± standard deviation; b median (interquartile range). BG, blood glucose; CVBG, coefficient of variation of BG; MARD, mean absolute relative deviation from target; BioIDeg, Biosimilar insulin degludec.
Table 3. Pharmacokinetic and pharmacodynamic parameters following a single dose of 0.4 (group A) or 0.5 U/kg (group B) of insulin degludec.
Group A (Geometric Mean with CV) (0.4 U/kg)Group B (Geometric Mean with CV) (0.5 U/kg)
BioIDegTresibaLS-Mean Ratio (90% CI)BioIDegTresibaLS-Mean Ratio (90% CI)
AUCIDeg,0–24h (ng/mL × h)301 (21.4%)303 (16.0%)0.993 (0.956, 1.031)372 (19.4%)377 (17.4%)0.988 (0.953, 1.024)
AUCIDeg,0–12h (ng/mL × h)134 (31.0%)135 (28.6%)0.994 (0.940, 1.051)159 (24.2%)164 (25.2%)0.969 (0.926, 1.014)
AUCIDeg,12–24h (ng/mL × h)165 (19.2%)166 (13.1%)0.993 (0.958, 1.030)212 (18.2%)211 (15.5%)1.006 (0.969, 1.044)
AUCIDeg,0–120h (ng/mL × h)564 (19.4%)562 (18.2%)1.003 (0.986, 1.021)710 (12.0%)700 (11.2%)1.013 (0.992, 1.035)
CIDeg,max (ng/mL)17.1 (25.8%)17.5 (22.5%)0.981 (0.940, 1.023)21.3 (20.6%)21.8 (18.1%)0.979 (0.936, 1.024)
Tmax (h)11.0 (26.3%) a11.0 (22.5%) a0.00 (−1.00, 2.00) b11.6 (24.2%)11.5 (33.2%)0.00 (0.00, 0.00) b
t1/2 (h)14.8 (24.8%) a13.5 (25.5%) a0.43 (−2.25, 3.51) b16.1 (22.1%)15.5 (26.9%)1.28 (−2.37, 2.20) b
AUCGIR,0–24h (mg/kg)1927 (41.2%)1843 (40.0%)1.046 (0.931, 1.175)2443 (31.8%)2393 (33.1%)1.021 (0.924, 1.128)
AUCGIR,0–12h (mg/kg)734.4 (63.2%)654.7 (59.2%)1.122 (0.944, 1.333)971 (39.0%)986 (39.6%)0.985 (0.856, 1.132)
AUCGIR,12–24h (mg/kg)1173 (29.7%)1158 (30.6%)1.012 (0.919, 1.115)1448 (30.2%)1392 (30.5%)1.040 (0.952, 1.137)
GIRmax (mg/kg/min)2.13 (48.2%)2.07 (44.7%)1.026 (0.927, 1.135)2.75 (30.8%)2.66 (38.2%)1.034 (0.932, 1.146)
tGIRmax (min)820 (22.9%) a830 (48.2%) a17.5 (0.0, 80.0) b740 (33.2%)685 (24.5%)120 (−80.0, 180) b
a Median (CV); b The difference between the medians with the 95% CI; AUC, area under curve; GIR, glucose infusion rate; BioIDeg, biosimilar insulin degludec; LS-mean, least square mean; CI, confidence interval.
Table 4. The intra-subject CV of pharmacokinetic and pharmacodynamic parameters.
Group A (0.4 U/kg)Group B (0.5 U/kg)p
AUCIDeg,0–24h (ng/mL × h)8.0%7.8%0.791
AUCIDeg,0–12h (ng/mL × h)11.9%9.8%0.066
AUCIDeg,12–24h (ng/mL × h)7.7%8.0%0.684
AUCIDeg,0–120h (ng/mL × h)3.6%4.5%0.033
CIDeg,max (ng/mL)9.0%9.6%0.492
AUCGIR,0–24h (mg/kg)24.9%20.2%0.049
AUCGIR,0–12h (mg/kg)37.6%27.6%0.005
AUCGIR,12–24h (mg/kg)20.6%18.7%0.355
GIRmax (mg/kg/min)21.6%21.4%0.916
AUC, area under the curve; IDeg, insulin degludec; GIR, glucose infusion rate. Participants in Group A received 0.4 U/kg of IDeg, while those in Group B received 0.5 U/kg.
Disclaimer/Publisher’s Note: The statements, opinions and data contained in all publications are solely those of the individual author(s) and contributor(s) and not of MDPI and/or the editor(s). MDPI and/or the editor(s) disclaim responsibility for any injury to people or property resulting from any ideas, methods, instructions or products referred to in the content.