1. Introduction
Hydroxyurea (HU), also known as hydroxycarbamide, has been used for around 30 years in sickle cell disease (SCD), with proven long-term efficacy and a verified safety record [
1]. In SCD, it prevents recurrent, painful vaso-occlusive crises and has been indicated in Europe since 2007 for patients aged ≥2 years old [
2]. HU primarily induces fetal hemoglobin (HbF) production, which is normally prominent in fetal life but declines postnatally, with HbF (two α/two γ chains) improving oxygen affinity and red blood cell plasticity, thereby reducing vaso-occlusive crises, transfusion/hospitalization needs, and morbidity–mortality in SCD [
3,
4,
5].
The initial dose recommended by the Food and Drug Administration (FDA) and the European Medicines Agency (EMA) is 15 mg/kg/day orally once daily, administered in the morning under fasting conditions, with regular hematological monitoring for toxicity. Dose escalation by 2.5–5 mg/kg/day every 3 months targets the maximum tolerated dose (MTD), which is between 14.2 and 35.5 mg/kg/day across patients, reflecting marked interindividual variability (IIV) driven by pharmacokinetic (PK) differences [
6,
7,
8]. HU shows approximately 100% oral bioavailability, with a maximum plasma concentration (C
max) of approximately 25 mg/L and a time to reach the C
max (T
max) of approximately 1 h in adults. The drug displays wide tissue distribution, including blood–brain barrier penetration, and two well-described pediatric absorption phenotypes (rapid absorbers: T
max 15–30 min, C
max ~40 mg/L; slow absorbers: T
max 60–120 min, C
max ~20 mg/L) [
9,
10,
11,
12]. Despite these characteristics, interindividual exposure varies 5-fold in adults and 2–3-fold in children, prolonging dose escalation periods of 6–12 months, delaying benefits, and hindering adherence [
11,
13].
The pharmacodynamic (PD) response to HU is routinely monitored through a panel of hematological biomarkers. The HbF percentage reflects the degree of HbF induction and is the primary efficacy endpoint in most clinical trials [
3,
7]. The mean corpuscular volume (MCV) is a sensitive and early marker of HU activity, as erythroid progenitors exposed to HU produce larger red blood cells; it is therefore commonly used as a surrogate of HU-mediated erythropoiesis [
14]. The absolute reticulocyte count decreases under HU treatment as a result of myelosuppression and reduced ineffective erythropoiesis, reflecting both drug activity and tolerance [
3,
7]. The absolute neutrophil count is the primary safety marker used to define the MTD, as excessive neutropenia is the main dose-limiting toxicity of HU [
7,
14,
15]. Together, these biomarkers provide a comprehensive picture of HU efficacy and tolerability, yet their relationship with individual PK parameters, particularly the absorption phenotype, remains incompletely characterized in pediatric populations. Addressing this knowledge gap is critical to optimizing HU dosing strategies and reducing the time to MTD attainment in this vulnerable population.
This study aimed to establish a population PK model in SCD patients on HU, quantifying parameter variability and identifying key covariates. The kinetic profile emerged as a major covariate explaining both PK parameter variability and hematological PD endpoints related to HU compliance and MTD attainment.
2. Materials and Methods
2.1. OPTIMDREP Clinical Trial
Data were obtained from the prospective OPTIMDREP clinical trial (NCT06464458). Study information and a flow chart are available in the
Supplementary Materials [
16]. All patients or parents/guardians provided written informed consent before enrolment in this study. The study OPTIMDREP was designed to identify the most effective approach to reduce the time to reach the MTD of HU (Nazon et al., submitted) (
Supplementary Table S1). Briefly, patients were randomized into two arms: arm A (control), in which dose adjustment was based on standard hematological monitoring, and arm B (experimental), in which dosing was guided by first-dose AUC measurement alongside hematological tolerance assessment, with the primary objective of reducing the time to reach the therapeutic MTD. In this study, the MTD was defined as neutrophil counts between 1.5 and 3.0 G/L and reticulocyte counts between 100 and 200 G/L at two consecutive visits under steady-state HU dosing [
8,
17]. Eligible patients were 2 to 35 years of age requiring therapeutic intensification for SCD or patients with poorly controlled HU treatment, defined as failure to reach the MTD. Arm A (control) consisted of a dose increase by 5 mg/kg/day every 3 months based on standard hematological monitoring, up to a maximum of 35 mg/kg/day. In arm B (experimental), an individualized PK-guided approach was applied: the individual area under the curve (AUC) measured at the first visit (V0) was used to estimate the dose expected to achieve the MTD based on the target AUC of 115 h.mg/L. The AUC target used for PK-guided dosing was derived from Dong et al., who established this threshold in a pediatric SCD population (median age: 8.8 years, range: 1.2–16.6 years) [
6]. Dose adjustment was performed at visit 1 (V1, month 3). From V1 to visit 4 (V4), the two-hour post-dose concentration (C
2H) was monitored but only hematological parameters were used to guide ongoing dose adjustments and assess tolerance. A second full AUC measurement was performed at visit 5 (V5).
Demographic information and standard laboratory parameters were collected at each visit from V0 to V5.
2.2. Blood Sampling
To obtain informative data, seven sampling times were prescribed at V0 and V5: before taking HU, and then 10 and 20 min and 1, 2, 4, and 6 h after taking the medication. From V1 to V4, samples were collected only at 2 h after HU intake. Blood samples were collected in 5 mL EDTA tubes. Whole blood was transported and/or stored at 2–8 °C for a maximum of 4 h before centrifugation at 1000 rpm for 10 min at 4 °C. Aliquoted plasma was rapidly frozen at −20 °C, and samples were analyzed once a week.
2.3. GC-MS Method
A volume of 50 µL of internal standard (tropic acid, 1 g/L in 0.9% NaCl) was added to 50 µL of patient plasma, quality control, calibrators and blanks (Etablissement Français du Sang, Strasbourg, France), followed by the addition of 1000 µL of a hexane/absolute ethanol mixture (50:50, v/v) to precipitate plasma proteins. The tubes were vortexed for 3 min and then centrifuged for 12 min at 2800× g and 4 °C. The supernatant was collected in new tubes and evaporated at 45 °C under a nitrogen flow. For the derivatization reaction, a BSTFA/heptane mixture (80:20, v/v) was prepared, and 100 µL was added under a fume hood to all tubes containing the dry extract. The tubes were incubated in an oven heated to 60 °C for 30 min. Once the tubes had cooled, they were centrifuged for 7 min at 4700 g and 4 °C. After transferring the mixture to vials suitable for GC-MS, 1 µL was injected into the analytical system (gas chromatography–mass spectrometry (GC-MS), ISQ LT, Thermo Fisher Scientific Inc., Waltham, MA, USA). The HU dosage method used a low-polarity RTX-5-MS capillary column (5% diphenyl/95% dimethyl polysiloxane, 30 m × 0.25 mm × 0.25 µm). Helium was the carrier gas. The initial injection temperature was 180 °C and the split mode was selected. The initial oven temperature was 80 °C (2 min), and then it increased by 12 °C/min to reach 170 °C and finally increased by 30 °C/min to reach 280 °C (2 min). The run lasted 15 min. The quantification and confirmation ions for HU were 277 and 292 m/z, respectively. The specific ion for tropic acid was 118 m/z. To calculate the HU concentration, the ratio of the HU peak area to that of the internal standard was used. The lower and upper limits of quantification were 0.79 mg/L and 100 mg/L, respectively. Method validation was performed in accordance with standard bioanalytical guidelines. The calibration curve was established in plasma from seven concentration points (2.5, 7.5, 10.0, 15.0, 20.0, 40.0, and 50.0 mg/L), with a coefficient of variation below 10% for all calibrators. Recovery, assessed as the ratio of the measured to added concentration, ranged from 99.6% to 105.6%, within the laboratory acceptance range of 90–110%. Intra- and inter-assay precisions were evaluated from 30 replicates at three concentration levels (7.5, 15.0, and 40.0 mg/L) and were below 15% at all levels, confirming satisfactory repeatability and reproducibility. Data processing was performed using Thermo Xcalibur© software (version 2.2, Thermo Fisher Scientific Inc.).
2.4. PK Analysis
2.4.1. Non-Compartmental Method
Plasma concentrations versus time were first assessed using a non-compartmental approach. Two PK profiles were identified based on the T
max at the first visit, consistent with those previously described [
9,
11]: rapid absorbers exhibited T
max values of 10 or 20 min (i.e., strictly below 1 h), and slow absorbers were defined by T
max values of 60 min or greater. A threshold of 1 h was therefore used to operationalize this distinction, whereby T
max < 1 h defined the rapid profile and T
max ≥ 1 h defined the slow profile. The AUC
0–6h was calculated using the trapezoidal rule with GraphPad Prism
® software (version 10.6.1). The AUC extrapolated to infinity (AUC
inf) was computed as AUC
0–6h + C
6h/λ
z, where C
6h represents the last quantifiable plasma concentration post-HU administration and λ
z is the terminal elimination rate constant. This latter was estimated by the log-linear regression of the last two quantifiable concentration–time points of each individual profile. The apparent plasma clearance (Cl/F) and volume of distribution (V
d/F) were derived from the AUC
inf and were also normalized to patient body weight (Cl/F/weight and V
d/F/weight, respectively).
2.4.2. Population Pharmacokinetics
Population pharmacokinetic modeling was performed to estimate typical population parameters (fixed effects), interindividual variability (IIV), and intraindividual variability (residual error). Concentrations
for subject
at time
were modeled as:
where
f is the nonlinear structural model depending on covariates X
ij; θ is the vector of the fixed-effect parameters; η
i∼
N(0,Ω) quantifies the IIV; and ε
ij∼
N(0,σ
2) represents the residual error. Analysis used Monolix 2024R1, Simulations Plus with the Stochastic Approximation of the Expectation–Maximization (SAEM) algorithm for the maximum likelihood estimation of the θ, Ω and σ
2. Empirical Bayes estimates of individual parameters employed the Hastings–Metropolis algorithm.
Base structural models were evaluated based on the parameter plausibility, precision, objective function value (OFV) (−2 log-likelihood), Likelihood Ratio Test (LRT), and residual error magnitude. Residual error models (additive, proportional, combined, exponential) were tested similarly. Parameter distributions (log-normal, probit-normal, power-normal) were selected if they significantly reduced the OFV.
Covariates reducing IIV and improving goodness of fit (GOF) were identified via forward inclusion (ΔOFV > 3.84,
p < 0.05, χ
2, 1 degree of freedom) and backward deletion (ΔOFV > 7.88,
p < 0.005, χ
2, 1 degree of freedom), conservative thresholds for this small pediatric cohort to limit errors [
18]. Selections were guided by pathophysiological/pharmacological rationale. Continuous covariates tested were age, body weight (BW), height, body mass index (BMI), serum creatinine, creatinine clearance [
19], cystatin C, the cystatin C-based estimated glomerular filtration rate (eGFR) [
20] and the treatment duration. Categorical covariates were sex, age (pediatric: 0 vs. adult: 1), randomization arm and kinetic profile (rapid or slow). Graphical exploratory analyses preceded testing. Missing data were handled as follows: categorical variables were coded as missing (.) in the dataset; continuous variables were imputed using population medians.
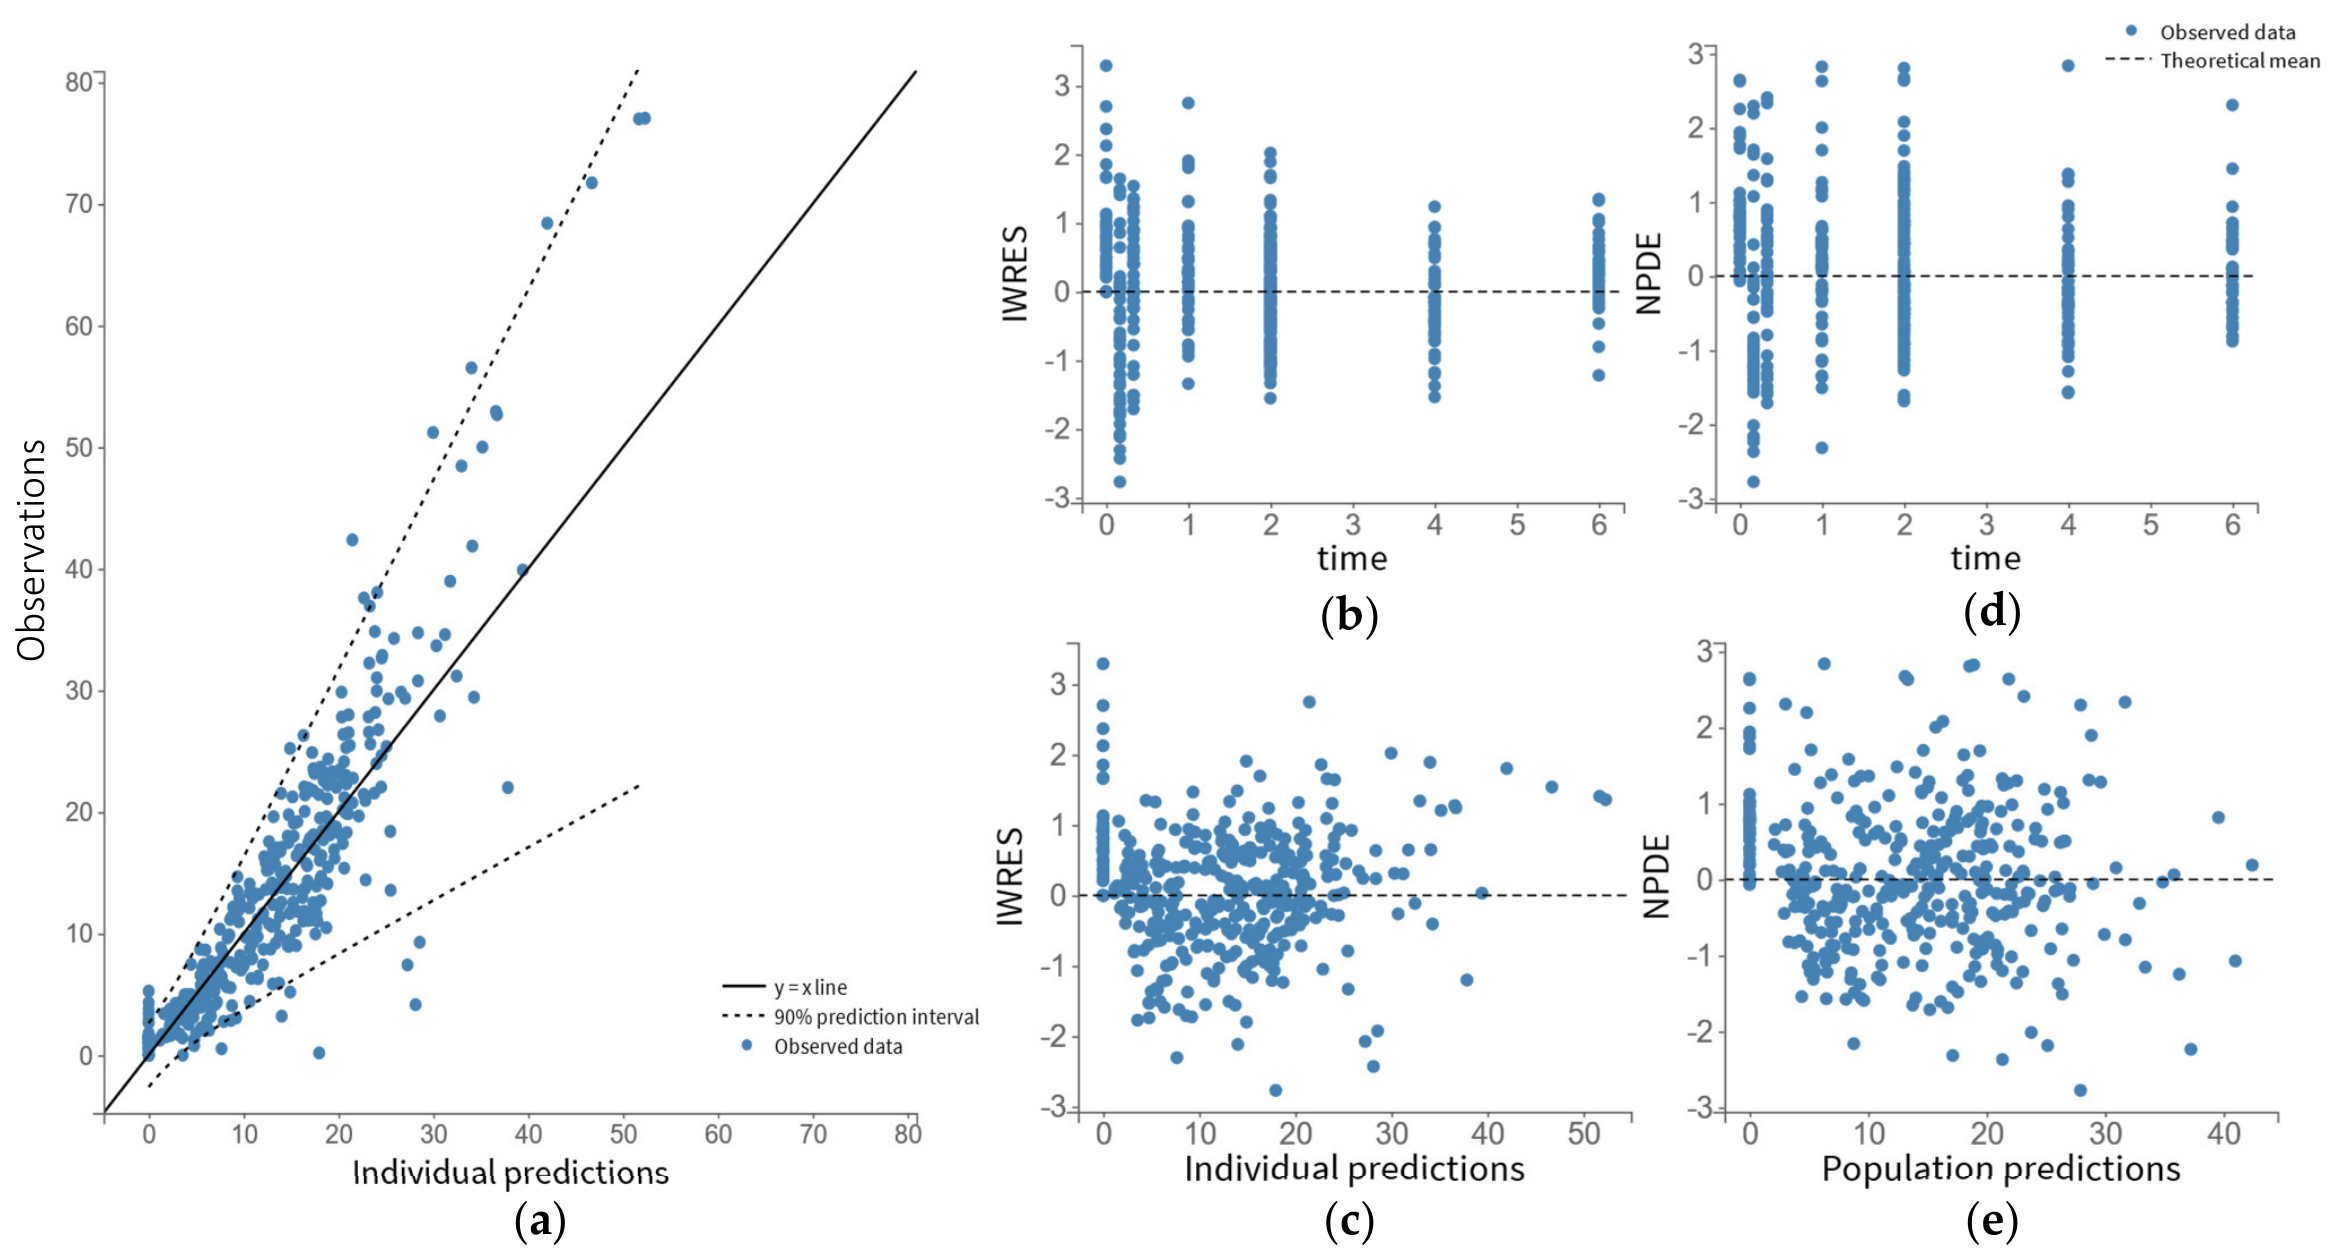
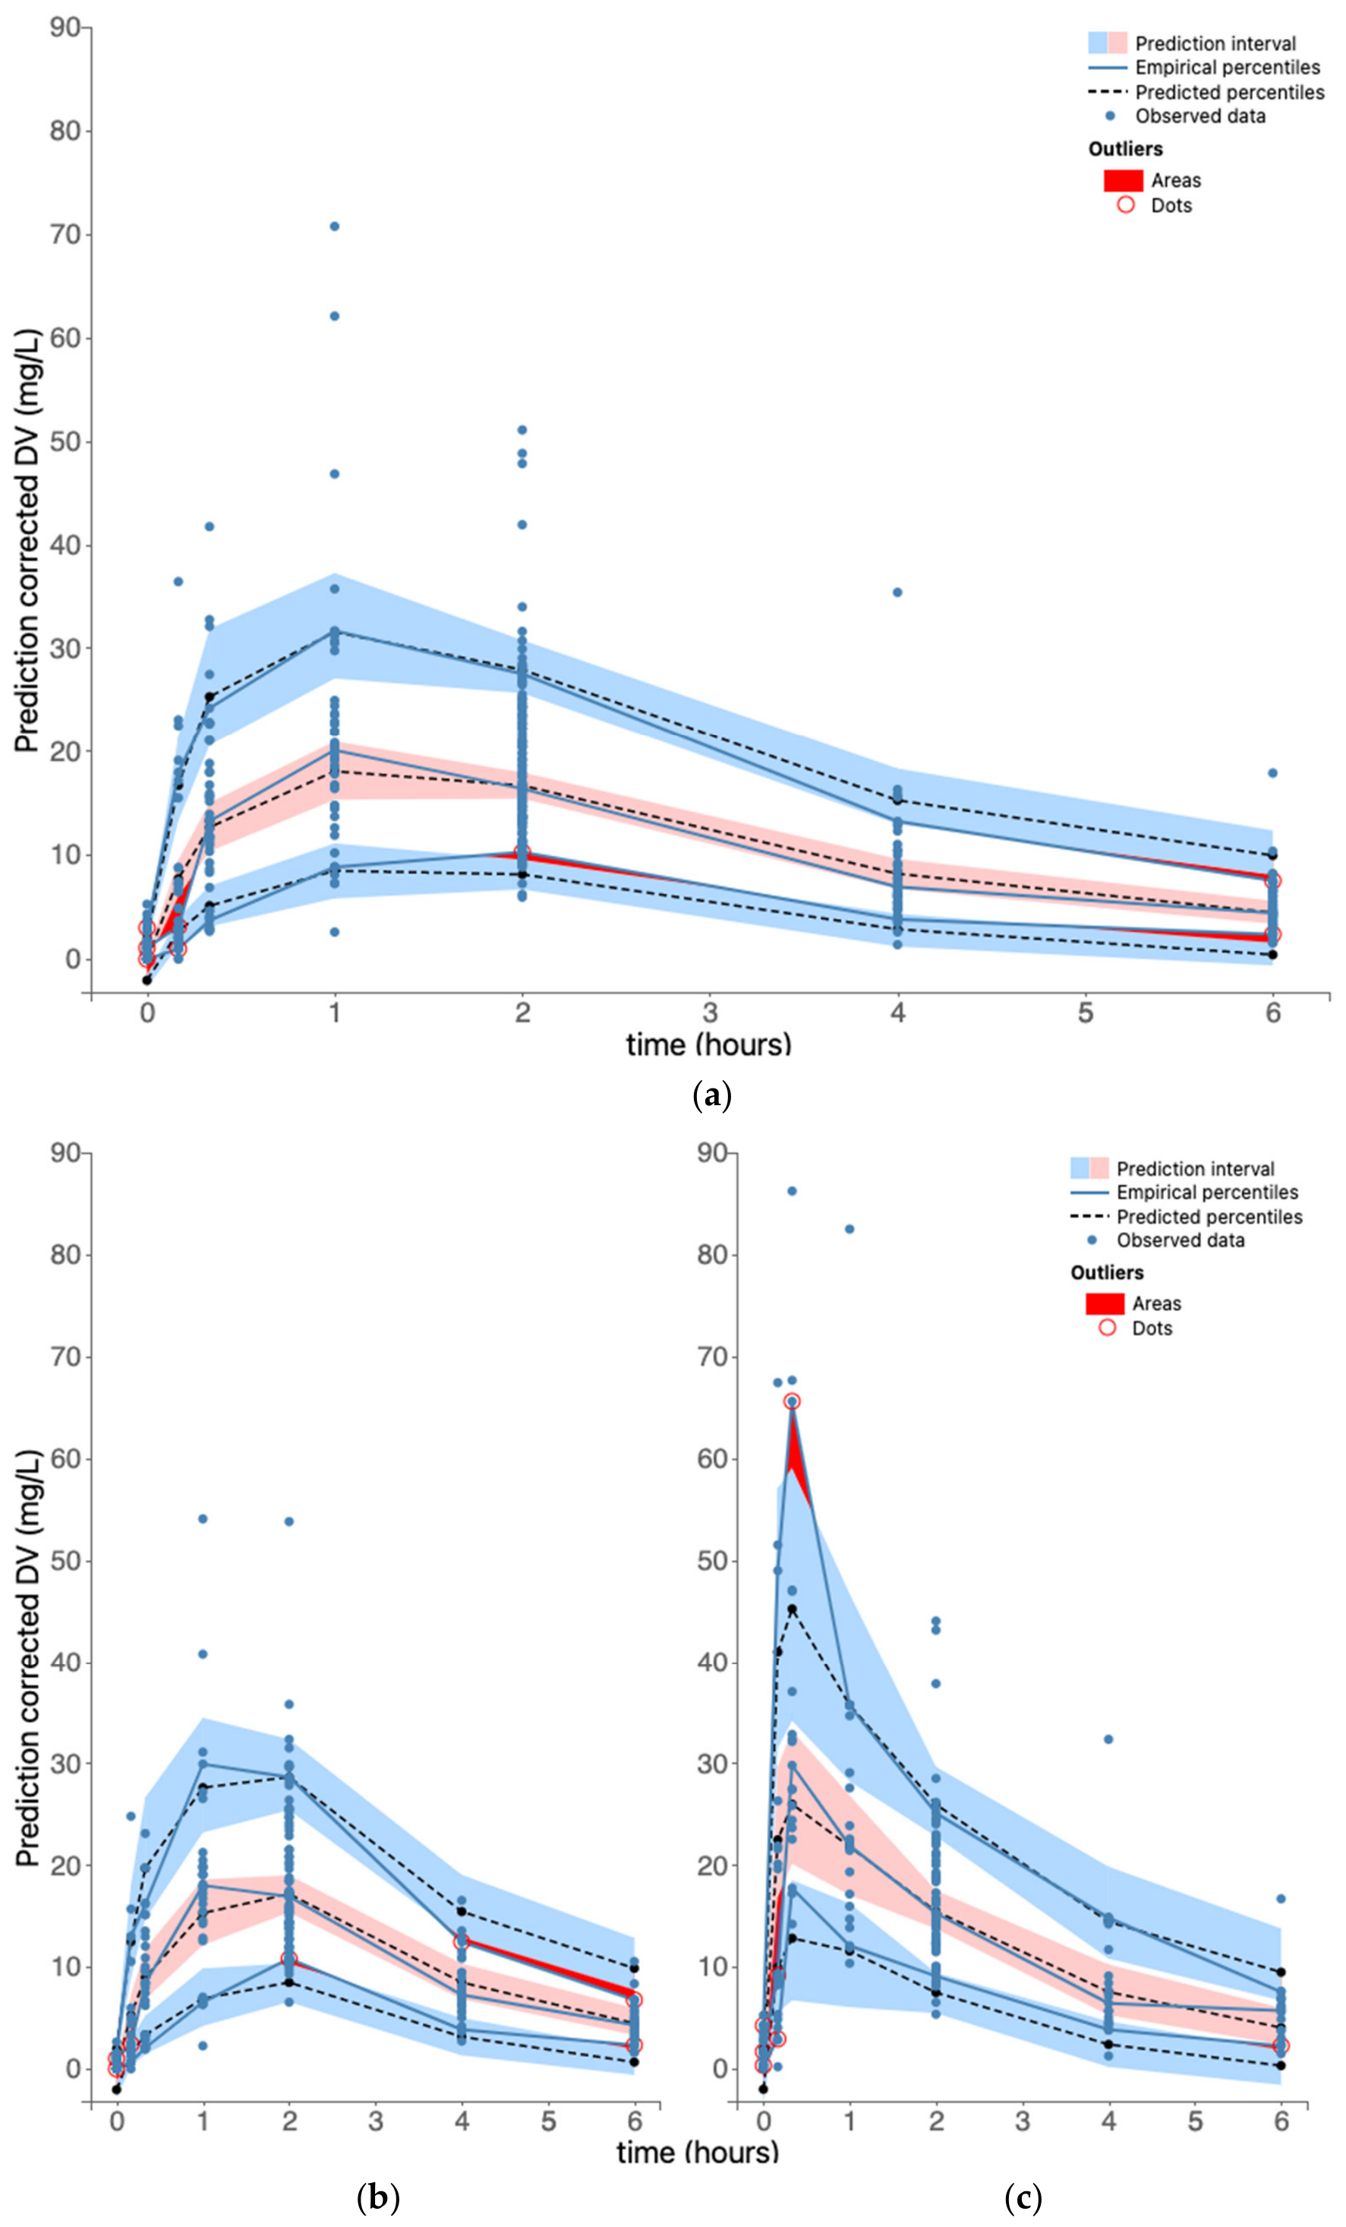
Internal validation used LRT for nested models (ΔOFV vs. χ2 with degrees of freedom difference). Graphical diagnostics included: observed vs. population/individual predicted concentrations; normalized prediction distribution errors (NPDEs) vs. predictions/time; individual weighted residuals (IWRESs). Prediction-corrected visual predictive checks (pcVPCs) compared observed data distributions (median, 5th/95th percentiles) to 10,000 Monte Carlo simulations.
Model stability was assessed using a non-parametric bootstrap with 200 resamples generated by resampling individuals with replacement from the original dataset. Parameter estimates from each bootstrap replicate were compared to the original estimates to calculate bias (100 × [bootstrap median—original estimate]/original estimate) and 95% coverage probability (% of bootstrap 95% confidence intervals containing the original estimate). Acceptable model stability was defined as bias < ±15% for fixed effects and interindividual variability parameters.
2.5. Pharmacodynamic Analysis
Correlations between the population PK parameters and hematological criteria of MTD attainment (neutrophil and reticulocyte counts), efficacy (HbF percentage), and HU adherence (mean corpuscular volume (MCV)), were assessed using Pearson correlation tests. Associations between the kinetic profile and the HU efficacy, MTD attainment, and MCV were also evaluated.
2.6. Statistical Analysis
Data analysis was performed using MonolixSuite®, GraphPad Prism®, and Excel® software. Statistical analyses and graphical representations were performed using GraphPad Prism® (version 10.6.1). Non-compartmental analysis (NCA) of individual concentration–time profiles was performed using GraphPad Prism®. Population pharmacokinetic modeling, including covariate screening and model evaluation, was conducted using MonolixSuite® (version 2024R1). Data management and calculation of the derived PK parameters (e.g., AUCinf, λz) were performed using Excel® (version Microsoft 365).
4. Discussion
In this study, HU pharmacokinetics were first characterized using non-compartmental analysis, followed by population modeling. Multiple covariates explained PK parameter variability, among which the kinetic profile (slow vs. rapid absorption) emerged as a key determinant, significantly accounting for interindividual variability and correlating with PD parameters of HU compliance and tolerability.
HU is now recognized as a disease-modifying treatment for SCD. However, both in adults and children, this therapy exhibits substantial IIV in the required dose, efficacy, tolerability, and time to reach the MTD. Several studies suggest that therapeutic drug monitoring could reduce the time to achieve therapeutic targets or MTD by at least 3 months [
6,
7,
11,
21].
First, a non-compartmental analysis was performed for each individual. The mean Cl/F, V
d/F, Cl/F/weight and V
d/F/weight were 9.1 L/h, 52.0 L, 0.26 L/h/kg and 1.4 L/kg, respectively. The mean AUC
0–6h and AUC
inf were estimated at 72.9 mg.h/L and 101.2 mg.h/L, respectively. These values are consistent with those reported in non-compartmental studies. Specifically, mean AUC and clearance values of 102 mg.h/L and 7.98 L/h [
9] and 107.3 mg.h/L and 9.32 L/h [
22], respectively, have been previously described in the literature. Furthermore, Ware et al. [
11] first identified two distinct absorption phenotypes, characterized by a T
max of 15–30 min in fast absorbers and of 60–120 min in slow absorbers; these findings were subsequently confirmed by Wiczling et al. [
9]. The present study corroborates these observations, as two subpopulations were identified: one with a T
max strictly below 1 h, and a second with a T
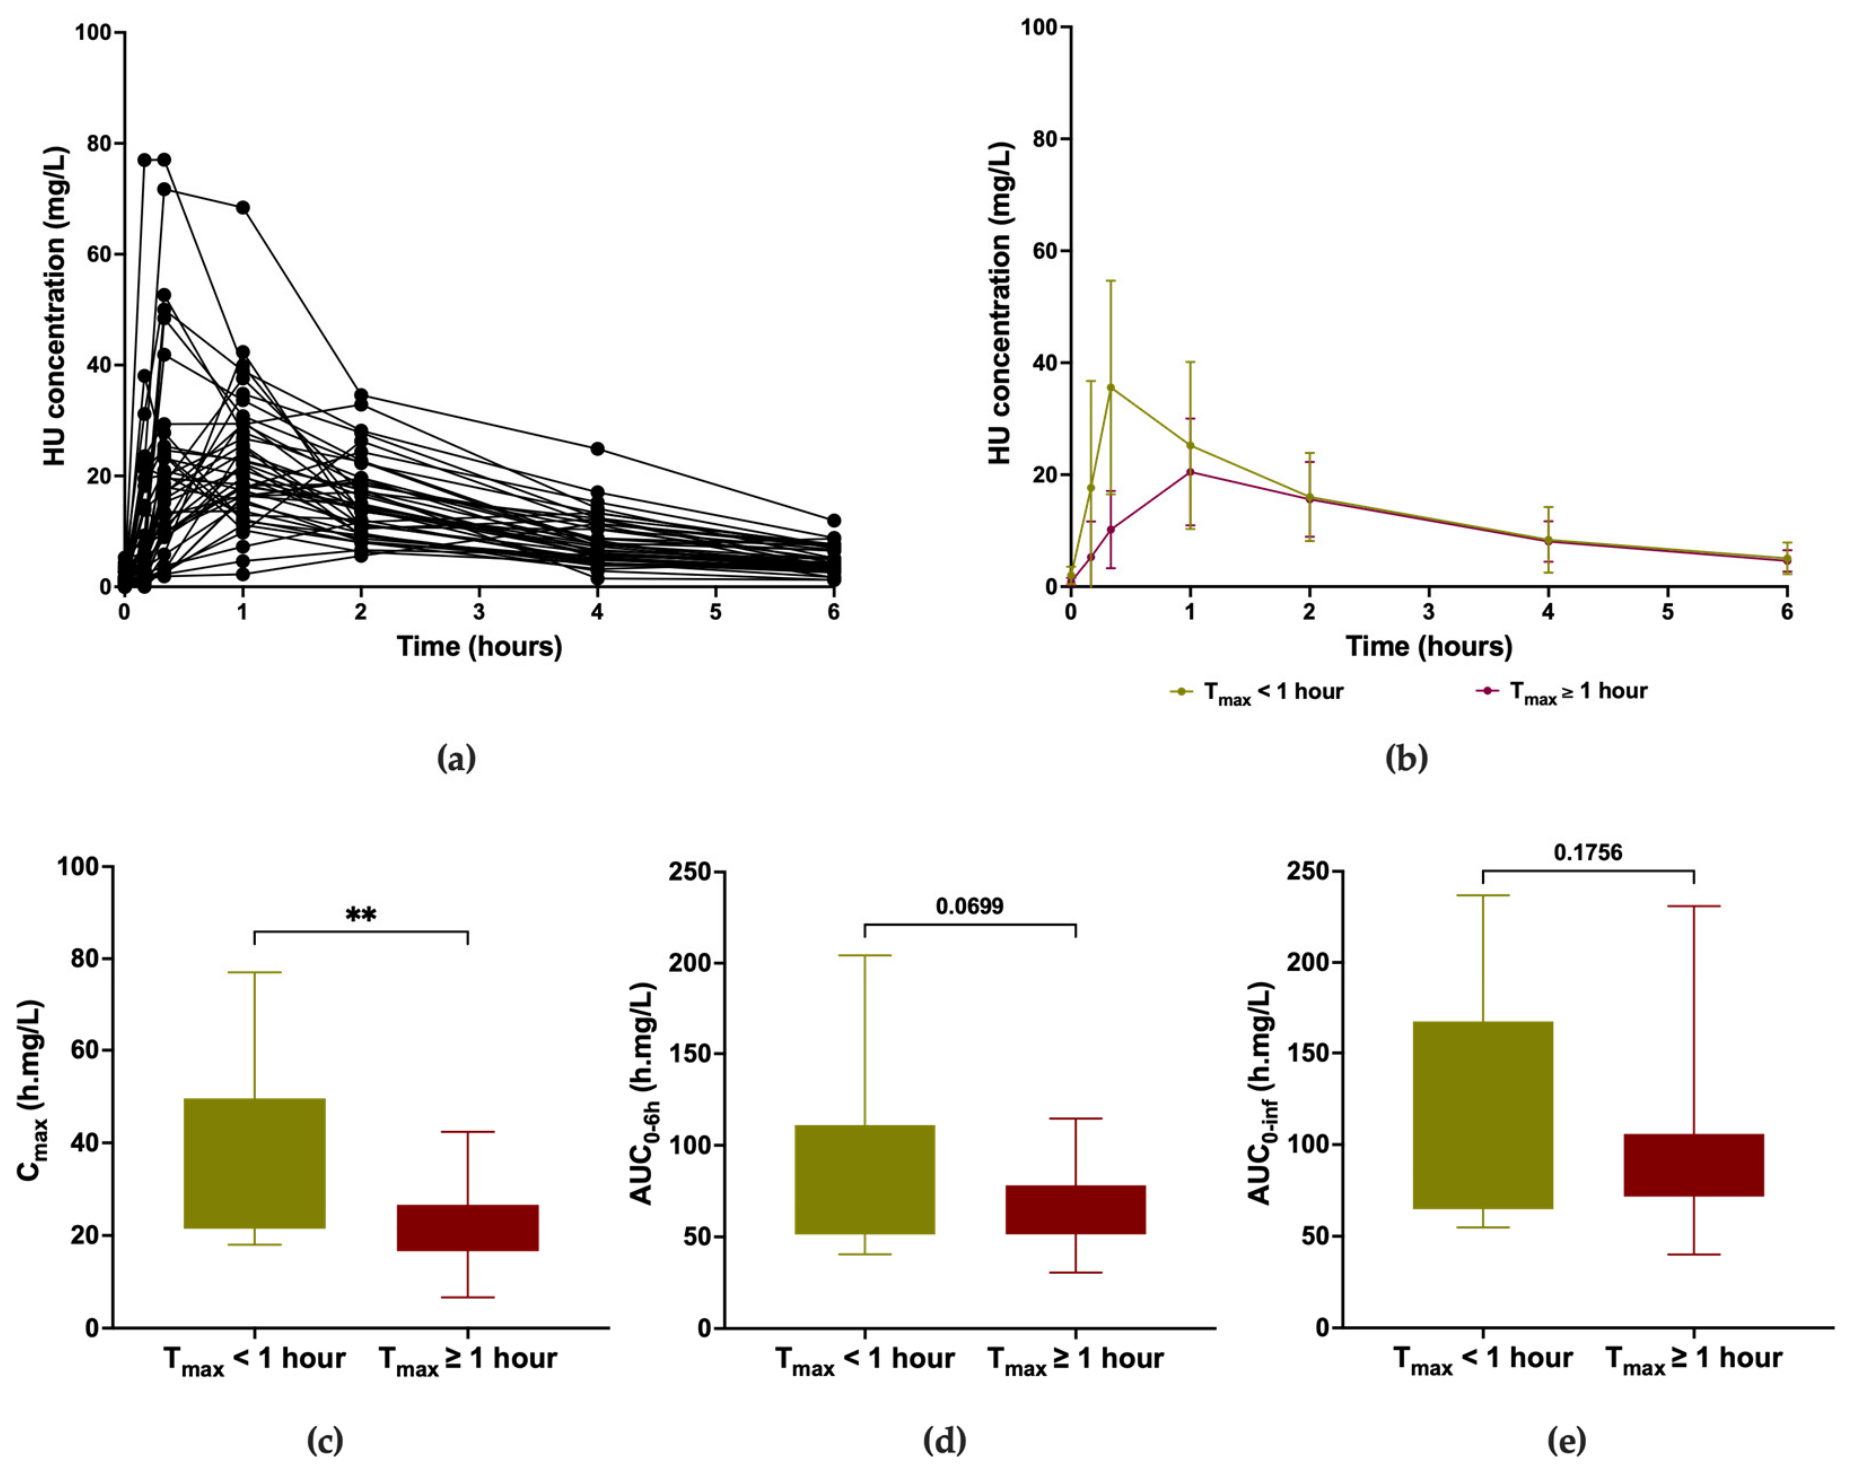
max of 1 h or greater. The absorption phenotype (rapid vs. slow) significantly influenced the plasma HU concentrations, with rapid absorbers exhibiting higher C
max values (36.5 ± 18.8 mg/L) compared to slow absorbers (22.3 ± 8.4 mg/L). The impact of the absorption phenotype on the C
max observed in the present study is consistent with the seminal findings of Ware et al. [
11], where rapid absorbers exhibited a significantly higher C
max (28.9 ± 6.9 mg/L) compared to slow absorbers (22.2 ± 4.3 mg/L;
p < 0.001), along with a shorter mean residence time. Regarding total drug exposure, a trend toward higher AUC values was observed in rapid absorbers compared to slow absorbers, although this difference did not reach statistical significance, consistent with previously published data. Ware et al. reported that the absorption phenotype significantly influenced first-dose measures of systemic exposure; however, no detailed AUC values stratified by phenotype were provided in their publication [
11]. This finding was further corroborated by Wiczling et al., who confirmed that the absorption profile does not significantly affect overall drug exposure [
9].
This study subsequently characterized PK parameters and their variability using a population approach. The model best describing the observed data was a one-compartment model with first-order absorption and elimination. The presence of delayed absorption in some patients has been previously reported [
10,
11]; however, the inclusion of transit compartments or an absorption lag-time to describe the absorption phase did not meaningfully improve the parameter precision in the present analysis. Given the imprecision of parameter estimates associated with these alternative models in the present dataset, the one-compartment model with first-order absorption was retained as the most parsimonious and clinically interpretable structural model. A linear elimination model was retained, which is consistent with the PK behavior commonly described at the low doses of HU used in SCD. Indeed, several preclinical and clinical studies have demonstrated that at higher doses (20–80 mg/kg), such as those employed in hematological malignancies, HU elimination becomes saturable and requires Michaelis–Menten kinetics to be adequately characterized [
10,
22]. Beckloff et al. further proposed that an AUC/C
max ratio below 4 is indicative of linear elimination, whereas a ratio above 6 suggests saturable Michaelis–Menten kinetics [
23]. In the present cohort, the calculated AUC/C
max ratio was approximately 2.8 and 4.5 for the rapid and slow PK profiles, respectively, thereby supporting and consolidating the choice of a linear elimination model.
The estimated V
d/F, normalized to body weight, was 25.23 L for a typical patient weighing 34.9 kg, with an IIV of 34.7%. This value is consistent with those reported in the literature, ranging from 0.480 to 0.901 L/kg [
10,
13,
22,
23]. Apparent clearance was estimated at 9.06 L/h (IIV = 32.99%) for the same typical patient, in good agreement with the literature values in children, adolescents and adults with SCD [
6,
9,
10]. A comparison of population PK parameter estimates from the present study with those reported in prior HU population PK studies in patients with SCD is summarized in
Table 4. While the final model demonstrated satisfactory goodness-of-fit and internal validation metrics, external validation in larger, multicenter datasets encompassing broader demographic and geographic diversity will be required before these findings can be generalized to the wider SCD pediatric population. Following systematic covariate screening, the categorical covariate “rapid” (coded 1) vs. “slow” (coded 0) absorption phenotype was identified as a significant predictor of the absorption rate constant and was retained in the final model, as it accounted for approximately half of the interindividual variability in this parameter. The typical k
a value was 1.36 h
−1 in slow absorbers, while it was 9.93 h
−1 in rapid absorbers, reflecting a nearly 7-fold difference in the absorption rates between the two phenotypes. To the best of our knowledge, no published population pharmacokinetic model has previously incorporated the absorption phenotype as a significant covariate on the k
a, making this a novel contribution of the present work.
Significant IIV was found for the Cl/F and V
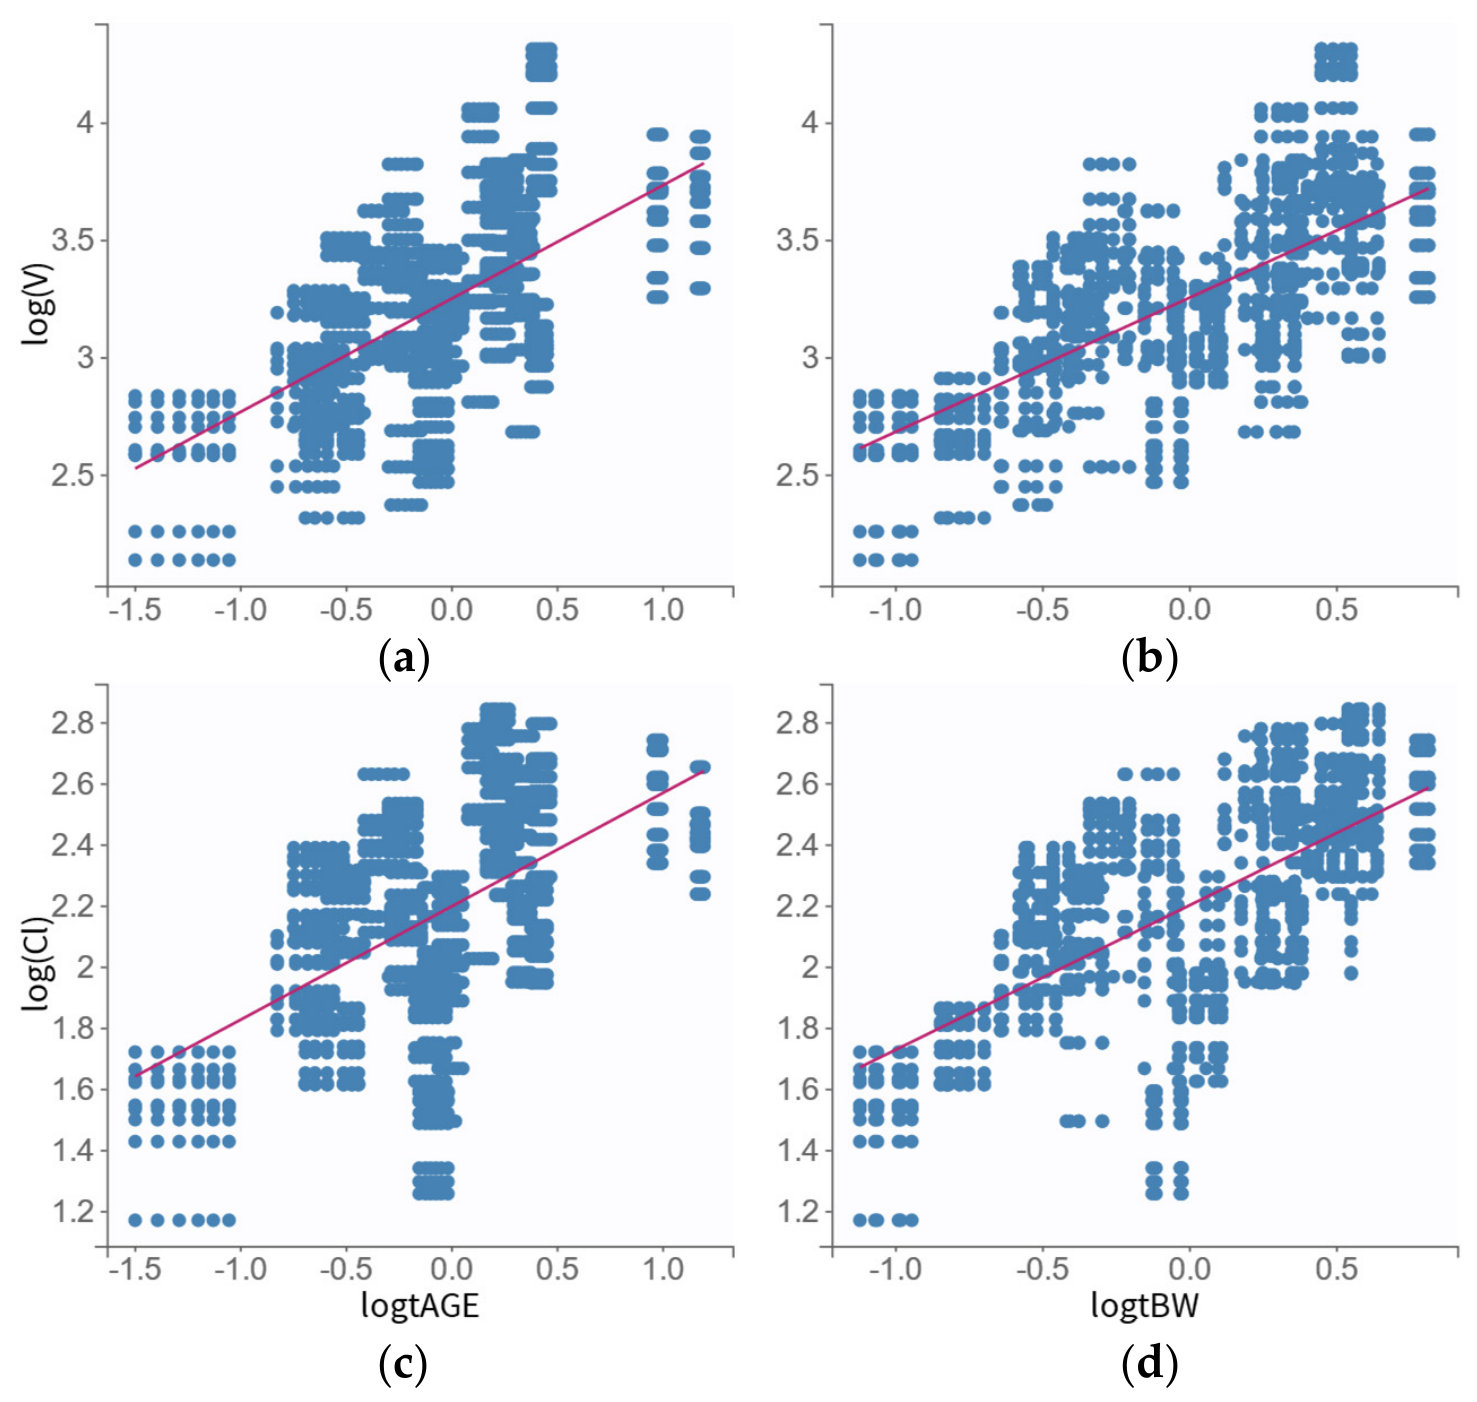
d/F. As this study enrolled predominantly pediatric patients, the selection of appropriate allometric scaling covariates was a critical step in model building. Log-transformed NBW and age yielded comparable results during covariate screening; however, BW is generally preferred in the literature [
6,
9,
13]. Although age showed promising results, it fails to account for underweight or overweight status, as well as growth retardation, which are clinical conditions that are not uncommon in children with SCD. Allometric exponents of 0.64 and 0.80 on the weight/34.9 ratio were found to best predict individual Cl/F and V
d/F values based on typical population values, a finding close to the exponents in the literature [
6,
13]. No other demographic, disease-related, or biological covariate tested reached the threshold for inclusion in the final model. A weak correlation was observed between serum creatinine and drug clearance (r = 0.50,
p = 0.0299); however, the inclusion of this covariate did not meaningfully improve the model fit or reduce the IIV. Contrary to the findings first reported by Dong et al. [
6], no significant relationship was identified between serum cystatin C and HU clearance in the present cohort. In their study (
n = 96), the range of serum cystatin C concentrations was considerably wider (0.57–1.25 mg/L) and included children with impaired renal function. In contrast, all patients in the present study had normal renal function, which likely accounts for the absence of a detectable relationship between cystatin C and HU clearance.
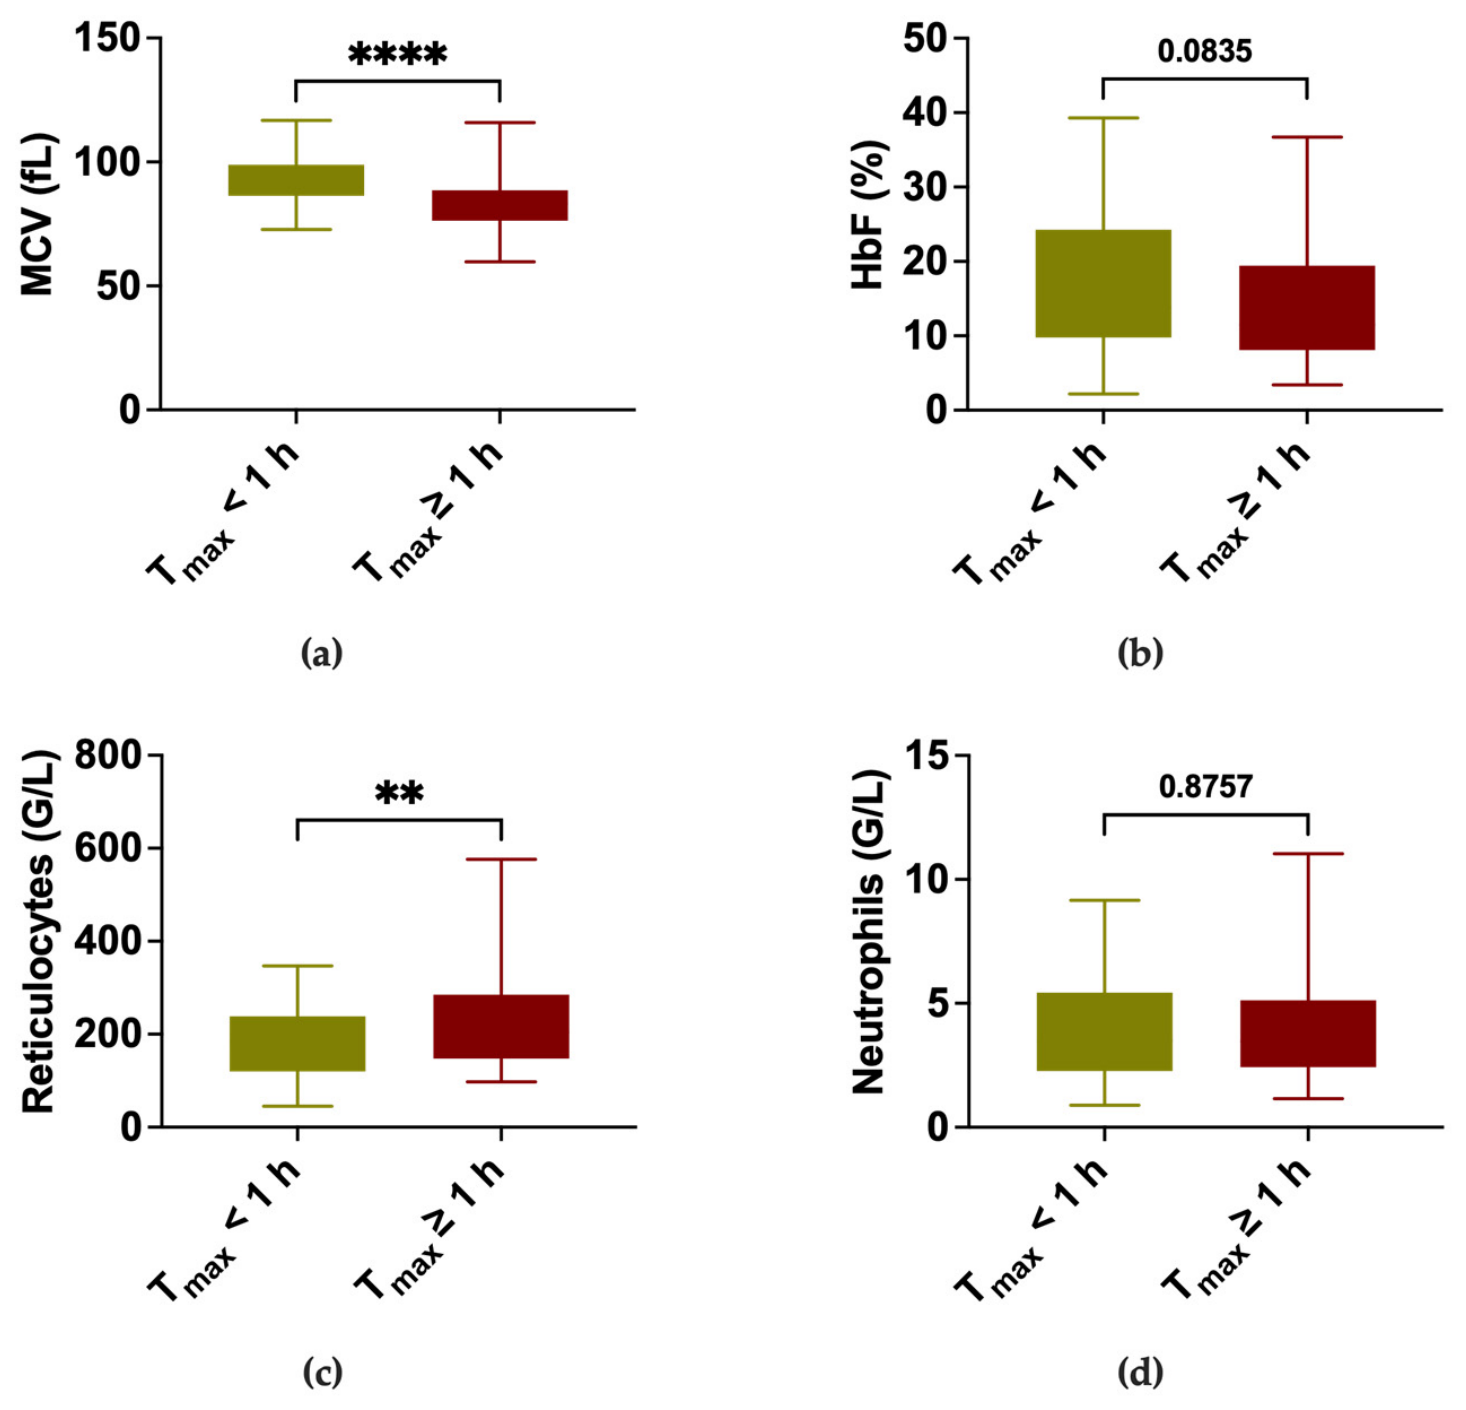
Finally, the present study provides novel evidence of a PK-PD relationship between the absorption phenotype and hematological response to HU. Rapid absorbers demonstrated significantly higher MCV values and lower reticulocyte counts compared to slow absorbers, with a trend toward higher HbF percentages, collectively suggesting the enhanced erythropoietic efficacy of HU in this subgroup. These findings are in partial agreement with those reported by Ware et al. in the HUSTLE cohort [
11], where the fast/slow absorption showed only a borderline association with the HbF percentage at the MTD (
p = 0.0982, R
2 = 0.05). Crucially, however, Ware et al. exclusively used the HbF percentage as their PD endpoint and did not investigate the relationship between the absorption phenotype and other key hematological parameters, namely, the MCV, reticulocyte count, or neutrophil count. The present study therefore extends these findings by demonstrating, for the first time, that rapid absorbers exhibit significantly higher MCV values and lower reticulocyte counts compared to slow absorbers, with a trend toward higher HbF percentages, suggesting a broader and more comprehensive hematological benefit associated with the rapid absorption phenotype. However, these results should be interpreted as exploratory, as individual PK parameters were not significantly correlated with hematological endpoints in our cohort. This absence of significant correlation, despite significant between-group differences according to absorption phenotype, may appear paradoxical but can be reconciled by several complementary considerations. First, the limited sample size (
n = 22) substantially reduces statistical power for continuous PK-PD correlation analyses, while binary group comparisons retain greater sensitivity in small cohorts. Second, the PK-PD relationship for HU may follow a threshold rather than a linear model, whereby erythroid progenitor suppression reaches a plateau beyond a critical C
max, attenuating continuous correlations while preserving group differences. Third, the absorption phenotype appears to reflect a predominantly stable individual characteristic, as supported by the absence of significant differences in the phenotype distributions between HU-naive and chronically treated patients. However, phenotype switching was observed in two patients who transitioned from a rapid to a slow profile between the first and fifth visit, indicating that the absorption phenotype is not entirely fixed and may be subject to intraindividual variability over time, possibly related to intercurrent clinical factors, adherence, or other patient-specific determinants. Despite this, rapid absorbers likely maintain higher daily C
max values throughout the entire course of treatment, generating a chronic cumulative pharmacological advantage that a single first-dose PK assessment cannot fully quantify, consistent with the S-phase-specific mechanism of HU cytotoxicity. Prospective studies incorporating repeated PK assessments will be required to characterize the long-term stability of the absorption phenotype and its implications for hematological response. Furthermore, the absence of a significant difference in the neutrophil counts between phenotypes is noteworthy. Two hypotheses may explain these findings. First, frequent infections in pediatric SCD patients induce reactive neutrophilia, masking HU’s stabilizing effect on the neutrophil count. Second, myelosuppressive toxicity is not phenotype-dependent, and both rapid and slow absorbers can safely reach the MTD. The MTD is conventionally defined as a stable and tolerated dose achieving a target range of mild marrow suppression, most commonly determined by the absolute neutrophil count associated with other hematological parameters (reticulocyte count, platelets) [
4,
11,
12]. The MTD was equivalently attained across phenotypes, confirming that both rapid and slow absorbers safely reach the therapeutic MTD despite a non-significant trend toward higher doses in slow absorbers. Substantial interpatient variability exists both in the MTD itself and in the percentage of HbF achieved, suggesting that PK, PD, and genetic factors all contribute to the phenotypic variability in HU response [
11,
12]. The absorption phenotype may therefore represent one important but not exclusive determinant of this variability. Larger cohort studies are warranted to elucidate its relative contribution alongside other covariates.
This study has several limitations that should be acknowledged. First, the sample size was modest, which may have limited the statistical power to detect subtle covariate effects, particularly for renal biomarkers such as cystatin C and creatinine, as well as weaker PK-PD associations, including the non-significant trend observed for HbF. Second, the cohort mainly included pediatric patients with preserved renal function, with only two adult participants, limiting the generalizability of our findings to older patients, individuals with impaired renal function, or more ethnically diverse populations. Third, it should be acknowledged that the absorption phenotype was derived from the same concentration–time dataset used for population PK model building, which introduces a potential circularity. Prospective validation of this covariate in an independent, larger multicenter cohort, ideally using a standardized first-dose PK sampling protocol, will be required to confirm its role as a robust and generalizable predictor of the ka in pediatric SCD patients treated with HU. The phenotype switching observed in two patients highlights a potential limitation of single-assessment classification strategies in clinical practice. While a first-dose PK assessment remains a pragmatic and accessible tool for phenotype characterization, repeated PK evaluations at key timepoints during dose escalation may be warranted to capture intraindividual variability in absorption behavior and refine the clinical utility of phenotype-guided dosing strategies. Finally, adherence was not assessed using direct measures, and pharmacogenetic data were not available, both of which may have contributed to the observed interindividual variability.