Abstract
Background: Psoriasis is a chronic inflammatory skin disorder for which topical medications are the preferred treatment option. However, current therapies are limited by adverse reactions, drug resistance, and economic burdens. Dictamni Cortex (DC; the root bark of Dictamnus dasycarpus Turcz.) has a long history in the treatment of psoriasis, with its transdermal bioactive constituents serving as the pharmacodynamic foundation for topical anti-psoriatic therapy. Methods: Building on the separation of DC’s chemical constituents, this study integrated ultra-performance liquid chromatography quadrupole time-of-flight mass spectrometry (UPLC-Q-TOF-MS) and network pharmacology, along with activity verification, to investigate the anti-psoriatic active components among the transdermal constituents of DC. Results: Forty-one chemical constituents were characterized in DC, including 26 transdermally permeable compounds, predominantly alkaloids and limonoids. Network pharmacological analysis revealed core targets, including MMP9 and TLR4, as well as multiple pathways related to inflammatory and immune responses. Molecular docking studies identified dictamnine, jangomolide, rutaevin, and other key transdermal constituents that exhibited high binding affinity to core targets. In vitro validation showed that these compounds significantly suppressed cellular proliferation (p < 0.05) and downregulated Ki67 mRNA expression (p < 0.05) in the psoriasis-like HaCaT cell model. Concurrently, they significantly reduced secretion of key pro-inflammatory cytokines, including IL-17A, IL-22, IL-1β, IL-6, and IL-8 (p < 0.05). Comprehensive comparative analyses confirmed that dictamnine exhibited ideal anti-psoriatic efficacy. Conclusions: These results provide a pharmacological substance basis for the development of external preparations of DC for treating psoriasis and provide novel research concepts for investigating the pharmacodynamic material basis of Traditional Chinese Medicine topical drugs.
1. Introduction
Psoriasis, a chronic inflammatory skin disorder with recurring outbreaks, impacts approximately 2–3% of the global population and shows a consistent increase in incidence [1]. The etiology and pathogenesis of the disease are complex and multifactorial, involving genetic, immunological, and environmental elements, and have not been fully elucidated, making a complete cure presently unattainable [2,3]. Moreover, accumulating evidence indicates that psoriasis is associated with comorbidities such as cardiovascular diseases [4], metabolic syndrome [5], and psychiatric disorders [6,7], which complicates treatment selection.
Psoriasis manifests with excessive keratinocyte hyperproliferation, infiltration of immune cells, and exaggerated inflammatory responses. In clinical settings, the disorder is categorized into subtypes: vulgaris, pustular, erythrodermic, and arthritic, with vulgaris being the most common. Although this subtype is not typically life-threatening, patients suffer from persistent skin lesions and recurrent flares. These symptoms severely reduce quality of life and create a substantial physiological and psychological burden for both patients and their families [8,9].
Current therapeutic strategies for psoriasis encompass topical agents, phototherapy, systemic drugs, and biologics that modulate immune pathways, aiming to mitigate symptoms and enhance patient well-being. Nevertheless, their clinical utility is constrained by adverse effects, drug resistance, long-term toxicity risks, and high costs, posing significant challenges in disease management [10,11].
Traditional Chinese medicine (TCM) has a long history and distinctive features in the management of psoriasis, with its earliest documented description preserved in the Zhu Bing Yuan Hou Lun (Treatise on the Causes and Symptoms of Diseases), a medical text originating from the Sui Dynasty (581–618 CE). Through millennia of clinical practice, TCM has accumulated extensive experience and has demonstrated advantages such as harmonizing therapeutic actions, favorable safety profiles, and evidence-based efficacy in psoriasis treatment. Clinical evidence has indicated that the accumulation of dampness-heat toxin in the skin induces qi-blood stasis, resulting in epidermal thickening and scale adhesion, which constitutes the core pathophysiology of psoriasis. Consequently, treatment strategies focus on heat-clearing and blood-cooling, blood-activating and stasis-resolving, as well as wind-dampness dispelling. TCM herbs exerting these therapeutic actions have demonstrated clinical efficacy in ameliorating psoriatic lesions [12,13,14].
Dictamni Cortex (DC), the dried root bark of Dictamnus dasycarpus Turcz. (Rutaceae), exhibits heat-clearing, dampness-drying, wind-dispelling, and detoxifying properties [15]. It was first documented in Shennong Bencao Jing (The Divine Farmer’s Materia Medica). Its primary active constituents encompass alkaloids, limonoids, flavonoids, and volatile oils, which provide a substantial pharmacological foundation. Contemporary pharmacological research has validated DC’s multifunctional bioactivities, including anti-inflammatory, antimicrobial, antiallergic, anticancer, pesticidal, and antioxidative properties [16,17]. DC is primarily used in dermatological practice and has a long history in psoriasis treatment, with documentation in both ancient medical texts and modern research. Yaoxing Lun (Drug Property Theory) and Bencao Yuanshi (Original Herbal Studies) state that it “treats diverse heat-toxins, pathogenic winds, wind-type sores, scabies, and erythematous erosions.” Additionally, Bencao Gangmu (Compendium of Materia Medica) documents that topical application of DC processed with wine is used to treat scabies. DC also plays an important role in the topical management of psoriasis in modern clinical practice [18,19]. A variety of topical lotions used by Dr Wang Yuxi for the treatment of psoriasis contain DC, which highlights its important role in the clinical management of this condition [20]. Basic research indicates that topical application of DC methanolic extract attenuates psoriasiform scaling and alleviates skin inflammation in psoriasis model mice [21]. Moreover, DC aqueous extract markedly ameliorates the inflammatory response in psoriatic rats via targeting Akt1, TP53, and Caspase-3 [22]. Dictamnine, the main constituent of DC, directly inhibits the potential target interleukin-23 (IL-23) of psoriasis [23]. These findings highlight that DC exhibits substantial therapeutic potential in psoriasis management and holds promise as a valuable candidate for the development of novel anti-psoriatic therapeutics.
The transdermally active components of DC are pivotal for its local therapeutic effects. However, due to the complex composition of TCM, the specific constituents responsible for its efficacy in transdermal psoriasis treatment have not yet been elucidated. Therefore, to elucidate the pharmacodynamic material basis underlying its anti-psoriatic efficacy, this study employed ultra-performance liquid chromatography-quadrupole time-of-flight mass spectrometry (UPLC-Q-TOF-MS) technology to accurately identify the transdermal constituents of DC, based on the systematic isolation of its chemical constituents. The potential therapeutic targets and signaling pathways of DC’s permeable constituents in psoriasis treatment were then systematically analyzed using network pharmacology approaches. Furthermore, molecular docking simulations were employed to characterize the interactions between chemical constituents and core targets. Subsequently, the anti-psoriasis active constituents were screened by anti-proliferation and anti-inflammatory experiments of the psoriasis-like human immortalized keratinocyte (HaCaT) cell model. This study provides novel research concepts for investigating the pharmacodynamic material basis of topical drugs, offering new perspectives for developing anti-psoriatic TCM topical preparations.
2. Materials and Methods
2.1. Materials and Reagents
Dictamnus dasycarpus Turcz. Root bark (Lot #2405001, Liaoning Province) was supplied by Xinjingyuan Pharmaceutical Co., Ltd. (Baoding, China). Dr. Shi Yuhua (Associate Researcher, National Resource Center for Chinese Materia Medica, China Academy of Chinese Medical Sciences) confirmed its botanical identity.
Male Kunming mice (SPF grade, 16–18 g) were obtained from Vital River Laboratory Animal Technology (Beijing, China; License No. SYXK [Jing] 2023-0077).
HaCaT cells and Minimum Essential Medium (MEM) were sourced from Saiku Biotechnology (Guangzhou, China). Recombinant human TNF-α was acquired from PeproTech (Cranbury, NJ, USA). Fetal bovine serum (FBS) and Cell Counting Kit-8 (CCK-8) came from Dalian Meilun Biotechnology (Dalian, China), while Penicillin-streptomycin (PS) solution and 0.25% trypsin (1×) solution were obtained from Gibco (Thermo Fisher Scientific, Waltham, MA, USA). RT SuperMix was purchased from Exongen (Chengdu, China). Enzyme-linked immunosorbent assay (ELISA) kits for Human interleukin-17 (IL-17), interleukin-22 (IL-22), interleukin-1β (IL-1β), interleukin-6 (IL-6), and interleukin-8 (IL-8) were supplied by Baiaosike Biotechnology (Beijing, China).
γ-Fagarine was provided by our laboratory, with rutaevin from Pusi Biotechnology (Chengdu, China) and calcipotriol from Yuanye Biotechnology (Shanghai, China). Additional reagents were purchased from Titan Technology (Shanghai, China). Preparative-grade reagents were used for semi-preparative chromatography, with chromatographic-grade materials for UPLC-Q-TOF-MS analyses.
2.2. Extraction, Separation, and Structural Identification of Chemical Constituents from DC
DC pieces (1.0 kg) were extracted three times with 70% ethanol (8.0 L, 8.0 L, and 6.0 L, respectively). Following extraction and filtration, the filtrate was rotary evaporated at 60 °C and further concentrated under reduced pressure in a 60 °C water bath until no ethanol odor remained, yielding 369 g of DC crude extract. The compounds were isolated by semi-preparative HPLC (Huide Yi Technology Co., Ltd., Beijing, China) using a binary gradient system of acetonitrile and water. Structural characterization was performed by 1H and 13C NMR spectroscopy (600 MHz; Bruker BioSpin GmbH, Fällanden, Switzerland), and the spectra were processed and analyzed using MestReNova (version 15.0.0) for structural determination.
2.3. Preparation of Test Solution
Precisely 0.15 g of the 70% ethanolic DC extract was transferred to a sealed conical flask, followed by the addition of 25 mL 70% ethanol and recording of the total mass. Ultrasonic-assisted extraction was performed for 30 min (300 W, 40 kHz) using a bath sonicator, after which the sample was allowed to equilibrate to ambient temperature. The flask was reweighed, and solvent loss was compensated for by adding fresh 70% ethanol. After homogenization, the sample was filtered (0.22 μm) to prepare the DC test solution.
The modified Franz diffusion cell technique was employed: intact abdominal skin from depilated mice was excised and securely mounted between the diffusion cell and the receiving cell. 0.50 g of DC 70% ethanol extract was added to the diffusion cell, with a diffusion area of 3.14 cm2. The receiving medium consisted of 95% ethanol-water (3:7, v/v). The transdermal permeation study was conducted using a TK-24BL diffusion system (Shanghai Kaikai Technology Co., Ltd., Shanghai, China) under precisely controlled conditions: temperature maintained at 32.0 ± 0.2 °C with continuous magnetic agitation (320 rpm). After 24 h of permeation, the receptor phase was carefully withdrawn, followed by sterile filtration (0.22 μm) to obtain the final DC permeation sample.
2.4. Identification of Transdermal Constituents of DC
UPLC-Q-TOF-MS (Waters Corporation, Milford, MA, USA) was employed for the qualitative identification of chemical constituents in DC ethanol extract and transdermal receiving solutions.
2.4.1. Chromatographic Conditions
Chromatographic separation was achieved using an ACQUITY UPLC BEH C18 column (2.1 × 100 mm, 1.7 μm; Waters Corporation, Milford, MA, USA) with a mobile phase of (A) acetonitrile and (B) 0.1% aqueous formic acid. The following gradient program was applied: 5–100% A (0–20 min), maintaining 100% A (20–25 min). Chromatographic analysis was performed under the following conditions: a constant flow rate of 0.3 mL/min, with the column thermostat set to 35 °C and the autosampler maintained at 20 °C. Identical injection volumes (4 μL) were used for analysis of both DC crude extract and transdermal permeation samples, employing UV detection at 245 nm.
2.4.2. Mass Spectrometric Analysis Parameters
The mass spectrometric analysis was conducted with an ESI interface operating in dual-polarity mode. Optimized ionization parameters included: desolvation gas (800 L/h, 450 °C), cone gas (50 L/h), capillary voltages (±3.0 kV for positive/−2.5 kV for negative mode), and source conditions (40 V cone voltage, 120 °C). Full-scan mass spectra were recorded at a 0.2 Hz acquisition rate across m/z 50–1500.
2.4.3. Data Processing and Compound Identification
MassLynx (version 4.2) was employed for processing and interpreting the raw mass spectrometry data. In the base peak intensity (BPI) chromatograms, target compounds were identified by matching retention time (RT), accurate molecular weight (error < 5 ppm, theoretical value calculated using ChemDraw Professional 22.2.0), and characteristic fragment ions (MS/MS spectra). These data were compared with the chemical constituents isolated in Section 2.2 of this study and with reported characteristic compounds of DC in the literature to achieve compound identification.
2.5. Network Pharmacology Investigation
2.5.1. Acquisition of Potential Targets for DC’s Transdermal Constituents
Following UPLC-Q-TOF-MS characterization, compounds demonstrating transdermal permeability were advanced to target prediction analysis. Initially, the compounds’ standard SMILES were obtained from PubChem (https://pubchem.ncbi.nlm.nih.gov/, accessed on 11 June 2025) [24]. Subsequent target profiling was performed using the SwissTargetPrediction platform (species: Homo sapiens; http://www.swisstargetprediction.ch/, accessed on 11 June 2025) [25], where all predictions with probability scores >0 were considered. The resulting targets were consolidated and duplicates removed, generating the final candidate target pool for DC’s transdermal constituents [26].
2.5.2. “Transdermal Constituent-Target” Network Construction and Analysis
The DC transdermal component-target network was constructed in Cytoscape (version 3.10.2) [27], with topological analysis conducted using Network Analyzer. Node significance was assessed via degree centrality [28].
2.5.3. Acquisition of Psoriasis Disease Targets
Potential therapeutic targets for psoriasis were systematically curated from established biomedical databases: DrugBank (https://go.drugbank.com/), GeneCards (https://www.genecards.org/), OMIM (https://www.omim.org/), and the Therapeutic Target Database (TTD, http://db.idrblab.net/ttd/). All databases were accessed on June 12, 2025 [29,30,31,32]. The retrieved targets were integrated and deduplicated to generate a psoriasis disease target set. In GeneCards, targets with a relevance score above the mean value were selected to ensure target relevance [33,34].
2.5.4. Venn Diagram Construction for Constituent-Disease Intersection Targets
Common targets shared between DC’s transdermal components and psoriasis-related targets were determined through Venn diagram analysis using Venny 2.1.0 (https://bioinfogp.cnb.csic.es/tools/venny/, accessed on 15 June 2025) [34,35].
2.5.5. PPI Network Establishment and Core Target Identification
The common targets were analyzed using the STRING platform (https://string-db.org/, accessed on 16 June 2025) to generate a Protein–Protein Interaction (PPI) network [36]. Homo sapiens were specified with interaction confidence set at >0.400. After eliminating isolated nodes and non-interacting partners, the network was visualized and analyzed in Cytoscape (version 3.10.2). Topological assessment employed median values of degree, closeness centrality, and betweenness centrality as selection criteria. Nodes satisfying all three cutoff criteria simultaneously were identified as core targets [37,38].
2.5.6. Functional Annotation and Pathway Enrichment Analysis
Core targets were functionally annotated via Metascape (https://metascape.org/gp/index.html, accessed 17 June 2025) using p < 0.01 as the significance cutoff [39]. The Gene Ontology (GO) analysis systematically examined biological processes (BP), cellular components (CC), and molecular functions (MF), while Kyoto Encyclopedia of Genes and Genomes (KEGG) pathway mapping identified key signaling pathways implicated in psoriasis pathogenesis [40,41]. The Bioinformatics online resource (http://www.bioinformatics.com.cn/, accessed on 18 June 2025) was employed to visualize the top 10–20 most significantly enriched terms based on p values [42].
2.5.7. Construction and Analysis of Multidimensional Interaction Network
A comprehensive network integrating percutaneous components, pivotal targets, and associated signaling pathways was established using Cytoscape (version 3.10.2), visualizing the multidimensional relationships among these elements. This was performed to further explore the molecular mechanisms of transdermal administration of DC in the treatment of psoriasis [43].
2.5.8. Molecular Docking
Target protein structures were acquired from RCSB PDB (https://www.rcsb.org/, accessed 20 June 2025) [44]. 2D molecular structures were retrieved from PubChem, followed by energy optimization in Chem3D, while PyMOL (version 3.1.0) was used for protein preprocessing, including dehydration and ligand removal. Default parameters were applied for all subsequent steps. Protein and ligand preparations were conducted with AutoDockTools (version 1.5.7), followed by active site-centered grid generation. Molecular docking was executed using AutoDock Vina [45], with subsequent visualization of binding poses in PyMOL (version 3.1.0).
2.6. In Vitro Validation
2.6.1. TNF-α-Stimulated HaCaT Cell Model Construction
HaCaT cells, an immortalized human keratinocyte line, were maintained in complete growth medium (MEM with 10% FBS and 1% PS) under standard culture conditions (37 °C, 5% CO2, humidified atmosphere). Upon reaching 80–90% confluence, adherent cells were detached using 0.25% trypsin for subculture. For proliferation assessment, cells (1 × 10⁴/well) were cultured overnight in 96-well plates to ensure adhesion. Following attachment, the culture medium was exchanged with TNF-α-containing MEM (10–50 ng/mL final concentration) for 24 h treatment. Cell viability quantification was performed using the CCK-8 method: after adding 10 μL CCK-8 solution per well, plates were incubated for 30–60 min before measuring optical density at 450 nm using a microplate reader. The viability percentage was calculated using the following formula:
Cell viability (%) = [(OD450(experimental) − OD450(blank))/(OD450(control) − OD450(blank))] × 100%
HaCaT keratinocytes were plated in 6-well culture dishes (3 × 10⁵ cells/well) and allowed to adhere. The culture medium was then replaced with serum-free MEM containing TNF-α (10–50 ng/mL) for 24 h stimulation. For cell harvesting, monolayers were rinsed with phosphate-buffered saline (PBS) and dissociated using 0.25% trypsin-EDTA (1 mL/well, 37 °C, 5–10 min), with enzymatic activity subsequently neutralized by adding 2 volumes of complete medium. Cell counts were determined in triplicate measurements using an automated cell counting system (Cellometer Mini, Nexcelom Bioscience, Lawrence, MA, USA) [46].
HaCaT keratinocytes were plated in 6-well culture dishes (3 × 10⁵ cells/well) and exposed to TNF-α (30 ng/mL) or vehicle control for 24 h. Culture supernatants were subsequently harvested for quantification of IL-1β and IL-6 secretion using manufacturer-specified protocols. Additional experimental conditions employed TNF-α at concentrations up to 30 ng/mL as the highest treatment dose.
2.6.2. Impact of Investigational Agents on Keratinocyte Viability
For experimental procedures, 96-well plates were inoculated with HaCaT cells at a density of 1 × 10⁴ cells per well. Following a 24 h incubation period, complete cellular adhesion was achieved prior to subsequent treatment. Cells were exposed to serially diluted concentrations of the test compounds. An untreated control group (cells only) and a cell-free blank group were included. After 24 h of treatment, the CCK-8 assay was performed as described in Section 2.6.1. OD450 measurements were obtained for viability calculations. Cytotoxic effects of different compound concentrations were evaluated, and appropriate concentrations were selected for subsequent experiments based on the viability data.
2.6.3. Impact of Investigational Agents on TNF-α-Mediated Keratinocyte Growth
For experimental procedures, 96-well plates were inoculated with HaCaT cells at a density of 1 × 10⁴ cells per well. Following a 24 h incubation period, complete cellular adhesion was achieved prior to subsequent treatment. Experimental groups included: (1) untreated control (cells only); (2) TNF-α model group (30 ng/mL TNF-α alone); (3) test compound groups (30 ng/mL TNF-α + test compounds at final concentrations of 12.5, 25, and 50 μM); and (4) cell-free blank group. CCK-8 viability assessment was performed after 24 h of co-treatment. The inhibitory effects of test compounds on TNF-α-induced cell proliferation were evaluated based on cell viability data.
2.6.4. Extraction of RNA and Reverse Transcription Quantitative Polymerase Chain Reaction (RT-qPCR)
Total RNA isolation was performed using TRIzol (Aidlab biotechnologies Co., Ltd., Beijing, China) reagent following the manufacturer’s protocol. For cDNA synthesis, 1 μg of extracted RNA was reverse transcribed in a 20 μL reaction volume containing: 1 μg RNA template, 4 μL of 5× Reaction Mix, 3 μL Supreme Enzyme Mix, and DEPC-treated water to volume. The reverse transcription protocol comprised: 25 °C (10 min), 55 °C (15 min), and 85 °C (5 min), with resulting cDNA stored at −20 °C. Quantitative real-time PCR analysis was conducted using the Langji Real-Time PCR System (Hangzhou, China) [47]. The thermal cycling protocol included: initial denaturation at 95 °C for 5 min; 40 cycles of 95 °C for 10 s, 58 °C for 20 s, and 72 °C for 20 s; followed by melting curve analysis (95 °C for 15 s, 60 °C for 60 s, and 95 °C for 15 s). mRNA expression levels were determined using the comparative threshold cycle (Ct) method, with relative expression calculated using the 2−ΔΔCt method and β-actin as the housekeeping gene. The qPCR primer sequences are listed in Table 1.

Table 1.
Primer sequences used in this study.
2.6.5. ELISA Detection of Inflammatory Markers
According to the experimental grouping described in Section 2.6.3, HaCaT keratinocytes were plated in 6-well culture dishes (1 × 10⁶ cells/well). Conditioned media were harvested from TNF-α-activated cultures following compound treatment for subsequent cytokine quantification. Concentrations of interleukin IL-17A, IL-22, IL-1β, IL-6, and IL-8 were determined using commercial ELISA kits following the supplier’s protocols.
2.6.6. Data Analysis
Statistical analyses were conducted with GraphPad Prism (version 8.0), with data expressed as mean ± SD (n = 3). Intergroup differences were analyzed by one-way ANOVA, with statistical significance defined as p < 0.05.
3. Results and Discussion
3.1. Structure Identification of Extracted Constituents
The 70% ethanol extract of DC was fractionated using macroporous resin to obtain fractions with different polarities. Further separation and purification by semi-preparative HPLC led to the isolation of seventeen compounds. Their structures were identified by NMR and ESI-MS. The seventeen compounds were as dictamnine (I) [48,49], evodol (II) [50], jangomolide (III) [51], limonin (IV) [48], obacunone (V) [52], fraxinellone (VI) [48], fraxinellonone (VII) [52,53], preskimmianine (VIII) [50,54], acetovanillone (IX) [55], isodictamdiol C (X) [56], dictamdiol B (XI) [57], dictamalkoside A (XII) [58], 3-[1β-hydroxy-2-(β-D-glucopyranosyloxy)-ethyl)-4-methoxy2(1H)-quinolinone (XIII) [59], 9α-hydroxyfraxinellone-9-O-β-D-glucoside (XIV) [57], haploperoside A (XV) [60,61], 4-hydroxy-3-methoxy-acetophenone-4-O-α-L-rhamnopyranosyl-(1→6)-β-D-glucopyranoside (XVI) [62], (+)-lyoniresinol-3α-O-β-D-glucopyranoside (XVII) [63]. Structural details are provided in Figure 1, and nuclear magnetic resonance spectra are provided in Supplementary Figures S1–S34.
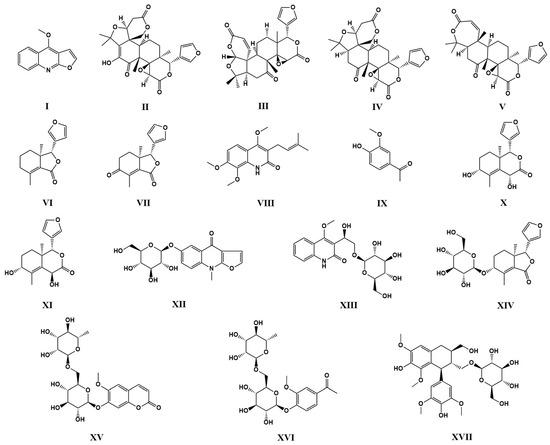
Figure 1.
Structures of compounds I–XVII from the 70% ethanol extract of DC.
Compound I: dictamnine (4-methoxyfuro[2,3-b]quinoline), white needle crystals, mp 126~128 °C. ESI-MS m/z: [M+H]+ 200.0713 (calcd for C12H9NO2, 200.0712). 1H NMR (600 MHz, DMSO-d6), δ: 8.15 (dd, J = 8.4, 1.5 Hz, 1H), 8.01 (d, J = 2.8 Hz, 1H), 7.88 (dd, J = 8.5, 0.7 Hz, 1H), 7.68 (ddd, J = 8.4, 6.7, 1.5 Hz, 1H), 7.44 (ddd, J = 8.3, 6.7, 1.2 Hz, 1H), 7.41 (d, J = 2.8 Hz, 1H), 4.40 (s, 3H). 13C NMR (150 MHz, DMSO-d6), δ: 163.4, 156.2, 144.9, 144.3, 129.4, 127.3, 123.6, 122.1, 118.0, 105.4, 103.3, 59.3. The above data are consistent with those reported in References [48,49], thus the compound is identified as dictamnine.
Compound II: evodol ((1R,2R,7S,13R,14R,16S,19S,20S)-19-(furan-3-yl)-11-hydrox-9,9,13,20-tetramethyl-4,8,15,18-tetraoxahexacyclo[11.9.0.02,7.02,10.014,16.014,20]docos-10-ene-5,12,17-trione), white needle crystals, mp 279~281 °C, ESI-MS m/z: [M−H]− 483.166 (calcd for C26H28O9, 483.1655). 1H NMR (600 MHz, CDCl3), δ: 7.41 (s, 1H), 7.40 (t, J = 1.7 Hz, 1H), 6.33 (s, 1H), 6.30 (s, 1H), 5.44 (s, 1H), 4.60–4.68 (m, 2H), 4.12 (s, 1H), 4.07 (s, 1H), 2.97 (dd, J = 18.1, 2.5 Hz, 1H), 2.84 (dd, J = 18.0, 4.4 Hz, 1H), 2.67 (dd, J = 13.2, 2.1 Hz, 1H), 1.80–1.97 (m, 2H), 1.59–1.72 (m, 2H), 1.55 (s, 3H), 1.50 (s, 3H), 1.16 (s, 3H), 1.05 (s, 3H). 13C NMR (150 MHz, CDCl3), δ: 195.3, 169.3, 166.6, 143.5, 141.2, 140.2, 139.6, 119.9, 109.8, 81.9, 79.3, 77.8, 68.7, 65.4, 52.2, 48.5, 47.0, 46.5, 37.5, 34.9, 31.8, 25.8, 25.3, 20.8, 20.6, 18.2. The above data are consistent with those reported in Reference [50], thus the compound is identified as evodol.
Compound III: jangomolide ((1R,2S,7R,10R,13R,14R,16S,19S,20S)-19-(furan-3-yl)-9,9,13,20-tetramethyl-6,8,15,18-tetraoxahexacyclo[11.9.0.02,7.02,10.014,16.014,20]docos-3-ene-5,12,17-trione), colorless crystals, mp 270~272 °C. ESI-MS m/z: [M+H]+ 469.1862 (calcd for C26H28O8, 469.1862). 1H NMR (600 MHz, CDCl3), δ: 7.38–7.43 (m, 2H), 6.52 (d, J = 10.0 Hz, 1H), 6.32 (s, 1H), 6.13 (d, J = 9.9 Hz, 1H), 6.06 (s, 1H), 5.53 (s, 1H), 3.99 (s, 1H), 2.69 (d, J = 6.2 Hz, 2H), 2.64–2.67 (m, 1H), 2.61 (t, J = 6.2 Hz, 1H), 1.75–1.79 (m, 2H), 1.49–1.53 (m, 2H), 1.36 (s, 3H), 1.28 (s, 6H), 1.16 (s, 3H). 13C NMR (150 MHz, CDCl3), δ: 209.0, 166.7, 160.4, 150.7, 143.4, 141.3, 120.0, 119.2, 109.8, 104.1, 86.5, 77.9, 67.4, 54.3, 53.4, 49.5, 49.4, 42.0, 38.6, 37.8, 31.8, 29.3, 25.0, 20.4, 19.3, 15.8. The above data are consistent with those reported in Reference [51], thus the compound is identified as jangomolide.
Compound IV: limonin ((1R,2R,7S,10R,13R,14R,16S,19S,20S)-19-(furan-3-yl)-9,9,13,20-tetramethyl-4,8,15,18-tetraoxahexacyclo[11.9.0.02,7.02,10.014,16.014,20]docosane-5,12,17-trione), white plate-like crystals, mp 289~291 °C. ESI-MS m/z: [M+H]+ 471.2020 (calcd for C26H30O8, 471.2019). 1H NMR (600 MHz, DMSO-d6), δ: 7.72 (s, 1H), 7.66 (t, J = 1.7 Hz, 1H), 6.51 (d, J = 1.0 Hz, 1H), 5.48 (s, 1H), 4.92 (d, J = 11.9 Hz, 1H), 4.48 (d, J = 13.0 Hz, 1H), 4.11 (d, J = 5.7 Hz, 2H), 3.12 (t, J = 15.3 Hz, 1H), 2.77 (d, J = 15.1 Hz, 1H), 2.62 (dd, J = 16.4, 4.1 Hz, 1H), 2.57 (dd, J = 12.5, 3.4 Hz, 1H), 2.46 (dd, J = 15.7, 3.4 Hz, 1H), 2.28 (dd, J = 14.9, 3.4 Hz, 1H), 1.79–1.86 (m, 1H), 1.69–1.75 (m, 2H), 1.22–1.26 (m, 1H), 1.19 (s, 3H), 1.11 (s, 3H), 1.02 (s, 3H), 1.00 (s, 3H). 13C NMR (150 MHz, DMSO-d6), δ: 208.1, 170.2, 167.3, 143.4, 141.7, 120.2, 110.2, 79.5, 78.4, 77.4, 66.7, 64.8, 58.0, 53.7, 50.3, 46.5, 45.3, 37.6, 36.2, 35.7, 29.8, 29.2, 21.4, 19.7, 17.5, 17.0. The above data are consistent with those reported in Reference [48], thus the compound is identified as limonin.
Compound V: obacunone ((1R,2R,4S,7S,8S,11R,12R,18R)-7-(furan-3-yl)-1,8,12,17,17-pentamethyl-3,6,16-trioxapentacyclo[9.9.0.02,4.02,8.012,18]icos-13-ene-5,15,20-trione), colorless crystals, mp 229~231 °C. ESI-MS m/z: [M+H]+ 455.2070 (calcd for C26H30O7, 455.2070). 1H NMR (600 MHz, MeOD), δ: 7.54 (s, 1H), 7.50 (t, J = 1.8 Hz, 1H), 6.78 (d, J = 11.8 Hz, 1H), 6.46 (d, J = 1.1 Hz, 1H), 5.93 (d, J = 11.8 Hz, 1H), 5.54 (s, 1H), 3.69 (s, 1H), 3.14 (t, J = 14.1 Hz, 1H), 2.73 (dd, J = 14.1, 5.0 Hz, 1H), 2.29 (dd, J = 14.1, 5.0 Hz, 1H), 2.14–2.25 (m, 2H), 1.87–1.95 (m, 3H), 1.52 (s, 3H), 1.50 (s, 3H), 1.44 (s, 3H), 1.28 (s, 3H), 1.12 (s, 3H). 13C NMR (150 MHz, MeOD), δ: 209.7, 169.7, 169.4, 160.1, 144.4, 142.7, 122.7, 121.8, 111.0, 86.1, 79.7, 66.6, 58.2, 54.4, 54.3, 50.3, 44.6, 40.9, 38.7, 33.6, 32.2, 27.1, 21.4, 20.4, 17.3, 16.8. The above data are consistent with those reported in Reference [52], thus the compound is identified as obacunone.
Compound VI: fraxinellone ((3R,3aR)-3-(furan-3-yl)-3a,7-dimethyl-3,4,5,6-tetrahydr-o-2-benzofuran-1-one), white needle crystals, mp 114~116 °C. ESI-MS m/z: [M+H]+ 233.1176 (calcd for C14H16O3, 233.1178). 1H NMR (600 MHz, CDCl3), δ: 7.47 (s, 1H), 7.43 (t, J = 1.8 Hz, 1H), 6.34 (d, J = 1.1 Hz, 1H), 4.88 (s, 1H), 2.23–2.31 (m, 1H), 2.14–2.30 (m, 1H), 2.13 (s, 3H), 1.78–1.89 (m, 2H), 1.69–1.77 (m, 1H), 1.41–1.49 (m, 1H), 0.85 (s, 3H). 13C NMR (150 MHz, CDCl3), δ: 170.0, 148.7, 143.5, 139.9, 127.5, 120.8, 108.7, 83.5, 43.1, 32.2, 31.8, 20.5, 18.6, 18.4. The above data are consistent with those reported in Reference [48], thus the compound is identified as fraxinellone.
Compound VII: fraxinellonone ((3R,3aR)-3-(furan-3-yl)-3a,7-dimethyl-4,5-dihydro-3H-2-benzofuran-1,6-dione), colorless needle and plate-like crystals, mp 119~121 °C, ESI-MS m/z: [M+H]+ 247.0966 (calcd for C14H14O4, 247.0970). 1H NMR (600 MHz, DMSO-d6), δ: 7.78 (s, 1H), 7.76 (t, J = 1.7 Hz, 1H), 6.57 (d, J = 2.2 Hz, 1H), 5.35 (s, 1H), 2.66–2.75 (m, 1H), 2.43–2.49 (m, 1H), 2.18–2.27 (m, 1H), 2.02 (s, 3H), 1.89–1.96 (m, 1H), 1.01 (s, 3H). 13C NMR (150 MHz, DMSO-d6), δ: 198.3, 168.7, 145.1, 144.2, 140.6, 137.6, 119.4, 109.0, 81.8, 43.4, 32.6, 30.8, 18.5, 9.7. The above data are consistent with those reported in References [52,53], thus the compound is identified as fraxinellonone.
Compound VIII: preskimmianine (4,7,8-trimethoxy-3-(3-methylbut-2-enyl)-1H-qui-nolin-2-one), white plate-like crystals, mp 122~124 °C. ESI-MS m/z: [M+H]+ 304.1546 (calcd for C17H21NO4, 304.1549). 1H NMR (600 MHz, DMSO-d6), δ: 10.85 (s, 1H), 7.41 (d, J = 9.0 Hz, 1H), 7.00 (d, J = 9.0 Hz, 1H), 5.16 (t, J = 7.8 Hz, 1H), 3.89 (s, 3H), 3.84 (s, 3H), 3.77 (s, 3H), 3.19 (d, J = 7.0 Hz, 2H), 1.73 (s, 3H), 1.64 (s, 3H). 13C NMR (150 MHz, DMSO-d6), δ: 163.6, 160.8, 152.7, 133.9, 132.0, 131.1, 122.0, 119.6, 118.2, 111.0, 107.6, 61.5, 60.6, 56.1, 25.5, 22.8, 17.8. The above data are consistent with those reported in References [50,54], thus the compound is identified as preskimmianine.
Compound IX: acetovanillone (1-(4-hydroxy-3-methoxyphenyl)ethenone), light yellow oily substance. ESI-MS m/z: [M+H]+ 167.0708 (calcd for C9H10O3, 167.0708). 1H NMR (600 MHz, CD3OD), δ: 7.56 (dd, J = 8.3, 2.1 Hz, 1H), 7.52 (d, J = 2.1 Hz, 1H), 6.82 (d, J = 8.3 Hz, 1H), 3.89 (s, 3H), 2.53 (s, 3H). 13C NMR (150 MHz, CD3OD), δ: 199.4, 154.9, 149.4, 129.8, 125.5, 116.1, 111.8, 56.3, 26.1. The above data are consistent with those reported in Reference [55], thus the compound is identified as acetovanillone.
Compound X: isodictamdiol C ((1R,4R,6R,8aR)-1-(furan-3-yl)-4,6-dihydroxy-5,8a-dimethyl-1,4,6,7,8,8a-hexahydro-3H-isochromen-3-one), light yellow solid. ESI-MS m/z: [M+K]+ 301.1045(calcd for C15H18O5, 301.1052). 1H NMR (600 MHz, DMSO-d6), δ: 7.71 (s, 1H), 7.67 (t, J = 1.8 Hz, 1H), 6.50 (d, J = 1.8 Hz, 1H), 5.72 (d, J = 5.5 Hz, 1H), 5.03 (s, 1H), 4.85 (d, J = 5.2 Hz, 1H), 4.81 (d, J = 5.7 Hz, 1H), 3.75 (s, 1H), 1.80 (s, 3H), 1.54–1.62 (m, 2H), 1.23 (s, 1H), 0.88 (s, 3H), 0.80 (dt, J = 12.5, 3.3 Hz, 1H). 13C NMR (150 MHz, DMSO-d6), δ: 173.5, 143.3, 141.4, 135.0, 133.8, 120.9, 110.1, 79.8, 65.8, 64.9, 38.0, 26.9, 26.5, 17.1, 15.5. The above data are consistent with those reported in Reference [56], thus the compound is identified as isodictamdiol C.
Compound XI: dictamdiol B ((1R,4S,6R,8aR)-1-(furan-3-yl)-4,6-dihydroxy-5,8a-dim-ethyl-4,6,7,8-tetrahydro-1H-isochromen-3-one), yellowish oil. ESI-MS m/z: [M+K]+ 301.1051 (calcd for C15H18O5, 301.1052). 1H NMR (600 MHz, DMSO-d6), δ: 7.73 (s, 1H), 7.68 (t, J = 1.7 Hz, 1H), 6.52 (d, J = 1.8 Hz, 1H), 6.37 (d, J = 4.8 Hz, 1H), 5.44 (s, 1H), 4.82 (d, J = 7.0 Hz, 1H), 4.65 (d, J = 4.3 Hz, 1H), 3.85 (q, J = 7.6 Hz, 1H), 1.88–1.94 (m, 1H), 1.73 (s, 3H), 1.57–1.65 (m, 1H), 1.44 (td, J = 13.8, 3.3 Hz, 1H), 0.97 (dt, J = 12.5, 3.3 Hz, 1H), 0.94 (s, 3H). 13C NMR (150 MHz, DMSO-d6), δ: 170.8, 143.4, 141.5, 138.0, 133.6, 120.0, 110.1, 78.5, 68.4, 66.2, 38.7, 31.2, 27.8, 18.4, 14.1. The above data are consistent with those reported in Reference [57], thus the compound is identified as dictamdiol B.
Compound XII: dictamalkoside A (9-methyl-6-(((2S,3R,4S,5S,6R)-3,4,5-trihydroxy-6-(hydroxymethyl)tetrahydro-2H-pyran-2-yl)oxy)furo[2,3-b]quinolin-4(9H)-one), yellow powder. ESI-MS m/z: [M+H]+ 378.1190 (calcd for C18H19NO8, 378.1189). 1H NMR (600 MHz, DMSO-d6), δ: 7.89 (d, J = 2.9 Hz, 1H), 7.79 (d, J = 9.2 Hz, 1H), 7.75 (d, J = 2.2 Hz, 1H), 7.54 (dd, J = 9.2, 3.0 Hz, 1H), 7.01 (d, J = 2.2 Hz, 1H), 4.94 (d, J = 7.4 Hz, 1H), 3.92 (s, 3H), 3.66–3.71 (m, 1H), 3.51 (dt, J = 11.4, 5.4 Hz, 1H), 3.34–3.35 (m, 1H), 3.33 (s, 1H), 3.29 (s, 1H), 3.16–3.25 (m, 1H). 13C NMR (150 MHz, DMSO-d6), δ: 171.1, 155.7, 153.0, 139.2, 133.5, 125.6 122.3, 117.1, 111.5, 107.2, 104.9, 101.4, 77.1, 76.5, 73.3, 69.6, 60.6, 31.6. The above data are consistent with those reported in Reference [58], thus the compound is identified as dictamalkoside A.
Compound XIII: 3-[1β-hydroxy-2-(β-D-glucopyranosyloxy)-ethyl)-4-methoxy2(1H)-Quinolinone (3-((R)-1-hydroxy-2-(((2R,3R,4S,5S,6R)-3,4,5-trihydroxy-6-(hydroxymethyl)-tetrahydro-2H-pyran-2-yl)oxy)ethyl)-4-methoxyquinolin-2(1H)-one), Yellowish gum. ESI-MS m/z: [M+H]+ 398.1450 (calcd for C18H23NO9, 398.1451). 1H NMR (600 MHz, DMSO-d6), δ: 7.74 (dd, J = 8.1, 1.4 Hz, 1H), 7.53 (ddd, J = 8.4, 7.1, 1.4 Hz, 1H), 7.35 (d, J = 8.6 Hz, 1H), 7.21–7.25 (m, 1H), 5.10 (td, J = 7.1, 4.6 Hz, 1H), 4.24 (d, J = 7.8 Hz, 1H), 3.92–3.99 (m, 5H), 3.63 (dq, J = 11.8, 2.1 Hz, 1H), 3.41 (dt, J = 11.4, 5.5 Hz, 2H), 3.12–3.17 (m, 1H), 3.09 (ddd, J = 9.9, 5.9, 2.2 Hz, 1H), 3.02 (td, J = 9.2, 3.7 Hz, 1H), 2.96 (td, J = 8.3, 3.1 Hz, 1H). 13C NMR (150 MHz, DMSO-d6), δ: 163.4, 162.4, 138.3, 130.8, 123.1, 122.0, 121.5, 116.0, 115.5, 103.5, 76.9, 76.6, 73.6, 72.4, 70.0, 65.9, 63.0, 61.1. The above data are consistent with those reported in Reference [59], thus the compound is identified as 3-[1β-hydroxy-2-(β-D-glucopyranosyloxy)-ethyl)-4-methoxy2(1H)-quinolinone.
Compound XIV: 9α-hydroxyfraxinellone-9-O-β-D-glucoside ((3R,3aR,6R)-3-(3-Fura-nyl)-6-(β-D-glucopyranosyloxy)-3a,4,5,6-tetrahydro-3a,7-dimethyl-1(3H)-isobenzofuranone), yellowish oil. ESI-MS m/z: [M+H]+ 411.1655 (calcd for C20H26O9, 411.1655). 1H NMR (600 MHz, DMSO-d6), δ: 7.72 (d, J = 2.1 Hz, 2H), 6.52 (s, 1H), 5.01 (s, 1H), 4.39 (d, J = 7.8 Hz, 1H), 4.01 (d, J = 4.4 Hz, 1H), 3.68 (d, J = 11.6 Hz, 1H), 3.40–3.48 (m, 1H), 3.12–3.18 (m, 2H), 3.04 (t, J = 9.3 Hz, 1H), 2.94–2.99 (m, 1H), 2.27 (dq, J = 14.6, 2.9 Hz, 1H), 2.17 (s, 3H), 1.80 (tt, J = 14.5, 4.0 Hz, 1H), 1.63 (td, J = 13.4, 3.3 Hz, 1H), 1.49 (dt, J = 12.5, 3.5 Hz, 1H), 0.76 (s, 3H). 13C NMR (150 MHz, DMSO-d6), δ: 169.1, 145.4, 143.9, 140.3, 129.9, 120.2, 109.1, 105.9, 82.2, 76.8, 76.8, 76.0, 73.7, 70.0, 61.1, 42.8, 26.7, 25.8, 18.8, 15.1. The above data are consistent with those reported in Reference [57], thus the compound is identified as 9α-hydroxyfraxinellone-9-O-β-D-glucoside.
Compound XV: haploperoside A (6-methoxy-7-[(2S,3R,4S,5S,6R)-3,4,5-trihydroxy-6-[[(2R,3R,4R,5R,6S)-3,4,5-trihydroxy-6-methyloxan-2-yl]oxymethyl]oxan-2-yl]oxychromen-2-one), white crystals. ESI-MS m/z: [M+H]+ 501.1605 (calcd for C22H28O13, 501.1608). 1H NMR (600 MHz, DMSO-d6), δ: 7.99 (d, J = 9.5 Hz, 1H), 7.31 (s, 1H), 7.15 (s, 1H), 6.35 (d, J = 9.4 Hz, 1H), 5.39 (d, J = 4.3 Hz, 1H), 5.21 (d, J = 4.9 Hz, 2H), 5.06 (d, J = 7.6 Hz, 1H), 4.67 (d, J = 5.4 Hz, 1H), 4.56 (d, J = 4.3 Hz, 1H), 4.50 (d, J = 1.6 Hz, 1H), 4.41 (d, J = 5.6 Hz, 1H), 3.82 (s, 4H), 3.55–3.61 (m, 2H), 3.52 (ddd, J = 9.2, 5.6, 3.4 Hz, 1H), 3.41 (td, J = 10.5, 6.4 Hz, 2H), 3.29 (s, 2H), 3.14 (s, 2H), 1.06 (d, J = 6.2 Hz, 3H). 13C NMR (150 MHz, DMSO-d6), δ: 160.9, 149.9, 148.8, 146.1, 144.4, 113.3, 112.4, 109.8, 103.2, 100.4, 99.8, 76.7, 75.5, 73.0, 71.8, 70.6, 70.4, 69.7, 68.3, 66.0, 56.0, 17.8. The above data are consistent with those reported in References [60,61], thus the compound is identified as haploperoside A.
Compound XVI: 4-hydroxy-3-methoxy-acetophenone-4-O-α-L-rhamnopyranosyl-(1→6)-β-D-glucopyranoside (1-(3-methoxy-4-(((2S,3R,4S,5S,6R)-3,4,5-trihydroxy-6-((((2R,3R,4R,5R,6S)-3,4,5-trihydroxy-6-methyltetrahydro-2H-pyran-2-yl)oxy)methyl)tetrahydro-2H-pyran-2-yl)oxy)phenyl)ethan-1-one), white powder. ESI-MS m/z: [M+Na]+ 497.1635 (calcd for C21H30O12, 497.1635). 1H NMR (600 MHz, DMSO-d6), δ: 7.59 (dd, J = 8.5, 2.1 Hz, 1H), 7.47 (d, J = 2.1 Hz, 1H), 7.13 (d, J = 8.5 Hz, 1H), 5.37 (s, 1H), 5.20 (s, 2H), 5.01 (d, J = 7.5 Hz, 1H), 4.75 (d, J = 5.4 Hz, 1H), 4.66 (d, J = 4.3 Hz, 1H), 4.54–4.59 (m, 1H), 4.52 (d, J = 1.6 Hz, 1H), 3.83 (s, 4H), 3.57 (q, J = 2.6 Hz, 1H), 3.52 (ddd, J = 9.4, 7.2, 1.8 Hz, 1H), 3.38–3.47 (m, 3H), 3.29 (d, J = 4.7 Hz, 2H), 3.17 (td, J = 9.3, 3.8 Hz, 1H), 3.07–3.14 (m, 1H), 2.54 (s, 3H), 1.10 (d, J = 6.2 Hz, 3H). 13C NMR (150 MHz, DMSO-d6), δ: 196.5, 150.5, 148.7, 131.0, 122.7, 114.4, 111.0, 100.7, 99.6, 76.8, 75.7, 73.1, 72.0, 70.7, 70.4, 69.9, 68.5, 66.6, 55.6, 26.5, 17.9. The above data are consistent with those reported in Reference [62], thus the compound is identified as 4-hydroxy-3-methoxy-acetophenone-4-O-α-L-rhamnopyranosyl-(1→6)-β-D-Glucopyranoside.
Compound XVII: (+)-lyoniresinol-3α-O-β-D-glucopyranoside ((2R,3R,4S,5S,6R)-2-(((1S,2R,3R)-7-hydroxy-1-(4-hydroxy-3,5-dimethoxyphenyl)-3-(hydroxymethyl)-6,8-dimethoxy-1,2,3,4-tetrahydronaphthalen-2-yl)methoxy)-6-(hydroxymethyl)tetrahydro-2H-pyra-n-3,4,5-triol), amorphous powder. ESI-MS m/z: [M−H]− 581.2225 (calcd for C28H38O13, 581.2234). 1H NMR (600 MHz, DMSO-d6) δ: 6.54 (s, 1H), 6.34 (s, 2H), 4.29 (d, J = 5.8 Hz, 1H), 4.16 (d, J = 7.8 Hz, 1H), 3.76 (s, 3H), 3.67–3.71 (m, 1H), 3.64–3.67 (m, 1H), 3.64 (s, 6H), 3.48–3.52 (m, 1H), 3.38–3.44 (m, 1H), 3.33–3.36 (m, 1H), 3.28 (s, 3H), 3.24–3.27 (m, 1H), 3.11–3.18 (m, 2H), 3.03–3.10 (m, 2H), 2.98–3.03 (m, 1H), 2.62 (dd, J = 15.1, 4.4 Hz, 1H), 1.94–1.99 (m, 1H), 1.44–1.53 (m, 1H). 13C NMR (150 MHz, DMSO-d6) δ: 147.5 × 2, 146.9, 146.5, 137.5, 137.3, 133.3, 128.4, 124.9, 106.7, 105.9 × 2, 103.4, 76.9, 76.9, 73.5, 70.1, 69.6, 64.0, 61.1, 58.9, 56.1 × 2, 55.7, 44.4, 40.6, 40.1, 32.4. The above data are consistent with those reported in Reference [63], thus the compound is identified as (+)-lyoniresinol-3α-O-β-D-glucopyranoside.
3.2. Chromatographic and Mass Spectrometric Characterization
Based on the high-resolution data acquired from UPLC-Q-TOF-MS in both positive and negative ion modes, we analyzed the chemical constituents of the DC ethanolic extract. By comparing with reference standards and literature data, a total of 41 compounds were tentatively identified (Table 2), 17 of which were confirmed by comparison with reference compounds isolated in this study. The base peak intensity (BPI) chromatogram of the ethanolic extract is shown in Figure 2. The majority of these constituents were alkaloids and limonoids, with minor amounts of glycosides.
Table 2.
UPLC-Q-TOF-MS characterization of chemical components in DC ethanol extract and its transdermal permeants.
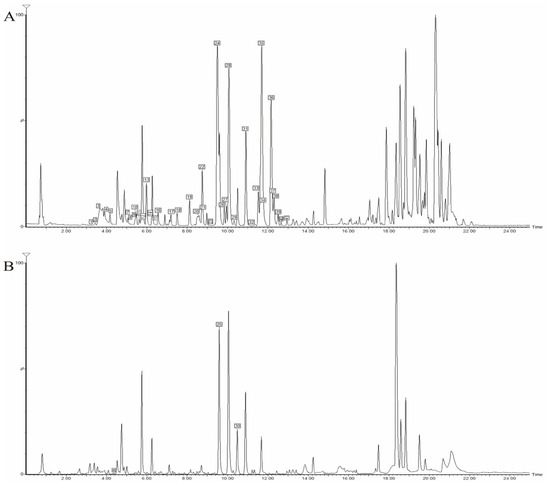
Figure 2.
UPLC-Q-TOF-MS BPI chromatogram of DC extracted thick paste. (A) Positive ion mode; (B) Negative ion mode.
We next analyzed the transdermal permeate. Its base peak intensity (BPI) chromatogram is displayed in Figure 3. A total of 26 constituents were detected. Alkaloids were the most abundant transdermal constituents, including dictamnine, γ-fagarine, isomaculosidine, and isopteleine, followed by limonoids such as limonin, evodol, and rutaevin. Analysis in positive ion mode provided more comprehensive information for constituent characterization.
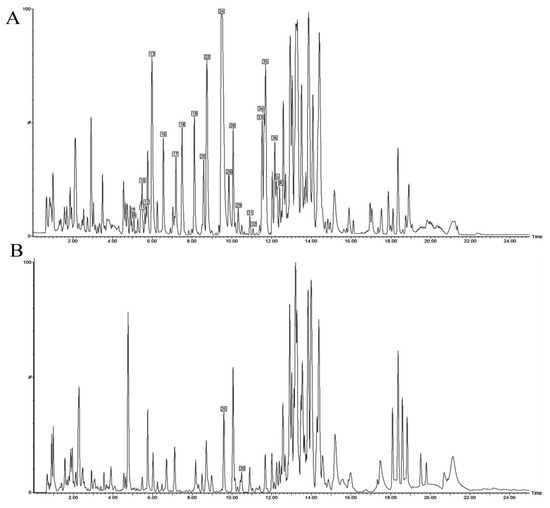
Figure 3.
UPLC-Q-TOF-MS BPI chromatogram of transdermal sample of DC extracted thick paste. (A) Positive ion mode; (B) Negative ion mode.
3.3. Identification and Analysis of Representative Compounds of Alkaloids and Limonoids
Limonin and obacunone are both limonoids, with primary fragmentation pathways involving the loss of H2O, CO, and CO2, and sharing a common characteristic fragment ion at m/z 161. Limonin (28, all numbering refers to Table 2) displayed a characteristic [M+H]+ ion at m/z 471.2020 (C26H30O8; calculated: 471.2019; error: −0.21 ppm). Fragment ions included m/z 427 [M+H-CO2]+, 425 [M+H-CO-H2O]+, and 161 [M+H-C16H22O6]+. Compound 35 (obacunone) showed a protonated molecular ion peak at m/z 455.2070 [M+H]+ (C26H30O7; calculated: 455.2070; error: 0.00 ppm). Fragment ions included m/z 437 [M+H-H2O]+, 411 [M+H-CO2]+, 409 [M+H-CO-H2O]+, and 161 [M+H-C16H22O5]+ [67].
Quinoline alkaloids in DC contain methoxy and carbonyl groups, exhibiting characteristic fragmentation pathways involving the loss of CO (carbonyl), CH3 (methyl), or combinations thereof (e.g., CO+CH3, 2×CO, 2×CH3). These constituents typically generate fragment ions at m/z 200, 201, or 202. The [M+H]+ peak of γ-fagarine (22) was observed at m/z 230.0817 (C13H11NO3; calculated: 230.0817; error: 0.00 ppm). Fragment ions included m/z 215 [M+H-CH3]+, 200 [M+H-2CH3]+, 172 [M+H-2CH3-CO]+, and 144 [M+H-2CH3-2CO]+. Dictamnine (24) exhibited a prominent [M+H]+ signal at m/z 200.0713 (C12H9NO2; calculated: 200.0712; error: −0.50 ppm) in positive ion mode. Fragment ions included m/z 185 [M+H-CH3]+, 157 [M+H-CH3-CO]+, and 129 [M+H-CH3-2CO]+ [65]. Based on characteristic fragmentation patterns and previous studies, compound 22 was identified as γ-fagarine and compound 24 as dictamnine. Figure 4 shows the specific fragmentation patterns.
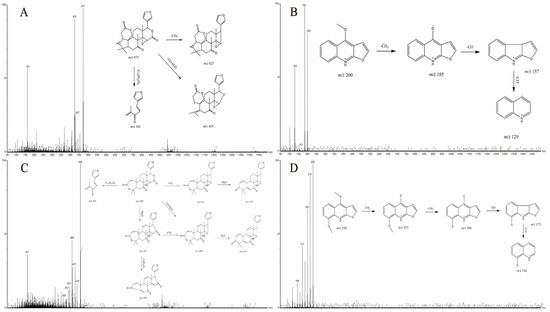
Figure 4.
Secondary mass spectra and possible fragmentation patterns of (A) Limonin (B) Dictamnine (C) Obacunone, and (D) γ-fagarine.
3.4. Integrated Network Pharmacological and Molecular Docking Evaluation
3.4.1. Targeted Prediction of Transdermal Constituents of DC
Among the 26 transdermal constituents of DC, a total of 20 compounds could obtain the predicted targets. According to the predetermined screening criteria, 976 targets of transdermal constituents of DC were determined (361 targets after combining and de-weighting). The “transdermal constituent-target” interaction network was constructed with Cytoscape software (version 3.10.2; Figure 5A). In this network, diamond nodes represent transdermal constituents of DC, rectangular nodes represent constituent targets, and each edge denotes a compound-target interaction. Node degree reflects the number of edges incident to a node. A higher node degree indicates more connected compounds or targets, and thus suggesting a higher likelihood of being a key compound or target [72]. Node color intensity in the network diagram correlates with degree value, with darker colors indicating higher degrees. 8-methoxy-N-methylflindersine, preskimmianine, and 8-methoxyflindersine interacted with the largest number of target proteins, with degree values of 112, 107, and 107, respectively. Among the target proteins, ADORA2B exhibited the highest degree value (12), representing the potential key target with the highest connectivity.
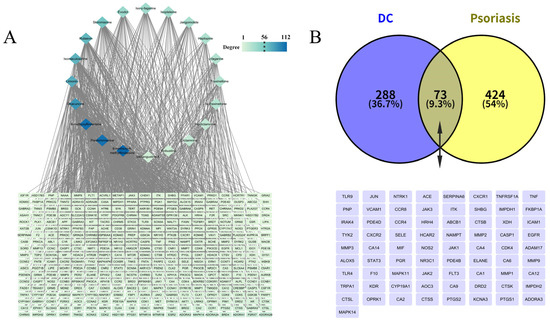
Figure 5.
(A) DC “transdermal constituents-targets” network diagram; (B) Venn diagram of intersection targets between transdermal constituents and diseases.
Comparative analysis revealed 73 common targets between the 361 percutaneous constituent targets and 497 psoriasis-associated targets curated from DrugBank, GeneCards, TTD, and OMIM databases (Figure 5B). These shared targets, including mitogen-activated protein kinase 14 (MAPK14), adenosine A3 receptor (ADORA3), prostaglandin-endoperoxide synthase 1 (PTGS1), potassium voltage-gated channel subfamily A member 3 (KCNA3), prostaglandin-endoperoxide synthase 2 (PTGS2), represent potential therapeutic mediators of DC’s transdermal components in psoriasis management.”
3.4.2. PPI Network Topology and Central Target Identification
The 73 candidate targets were analyzed using the STRING platform to generate a PPI network (Figure 6A), comprising 69 interconnected nodes with 538 edges. Target networks were subjected to topological analysis and visualization in Cytoscape (version 3.10.2). Median values of node degree, closeness centrality, and betweenness centrality were used as cutoff thresholds. Nodes with values greater than or equal to the median for all three parameters were identified as core targets, resulting in 24 core targets. Network analysis revealed positive correlations between node value magnitude and both visual parameters (size and color gradient), as demonstrated in Figure 6B. Subsequently, the top five core targets were selected as target proteins for molecular docking: tumor necrosis factor (TNF), matrix metalloproteinase-9 (MMP9), Toll-like receptor 4 (TLR4), intercellular adhesion molecule-1 (ICAM-1), and epidermal growth factor receptor (EGFR).
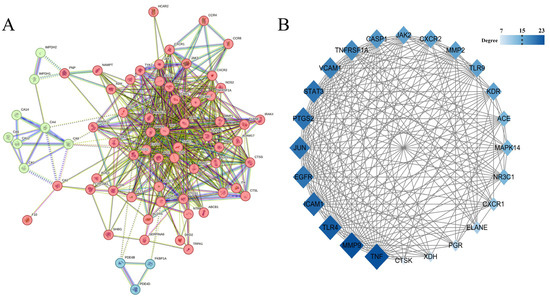
Figure 6.
(A) PPI network, the colors are obtained based on k-means clustering analysis; (B) Core target network.
In the TNF family, TNF-α is primarily secreted by monocytes and macrophages, while TNF-β is produced by activated T cells. TNF-α is not only a core driver of the inflammatory response but also induces the aberrant secretion of pro-inflammatory cytokines (e.g., IL-17 and IL-23) and promotes keratinocyte hyperproliferation. It critically regulates psoriasis pathogenesis [46]. TLR4 initiates MyD88-dependent signaling pathways by forming a complex with the adaptor protein MyD88, which in turn activates the nuclear factor-κB (NF-κB) canonical signaling pathway, induces the secretion of pro-inflammatory factors, and promotes the development and progression of psoriasis. NF-κB phosphorylation can directly regulate MMP9 transcriptional activation, which activates dermal vascular endothelial cells, leading to vasodilation and increased vascular permeability, thereby contributing to the formation of psoriatic lesions [73,74]. ICAM-1, a transmembrane adhesion molecule expressed on T cells and keratinocytes, mediates T cell infiltration in psoriatic lesions. Clinical studies have demonstrated elevated ICAM-1 levels in serum and lesional keratinocytes of psoriasis patients [75,76]. EGFR is a receptor tyrosine kinase widely expressed in skin tissues, serving as a key regulator of epidermal cell proliferation, differentiation, migration, and inflammation. EGFR and its ligands (e.g., TGF-α, amphiregulin, and HB-EGF) are aberrantly overexpressed and activated in the epidermis of active psoriatic lesions, indicating that EGFR-mediated hyperstimulation of keratinocytes may contribute to the development of psoriatic lesions, highlighting the important role of EGFR in psoriasis pathogenesis [77,78].
Other core targets, including JUN, STAT3, and PTGS2, are also closely associated with the pathogenesis of psoriasis. The c-Jun protein is a key transcriptional component of the activator protein-1 (AP-1) complex. Its activation regulates cell proliferation, apoptosis, and other cellular processes, and can enhance AP-1 activity to promote inflammatory responses [79,80]. PTGS2 is highly expressed in psoriatic lesions, and its encoded cyclooxygenase-2 (COX-2) participates in inflammatory responses by catalyzing the metabolism of arachidonic acid to generate prostaglandin inflammatory mediators [81]. STAT3 is a recognized potential therapeutic target in psoriasis. STAT3 activation drives Th17 cell differentiation and production of pro-inflammatory cytokines (IL-17, IL-23), critically regulating disease progression and cellular proliferation [82,83]. The core targets were shown to be essential for the efficacy of the transdermal components of DC in the treatment of psoriasis.
3.4.3. Bioinformatic Analysis of Functional Annotations and Pathways
To elucidate DC transdermal components’ anti-psoriatic mechanisms, we conducted GO/KEGG analyses on 24 core targets. GO enrichment revealed 509 significant terms (p < 0.01). Of these, 456 terms were associated with BPs, including “cellular response to cytokine stimulus”, “cellular response to lipid”, “positive regulation of smooth muscle cell proliferation”; 21 terms were related to CCs, including “external side of plasma membrane”, “side of membrane”, “membrane raft”; and 32 terms were associated with MFs, including “cytokine binding”, “serine-type peptidase activity”, “serine hydrolase activity”. Figure 7A displays the top-ranked terms, including 20 biological processes and 10 entries each for cellular components and molecular functions. GO enrichment analysis suggested that DC constituents might modulate inflammatory signaling pathways, down-regulate vascular smooth muscle proliferation and extracellular matrix degradation by inhibiting cellular responses to cytokines, lipid stimulation, and inflammatory stimuli. These effects may alleviate psoriatic inflammation and erythema. DC constituents may also target membrane-associated constituents, affect membrane receptor complexes, regulate cellular signal transduction, modulate enzyme activities, reduce inflammatory mediator release, and improve psoriatic symptoms.
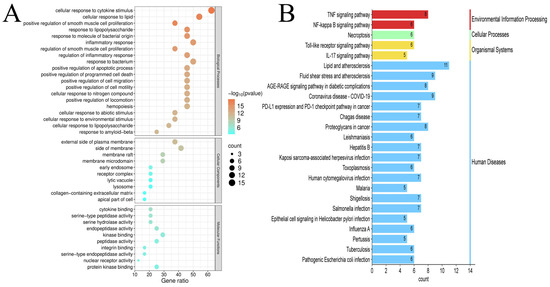
Figure 7.
(A) GO analysis; (B) KEGG analysis.
KEGG pathway analysis identified 84 significant pathways (p < 0.01). The enrichment bar graph showed the top 25 pathways enriched in KEGG for 24 key genes (Figure 7B). Multiple key targets were associated with pathways, including “Lipid and Atherosclerosis”, “Fluid Shear Stress and Atherosclerosis”, “AGE-RAGE signaling pathway in diabetic complications”, “TNF signaling pathway”, and “Coronavirus disease-COVID-19”. KEGG pathway prediction suggests that DC modulates multiple immune and inflammatory pathways. Its transdermal constituents may alleviate psoriatic inflammation and keratinocyte hyperproliferation through multiple mechanisms, including inhibiting inflammatory signaling pathways (e.g., IL-17, TNF, and NF-κB pathways), regulating immune dysregulation (e.g., PD-1/PD-L1 checkpoint signaling), modulating oxidative stress (e.g., AGE-RAGE signaling), and promoting epidermal barrier repair.
Psoriasis is characterized by keratinocyte hyperproliferation, aberrant differentiation, T-cell infiltration, and increased inflammatory mediators in epidermal tissue. The TNF signaling pathway regulates inflammatory and immune responses. In the presence of pro-inflammatory signals, the expression of multiple TNF superfamily ligands and receptors is upregulated in immune cells. Binding of TNF superfamily ligands to their respective receptors on target cells initiates an intracellular signaling cascade that activates key transcription factors, including NF-κB and AP-1. This orchestrates transcription that promotes inflammation and immune effector functions [84]. The NF-κB signaling pathway is divided into canonical and noncanonical pathways. When activated, the canonical NF-κB pathway mediates responses to various external stimuli involved in inflammatory responses, immune regulation, cell proliferation, differentiation, and survival. Accumulating evidence has established a critical role of the NF-κB signaling pathway in psoriasis pathogenesis. The NF-κB noncanonical pathway plays a key role in immune cell development at multiple levels [85,86,87]. Impaired immune tolerance is considered a pathogenic factor in psoriasis and related immune-mediated diseases. The programmed cell death protein 1 (PD-1) receptor critically maintains immune tolerance through PD-L1/PD-L2 interactions, preventing immune-mediated disorders. Emerging evidence has implicated the PD-1/PD-L1 axis in psoriasis pathogenesis [88,89]. In addition, additional enriched pathways include the “AGE-RAGE signaling pathway in diabetic complications”, “Lipid and Atherosclerosis”, “Fluid Shear Stress and Atherosclerosis”, and “Coronavirus disease-COVID-19 pathway”. These findings suggest that psoriasis shares common signaling pathways with metabolic disorders, cardiovascular diseases, diabetes, and infectious diseases, indicating potential comorbidities.
3.4.4. Establishment and Evaluation of the “Transdermal Component-Core Target-Key Pathway” Multidimensional Network
We constructed a multidimensional “component-target-pathway” network model integrating 20 transdermal components, 24 core targets, and the top 25 DC-related KEGG pathways using network pharmacology approaches (Figure 8A; see Supplementary Material Table S1 for pathway details). In the network, diamonds represent targets, hexagons represent transdermal constituents, and polygons represent KEGG pathways. Edges represent interactions between nodes, with node color intensity indicating the interaction degree. The results showed that alkaloid constituents exhibited strong associations with targets including MAPK14, PTGS2, ELANE, JAK2, and TLR4, while limonoids were associated with targets including CTSK, KDR, NR3C1, and MMP9. MAPK14 demonstrated the highest connectivity with transdermal components and pathways, qualifying it as the candidate target for docking studies. The TNF, MAPK14, TLR4, and JUN were involved in over 15 key pathways, with TNF involved in 22 pathways and MAPK14 in 21 pathways. These findings suggest that DC exerts its anti-psoriatic effects through modulation of these key targets. Dictangustine A, fraxinellone, isofraxinellone, and robustine did not exhibit associations with the 24 core targets, so the top 16 constituents were selected for molecular docking. These network pharmacological findings indicate that the transdermal constituents of DC exert therapeutic effects on psoriasis through a multi-target, multi-pathway mechanism.
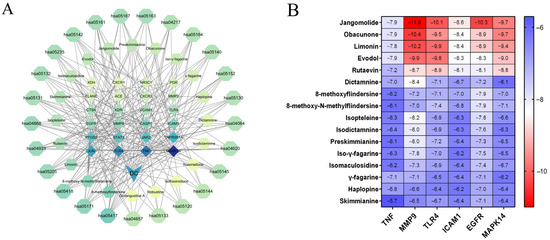
Figure 8.
(A) Multidimensional network diagram of “transdermal constituents-core targets-key pathways”, color intensity indicating the interaction degree; (B) Molecular docking heatmap of DC transdermal constituents.
3.4.5. Molecular Docking Verification Analysis
The top 5 key targets and MAPK14 were verified by molecular docking with 16 transdermal constituents of DC. Structural data were obtained from the PDB for TNF (5UUI), MMP9 (4XCT), TLR4 (4G8A), ICAM1 (2OZ4), EGFR (8A2D), and MAPK14 (5ETA). These targets were identified as potential therapeutic targets for psoriasis. Molecular docking between constituents and protein receptors was performed using AutoDock Vina. A lower Vina score indicates stronger binding activity, higher molecular affinity, and a more stable complex structure. The results showed that the main transdermal constituents exhibited negative binding energies and favorable docking poses with core targets, with detailed binding energy values provided in Figure 8B. All transdermal constituents displayed good docking affinity with protein receptors (Vina score < −5.0 kcal/mol).
As shown in the thermogram (Figure 8B), limonoids, such as jangomolide, obacunone, limonin, evodol, and rutaevin, exhibited better binding affinity than alkaloids. Alkaloids generally displayed similar binding affinity, with dictamnine showing better binding than other alkaloids. These findings suggest that these constituents in DC may play key roles in improving psoriasis, potentially through interactions with key targets including TNF, MMP9, TLR4, ICAM1, EGFR, and MAPK14. These six compounds were selected for subsequent in vitro activity screening.
Jangomolide exhibited the strongest binding affinity with MMP9 among all docking results, with a binding energy of −11.0 kcal/mol (1 kcal/mol = 4.184 kJ/mol). In the molecular docking analysis, dictamnine, jangomolide, obacunone, limonin, evodol, and rutaevin exhibited stable binding with MMP9 and low binding energy. These six compound-target pairs were selected for visualization using PyMoL (version 3.1.0) software.
As can be seen from the 3D model diagram (Figure 9), dictamnine forms five hydrogen bonds with residues of MMP9 between LEU243, HIS226, LEU222, TYR248, and MET247. Jangomolide forms three hydrogen bonds with residues of MMP9 between HIS236 and HIS226. Obacunone forms two hydrogen bonds with MMP9 at PRO246. Limonin forms four hydrogen bonds with residues of MMP9 between ALA191, ALA189, LEU188, and GLY186, and evodol forms four hydrogen bonds with residues of MMP9 between GLY186, LEU188, GLU227, and ALA191. rutaevin forms five hydrogen bonds with residues of MMP9 between ARG249, TYR248, GLY217, GLY213, and LYS214. The small molecules form stable complexes with the target protein’s binding pocket through a combination of hydrogen bonding and hydrophobic interactions.
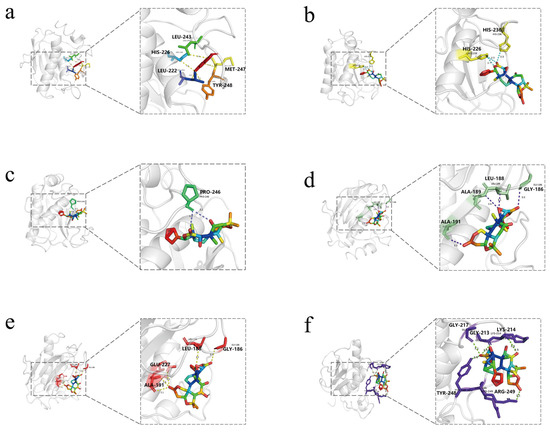
Figure 9.
Three-dimensional Visualization models of molecular docking with MMP9 for (a) Dictamnine; (b) Jangomolide; (c) Obacunone; (d) Limonin; (e) Evodol; (f) Rutaevin.
As shown by the thermogram (Figure 8B), the binding energy of the transdermal ingredient to the TLR4 protein was also mostly lower than that of the other proteins, except for the lower binding energy to the MMP9 protein. These findings indicated that MMP9 and TLR4 were key core targets for the anti-psoriatic effects of DC transdermal constituents. These targets demonstrated strong functional connections to NF-κB signaling, underscoring the central role of this pathway in psoriasis pathogenesis.
3.5. Analysis of In Vitro Test Results
3.5.1. Effect of TNF-α on HaCaT Cells
The HaCaT cell line is a human immortalized epidermal keratinocyte line, which has similar proliferation and differentiation characteristics to epidermal stem cells. It is widely used in skin disease research and is a suitable cell line for establishing psoriatic cell models. TNF-α, a key inflammatory cytokine in psoriasis, drives both keratinocyte proliferation and inflammatory cascades, mirroring disease pathology [46,90]. Therefore, TNF-α is commonly used to construct psoriatic cell models. Wang et al. [91] induced a psoriasis-like HaCaT cell model with 20 ng/mL TNF-α and found that genistein effectively inhibited abnormal proliferation of HaCaT cells and expression of inflammatory factors. In another study, Wang et al. [10] established a psoriasis-like HaCaT cell model using 100 ng/mL TNF-α, demonstrating that tanshinone I targets both inflammatory pathways and keratinocyte differentiation to ameliorate psoriasis-like dermatitis.
To mimic psoriatic conditions, HaCaT cells were stimulated with TNF-α (10–50 ng/mL, 24 h). We first evaluated its effect on proliferation via cell viability assays. TNF-α treatment (10–50 ng/mL) significantly enhanced HaCaT cell viability versus untreated controls, demonstrating a hyperproliferative response (Figure 10(Aa)). Compared with untreated HaCaT cells (cell count: 0.72 ± 0.02 × 10⁶ cells/mL), treatment with 10–50 ng/mL TNF-α significantly increased cell counts to 1.08 ± 0.02 × 10⁶, 1.85 ± 0.01 × 10⁶, 2.38 ± 0.02 × 10⁶, 1.10 ± 0.01 × 10⁶, and 1.14 ± 0.03 × 10⁶ cells/mL, respectively (Figure 10(Ab)). Among these, the 30 ng/mL TNF-α treatment produced the most potent growth-promoting effects on HaCaT cells. Therefore, the selected concentration was used to measure inflammatory mediators. Treated cells demonstrated markedly elevated IL-6 (Figure 10(Ac)) and IL-1β (Figure 10(Ad)) expression levels. These results indicated that cell proliferation and inflammatory responses were upregulated, confirming the successful establishment of the psoriatic cell model. Subsequently, 30 ng/mL TNF-α was used for subsequent modeling experiments.
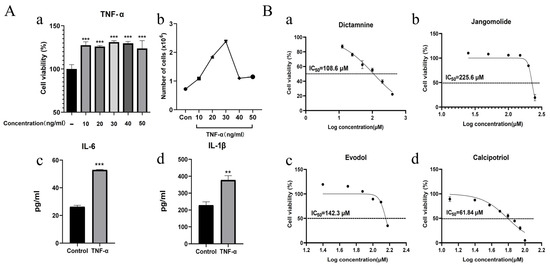
Figure 10.
(A) Establishment of psoriatic cell model; (a) TNF-α regulation of keratinocyte proliferation; (b) Cell counts of HaCaT cells treated with different concentrations of TNF-α for 24 h detected by direct cell counting; (c) IL-6 expression modulated by 30 ng/mL TNF-α; (d) IL-1β expression modulated by 30 ng/mL TNF-α. (B) Effects of (a) Dictamnin; (b) Jangomolide; (c) Evodol; (d) Calcipotriol on normal cells and their IC50 values. ** p < 0.01 (vs. normal), *** p < 0.001 (vs. normal).
3.5.2. Drug Concentration Screening
In HaCaT cells, different concentrations of dictamnine, jangomolide, obacunone, limonin, evodol, rutaevin, and calcipotriol (positive control) were added for intervention based on the compounds’ physicochemical properties to screen appropriate concentrations for subsequent experiments. The results indicated that the viability of HaCaT cells was influenced by compound specificity and concentration. Dictamnine demonstrated concentration-dependent inhibition of HaCaT cell viability in CCK-8 assays, with a calculated IC50 of 108.6 μM (24 h treatment; Figure 10(Ba)). Jangomolide inhibited HaCaT cell viability at higher concentrations, with a fitted IC50 value of 225.6 μM after 24 h of treatment (Figure 10(Bb)). Evodol exhibited a fitted IC50 value of 142.3 μM after 24 h of treatment (Figure 10(Bc)), while calcipotriol showed a fitted IC50 value of 61.84 μM (Figure 10(Bd)). Obacunone, limonin, and rutaevin exhibited no cytotoxic effects at the selected concentrations. Following viability screening (Figure 11), subsequent experiments employed compound concentrations of 50, 25, and 12.5 μM
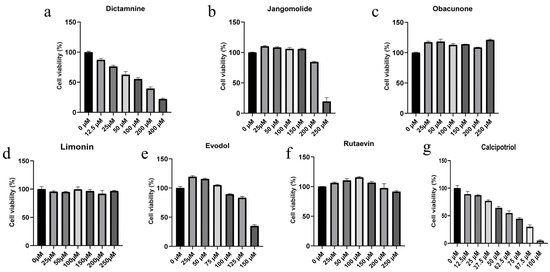
Figure 11.
Cytotoxic effects of different compounds on normal HaCaT Cells: (a) Dictamnine; (b) Jangomolide; (c) Obacunone; (d) Limonin; (e) Evodol; (f) Rutaevin; (g) Calcipotriol.
3.5.3. Inhibitory Effects of Different Compounds on Abnormal HaCaT Cell Proliferation
Psoriasis pathogenesis is characterized by keratinocyte hyperproliferation concurrent with inflammatory activation [92]. Therefore, drugs that inhibit hyperproliferation and exhibit anti-inflammatory effects have therapeutic potential for psoriasis. The CCK-8 assay was used to quantify metabolically active cells as a proliferation indicator. In this study, we evaluated six transdermal compounds (dictamnine, jangomolide, obacunone, limonin, evodol, rutaevin) and calcipotriol on TNF-α-stimulated HaCaT cells at 12.5, 25, and 50 μM (Figure 12A). The normal group received no TNF-α treatment, while the model group was treated with TNF-α alone. Metabolic activity was significantly higher in the model group versus controls (p < 0.001), confirming TNF-α-mediated hyperproliferation. Compared with the model group, dictamnine, jangomolide, limonin, evodol, rutaevin, and calcipotriol significantly reduced TNF-α-induced abnormal cell proliferation at 12.5, 25, and 50 μM (p < 0.01). Obacunone exhibited marginal inhibitory activity at 50 μM (p < 0.05). Across all tested concentrations, dictamnine inhibited cell viability significantly more effectively than the other compounds, with an efficacy comparable to calcipotriol (positive control). At high and low concentrations, dictamnine inhibited aberrant cell proliferation by 48% and 33%, respectively. The inhibition rates for calcipotriol were 45% and 25% at high and low concentrations, respectively. In contrast, the remaining compounds (jangomolide, limonin, evodol, rutaevin) exhibited only approximately 20% inhibition even at high concentrations.
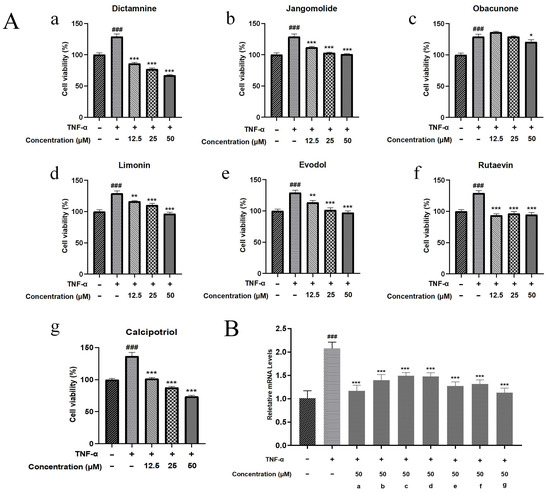
Figure 12.
(A) Cellular activity against abnormal proliferation: (a) Dictamnine; (b) Jangomolide; (c) Obacunone; (d) Limonin; (e) Evodol; (f) Rutaevin; (g) Calcipotriol. (B) Inhibitory effects on Ki67 mRNA expression; (a) Dictamnine; (b) Jangomolide; (c) Obacunone; (d) Limonin; (e) Evodol; (f) Rutaevin; (g) Calcipotriol. Statistical comparisons: ### p < 0.001 (vs. normal); * p < 0.05, ** p < 0.01, *** p < 0.001 (vs. model).
3.5.4. Modulation of Ki67 Expression by Various Compounds in a Psoriasis-like HaCaT Model
As shown in Section 3.5.3, all tested compounds attenuated TNF-α-induced abnormal increases in cell viability to varying degrees, with significant differences observed at 50 μM. Therefore, Ki67 mRNA expression was measured for each compound at this concentration. Ki67 is a nuclear protein associated with cell proliferation, expressed during the cell proliferation cycle, and reliably reflects the cell proliferation status in psoriasis [93]. The model group exhibited significantly higher Ki67 mRNA expression compared to normal controls (p < 0.001). Compared with the TNF-α treatment alone, all compounds reduced Ki67 mRNA expression to varying degrees, with significant differences (p < 0.001). Among the transdermal compounds, dictamnine exhibited the greatest reduction, approaching the positive control level (Figure 12B).
3.5.5. Effects of Different Compounds on Inflammatory Factor Expression
Based on the TNF, NF-κB, IL-17, and Toll-like receptor signaling pathways identified through network pharmacology analysis, and considering the pathogenesis of psoriasis, the inflammatory factors IL-17A, IL-22, IL-1β, IL-6, and IL-8 were selected for detection. Keratinocytes can initiate inflammatory processes upon TNF-α stimulation, producing cytokines including IL-17A, IL-22, IL-1β, IL-6, and IL-8, which are associated with psoriasis pathogenesis [94,95,96,97,98,99]. TNF-α stimulation markedly elevated IL-17A, IL-22, IL-1β, IL-6, and IL-8 expression in HaCaT cells (p < 0.001; Figure 13, Figure 14, Figure 15, Figure 16 and Figure 17). All test compounds significantly reduced the levels of various inflammatory factors across tested concentrations (12.5–50 μM; p < 0.001; Figure 13, Figure 14, Figure 15, Figure 16 and Figure 17). Among them, dictamnine and rutaevin exhibited similar inhibitory effects, comparable to the positive control (calcipotriol), and showed excellent anti-inflammatory activity even at low concentrations. Jangomolide, limonin, obacunone, and evodol displayed comparable inhibitory efficacy. Overall, obacunone showed the weakest anti-inflammatory effect, while dictamnine exhibited the most potent anti-inflammatory activity. Among all inflammatory factors examined, dictamnine produced the most substantial suppression of IL-6, reducing its levels by 49% at high concentration and 38% at low concentration. In comparison, calcipotriol led to reductions of 42% and 36%, respectively. IL-8 was the second most markedly inhibited cytokine, with dictamnine treatment resulting in decreases of 38% (high) and 32% (low). Conversely, calcipotriol reduced IL-8 levels by 31% and 24% at the corresponding concentrations.
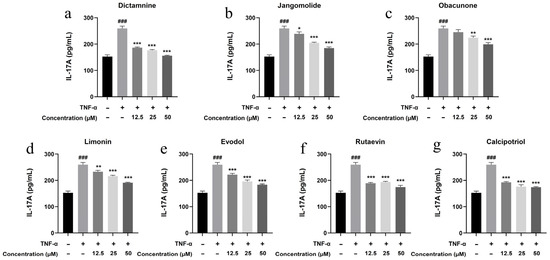
Figure 13.
Suppression of IL-17A production by various compounds: (a) Dictamnine; (b) Jangomolide; (c) Obacunone; (d) Limonin; (e) Evodol; (f) Rutaevin; (g) Calcipotriol. Statistical comparisons: ### p < 0.001 (vs. normal); * p < 0.05, ** p < 0.01, *** p < 0.001 (vs. model).
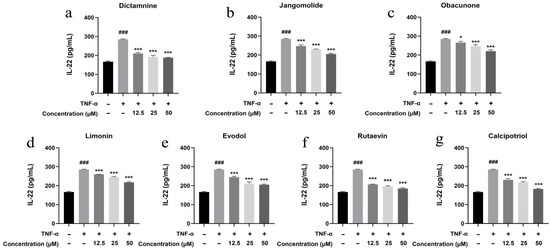
Figure 14.
Suppression of IL-22 production by various compounds: (a) Dictamnine; (b) Jangomolide; (c) Obacunone; (d) Limonin; (e) Evodol; (f) Rutaevin; (g) Calcipotriol. Statistical comparisons: ### p < 0.001 (vs. normal); * p < 0.05, *** p < 0.001 (vs. model).
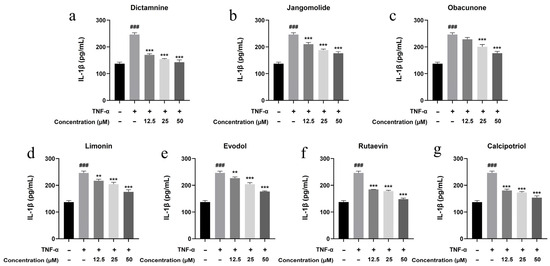
Figure 15.
Suppression of IL-1β production by various compounds: (a) Dictamnine; (b) Jangomolide; (c) Obacunone; (d) Limonin; (e) Evodol; (f) Rutaevin; (g) Calcipotriol. Statistical comparisons: ### p < 0.001 (vs. normal); ** p < 0.01, *** p < 0.001 (vs. model).
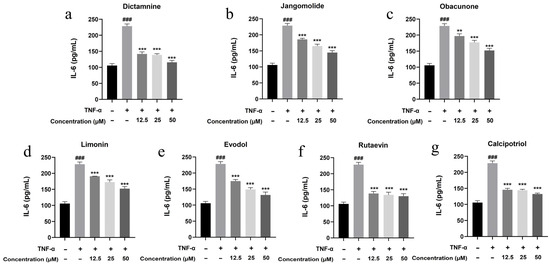
Figure 16.
Suppression of IL-6 production by various compounds: (a) Dictamnine; (b) Jangomolide; (c) Obacunone; (d) Limonin; (e) Evodol; (f) Rutaevin; (g) Calcipotriol. Statistical comparisons: ### p < 0.001 (vs. normal) ** p < 0.01, *** p < 0.001 (vs. model).
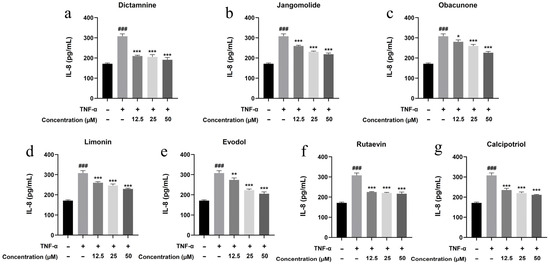
Figure 17.
Suppression of IL-8 production by various compounds: (a) Dictamnine; (b) Jangomolide; (c) Obacunone; (d) Limonin; (e) Evodol; (f) Rutaevin; (g) Calcipotriol. Statistical comparisons: ### p < 0.001 (vs. normal); * p < 0.05, ** p < 0.01, *** p < 0.001 (vs. model).
Based on the antiproliferative and anti-inflammatory results, all transdermal compounds significantly inhibited abnormal keratinocyte proliferation, with dictamnine exhibiting the most potent effects. The compounds showed good anti-inflammatory activity and effectively reduced levels of the inflammatory factors IL-17A, IL-22, IL-1β, IL-6, and IL-8. Among these, dictamnine and rutaevin displayed better inhibitory effects than other compounds, comparable to calcipotriol (positive control). These six compounds show therapeutic potential for psoriasis, with dictamnine showing the best antiproliferative and anti-inflammatory effects, thus establishing a foundation for developing new anti-psoriatic drugs.
4. Conclusions
In this study, 41 constituents of DC were identified by UPLC-Q-TOF-MS (17 chemical components isolated in this paper were used as reference substances for comparison). A total of 26 constituents were found to penetrate the skin, most of which were alkaloids and limonoids, indicating these compounds might more easily penetrate the skin to exert therapeutic effects. Network pharmacology analysis showed that 20 transdermal constituents were associated with potential therapeutic targets for psoriasis, including TNF, MMP9, TLR4, ICAM1, EGFR, and MAPK14. Functional enrichment analysis (GO/KEGG) revealed that DC’s anti-psoriatic activity involved modulation of diverse immune-inflammatory pathways. Using molecular docking to simulate ligand-target affinity, we selected six transdermal constituents with anti-psoriatic potential: dictamnine, jangomolide, obacunone, limonin, evodol, and rutaevin. In vitro anti-proliferation assays and inflammatory factor detection further confirmed that these compounds effectively inhibited abnormal cell proliferation and reduced inflammatory factor levels. Based on the evaluation of multiple indicators for each compound, dictamnine was confirmed to have the most promising anti-psoriatic effect and demonstrated potential as a candidate drug for psoriasis treatment. These results provide a pharmacodynamic material basis for the development of external preparations of DC for treating psoriasis, offer a novel research approach for exploring the pharmacodynamic material basis of external drugs, and present a new perspective for the development of external traditional Chinese medicine preparations against psoriasis.
Supplementary Materials
The following supporting information can be downloaded at https://www.mdpi.com/article/10.3390/pharmaceutics17091195/s1, Figures S1–S34: Compound 1H and 13C NMR spectrum; Table S1: The top 25 KEGG pathways.
Author Contributions
Conceptualization, S.S. and Z.W.; investigation and validation, Z.W., M.P. and Z.G.; data curation, Z.W., M.P., Z.G., M.D., L.G. and S.L.; methodology, Z.W., M.D., L.G., S.L. and S.S.; resources, M.D., L.G. and S.L.; visualization, Z.W.; writing—original draft preparation, Z.W.; writing—review and editing, S.S. All authors have read and agreed to the published version of the manuscript.
Funding
This research was funded by CACMS Innovation Fund (CI2024E003-XY-06, CI2023E002-Y-54, CI2023E005TS07), Fundamental Research Funds for the Central Public Welfare Research Institutes (ZZ13-YQ-108).
Institutional Review Board Statement
The animal experiment involved in this study was approved by the Experimental Animal Ethics Committee of the Institute of Chinese Materia Medica China Academy of Chinese Medical Sciences, with the approval number of 2025B013 (approval date: 17 January 2025).
Informed Consent Statement
Not applicable.
Data Availability Statement
Data is contained within the article and Supplementary Materials.
Conflicts of Interest
The authors declare no conflicts of interest.
References
- Zhan, Z.Y.; Jiang, M.; Zhang, Z.H.; An, Y.M.; Wang, X.Y.; Wu, Y.L.; Nan, J.X.; Lian, L.H. NETs contribute to psoriasiform skin inflammation: A novel therapeutic approach targeting IL-36 cytokines by a small molecule tetrahydroxystilbene glucoside. Phytomedicine 2024, 131, 155783. [Google Scholar] [CrossRef]
- Sugumaran, D.; Yong, A.C.H.; Stanslas, J. Advances in psoriasis research: From pathogenesis to therapeutics. Life Sci. 2024, 355, 122991. [Google Scholar] [CrossRef]
- Liu, J.W.; Zhu, L. New advances in the pathogenesis and drug research of psoriasis. Acta Pharm. Sin. 2023, 58, 2942–2951. (In Chinese) [Google Scholar]
- Li, X.; Yan, Z.; Lan, H.; Wu, Y.; Chen, S.; Qiu, G.; Wu, Y. Genetic Comorbidity of Psoriasis and Four Cardiovascular Diseases: Uncovering Shared Mechanisms and Potential Therapeutic Targets. Exp. Dermatol. 2025, 34, e70158. [Google Scholar] [CrossRef]
- Wu, J.J.; Kavanaugh, A.; Lebwohl, M.G.; Gniadecki, R.; Merola, J.F. Psoriasis and metabolic syndrome: Implications for the management and treatment of psoriasis. J. Eur. Acad. Dermatol. Venereol. 2022, 36, 797–806. [Google Scholar] [CrossRef] [PubMed]
- Chu, M.; Shen, S.; Zhu, Z.; Li, Z.; Bai, Y.; Ma, J.; Hao, J.; Wang, L.; Fu, M.; Dang, E.; et al. Association of psoriasis with depression, anxiety, and suicidality: A bidirectional two-sample Mendelian randomization study. J. Dermatol. 2023, 50, 1629–1634. [Google Scholar] [CrossRef] [PubMed]
- Luca, M.; Musumeci, M.L.; D’Agata, E.; Micali, G. Depression and sleep quality in psoriatic patients: Impact of psoriasis severity. Int. J. Psychiatry Clin. Pract. 2020, 24, 102–104. [Google Scholar] [CrossRef]
- Committee on Psoriasis. Chinese Society of Dermatology. Guideline for the diagnosis and treatment of psoriasis in China (2023 edition). Chin. J. Dermatol. 2023, 56, 573–625. [Google Scholar] [CrossRef]
- Hu, W.; Shen, J.; Zhou, C.; Tai, Z.; Zhu, Q.; Chen, Z.; Huang, Y.; Sheng, C. Discovery of Janus Kinase and Histone Deacetylase Dual Inhibitors as a New Strategy to Treat Psoriasis. J. Med. Chem. 2024, 67, 19267–19281. [Google Scholar] [CrossRef]
- Wang, Q.; Luo, X.; Su, Y.; Jin, Y.; Kuang, Q.; Li, S.; Shen, W.; Zhu, Y. Tanshinone I Ameliorates Psoriasis-Like Dermatitis by Suppressing Inflammation and Regulating Keratinocyte Differentiation. Drug Des. Dev. Ther. 2025, 19, 539–552. [Google Scholar] [CrossRef] [PubMed]
- Lee, H.J.; Kim, M. Challenges and Future Trends in the Treatment of Psoriasis. Int. J. Mol. Sci. 2023, 24, 13313. [Google Scholar] [CrossRef]
- Wu, Z.M.; Duan, X.W.; Deng, H.H.; Li, X.T.; Han, S.W.; Qi, R.Z. Analysis of the characteristics and clinical application of Liangxue Wuhua Decoction in treating psoriasis based on the theory of “blood-heat as the root cause”. Yunnan J. Tradit. Chin. Med. Mater. Med. 2024, 45, 35–38. (In Chinese) [Google Scholar]
- Li, B.N.; Zhao, J.; Yuan, F.H.; Shu, X.G.; Zhang, X.Z. Research progress on the mechanism and clinical application of traditional Chinese medicine in the treatment of psoriasis. Heilongjiang J. Tradit. Chin. Med. 2024, 53, 353–354. (In Chinese) [Google Scholar]
- Lin, X.F.; Zhang, G.L.; Shen, Y.X.; Dong, C.L.; Tao, K.; Zhang, Y.S. Research progress on traditional Chinese medicine treatment of psoriasis. Chin. J. Geriatr. Care. 2024, 22, 122–126. (In Chinese) [Google Scholar]
- Chinese Pharmacopoeia Commission. Pharmacopoeia of the People’s Republic of China, 2020 ed.; China Medical Science Press: Beijing, China, 2020; Volume 1, pp. 114–115. [Google Scholar]
- Steven, S.; Evie, W.O.; Albert, H.; Wang, Z.X. Functional Properties and Quality Control of Cortex Dictamni: A Review. Curr. Nutr. Food Sci. 2025, 21, 579–585. [Google Scholar]
- Liu, X.Y.; Chen, L.L.; Sun, P.; Zhan, Z.S.; Wang, J.F. Research progress in chemical composition, pharmacological effects, toxicology of Dictamni cortex and predictive analysis of its quality markers. Chin. New Drug J. 2023, 32, 799–805. (In Chinese) [Google Scholar]
- Xu, Q.Y.; Li, F.L.; Mao, X.; Song, H.C.; Qu, X.L. Research progress of traditional Chinese medicine in the blood-heat stage of psoriasis vulgaris. Shanghai Med. Pharm. J. 2021, 42, 18–20. (In Chinese) [Google Scholar]
- Yao, D.M.; Chen, J.J. Analysis of Medication Rules About External Traditional Chinese Medicine Preparations in National Patent Database for Psoriasis. Asia-Pac. Tradit. Med. 2024, 20, 142–146. (In Chinese) [Google Scholar]
- Xu, K.; Yang, S.Q.; Yuan, R. Wang Yuxi’s experience in treating psoriasis with Chinese herbal external washing therapy. Guide J. Tradit. Chin. Med. 2022, 28, 150–153. (In Chinese) [Google Scholar]
- Choi, M.; Yi, J.K.; Kim, S.Y.; Ryu, J.H.; Lee, J.; Kwon, W.; Jang, S.; Kim, D.; Kim, M.; Kim, H.; et al. Anti-inflammatory effects of a methanol extract of Dictamnus dasycarpus Turcz. root bark on imiquimod-induced psoriasis. BMC Complement. Altern. Med. 2019, 19, 347. [Google Scholar] [CrossRef]
- Gao, R.; Sun, H.J.; Zhang, M.M.; Deng, G.Y.; Zhang, Z.D. Mechanism of Dictamni Cortex aqueous extract in improving psoriasis-like rats based on Akt1, TP53, and Caspase-3 targets. J. Chin. Med. Mater. 2024, 47, 2328–2333. (In Chinese) [Google Scholar]
- Li, Y. Effect and Molecular Mechanisms of Dictamnine in Treating Psoriasis. Master’s Thesis, South-Central Minzu University, Wuhan, China, 2020. [Google Scholar]
- Kim, S.; Chen, J.; Cheng, T.; Gindulyte, A.; He, J.; He, S.; Li, Q.; Shoemaker, B.A.; Thiessen, P.A.; Yu, B.; et al. PubChem 2023 update. Nucleic Acids Res. 2022, 51, D1373–D1380. [Google Scholar] [CrossRef] [PubMed]
- Gfeller, D.; Grosdidier, A.; Wirth, M.; Daina, A.; Michielin, O.; Zoete, V. SwissTargetPrediction: A web server for target prediction of bioactive small molecules. Nucleic Acids Res. 2014, 42, W32–W38. [Google Scholar] [CrossRef] [PubMed]
- Liu, H.J.; Jiang, L.; Cheng, X.H.; Zeng, J.; Li, Q. Exploring the pharmacodynamic material basis of Heibu Yaogao in treating keloids based on transdermal component spectrum and network pharmacology. J. Shaanxi Univ. Chin. Med. 2025, 1–9. (In Chinese) [Google Scholar]
- Shannon, P.; Markiel, A.; Ozier, O.; Baliga, N.S.; Wang, J.T.; Ramage, D.; Amin, N.; Schwikowski, B.; Ideker, T. Cytoscape: A Software Environment for Integrated Models of Biomolecular Interaction Networks. Genome Res. 2003, 13, 2498–2504. [Google Scholar] [CrossRef]
- Wang, Y.; Cai, S.; Wen, W.; Tan, Y.; Wang, W.; Xu, J.; Xiong, P. A Network Pharmacology Study and In Vitro Evaluation of the Bioactive Compounds of Kadsura coccinea Leaf Extract for the Treatment of Type 2 Diabetes Mellitus. Molecules 2025, 30, 1157. [Google Scholar] [CrossRef]
- Knox, C.; Wilson, M.; Klinger, C.M.; Franklin, M.; Oler, E.; Wilson, A.; Pon, A.; Cox, J.; Chin, N.E.; Strawbridge, S.A.; et al. DrugBank 6.0: The DrugBank Knowledgebase for 2024. Nucleic Acids Res. 2024, 52, D1265–D1275. [Google Scholar] [CrossRef] [PubMed]
- Stelzer, G.; Rosen, N.; Plaschkes, I.; Zimmerman, S.; Twik, M.; Fishilevich, S.; Stein, T.I.; Nudel, R.; Lieder, I.; Mazor, Y.; et al. The GeneCards Suite: From Gene Data Mining to Disease Genome Sequence Analyses. Curr. Protoc. Bioinform. 2016, 54, 1.30.1–1.30.33. [Google Scholar] [CrossRef]
- Hamosh, A.; Amberger, J.S.; Bocchini, C.; Scott, A.F.; Rasmussen, S.A. Online Mendelian Inheritance in Man (OMIM): Victor McKusick’s magnum opus. Am. J. Med. Genet. Part A 2021, 185, 3259–3265. [Google Scholar] [CrossRef]
- Zhou, Y.; Zhang, Y.; Zhao, D.; Yu, X.; Shen, X.; Zhou, Y.; Wang, S.; Qiu, Y.; Chen, Y.; Zhu, F. TTD: Therapeutic Target Database describing target druggability information. Nucleic Acids Res. 2024, 52, D1465–D1477. [Google Scholar] [CrossRef]
- Shi, Y.; Xu, H.; Xu, C.L.; Jin, J.J.; Qin, K.M. Mechanism of Cortex Dictamni in the Treatment of Eczema by LC-MS Combined with Network Pharmacology. World Sci. Technol. Mod. Tradit. Chin. Med. 2022, 24, 2053–2063. (In Chinese) [Google Scholar]
- Wei, J.; Liu, Z.; Li, M.; Du, L.; Zhu, X.; Leng, Y.; Han, C.; Xu, Q.; Zhang, C. Based on UPLC-Q-TOF/MS and Network Pharmacology to Explore the Mechanism of Qingre Lishi Decoction in the Treatment of Psoriasis. Drug Des. Dev. Ther. 2024, 18, 3871–3889. [Google Scholar] [CrossRef]
- Oliveros, J.C. (2007–2015) Venny. An Interactive Tool for Comparing Lists with Venn’s Diagrams. Available online: https://bioinfogp.cnb.csic.es/tools/venny/ (accessed on 15 June 2025).
- Szklarczyk, D.; Kirsch, R.; Koutrouli, M.; Nastou, K.; Mehryary, F.; Hachilif, R.; Gable, A.L.; Fang, T.; Doncheva, N.T.; Pyysalo, S.; et al. The STRING database in 2023: Protein–protein association networks and functional enrichment analyses for any sequenced genome of interest. Nucleic Acids Res. 2022, 51, D638–D646. [Google Scholar] [CrossRef]
- Zhou, J.X.; Shen, S.; Du, M.B.; Li, Y.J.; Sun, Y. Investigation of Transdermal Constituents and Molecular Mechanism of Euodiae Fructus in Treatment of Diarrhea by Transdermal Drug Delivery Based on Integrated Pharmacology and UPLC-Q-TOF-MS. Chin. J. Exp. Tradit. Med. Form. 2021, 27, 112–120. (In Chinese) [Google Scholar]
- Wang, J.L.; Guan, Y.X.; Fan, J.W.; Li, Y.F.; Zhang, G.M. Quality Evaluation of Qinggan Granules Based on UPLC-Q-Exactive-Orbitrap-MS and Network Pharmacology. World Chin. Med. 2024, 19, 2035–2047. (In Chinese) [Google Scholar]
- Zhou, Y.; Zhou, B.; Pache, L.; Chang, M.; Khodabakhshi, A.H.; Tanaseichuk, O.; Benner., C.; Chanda, S.K. Metascape provides a biologist-oriented resource for the analysis of systems-level datasets. Nat. Commun. 2019, 10, 1523. [Google Scholar] [CrossRef] [PubMed]
- Zhou, T.; Qu, K.; Chen, Z.Y.; Li, N.; Liu, H.L.; Wu, Y.; Ding, Y.L.; Xu, J.H. Network Pharmacology and Experimental Validation of Effective Components of Panacis Quinquefolii Radix and Carthamus tinctorius in Treatment of Early Diabetic Nephropathy. World Chin. Med. 2024, 19, 2072–2080. (In Chinese) [Google Scholar]
- Qi, Y.L.; Bai, L.D.; Qiu, X.Z.; Si, Y.M.; Wang, Y.Y.; Chen, L.; Li, Y.H. Bioinformatics analysis of lymphangiogenesis in myocardial infarction and screening of traditional Chinese medicine for prevention treatment. J. Tianjin Univ. Tradit. Chin. Med. 2024, 43, 113–122. (In Chinese) [Google Scholar]
- Tang, D.; Chen, M.; Huang, X.; Zhang, G.; Zeng, L.; Zhang, G.; Wu, S.; Wang, Y. SRplot: A free online platform for data visualization and graphing. PLoS ONE 2023, 18, e0294236. [Google Scholar] [CrossRef] [PubMed]
- Ma, M.; Du, Q.; Shi, S.; Lv, J.; Zhang, W.; Ge, D.; Xing, L.; Yu, N. Integrating UPLC-Q-TOF-MS and Network Pharmacology to Explore the Potential Mechanisms of Paeonia lactiflora Pall. in the Treatment of Blood Stasis Syndrome. Molecules 2024, 29, 3019. [Google Scholar] [CrossRef]
- Burley, S.K.; Berman, H.M.; Kleywegt, G.J.; Markley, J.L.; Nakamura, H.; Velankar, S. Protein Data Bank (PDB): The Single Global Macromolecular Structure Archive. Methods Mol. Biol. 2017, 1607, 627–641. [Google Scholar]
- Trott, O.; Olson, A.J. AutoDock Vina: Improving the speed and accuracy of docking with a new scoring function, efficient optimization, and multithreading. J. Comput. Chem. 2010, 31, 455–461. [Google Scholar] [CrossRef] [PubMed]
- Wikan, N.; Hankittichai, P.; Thaklaewphan, P.; Potikanond, S.; Nimlamool, W. Oxyresveratrol Inhibits TNF-α-Stimulated Cell Proliferation in Human Immortalized Keratinocytes (HaCaT) by Suppressing AKT Activation. Pharmaceutics 2021, 14, 63. [Google Scholar] [CrossRef] [PubMed]
- Chen, L.; Liu, H.; Zheng, Z.Y.; Qu, S.Q.; Zhang, Y.; Deng, S.Q.; Shen, S.; Liu, T.; Dai, Y.; Li, Y.; et al. MicroRNA-32-5p inhibits metastasis by directly targeting VPS4B and increases sensitivity to dihydroartemisinin in neuroblastoma. Sci. Tradit. Chin. Med. 2024, 2, 202–213. [Google Scholar] [CrossRef]
- Guo, L.N.; Wang, R.; Pei, Y.H.; Liu, L.; Sun, J.K.; Comg, H.; Cui, H.X.; Wang, X.L.; Li, W.J.; Jian, B.Y.; et al. Chemical constituents from the root barks of Dictamnus dasycarpus. Chin. Tradit. Pat. Med. 2016, 38, 2409–2413. (In Chinese) [Google Scholar]
- Liu, X. Chemical Constituents Research of Dictamnus dasycarpus. Master’s Thesis, China Medical University, Shenyang, China, 2020. [Google Scholar]
- Guo, X.X.; Zhao, L.N.; Wang, J.; Liu, S.; Bi, Q.R.; Wang, Z.; Tan, N.H. Chemical constituents from root barks of Dictamnus dasycarpus and their cytotoxic activities. Chin. J. Chin. Mater Med. 2018, 43, 4869–4877. (In Chinese) [Google Scholar]
- Wang, X.X. Active Constituents and Quality Research of Euodia Rutaecarpa. Ph.D. Dissertation, Shenyang Pharmaceutical University, Shenyang, China, 2013. [Google Scholar]
- Bai, Y.Y.; Tang, W.Z.; Wang, X.J. Chemical Constituents from Root Bark of Dictamnus dasycarpus. Chin. Med. Mat. 2014, 37, 263–265. (In Chinese) [Google Scholar]
- Du, C.F.; Yang, X.X.; Tu, P.F. Studies on chemical constituents in bark of Dictamnus dasycarpus. Chin. J. Chin. Mater Med. 2005, 21, 23–26. (In Chinese) [Google Scholar]
- Zhao, Q.Q. Isolation and Structural Identification of Chemical Constituents from Traditional Chinese Medicine Dictamnus dasycarpus. Master’s Thesis, Northwest University, Xi’an, China, 2015. [Google Scholar]
- Duan, J.; Li, W.; Hu, X.J.; Fu, H.Z.; Koike, K. Study on chemical constituents of Jiu-zishen. Chin. Tradit. Herb. Drugs 2009, 40, 528–530. (In Chinese) [Google Scholar]
- Gao, P.; Wang, L.; Zhao, L.; Lu, Y.Y.; Zeng, K.W.; Zhao, M.B.; Jiang, Y.; Tu, P.F.; Guo, X.Y. Rapid identification, isolation, and evaluation on anti-neuroinflammatory activity of limonoids derivatives from the root bark of Dictamnus dasycarpus. J. Pharm. Biomed. Anal. 2021, 200, 114079. [Google Scholar] [CrossRef]
- Yoon, J.S.; Sung, S.H.; Kim, Y.C. Neuroprotective limonoids of root bark of Dictamnus dasycarpus. J. Nat. Prod. 2008, 71, 208–211. [Google Scholar] [CrossRef]
- Yang, S.; Sun, F.; Ruan, J.; Yan, J.; Huang, P.; Wang, J.; Han, L.; Zhang, Y.; Wang, T. Anti-inflammatory constituents from Cortex Dictamni. Fitoterapia 2019, 134, 465–473. [Google Scholar] [CrossRef]
- Yoon, J.S.; Jeong, E.J.; Yang, H.; Kim, S.H.; Sung, S.H.; Kim, Y.C. Inhibitory alkaloids from Dictamnus dasycarpus root barks on lipopolysaccharide-induced nitric oxide production in BV2 cells. J. Enzym. Inhib. Med. Chem. 2012, 27, 490–494. [Google Scholar] [CrossRef]
- Yuldashev, M.P.; Batirov, É.K.; Bdovin, A.D.; Malikov, V.M.; Yagudaev, M.R. Coumarin glycosides of Haplophyllum performatum. structures of haploperosides C, D, and E. Chem. Nat. Compd. 1985, 21, 25–32. [Google Scholar] [CrossRef]
- Zhang, J.L.; Song, S.C.; Liu, J.C.; Ni, P.-H.; Liu, L.; Ma, Y.-K.; Sun, Y.; Liu, Q.; Guo, L.-N. Chemical constituents from the root bark of Dictamnus dasycarpus Turcz. (Rutaceae) and their chemotaxonomic significance. Biochem. Syst. Ecol. 2019, 86, 103931. [Google Scholar] [CrossRef]
- Yuan, X.D.; Gao, H.M.; Chen, L.M.; Zhang, Q.W.; Wang, Z.M. A new lignan from stems of Sargentodoxa cuneata. Chin. J. Chin. Mater Med. 2013, 38, 2118–2124. [Google Scholar]
- Lee, D.G.; Jung, H.J.; Woo, E.R. Antimicrobial property of (+)-lyoniresinol-3alpha-O-beta-D- glucopyranoside isolated from the root bark of Lycium chinense Miller against human pathogenic microorganisms. Arch. Pharmacal Res. 2005, 28, 1031–1036. [Google Scholar] [CrossRef] [PubMed]
- Chang, K.; Gao, P.; Lu, Y.Y.; Tu, P.F.; Jiang, Y.; Guo, X.Y. Identification and characterization of quinoline alkaloids from the root bark of Dictamnus dasycarpus and their metabolites in rat plasma, urine and feces by UPLC/Qtrap-MS and UPLC/Q-TOF-MS. J. Pharm. Biomed. Anal. 2021, 204, 114229. [Google Scholar] [CrossRef]
- Guo, X.X.; Bi, Q.R.; Wang, Z.; Tan, N.H. Mass spectrometry guided strategy based on feature fragment ions forguided-separation on quinoline alkaloids from root barks of Dictamnus dasycarpus. Chin. J. Chin. Mater Med. 2018, 43, 3887–3892. (In Chinese) [Google Scholar]
- Xia, T.L.; Wang, Y.; Wang, D.; Zhao, D.P.; Su, T.; Zhao, J.H.; Lei, X.; Zhang, N. Analysis of Absorbed Components of Rhizoma Anemarrhenae-Cortex Phellodendri Chinesis Herb-Pair Based on UPLC-Q-Exactive Orbitrap-MS. Chin. Pharm. J. 2024, 59, 330–337. (In Chinese) [Google Scholar]
- Ren, W.; Li, Y.; Zuo, R.; Wang, H.; Si, N.; Zhao, H.; Han, L.; Yang, J.; Bian, B. Species-related difference between limonin and obacunone among five liver microsomes and zebrafish using ultra-high-performance liquid chromatography coupled with a LTQ-Orbitrap mass spectrometer. Rapid Commun. Mass Spectrom. 2014, 28, 2292–2300. [Google Scholar] [CrossRef]
- Zhao, X.M.; Chen, Y.X.; Liang, C.X.; Guo, J.; Liu, X.Q.; Feng, W.H.; Zhao, Z.B.; Yan, L.H.; Wang, Z.M. Analysis of Chemical Constituents in Euodiae Fructus by UPLC-Q-TOF-MS/MS. Chin. J. Exp. Tradit. Med. Form. 2021, 27, 113–126. (In Chinese) [Google Scholar]
- Gao, L.N.; Li, R.C.; Zhou, C.Z.; Liu, Q.Z.; Wan, X.H. Chemical constituents and pharmacological effects of Dictamni Cortex:a review. China J. Chin. Mater. Med. 2022, 47, 3723–3737. (In Chinese) [Google Scholar]
- Shi, M.; Ren, B.N.; Qiu, Z.H.; Wu, Y. Rapid identification of the components in Phellodendri chinensis Cortex based on UPLC-Q-TOF-MS. Chin. J. Hosp. Pharm. 2022, 42, 2225–2229. (In Chinese) [Google Scholar]
- Wang, Y.; Hu, W.D.; Hong, L.L.; Xu, X.Y.; Wang, H.; Wang, X.Y.; Yang, W.Z.; Gao, X.M. Characterization and identification of chemical components from Euodiae Fructus based on UHPLC-Q-TOF-MS. China J. Chin. Mater. Med. 2024, 49, 2953–2964. (In Chinese) [Google Scholar]
- Shi, J.W.; Hao, L.; Wang, Y.; Huo, Z.P.; Zhang, Y.Q.; Song, Z.H.; He, Y. Exploration of the Mechanism of Yangxue Qingnao Granules in the Treatment of Hypertension Based on Network Pharmacology and Molecular Docking. Tradit. Chin. Drug Res. Clin. Pharmacol. 2024, 35, 1206–1214. (In Chinese) [Google Scholar]
- Liu, L.; Zhang, H.; Tang, X.; Zhang, M.; Wu, Y.; Zhao, Y.; Lu, C.; Zhao, R. Geniposide ameliorates psoriatic skin inflammation by inhibiting the TLR4/MyD88/NF-κB p65 signaling pathway and MMP9. Int. Immunopharmacol. 2024, 133, 112082. [Google Scholar] [CrossRef] [PubMed]
- Li, J.; Liu, Y.; Cao, Y.; Wang, J.; Zhao, X.; Jiao, J.; Li, J.; Zhang, K.; Yin, G. Inhibition of miR-155 Attenuates CD14+ Monocyte-Mediated Inflammatory Response and Oxidative Stress in Psoriasis Through TLR4/MyD88/NF-κB Signaling Pathway. Clin. Cosmet. Investig. Dermatol. 2022, 15, 193–201. [Google Scholar] [CrossRef] [PubMed]
- Zhong, Y.; Zhang, B.W.; Li, J.T.; Zeng, X.; Pei, J.X.; Zhang, Y.M.; Yang, Y.X.; Li, F.L.; Deng, Y.; Zhao, Q. Ethanol extract of Herpetospermum caudigerum Wall ameliorates psoriasis-like skin inflammation and promotes degradation of keratinocyte-derived ICAM-1 and CXCL9. J. Integr. Med. 2023, 21, 584–592. [Google Scholar] [CrossRef]
- Shih, C.M.; Hsieh, C.K.; Huang, C.Y.; Huang, C.Y.; Wang, K.H.; Fong, T.H.; Trang, N.T.T.; Liu, K.T.; Lee, A.W. Lycopene Inhibit IMQ-Induced Psoriasis-Like Inflammation by Inhibiting ICAM-1 Production in Mice. Polymers 2020, 12, 1521. [Google Scholar] [CrossRef] [PubMed]
- Dai, X.; Murakami, M.; Shiraishi, K.; Muto, J.; Tohyama, M.; Mori, H.; Utsunomiya, R.; Sayama, K. EGFR ligands synergistically increase IL-17A-induced expression of psoriasis signature genes in human keratinocytes via IκBζ and Bcl3. Eur. J. Immunol. 2022, 52, 994–1005. [Google Scholar] [CrossRef]
- Wang, S.; Zhang, Z.; Peng, H.; Zeng, K. Recent advances on the roles of epidermal growth factor receptor in psoriasis. Am. J. Transl. Res. 2019, 11, 520–528. [Google Scholar]
- Yang, J. Cereblon Suppresses LPS-Induced Inflammatory Response and Apoptosis Through Promoting the Ubiquitination and Degradation of c-Jun. Master’s Thesis, Soochow University, Suzhou, China, 2018. [Google Scholar]
- Zhang, J.J.; Liu, J.X.; Zhang, X.Z.; Jia, Y. Exploration of the effects of Tuhuaidan Siwu Decoction on proliferation and inflammation of HaCaT Cells based on network pharmacology and molecular docking technology. J. Shanxi Univ. Chin. Med. 2022, 23, 214–220+224. (In Chinese) [Google Scholar]
- Lin, L.Y.; Lin, Y.; Lei, H.Q.; Liu, J.; Zhang, Y.L.; Huang, W.L.; Yang, L.H.; Tao, J.H. Network Pharmacology Study and Cellular Validation of Dictamni Cortex and Wogonin in the Treatment of Psoriasis. J. Guangzhou Univ. Tradit. Chin. Med. 2023, 40, 1488–1497. (In Chinese) [Google Scholar]
- Liu, T.; He, Y.; Liao, Y. Gypenosides alleviates HaCaT keratinocyte hyperproliferation and ameliorates imiquimod-induced psoriasis in mice. Allergol. Immunopathol. 2024, 52, 22–32. [Google Scholar] [CrossRef]
- Ma, C.; Gu, C.; Lian, P.; Wazir, J.; Lu, R.; Ruan, B.; Wei, L.; Li, L.; Pu, W.; Peng, Z.; et al. Sulforaphane alleviates psoriasis by enhancing antioxidant defense through KEAP1-NRF2 Pathway activation and attenuating inflammatory signaling. Cell Death Dis. 2023, 14, 768. [Google Scholar] [CrossRef] [PubMed]
- Veerasubramanian, P.K.; Wynn, T.A.; Quan, J.; Karlsson, F.J. Targeting TNF/TNFR superfamilies in immune-mediated inflammatory diseases. J. Exp. Med. 2024, 221, e20240806. [Google Scholar] [CrossRef] [PubMed]
- Wu, J.; Liu, S.; Zhang, H.; Zhang, X.; Xue, J.; Li, Z.; Zhang, Y.; Jiang, Y.; Zhang, P.; Yang, M.; et al. Amlexanox ameliorates imiquimod-induced psoriasis-like dermatitis by inhibiting Th17 cells and the NF-κB signal pathway. Biomed. Pharmacother. 2025, 184, 117922. [Google Scholar] [CrossRef] [PubMed]
- Zhang, W.; Zhu, G.; Sun, H.; Jiang, C. NLRC3 affects the development of psoriasis by modulating the NF-κB signaling pathway mediated inflammatory response through its interaction with TRAF6. Immunol. Lett. 2025, 272, 106949. [Google Scholar] [CrossRef]
- Yu, H.; Lin, L.; Zhang, Z.; Zhang, H.; Hu, H. Targeting NF-κB pathway for the therapy of diseases: Mechanism and clinical study. Signal Transduct. Target. Ther. 2020, 5, 209. [Google Scholar] [CrossRef]
- Adamczyk, M.; Bartosińska, J.; Raczkiewicz, D.; Michalak-Stoma, A.; Krasowska, D. The Impact of Biologic Treatment on PD-1/PD-L1 Pathway Disturbances in Psoriasis. J. Clin. Med. 2023, 12, 4179. [Google Scholar] [CrossRef] [PubMed]
- Emre, S.; Süngü, N.; Hayran, Y.; Demirseren, D.D.; Aktas, A.; Duman, T.Ö. Investigation of the PD-1/PD-L1 Expression in the Lesional Skins of Patients with Psoriasis. Dermatol. Pract. Concept. 2023, 13, e2023134. [Google Scholar] [CrossRef] [PubMed]
- Swindell, W.R.; Johnston, A.; Xing, X.; Voorhees, J.J.; Elder, J.T.; Gudjonsson, J.E. Modulation of epidermal transcription circuits in psoriasis: New links between inflammation and hyperproliferation. PLoS ONE 2013, 8, e79253. [Google Scholar] [CrossRef]
- Wang, A.; Wei, J.; Lu, C.; Chen, H.; Zhong, X.; Lu, Y.; Li, L.; Huang, H.; Dai, Z.; Han, L. Genistein suppresses psoriasis-related inflammation through a STAT3-NF-κB-dependent mechanism in keratinocytes. Int. Immunopharmacol. 2019, 69, 270–278. [Google Scholar] [CrossRef]
- Gao, J.; Chen, F.; Fang, H.; Mi, J.; Qi, Q.; Yang, M. Daphnetin inhibits proliferation and inflammatory response in human HaCaT keratinocytes and ameliorates imiquimod-induced psoriasis-like skin lesion in mice. Biol. Res. 2020, 53, 48. [Google Scholar] [CrossRef]
- Lin, X.Y.; He, F.; Dong, D.D.; Li, K. Expression and significance of Ki67 in psoriatic lesions. Sichuan Med. J. 2011, 32, 154–156. (In Chinese) [Google Scholar]
- Choi, D.H.; Hwang, H.S. Anti-inflammation activity of brazilin in TNF-α induced human psoriasis dermatitis skin model. Appl. Biol. Chem. 2019, 62, 46. [Google Scholar] [CrossRef]
- Takuathung, M.N.; Potikanond, S.; Sookkhee, S.; Mungkornasawakul, P.; Jearanaikulvanich, T.; Chinda, K.; Wikan, N.; Nimlamool, W. Anti-psoriatic and anti-inflammatory effects of Kaempferia parviflora in keratinocytes and macrophage cells. Biomed. Pharmacother. 2021, 143, 112229. [Google Scholar] [CrossRef] [PubMed]
- Tokuyama, M.; Mabuchi, T. New Treatment Addressing the Pathogenesis of Psoriasis. Int. J. Mol. Sci. 2020, 21, 7488. [Google Scholar] [CrossRef]
- Li, P.; Li, Y.; Jiang, H.; Xu, Y.; Liu, X.; Che, B.; Tang, J.; Liu, G.; Tang, Y.; Zhou, W.; et al. Glabridin, an isoflavan from licorice root, ameliorates imiquimod-induced psoriasis-like inflammation of BALB/c mice. Int. Immunopharmacol. 2018, 59, 243–251. [Google Scholar] [CrossRef]
- Lin, Y.; Yin, X.; Ma, S.; Xue, Y.; Hu, C.; Xie, Y.; Zeng, Y.; Zhao, X.; Du, C.; Sun, Y.; et al. Cang-ai volatile oil ameliorates imiquimod-induced psoriatic skin lesions by suppressing the ILC3s. J. Ethnopharmacol. 2024, 326, 117867. [Google Scholar] [CrossRef] [PubMed]
- Qiu, X.N.; Hong, D.; Shi, Z.R.; Lu, S.Y.; Lai, Y.X.; Ren, Y.L.; Liu, X.T.; Guo, C.P.; Tan, G.Z.; Wang, L.C. TNF-α promotes CXCL-1/8 production in keratinocytes by downregulating galectin-3 through NF-κB and hsa-miR-27a-3p pathway to contribute psoriasis development. Immunopharmacol. Immunotoxicol. 2023, 45, 692–700. [Google Scholar] [CrossRef] [PubMed]
Disclaimer/Publisher’s Note: The statements, opinions and data contained in all publications are solely those of the individual author(s) and contributor(s) and not of MDPI and/or the editor(s). MDPI and/or the editor(s) disclaim responsibility for any injury to people or property resulting from any ideas, methods, instructions or products referred to in the content. |
© 2025 by the authors. Licensee MDPI, Basel, Switzerland. This article is an open access article distributed under the terms and conditions of the Creative Commons Attribution (CC BY) license (https://creativecommons.org/licenses/by/4.0/).