
Exploring Ibuprofen–Menthol Eutectic Systems: Physicochemical Properties and Cytotoxicity for Pharmaceutical Applications

 ,
,  ,
,  , and
, and 
Abstract

1. Introduction
2. Materials and Methods
2.1. Chemicals
2.2. Preparation of Therapeutical Eutectic Systems
2.3. NMR Spectra
2.4. Differential Scanning Calorimetry (DSC)
2.5. Thermophysical Properties
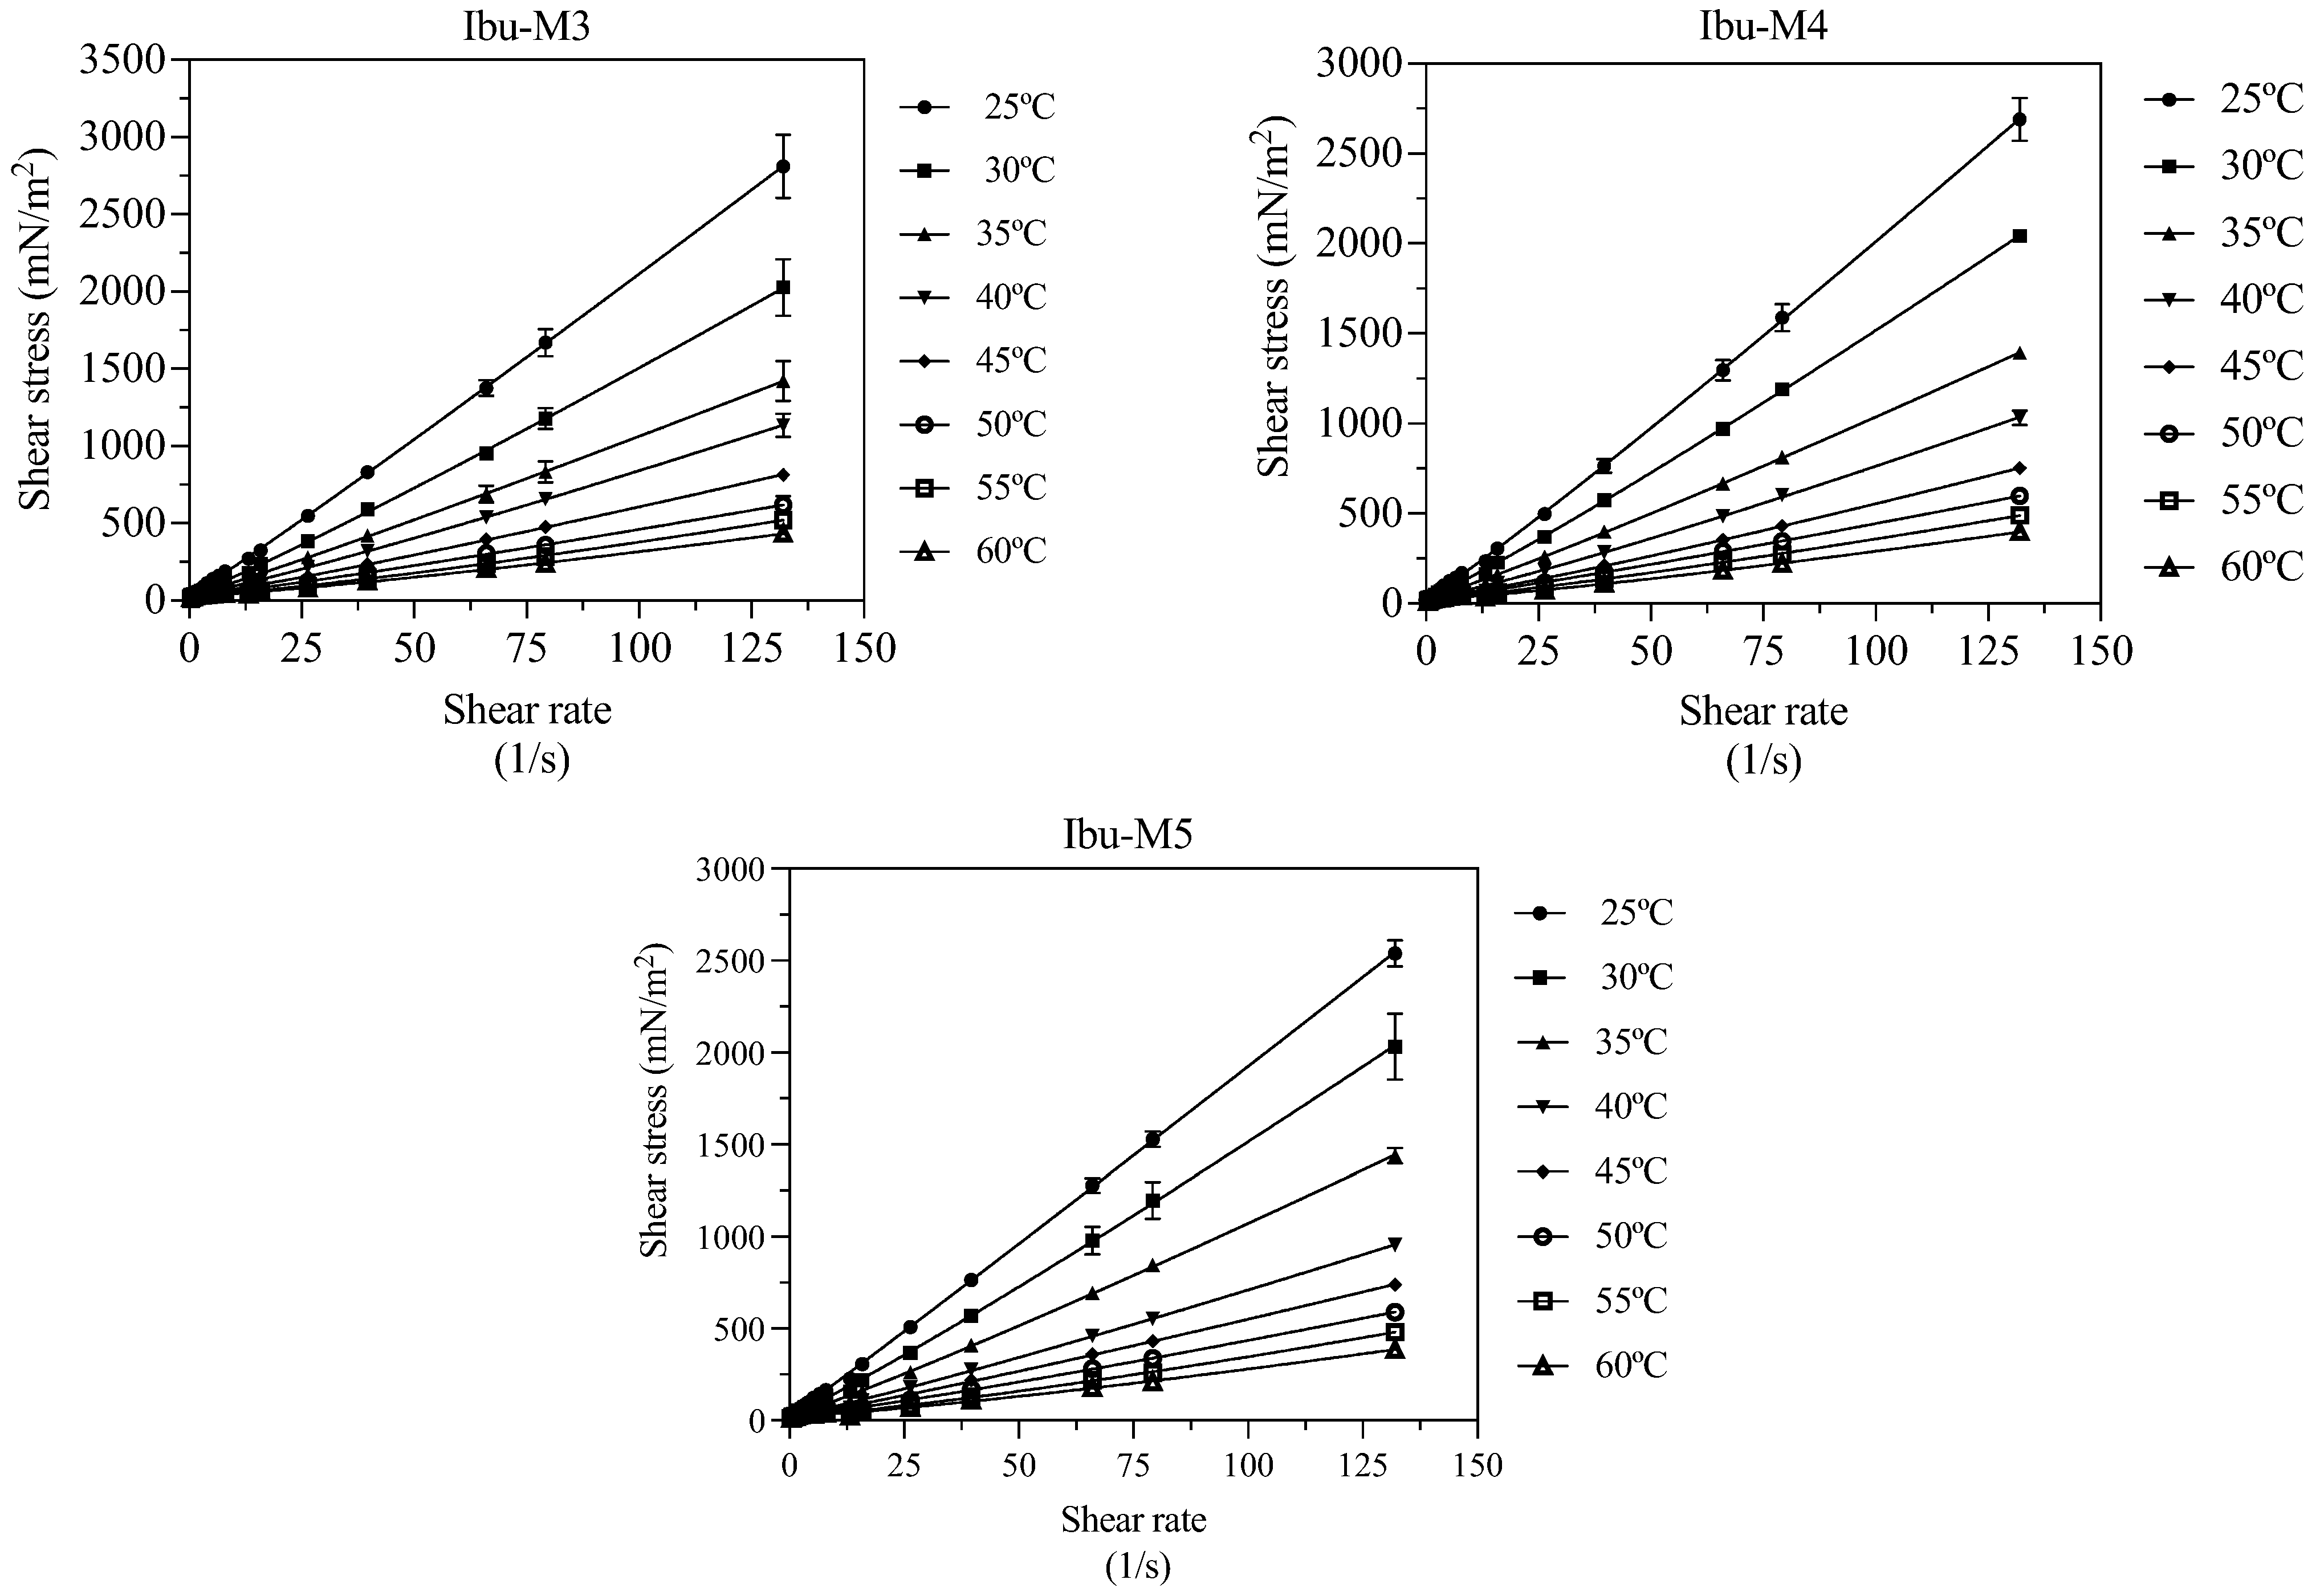
2.6. Rheological Properties
2.7. Cytotoxicity Study
2.7.1. Cell Culture
2.7.2. Concentrations
2.7.3. Cell Viability Assay
Prestoblue Assay
Crystal Violet Assay
2.7.4. BCA Protein Assay Kit
2.8. Statistical Analysis
3. Results and Discussion
3.1. Preparation of THEESs
3.2. Structural Study
3.3. Thermal Properties
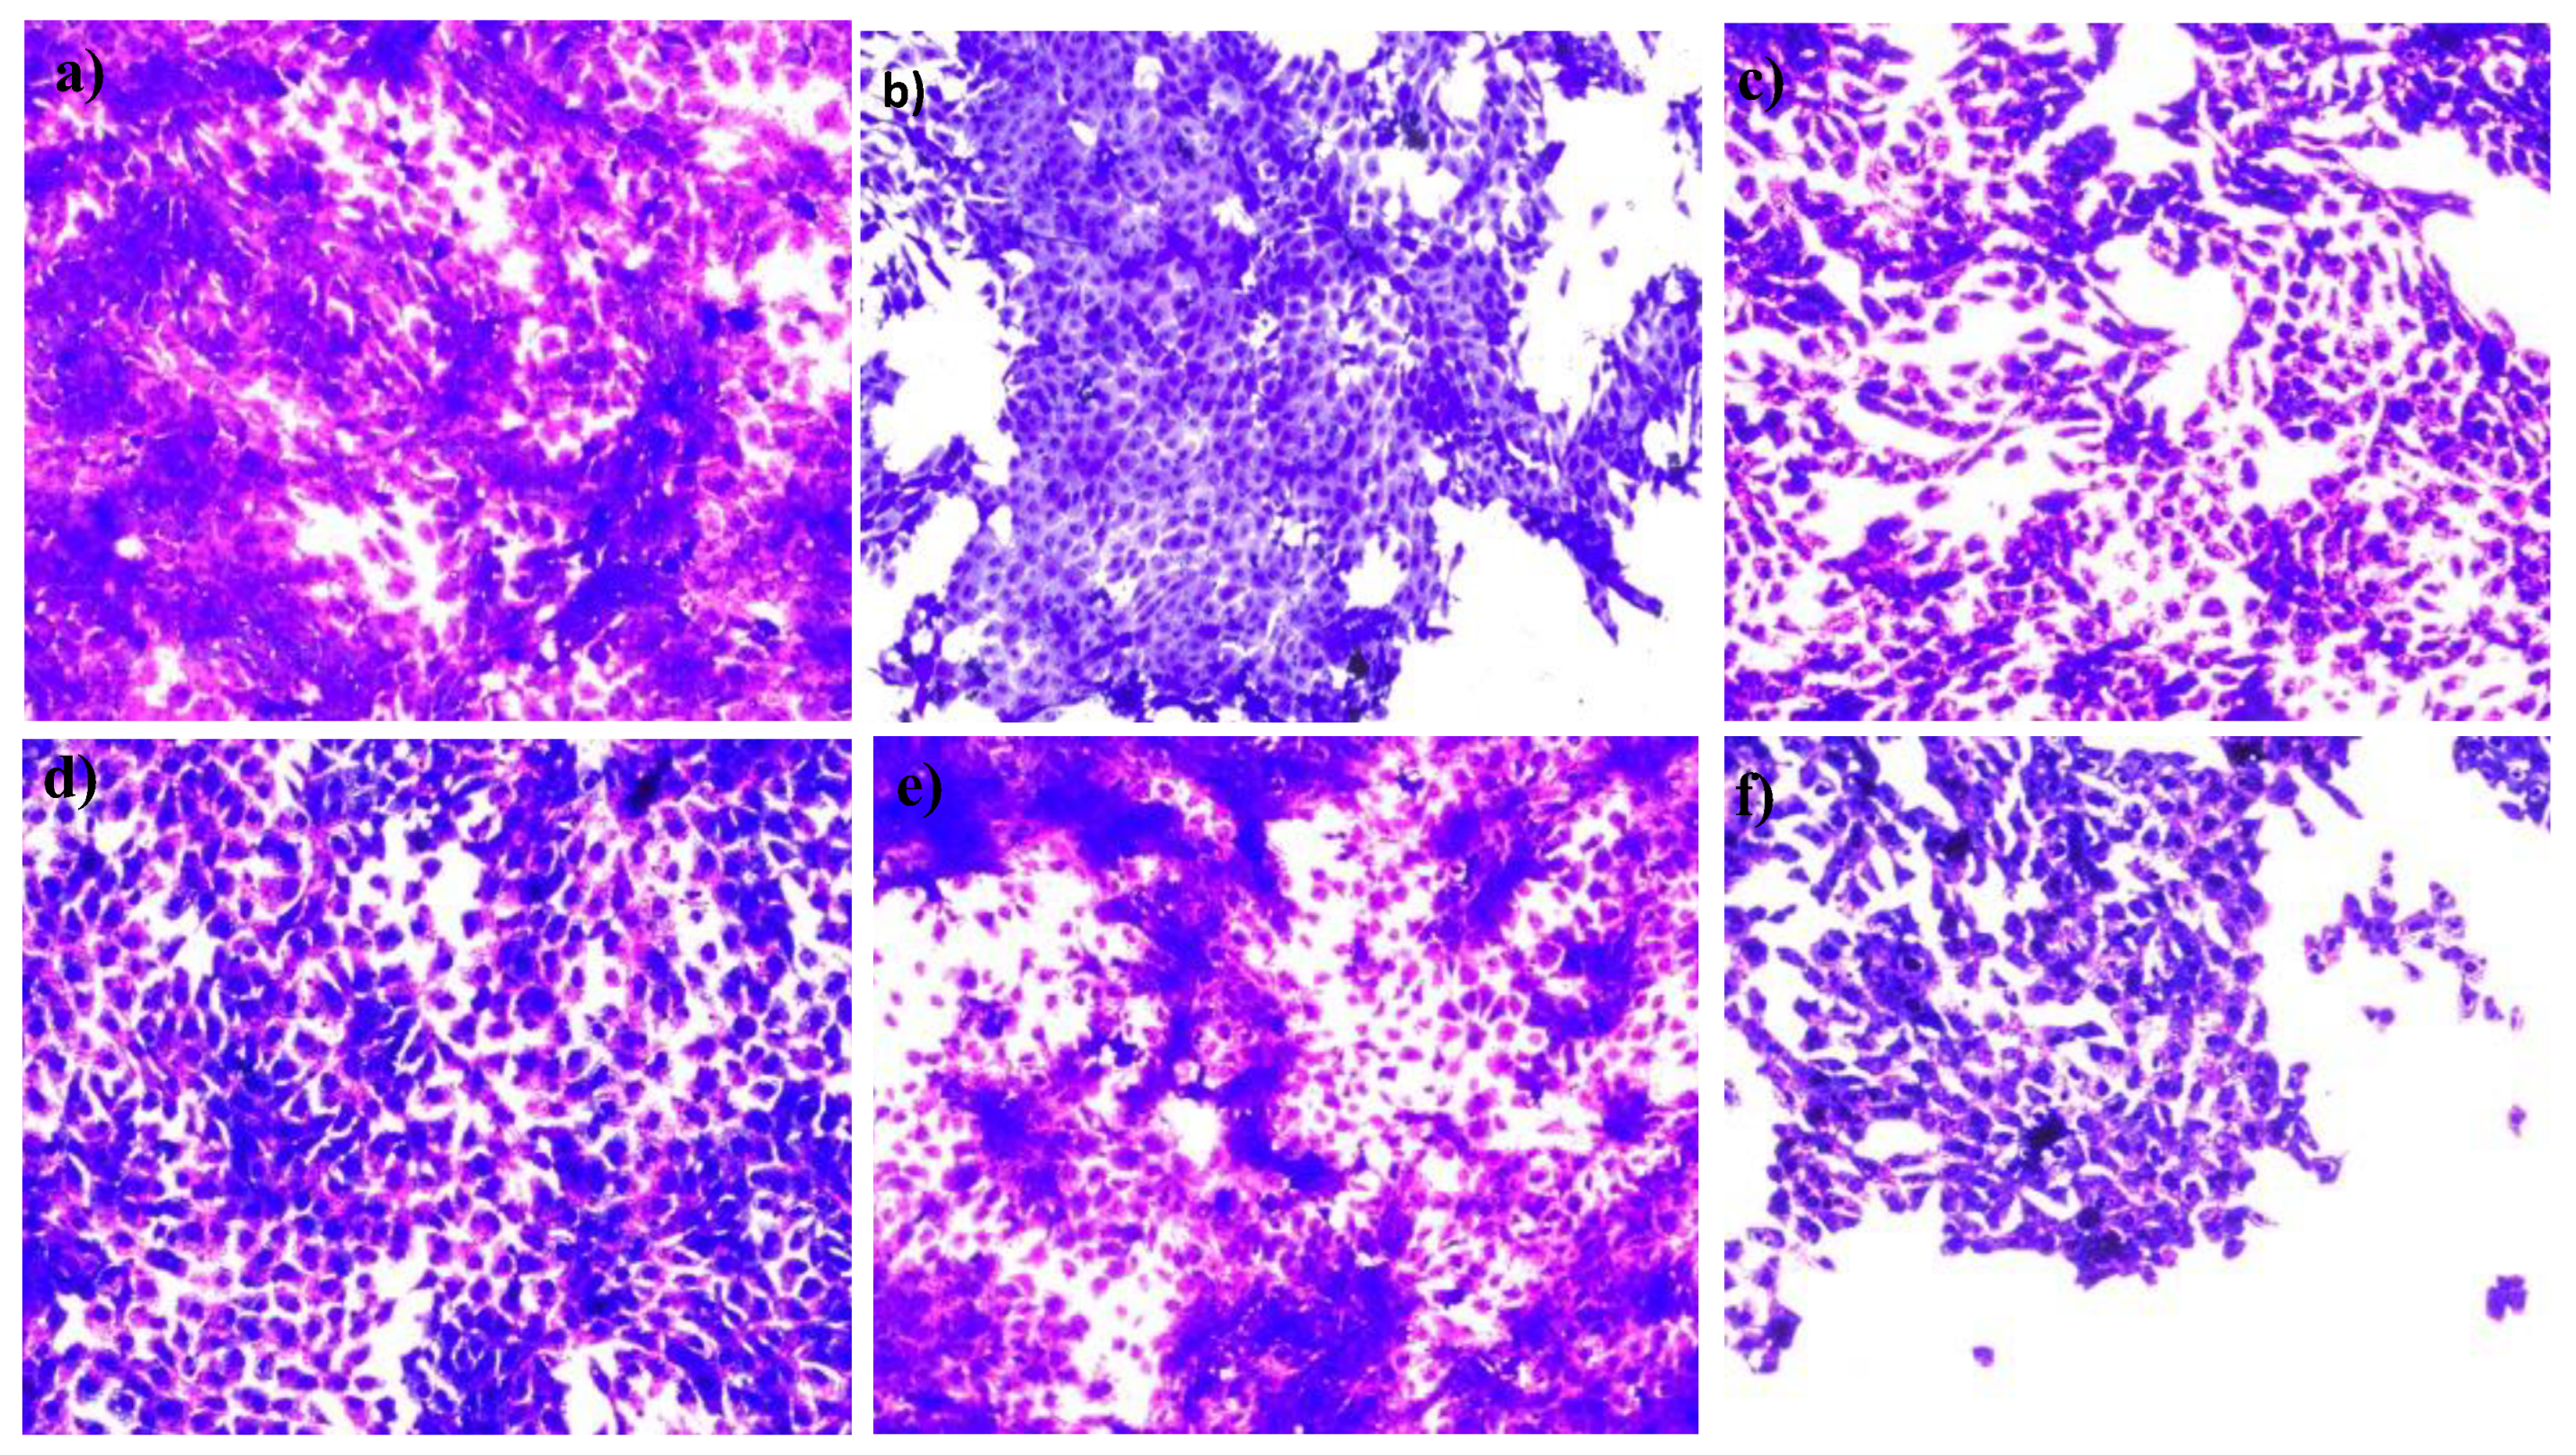
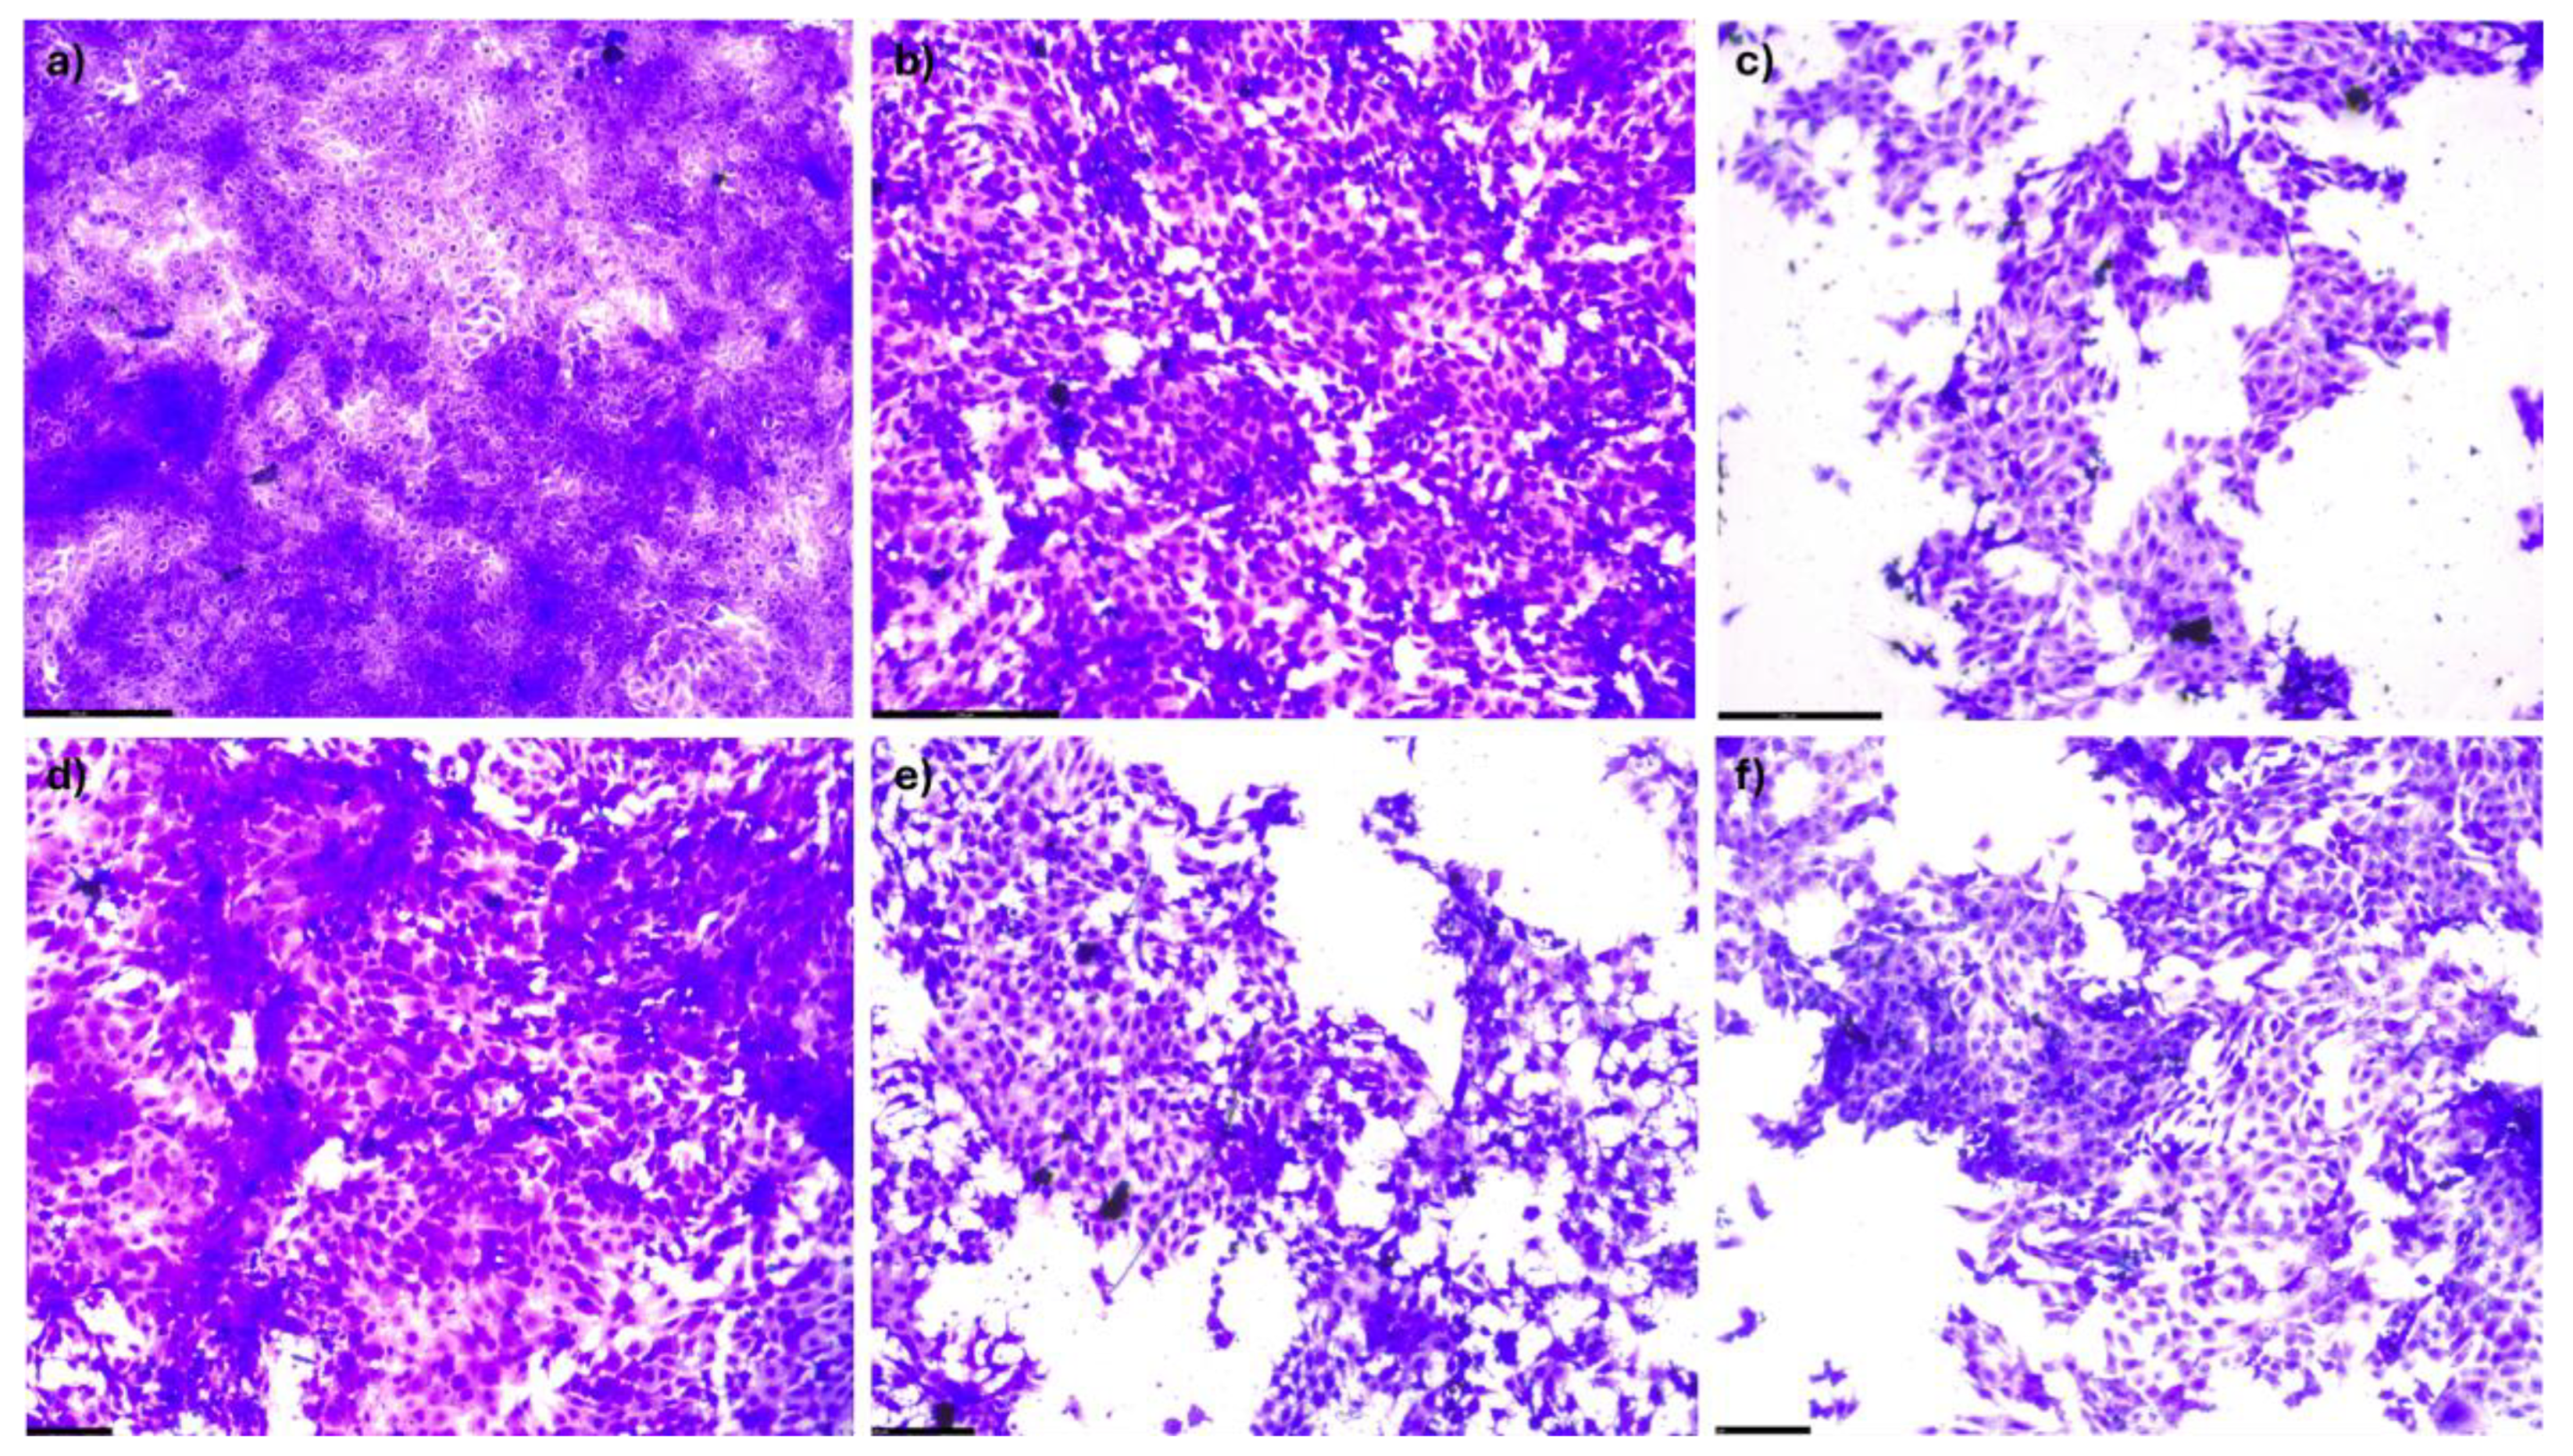
3.4. Cytotoxicity Results
3.4.1. Prestoblue Assay Results
3.4.2. Crystal Violet Assay Results
3.5. BCA Protein Assay Kit
4. Conclusions
Supplementary Materials
Author Contributions
Funding
Institutional Review Board Statement
Informed Consent Statement
Data Availability Statement
Acknowledgments
Conflicts of Interest
References
- Morrison, H.G.; Sun, C.C.; Neervannan, S. Characterization of Thermal Behavior of Deep Eutectic Solvents and Their Potential as Drug Solubilization Vehicles. Int. J. Pharm. 2009, 378, 136–139. [Google Scholar] [CrossRef] [PubMed]
- Barros, A.A.; Silva, J.M.; Craveiro, R.; Paiva, A.; Reis, R.L.; Duarte, A.R.C. Green Solvents for Enhanced Impregnation Processes in Biomedicine. Curr. Opin. Green Sustain. Chem. 2017, 5, 82–87. [Google Scholar] [CrossRef]
- Carranza, A.; Pérez-García, M.G.; Song, K.; Jeha, G.M.; Diao, Z.; Jin, R.; Bogdanchikova, N.; Soltero, A.F.; Terrones, M.; Wu, Q.; et al. Deep-Eutectic Solvents as MWCNT Delivery Vehicles in the Synthesis of Functional Poly(HIPE) Nanocomposites for Applications as Selective Sorbents. ACS Appl. Mater. Interfaces 2016, 8, 31295–31303. [Google Scholar] [CrossRef]
- Carriazo, D.; Serrano, M.C.; Gutiérrez, M.C.; Ferrer, M.L.; del Monte, F. Deep-Eutectic Solvents Playing Multiple Roles in the Synthesis of Polymers and Related Materials. Chem. Soc. Rev. 2012, 41, 4996–5014. [Google Scholar] [CrossRef]
- Oyoun, F.; Toncheva, A.; Henríquez, L.C.; Grougnet, R.; Laoutid, F.; Mignet, N.; Alhareth, K.; Corvis, Y. Deep Eutectic Solvents: An Eco-Friendly Design for Drug Engineering. ChemSusChem 2023, 16, e202300669. [Google Scholar] [CrossRef]
- Lomba, L.; Ribate, M.P.; Zaragoza, E.; Concha, J.; Garralaga, M.P.; Errazquin, D.; García, C.B.; Giner, B. Deep Eutectic Solvents: Are They Safe? Appl. Sci. 2021, 11, 10061. [Google Scholar] [CrossRef]
- Lomba, L.; García, C.B.; Ribate, P.; Giner, B.; Zuriaga, E.; Silvestre, D. Applications of Deep Eutectic Solvents Related to Health, Synthesis, and Extraction of Natural Based Chemicals. Appl. Sci. 2021, 11, 10156. [Google Scholar] [CrossRef]
- García, C.B.; Concha, J.; Culleré, L.; Lomba, L.; Sangüesa, E.; Ribate, M.P. Has the Toxicity of Therapeutic Deep Eutectic Systems Been Assessed? Appl. Sci. 2023, 13, 5980. [Google Scholar] [CrossRef]
- Stott, P.W.; Williams, A.C.; Barry, B.W. Transdermal Delivery from Eutectic Systems: Enhanced Permeation of a Model Drug, Ibuprofen. J. Control. Release 1998, 50, 297–308. [Google Scholar] [CrossRef]
- Aroso, I.M.; Craveiro, R.; Rocha, Â.; Dionísio, M.; Barreiros, S.; Reis, R.L.; Paiva, A.; Duarte, A.R.C. Design of Controlled Release Systems for THEDES—Therapeutic Deep Eutectic Solvents, Using Supercritical Fluid Technology. Int. J. Pharm. 2015, 492, 73–79. [Google Scholar] [CrossRef] [PubMed]
- Aroso, I.M.; Silva, J.C.; Mano, F.; Ferreira, A.S.D.; Dionísio, M.; Sá-Nogueira, I.; Barreiros, S.; Reis, R.L.; Paiva, A.; Duarte, A.R.C. Dissolution Enhancement of Active Pharmaceutical Ingredients by Therapeutic Deep Eutectic Systems. Eur. J. Pharm. Biopharm. 2016, 98, 57–66. [Google Scholar] [CrossRef]
- Pereira, J.; Miguel Castro, M.; Santos, F.; Rita Jesus, A.; Paiva, A.; Oliveira, F.; Duarte, A.R.C. Selective Terpene Based Therapeutic Deep Eutectic Systems against Colorectal Cancer. Eur. J. Pharm. Biopharm. 2022, 175, 13–26. [Google Scholar] [CrossRef]
- Pereira, C.V.; Silva, J.M.; Rodrigues, L.; Reis, R.L.; Paiva, A.; Duarte, A.R.C.; Matias, A. Unveil the Anticancer Potential of Limomene Based Therapeutic Deep Eutectic Solvents. Sci. Rep. 2019, 9, 14926. [Google Scholar] [CrossRef]
- Silva, E.; Oliveira, F.; Silva, J.M.; Matias, A.; Reis, R.L.; Duarte, A.R.C. Optimal Design of THEDES Based on Perillyl Alcohol and Ibuprofen. Pharmaceutics 2020, 12, 1121. [Google Scholar] [CrossRef]
- Roda, A.; Santos, F.; Matias, A.A.; Paiva, A.; Duarte, A.R.C. Design and Processing of Drug Delivery Formulations of Therapeutic Deep Eutectic Systems for Tuberculosis. J. Supercrit. Fluids 2020, 161, 104826. [Google Scholar] [CrossRef]
- Ibuprofen—StatPearls—NCBI Bookshelf. Available online: https://www.ncbi.nlm.nih.gov/books/NBK542299/ (accessed on 29 December 2024).
- Guzmán, E.; Lucia, A. Essential Oils and Their Individual Components in Cosmetic Products. Cosmetics 2021, 8, 114. [Google Scholar] [CrossRef]
- Makibuchi, T.; Yamashiro, K.; Anazawa, S.; Fujimoto, T.; Ochi, G.; Ikarashi, K.; Sato, D. Assessing the Effects of the Topical Application of L-Menthol on Pain-Related Somatosensory-Evoked Potentials Using Intra-Epidermal Stimulation. Brain Sci. 2023, 13, 918. [Google Scholar] [CrossRef] [PubMed]
- Wang, G.; Hurr, C. Effects of Cutaneous Administration of an Over-the-Counter Menthol Cream during Temperate-Water Immersion for Exercise-Induced Hyperthermia in Men. Front. Physiol. 2023, 14, 1161240. [Google Scholar] [CrossRef] [PubMed]
- Nagai, N.; Ogata, F.; Deguchi, S.; Fushiki, A.; Daimyo, S.; Otake, H.; Kawasaki, N. Design of a Transdermal Sustained Release Formulation Based on Water-Soluble Ointment Incorporating Tulobuterol Nanoparticles. Pharmaceutics 2022, 14, 2431. [Google Scholar] [CrossRef] [PubMed]
- Ma, F.; He, H.; Xu, B.; Zhou, J.; Pu, K. Effect of Sterile Ice Water versus Menthol Spray on Thirst Symptoms of Fasted Children in the Intensive Care Unit: A Prospective Cohort Study. Medicine 2023, 102, E33315. [Google Scholar] [CrossRef]
- Acharya, P.C.; Suares, D.; Shetty, S.; Fernandes, C.; Tekade, R.K. Rheology and Its Implications on Performance of Liquid Dosage Forms. In Dosage Form Design Considerations; Tekade, R.K., Ed.; Academic Press: New York, NY, USA, 2018; Volume I, pp. 549–597. ISBN 9780128144244. [Google Scholar]
- Esfahani, M.H.; Bergua, F.; Delso, I.; Lafuente, C.; Artal, M. Geraniol and Hydrophobic Geraniol:Thymol Eutectic Mixtures: Structure and Thermophysical Characterization. Ind. Crops Prod. 2024, 222, 119781. [Google Scholar] [CrossRef]
- Martins, M.A.R.; Pinho, S.P.; Coutinho, J.A.P. Insights into the Nature of Eutectic and Deep Eutectic Mixtures. J. Solut. Chem. 2019, 48, 962–982. [Google Scholar] [CrossRef]
- Dwivedi, S.K.; Sattari, S.; Jamali, F.; Mitchell, A.G. Ibuprofen Racemate and Enantiomers: Phase Diagram, Solubility and Thermodynamic Studies. Int. J. Pharm. 1992, 87, 95–104. [Google Scholar] [CrossRef]
- Štejfa, V.; Bazyleva, A.; Fulem, M.; Rohlíček, J.; Skořepová, E.; Růžička, K.; Blokhin, A.V. Polymorphism and Thermophysical Properties of L- and Dl-Menthol. J. Chem. Thermodyn. 2019, 131, 524–543. [Google Scholar] [CrossRef] [PubMed]
- Bergua, F.; Castro, M.; Lafuente, C.; Artal, M. Thymol+l-Menthol Eutectic Mixtures: Thermophysical Properties and Possible Applications as Decontaminants. J. Mol. Liq. 2022, 368, 120789. [Google Scholar] [CrossRef]
- Vogel, H. Das Temperaturabhangigkeitsgesetz der Viskositat von Flussigkeiten. Phys. Z. 1921, 22, 645–646. [Google Scholar]
- Tammann, G.; Hesse, W. Die Abhängigkeit Der Viscosität von Der Temperatur Bie Unterkühlten Flüssigkeiten. Z. Anorg. Allg. Chem. 1926, 156, 245–257. [Google Scholar] [CrossRef]
- Smith, E.L.; Abbott, A.P.; Ryder, K.S. Deep Eutectic Solvents (DESs) and Their Applications. Chem. Rev. 2014, 114, 11060–11082. [Google Scholar] [CrossRef]
- Zhang, M.; Zhang, X.; Liu, Y.; Wu, K.; Zhu, Y.; Lu, H.; Liang, B. Insights into the Relationships between Physicochemical Properties, Solvent Performance, and Applications of Deep Eutectic Solvents. Environ. Sci. Pollut. Res. Int. 2021, 28, 35537–35563. [Google Scholar] [CrossRef]
- Abdallah, M.M.; Cardeira, M.; Matias, A.A.; Bronze, M.R.; Fernández, N. Lactic Acid-Based Natural Deep Eutectic Solvents to Extract Bioactives from Marine By-Products. Molecules 2022, 27, 4356. [Google Scholar] [CrossRef]
- Kovacs, S.; Hawes, S.E.; Maley, S.N.; Mosites, E.; Wong, L.; Stergachis, A. Technologies for Detecting Falsified and Substandard Drugs in Low and Middle-Income Countries. PLoS ONE 2014, 9, e90601. [Google Scholar] [CrossRef]
- García, G.; Aparicio, S.; Ullah, R.; Atilhan, M. Deep Eutectic Solvents: Physicochemical Properties and Gas Separation Applications. Energy Fuels 2015, 29, 2616–2644. [Google Scholar] [CrossRef]
- Mohan, S.; Kato, E.; Drennen, J.K.; Anderson, C.A. Refractive Index Measurement of Pharmaceutical Solids: A Review of Measurement Methods and Pharmaceutical Applications. J. Pharm. Sci. 2019, 108, 3478–3495. [Google Scholar] [CrossRef] [PubMed]
- Al-Sanea, M.M.; Gamal, M. Critical Analytical Review: Rare and Recent Applications of Refractive Index Detector in HPLC Chromatographic Drug Analysis. Microchem. J. 2022, 178, 107339. [Google Scholar] [CrossRef]
- Peyrovedin, H.; Haghbakhsh, R.; Duarte, A.R.C.; Raeissi, S. A Global Model for the Estimation of Speeds of Sound in Deep Eutectic Solvents. Molecules 2020, 25, 1626. [Google Scholar] [CrossRef] [PubMed]
- Xu, F.; Sun, L.X.; Tan, Z.C.; Liang, J.G.; Li, R.L. Thermodynamic Study of Ibuprofen by Adiabatic Calorimetry and Thermal Analysis. Thermochim. Acta 2004, 412, 33–57. [Google Scholar] [CrossRef]
- Riddick, J.A.; Bunger, W.B.; Sakano, T.K. Organic Solvents: Physical Properties and Methods of Purification, 4th ed.; Wiley Interscience: Hoboken, NJ, USA, 1986. [Google Scholar]
- Kadhom, M.A.; Abdullah, G.H.; Al-Bayati, N. Studying Two Series of Ternary Deep Eutectic Solvents (Choline Chloride–Urea–Glycerol) and (Choline Chloride–Malic Acid–Glycerol), Synthesis and Characterizations. Arab. J. Sci. Eng. 2017, 42, 1579–1589. [Google Scholar] [CrossRef]
- El Achkar, T.; Greige-Gerges, H.; Fourmentin, S. Basics and Properties of Deep Eutectic Solvents: A Review. Environ. Chem. Lett. 2021, 19, 3397–3408. [Google Scholar] [CrossRef]
- Zuriaga, E.; Giner, B.; Ribate, M.P.; Garcia, C.B.; Lomba, L. Exploring the Usefulness of Key Green Physicochemical Properties: Quantitative Structure-Activity Relationship for Solvents From Biomass. Environ. Toxicol. Chem. 2018, 37, 1014–1023. [Google Scholar] [CrossRef]
- Simões, A.; Miranda, M.; Cardoso, C.; Veiga, F.; Vitorino, C. Rheology by Design: A Regulatory Tutorial for Analytical Method Validation. Pharmaceutics 2020, 12, 820. [Google Scholar] [CrossRef] [PubMed]
- Park, E.K.; Song, K.W. Rheological Evaluation of Petroleum Jelly as a Base Material in Ointment and Cream Formulations: Steady Shear Flow Behavior. Arch. Pharm. Res. 2010, 33, 141–150. [Google Scholar] [CrossRef]
- Cardoso De Oliveira, R.; Rossi, R.M.; Gimenes, M.L.; Jagadevan, S.; Machado Giufrida, W.; Davantel De Barros, S.T. Extraction of Passion Fruit Seed Oil Using Supercritical CO2: A Study of Mass Transfer and Rheological Property by Bayesian Inference. Grasas y Aceites 2013, 64, 400–406. [Google Scholar] [CrossRef]
- Younk, S.; George, J.L.; Luksic, S.A.; Marcial, J.; Cutforth, D.A.; Hrma, P.; Ferkl, P.; Kruger, A.A.; Pokorny, R. Thermo-Rheological Snapshot of Melter Feed Conversion to Glass. J. Am. Ceram. Soc. 2025, 108, e20208. [Google Scholar] [CrossRef]
- Lall, N.; Henley-Smith, C.J.; De Canha, M.N.; Oosthuizen, C.B.; Berrington, D. Viability Reagent, PrestoBlue, in Comparison WithOther Available Reagents, Utilized in Cytotoxicity AndAntimicrobial Assays. Int. J. Microbiol. 2013, 2013, 420601. [Google Scholar] [CrossRef] [PubMed]
- Silva, E.; Oliveira, F.; Silva, J.M.; Reis, R.L.; Duarte, A.R.C. Untangling the Bioactive Properties of Therapeutic Deep Eutectic Solvents Based on Natural Terpenes. Curr. Res. Chem. Biol. 2021, 1, 100003. [Google Scholar] [CrossRef]
- Feoktistova, M.; Geserick, P.; Leverkus, M. Crystal Violet Assay for Determining Viability of Cultured Cells. Cold Spring Harb. Protoc. 2016, 2016, 343–346. [Google Scholar] [CrossRef]
- Rogatsky, E. Pandora Box of BCA Assay. Investigation of the Accuracy and Linearity of the Microplate Bicinchoninic Protein Assay: Analytical Challenges and Method Modifications to Minimize Systematic Errors. Anal. Biochem. 2021, 631, 114321. [Google Scholar] [CrossRef]
- Smith, P.K.; Krohn, R.I.; Hermanson, G.T.; Mallia, A.K.; Gartner, F.H.; Provenzano, M.D.; Fujimoto, E.K.; Goeke, N.M.; Olson, B.J.; Klenk, D.C. Measurement of Protein Using Bicinchoninic Acid. Anal. Biochem. 1985, 150, 76–85. [Google Scholar] [CrossRef]
- Brown, R.E.; Jarvis, K.L.; Hyland, K.J. Protein Measurement Using Bicinchoninic Acid: Elimination of Interfering Substances. Anal. Biochem. 1989, 180, 136–139. [Google Scholar] [CrossRef]
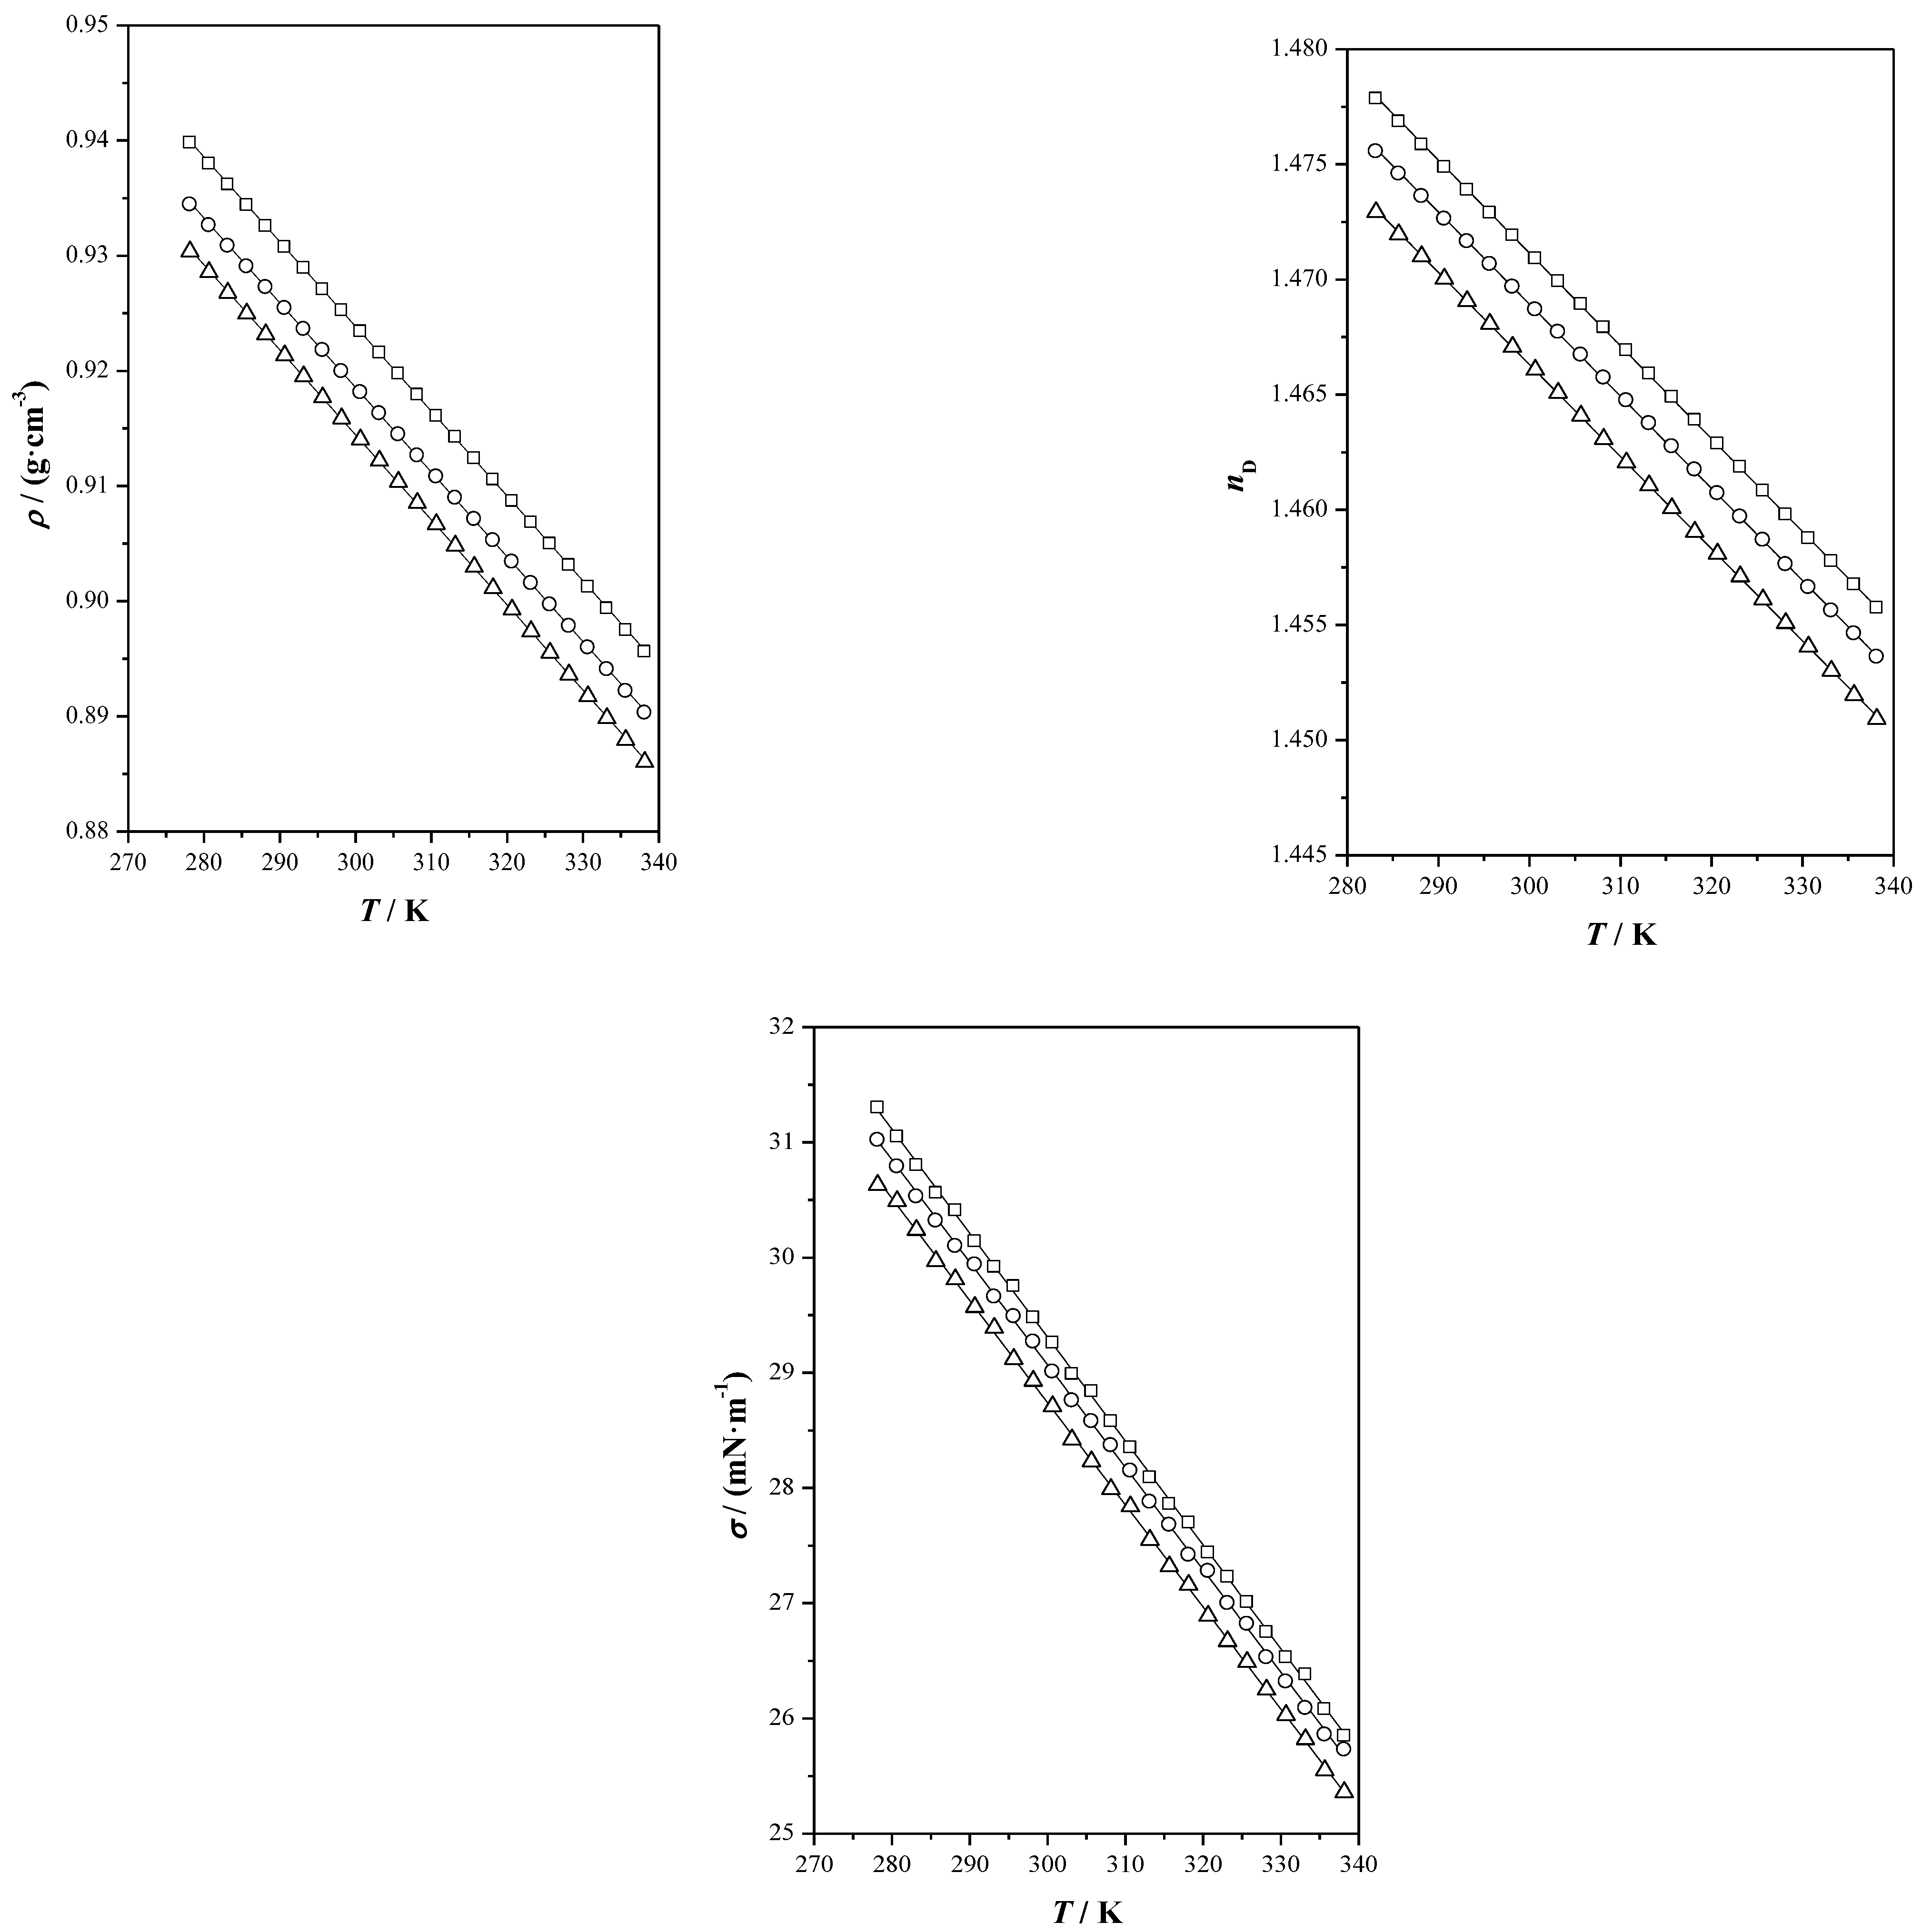
 ), menthol (
 ), Ibu-M3 (
 ), Ibu-M4 (
 ) and Ibu-M5(
 ).
), menthol (), Ibu-M3 (), Ibu-M4 () and Ibu-M5().
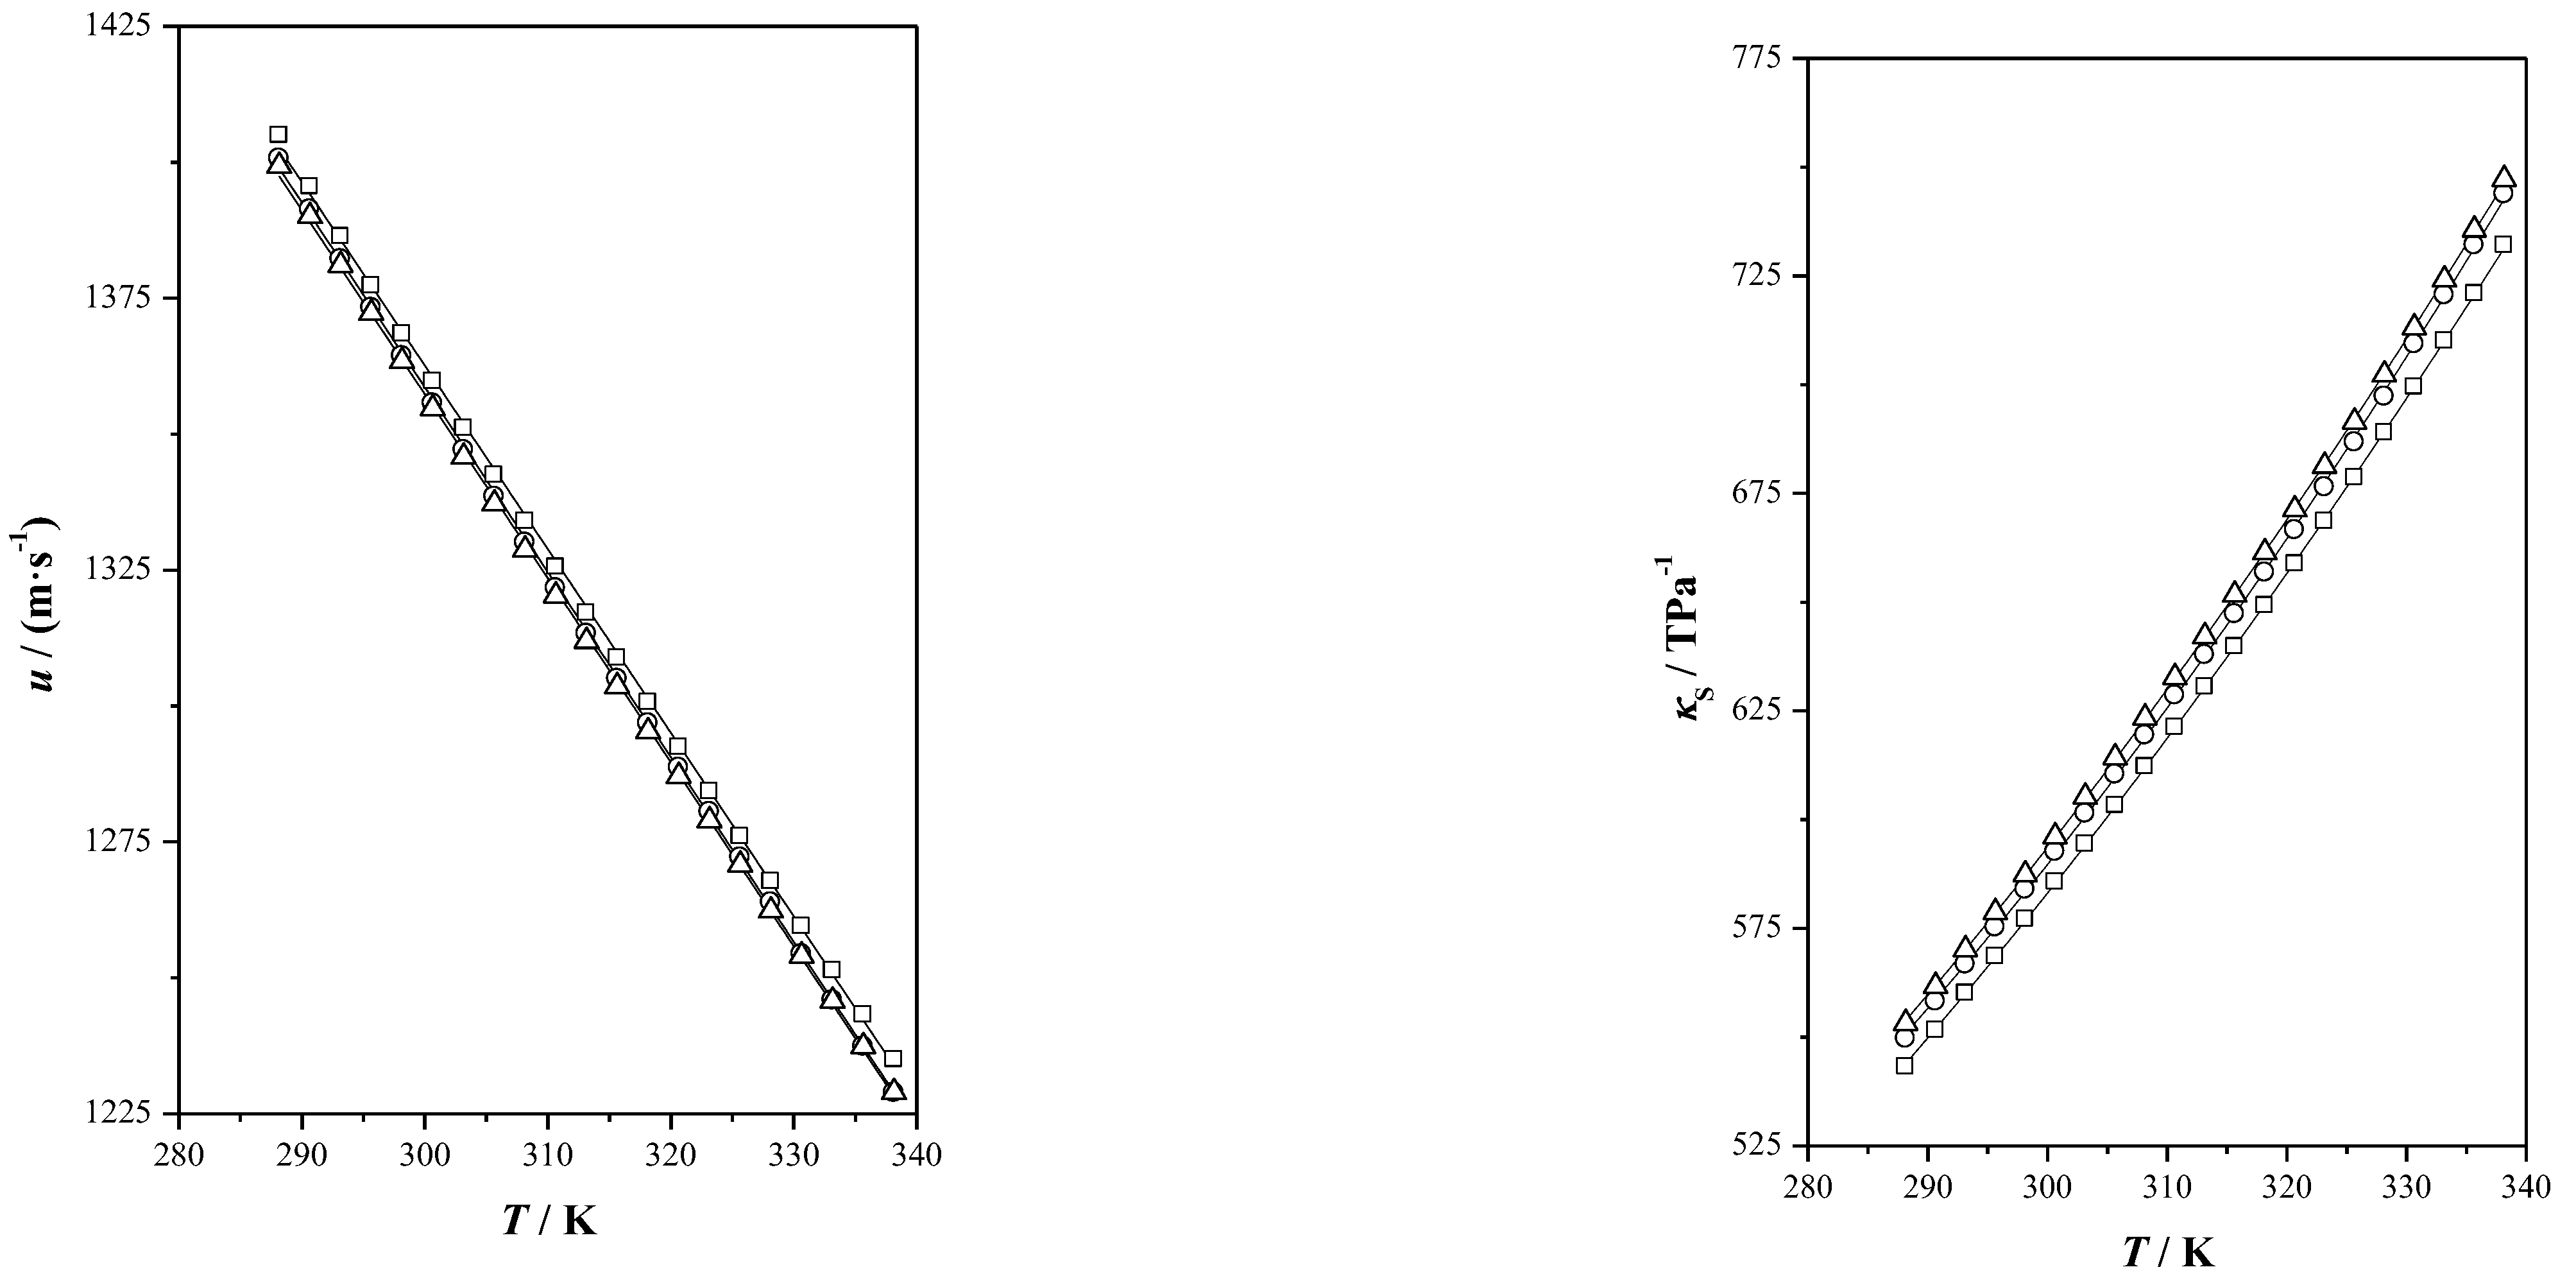
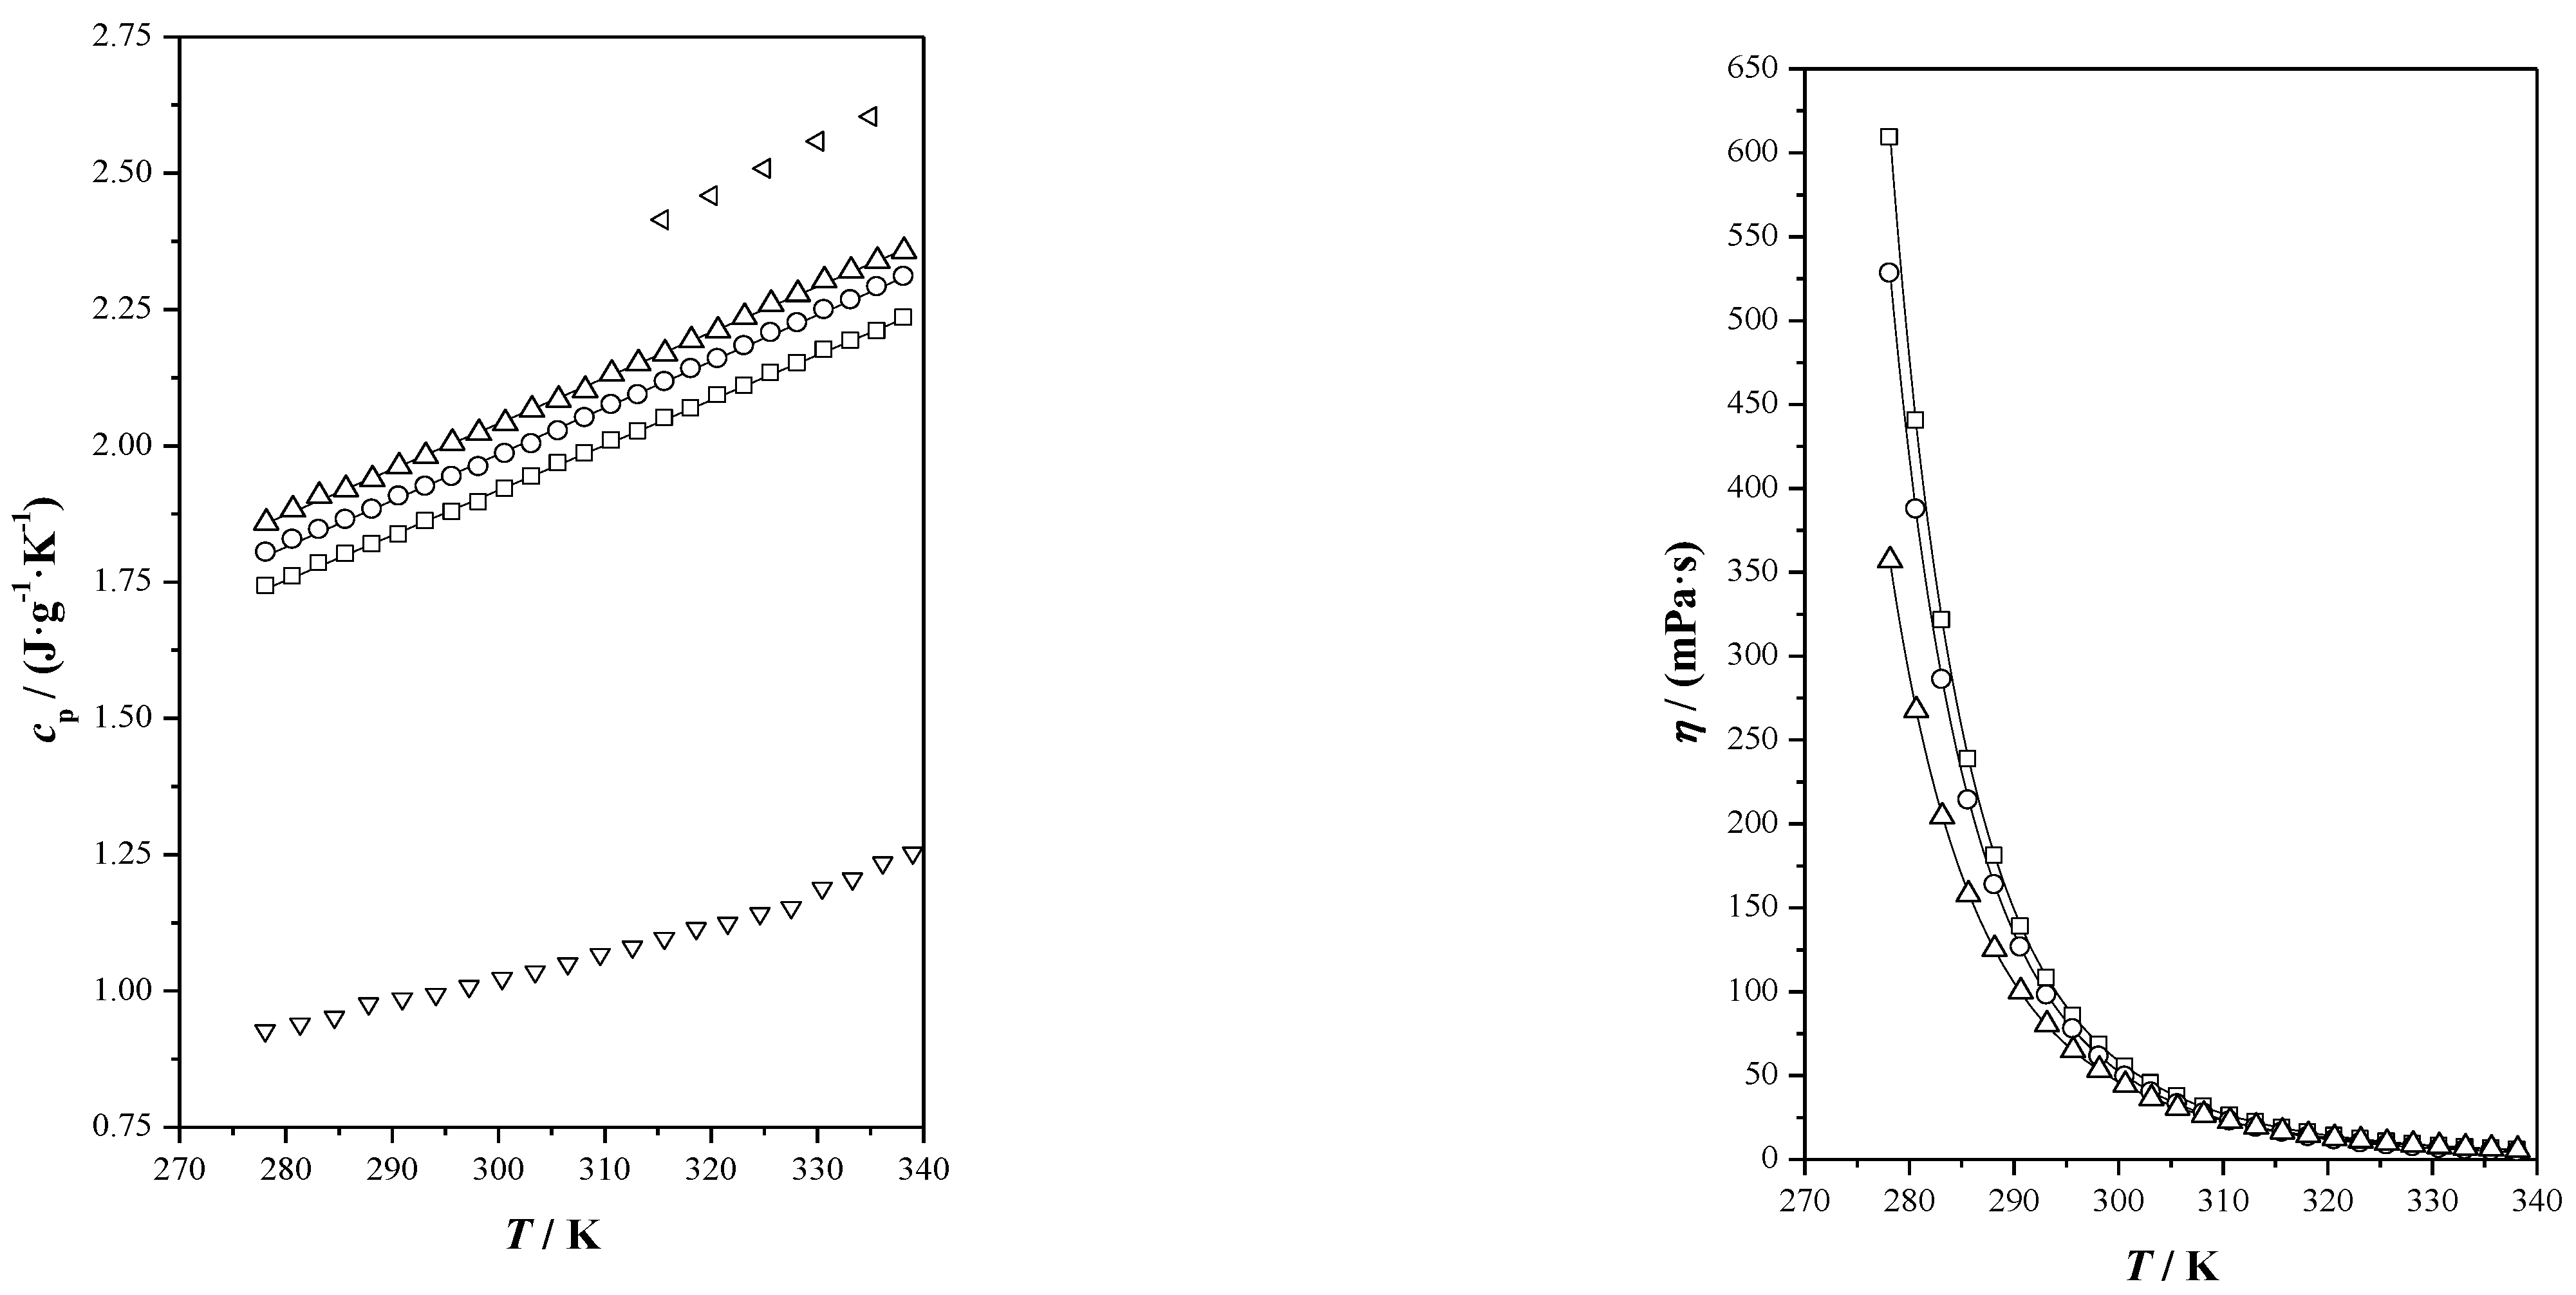
).
), menthol (), Ibu-M3 (), Ibu-M4 () and Ibu-M5().
 ), menthol (), Ibu-M3 (), Ibu-M4 (); and Ibu-M5 ().
), menthol (), Ibu-M3 (), Ibu-M4 (); and Ibu-M5 ().
), menthol (), Ibu-M3 (), Ibu-M4 (); and Ibu-M5 ().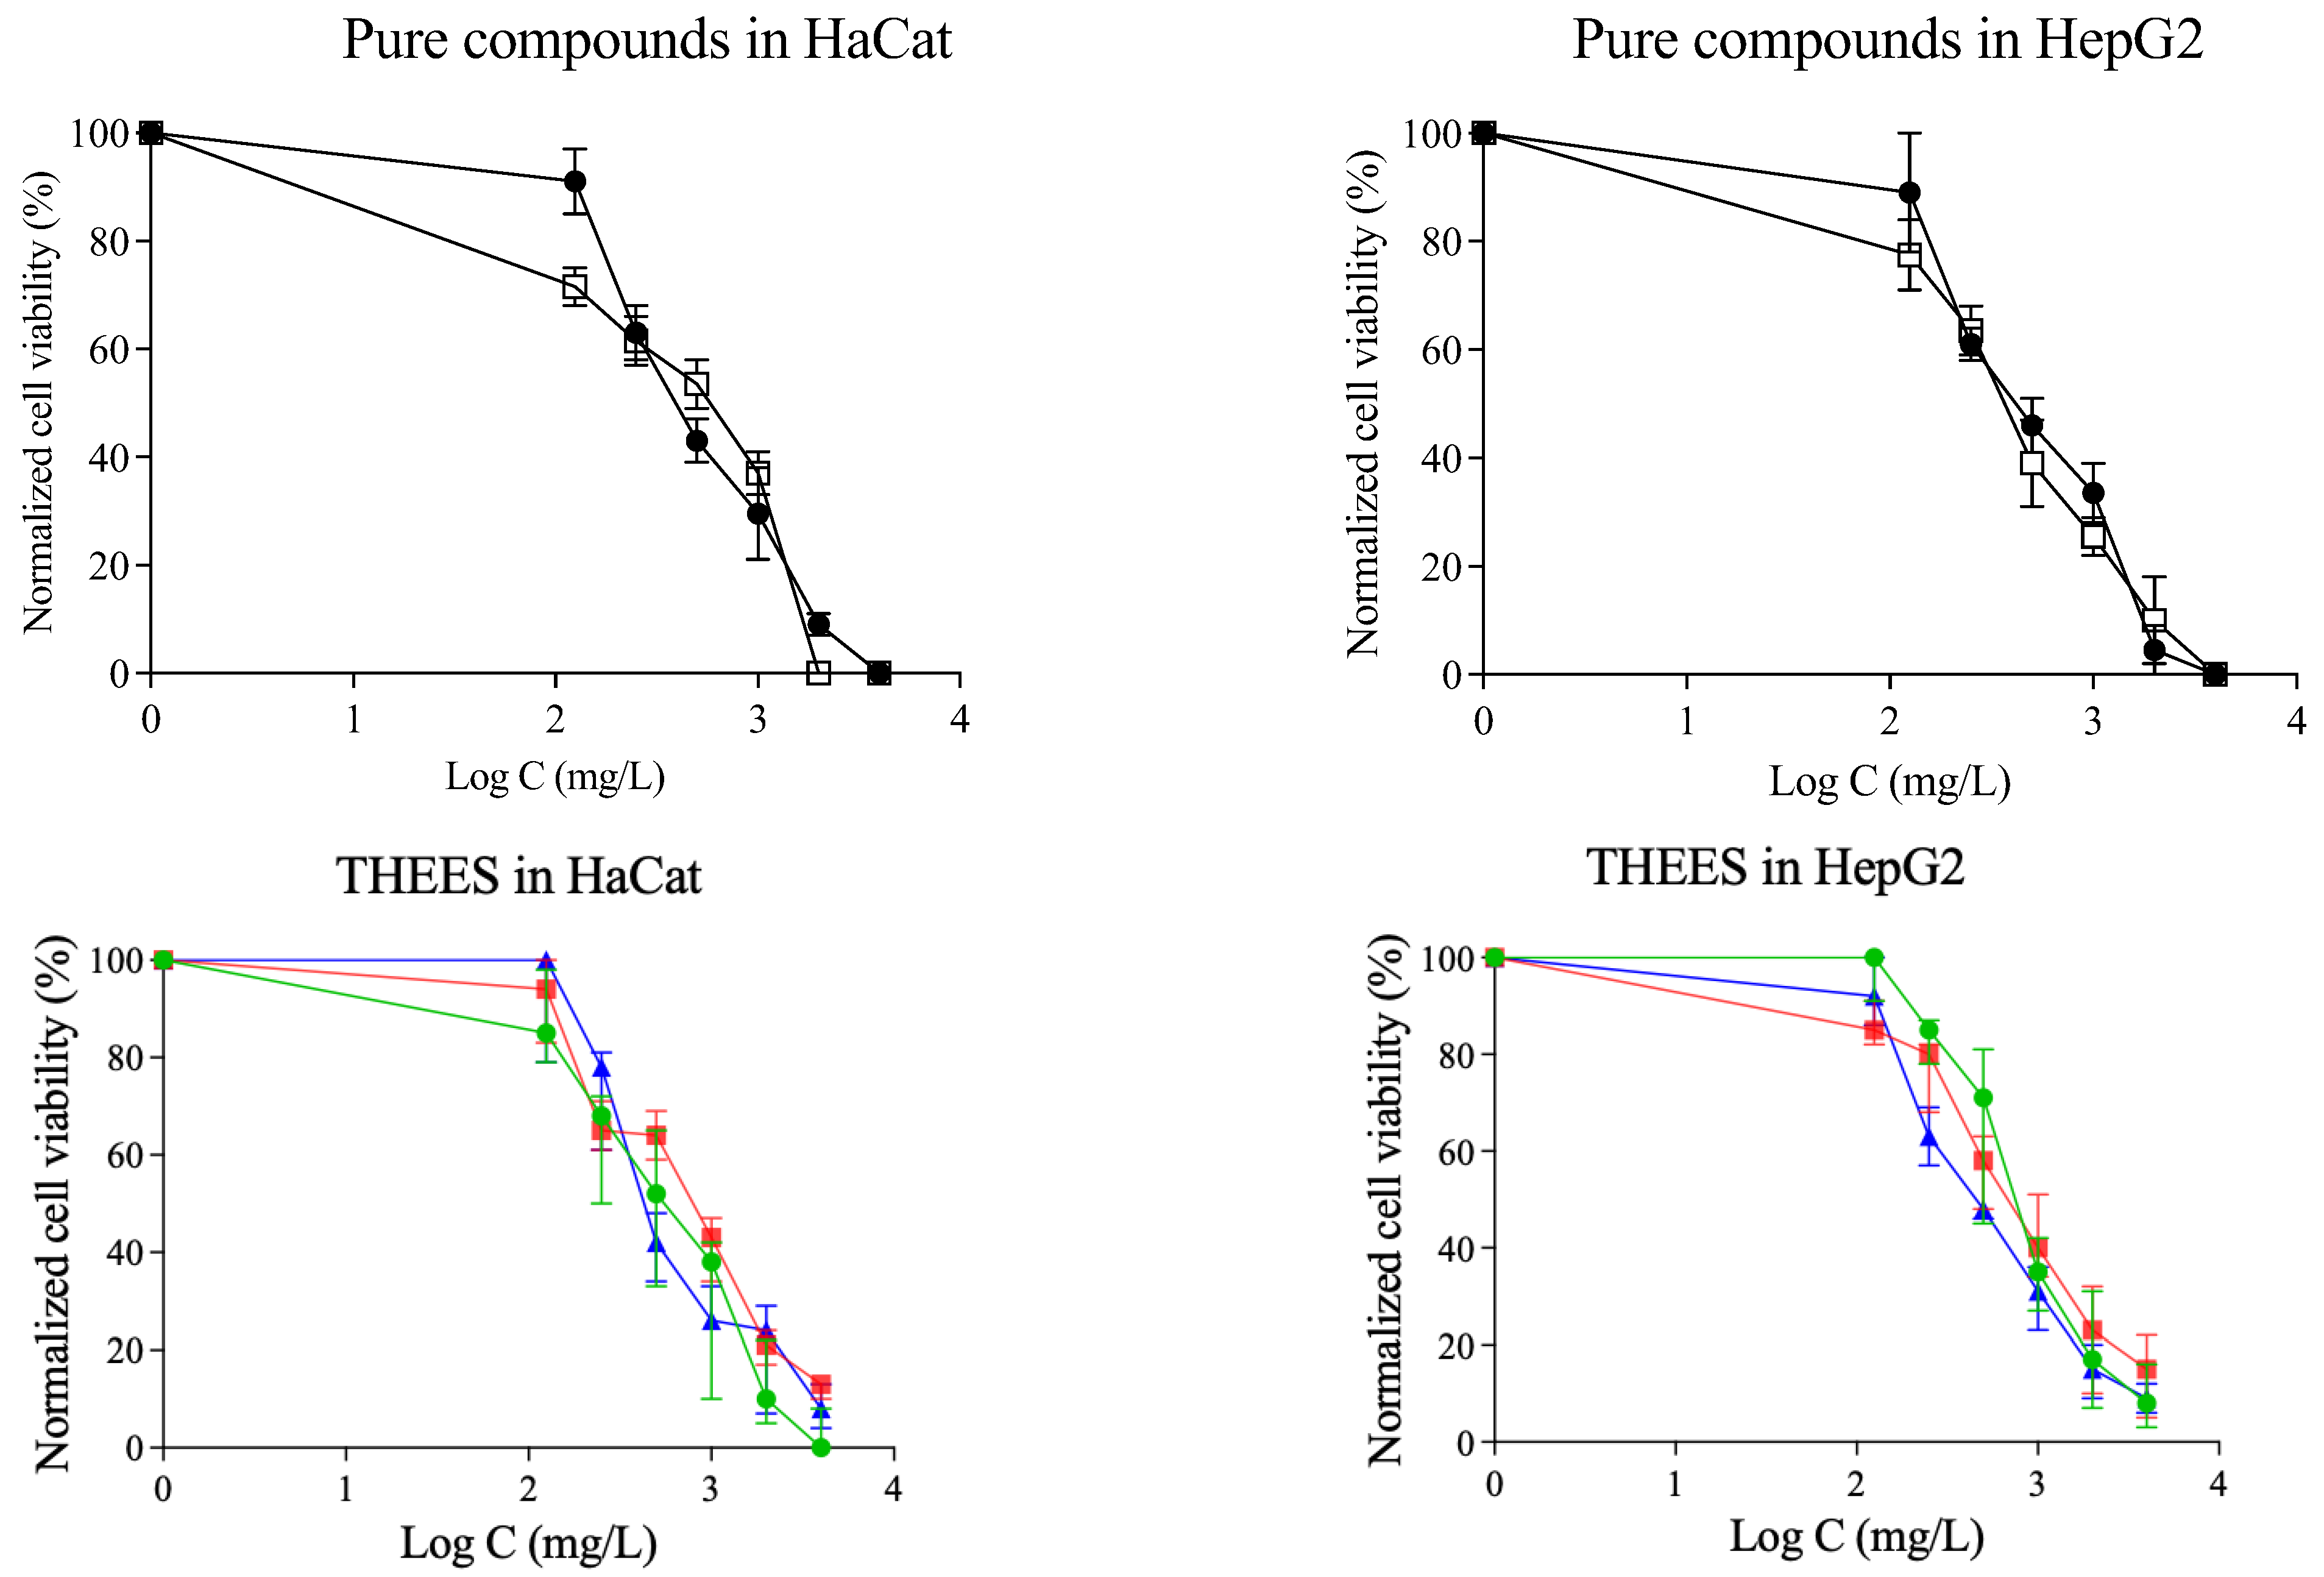 ), menthol (), Ibu-M3 (), Ibu-M4 () and Ibu-M5 ().
), menthol (), Ibu-M3 (), Ibu-M4 () and Ibu-M5 ().
), menthol (), Ibu-M3 (), Ibu-M4 () and Ibu-M5 ().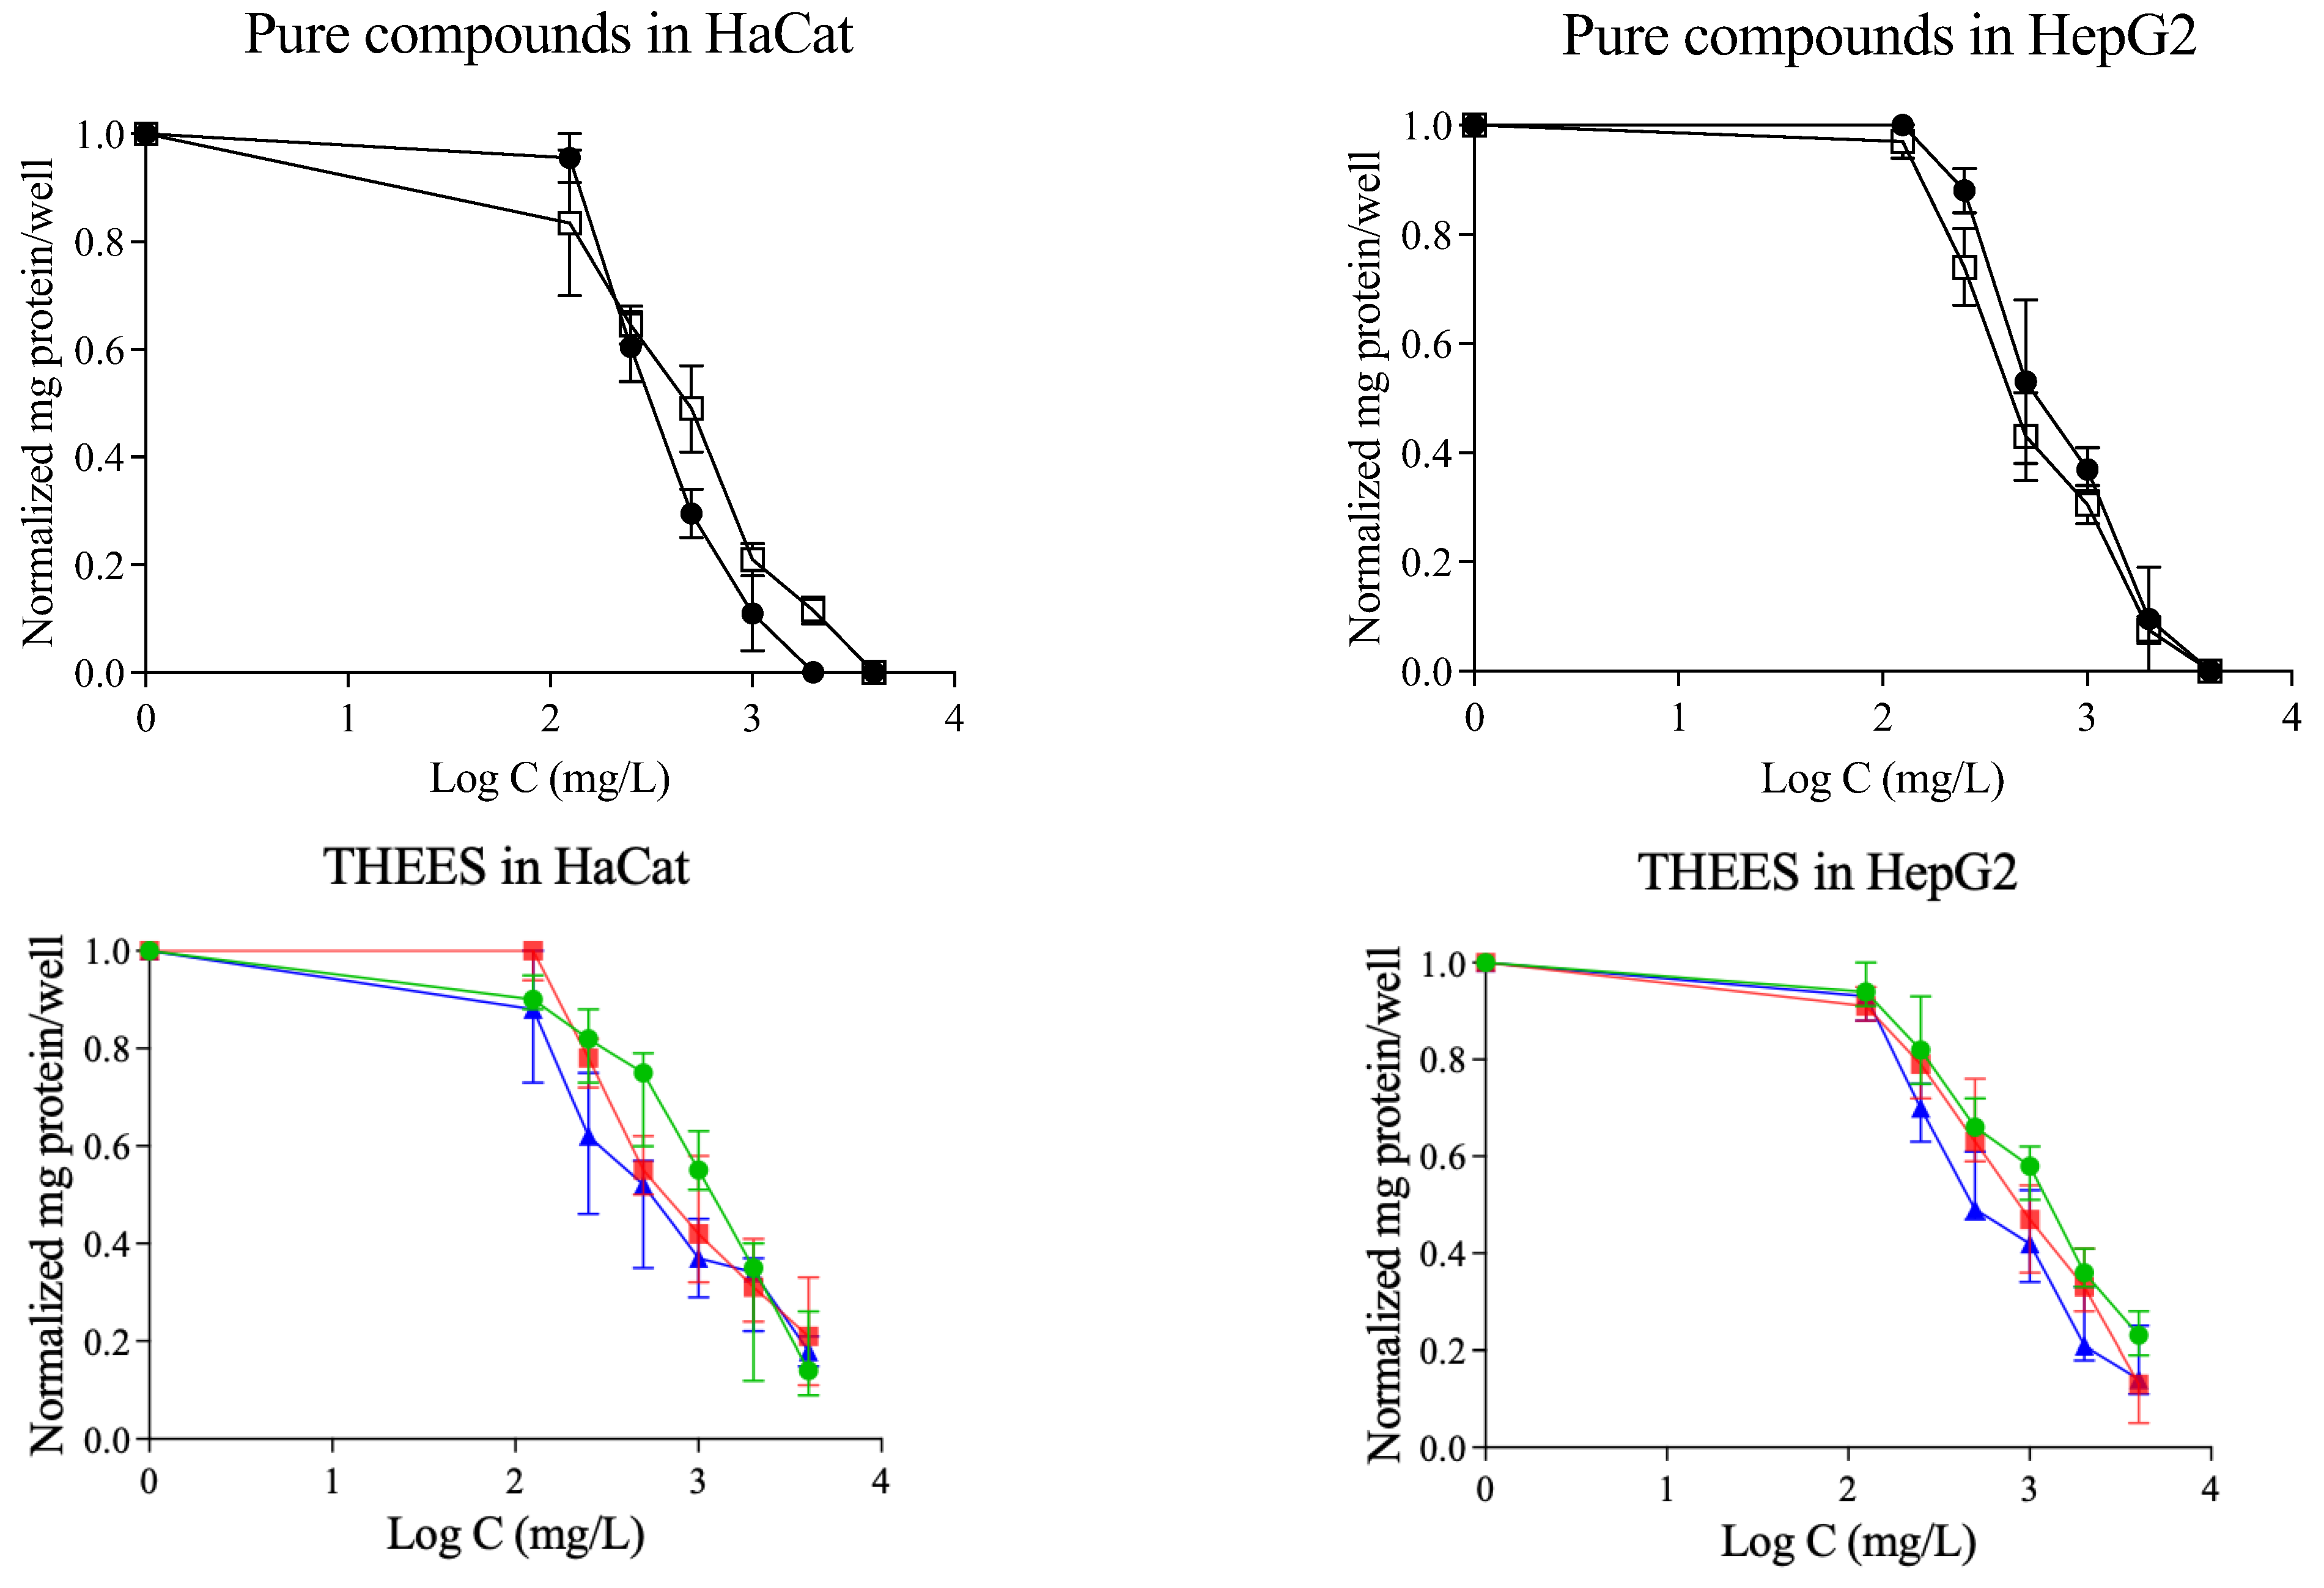

| THEES | Abbreviation | Molar Ratio | Molar Mass (g/mol) |
|---|---|---|---|
| Ibuprofen/menthol | Ibu-M3 | 1:3 | 168.78 |
| Ibu-M4 | 1:4 | 166.27 | |
| Ibu-M5 | 1:5 | 164.61 |
| THEES | 1011 DI/m2·s−1 | 1011 DM/m2·s−1 | 1011 DOH/m2·s−1 |
|---|---|---|---|
| Ibu-M3 | 1.174 | 1.843 | 1.868 |
| Ibu-M4 | 1.271 | 2.002 | 1.953 |
| Ibu-M5 | 1.279 | 2.041 | 2.032 |
| Compound/System | Abbreviation | Composition (Molar Ratio) | Molar Mass(g/mol) | Tm,exp (K) | Tm,lit (K) |
|---|---|---|---|---|---|
| Ibuprofen | - | - | 206.29 | 347.33 | 344.15 [25] |
| DL-Menthol | - | - | 156.27 | α = 307.44 | α = 307.44 [26] |
| β = 300.26 | β = 300.26 [26] | ||||
| Ibuprofen/menthol | Ibu-M3 | 1:3 | 168.78 | 253.00 | - |
| Ibu-M4 | 1:4 | 166.27 | 282.61 | - | |
| Ibu-M5 | 1:5 | 164.61 | 282.41 | - |
| THDES | HaCaT (mg/L) | HepG2 (mg/L) | Caco-2 (mg/L) |
|---|---|---|---|
| Ibuprofen | 388 ± 8 | 435 ± 7 | 596.2 [13] |
| Menthol | 361 ± 8 | 419 ± 9 | 795.4 [48] |
| Ibu-M3 | 579 ± 5 | 530 ± 8 | 1505.5 [12,48] |
| Ibu-M4 | 427 ± 11 | 352 ± 8 | - |
| Ibu-M5 | 218 ± 6 | 228 ± 6 | - |
| THEES | Property | A | B | C | S |
|---|---|---|---|---|---|
| Ibu-M3 | ρ/(g·cm−3) | −0.000736 | 1.14476 | 0.0001 | |
| u/(m·s−1) | −3.302 | 2353.35 | 1.96 | ||
| nD | −0.000402 | 1.591809 | 0.0001 | ||
| σ/(mN·m−1) | −0.0902 | 56.36 | 0.03 | ||
| cp/(J·g−1·K−1) | −0.5622 | 0.00827 | 0.0030 | ||
| η a/(mPa·s) | 0.0097 | 894.7 | 197.17 | 0.58 | |
| Ibu-M4 | ρ/(g·cm−3) | −0.000735 | 1.13917 | 0.0002 | |
| u/(m·s−1) | −3.400 | 2387.67 | 0.74 | ||
| nD | −0.000399 | 1.588761 | 0.0002 | ||
| σ/(mN·m−1) | −0.0890 | 55.76 | 0.03 | ||
| cp/(J·g−1·K−1) | −0.5677 | 0.00851 | 0.0043 | ||
| η/(mPa·s) | 0.0016 | 1253.3 | 179.66 | 0.60 | |
| Ibu-M5 | ρ/(g·cm−3) | −0.000738 | 1.13598 | 0.0002 | |
| u/(m·s−1) | −3.295 | 2349.22 | 5.09 | ||
| nD | −0.000404 | 1.586233 | 0.0001 | ||
| σ/(mN·m−1) | −0.0887 | 55.34 | 0.03 | ||
| cp/(J·g−1·K−1) | −0.47171 | 0.00837 | 0.0039 | ||
| η/(mPa·s) | 0.0174 | 839.1 | 193.64 | 0.41 |
| T (K) | 298.15 | 303.15 | 308.15 | 313.15 | 318.15 | 323.15 | 328.15 | 333.15 |
|---|---|---|---|---|---|---|---|---|
| Ibu-M3 | ||||||||
| τ0 (mN/m2) | 29.94 | 32.67 | 30.02 | 33.26 | 28.10 | 27.44 | 27.15 | 26.95 |
| k (g/s·m) | 17.31 | 10.06 | 7.523 | 4.599 | 3.392 | 2.478 | 1.287 | 1.052 |
| n | 1.040 | 1.083 | 1.069 | 1.122 | 1.116 | 1.121 | 1.218 | 1.220 |
| R2 | 0.9959 | 0.9936 | 0.9921 | 0.9955 | 0.9975 | 0.9891 | 0.9943 | 0.9933 |
| s | 47.82 | 42.91 | 33.23 | 19.87 | 10.49 | 16.53 | 9.805 | 8.809 |
| Ibu-M4 | ||||||||
| τ0 (mN/m2) | 26.29 | 28.51 | 27.09 | 25.64 | 26.75 | 25.60 | 23.98 | 22.38 |
| k (g/s·m) | 14.72 | 9.726 | 6.534 | 3.98 | 2.631 | 2.355 | 1.458 | 0.998 |
| n | 1.065 | 1.092 | 1.094 | 1.134 | 1.151 | 1.125 | 1.180 | 1.214 |
| R2 | 0.9978 | 0.9993 | 0.999 | 0.997 | 0.9965 | 0.995 | 0.996 | 0.9929 |
| s | 33.70 | 13.85 | 11.32 | 14.83 | 11.36 | 10.76 | 7.783 | 8.365 |
| Ibu-M5 | ||||||||
| τ0 (mN/m2) | 20.90 | 25.53 | 22.91 | 24.01 | 22.63 | 23.31 | 22.97 | 22.97 |
| k (g/s·m) | 17.50 | 10.04 | 6.872 | 4.217 | 3.223 | 2.090 | 1.040 | 0.8226 |
| n | 1.018 | 1.086 | 1.092 | 1.106 | 1.107 | 1.148 | 1.247 | 1.247 |
| R2 | 0.9989 | 0.993 | 0.998 | 0.9982 | 0.9967 | 0.9961 | 0.995 | 0.9928 |
| s | 22.79 | 45.40 | 16.97 | 10.55 | 11.13 | 9.413 | 8.546 | 8.1240 |
Disclaimer/Publisher’s Note: The statements, opinions and data contained in all publications are solely those of the individual author(s) and contributor(s) and not of MDPI and/or the editor(s). MDPI and/or the editor(s) disclaim responsibility for any injury to people or property resulting from any ideas, methods, instructions or products referred to in the content. |
© 2025 by the authors. Licensee MDPI, Basel, Switzerland. This article is an open access article distributed under the terms and conditions of the Creative Commons Attribution (CC BY) license (https://creativecommons.org/licenses/by/4.0/).
Share and Cite
Werner, Á.; Zuriaga, E.; Sanz, M.; Bergua, F.; Giner, B.; Lafuente, C.; Lomba, L. Exploring Ibuprofen–Menthol Eutectic Systems: Physicochemical Properties and Cytotoxicity for Pharmaceutical Applications. Pharmaceutics 2025, 17, 979. https://doi.org/10.3390/pharmaceutics17080979
Werner Á, Zuriaga E, Sanz M, Bergua F, Giner B, Lafuente C, Lomba L. Exploring Ibuprofen–Menthol Eutectic Systems: Physicochemical Properties and Cytotoxicity for Pharmaceutical Applications. Pharmaceutics. 2025; 17(8):979. https://doi.org/10.3390/pharmaceutics17080979
Chicago/Turabian StyleWerner, Álvaro, Estefanía Zuriaga, Marina Sanz, Fernando Bergua, Beatriz Giner, Carlos Lafuente, and Laura Lomba. 2025. "Exploring Ibuprofen–Menthol Eutectic Systems: Physicochemical Properties and Cytotoxicity for Pharmaceutical Applications" Pharmaceutics 17, no. 8: 979. https://doi.org/10.3390/pharmaceutics17080979
APA StyleWerner, Á., Zuriaga, E., Sanz, M., Bergua, F., Giner, B., Lafuente, C., & Lomba, L. (2025). Exploring Ibuprofen–Menthol Eutectic Systems: Physicochemical Properties and Cytotoxicity for Pharmaceutical Applications. Pharmaceutics, 17(8), 979. https://doi.org/10.3390/pharmaceutics17080979