Plasma Versus Whole Blood Tacrolimus Concentrations and Health-Related Quality of Life in Kidney Transplant Recipients

 , , , , , , , ,
  ,
,  ,
,  and
on behalf of TransplantLines Investigators
and
on behalf of TransplantLines Investigators
Abstract
1. Introduction
2. Materials and Methods
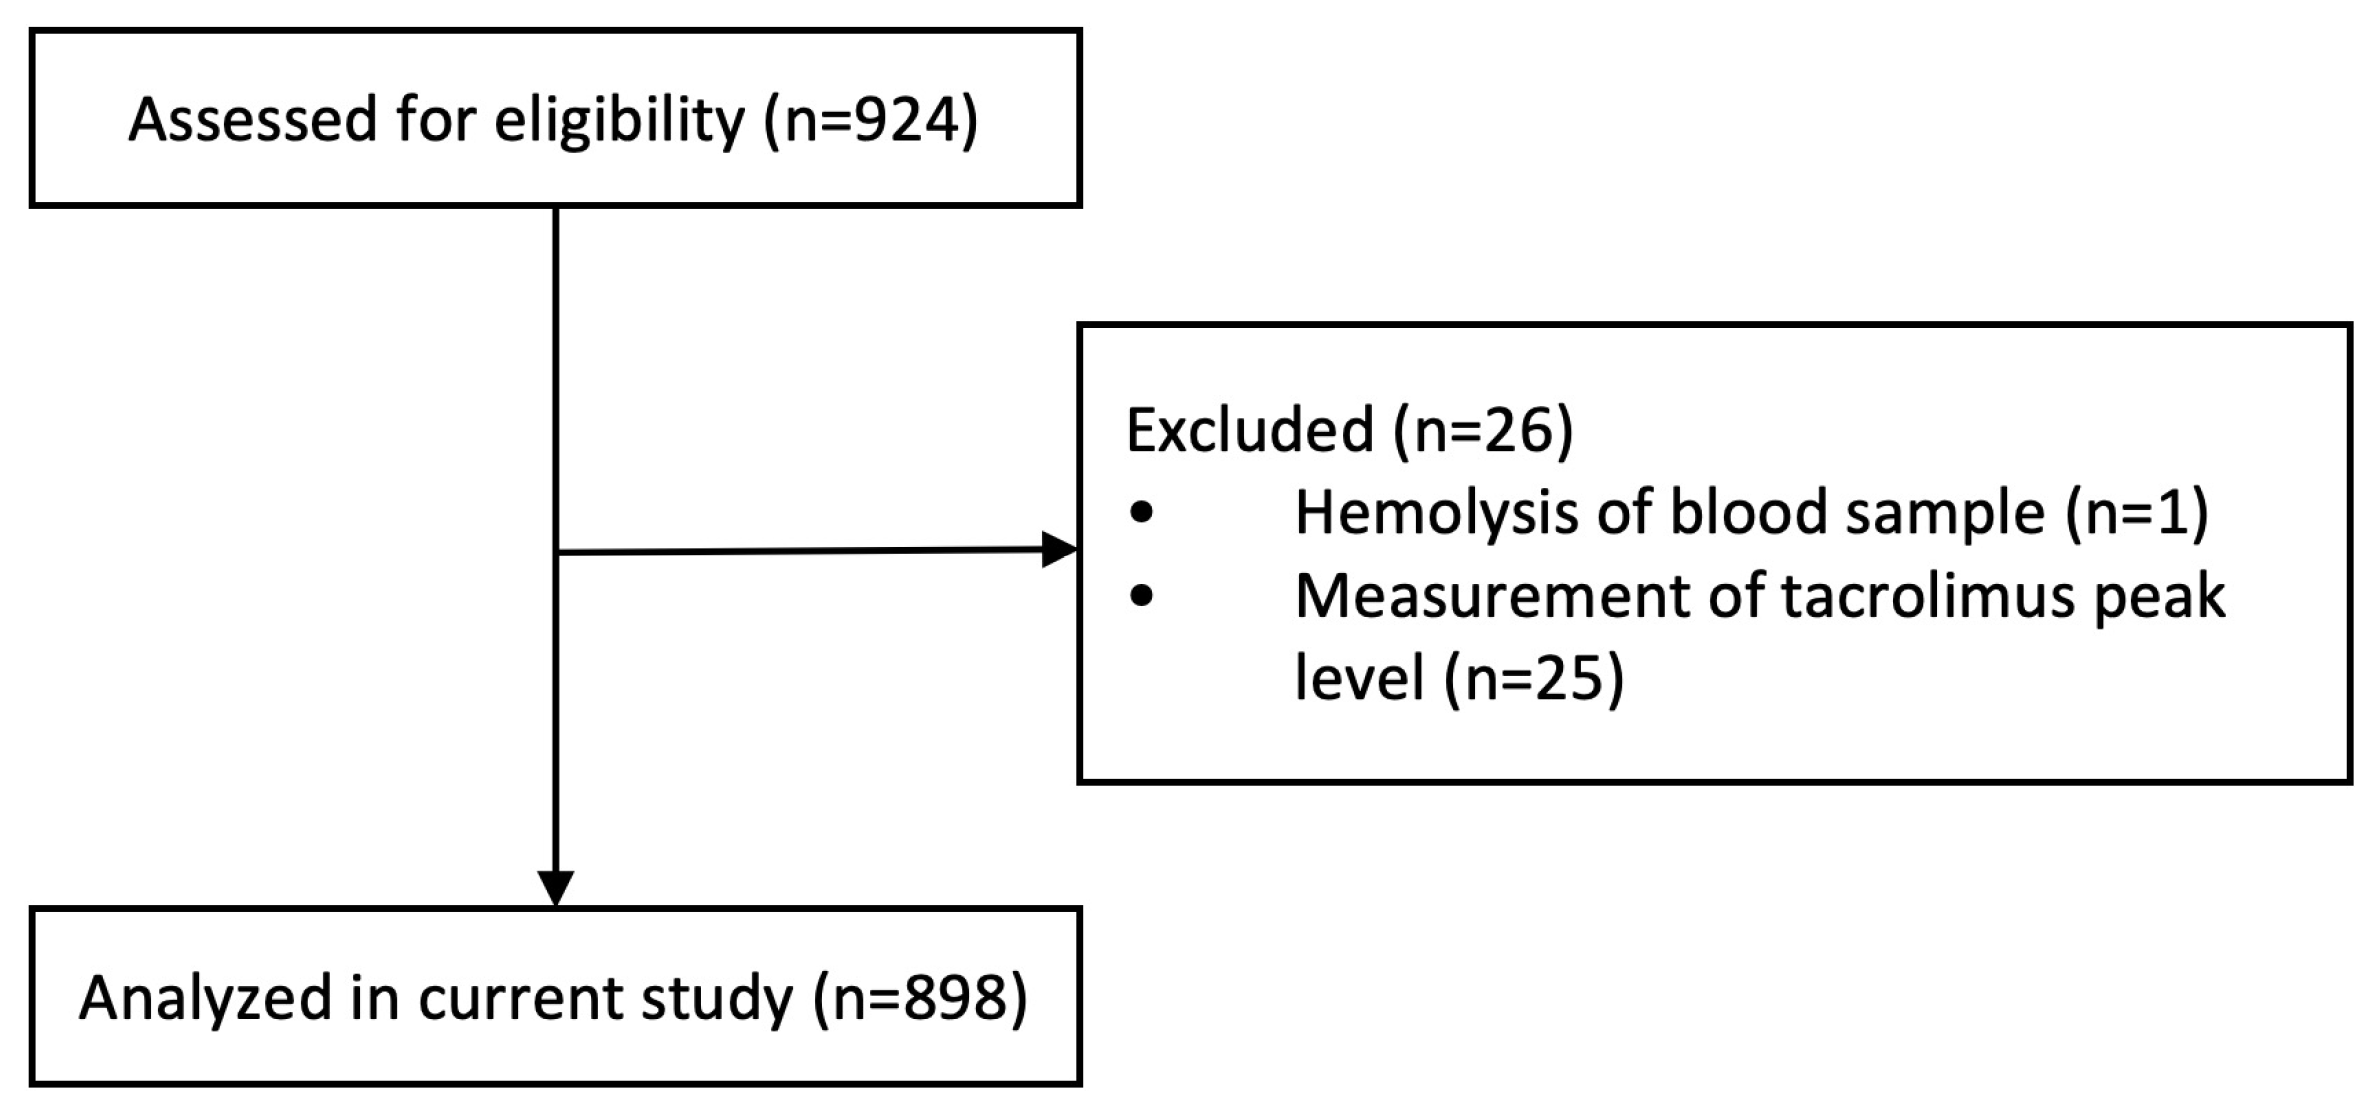
2.1. Patient Population and Study Design
2.2. Tacrolimus Analyses
2.3. Health-Related Quality of Life
2.4. Tacrolimus-Related Side Effects
2.5. Statistical Analyses
3. Results
3.1. Study Population
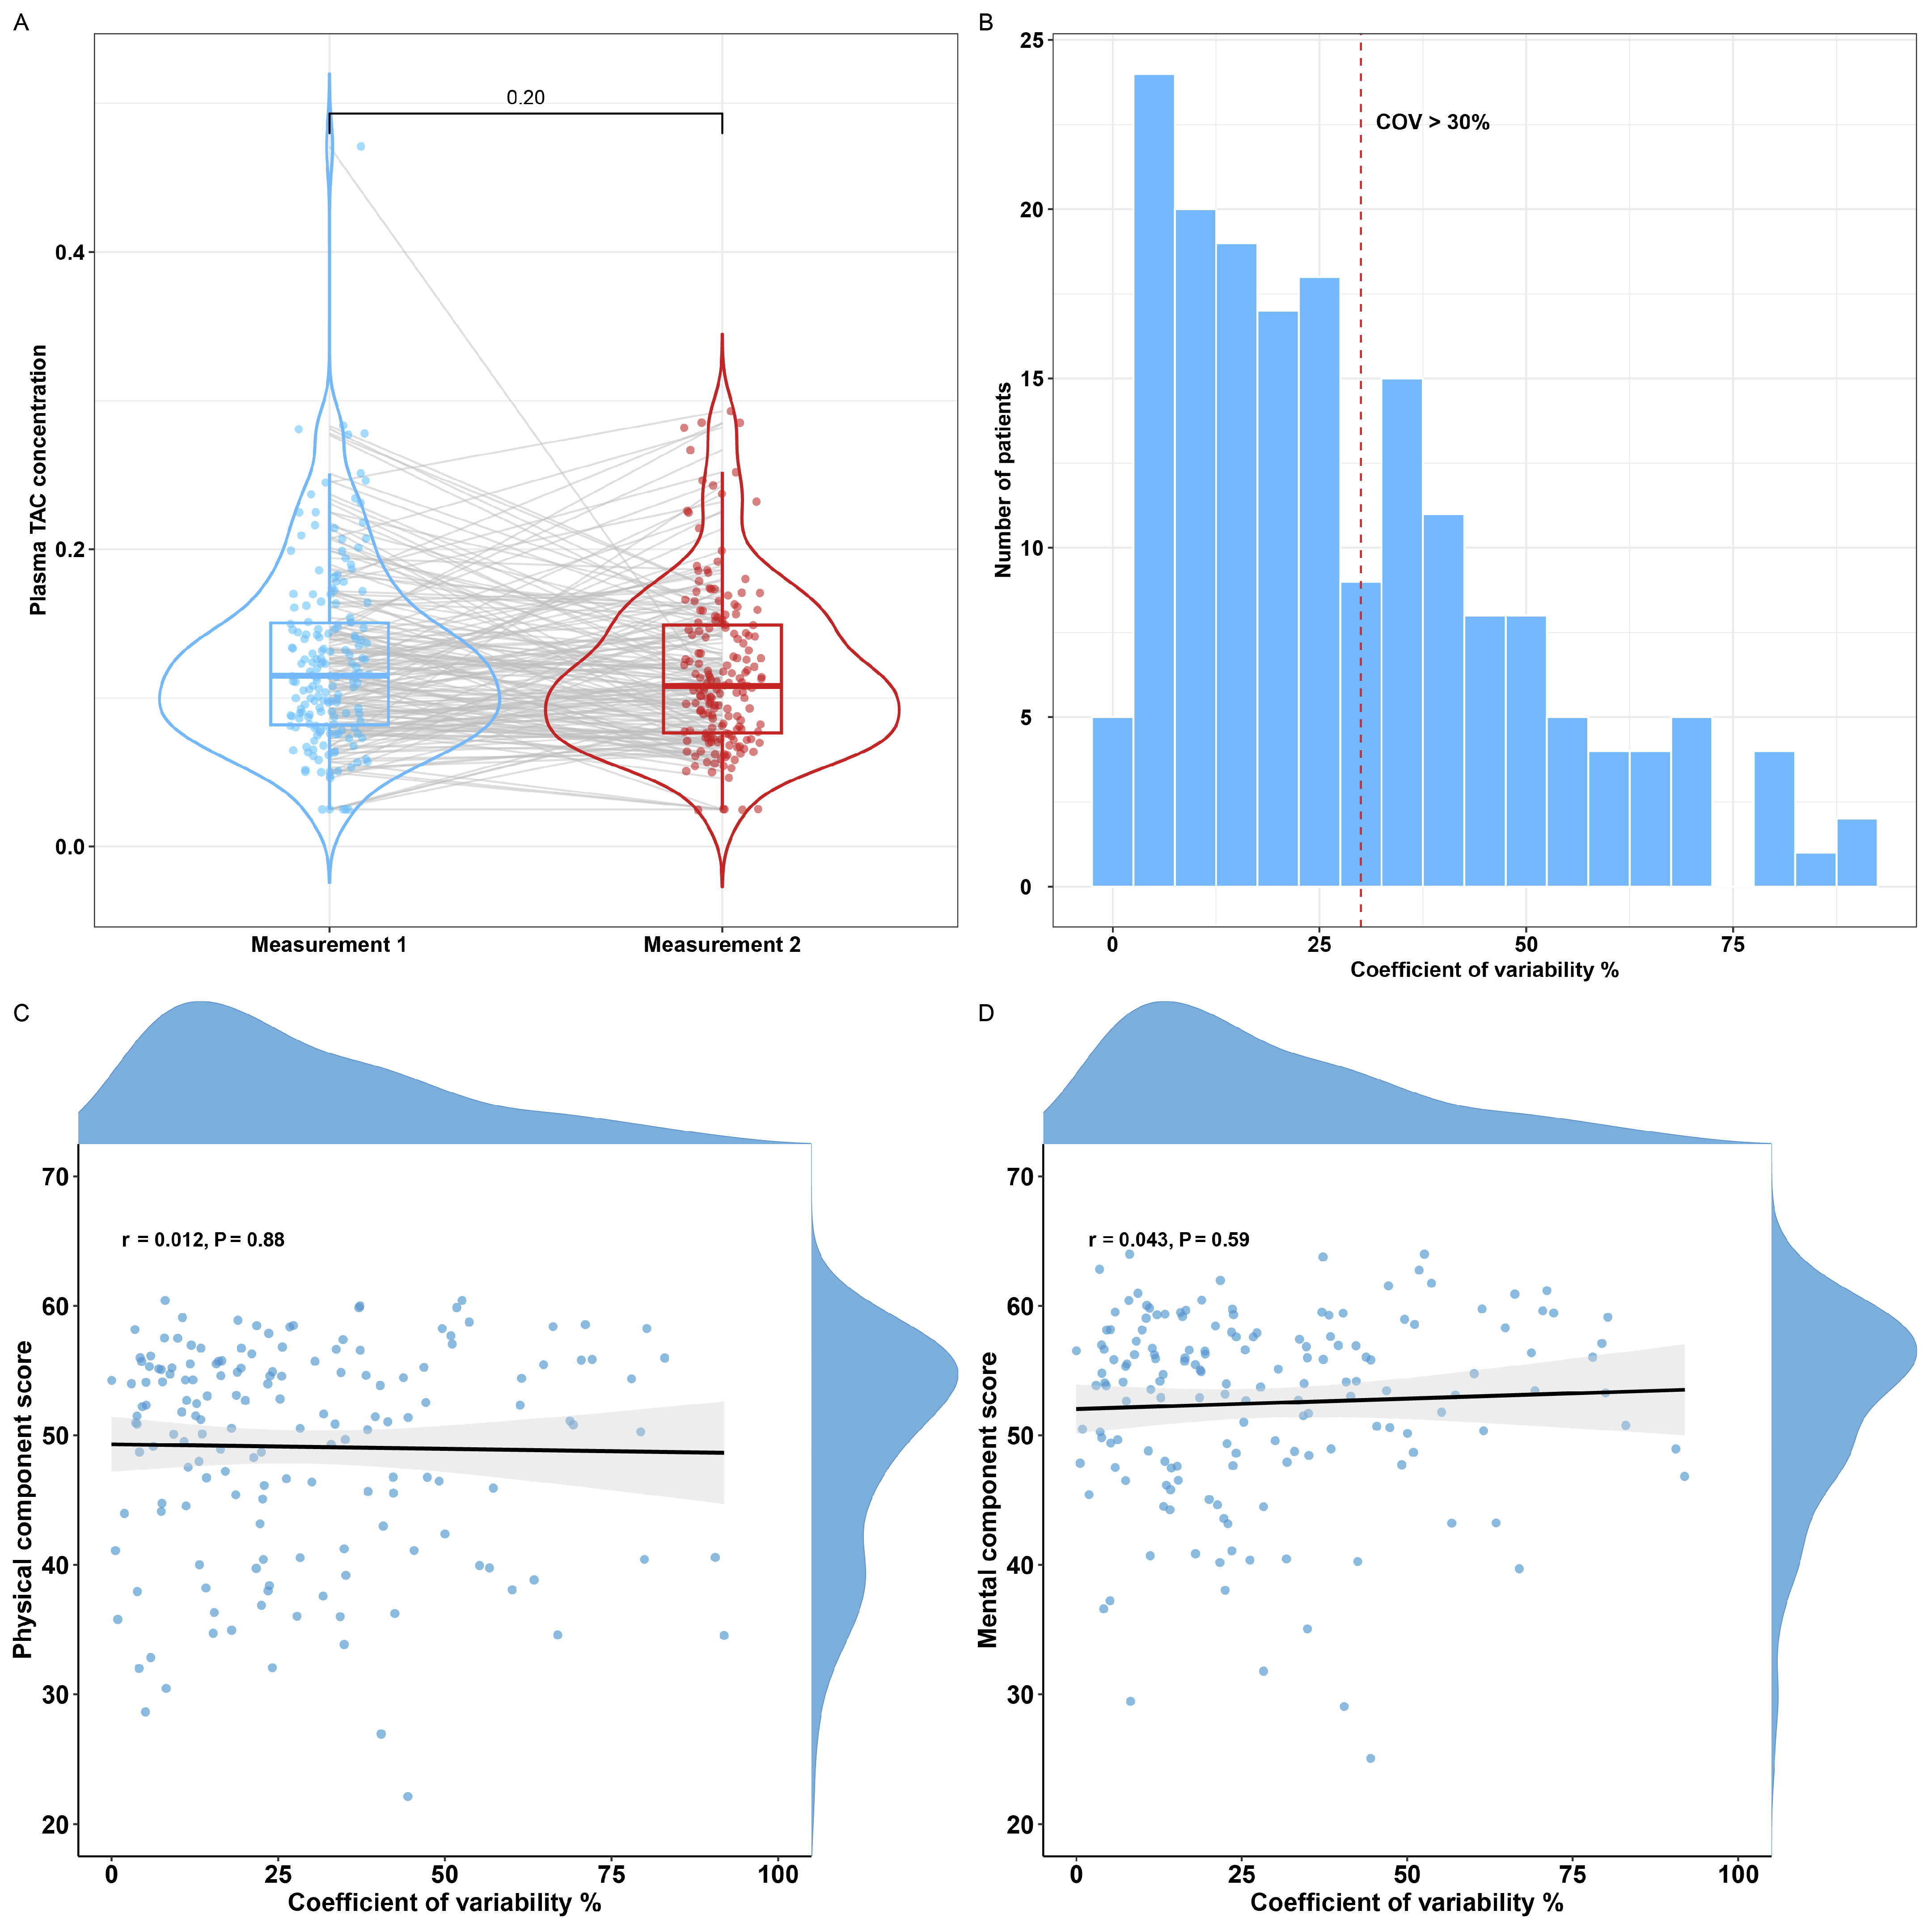
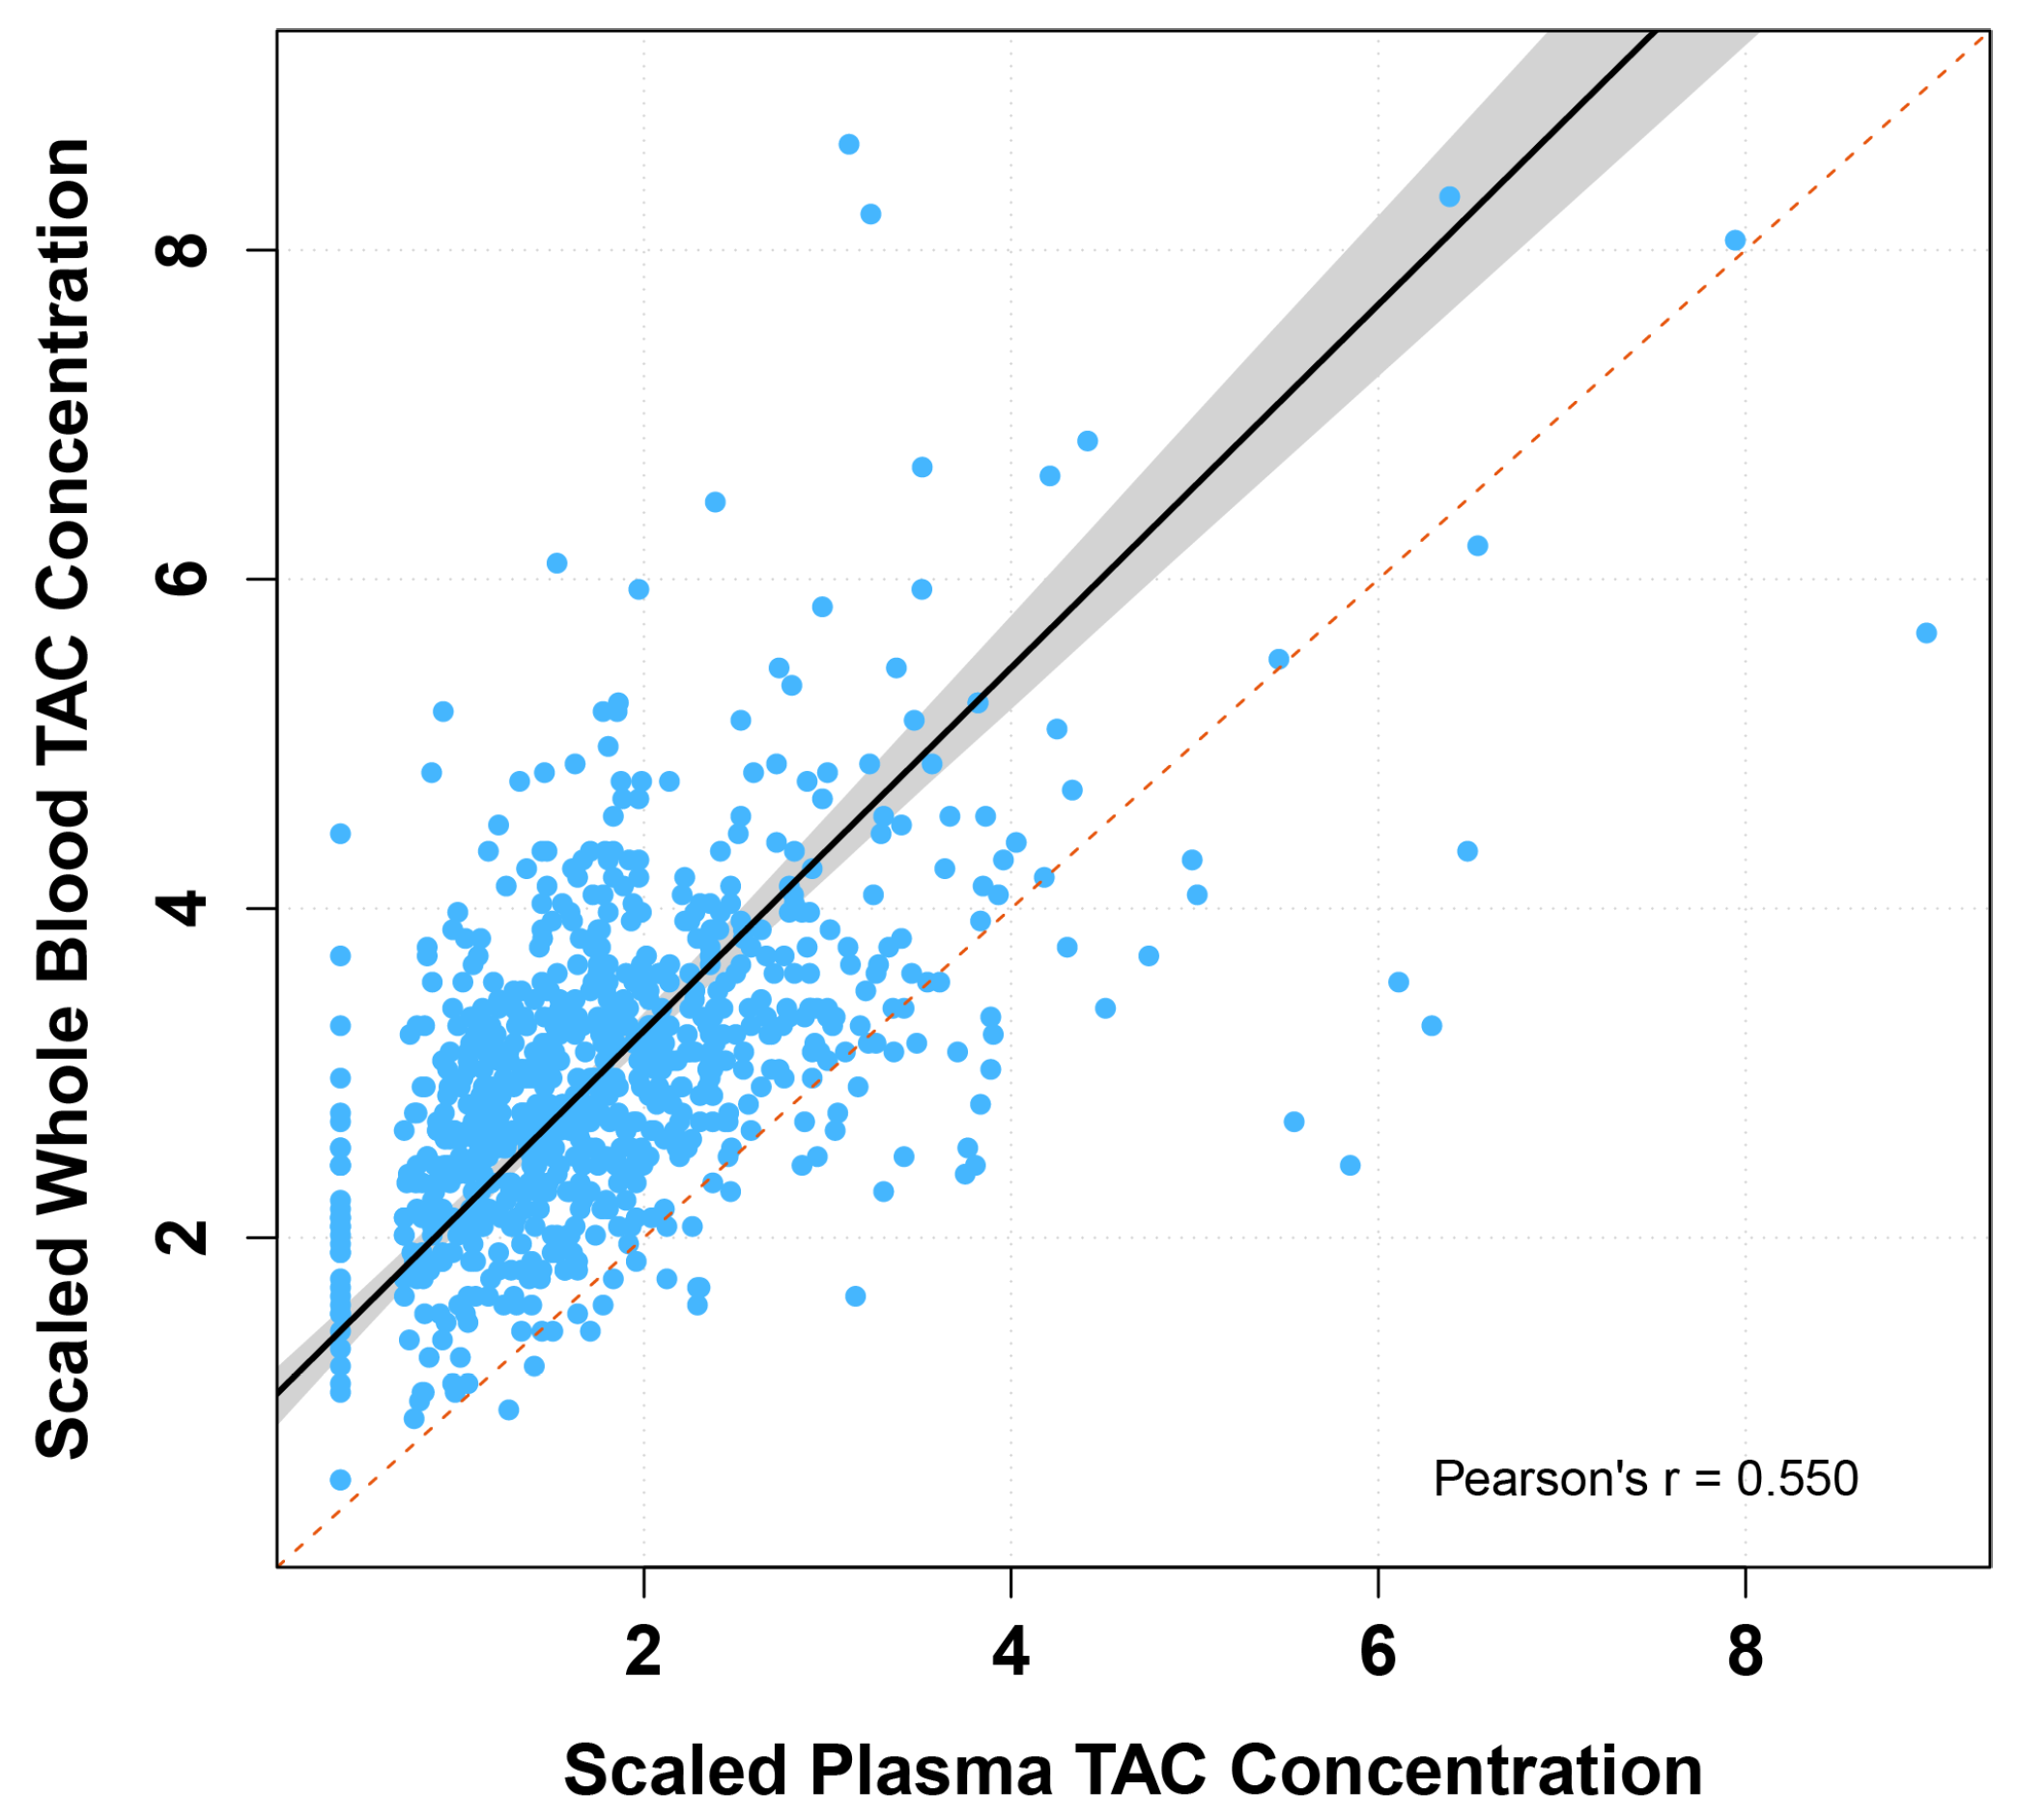
3.2. Comparison of Tacrolimus Concentrations in Whole Blood and Plasma
3.3. Tacrolimus Concentrations and Dose Associations
3.4. Assessment of Tacrolimus Concentrations and Health-Related Quality of Life
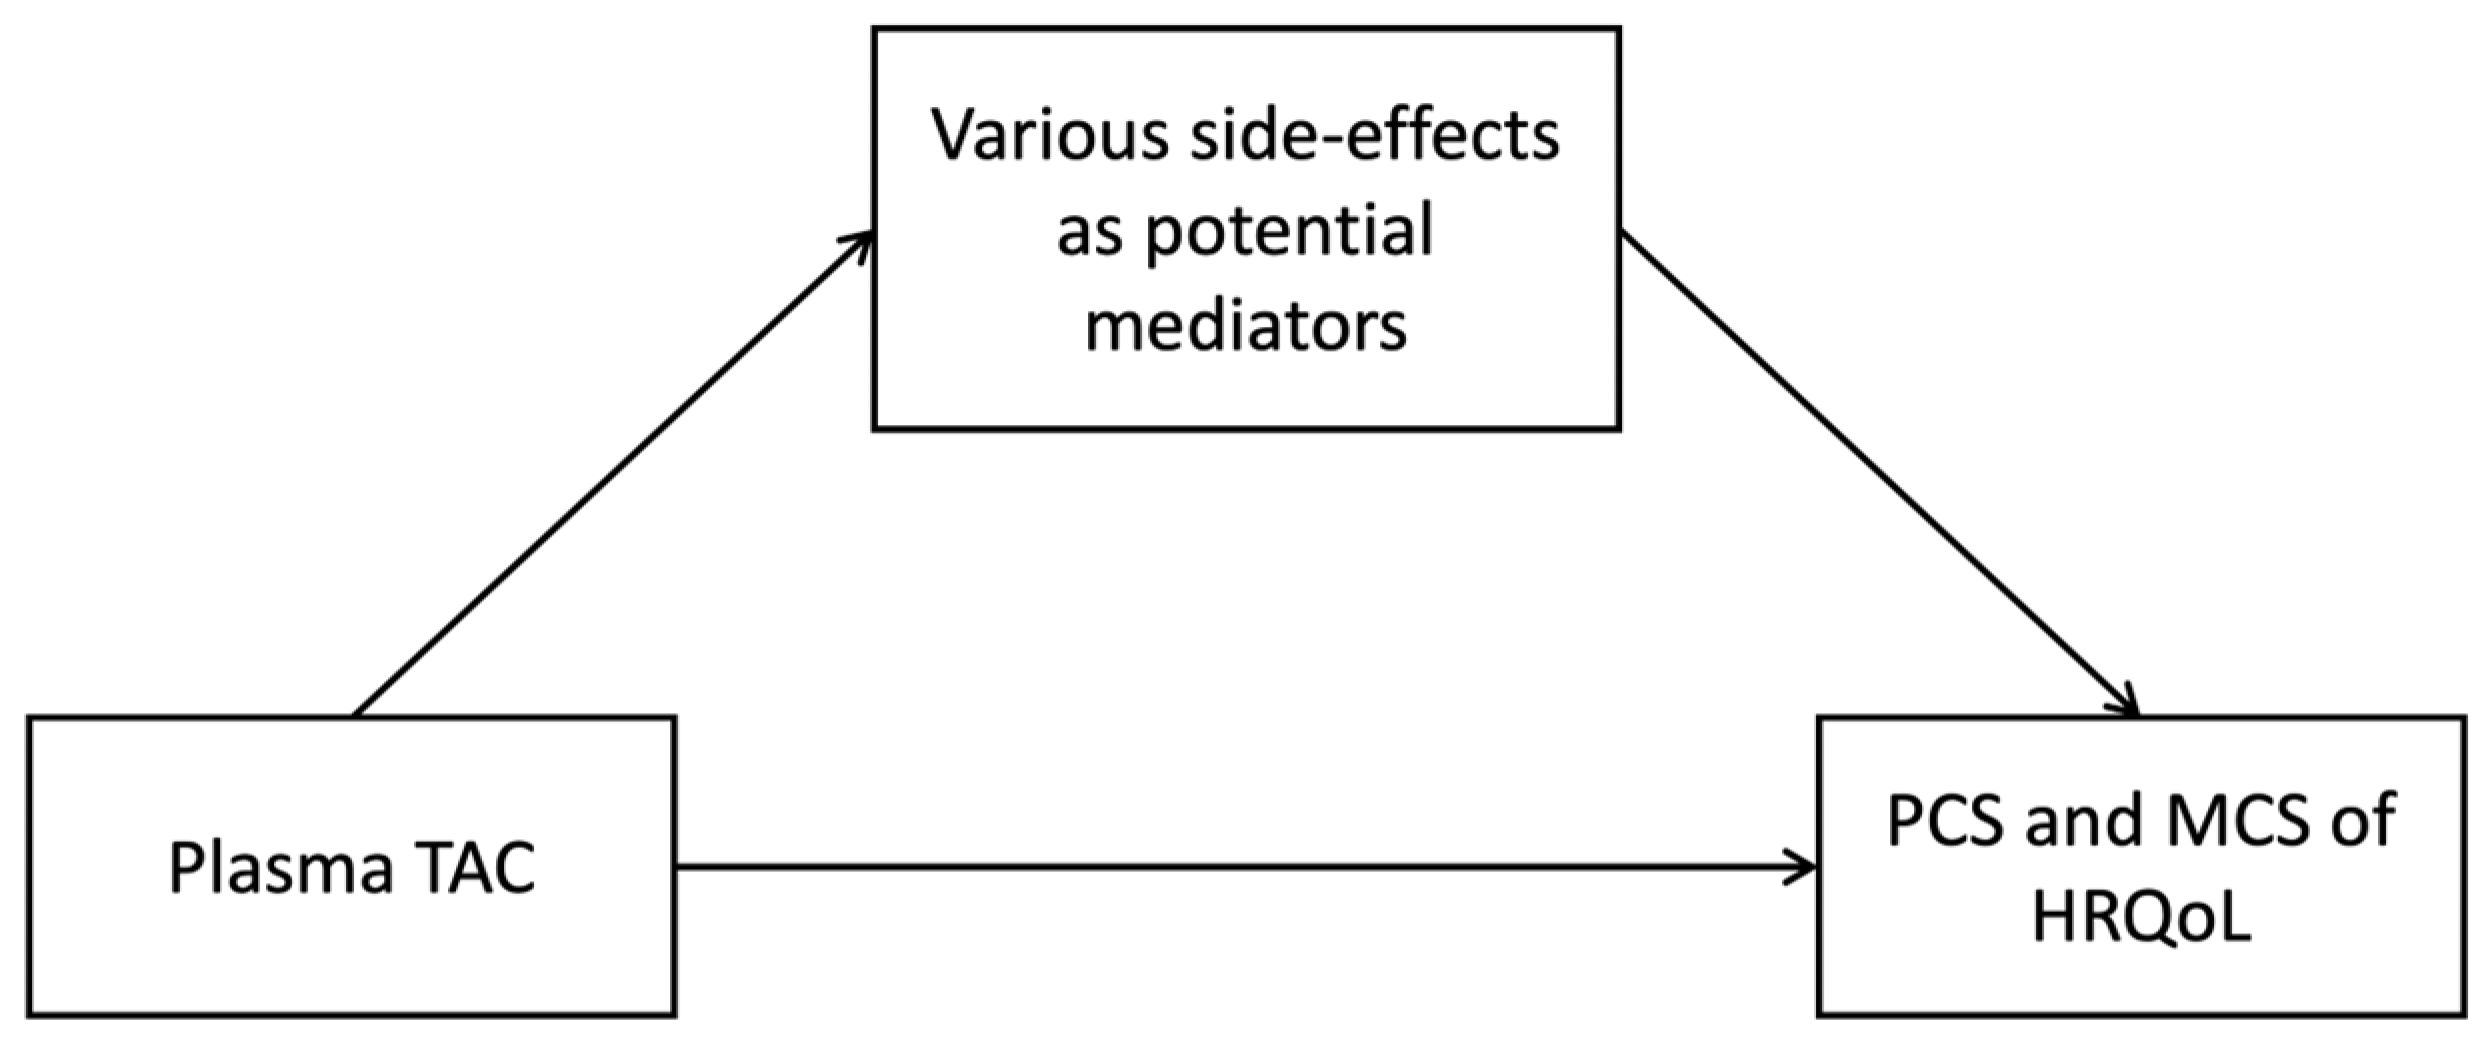
3.5. Mediation Effects on Health-Related Quality of Life
4. Discussion
5. Conclusions
Author Contributions
Funding
Institutional Review Board Statement
Informed Consent Statement
Data Availability Statement
Acknowledgments
Conflicts of Interest
Abbreviations
| CI | Confidence Interval |
| CIS | Checklist Individual Strength |
| HRQoL | Health-Related Quality of Life |
| IPV | Intra-patient variability |
| KTR | Kidney Transplant Recipient |
| LOA | Limits of Agreement |
| MCS | Mental Component Summary |
| MTSOSD-59R | 59-item Modified Transplant Symptom Occurrence and Symptom Distress Scale |
| PCS | Physical Component Summary |
| PTDM | Post-transplantation Diabetes Mellitus |
| SD | Standard Deviation |
| SF-36 | 36-item Short-Form Health Survey |
| TAC | Tacrolimus |
| TDM | Therapeutic Drug Monitoring |
| UMCG | University Medical Center Groningen |
Appendix A

| Coef β (95% CI) | St. β | p-Value | ||
|---|---|---|---|---|
| Model 1: PCS ~ Whole blood TAC | Interaction term Whole blood TAC × Age | 0.02 (−0.01–0.06) | 0.004 | 0.18 |
| Interaction term Whole blood TAC × Sex | 0.56 (−0.31–1.43) | 0.11 | 0.21 | |
| Model 2: PCS ~ Plasma TAC | Interaction term Plasma TAC × Age | −0.24 (−1.24–0.76) | −0.002 | 0.64 |
| Interaction term Plasma TAC × Sex | 10.18 (−12.42–32.79) | 0.07 | 0.38 | |
| Model 3: MCS ~ Whole blood TAC | Interaction term Whole blood TAC × Age | 0.02 (−0.002–0.06) | 0.01 | 0.07 |
| Interaction term Whole blood TAC × Sex | 0.39 (−0.35–1.13) | 0.09 | 0.30 | |
| Model 4: MCS ~ Plasma TAC | Interaction term Plasma TAC × Age | −0.21 (−1.06–0.64) | −0.002 | 0.63 |
| Interaction term Plasma TAC × Sex | 5.86 (−13.27–24.99) | 0.05 | 0.55 |
| Whole Blood TAC (Adjusted Model *) | Plasma TAC (Crude Model) | p-Value 1 | |||||||
|---|---|---|---|---|---|---|---|---|---|
| N | Coef β (95% CI) | St. β | p-Value | N | Coef β (95% CI) | St. β | p-Value | ||
| PCS | 614 | −0.21 (−0.62–0.21) | −0.04 | 0.33 | 593 | −16.94 (−27.97–5.90) | −0.12 | 0.003 | 0.01 |
| MCS | 614 | −0.05 (−0.41–0.30) | −0.01 | 0.76 | 593 | −16.01 (−25.34–6.68) | −0.14 | <0.001 | <0.001 |
Appendix B
Appendix C
Appendix C.1. Potential Mediator Fatigue Severity
| Outcome: Fatigue Severity | |||
| B (95% CI) | St. β | p-Value | |
| Plasma TAC | 20.09 (5.69; 34.49) | 0.11 | 0.01 |
| Outcome: PCS | |||
| B (95% CI) | St. β | p-Value | |
| Plasma TAC | −5.67 (−12.98; 1.64) | −0.04 | 0.13 |
| Fatigue severity, CIS20-R | −0.54 (−0.58; −0.50) | −0.004 | <0.001 |
| Outcome: MCS | |||
| B (95% CI) | St. β | p-Value | |
| Plasma TAC | −6.58 (−13.09; −0.07) | −0.06 | 0.05 |
| Fatigue severity, CIS20-R | −0.44 (−0.47; −0.41) | −0.004 | <0.001 |
| Multivariable Model | |||||
|---|---|---|---|---|---|
| Effect | B (95% CI) | p-Value | Proportion Mediated | p-Value | |
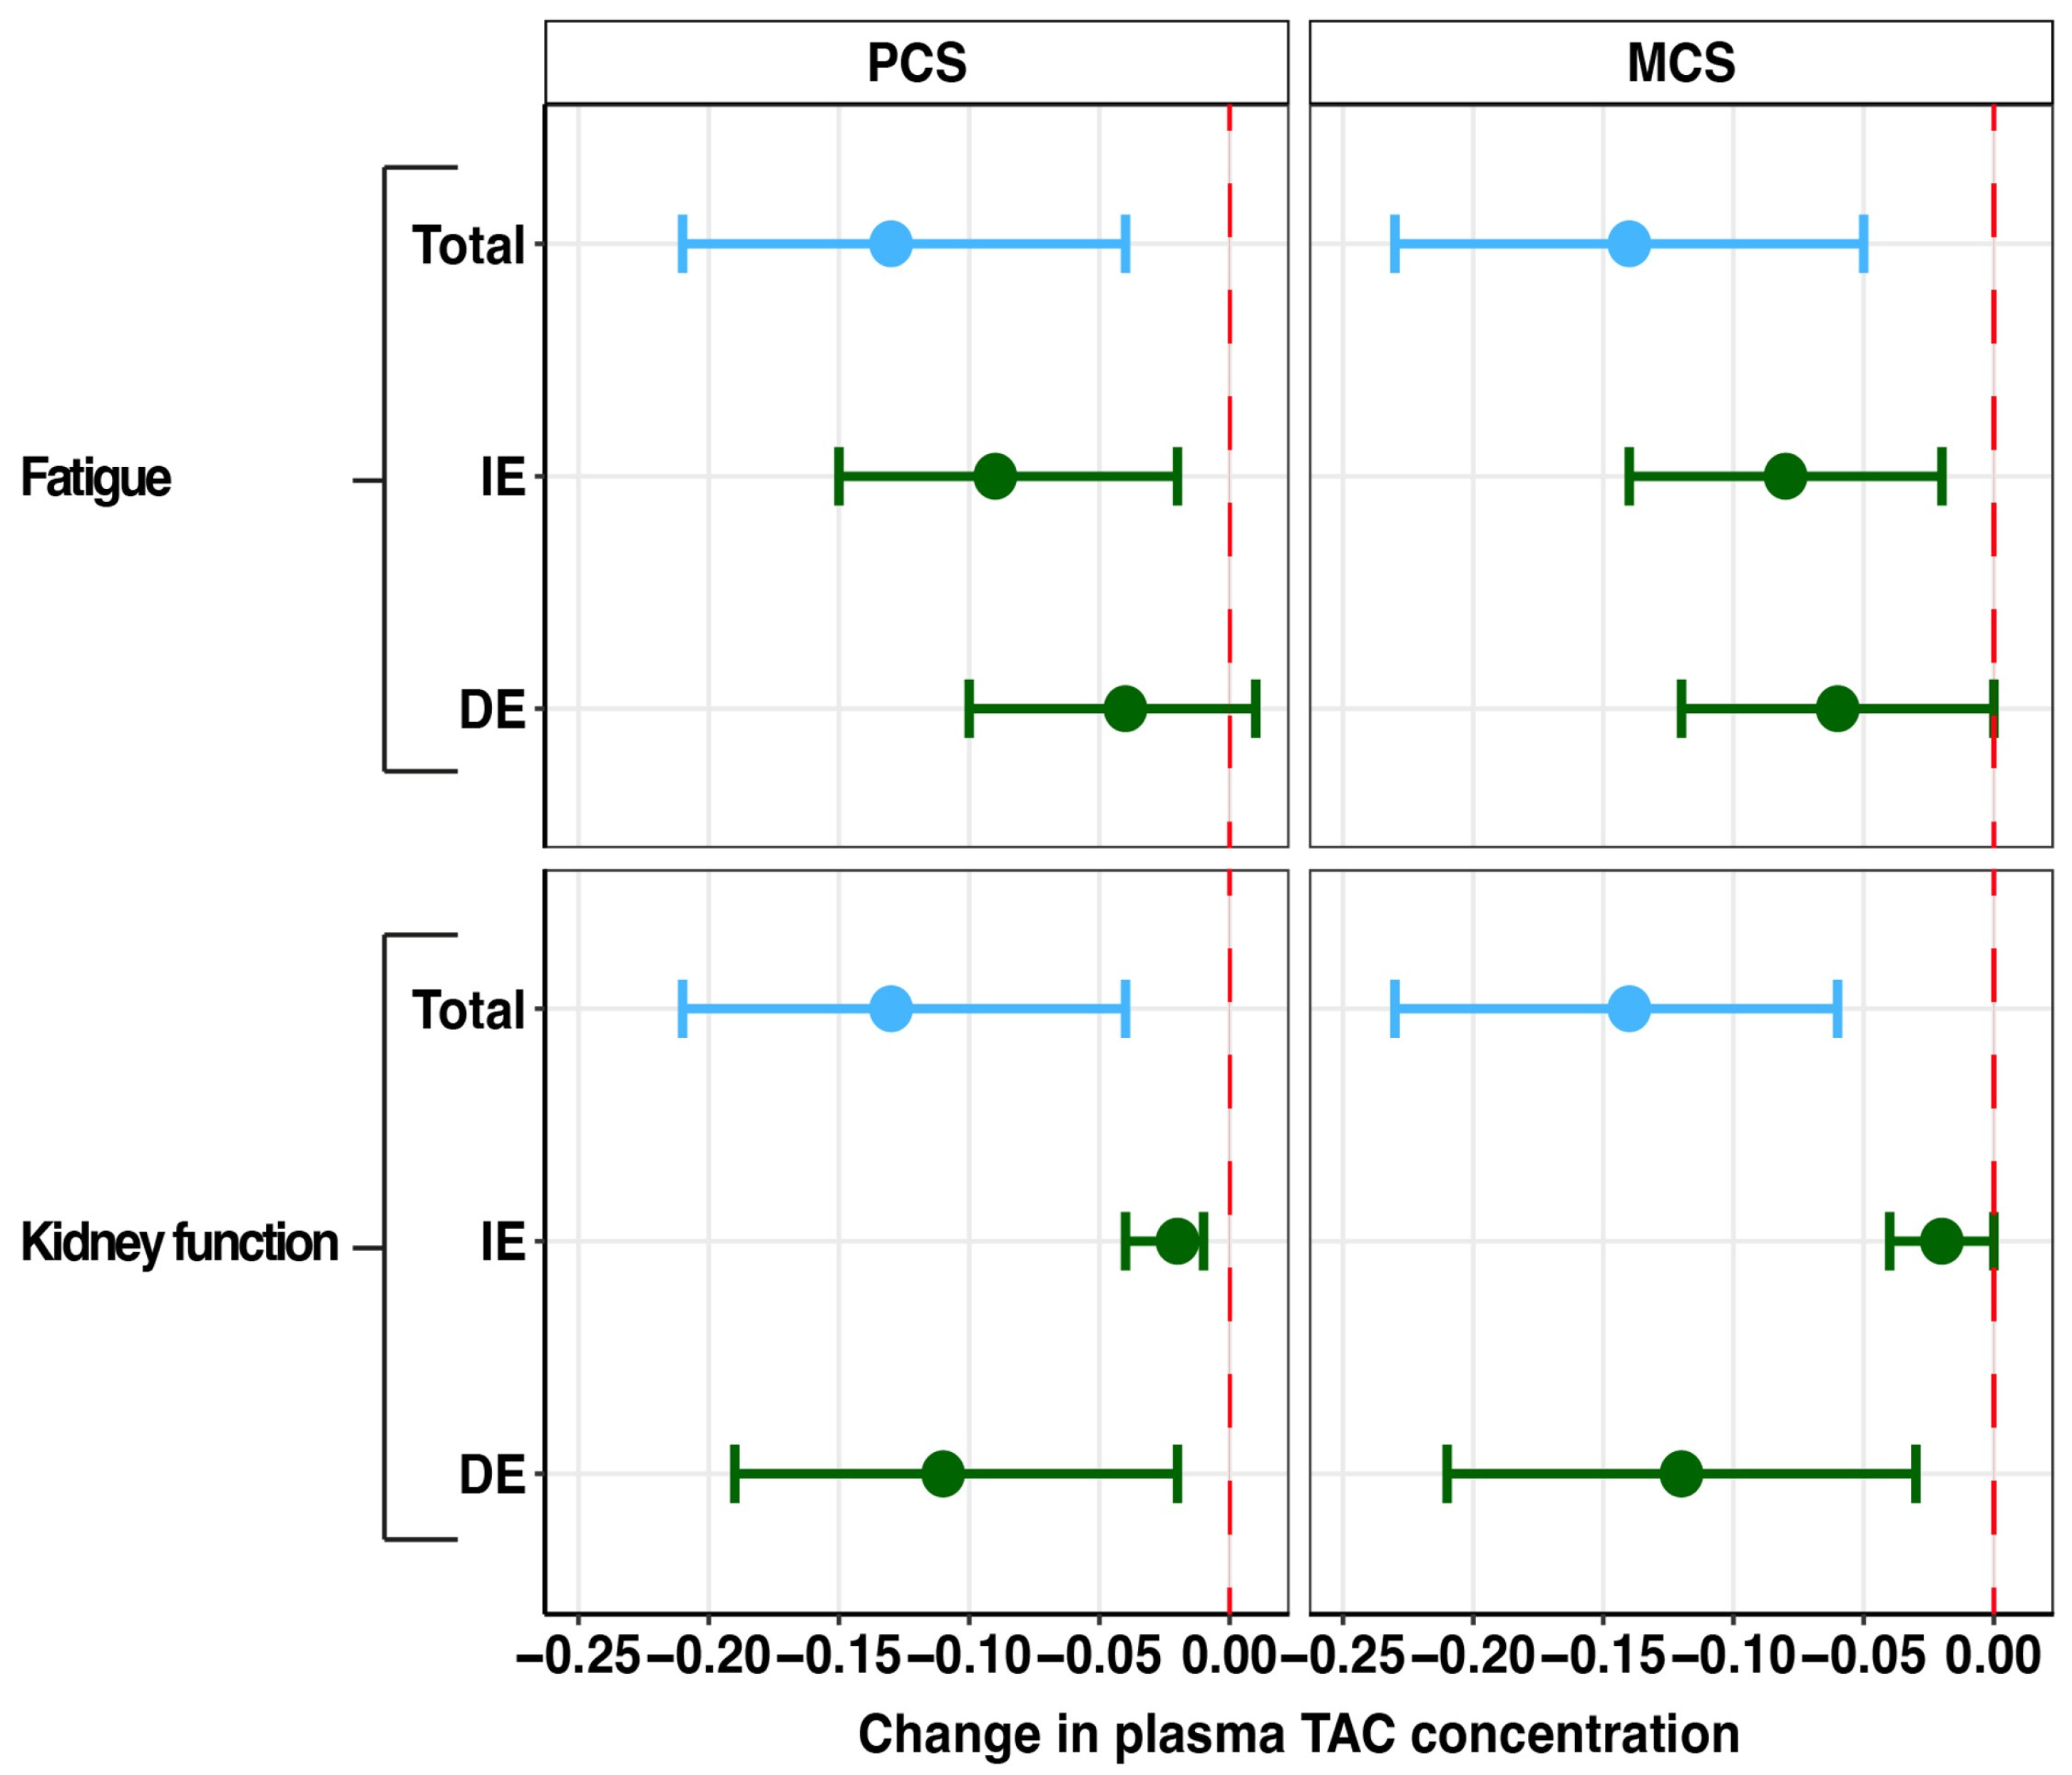
| PCS of HRQoL | Indirect effect | −0.09 (−0.15; −0.02) | 0.01 | 67.8% | 0.01 |
| Direct effect | −0.04 (−0.10; 0.01) | 0.14 | |||
| Total effect | −0.13 (−0.21; −0.04) | 0.01 | |||
| MCS of HRQoL | Indirect effect | −0.08 (−0.14; −0.02) | 0.01 | 59.5% | 0.02 |
| Direct effect | −0.06 (−0.12; 0.00) | 0.05 | |||
| Total effect | −0.14 (−0.23; −0.05) | 0.002 | |||
Appendix C.2. Potential Mediator Sleep Quality
| Outcome: Sleep Quality | |||
|---|---|---|---|
| B (95% CI) | St. β | p-Value | |
| Plasma TAC | 2.42 (−1.43; 6.28) | 0.05 | 0.21 |
Appendix C.3. Potential Mediator Gut Microbiome Outcomes
| Outcome: Shannon Diversity Index | |||
| B (95% CI) | St. β | p-Value | |
| Plasma TAC | −1.11 (−1.80; −0.41) | −0.14 | 0.002 |
| Outcome: PCS | |||
| B (95% CI) | St. β | p-Value | |
| Plasma TAC | −13.17 (−26.55; 0.21) | −0.10 | 0.05 |
| Shannon Diversity Index | 0.22 (−1.53; 1.97) | 0.002 | 0.80 |
| Outcome: MCS | |||
| B (95% CI) | St. β | p-Value | |
| Plasma TAC | −11.90 (−23.15; −0.64) | −0.10 | 0.04 |
| Shannon Diversity Index | 0.27 (−1.20; 1.74) | 0.002 | 0.72 |
| Outcome: Diarrhea | |||
|---|---|---|---|
| B (95% CI) | St. β | p-Value | |
| Plasma TAC | −2.63 (−13.35; 8.09) | −0.03 | 0.63 |
Appendix C.4. Potential Mediator Kidney Function
| Outcome: eGFR | |||
| B (95% CI) | St. β | p-Value | |
| Plasma TAC | −35.59 (−53.55; −17.62) | −0.14 | <0.001 |
| Outcome: PCS | |||
| B (95% CI) | St. β | p-Value | |
| Plasma TAC | −13.82 (−24.91; −2.73) | −0.10 | 0.02 |
| Kidney function, eGFR | 0.07 (0.03; 0.11) | 0.001 | <0.001 |
| Outcome: MCS | |||
| B (95% CI) | St. β | p-Value | |
| Plasma TAC | −13.76 (−23.17; −4.37) | −0.12 | 0.004 |
| Kidney function, eGFR | 0.05 (0.02; 0.09) | 0.0004 | 0.01 |
| Multivariable Model | |||||
|---|---|---|---|---|---|
| Effect | B (95% CI) | p-Value | Proportion Mediated | p-Value | |
| PCS of HRQoL | Indirect effect | −0.02 (−0.04; −0.01) | 0.002 | 16.7% | 0.01 |
| Direct effect | −0.11 (−0.19; −0.02) | 0.03 | |||
| Total effect | −0.13 (−0.21; −0.04) | 0.004 | |||
| MCS of HRQoL | Indirect effect | −0.02 (−0.04; 0.00) | 0.02 | 12.9% | 0.02 |
| Direct effect | −0.12 (−0.21; −0.03) | 0.004 | |||
| Total effect | −0.14 (−0.23; −0.06) | <0.001 | |||
Appendix C.5. Potential Mediator Post-Transplantation Diabetes Mellitus
| Outcome: PTDM | ||
|---|---|---|
| OR (95% CI) | p-Value | |
| Plasma TAC | 1.11 (0.93; 1.31) | 0.23 |
Appendix C.6. Potential Mediator Alopecia
| Outcome: Alopecia | ||
|---|---|---|
| OR (95% CI) | p-Value | |
| Plasma TAC | 1.09 (0.93; 1.28) | 0.31 |
Appendix C.7. Potential Mediator Tremor
| Outcome: Tremor | ||
|---|---|---|
| IRR (95% CI) | p-Value | |
| Plasma TAC | 1.17 (0.86; 1.59) | 0.31 |
Appendix D
| N (%) | |
| Other immunosuppressants | |
| Prednisolone | 873 (97.3) |
| Mycophenolate mofetil | 718 (80.0) |
| Azathioprine | 51 (5.7) |
| MTOR inhibitors (everolimus or sirolimus) | 42 (4.7) |
| Antihypertensives | |
| Beta-blockers | 538 (60.0) |
| Calcium channel blockers | 407 (45.4) |
| Alpha blockers | 136 (15.2) |
| Diuretics | 213 (23.8) |
| Angiotensin-converting enzyme inhibitors | 173 (19.3) |
| Angiotensin II receptor blockers | 111 (12.4) |
| Lipid-lowering treatment | |
| Statins | 508 (56.6) |
| Gemfibrozil | 50 (5.6) |
| Ezetimibe | 16 (1.8) |
| Antidiabetic Medication | |
| Metformin | 100 (11.2) |
| Sulfonylureas | 53 (5.9) |
| SGLT2 inhibitors | 3 (0.3) |
| DPP4 inhibitors | 10 (1.1) |
| GLP-1 receptor agonists | 5 (0.6) |
| Insulin | 121 (13.5) |
| Anticoagulants | |
| Acetylsalicylic acid | 188 (21.0) |
| Dipyridamole | 5 (0.6) |
| Clopidogrel | 48 (5.4) |
| Apixaban | 12 (1.3) |
| Non-vitamin K oral anticoagulants | 12 (2.0) |
| Vitamin K antagonists | 105 (11.7) |
| Gastroprotective agents | |
| Proton pump inhibitors | 661 (73.7) |
| H2-receptor antagonists | 32 (3.6) |
| Antacids | 11 (1.2) |
| Mucosal protective agents | 3 (0.3) |
| Antibiotics | |
| Sulfonamides | 35 (3.9) |
| Fluoroquinolones | 14 (1.6) |
| Macrolides | 10 (1.1) |
| Penicillin | 2 (0.2) |
| Antifungal agents | |
| Imidazoles | 16 (1.8) |
| Antidepressant Medication | |
| Tricyclic antidepressants | 22 (2.5) |
| Selective serotonin reuptake inhibitors | 29 (3.2) |
| Sleep medication | |
| Benzodiazepines | 65 (7.3) |
| Melatonin agonists | 3 (0.3) |
References
- Sikma, M.A.; van Maarseveen, E.M.; van de Graaf, E.A.; Kirkels, J.H.; Verhaar, M.C.; Donker, D.W.; Kesecioglu, J.; Meulenbelt, J. Pharmacokinetics and Toxicity of Tacrolimus Early after Heart and Lung Transplantation. Am. J. Transplant. 2015, 15, 2301–2313. [Google Scholar] [CrossRef] [PubMed]
- Braithwaite, H.E.; Darley, D.R.; Brett, J.; Day, R.O.; Carland, J.E. Identifying the association between tacrolimus exposure and toxicity in heart and lung transplant recipients: A systematic review. Transplant. Rev. 2021, 35, 100610. [Google Scholar] [CrossRef] [PubMed]
- Wang, Y.; Hemmelder, M.H.; Bos, W.J.W.; Snoep, J.D.; de Vries, A.P.J.; Dekker, F.W.; Meuleman, Y. Mapping health-related quality of life after kidney transplantation by group comparisons: A systematic review. Nephrol. Dial. Transplant. 2021, 36, 2327–2339. [Google Scholar] [CrossRef] [PubMed]
- Sikma, M.A.; Van Maarseveen, E.M.; Hunault, C.C.; Moreno, J.M.; Van de Graaf, E.A.; Kirkels, J.H.; Verhaar, M.C.; Grutters, J.C.; Kesecioglu, J.; De Lange, D.W.; et al. Unbound Plasma, Total Plasma, and Whole-Blood Tacrolimus Pharmacokinetics Early After Thoracic Organ Transplantation. Clin. Pharmacokinet. 2020, 59, 771–780. [Google Scholar] [CrossRef]
- Brunet, M.; van Gelder, T.; Åsberg, A.; Haufroid, V.; Hesselink, D.A.; Langman, L.; Lemaitre, F.; Marquet, P.; Seger, C.; Shipkova, M.; et al. Therapeutic Drug Monitoring of Tacrolimus-Personalized Therapy: Second Consensus Report. Ther. Drug Monit. 2019, 41, 261–307. [Google Scholar] [CrossRef]
- Bouamar, R.; Shuker, N.; Hesselink, D.A.; Weimar, W.; Ekberg, H.; Kaplan, B.; Bernasconi, C.; van Gelder, T. Tacrolimus Predose Concentrations Do Not Predict the Risk of Acute Rejection After Renal Transplantation: A Pooled Analysis From Three Randomized-Controlled Clinical Trials. Am. J. Transplant. 2013, 13, 1253–1261. [Google Scholar] [CrossRef]
- Udomkarnjananun, S.; Schagen, M.R.; Volarević, H.; van de Velde, D.; Dieterich, M.; Matic, M.; Baan, C.C.; Reinders, M.E.J.; de Winter, B.C.M.; Hesselink, D.A. Prediction of the Intra-T Lymphocyte Tacrolimus Concentration after Kidney Transplantation with Population Pharmacokinetic Modeling. Clin. Pharmacol. Ther. 2025, 117, 162–173. [Google Scholar] [CrossRef]
- Lemaitre, F.; Blanchet, B.; Latournerie, M.; Antignac, M.; Houssel-Debry, P.; Verdier, M.-C.; Dermu, M.; Camus, C.; Le Priol, J.; Roussel, M.; et al. Pharmacokinetics and pharmacodynamics of tacrolimus in liver transplant recipients: Inside the white blood cells. Clin. Biochem. 2015, 48, 406–411. [Google Scholar] [CrossRef]
- Lemaitre, F.; Vethe, N.T.; D’Avolio, A.; Tron, C.; Robertsen, I.; De Winter, B.; Denicolo, A.; Koch, B.C.P.; Venkataramanan, R.; Van Gelder, T.; et al. Measuring Intracellular Concentrations of Calcineurin Inhibitors: Expert Consensus from the International Association of Therapeutic Drug Monitoring and Clinical Toxicology Expert Panel. Ther. Drug Monit. 2020, 42, 665–670. [Google Scholar] [CrossRef]
- Han, S.S.; Yang, S.H.; Kim, M.C.; Cho, J.-Y.; Min, S.-I.; Lee, J.P.; Kim, D.K.; Ha, J.; Kim, Y.S. Monitoring the intracellular tacrolimus concentration in kidney transplant recipients with stable graft function. PLoS ONE 2016, 11, e0153491. [Google Scholar] [CrossRef]
- Stienstra, N.A.; Sikma, M.A.; Van Dapperen, A.L.; De Lange, D.W.; Van Maarseveen, E.M. Development of a simple and rapid method to measure the free fraction of tacrolimus in plasma using ultrafiltration and LC-MS/MS. Ther. Drug Monit. 2016, 38, 722–727. [Google Scholar] [CrossRef] [PubMed]
- Udomkarnjananun, S.; Eiamsitrakoon, T.; de Winter, B.C.M.; van Gelder, T.; Hesselink, D.A. Should we abandon therapeutic drug monitoring of tacrolimus in whole blood and move to intracellular concentration measurements? Br. J. Clin. Pharmacol. 2023, 1–12. [Google Scholar] [CrossRef] [PubMed]
- Eisenga, M.F.; Gomes-Neto, A.W.; van Londen, M.; Ziengs, A.L.; Douwes, R.M.; Stam, S.P.; Osté, M.C.J.; Knobbe, T.J.; Hessels, N.R.; Buunk, A.M.; et al. Rationale and design of TransplantLines: A prospective cohort study and biobank of solid organ transplant recipients. BMJ Open 2018, 8, e024502. [Google Scholar] [CrossRef] [PubMed]
- von Elm, E.; Altman, D.G.; Egger, M.; Pocock, S.J.; Gøtzsche, P.C.; Vandenbroucke, J.P. The Strengthening the Reporting of Observational Studies in Epidemiology (STROBE) statement: Guidelines for reporting observational studies. J. Clin. Epidemiol. 2008, 61, 344–349. [Google Scholar] [CrossRef]
- Hecht, M.; Veigure, R.; Couchman, L.; Barker, C.I.S.; Standing, J.F.; Takkis, K.; Evard, H.; Johnston, A.; Herodes, K.; Leito, I.; et al. Utilization of data below the analytical limit of quantitation in pharmacokinetic analysis and modeling: Promoting interdisciplinary debate. Bioanalysis 2018, 10, 1229–1248. [Google Scholar] [CrossRef]
- Koster, R.A.; Dijkers, E.C.F.; Uges, D.R.A. Robust, high-throughput LC-MS/MS method for therapeutic drug monitoring of cyclosporine, tacrolimus, everolimus, and sirolimus in whole blood. Ther. Drug Monit. 2009, 31, 116–125. [Google Scholar] [CrossRef]
- Zijp, T.R.; van Hateren, K.; Kuiper, H.; Jongedijk, E.M.; Touw, D.J. Ultra-high throughput dual channel liquid chromatography with tandem mass spectrometry for quantification of four immunosuppressants in whole blood for therapeutic drug monitoring. J. Chromatogr. A 2023, 1702, 464086. [Google Scholar] [CrossRef]
- Zijp, T.R.; Knobbe, T.J.; van Hateren, K.; Roggeveld, J.; Blokzijl, H.; Gan, C.T.; Bakker, S.J.; Jongedijk, E.M.; TransplantLines Investigators; Touw, D.J. Expeditious quantification of plasma tacrolimus with liquid chromatography tandem mass spectrometry in solid organ transplantation. J. Chromatogr. B Anal. Technol. Biomed. Life Sci. 2023, 1222, 123709. [Google Scholar] [CrossRef] [PubMed]
- Aaronson, N.K.; Muller, M.; Cohen, P.D.; Essink-Bot, M.-L.; Fekkes, M.; Sanderman, R.; Sprangers, M.A.; Velde, A.t.; Verrips, E. Translation, validation, and norming of the Dutch language version of the SF-36 Health Survey in community and chronic disease populations. J. Clin. Epidemiol. 1998, 51, 1055–1068. [Google Scholar] [CrossRef]
- Laucis, N.C.; Hays, R.D.; Bhattacharyya, T. Scoring the SF-36 in orthopaedics: A brief guide. J. Bone Jt. Surg—Am. Vol. 2014, 97, 1628–1634. [Google Scholar] [CrossRef]
- Taft, C.; Karlsson, J.; Sullivan, M. Do SF-36 Summary Component Scores Accurately Summarize Subscale Scores ? Qual. Life Res. 2001, 10, 395–404. [Google Scholar] [CrossRef] [PubMed]
- Farivar, S.S.; Cunningham, W.E.; Hays, R.D. Correlated physical and mental health summary scores for the SF-36 and SF-12 Health Survey, V.1. Health Qual. Life Outcomes 2007, 5, 54. [Google Scholar] [CrossRef] [PubMed]
- Worm-Smeitink, M.; Gielissen, M.; Bloot, L.; van Laarhoven, H.; van Engelen, B.; van Riel, P.; Bleijenberg, G.; Nikolaus, S.; Knoop, H. The assessment of fatigue: Psychometric qualities and norms for the Checklist individual strength. J. Psychosom. Res. 2017, 98, 40–46. [Google Scholar] [CrossRef] [PubMed]
- Buysse, D.J.; Reynolds, C.F.; Monk, T.H.; Berman, S.R.; Kupfer, D.J.; Buysse, D.J.; Reynolds, C.F.; Monk, T.H.; Berman, S.R.; Kupfer, D.J. The Pittsburgh Sleep Quality Index: A new instrument for psychiatric practice and research. Psychiatry Res. 1989, 28, 193–213. [Google Scholar] [CrossRef]
- Swarte, J.C.; Li, Y.; Hu, S.; Björk, J.R.; Gacesa, R.; Vila, A.V.; Douwes, R.M.; Collij, V.; Kurilshikov, A.; Post, A.; et al. Gut microbiome dysbiosis is associated with increased mortality after solid organ transplantation. Sci. Transl. Med. 2022, 14, eabn7566. [Google Scholar] [CrossRef]
- Reese, A.T.; Dunn, R.R. Drivers of Microbiome Biodiversity: A Review of General Rules, Feces, and Ignorance. mBio 2018, 9, e01294-18. [Google Scholar] [CrossRef]
- Douwes, R.M.; Swarte, J.C.; Post, A.; Annema, C.; Harmsen, H.J.M.; Bakker, S.J.L. Discrepancy between self-perceived mycophenolic acid-associated diarrhea and stool water content after kidney transplantation. Clin. Transplant. 2021, 35, e14321. [Google Scholar] [CrossRef]
- Levey, A.S.; Stevens, L.A. Estimating GFR Using the CKD Epidemiology Collaboration (CKD-EPI) Creatinine Equation: More Accurate GFR Estimates, Lower CKD Prevalence Estimates, and Better Risk Predictions. Am. J. Kidney Dis. 2010, 55, 622–627. [Google Scholar] [CrossRef]
- Sharif, A.; Hecking, M.; de Vries, A.P.J.; Porrini, E.; Hornum, M.; Rasoul-Rockenschaub, S.; Berlakovich, G.; Krebs, M.; Kautzky-Willer, A.; Schernthaner, G.; et al. Proceedings from an international consensus meeting on posttransplantation diabetes mellitus: Recommendations and future directions. Am. J. Transplant. 2014, 14, 1992–2000. [Google Scholar] [CrossRef]
- Werzowa, J.; Hecking, M.; Haidinger, M.; Döller, D.; Sharif, A.; Tura, A.; Säemann, M.D. The Diagnosis of Posttransplantation Diabetes Mellitus: Meeting the Challenges. Curr. Diabetes Rep. 2015, 15, 27. [Google Scholar] [CrossRef]
- Jenssen, T.; Hartmann, A. Post-transplant diabetes mellitus in patients with solid organ transplants. Nat. Rev. Endocrinol. 2019, 15, 172–188. [Google Scholar] [CrossRef] [PubMed]
- Dobbels, F.; Moons, P.; Abraham, I.; Larsen, C.P.; Dupont, L.; De Geest, S. Measuring symptom experience of side-effects of immunosuppressive drugs: The Modified Transplant Symptom Occurence and Distress Scale. Transpl. Int. 2008, 21, 764–773. [Google Scholar] [CrossRef] [PubMed]
- Fahn, S.; Tolosa, E.; Marin, C. Clinical Rating Scale for Tremor. In Parkinson’s Disease and Movement Disorders, 2nd ed.; Urban & Schwarzenberg: Munich, Germany, 1993; pp. 225–234. [Google Scholar]
- Elble, R.; Bain, P.; João Forjaz, M.; Haubenberger, D.; Testa, C.; Goetz, C.G.; Leentjens, A.F.G.; Martinez-Martin, P.; Traon, A.P.; Post, B.; et al. Task force report: Scales for screening and evaluating tremor: Critique and recommendations. Mov. Disord. 2013, 28, 1793–1800. [Google Scholar] [CrossRef]
- Bilic-Zulle, L. Comparison of methods: Passing and Bablok regression. Biochem. Med. 2011, 21, 49–52. [Google Scholar] [CrossRef]
- Haghayegh, S.; Kang, H.A.; Khoshnevis, S.; Smolensky, M.H.; Smolensky, M.H.; Diller, K.R. A comprehensive guideline for Bland-Altman and intra class correlation calculations to properly compare two methods of measurement and interpret findings. Physiol. Meas. 2020, 41, 055012. [Google Scholar] [CrossRef] [PubMed]
- European Medicines Agency. Guideline on Bioanalytical Method Validation; EMA Guidance Document; EMA: Amsterdam, The Netherlands, 2011. [Google Scholar]
- Preacher, K.J.; Hayes, A.F. SPSS and SAS procedures for estimating indirect effects in simple mediation models. Behav. Res. Methods Instrum. Comput. 2004, 36, 717–731. [Google Scholar] [CrossRef]
- Tingley, D.; Yamamoto, T.; Hirose, K.; Keele, L.; Imai, K. Mediation: R package for causal mediation analysis. J. Stat. Softw. 2014, 59, 1–38. [Google Scholar] [CrossRef]
- Piburn, K.H.; Sigurjonsdottir, V.K.; Indridason, O.S.; Maestretti, L.; Patton, M.V.; McGrath, A.; Palsson, R.; Gallo, A.; Chaudhuri, A.; Grimm, P.C. Patterns in Tacrolimus Variability and Association with De Novo Donor-Specific Antibody Formation in Pediatric Kidney Transplant Recipients. Clin. J. Am. Soc. Nephrol. 2022, 17, 1194–1203. [Google Scholar] [CrossRef]
- Koomen, J.V.; Knobbe, T.J.; Zijp, T.R.; Kremer, D.; Gan, C.T.; Verschuuren, E.A.; Bakker, S.J.; Touw, D.J.; Colin, P.J. A Joint Pharmacokinetic Model for the Simultaneous Description of Plasma and Whole Blood Tacrolimus Concentrations in Kidney and Lung Transplant Recipients. Clin. Pharmacokinet. 2023, 62, 1117–1128. [Google Scholar] [CrossRef]
- Mohammed Ali, Z.; Meertens, M.; Fernández, B.; Fontova, P.; Vidal-Alabró, A.; Rigo-Bonnin, R.; Melilli, E.; Cruzado, J.M.; Grinyó, J.M.; Colom, H.; et al. CYP3A5*3 and CYP3A4*22 Cluster Polymorphism Effects on LCP-Tac Tacrolimus Exposure: Population Pharmacokinetic Approach. Pharmaceutics 2023, 15, 2699. [Google Scholar] [CrossRef]
- Pallet, N.; Jannot, A.-S.; El Bahri, M.; Etienne, I.; Buchler, M.; de Ligny, B.H.; Choukroun, G.; Colosio, C.; Thierry, A.; Vigneau, C.; et al. Kidney transplant recipients carrying the CYP3A4*22 allelic variant have reduced tacrolimus clearance and often reach supratherapeutic tacrolimus concentrations. Am. J. Transplant. 2015, 15, 800–805. [Google Scholar] [CrossRef] [PubMed]
- Nuchjumroon, A.; Vadcharavivad, S.; Singhan, W.; Poosoonthornsri, M.; Chancharoenthana, W.; Udomkarnjananun, S.; Townamchai, N.; Avihingsanon, Y.; Praditpornsilpa, K.; Eiam-Ong, S. Comparison of Tacrolimus Intra-Patient Variability during 6–12 Months after Kidney Transplantation between CYP3A5 Expressers and Nonexpressers. J. Clin. Med. 2022, 11, 6320. [Google Scholar] [CrossRef]
- Schijvens, A.M.; van Hesteren, F.H.S.; Cornelissen, E.A.M.; Bootsma-Robroeks, C.M.H.H.T.; Brüggemann, R.J.M.; Burger, D.M.; de Wildt, S.N.; Schreuder, M.F.; ter Heine, R. The potential impact of hematocrit correction on evaluation of tacrolimus target exposure in pediatric kidney transplant patients. Pediatr. Nephrol. 2019, 34, 507–515. [Google Scholar] [CrossRef] [PubMed]
- Campagne, O.; Mager, D.E.; Brazeau, D.; Venuto, R.C.; Tornatore, K.M. The impact of tacrolimus exposure on extrarenal adverse effects in adult renal transplant recipients. Br. J. Clin. Pharmacol. 2019, 85, 516–529. [Google Scholar] [CrossRef] [PubMed]
- Kirubakaran, R.; Stocker, S.L.; Hennig, S.; Day, R.O.; Carland, J.E. Population Pharmacokinetic Models of Tacrolimus in Adult Transplant Recipients: A Systematic Review. Clin. Pharmacokinet. 2020, 59, 1357–1392. [Google Scholar] [CrossRef]
- Albilal, S.; Shawaqfeh, M.S.; Albusaysi, S.; Fetyani, L.; Alnashmi, F.; Alshehri, S.D.; Albekairy, N.A.; Akhulaif, A.; Alzahrani, L.; Alwuhayde, M.; et al. Tacrolimus Trough Level Variation and Its Correlation to Clinical Outcomes and Consequences in Solid Organ Transplantation. Transpl. Res. Risk Manag. 2023, 15, 1–11. [Google Scholar] [CrossRef]
- Gaynor, J.J.; Ciancio, G.; Guerra, G.; Sageshima, J.; Roth, D.; Goldstein, M.J.; Chen, L.; Kupin, W.; Mattiazzi, A.; Tueros, L.; et al. Lower tacrolimus trough levels are associated with subsequently higher acute rejection risk during the first 12 months after kidney transplantation. Transpl. Int. 2016, 29, 216–226. [Google Scholar] [CrossRef]

| N | 898 |
| Demographics | |
| Age, years | 55.1 ± 13.8 |
| Sex, n (%) female | 333 (37.1) |
| Time since Tx, years | 1.03 [1.00–3.72] |
| Tacrolimus | |
| Dose TAC, mg/day 1 | 3.0 [2.0–4.0] |
| Whole blood TAC levels, µg/L 2 | 5.7 ± 1.9 |
| Plasma TAC levels, µg/L 3 | 0.13 ± 0.07 |
| HRQoL | |
| PCS 4 | 47.1 ± 9.5 |
| MCS 5 | 51.3 ± 8.0 |
| Tacrolimus-related side effects | |
| Chronic fatigue, CIS20R 6 | 26.6 ± 13.2 |
| Sleep quality, PSQI 7 | 5.0 [3.0–7.0] |
| Shannon diversity index 8 | 2.3 ± 0.5 |
| Water percentage stool sample 9 | 75.1 ± 6.6 |
| Kidney function, eGFR | 53.5 ± 18.7 |
| PTDM 10 | 171 (19.7) |
| Alopecia, MTSOSD-59R 11 | 256 (38.4) |
| Tremor, TRS-C 12 | 0 [0–9] |
| Passing–Bablok Regression Analyses | |||||
| N | Intercept (95% CI) | Slope (95% CI) | |||
| KTR | 797 | 1.05 (0.89–1.22) | 1.10 (1.00–1.21) | ||
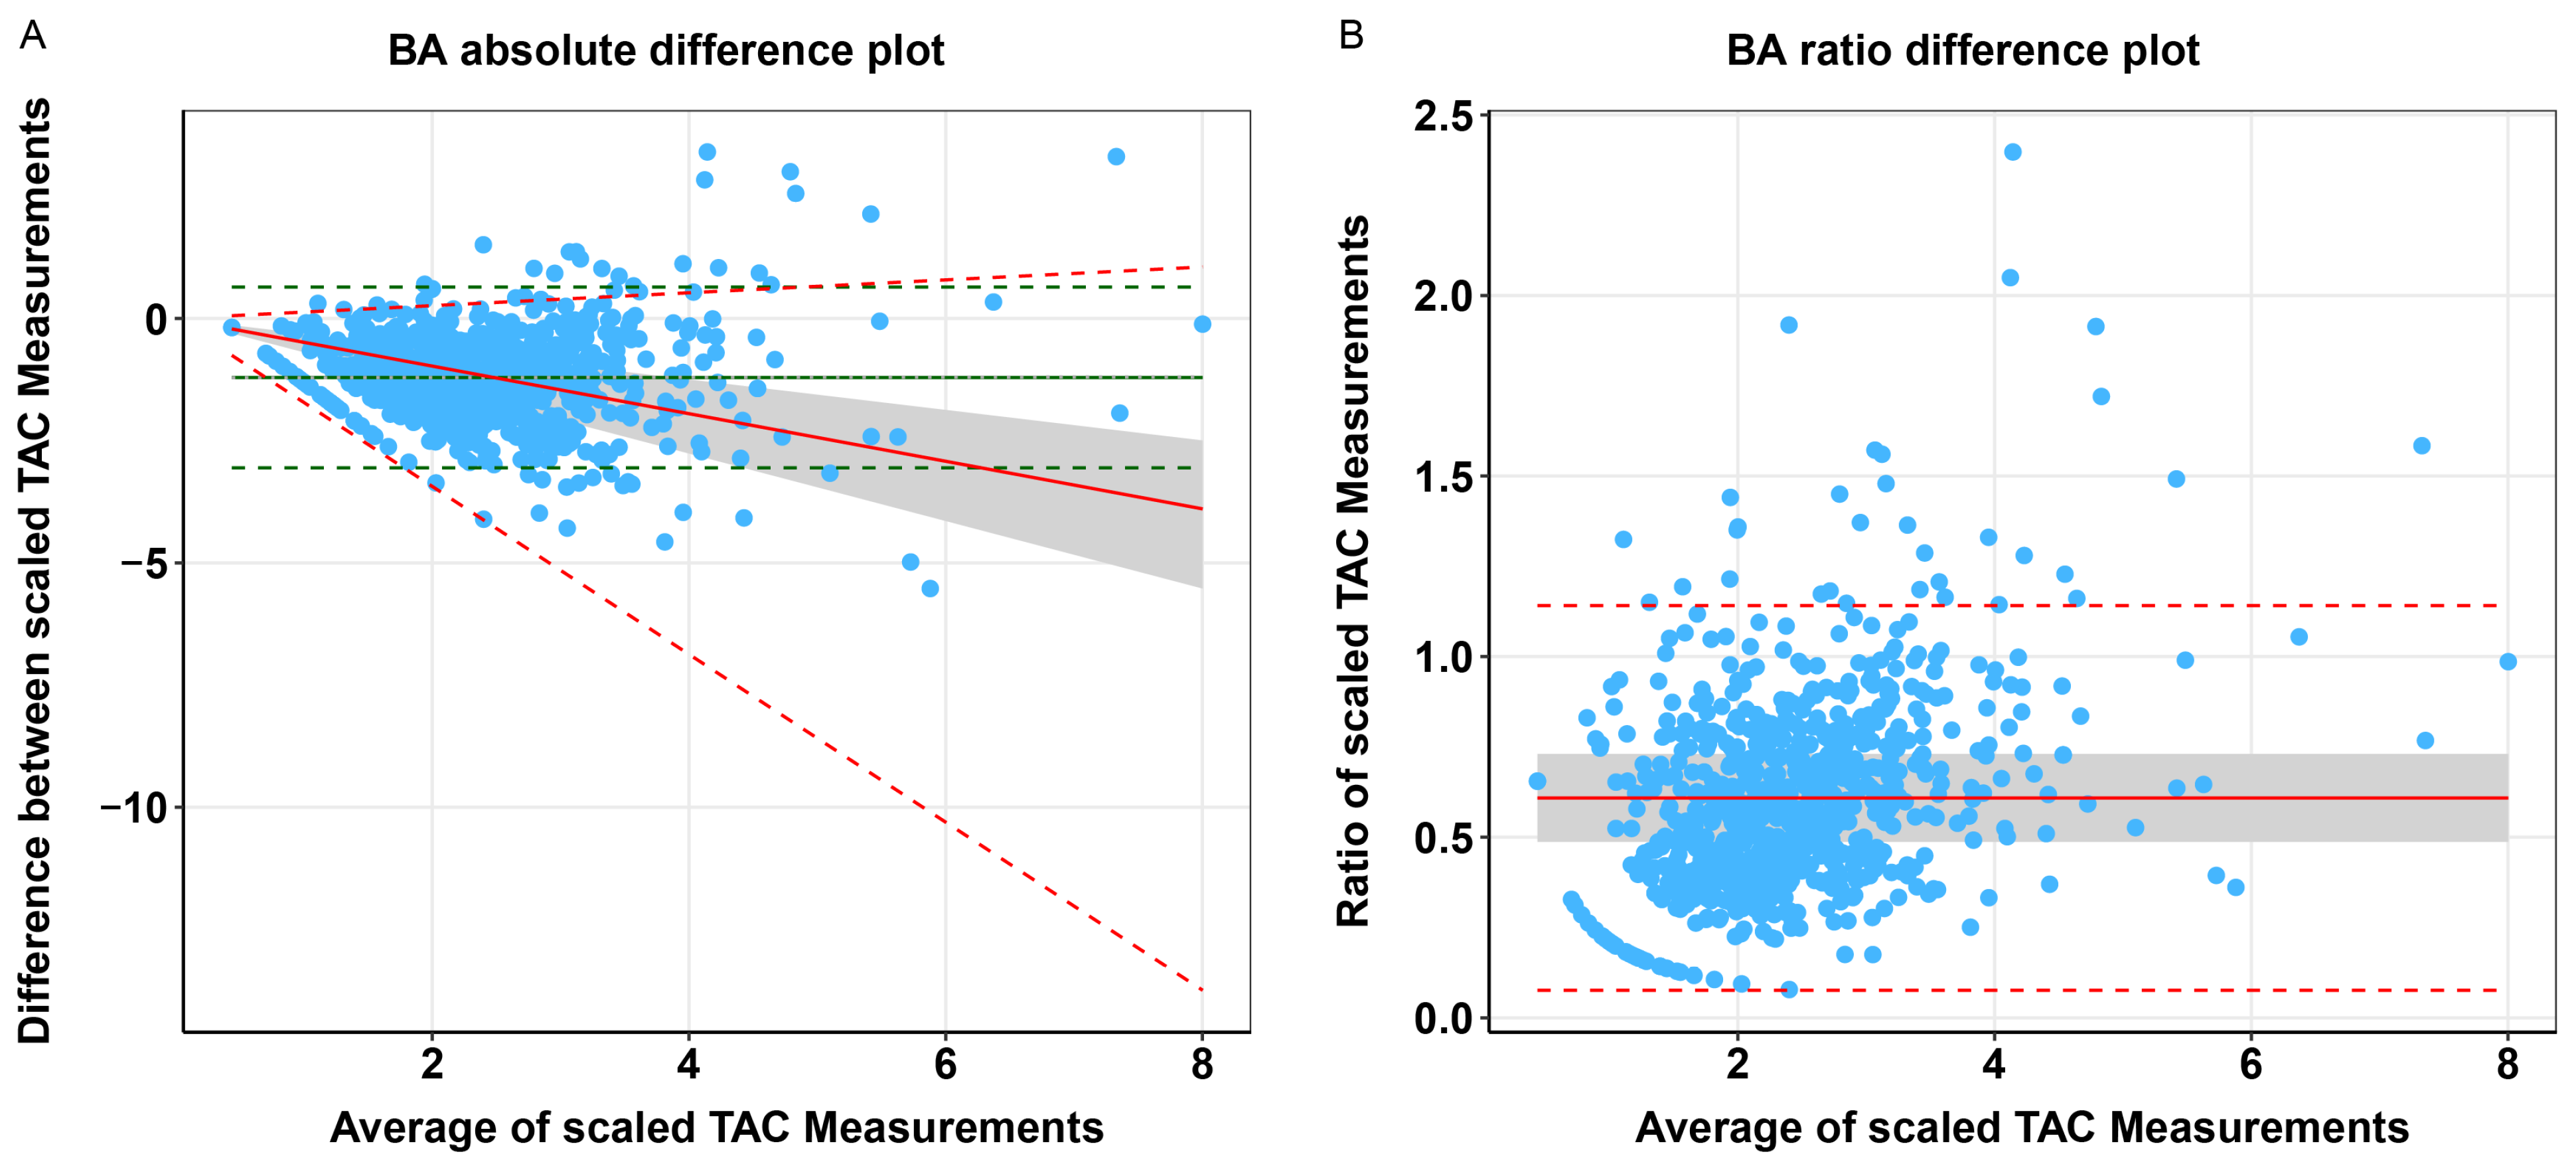
| Bland–Altman Analyses | |||||
| Bland–Altman Absolute Differences | Bland–Altman Ratio Differences | ||||
| Bias (95% CI) | 95% LOA (bias ± 1.96 SD) | p-Value | Bias (95% CI) | 95% LOA (bias ± 1.96 SD) | p-Value |
| 0.002 (−0.07–0.08) | −3.06–0.64 | 0.96 | 0.12 (0.10–0.14) | 0.08–1.14 | <0.001 |
| Whole Blood TAC | Plasma TAC | p-Value 1 | ||||||
|---|---|---|---|---|---|---|---|---|
| N | Coef β (95% CI) | St. β | p-Value | N | Coef β (95% CI) | St. β | p-Value | |
| 858 | 0.17 (0.09–0.26) | 0.14 | <0.001 | 803 | 4.43 (2.17–6.70) | 0.13 | <0.001 | 0.54 |
| Whole Blood TAC | Plasma TAC | p-Value 1 | |||||||
|---|---|---|---|---|---|---|---|---|---|
| N | Coef β (95% CI) | St. β | p-Value | N | Coef β (95% CI) | St. β | p-Value | ||
| PCS | 618 | −0.14 (−0.55–0.28) | −0.03 | 0.52 | 593 | −16.94 (−27.97–5.90) | −0.12 | 0.003 | 0.01 |
| MCS | 618 | 0.004 (−0.35–0.36) | 0.001 | 0.98 | 593 | −16.01 (−25.34–6.68) | −0.14 | <0.001 | <0.001 |
Disclaimer/Publisher’s Note: The statements, opinions and data contained in all publications are solely those of the individual author(s) and contributor(s) and not of MDPI and/or the editor(s). MDPI and/or the editor(s) disclaim responsibility for any injury to people or property resulting from any ideas, methods, instructions or products referred to in the content. |
© 2025 by the authors. Licensee MDPI, Basel, Switzerland. This article is an open access article distributed under the terms and conditions of the Creative Commons Attribution (CC BY) license (https://creativecommons.org/licenses/by/4.0/).
Share and Cite
Nolte, S.; Swarte, J.C.; Knobbe, T.J.; Nolte, I.M.; Zijp, T.R.; Moes, H.R.; van Londen, M.; Riemersma, N.L.; Björk, J.R.; Weersma, R.K.; et al. Plasma Versus Whole Blood Tacrolimus Concentrations and Health-Related Quality of Life in Kidney Transplant Recipients. Pharmaceutics 2025, 17, 590. https://doi.org/10.3390/pharmaceutics17050590
Nolte S, Swarte JC, Knobbe TJ, Nolte IM, Zijp TR, Moes HR, van Londen M, Riemersma NL, Björk JR, Weersma RK, et al. Plasma Versus Whole Blood Tacrolimus Concentrations and Health-Related Quality of Life in Kidney Transplant Recipients. Pharmaceutics. 2025; 17(5):590. https://doi.org/10.3390/pharmaceutics17050590
Chicago/Turabian StyleNolte, Svea, J. Casper Swarte, Tim J. Knobbe, Ilja M. Nolte, Tanja R. Zijp, Harmen R. Moes, Marco van Londen, Niels L. Riemersma, Johannes R. Björk, Rinse K. Weersma, and et al. 2025. "Plasma Versus Whole Blood Tacrolimus Concentrations and Health-Related Quality of Life in Kidney Transplant Recipients" Pharmaceutics 17, no. 5: 590. https://doi.org/10.3390/pharmaceutics17050590
APA StyleNolte, S., Swarte, J. C., Knobbe, T. J., Nolte, I. M., Zijp, T. R., Moes, H. R., van Londen, M., Riemersma, N. L., Björk, J. R., Weersma, R. K., Drost, G., Berger, S. P., Touw, D. J., & Bakker, S. J. L., on behalf of TransplantLines Investigators. (2025). Plasma Versus Whole Blood Tacrolimus Concentrations and Health-Related Quality of Life in Kidney Transplant Recipients. Pharmaceutics, 17(5), 590. https://doi.org/10.3390/pharmaceutics17050590