
Anti-Tumor Potential of Frankincense Essential Oil and Its Nano-Formulation in Breast Cancer: An In Vivo and In Vitro Study

 , ,
, ,  and
and 
Abstract
1. Introduction
2. Materials and Methods
2.1. Plant Material
2.2. Gas Chromatography/Mass Spectroscopy (GC-MS) Analysis
2.3. FEO-CSNP Formulation
2.4. Characterization of the Nanomaterial
2.4.1. Transmission Electron Microscopy (TEM)
2.4.2. Dynamic Light Scattering (DLS) and Zeta Potential
2.4.3. Fourier Transform Infrared (FT-IR) Spectroscopy
2.4.4. Encapsulation Efficiency and Drug-Loading Capacity
2.4.5. In Vitro Drug Release Study
2.5. Cell Line Maintenance and Drug Treatment
2.6. Cytotoxicity Assay
2.7. Cell Cycle Distribution
2.8. Apoptosis Detection
2.9. Wound Healing Assay
2.10. In Vivo Studies
2.10.1. Histopathological Analysis
2.10.2. Arginase Activity
2.10.3. GST Activity
2.10.4. Glutathione (GSH) Activity
2.10.5. MDA Activity
2.11. Gene Expression Analysis
2.12. Statistical Analysis
3. Results
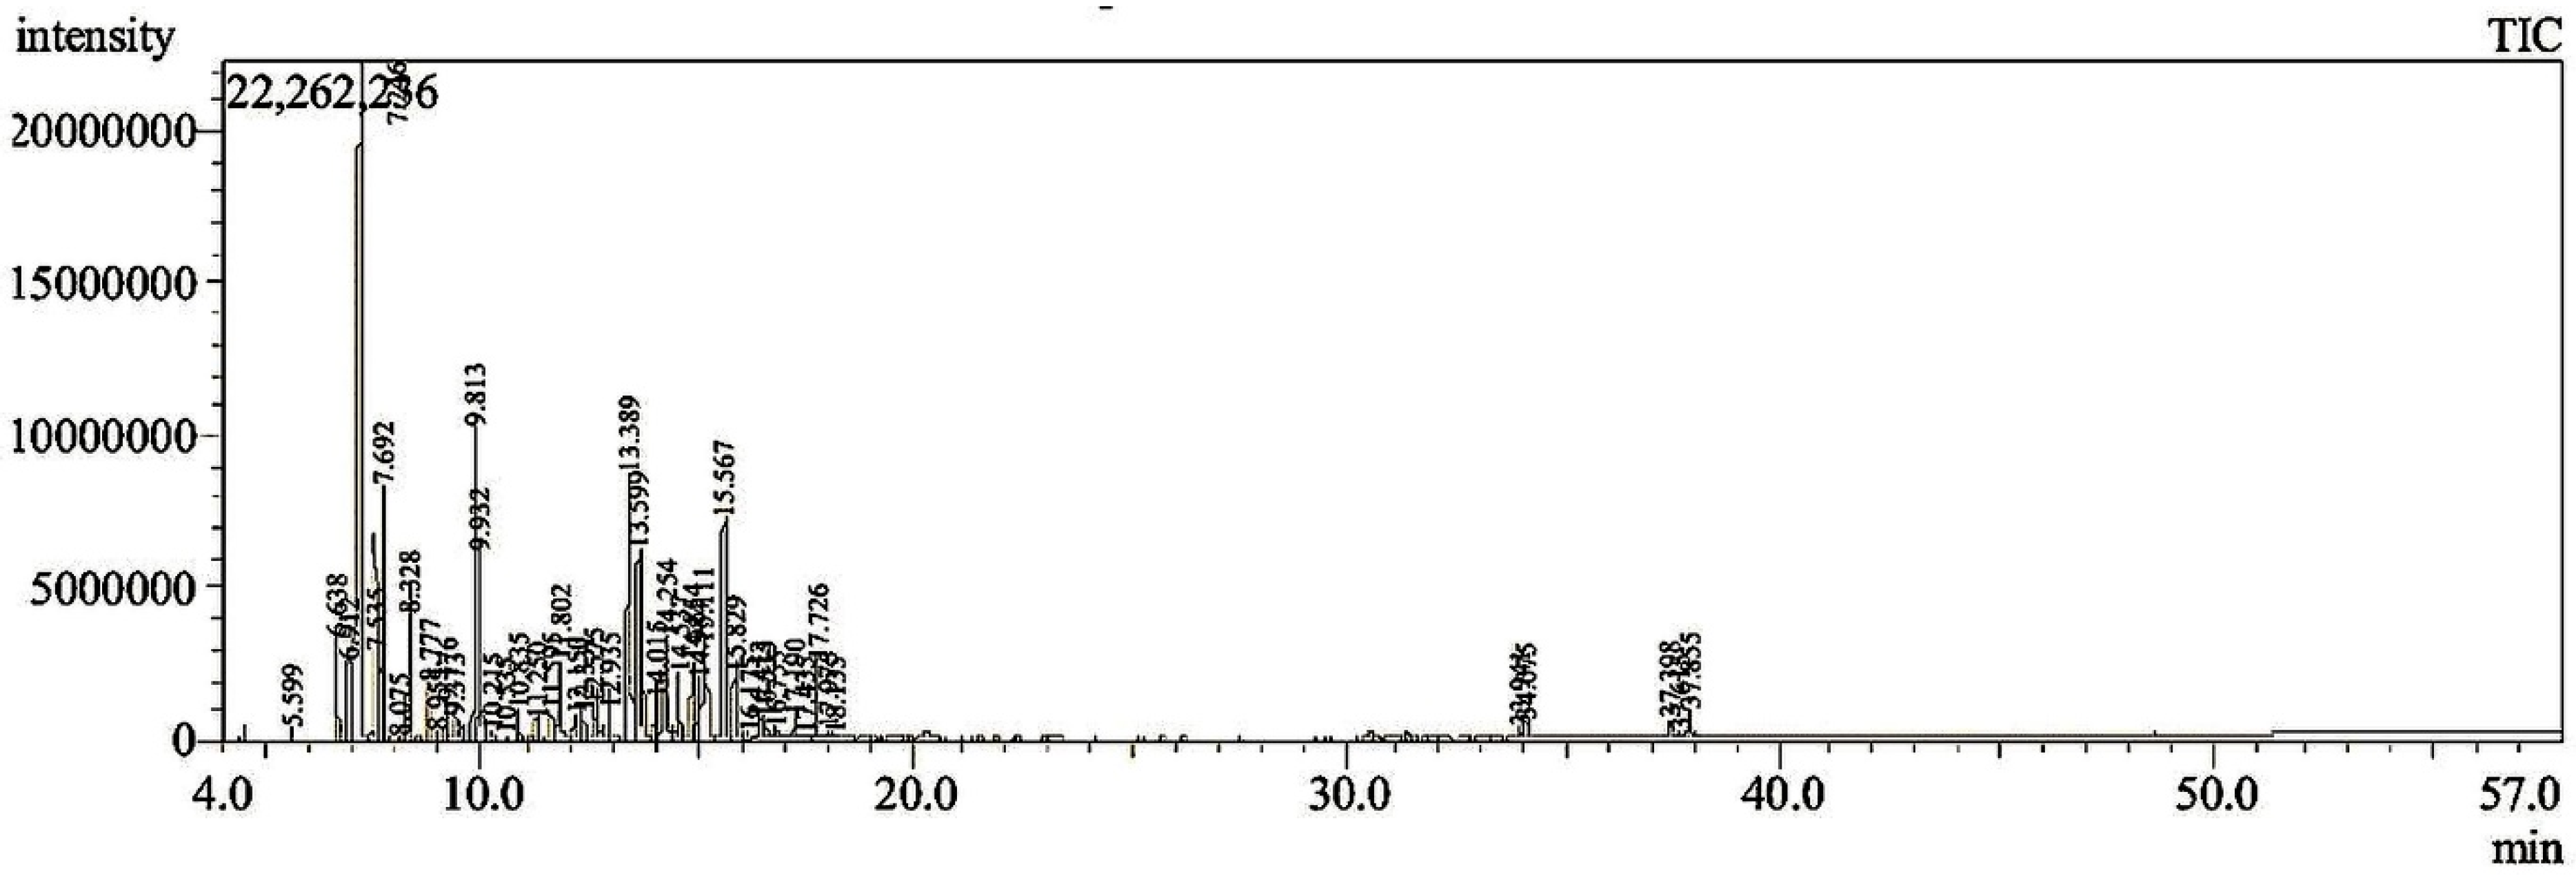
3.1. GC-MS Analysis
3.2. Characterization of Nanomaterial
3.2.1. Transmission Electron Microscopy (TEM)
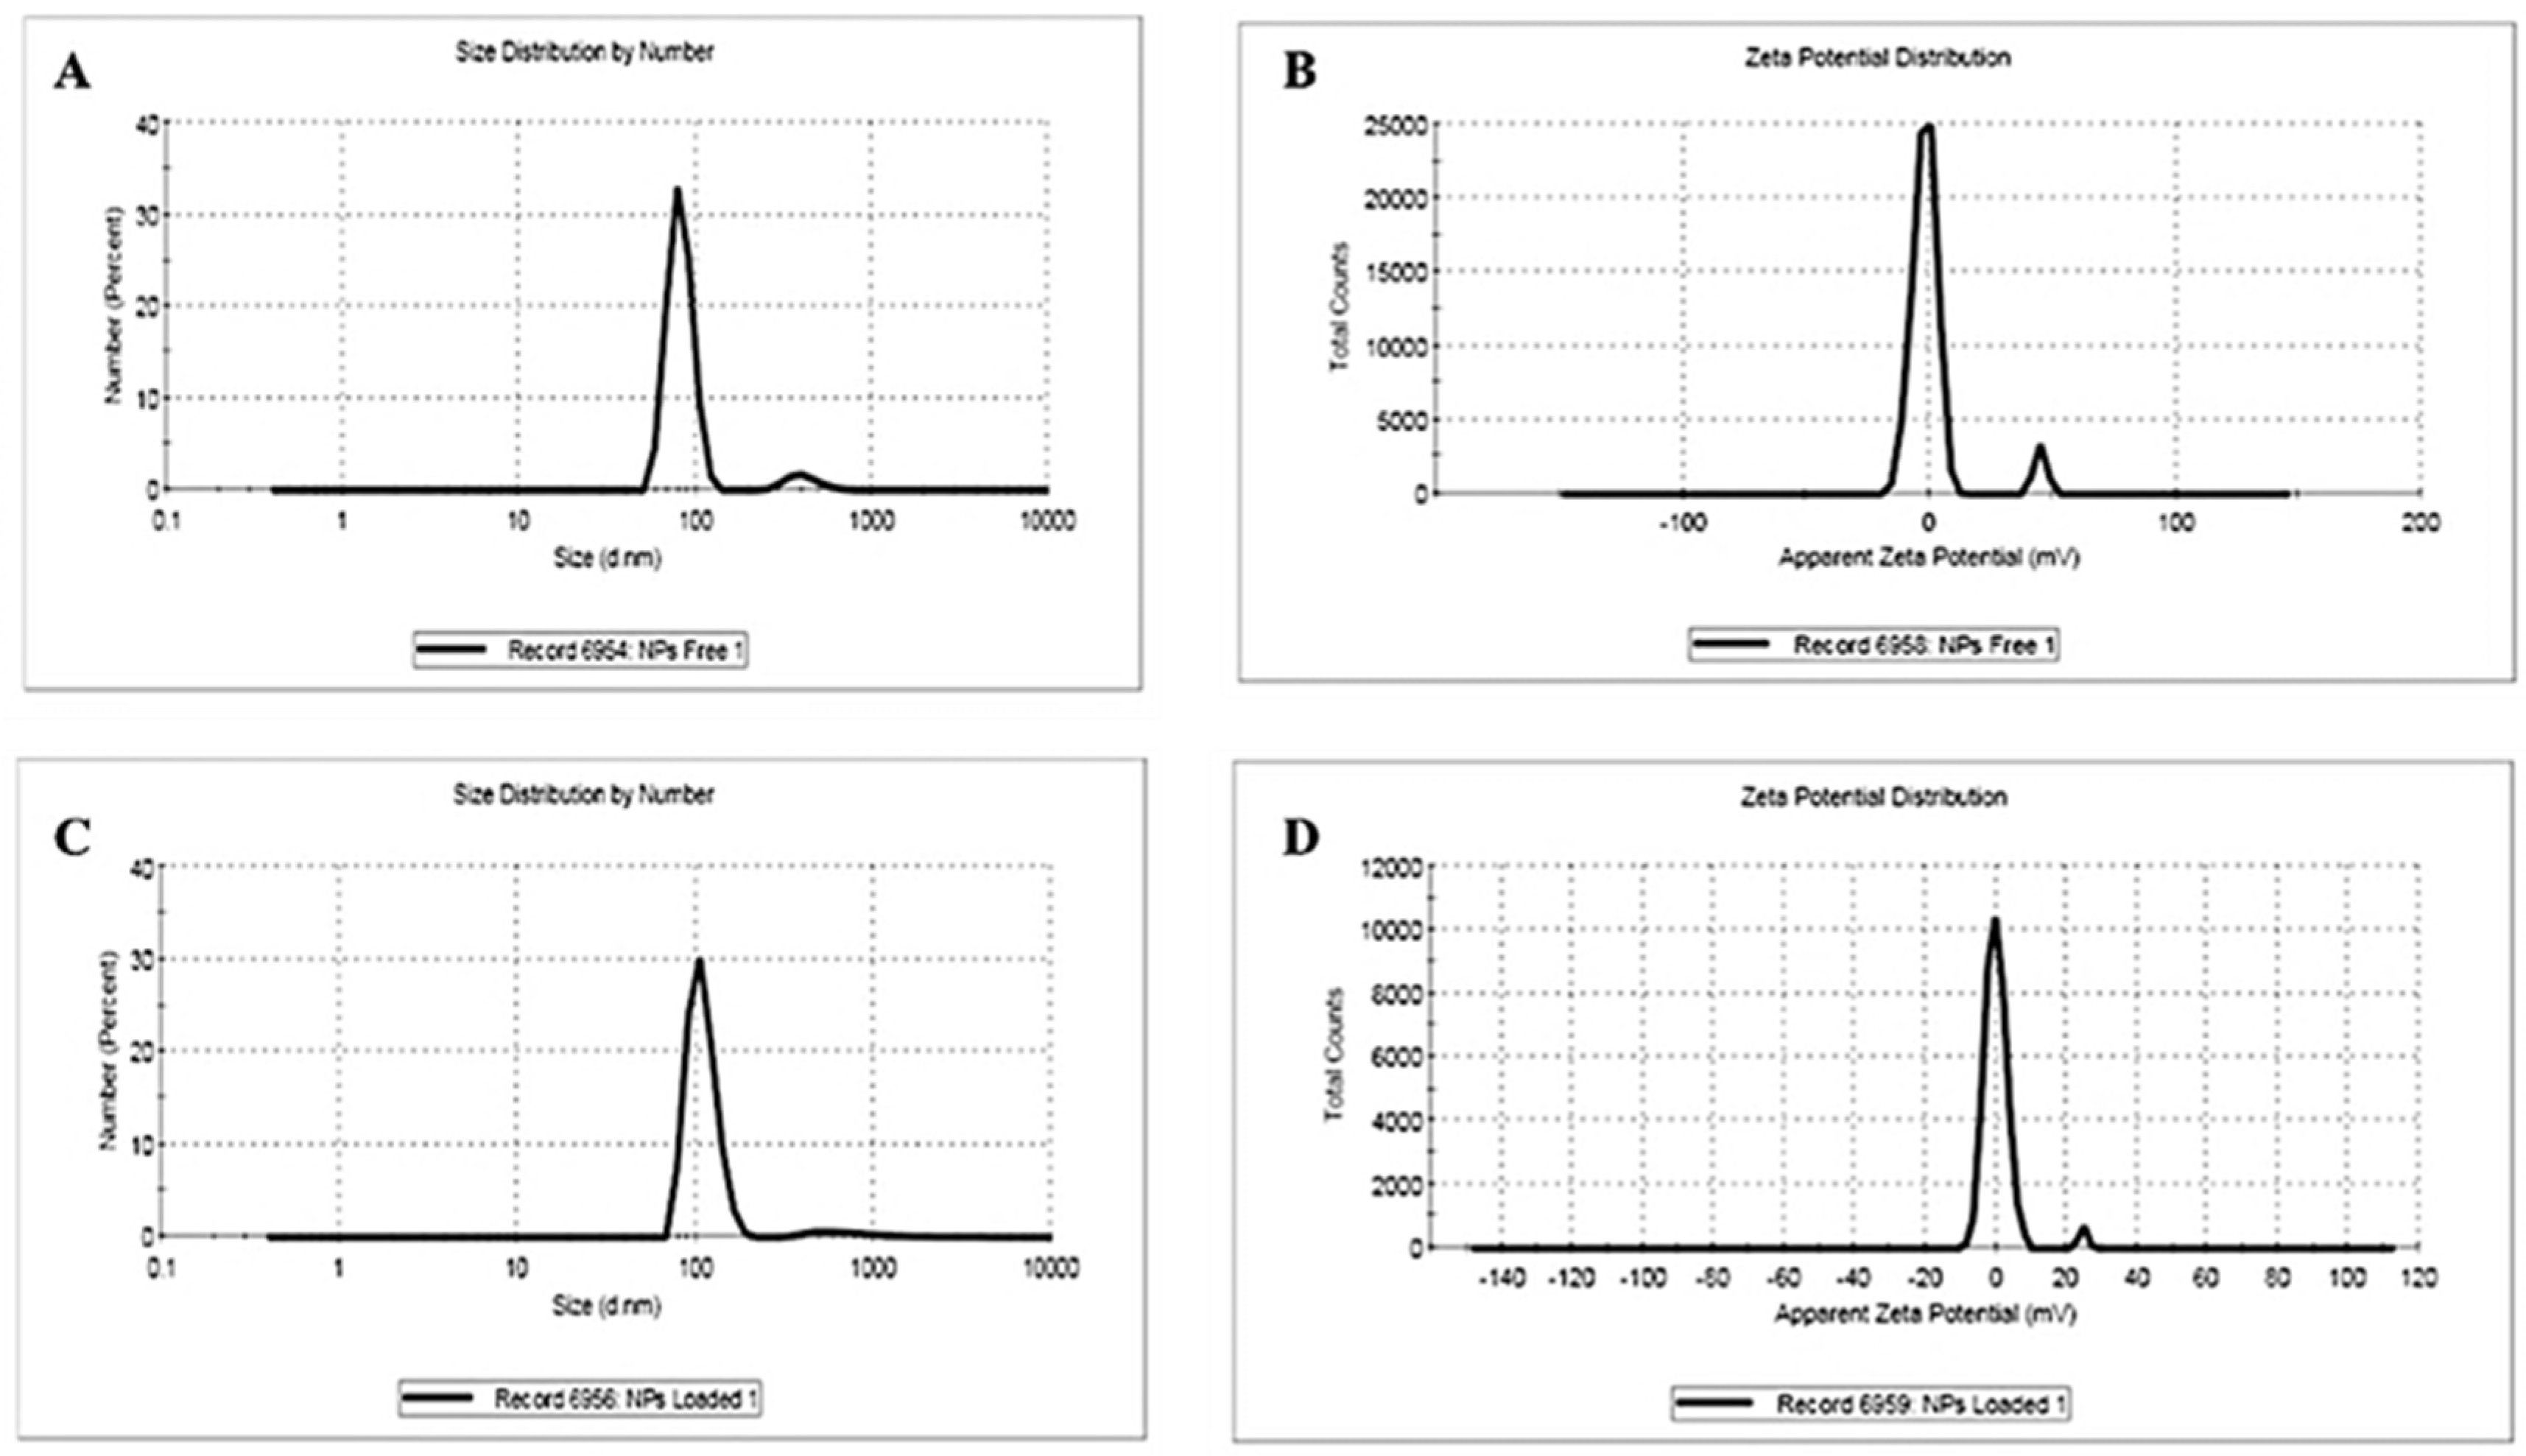
3.2.2. Dynamic Light Scattering and Zeta Potential
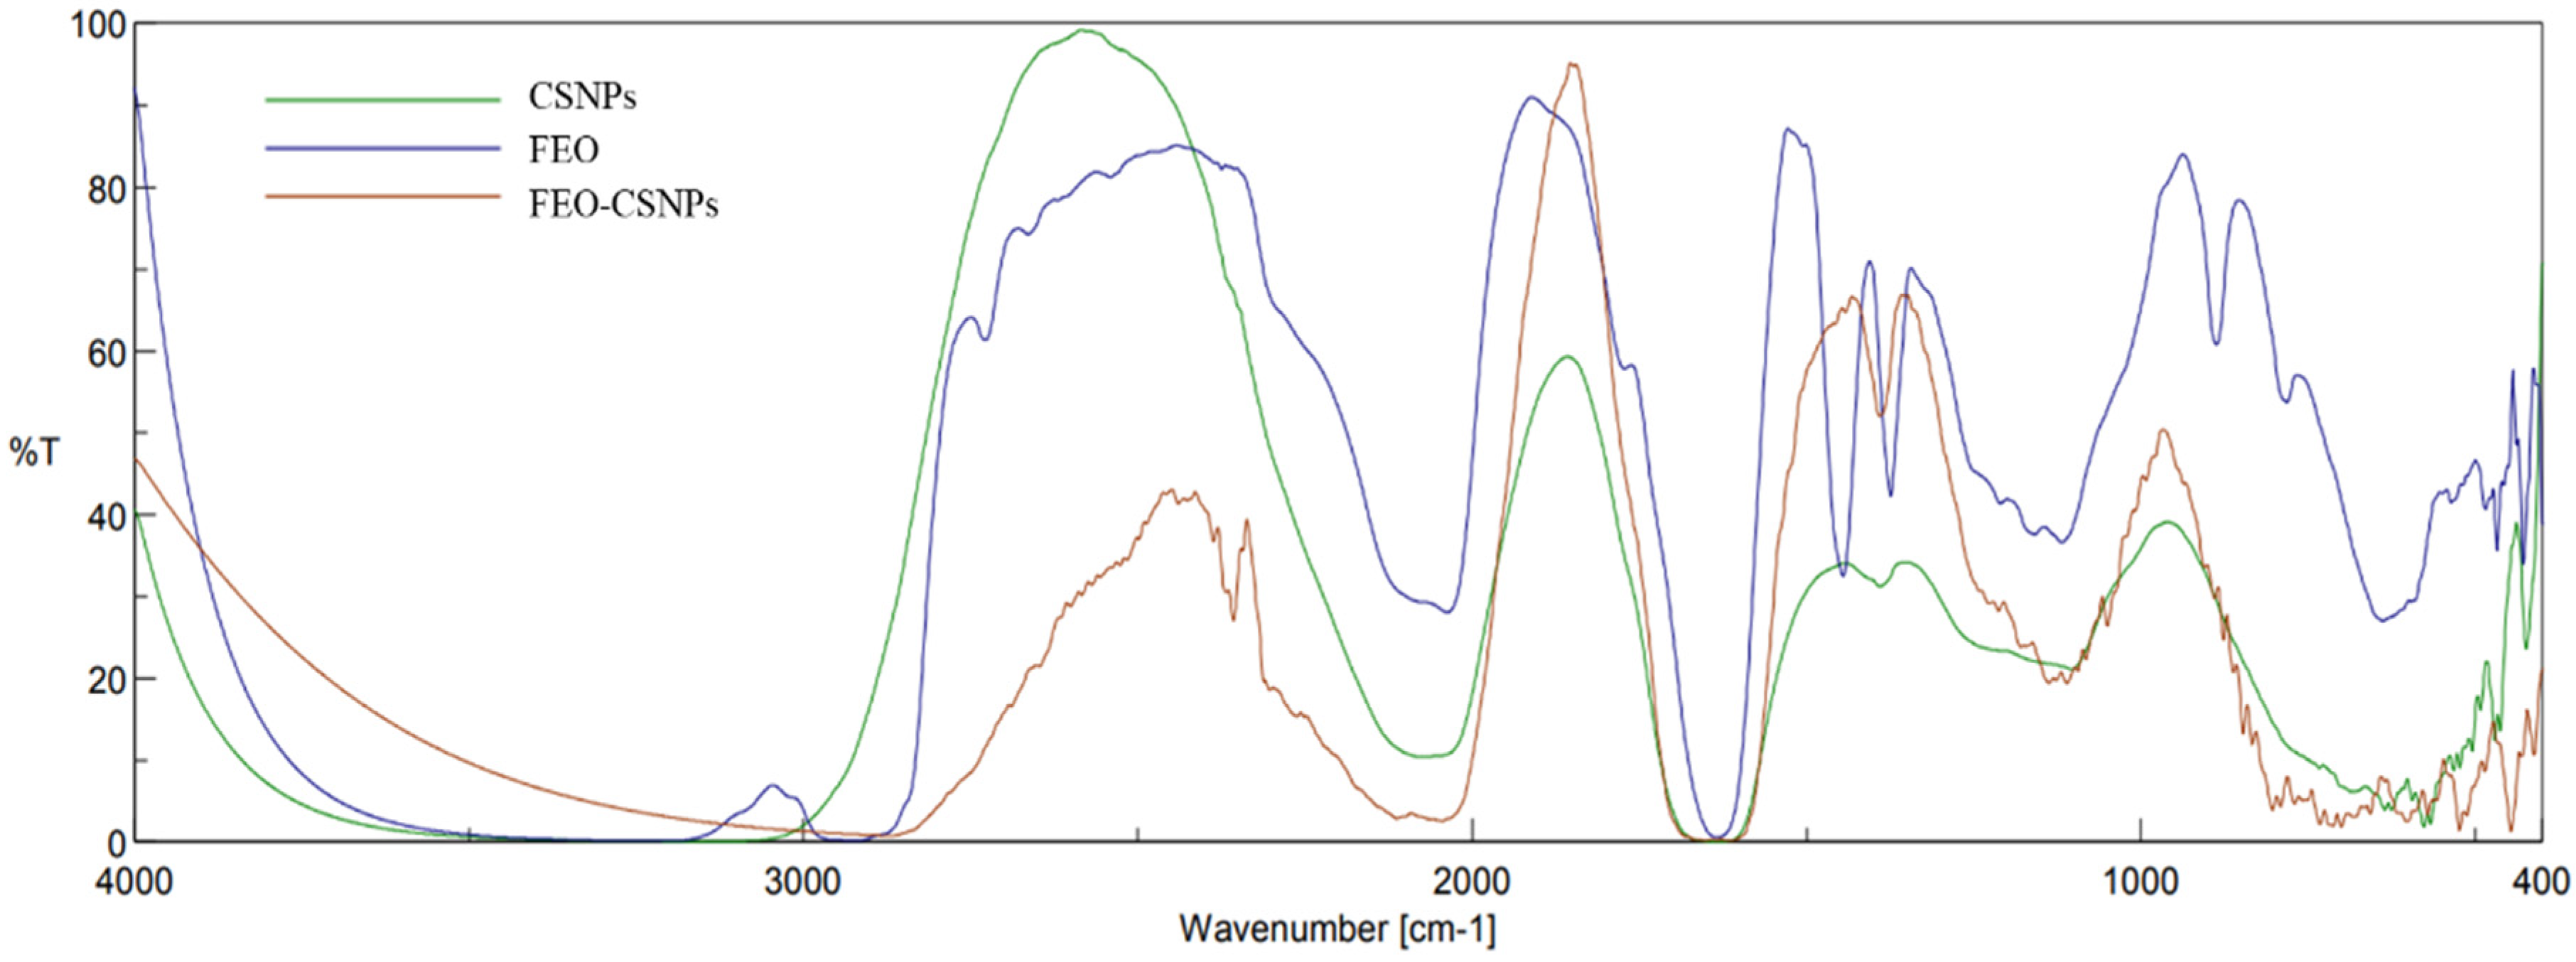
3.2.3. Fourier Transform Infrared Spectroscopic (FTIR)
3.2.4. EE, LC, and In Vitro Drug Release
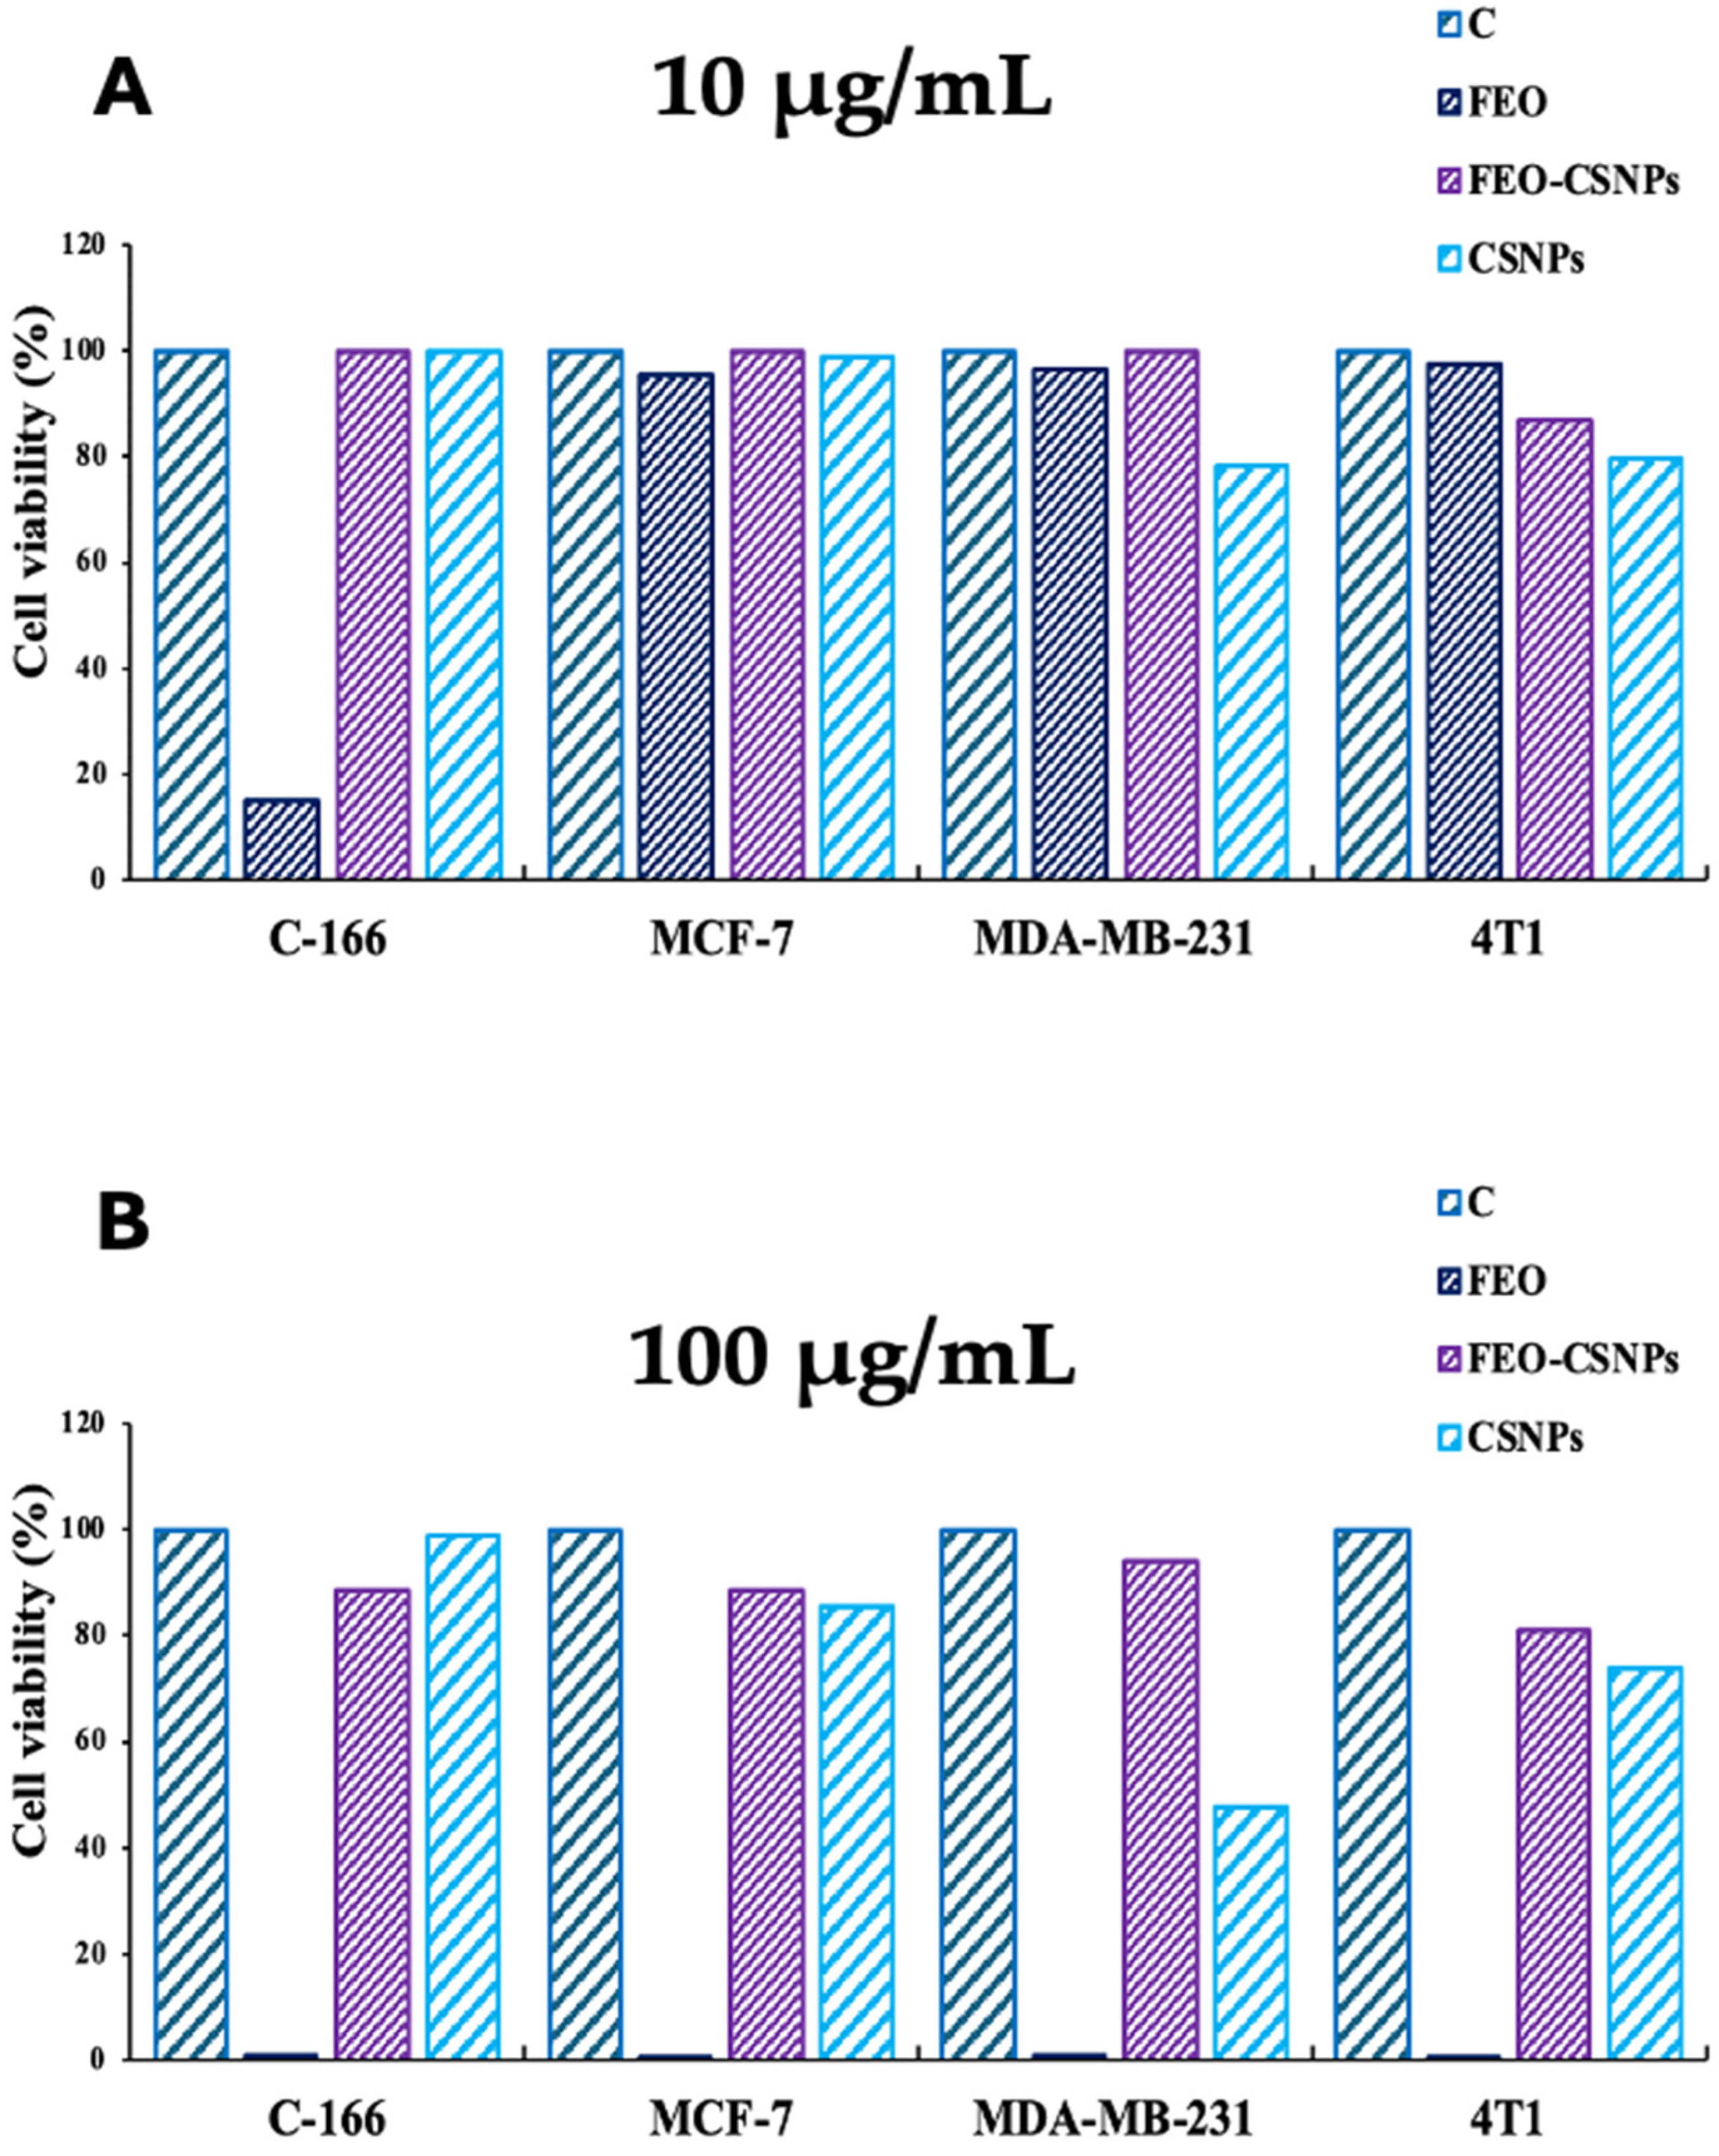
3.3. Cytotoxicity Assay
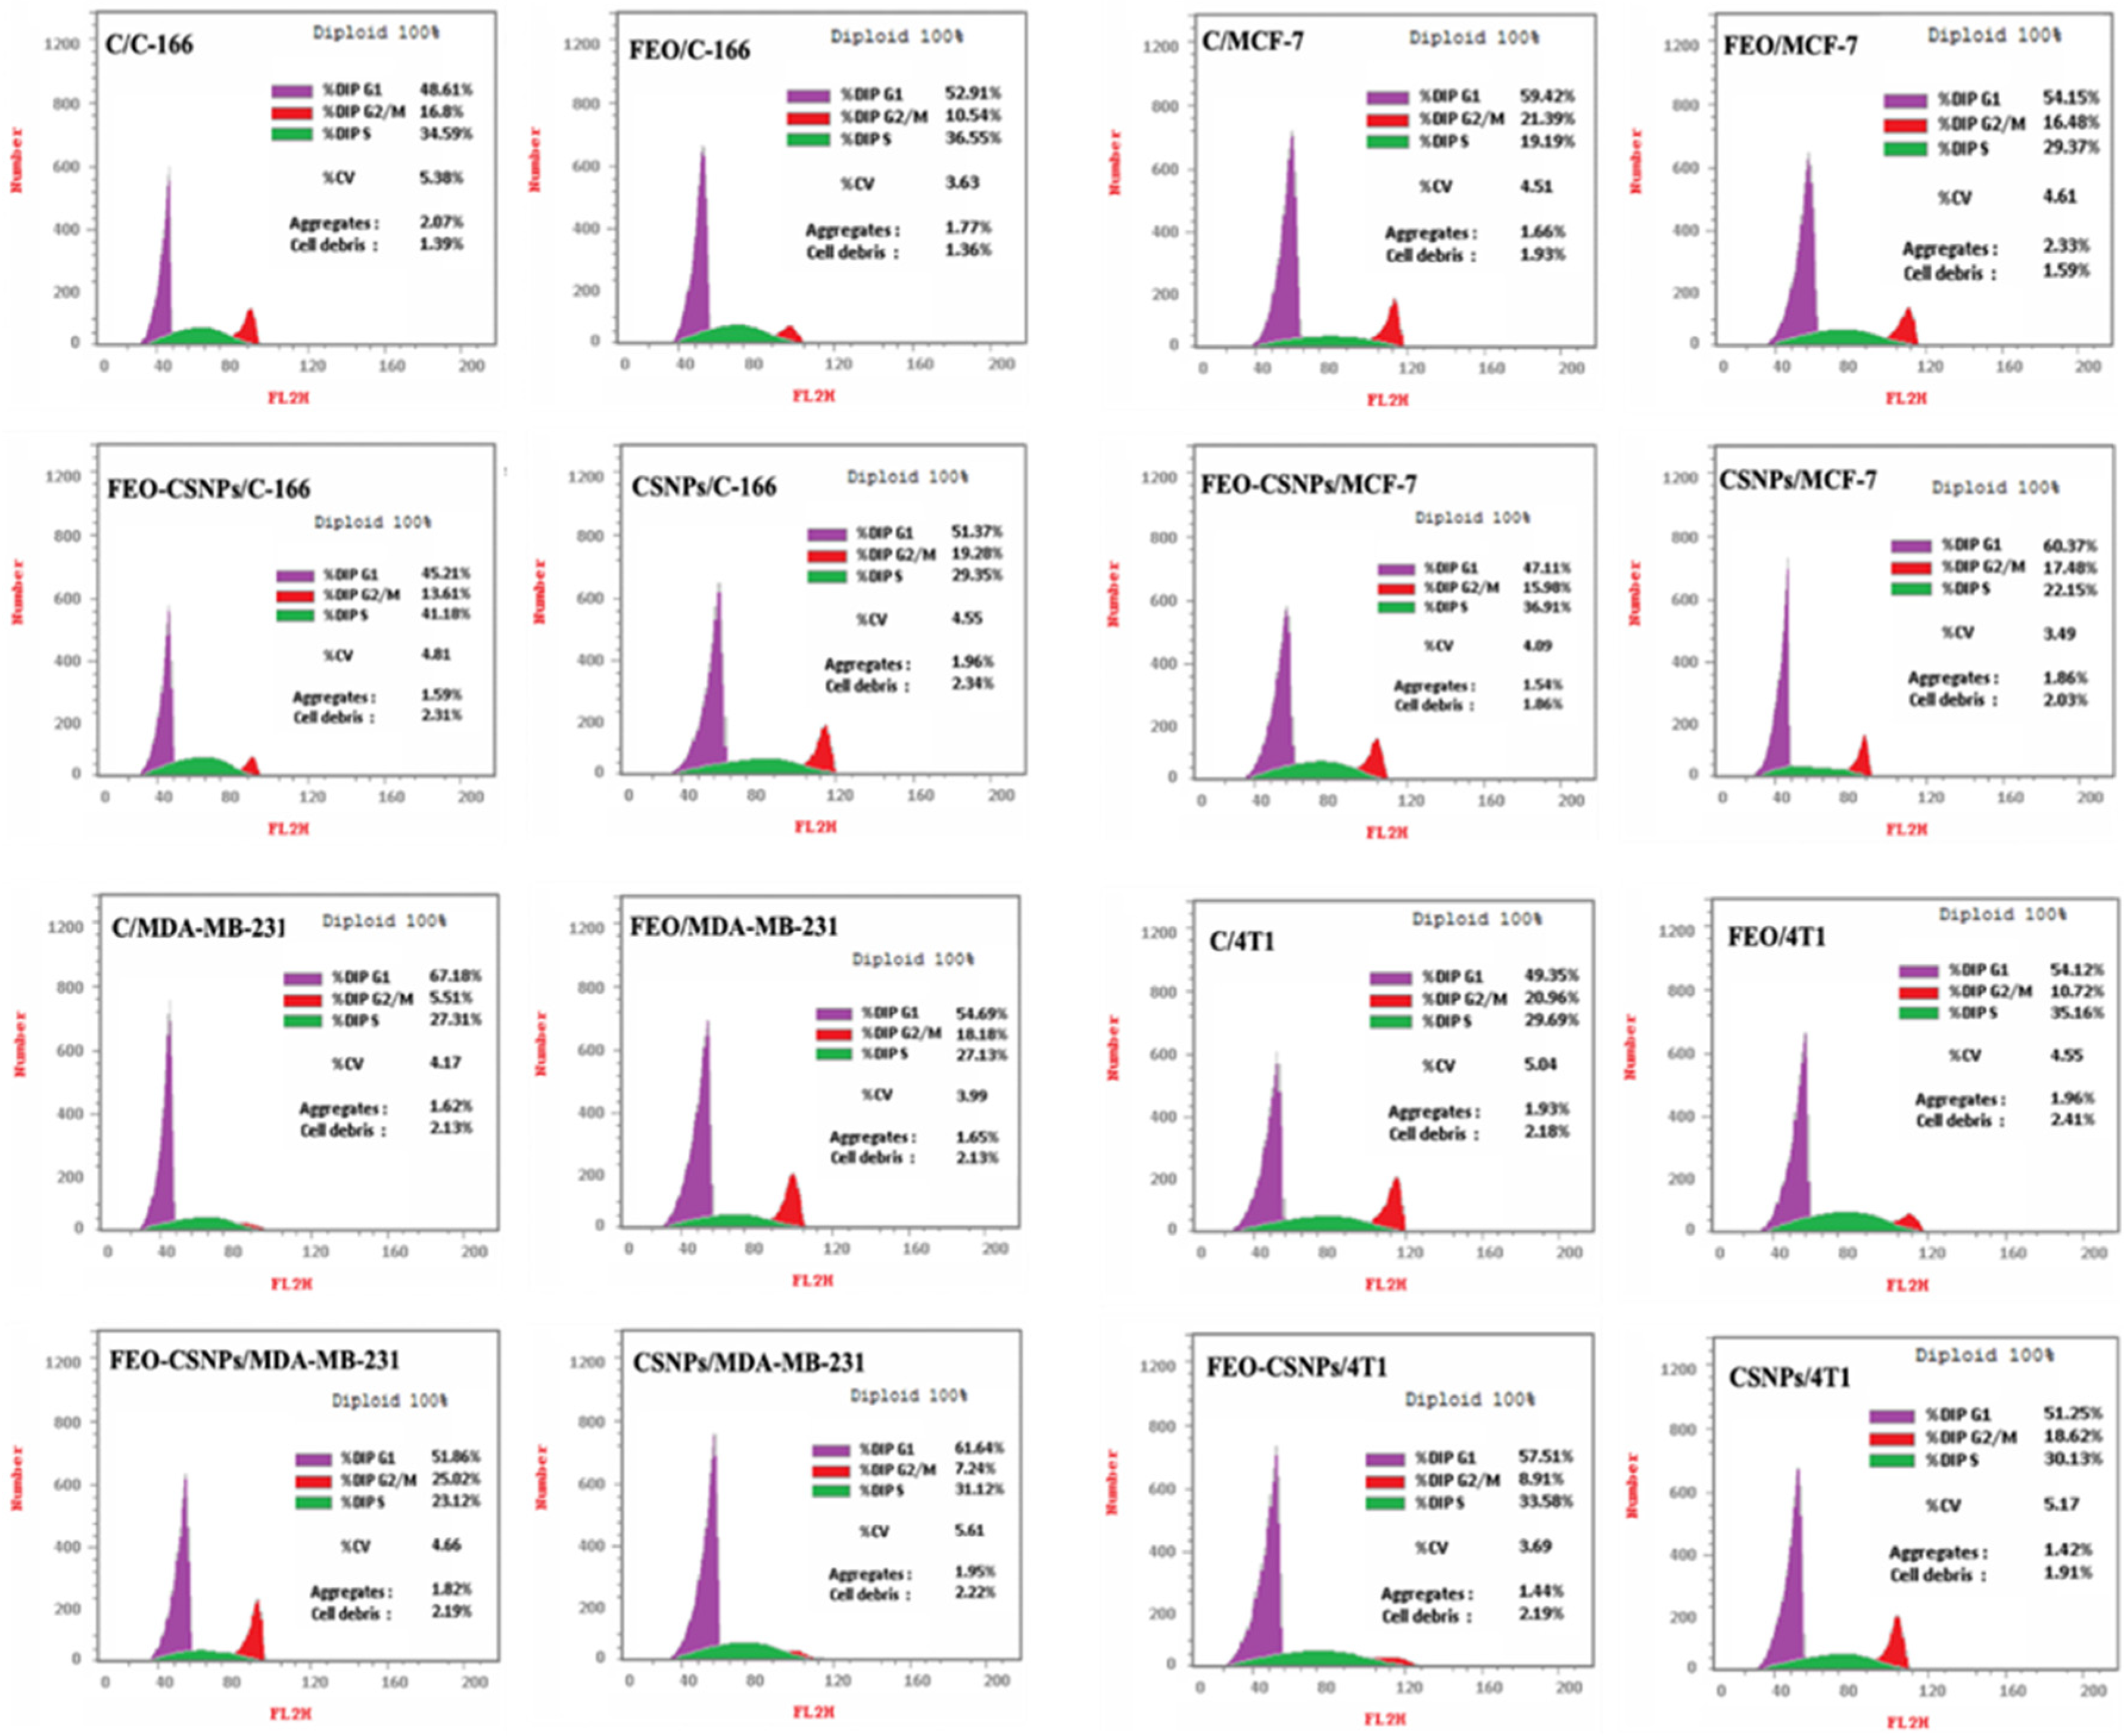
3.4. Cell Cycle Distribution
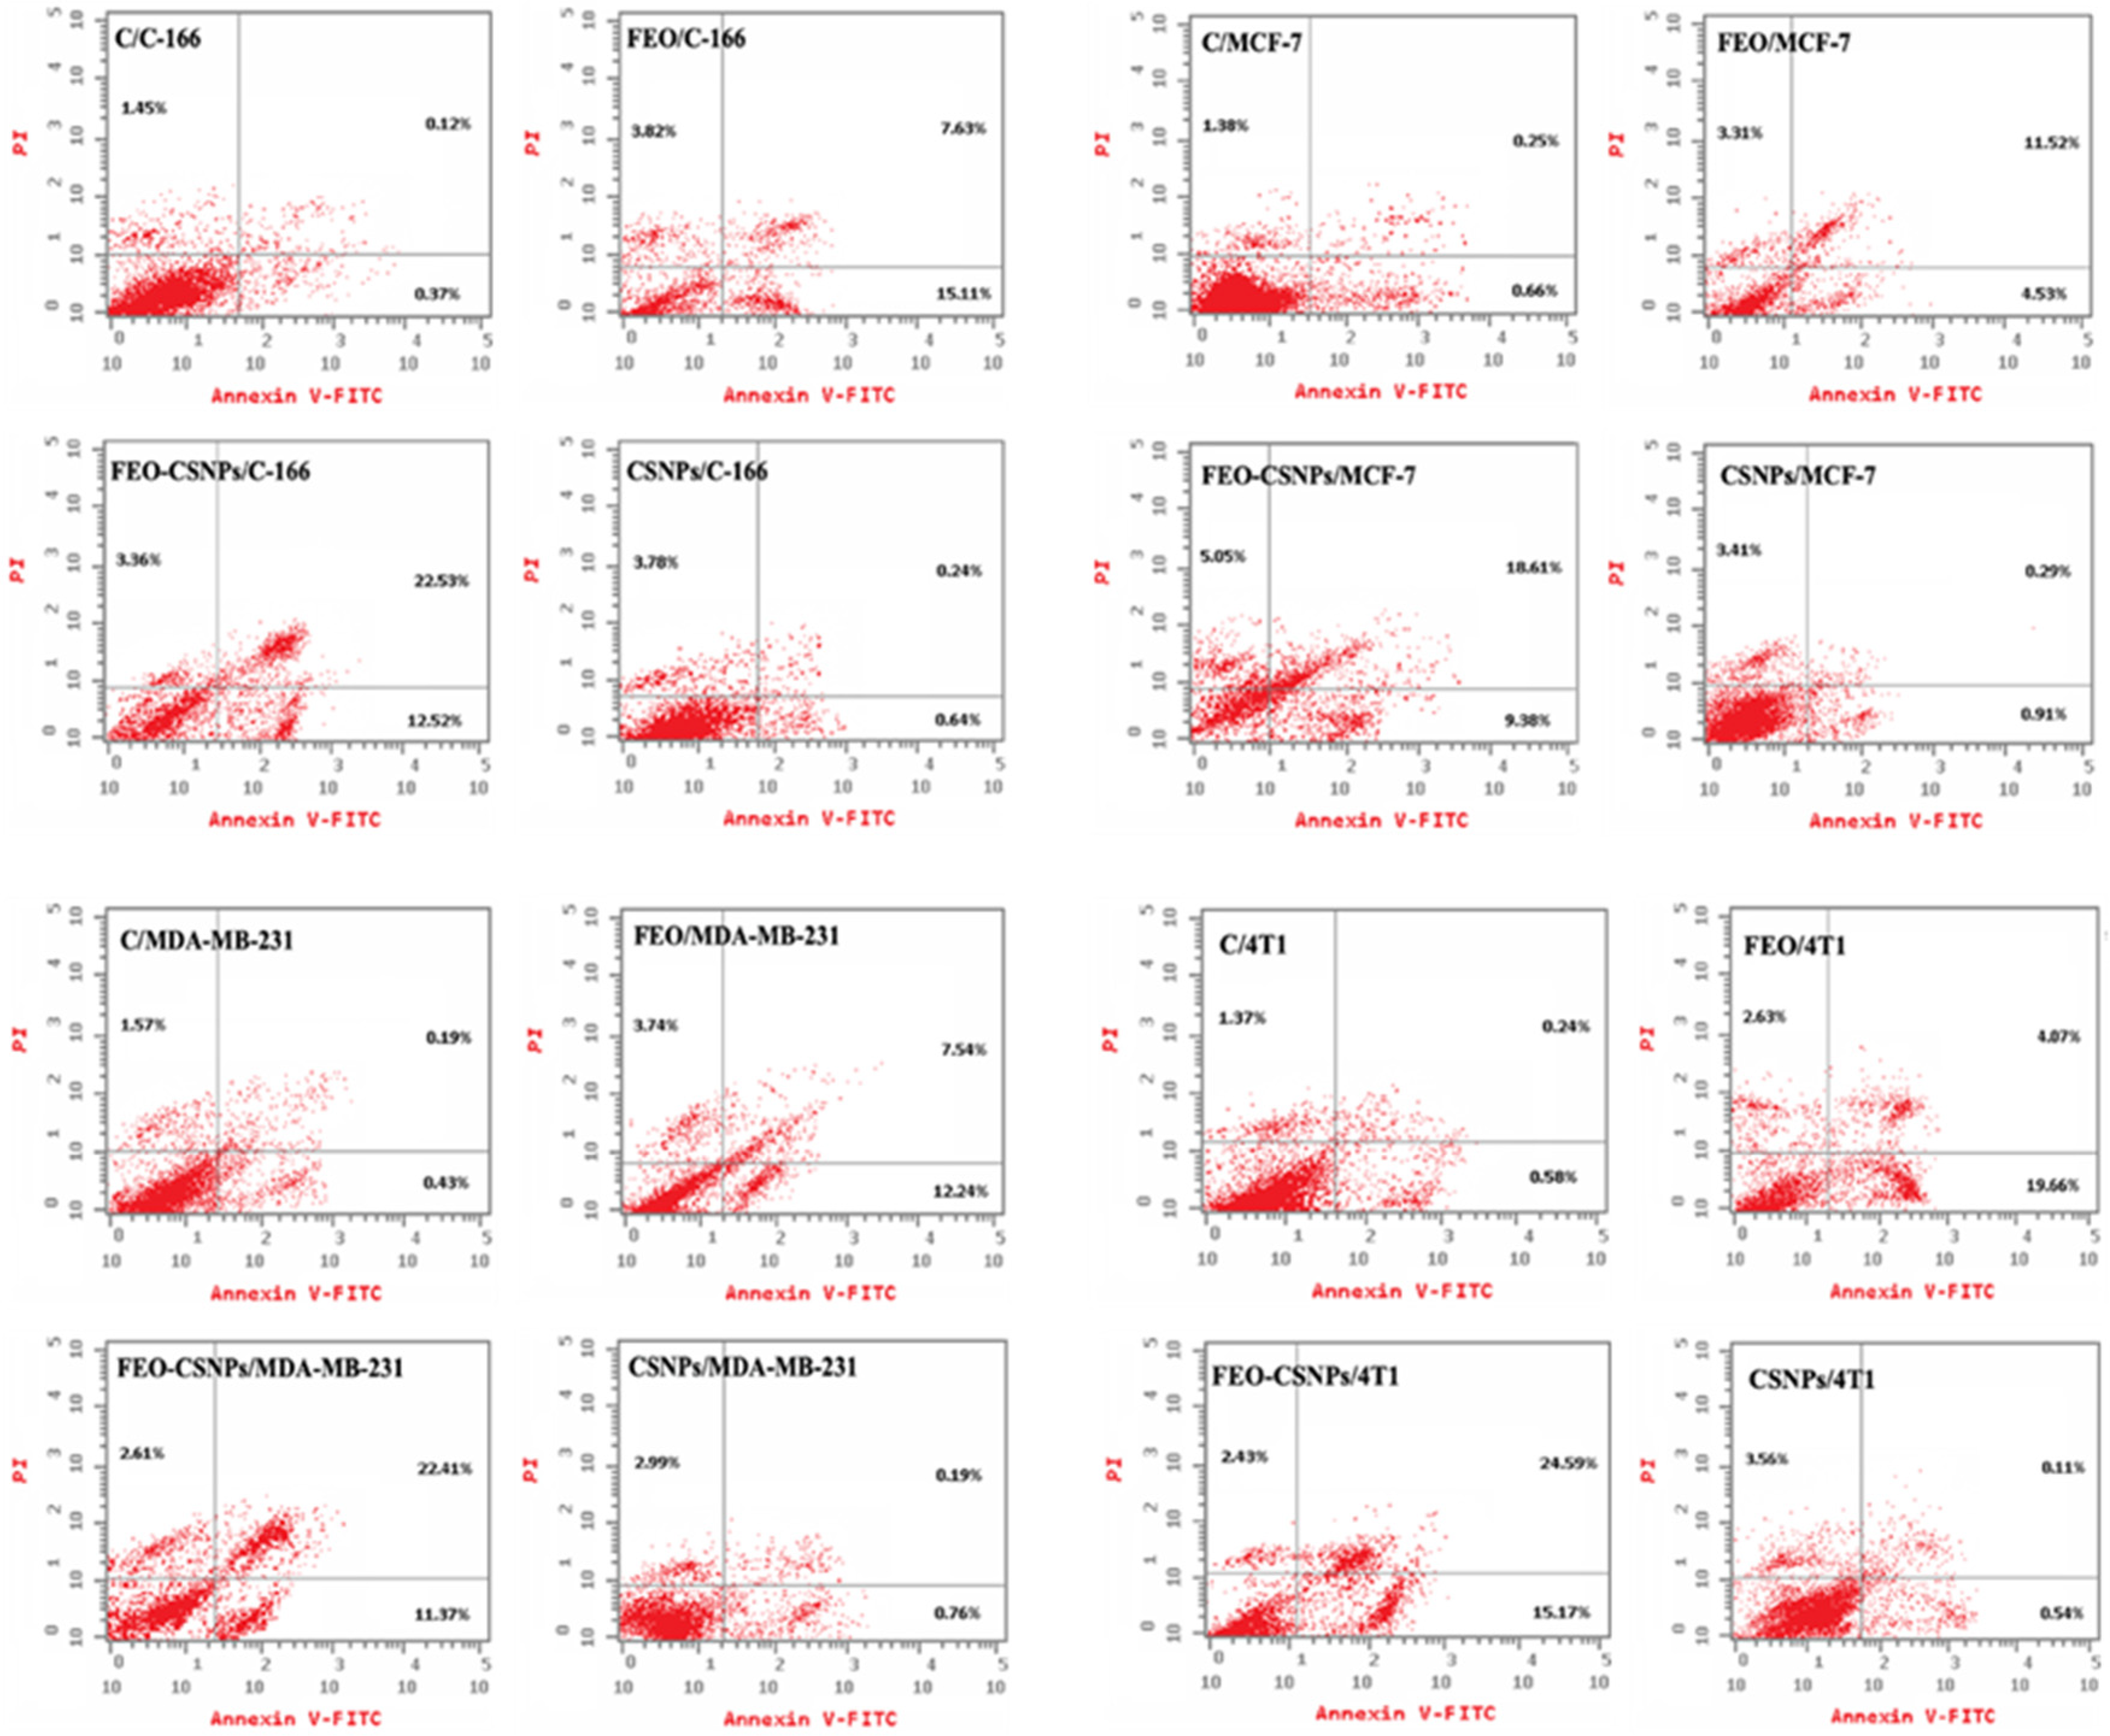
3.5. Apoptosis Detection
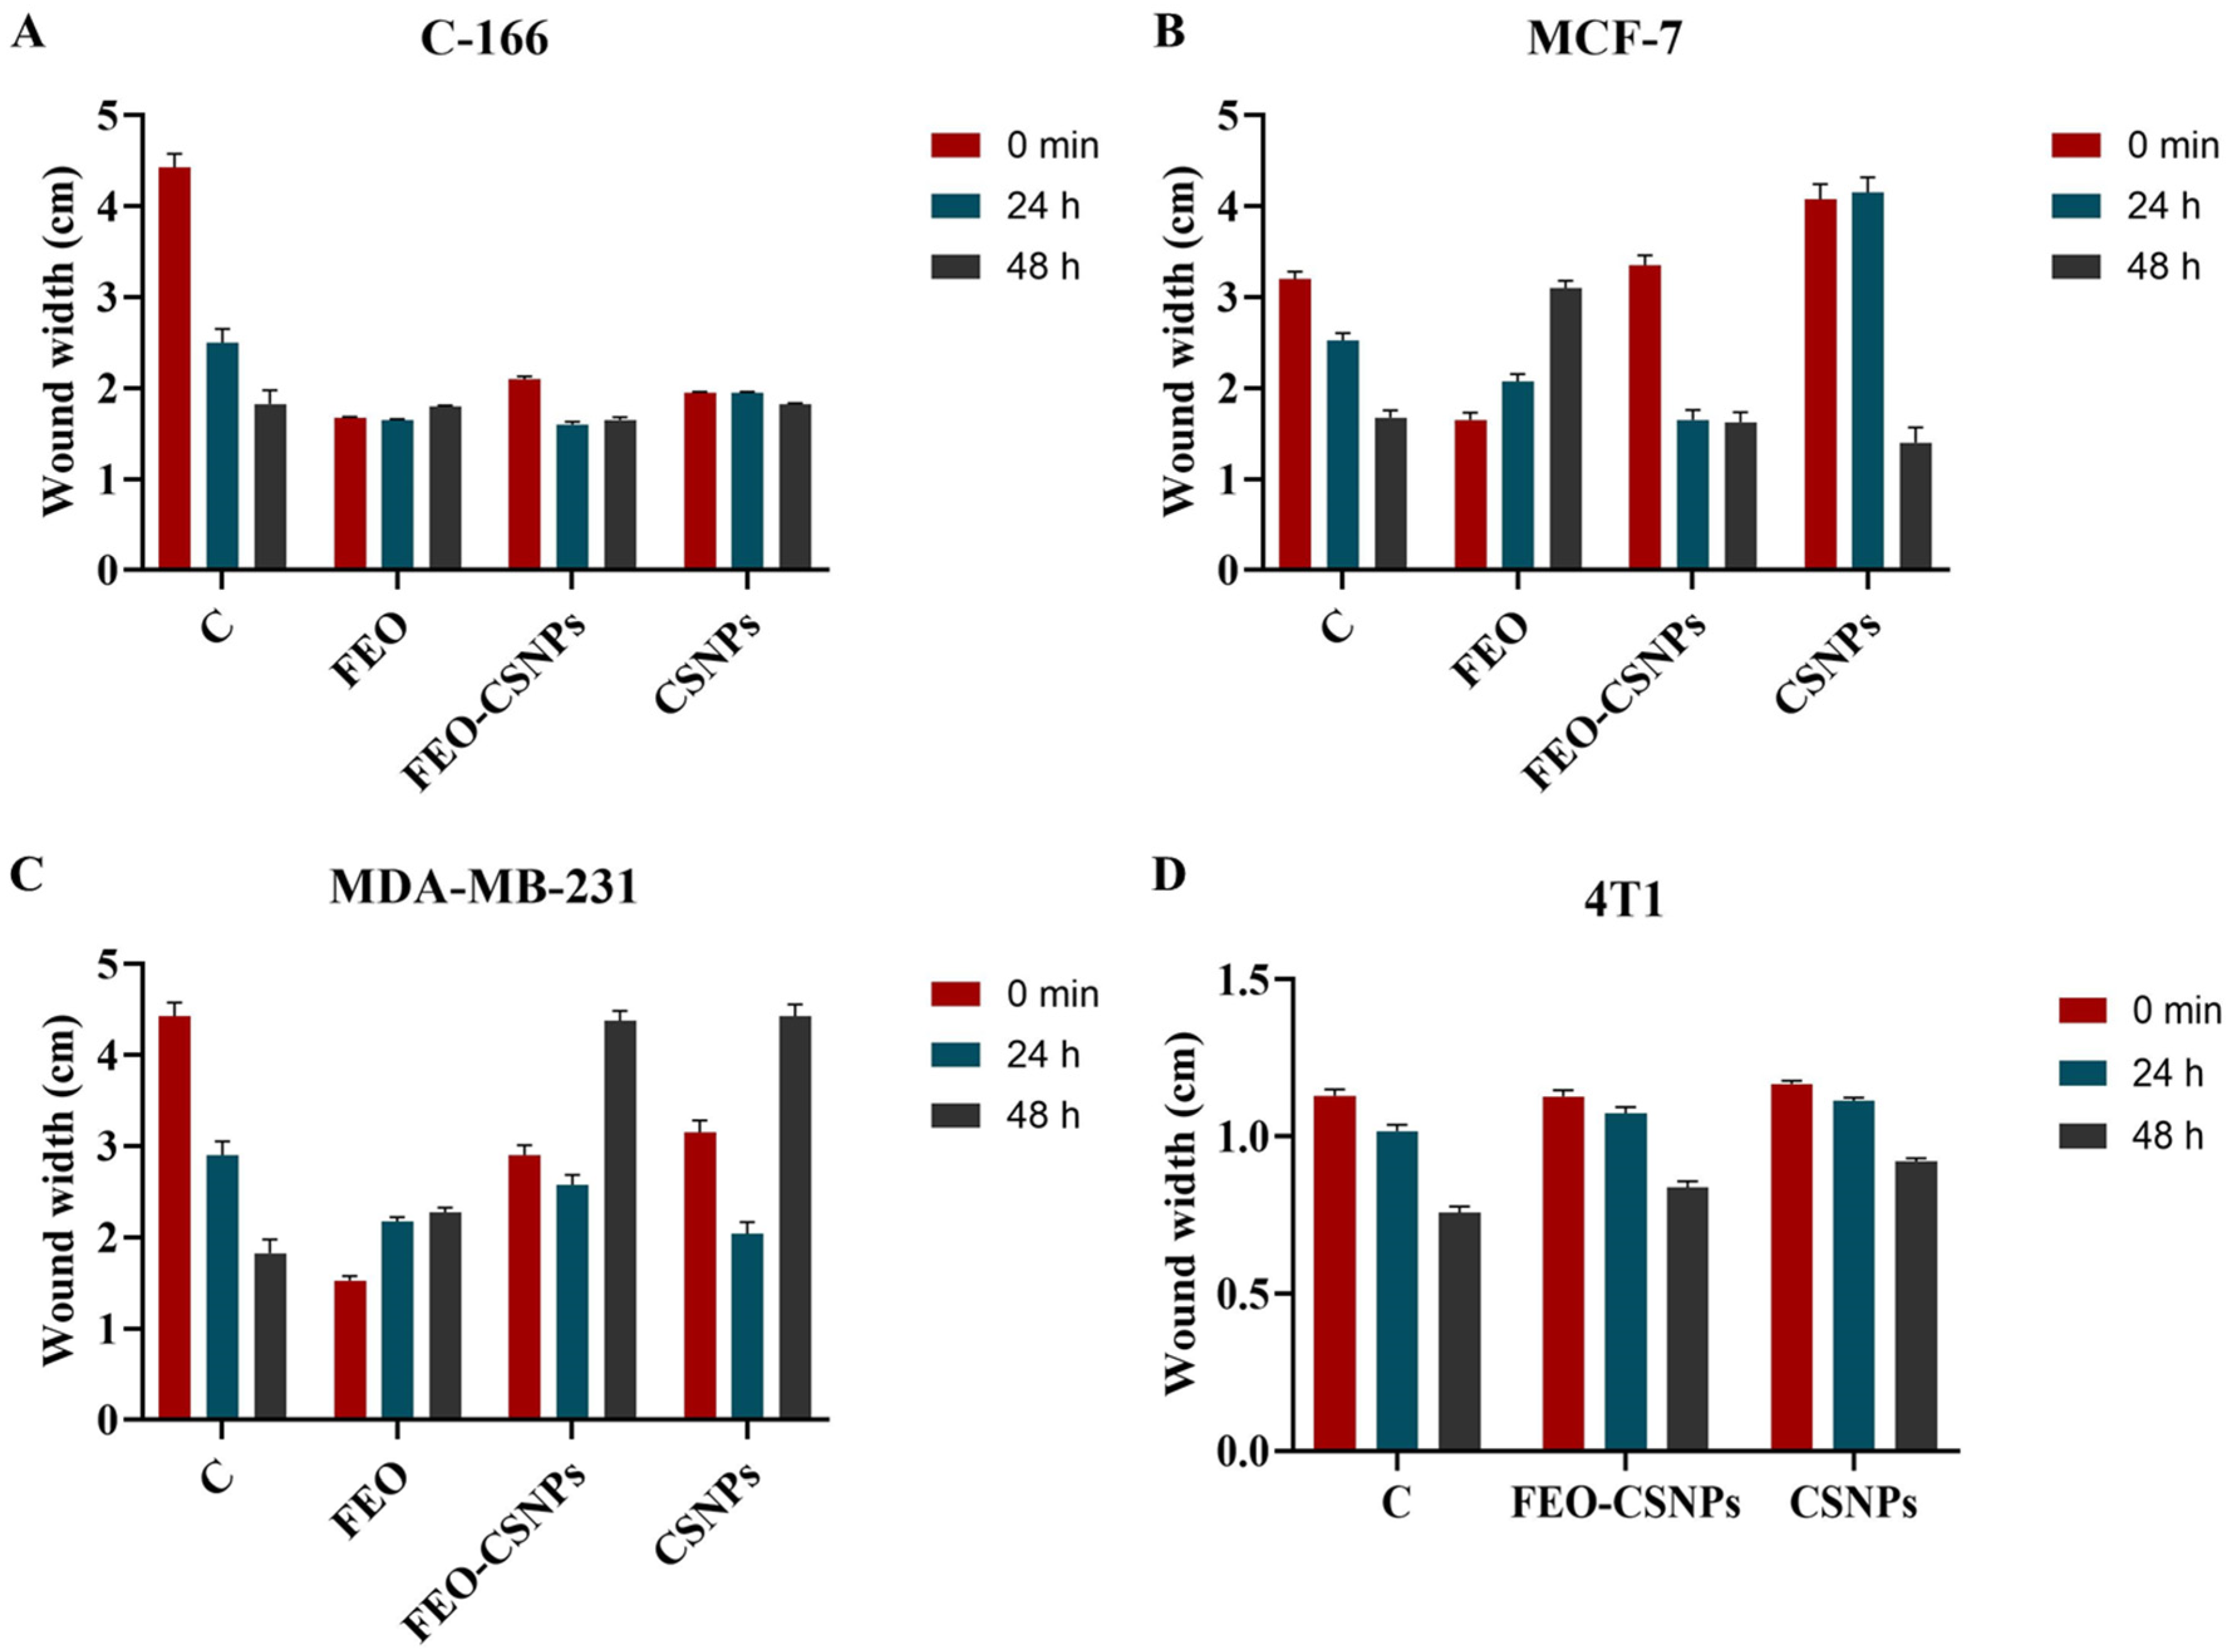
3.6. Wound Healing Assay
3.7. In Vivo Experimental Studies
3.7.1. Body Weight and Tumor Volume
3.7.2. Microscopic Study of Mammary Gland
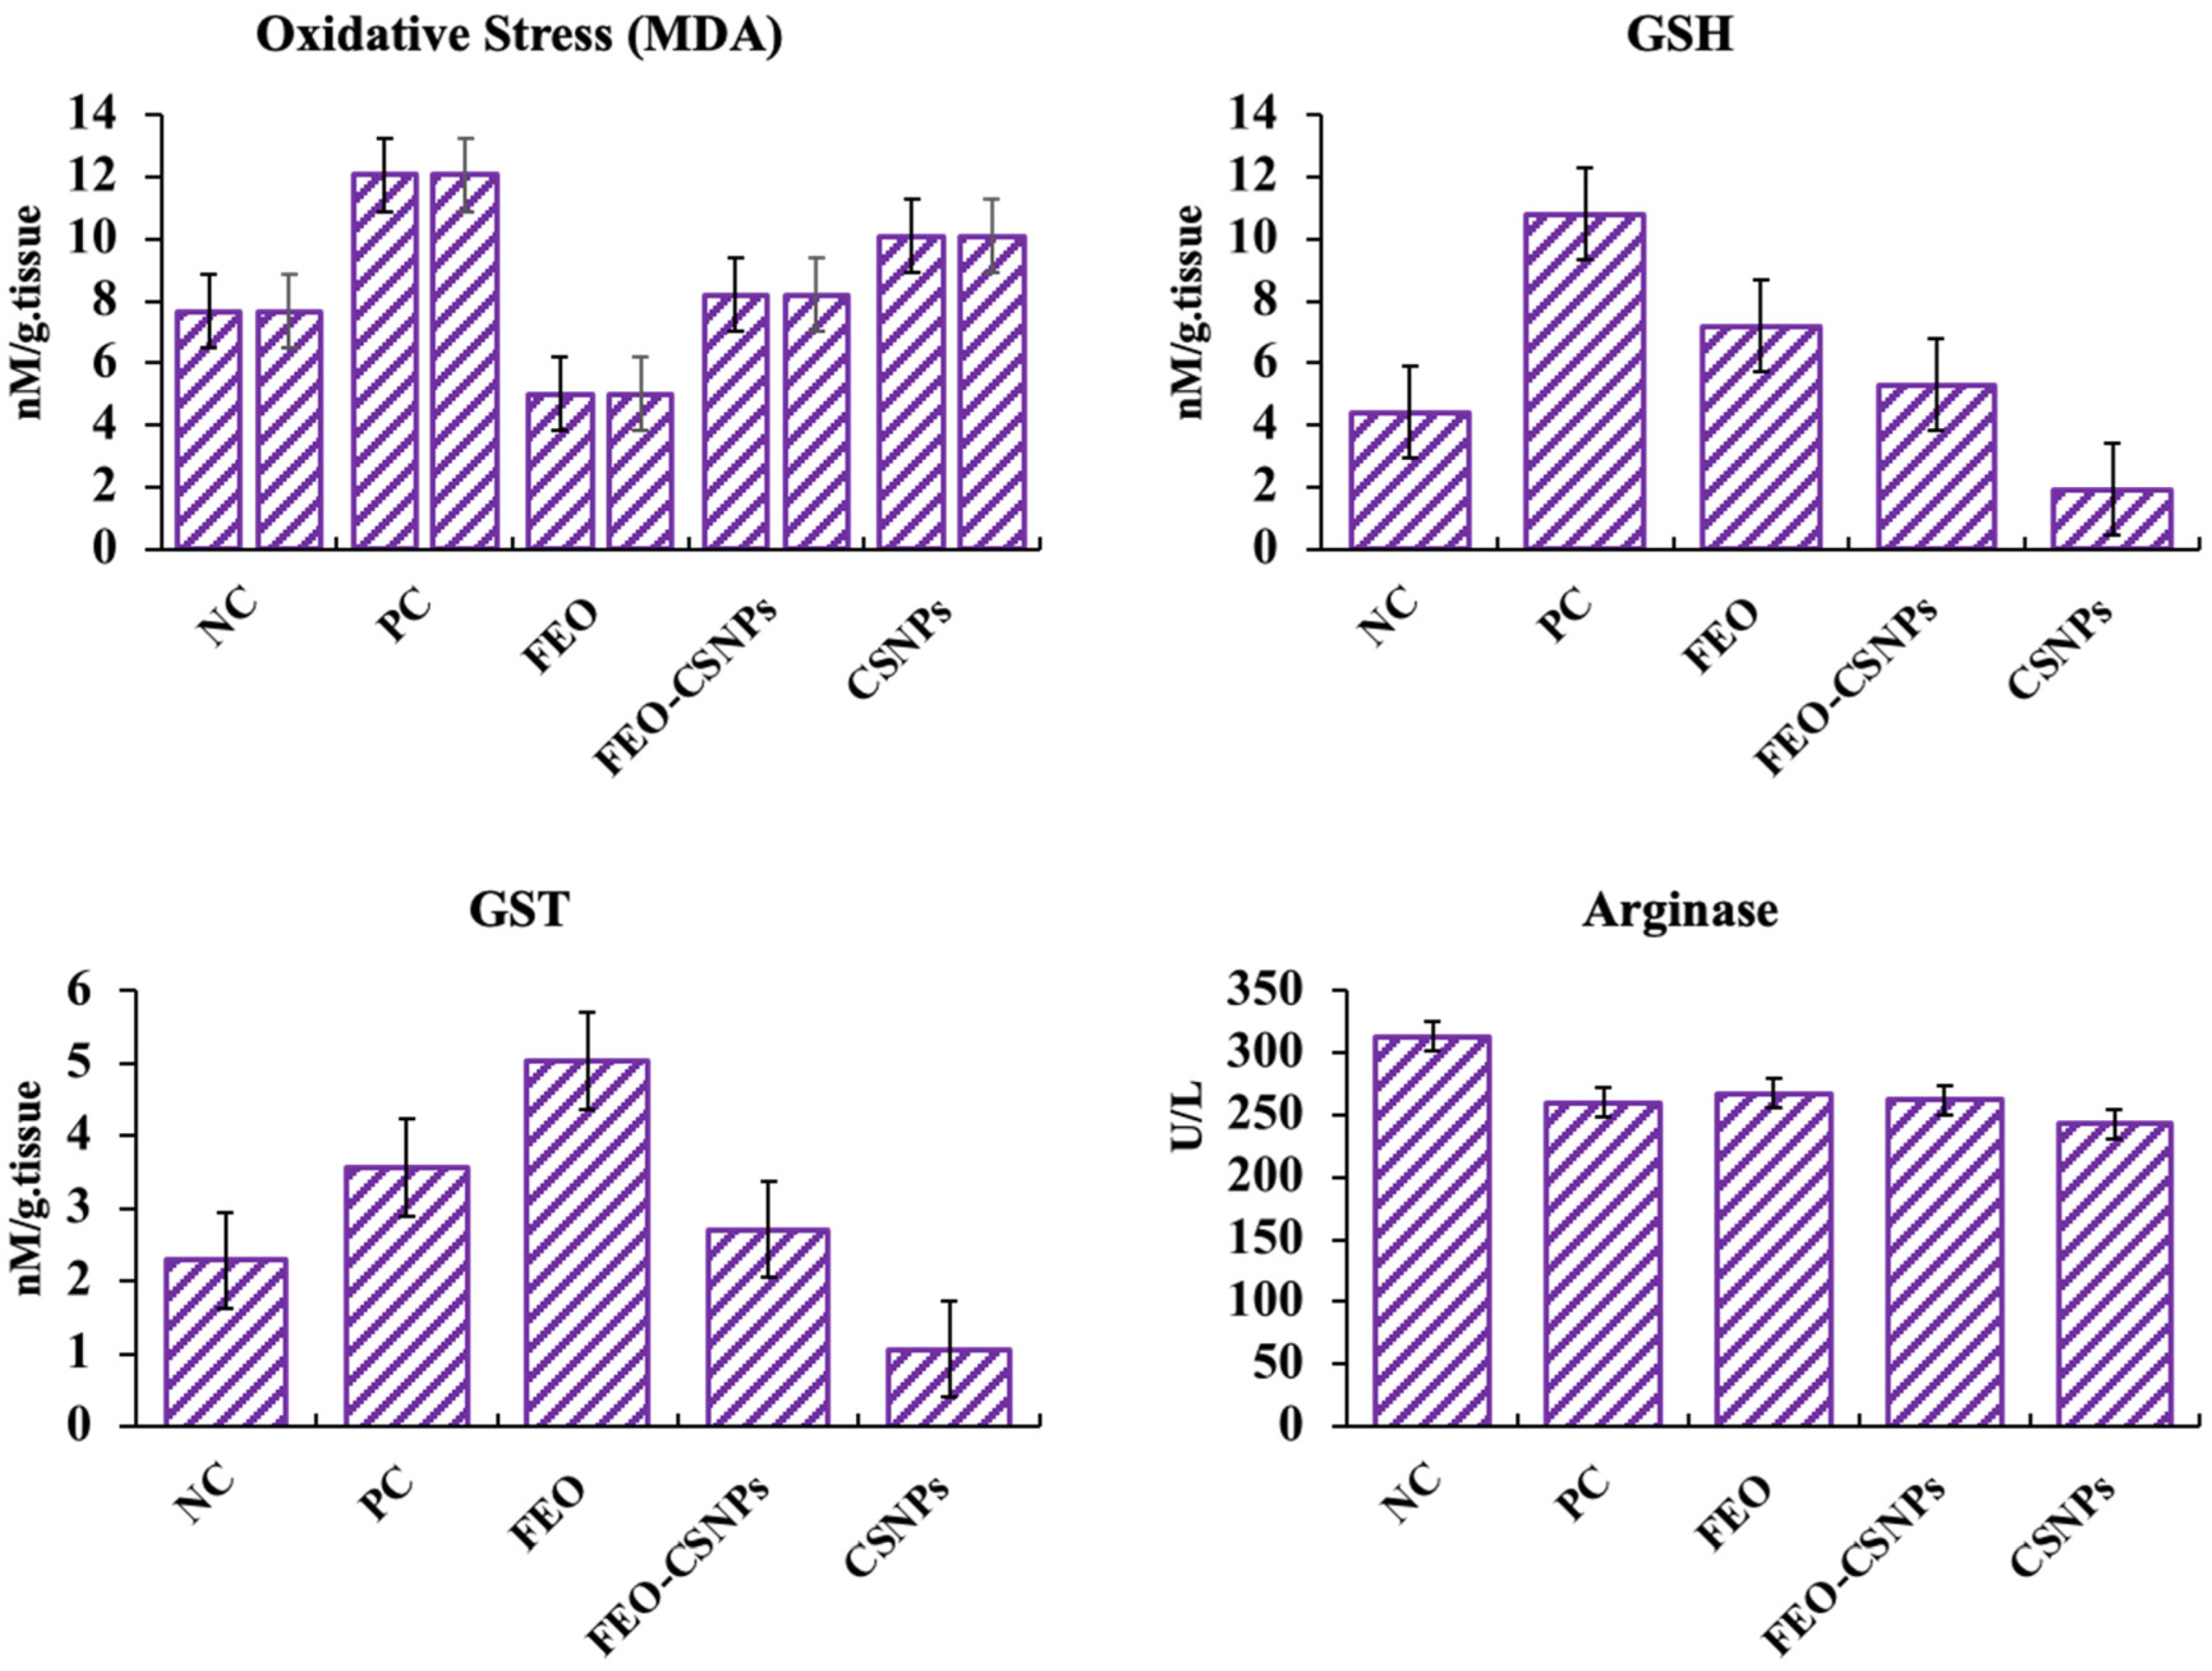
3.7.3. Stress-Related Parameters
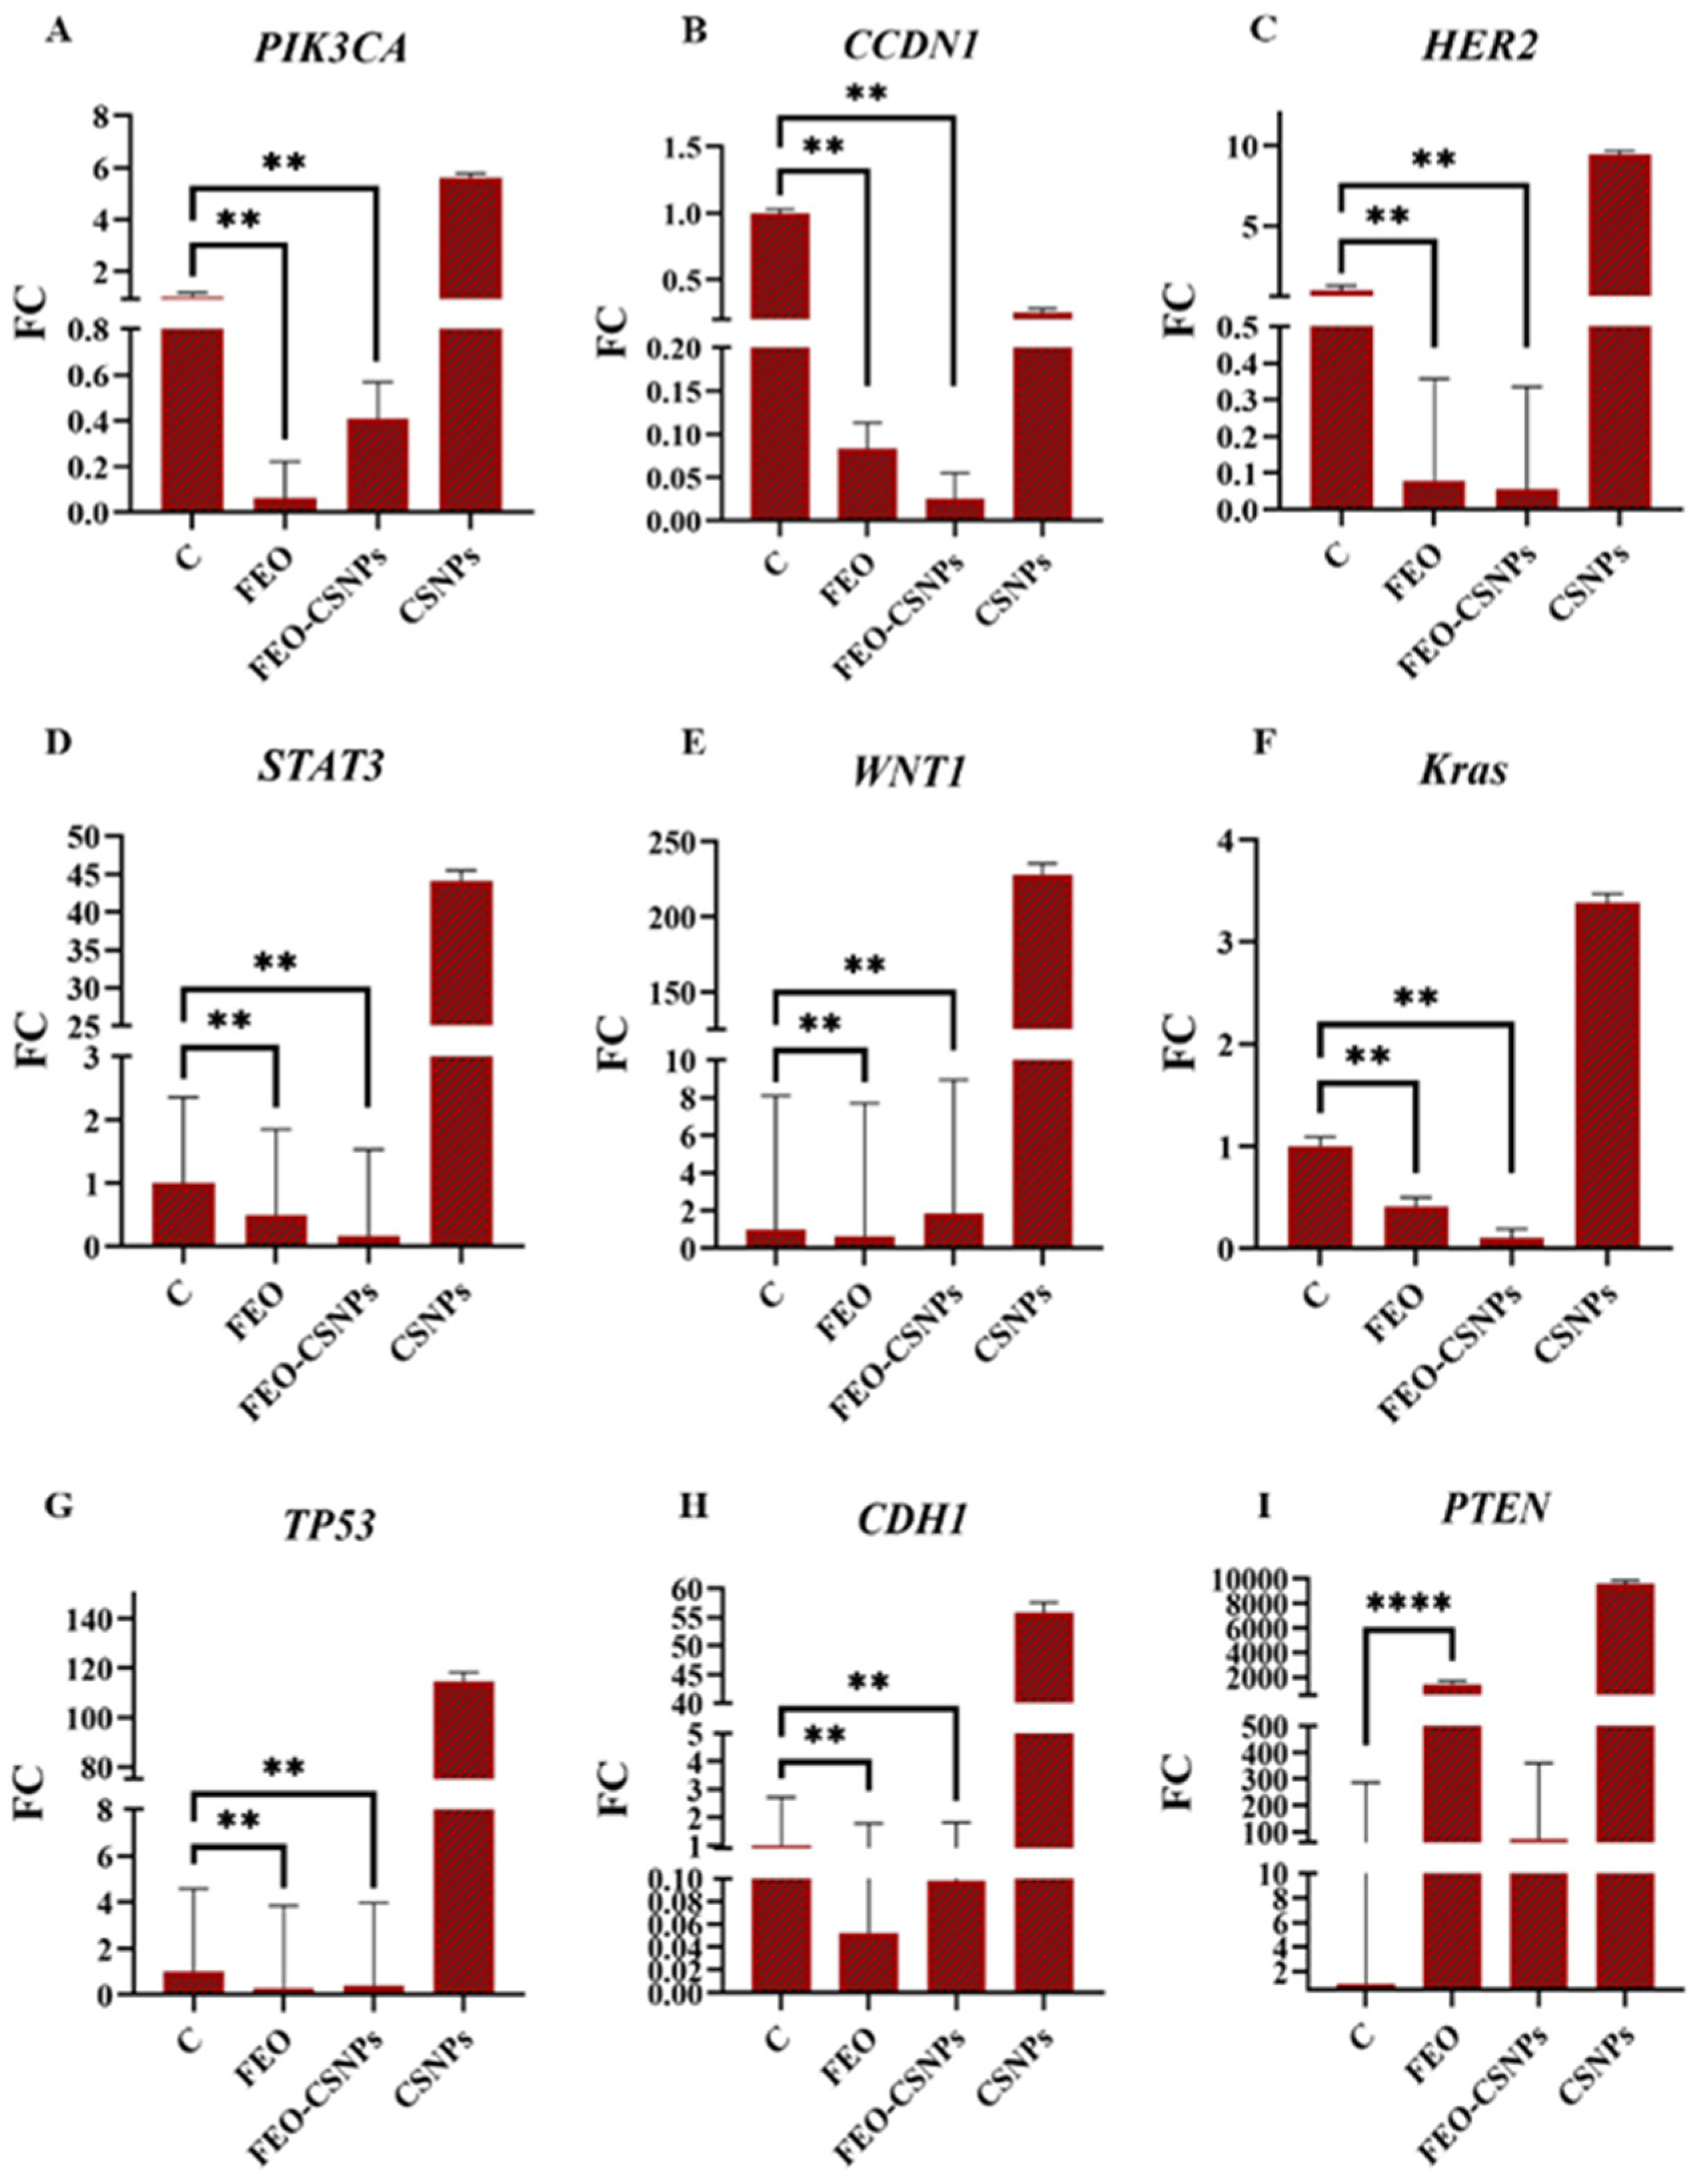
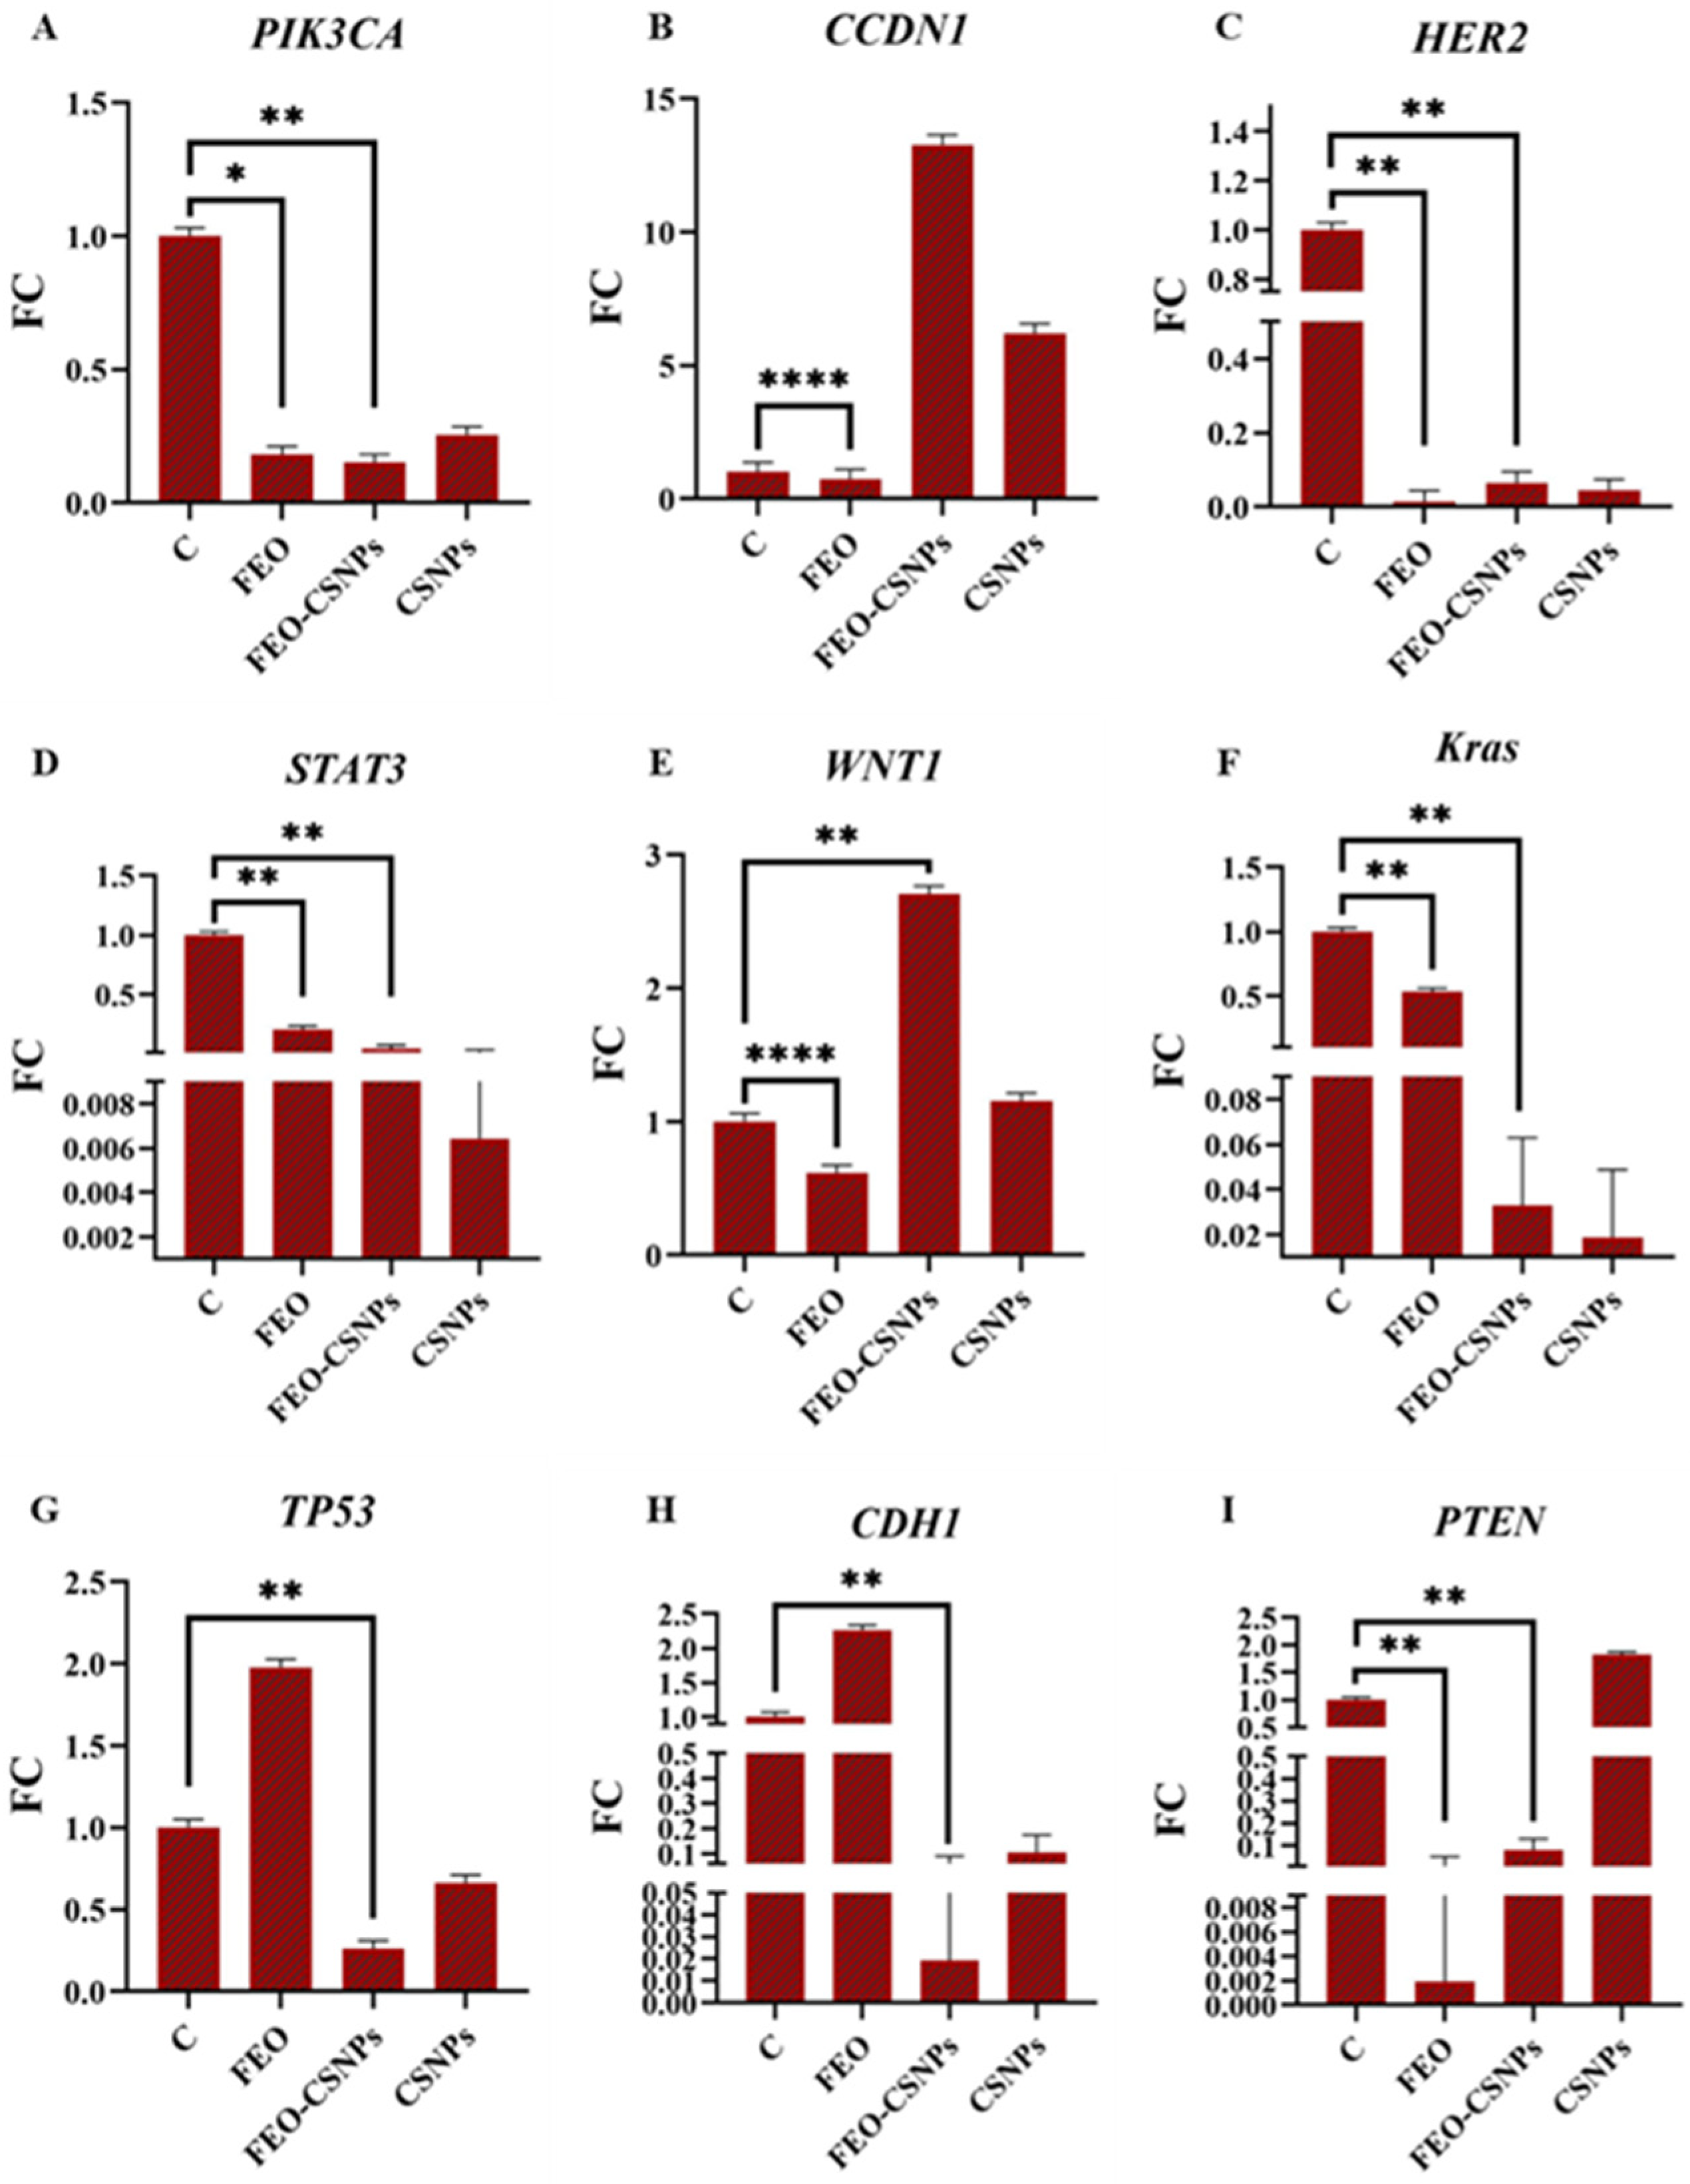
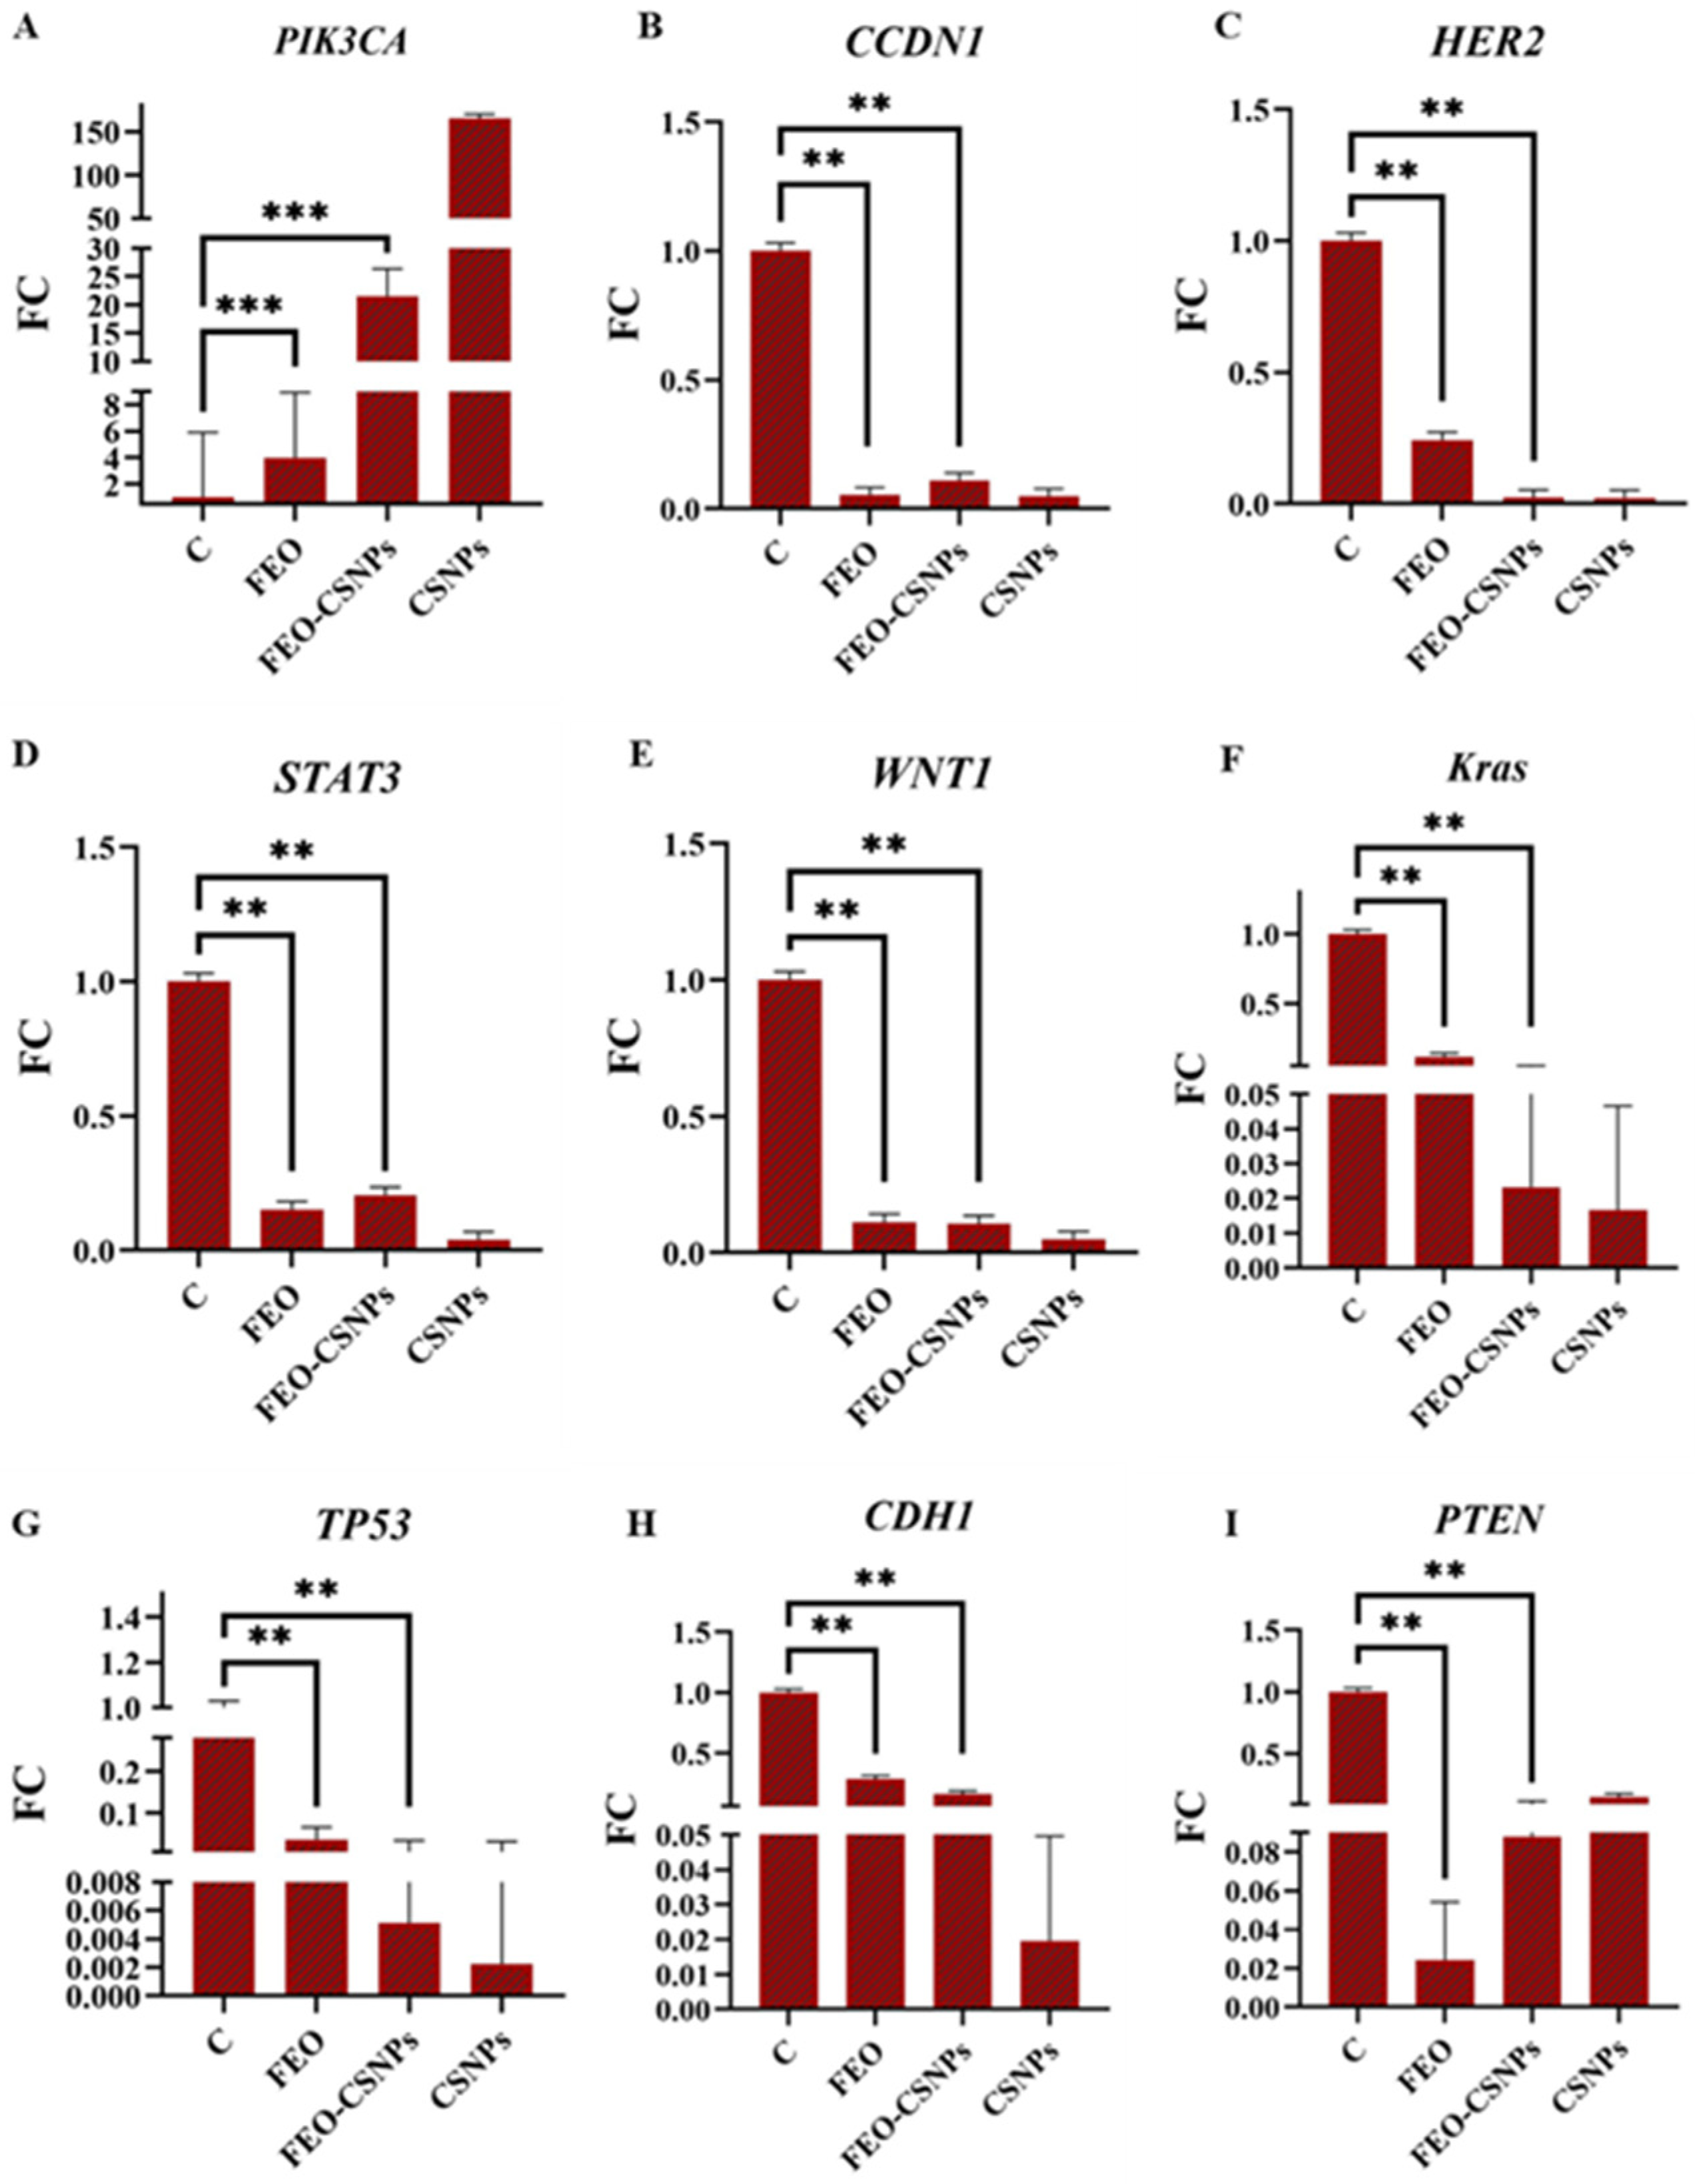
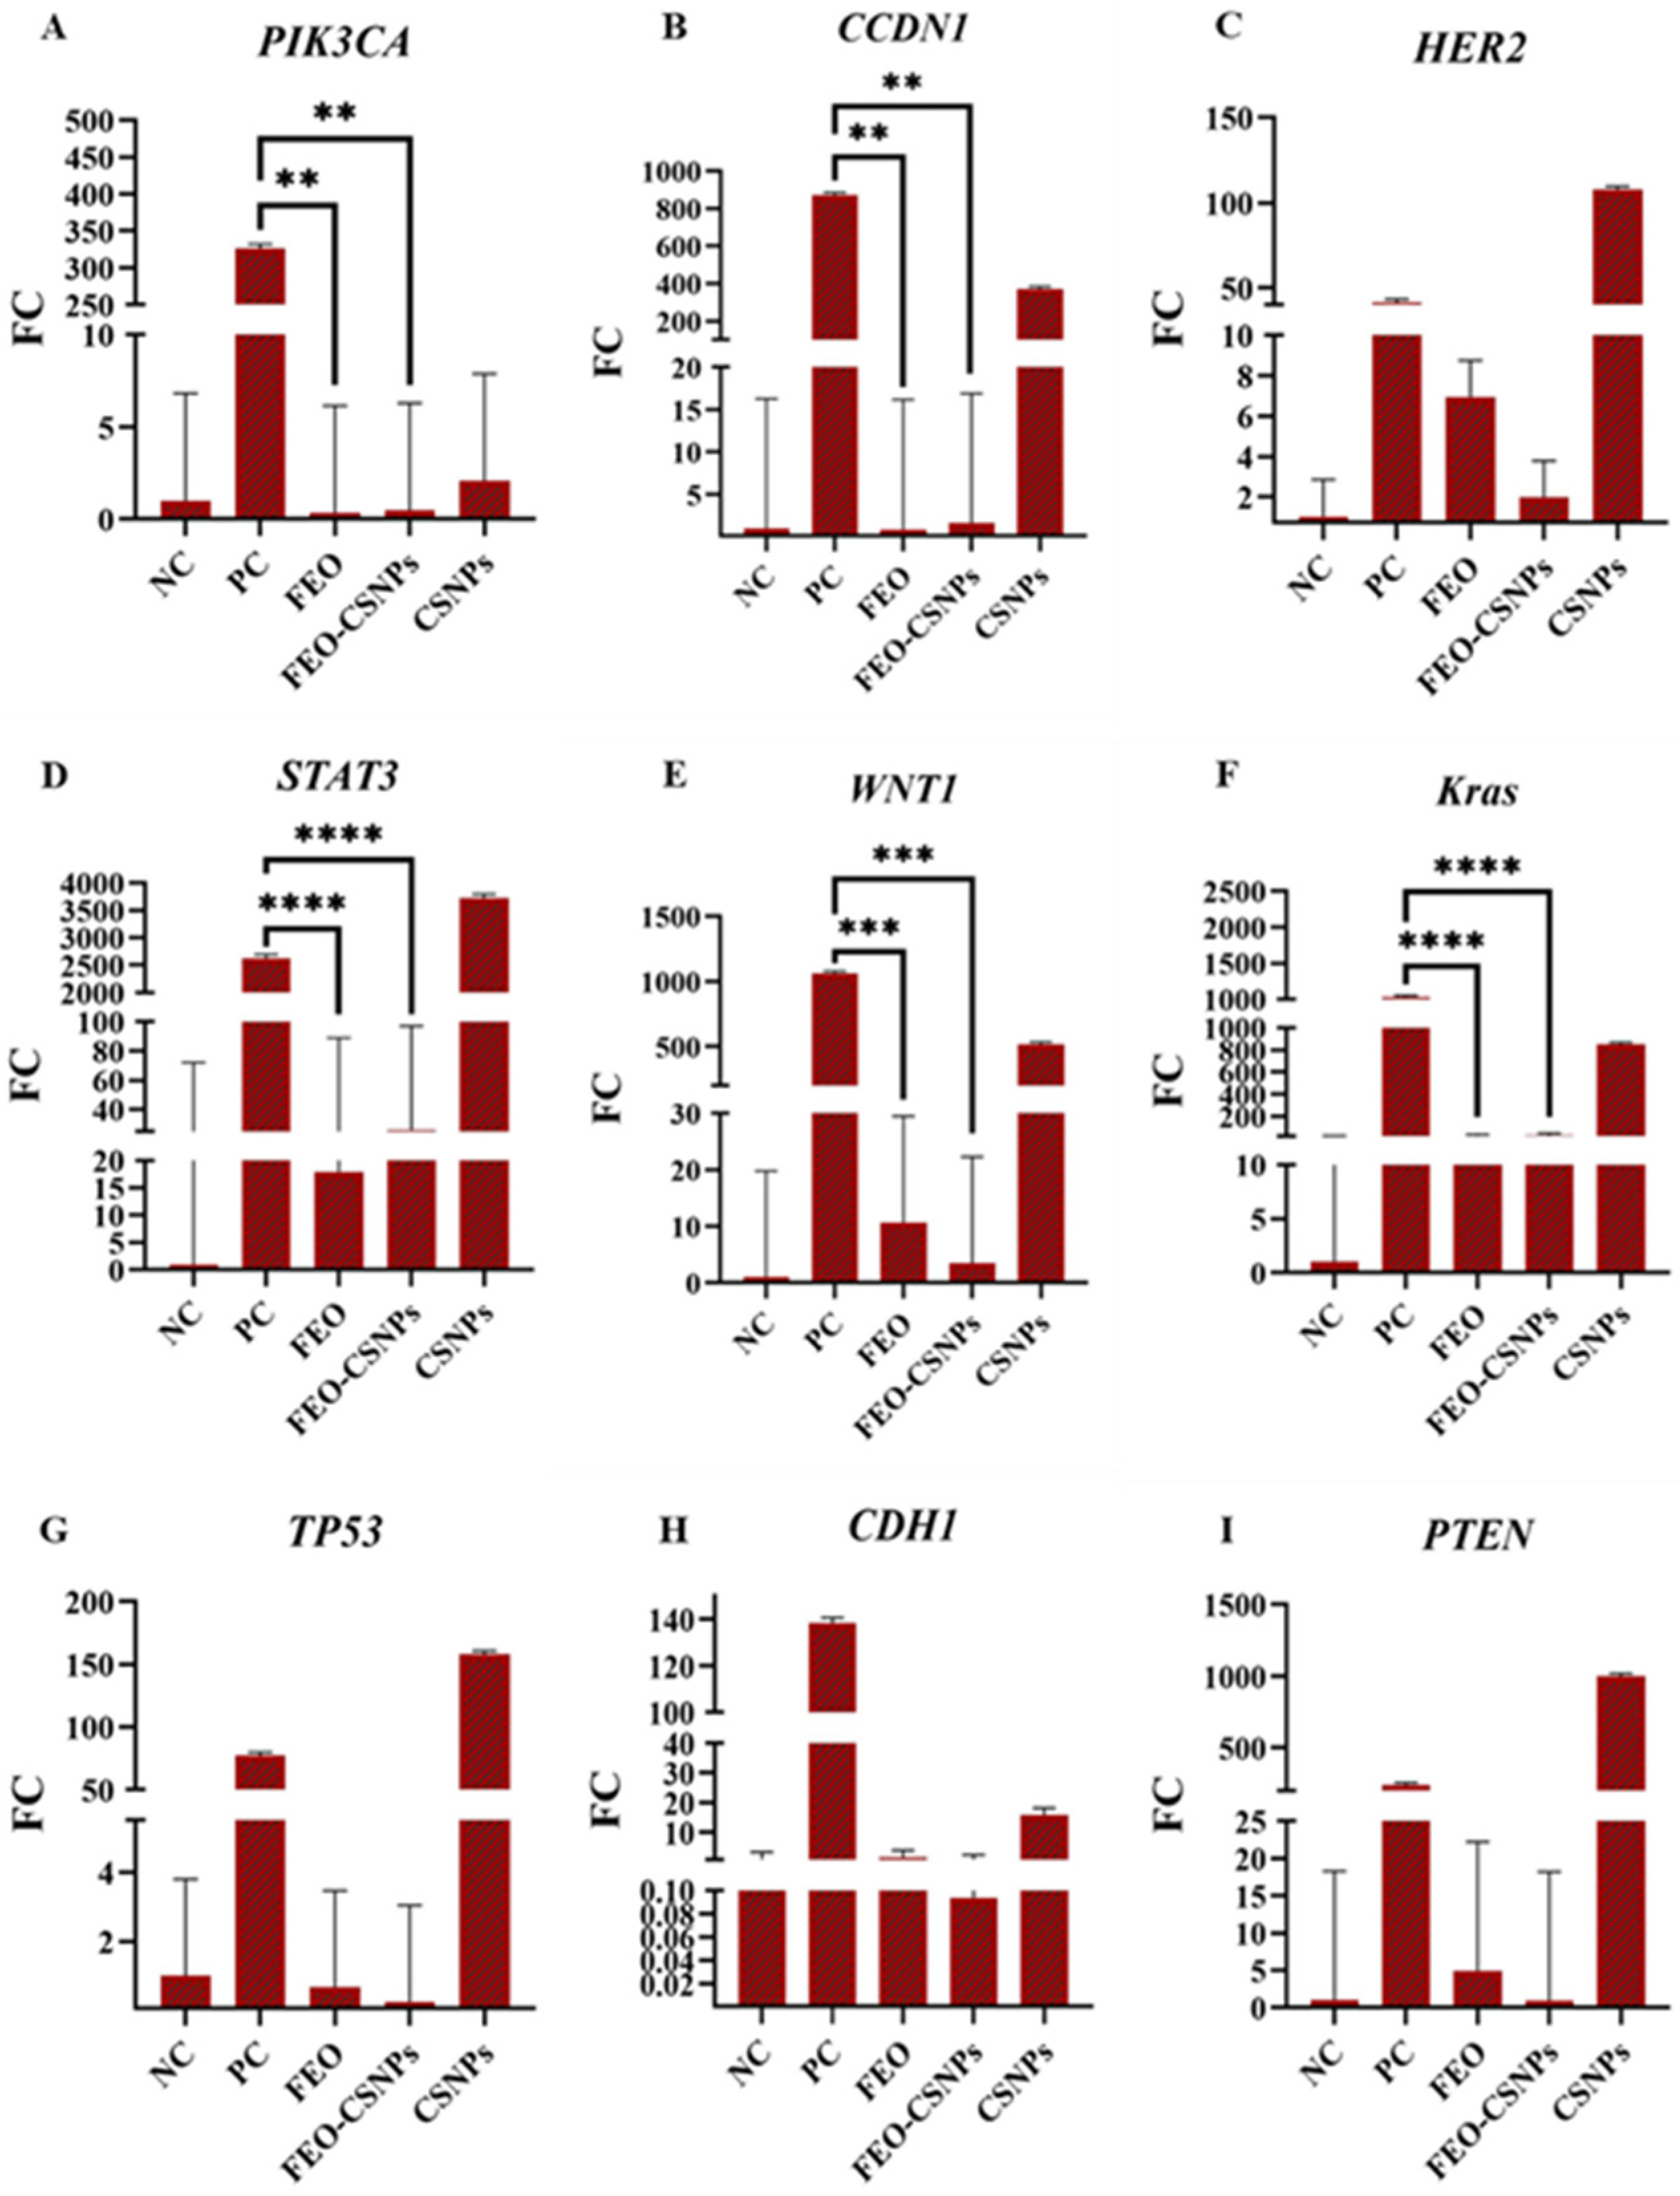
3.8. Gene Expression Analysis
4. Discussion
5. Conclusions
Supplementary Materials
Author Contributions
Funding
Institutional Review Board Statement
Informed Consent Statement
Data Availability Statement
Conflicts of Interest
Abbreviations
References
- Siegel, R.L.; Giaquinto, A.N.; Jemal, A. Cancer statistics, 2024. CA Cancer J. Clin. 2024, 74, 12–49. [Google Scholar] [PubMed]
- Dvir, K.; Giordano, S.; Leone, J.P. Immunotherapy in Breast Cancer. Int. J. Mol. Sci. 2024, 25, 7517. [Google Scholar] [CrossRef] [PubMed]
- Ibrahim, A.S.; Khaled, H.M.; Mikhail, N.N.; Baraka, H.; Kamel, H. Cancer incidence in Egypt: Results of the national population-based cancer registry program. J. Cancer Epidemiol. 2014, 2014, 437971. [Google Scholar] [PubMed]
- Alorabi, M.; Elghazawy, H. Cancer Control in Egypt: Investing in Health; The ASCO Post: Huntington, NY, USA, 2021. [Google Scholar]
- Noel, B.; Singh, S.K.; Lillard, J.W., Jr.; Singh, R. Role of natural compounds in preventing and treating breast cancer. Front Biosci Sch. Ed. 2020, 12, 137–160. [Google Scholar]
- Burguin, A.; Diorio, C.; Durocher, F. Breast Cancer Treatments: Updates and New Challenges. J. Pers. Med. 2021, 11, 808. [Google Scholar] [CrossRef]
- Ezekiel, J.; Tadzabia, K.; Gambo, N. Phytochemicals, Antioxidant Assay and Cytotoxicity of the Methanolic Leaf Extract of African Frankincense Tree, Boswellia Dalzielii. Trends Sci. Technol. J. 2020, 5, 300–303. [Google Scholar]
- Di Stefano, V.; Schillaci, D.; Cusimano, M.G.; Rishan, M.; Rashan, L. In Vitro Antimicrobial Activity of Frankincense Oils from Boswellia sacra Grown in Different Locations of the Dhofar Region (Oman). Antibiotics 2020, 9, 195. [Google Scholar] [CrossRef]
- Khajehdehi, M.; Khalaj-Kondori, M.; Baradaran, B. Molecular evidences on anti-inflammatory, anticancer, and memory-boosting effects of frankincense. Phytother. Res. 2022, 36, 1194–1215. [Google Scholar] [CrossRef]
- Swamy, M.K.; Pullaiah, T.; Dey, A. Frankincense (Olibanum): An Aromatic Resin with Economic Importance. In Frankincense–Gum Olibanum; Apple Academic Press: Palm Bay, FL, USA, 2023; pp. 1–10. [Google Scholar]
- Al-Harrasi, A.; Khan, A.L.; Asaf, S.; Al-Rawahi, A. Biology of Genus Boswellia; Springer: Berlin/Heidelberg, Germany, 2019. [Google Scholar]
- Shakir Abed Almjalawi, B.; Alhamed, T.A.; Alhesnawi, A.S.M. Antibacterial Activity of Boswellia carterii Aqueous Extract and Its Effect on Phagocytosis in vitro. Arch. Razi Inst. 2022, 77, 545–552. [Google Scholar]
- Gnedy, M.M.A.; Hussien, R.A.A.; Sleem, R.A.; Elkelish, A.; AlHarbi, M.; Alharbi, B.M.; Sayed, A.A.S. In vitro efficacy of Boswellia carterii resin extracts formulated as an emulsifiable concentrate against Tetranychus urticae and phytopathogenic fungi. Saudi J. Biol. Sci. 2023, 30, 103843. [Google Scholar]
- Efferth, T.; Oesch, F. Anti-inflammatory and anti-cancer activities of frankincense: Targets, treatments and toxicities. Semin. Cancer Biol. 2022, 80, 39–57. [Google Scholar] [PubMed]
- Parsonidis, P.; Vlachou, I.; Mamagkaki, A.; Bouris, I.; Daikopoulou, V.; Papasotiriou, I. Cytotoxic effect of Boswellia sacra on human cancer cell lines. J. Cancer Sci. Ther. 2021, 13, 1–6. [Google Scholar]
- Hakkim, F.L.; Bakshi, H.A.; Khan, S.; Nasef, M.; Farzand, R.; Sam, S.; Rashan, L.; Al-Baloshi, M.S.; Abdo Hasson, S.S.A.; Jabri, A.A.; et al. Frankincense essential oil suppresses melanoma cancer through down regulation of Bcl-2/Bax cascade signaling and ameliorates heptotoxicity via phase I and II drug metabolizing enzymes. Oncotarget 2019, 10, 3472–3490. [Google Scholar]
- Jiang, X.; Liu, Y.; Zhang, G.; Lin, S.; Yuan, N.; Wu, J.; Yan, X.; Ma, Y.; Ma, M. Acetyl-11-keto-β-boswellic Acid Inhibits Precancerous Breast Lesion MCF-10AT Cells via Regulation of LINC00707/miR-206 that Reduces Estrogen Receptor-α. Cancer Manag. Res. 2020, 12, 2301–2314. [Google Scholar] [PubMed]
- Valente, I.V.B.; Garcia, D.; Abbott, A.; Spruill, L.; Siegel, J.; Forcucci, J.; Hanna, G.; Mukherjee, R.; Hamann, M.; Hilliard, E.; et al. The anti-proliferative effects of a frankincense extract in a window of opportunity phase ia clinical trial for patients with breast cancer. Breast Cancer Res. Treat. 2024, 204, 521–530. [Google Scholar]
- El-Dek, S.I.; Hassan, M.I.; Mohamed, A.F.; Abdel Wahab, A.W.K. Apoptotic and necrotic effects of chitosan nanoparticles loaded with the honeybee, Apis mellifera venom on different cancer cell lines. J. Egypt. Soc. Parasitol. 2019, 49, 115–122. [Google Scholar]
- Gu, X.; Cao, R.; Li, Y.; Liu, S.; Wang, Z.; Feng, S.; Li, F.; Lyu, S. Three-component antibacterial membrane of poly (butylene carbonate), poly (lactic acid) and chitosan prepared by electrospinning. Mater. Technol. 2019, 34, 463–470. [Google Scholar]
- Xia, W.; Tao, Z.; Zhu, B.; Zhang, W.; Liu, C.; Chen, S.; Song, M. Targeted Delivery of Drugs and Genes Using Polymer Nanocarriers for Cancer Therapy. Int. J. Mol. Sci. 2021, 22, 9118. [Google Scholar] [CrossRef]
- Wei, Q.Y.; Xu, Y.M.; Lau, A.T.Y. Recent Progress of Nanocarrier-Based Therapy for Solid Malignancies. Cancers 2020, 12, 2783. [Google Scholar] [CrossRef]
- Fang, J.; Islam, W.; Maeda, H. Exploiting the dynamics of the EPR effect and strategies to improve the therapeutic effects of nanomedicines by using EPR effect enhancers. Adv. Drug Deliv. Rev. 2020, 157, 142–160. [Google Scholar]
- Fasolino, I.; Raucci, M.G.; Soriente, A.; Demitri, C.; Madaghiele, M.; Sannino, A.; Ambrosio, L. Osteoinductive and anti-inflammatory properties of chitosan-based scaffolds for bone regeneration. Mater. Sci. Eng. C Mater. Biol. Appl. 2019, 105, 110046. [Google Scholar] [CrossRef] [PubMed]
- Avelelas, F.; Horta, A.; Pinto, L.F.V.; Cotrim Marques, S.; Marques Nunes, P.; Pedrosa, R.; Leandro, S.M. Antifungal and Antioxidant Properties of Chitosan Polymers Obtained from Nontraditional Polybius henslowii Sources. Mar. Drugs 2019, 17, 239. [Google Scholar] [CrossRef]
- Alqahtani, F.; Aleanizy, F.; El Tahir, E.; Alhabib, H.; Alsaif, R.; Shazly, G.; AlQahtani, H.; Alsarra, I.; Mahdavi, J. Antibacterial Activity of Chitosan Nanoparticles Against Pathogenic N. gonorrhoea. Int. J. Nanomed. 2020, 15, 7877–7887. [Google Scholar] [CrossRef]
- Nandgude, T.; Pagar, R. Plausible role of chitosan in drug and gene delivery against resistant breast cancer cells. Carbohydr. Res. 2021, 506, 108357. [Google Scholar] [CrossRef]
- Amin, M.K.; Boateng, J.S. Comparison and process optimization of PLGA, chitosan and silica nanoparticles for potential oral vaccine delivery. Ther. Deliv. 2019, 10, 493–514. [Google Scholar] [CrossRef]
- Mitchell, M.J.; Billingsley, M.M.; Haley, R.M.; Wechsler, M.E.; Peppas, N.A.; Langer, R. Engineering precision nanoparticles for drug delivery. Nat. Rev. Drug Discov. 2021, 20, 101–124. [Google Scholar] [PubMed]
- Moraru, C.; Mincea, M.; Menghiu, G.; Ostafe, V. Understanding the Factors Influencing Chitosan-Based Nanoparticles-Protein Corona Interaction and Drug Delivery Applications. Molecules 2020, 25, 4758. [Google Scholar] [CrossRef] [PubMed]
- Salehi, F.; Jamali, T.; Kavoosi, G.; Ardestani, S.K.; Vahdati, S.N. Stabilization of Zataria essential oil with pectin-based nanoemulsion for enhanced cytotoxicity in monolayer and spheroid drug-resistant breast cancer cell cultures and deciphering its binding mode with gDNA. Int. J. Biol. Macromol. 2020, 164, 3645–3655. [Google Scholar] [CrossRef]
- Calvo, P.; Remunan-Lopez, C.; Vila-Jato, J.L.; Alonso, M. Novel hydrophilic chitosan-polyethylene oxide nanoparticles as protein carriers. J. Appl. Polym. Sci. 1997, 63, 125–132. [Google Scholar] [CrossRef]
- Agnihotri, S.A.; Mallikarjuna, N.N.; Aminabhavi, T.M. Recent advances on chitosan-based micro- and nanoparticles in drug delivery. J. Control Release 2004, 100, 5–28. [Google Scholar] [CrossRef]
- Al-Balushi, R.A.; Haque, A.; Saeed, M.; Al-Harthy, T.; Al-Hinaai, M.; Al-Hashmi, S. Unlocking the Anticancer Potential of Frankincense Essential Oils (FEOs) Through Nanotechnology: A Review. Mol. Biotechnol. 2023, 66, 3013–3024. [Google Scholar] [PubMed]
- Kumari, G.D.; Raksha, G.; Deepak, K.; Anjana, G.; Mary, C.S. A Review on Chitosan Nanoparticle as a Drug delivery system. Asian J. Pharm. Res. 2020, 10, 299–306. [Google Scholar]
- Camarda, L.; Dayton, T.; Di Stefano, V.; Pitonzo, R.; Schillaci, D. Chemical Composition and Antimicrobial Activity of Some Oleogum Resin Essential Oils from Boswellia SPP. (Burseraceae). Ann. Di Chim. 2007, 97, 837–844. [Google Scholar]
- Ayub, M.A.; Ijaz, M.; Hanif, M.A.; Hussain, A.; Bahadur, A. Fractionation of Boswellia serrata oleogum resin essential oil by short-path molecular vacuum distillation: Unveiling potent biological activities and chemical composition. J. Food Sci. 2024, 89, 7274–7293. [Google Scholar] [PubMed]
- Moses, S.; Edwards, V.; Brantley, E. Cytotoxicity in MCF-7 and MDA-MB-231 breast cancer cells, without harming MCF-10A healthy cells. J. Nanomed. Nanotechnol. 2016, 7, 1000369. [Google Scholar]
- Frank, M.B.; Yang, Q.; Osban, J.; Azzarello, J.T.; Saban, M.R.; Saban, R.; Ashley, R.A.; Welter, J.C.; Fung, K.M.; Lin, H.K. Frankincense oil derived from Boswellia carteri induces tumor cell specific cytotoxicity. BMC Complement. Altern. Med. 2009, 9, 6. [Google Scholar]
- Fyala, A.S.; Sultan, A.S. Frankincense essential oil and doxorubicin treatment inhibited cell proliferation and induced apoptosis in CD133+ and CD90+ subpopulation hepatocellular carcinoma cancer stem cells. Cancer Res. 2018, 78, 159. [Google Scholar]
- Azzazy, H.M.E.; Abdelnaser, A.; Al Mulla, H.; Sawy, A.M.; Shamma, S.N.; Elhusseiny, M.; Alwahibi, S.; Mahdy, N.K.; Fahmy, S.A. Essential Oils Extracted from Boswellia sacra Oleo Gum Resin Loaded into PLGA-PCL Nanoparticles: Enhanced Cytotoxic and Apoptotic Effects against Breast Cancer Cells. ACS Omega 2023, 8, 1017–1025. [Google Scholar]
- Alipanah, H.; Zareian, P. Anti-cancer properties of the methanol extract of Boswellia serrata gum resin: Cell proliferation arrest and inhibition of angiogenesis and metastasis in BALB/c mice breast cancer model. Physiol. Pharmacol. 2018, 22, 183–194. [Google Scholar]
- Alahmari, A.S.; El-Mekkawy, H.I.; Al-Doaiss, A.A.; Alduwish, M.A. Effect of Natural Commiphora myrrha Extract against Hepatotoxicity Induced by Alcohol Intake in Rat Model. Toxics 2022, 10, 729. [Google Scholar] [CrossRef]
- Yousef, J.M. Identifying frankincense impact by biochemical analysis and histological examination on rats. Saudi J. Biol. Sci. 2011, 18, 189–194. [Google Scholar] [CrossRef] [PubMed]
- Elmoslemany, A.M.; Elzallat, M.; Abd-Elfatah, M.H.; Mohammed, D.M.; Abd Elhady, E.E. Possible therapeutic effect of frankincense (Gum olibanum) and myrrh (Commiphora myrrha) resins extracts on DEN/CCL4 induced hepatocellular carcinoma in rats. Phytomed. Plus 2024, 4, 100517. [Google Scholar]
- Marefati, N.; Beheshti, F.; Memarpour, S.; Bayat, R.; Naser Shafei, M.; Sadeghnia, H.R.; Ghazavi, H.; Hosseini, M. The effects of acetyl-11-keto-β-boswellic acid on brain cytokines and memory impairment induced by lipopolysaccharide in rats. Cytokine 2020, 131, 155107. [Google Scholar] [CrossRef]
- Pappou, E.P.; Ahuja, N. The role of oncogenes in gastrointestinal cancer. Gastrointest. Cancer Res. 2010, S2–S15. [Google Scholar]
- Avalle, L.; Pensa, S.; Regis, G.; Novelli, F.; Poli, V. STAT1 and STAT3 in tumorigenesis: A matter of balance. Jakstat 2012, 1, 65–72. [Google Scholar] [PubMed]
- Hsu, J.L.; Hung, M.C. The role of HER2, EGFR, and other receptor tyrosine kinases in breast cancer. Cancer Metastasis Rev. 2016, 35, 575–588. [Google Scholar]
- Lei, Z.N.; Teng, Q.X.; Tian, Q.; Chen, W.; Xie, Y.; Wu, K.; Zeng, Q.; Zeng, L.; Pan, Y.; Chen, Z.S.; et al. Signaling pathways and therapeutic interventions in gastric cancer. Signal Transduct. Target. Ther. 2022, 7, 358. [Google Scholar]
- Sun, M.X.; He, X.P.; Huang, P.Y.; Qi, Q.; Sun, W.H.; Liu, G.S.; Hua, J. Acetyl-11-keto-β-boswellic acid inhibits proliferation and induces apoptosis of gastric cancer cells through the phosphatase and tensin homolog/Akt/cyclooxygenase-2 signaling pathway. World J. Gastroenterol. 2020, 26, 5822–5835. [Google Scholar]
- Yu, M.; Qin, K.; Fan, J.; Zhao, G.; Zhao, P.; Zeng, W.; Chen, C.; Wang, A.; Wang, Y.; Zhong, J.; et al. The evolving roles of Wnt signaling in stem cell proliferation and differentiation, the development of human diseases, and therapeutic opportunities. Genes. Dis. 2024, 11, 101026. [Google Scholar]
- Qurishi, Y.; Hamid, A.; Sharma, P.R.; Wani, Z.A.; Mondhe, D.M.; Singh, S.K.; Zargar, M.A.; Andotra, S.S.; Shah, B.A.; Taneja, S.C.; et al. PARP cleavage and perturbance in mitochondrial membrane potential by 3-α-propionyloxy-β-boswellic acid results in cancer cell death and tumor regression in murine models. Future Oncol. 2012, 8, 867–881. [Google Scholar]
- Sutherland, R.L.; Musgrove, E.A. Cyclin D1 and mammary carcinoma: New insights from transgenic mouse models. Breast Cancer Res. 2002, 4, 14–17. [Google Scholar]
- Syrovets, T.; Gschwend, J.E.; Büchele, B.; Laumonnier, Y.; Zugmaier, W.; Genze, F.; Simmet, T. Inhibition of IkappaB kinase activity by acetyl-boswellic acids promotes apoptosis in androgen-independent PC-3 prostate cancer cells in vitro and in vivo. J. Biol. Chem. 2005, 280, 6170–6180. [Google Scholar] [PubMed]
- Krishnamurti, U.; Silverman, J.F. HER2 in breast cancer: A review and update. Adv. Anat. Pathol. 2014, 21, 100–107. [Google Scholar]
- Ma, J.H.; Qin, L.; Li, X. Role of STAT3 signaling pathway in breast cancer. Cell Commun. Signal 2020, 18, 33. [Google Scholar] [PubMed]
- Thalappil, M.A.; Butturini, E.; Carcereri de Prati, A.; Bettin, I.; Antonini, L.; Sapienza, F.U.; Garzoli, S.; Ragno, R.; Mariotto, S. Pinus mugo Essential Oil Impairs STAT3 Activation through Oxidative Stress and Induces Apoptosis in Prostate Cancer Cells. Molecules 2022, 27, 4834. [Google Scholar] [CrossRef] [PubMed]
- Schlange, T.; Matsuda, Y.; Lienhard, S.; Huber, A.; Hynes, N.E. Autocrine WNT signaling contributes to breast cancer cell proliferation via the canonical WNT pathway and EGFR transactivation. Breast Cancer Res. 2007, 9, R63. [Google Scholar]
- Nakashima, T.; Liu, D.; Nakano, J.; Ishikawa, S.; Yokomise, H.; Ueno, M.; Kadota, K.; Huang, C.L. Wnt1 overexpression associated with tumor proliferation and a poor prognosis in non-small cell lung cancer patients. Oncol. Rep. 2008, 19, 203–209. [Google Scholar]
- Liu, H.P.; Gao, Z.H.; Cui, S.X.; Wang, Y.; Li, B.Y.; Lou, H.X.; Qu, X.J. Chemoprevention of intestinal adenomatous polyposis by acetyl-11-keto-beta-boswellic acid in APC (Min/+) mice. Int. J. Cancer 2013, 132, 2667–2681. [Google Scholar]
- Ahmed, H.H.; Abdel-Rahman, M.; Salem, F.; Shalby, A.B.; Lokman, M.S. Antitumor efficacy of Boswellia serrata extract in management of colon cancer induced in experimental animal. Int. J. Pharm. Pharm. Sci. 2013, 5, 379–389. [Google Scholar]
- Abd-Rabou, A.A.; Edris, A.E. Frankincense essential oil nanoemulsion specifically induces lung cancer apoptosis and inhibits survival pathways. Cancer Nanotechnol. 2022, 13, 22. [Google Scholar]
- Takahashi, M.; Sung, B.; Shen, Y.; Hur, K.; Link, A.; Boland, C.R.; Aggarwal, B.B.; Goel, A. Boswellic acid exerts antitumor effects in colorectal cancer cells by modulating expression of the let-7 and miR-200 microRNA family. Carcinogenesis 2012, 33, 2441–2449. [Google Scholar] [PubMed]
- Shen, Y.; Takahashi, M.; Byun, H.-M.; Link, A.; Sharma, N.; Balaguer, F.; Leung, H.-C.; Boland, C.R.; Goel, A. Boswellic acid induces epigenetic alterations by modulating DNA methylation in colorectal cancer cells. Cancer Biol. Ther. 2012, 13, 542–552. [Google Scholar] [PubMed]


| Gene Name | Forward | Reverse |
|---|---|---|
| GAPDH | TAGGCGCTCACTGTTCTCTC | GCCCAATACGACCAAATCCG |
| PIK3CA | ACCCGATGCGGTTAGAGC | TGATGGTCGTGGAGGCATTG |
| CCND1 | GACCCCGCACGATTTCATTG | TGGAGGGCGGATTGGAAATG |
| HER2 | AGTGAGCAAGTGATGTCCTGA | ACCCCCATACTTGTCCCTTGA |
| STAT3 | GGAAGAATCCAACAACGGCA | TGGCAAGGAGTGGGTATCA |
| WNT1 | CCCCTTTGTCCTGCGTTTTC | CATTTCTGCTGGTTCCCCCA |
| KRAS | AGGGACTAGGGCAGTTTGGA | AATGTCTTGGCACACCACCA |
| TP53 | GAGACCTGTGGGAAGCGAAA | CTGGCATTCTGGGAGCTTCA |
| CDH1 | CTGATGCTGATGCCCCCAA | AGCTGTGAGGATGCCAGTTT |
| PTEN | CTCAGCCGTTACCTGTGTGT | AGGTTTCCTCTGGTCCTGGT |
| Peak No | Retention Time | Compound Name | Molecular Formula | Molecular Weight | RetIndex | Peak Area (%) |
|---|---|---|---|---|---|---|
| 1 | 5.599 | Methanol, (1,4-dihydrophenyl)- | C7H10O | 110 | 988 | 0.14 |
| 2 | 6.638 | Sabinene | C10H16 | 136 | 897 | 1.85 |
| 3 | 6.912 | α-thujene | C10H16 | 136 | 902 | 2.85 |
| 4 | 7.246 | α-pinene | C10H16 | 136 | 948 | 35.81 |
| 5 | 7.535 | Camphene | C10H16 | 136 | 943 | 2.31 |
| 6 | 7.692 | 2,4(10)-Thujadiene | C10H14 | 134 | 879 | 2.95 |
| 7 | 8.075 | 1,3,3,4-Tetramethyl-2-oxabicyclo [2.2.0]hexane | C9H16O | 140 | 892 | 0.08 |
| 8 | 8.328 | β-pinene | C10H16 | 136 | 943 | 2.36 |
| 9 | 8.777 | 4,7-Methano-1H-indene, 2,4,5,6,7,7a-hexahydro- | C10H14 | 134 | 891 | 0.87 |
| 10 | 8.955 | 2-Butanone, 4-cyclopentylidene- | C9H14O | 138 | 1118 | 0.13 |
| 11 | 9.176 | 1,4-Cyclohexadiene, 3-ethenyl-1,2-dimethyl- | C10H14 | 134 | 1013 | 0.53 |
| 12 | 9.373 | Benzene, 1-methoxy-2-methyl- | C8H10O | 122 | 983 | 0.89 |
| 13 | 9.813 | m-Cymene | C10H14 | 134 | 1042 | 5.32 |
| 14 | 9.932 | Limonene | C10H16 | 136 | 1018 | 2.96 |
| 15 | 10.215 | p-Cymene | C10H14 | 134 | 1042 | 0.17 |
| 16 | 10.535 | 2-Cyclohexen-1-ol, 1-methyl-4-(1-methylethenyl)-, trans- | C10H16O | 152 | 1140 | 0.10 |
| 17 | 10.835 | γ-terpinene | C10H16 | 136 | 998 | 0.39 |
| 18 | 11.250 | 3-Cyclohexene-1-methanol, 2-hydroxy-.alpha.,.alpha.,4-trimethyl- | C10H18O2 | 170 | 1331 | 0.42 |
| 19 | 11.595 | (1R)-cis-Verbenol | C10H16O | 152 | 1136 | 0.42 |
| 20 | 11.802 | Benzene, 1-methyl-4-(1-methylethenyl)- | C10H12 | 132 | 1073 | 1.44 |
| 21 | 12.150 | (+)-Nerolidol | C15H26O | 222 | 1564 | 0.67 |
| 22 | 12.331 | 2-Cyclohexen-1-ol, 1-methyl-4-(1-methylethenyl)-, trans- | C10H16O | 152 | 1140 | 0.53 |
| 23 | 12.575 | Fenchol | C10H18O | 154 | 1138 | 1.55 |
| 24 | 12.935 | α-Campholenal | C10H16O | 152 | 1155 | 0.76 |
| 25 | 13.389 | Sabinol | C10H16O | 152 | 1131 | 6.47 |
| 26 | 13.599 | trans-Verbenol | C10H16O | 152 | 1136 | 5.55 |
| 27 | 14.015 | E-pinocamphone | C10H16O | 152 | 1109 | 1.12 |
| 28 | 14.254 | α-Phellandren-8-ol | C10H16O | 152 | 1125 | 2.86 |
| 29 | 14.537 | terpinen-4-ol | C10H18O | 154 | 1137 | 1.38 |
| 30 | 14.854 | p-Cymen-8-ol | C10H14O | 150 | 1197 | 1.65 |
| 31 | 14.984 | α-Terpineol | C10H18O | 154 | 1143 | 1.15 |
| 32 | 15.111 | Myrtenal | C10H14O | 150 | 1136 | 2.74 |
| 33 | 15.567 | Verbenone | C10H14O | 150 | 1119 | 4.74 |
| 34 | 15.829 | trans-Carveol | C10H16O | 152 | 1206 | 1.57 |
| 35 | 16.175 | Carveol | C10H16O | 152 | 1206 | 0.27 |
| 36 | 16.413 | 2-Methyl-7-exo-vinylbicyclo[4.2.0]oct-1(2)-ene | C11H16 | 148 | 1112 | 0.40 |
| 37 | 16.535 | Carvone | C10H14O | 150 | 1190 | 0.34 |
| 38 | 16.755 | Myrtenyl formate | C11H16O2 | 180 | 1312 | 0.45 |
| 39 | 17.190 | 3,5-Dimethoxytoluene | C9H12O2 | 152 | 1172 | 0.50 |
| 40 | 17.435 | 1-Cyclohexene-1-carboxaldehyde, 4-(1-methylethyl)- | C10H16O | 152 | 1175 | 0.08 |
| 41 | 17.726 | Bornyl acetate | C12H20O2 | 196 | 1277 | 1.12 |
| 42 | 17.975 | (+)-cis-Verbenol, acetate | C12H18O2 | 194 | 1276 | 0.13 |
| 43 | 18.135 | Shisool acetate | C12H20O2 | 196 | 1374 | 0.10 |
| 44 | 33.941 | n-Hexadecanoic acid | C16H32O2 | 256 | 1968 | 0.20 |
| 45 | 34.075 | (R,1E,5E,9E)-1,5,9-Trimethyl-12-(prop-1-en-2-yl)cyclotetradeca-1,5,9-triene | C20H32 | 272 | 2121 | 0.31 |
| 46 | 37.398 | Oleic Acid | C18H34O2 | 282 | 2175 | 0.58 |
| 47 | 37.615 | Cycloheptane, 4-methylene-1-methyl-2-(2-methyl-1-propen-1-yl)-1-vinyl- | C15H24 | 204 | 1475 | 0.14 |
| 48 | 37.855 | Incensole isomer | C20H34O2 | 306 | 2303 | 0.68 |
Disclaimer/Publisher’s Note: The statements, opinions and data contained in all publications are solely those of the individual author(s) and contributor(s) and not of MDPI and/or the editor(s). MDPI and/or the editor(s) disclaim responsibility for any injury to people or property resulting from any ideas, methods, instructions or products referred to in the content. |
© 2025 by the authors. Licensee MDPI, Basel, Switzerland. This article is an open access article distributed under the terms and conditions of the Creative Commons Attribution (CC BY) license (https://creativecommons.org/licenses/by/4.0/).
Share and Cite
Mohamed, N.; Ismail, H.; Nasr, G.M.; Abdel-Ghany, S.; Arneth, B.; Sabit, H. Anti-Tumor Potential of Frankincense Essential Oil and Its Nano-Formulation in Breast Cancer: An In Vivo and In Vitro Study. Pharmaceutics 2025, 17, 426. https://doi.org/10.3390/pharmaceutics17040426
Mohamed N, Ismail H, Nasr GM, Abdel-Ghany S, Arneth B, Sabit H. Anti-Tumor Potential of Frankincense Essential Oil and Its Nano-Formulation in Breast Cancer: An In Vivo and In Vitro Study. Pharmaceutics. 2025; 17(4):426. https://doi.org/10.3390/pharmaceutics17040426
Chicago/Turabian StyleMohamed, Nouran, Hisham Ismail, Ghada M. Nasr, Shaimaa Abdel-Ghany, Borros Arneth, and Hussein Sabit. 2025. "Anti-Tumor Potential of Frankincense Essential Oil and Its Nano-Formulation in Breast Cancer: An In Vivo and In Vitro Study" Pharmaceutics 17, no. 4: 426. https://doi.org/10.3390/pharmaceutics17040426
APA StyleMohamed, N., Ismail, H., Nasr, G. M., Abdel-Ghany, S., Arneth, B., & Sabit, H. (2025). Anti-Tumor Potential of Frankincense Essential Oil and Its Nano-Formulation in Breast Cancer: An In Vivo and In Vitro Study. Pharmaceutics, 17(4), 426. https://doi.org/10.3390/pharmaceutics17040426