

Study on Lyophilised Orodispersible Tablets from Plant-Based Drinks as Bulking Agents

 ,
,  , and
, and
Abstract

1. Introduction
2. Materials and Methods
2.1. Materials
2.2. Preliminary Studies of the Milk, Plant-Based Drinks, and Formula
2.2.1. Viscosity
2.2.2. pH
2.2.3. Particle Size Determination
2.2.4. Sensory Valuation with Electronic Tongue
2.3. Formulation of the ODTs
2.3.1. Preparation of ODT
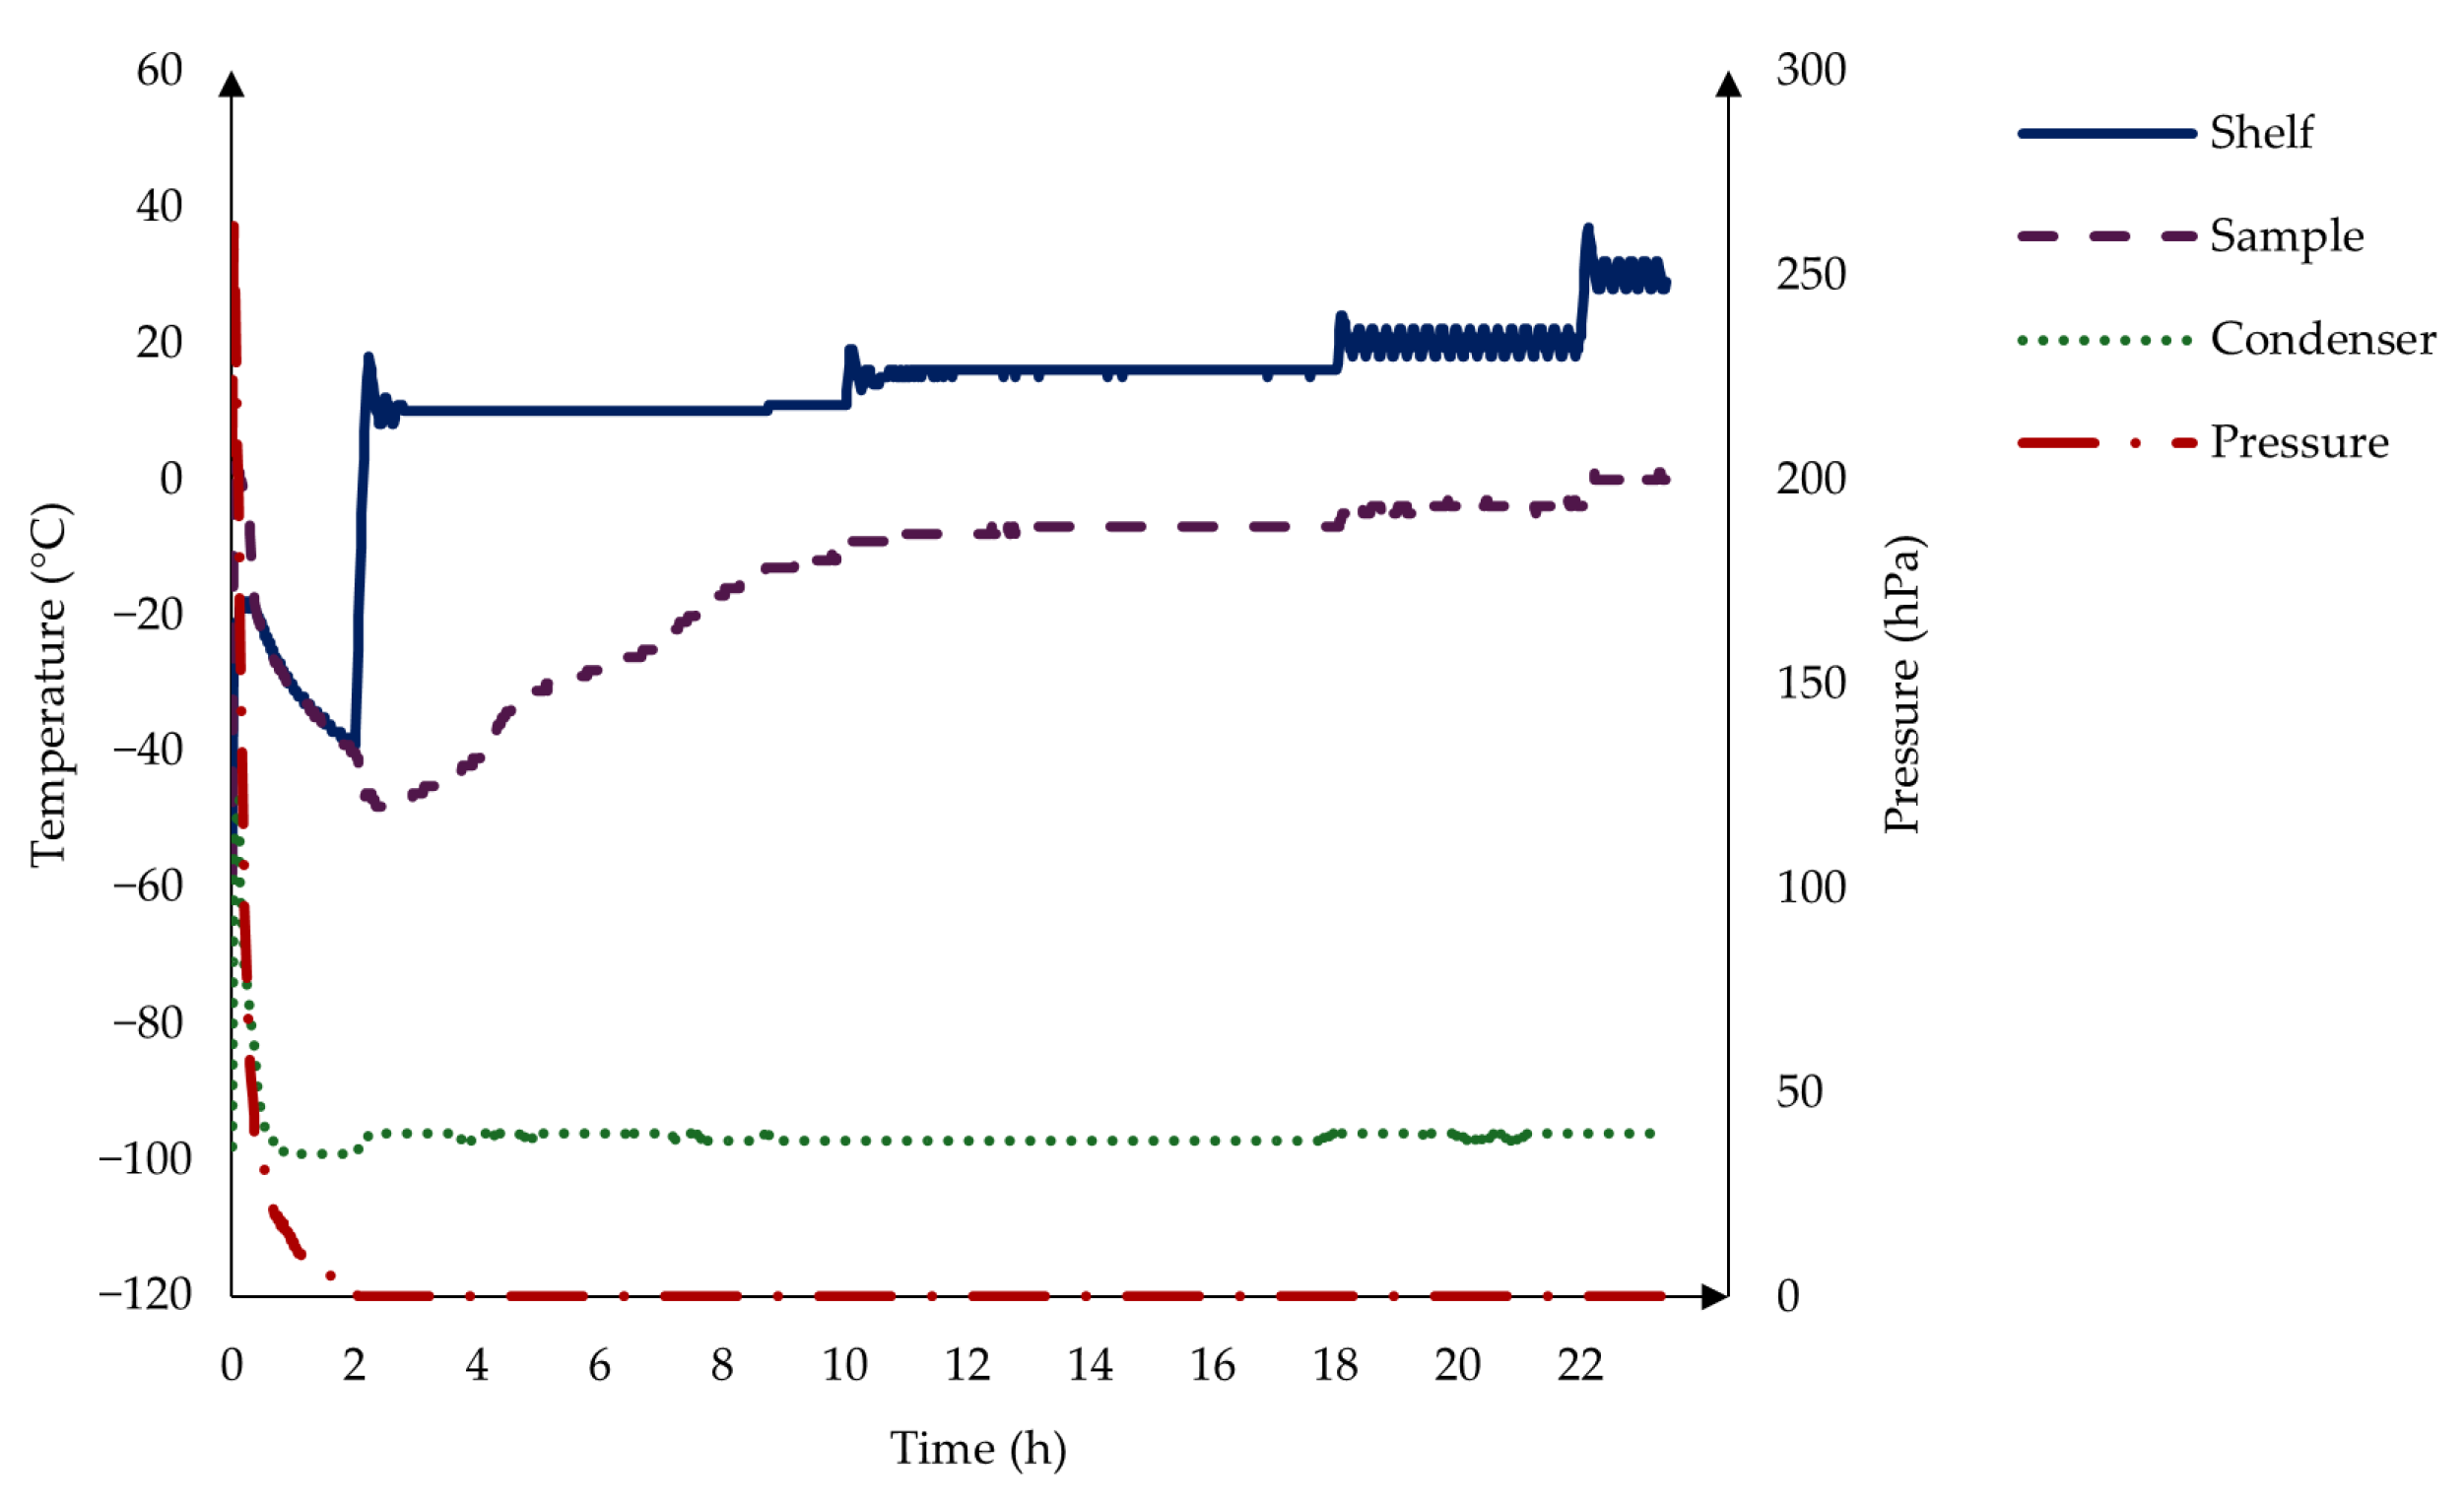
2.3.2. Freeze-Drying
2.4. Characterisation of the ODTs
2.4.1. Uniformity of Mass
2.4.2. Disintegration Time
2.4.3. Residual Water Content of Freeze-Dried ODTs
2.4.4. Study of the Effect of the Environment on the Structure
2.4.5. Uptake of Methylene Blue Water
2.4.6. Determination of API Content with HPLC-DAD
3. Results and Discussion
3.1. Results of the Preliminary Studies of Milk, Plant-Based Drinks, and Formula
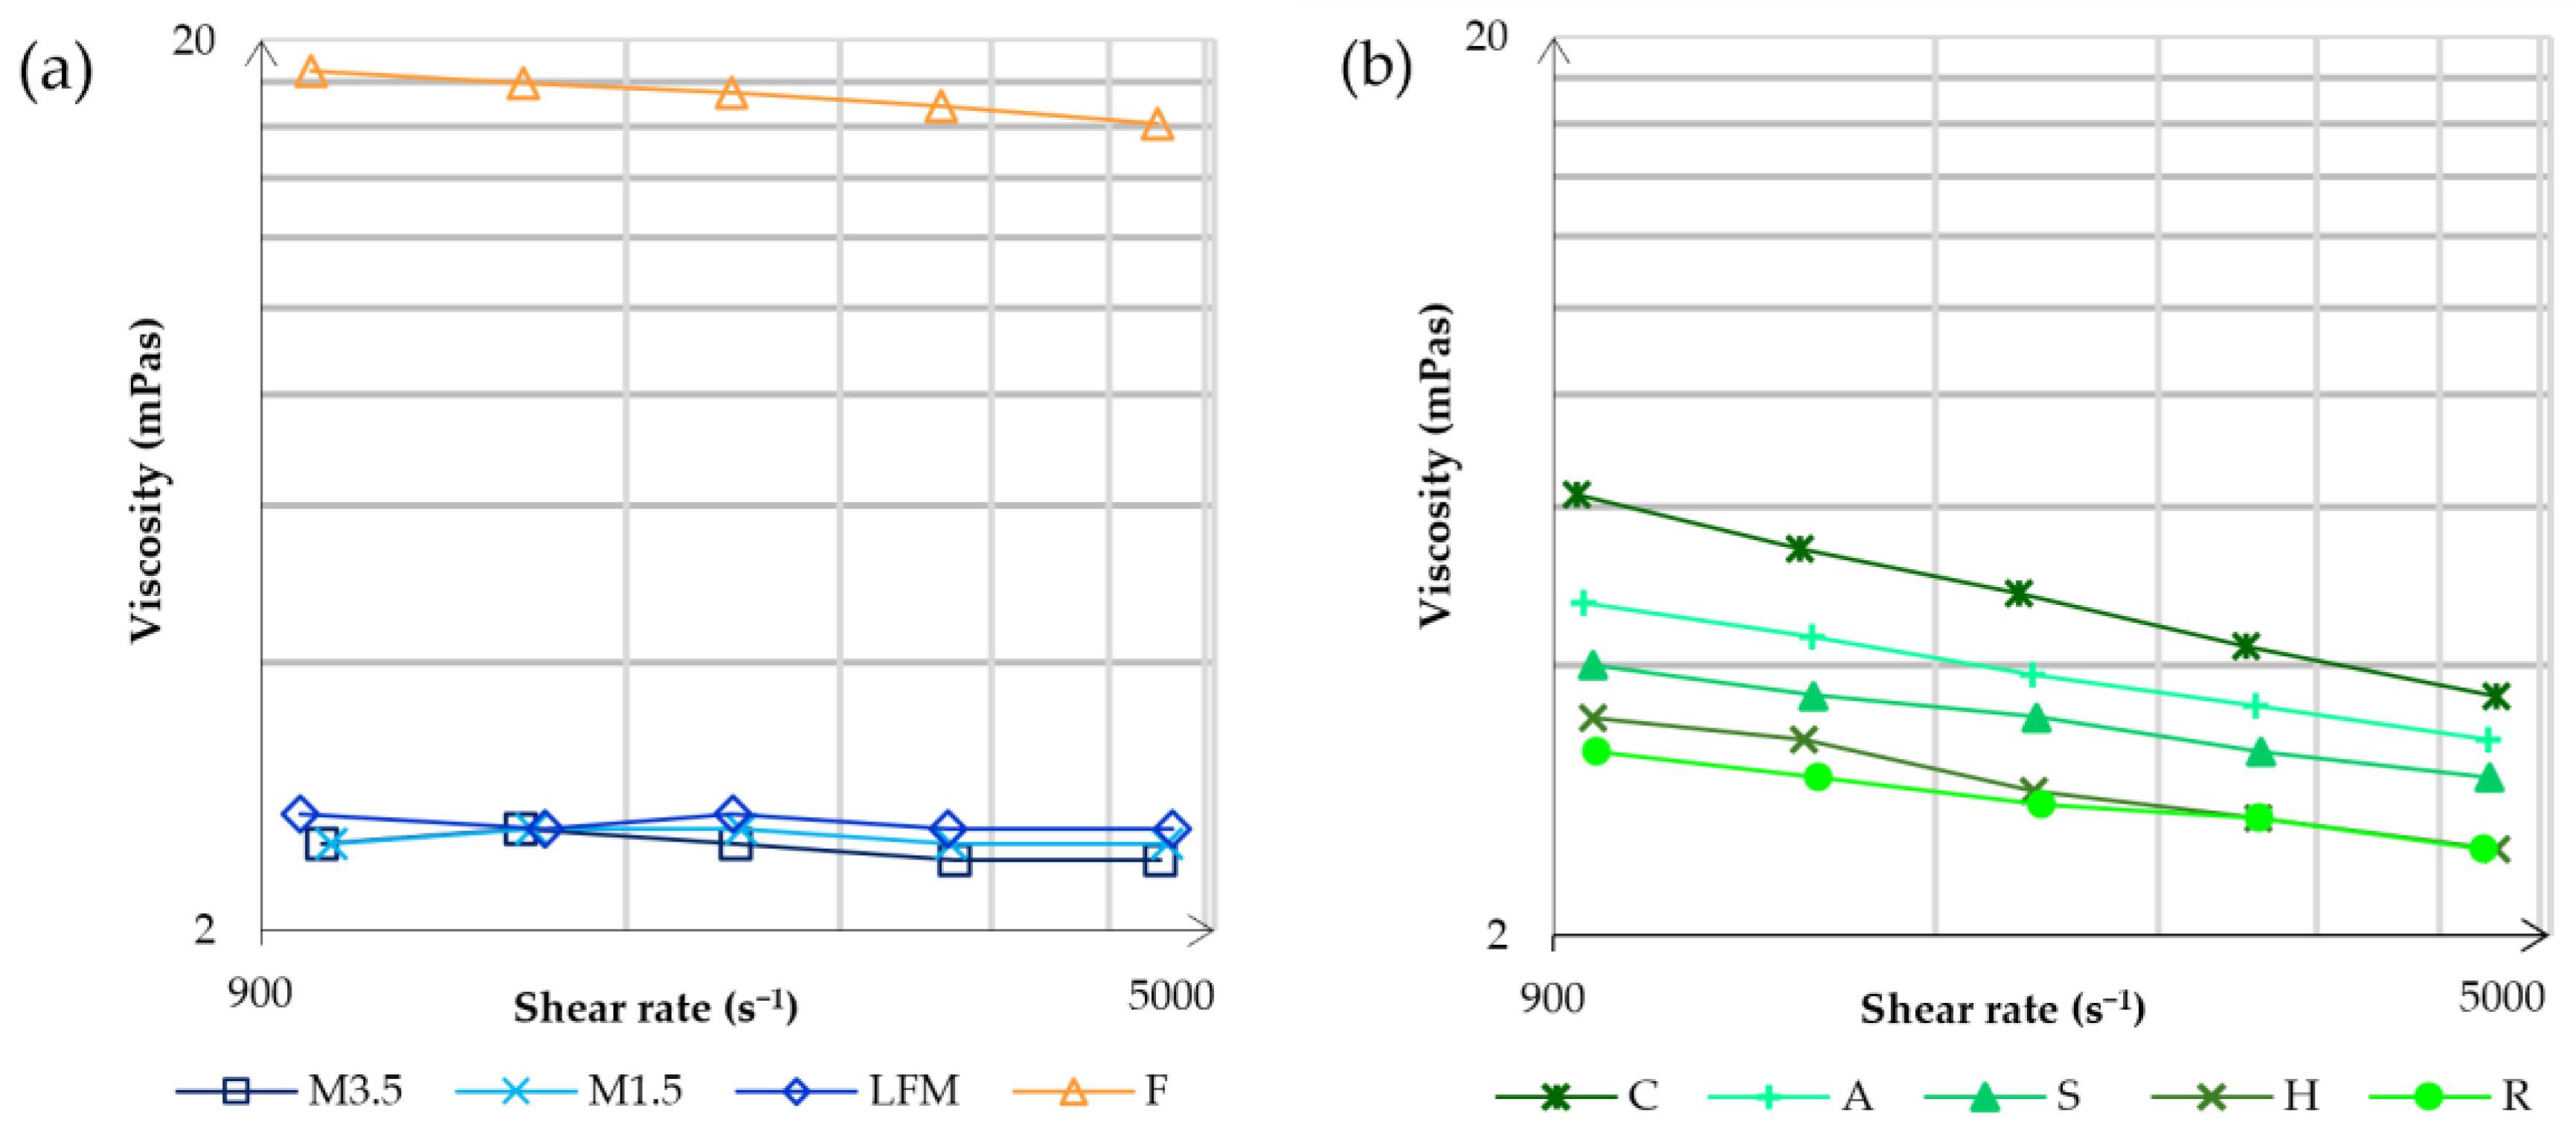
3.2. Viscosity Results
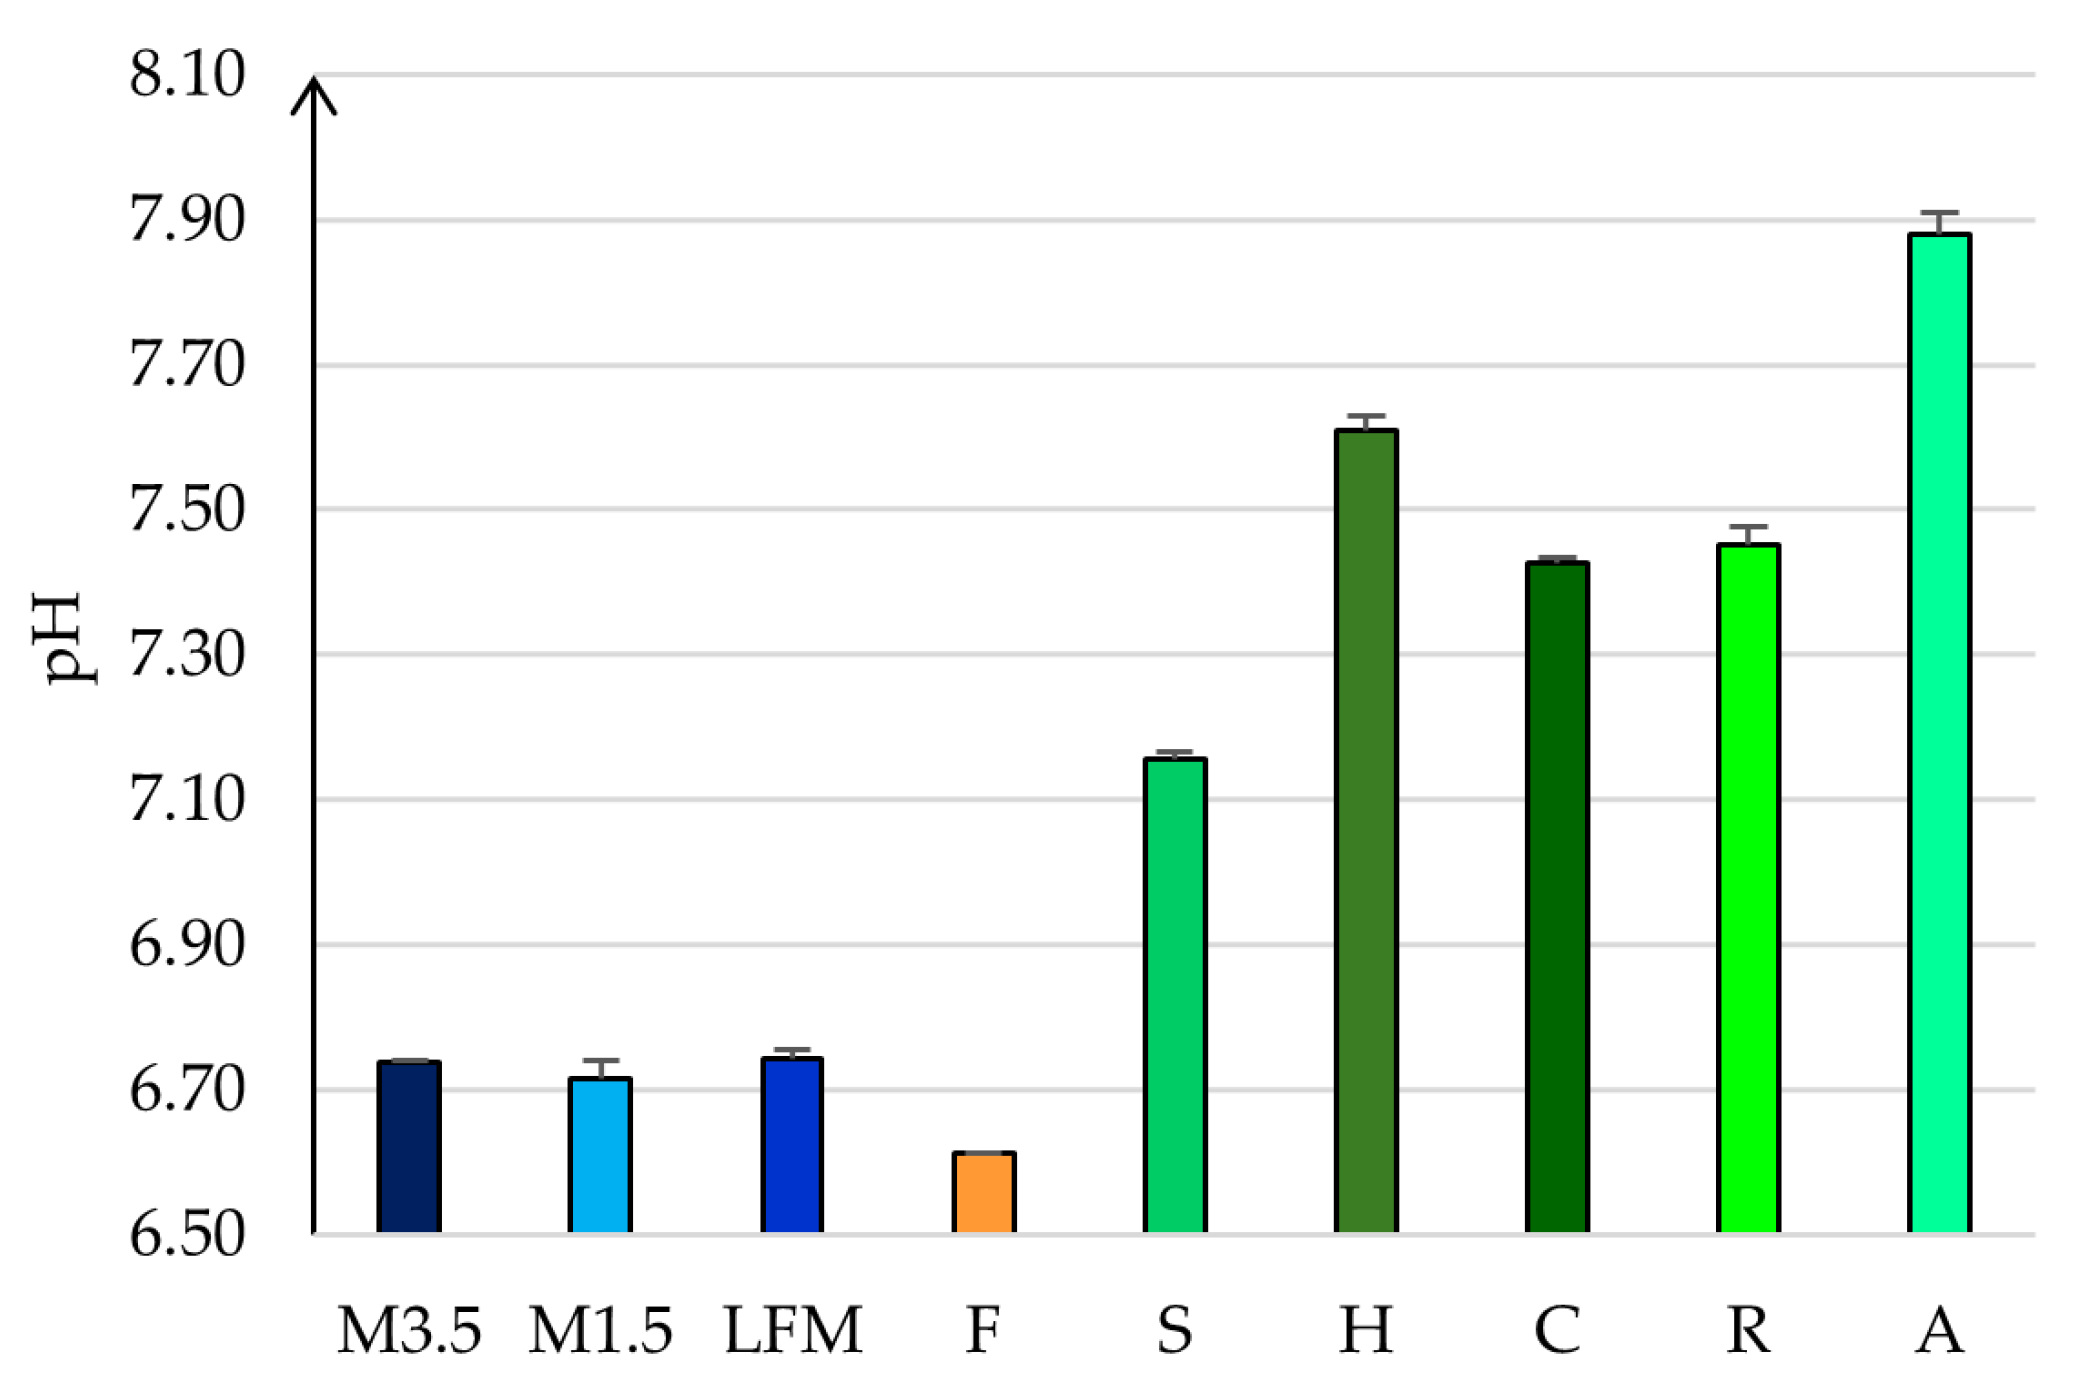
3.3. pH Results
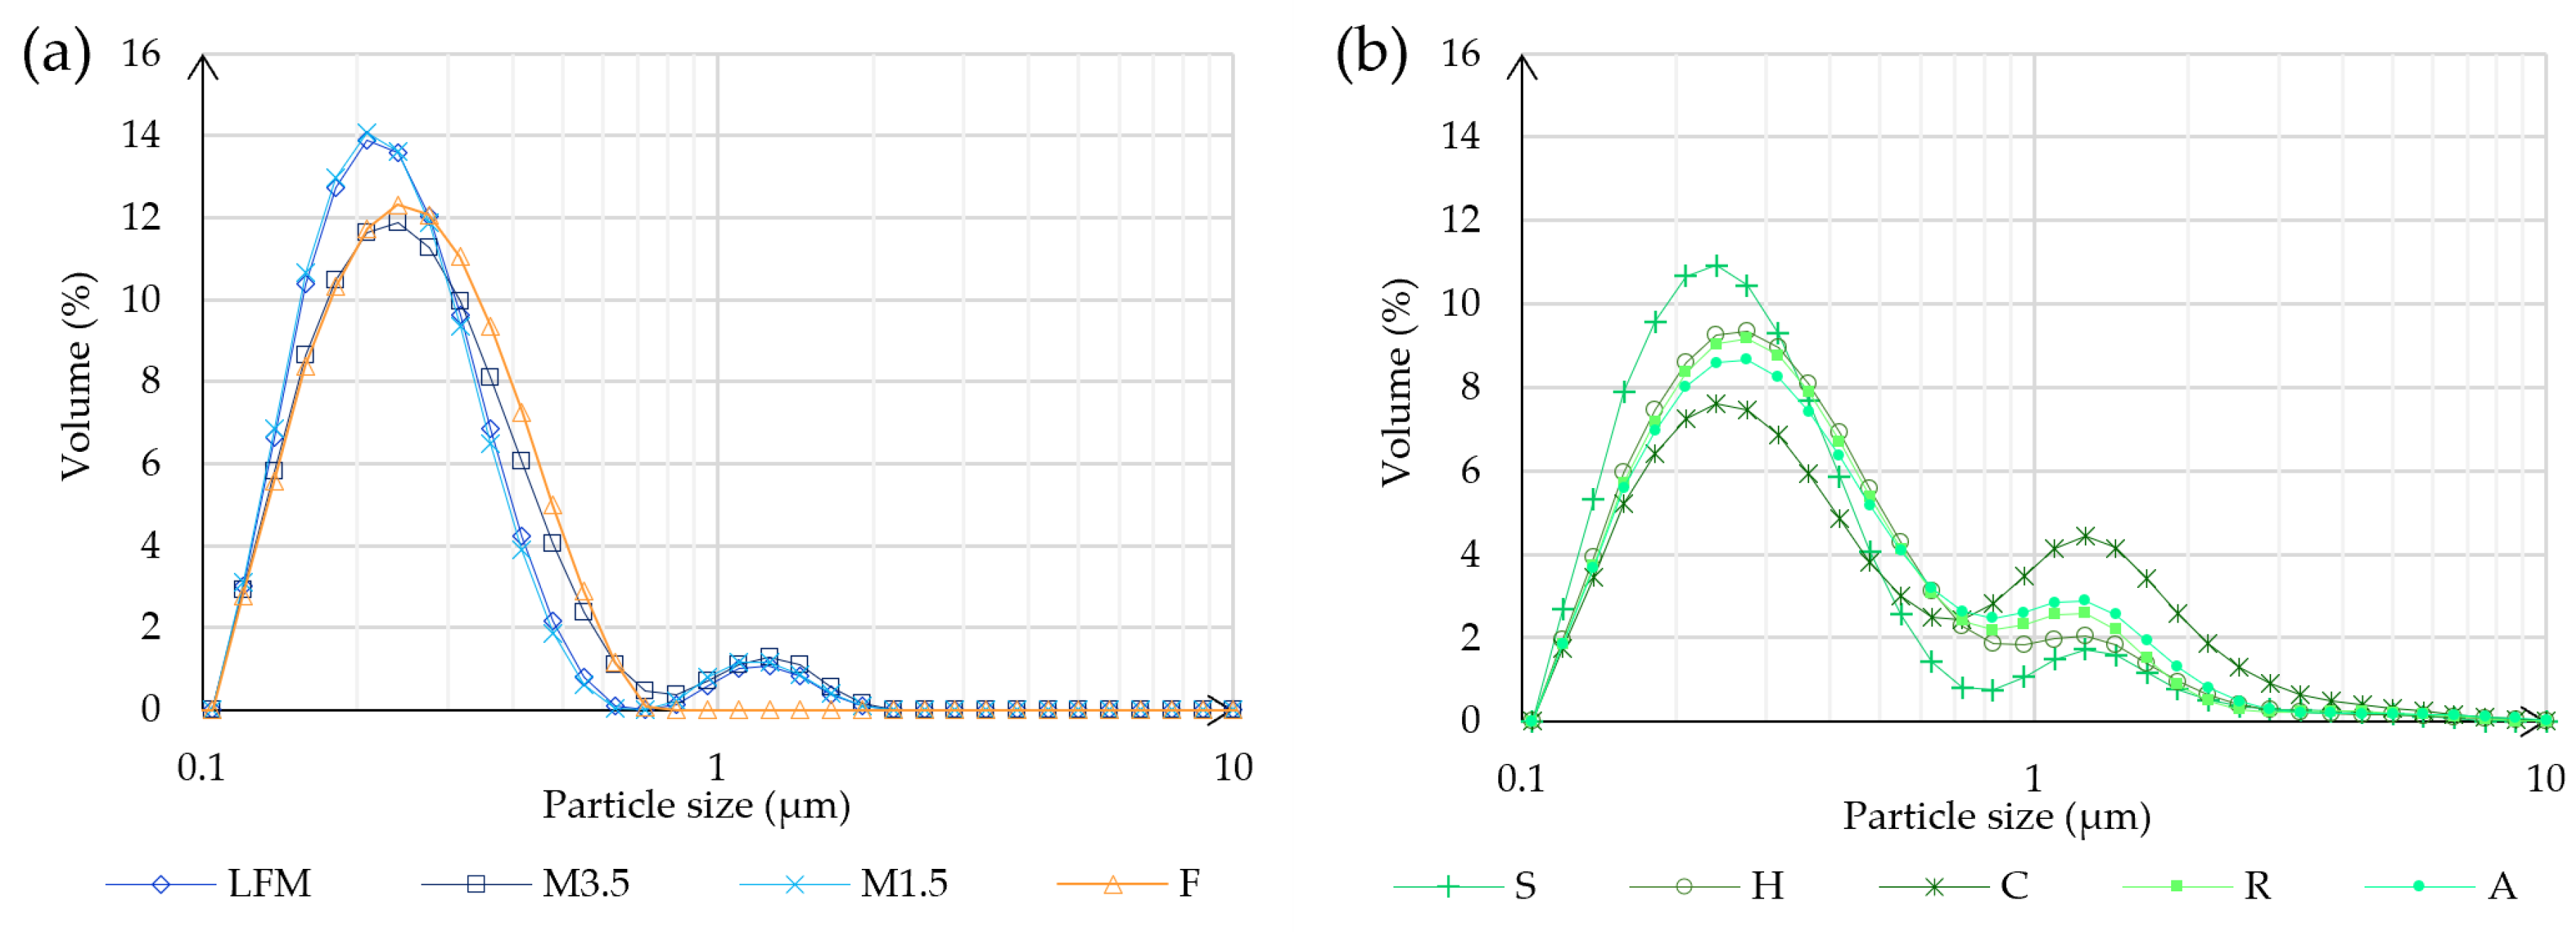
3.4. Particle Size
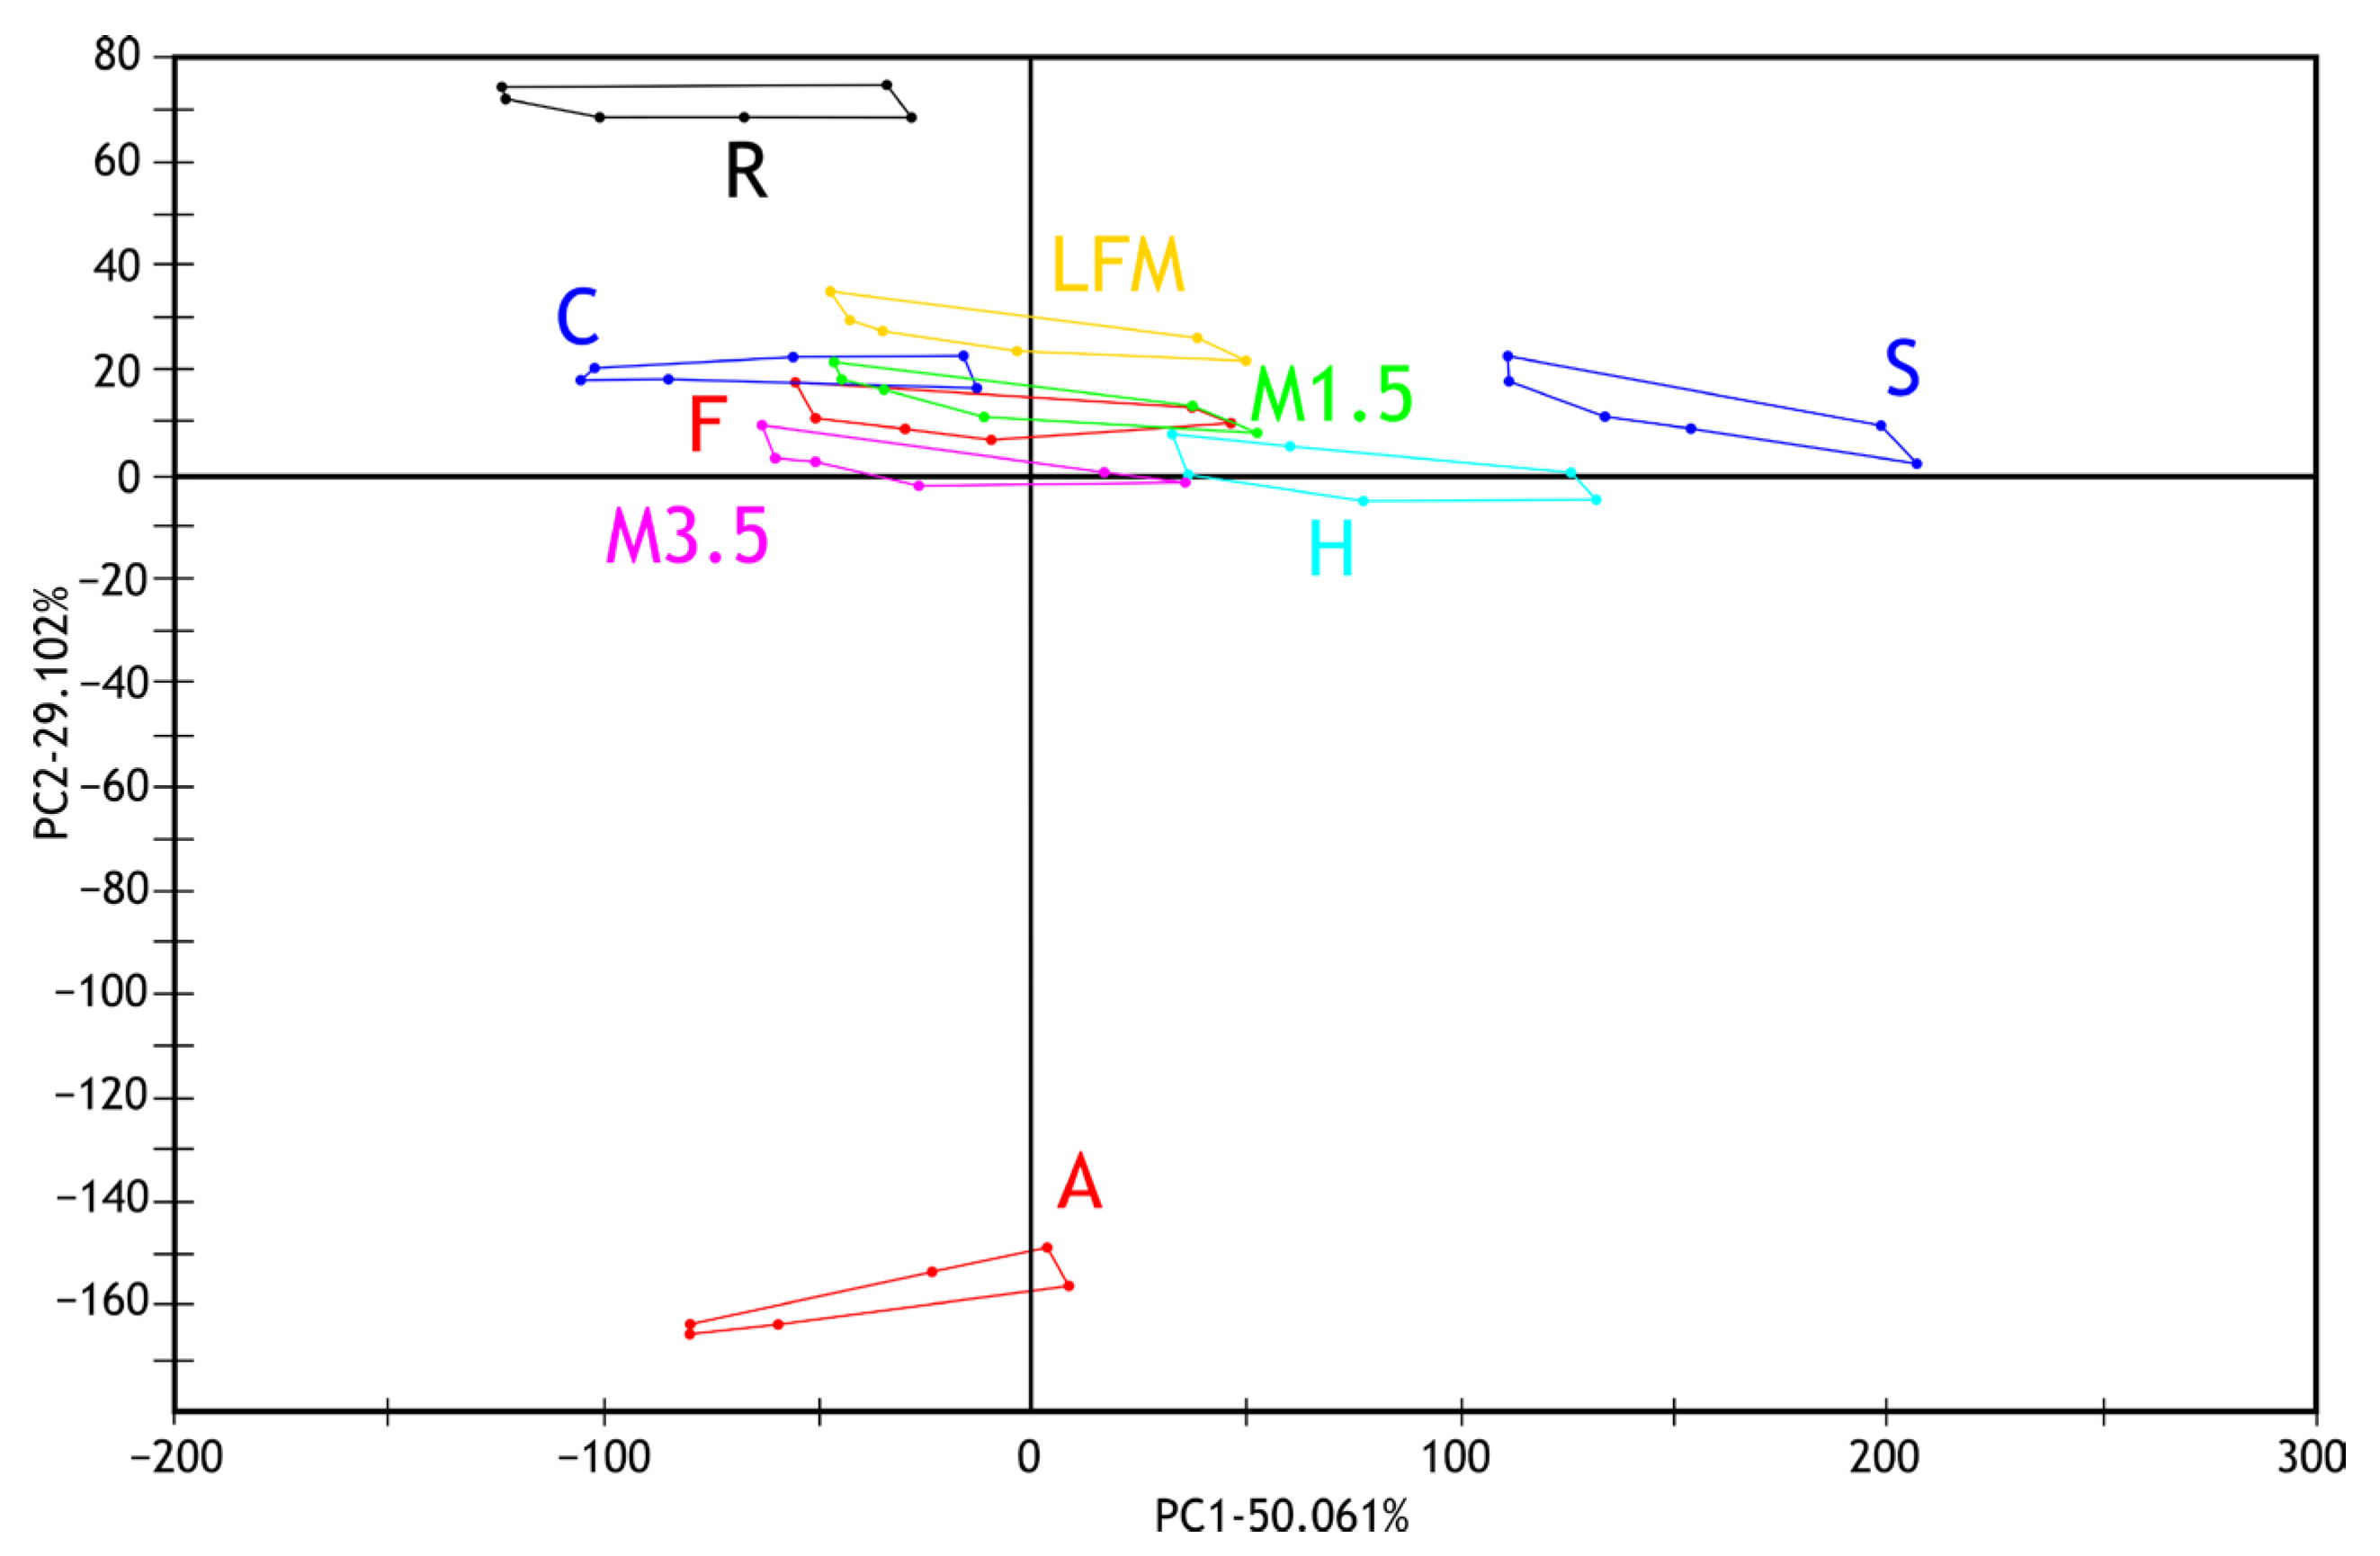
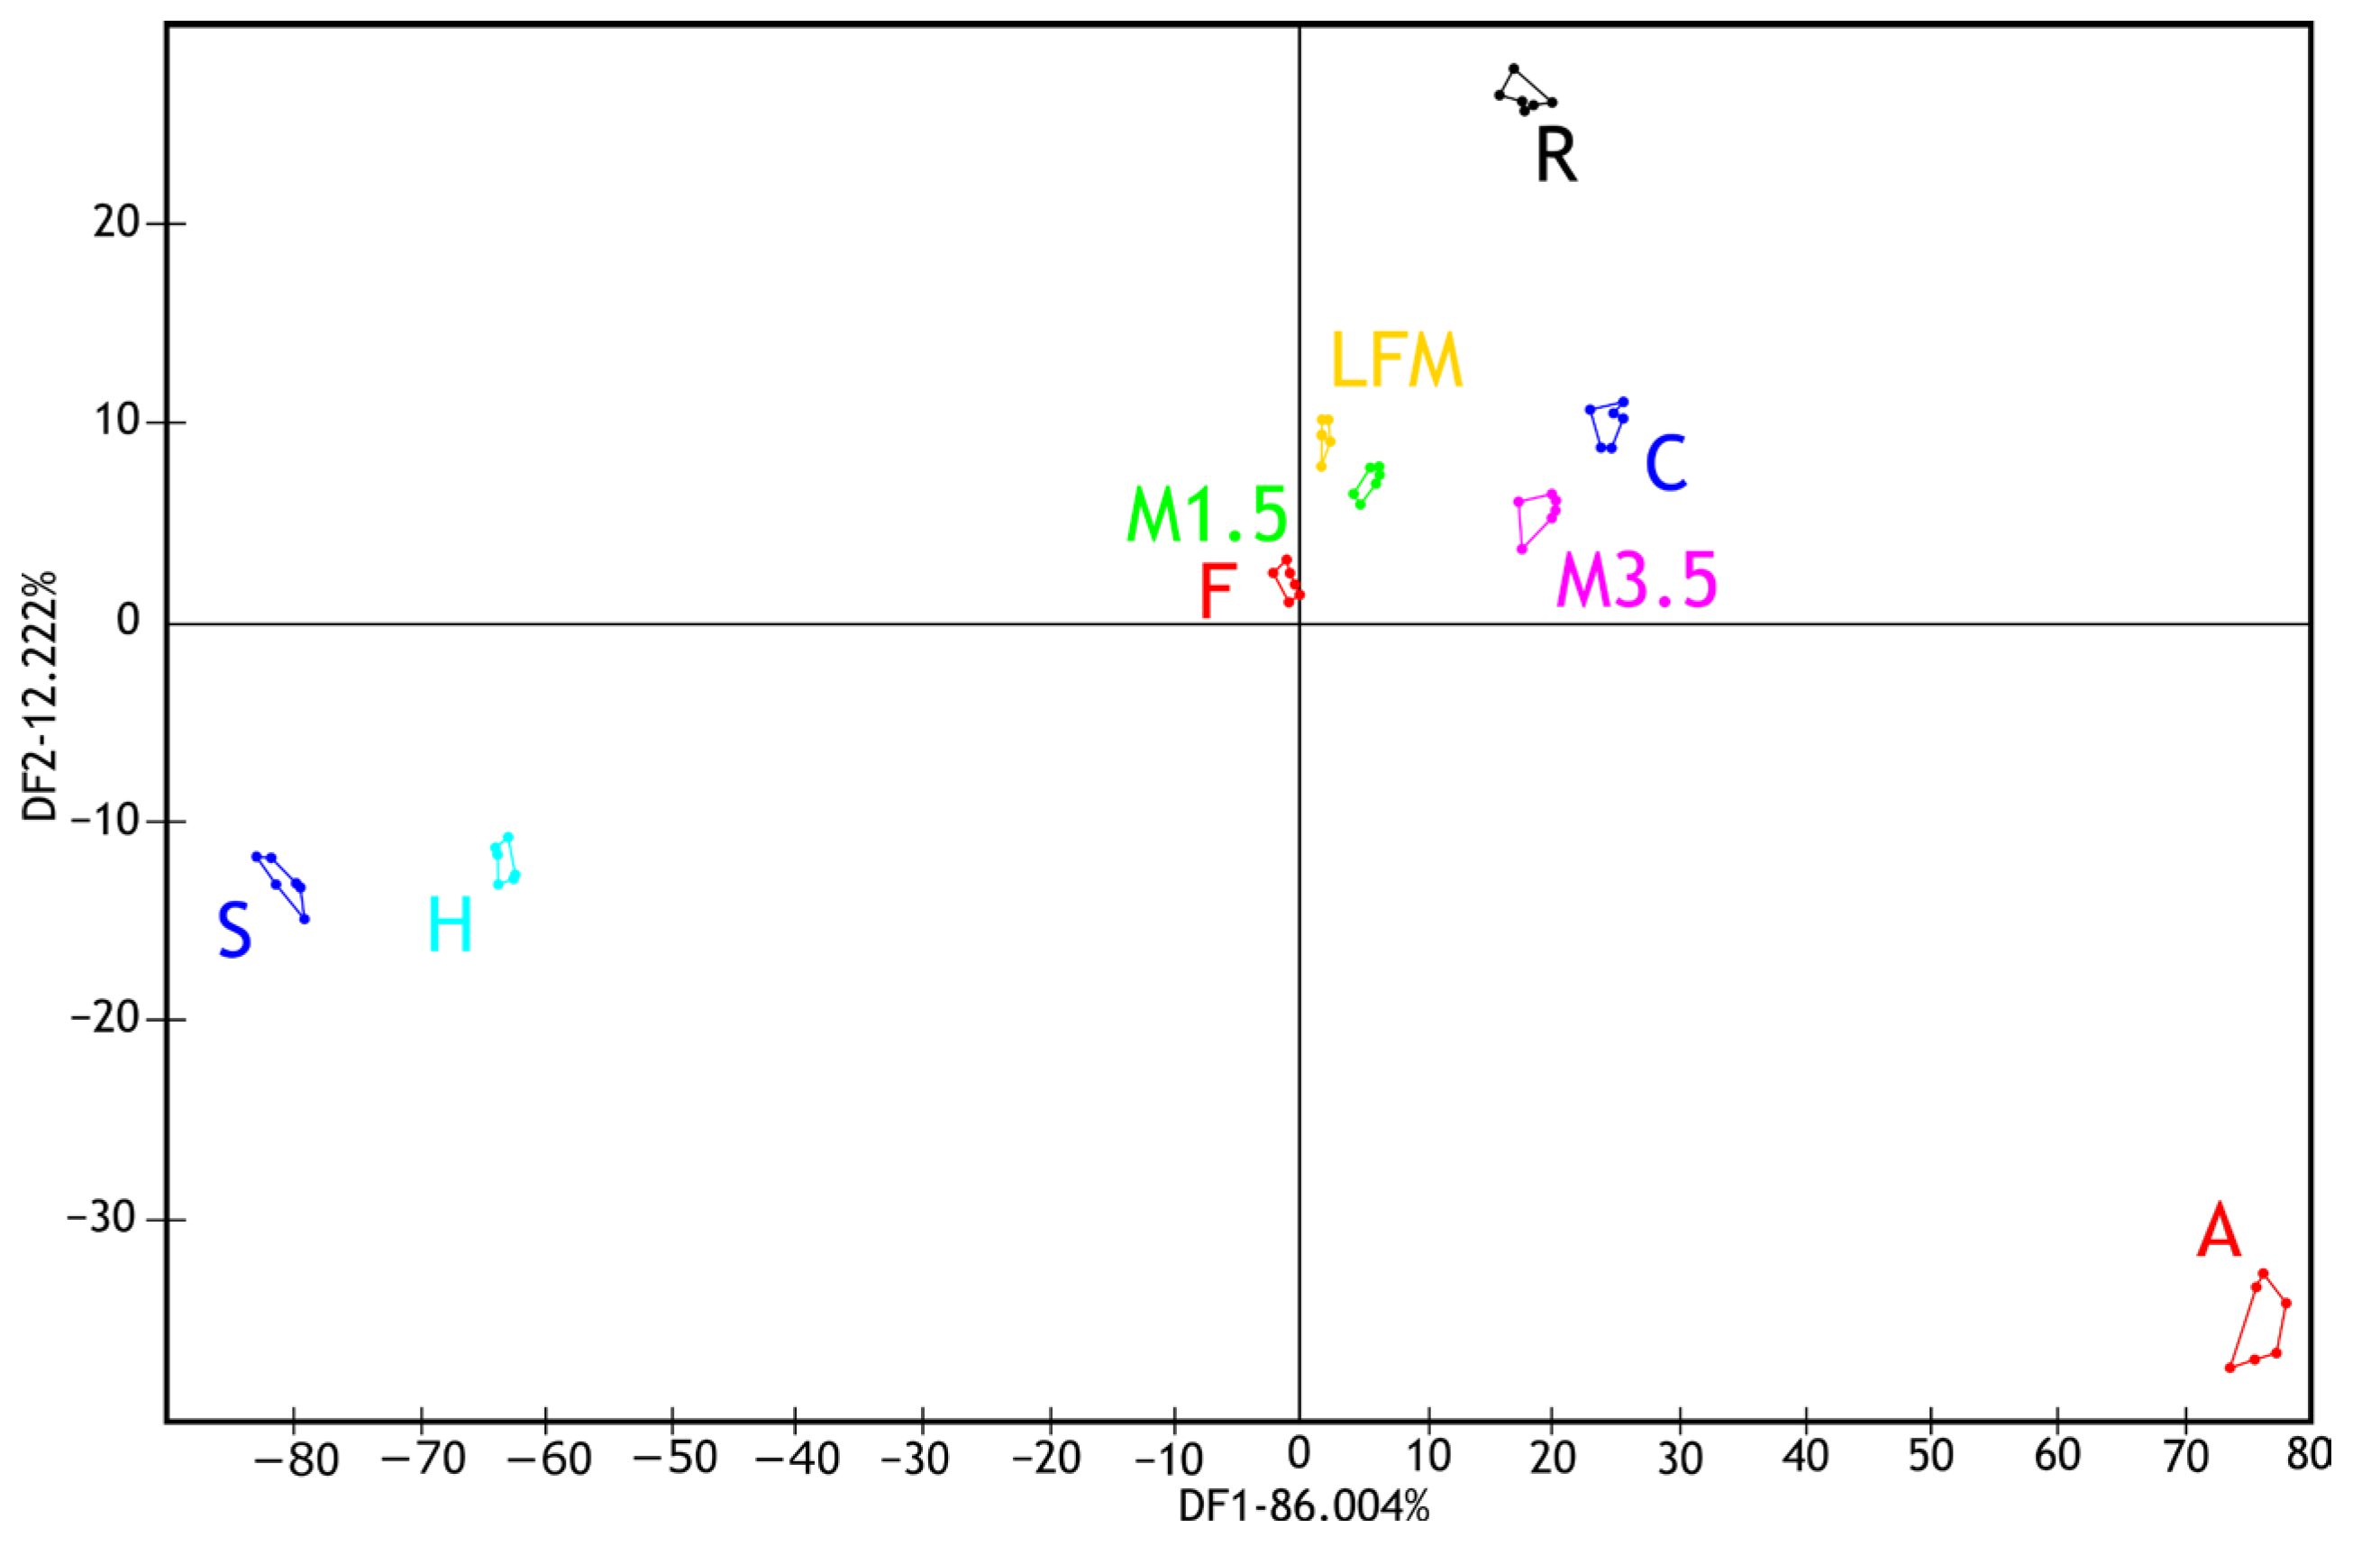
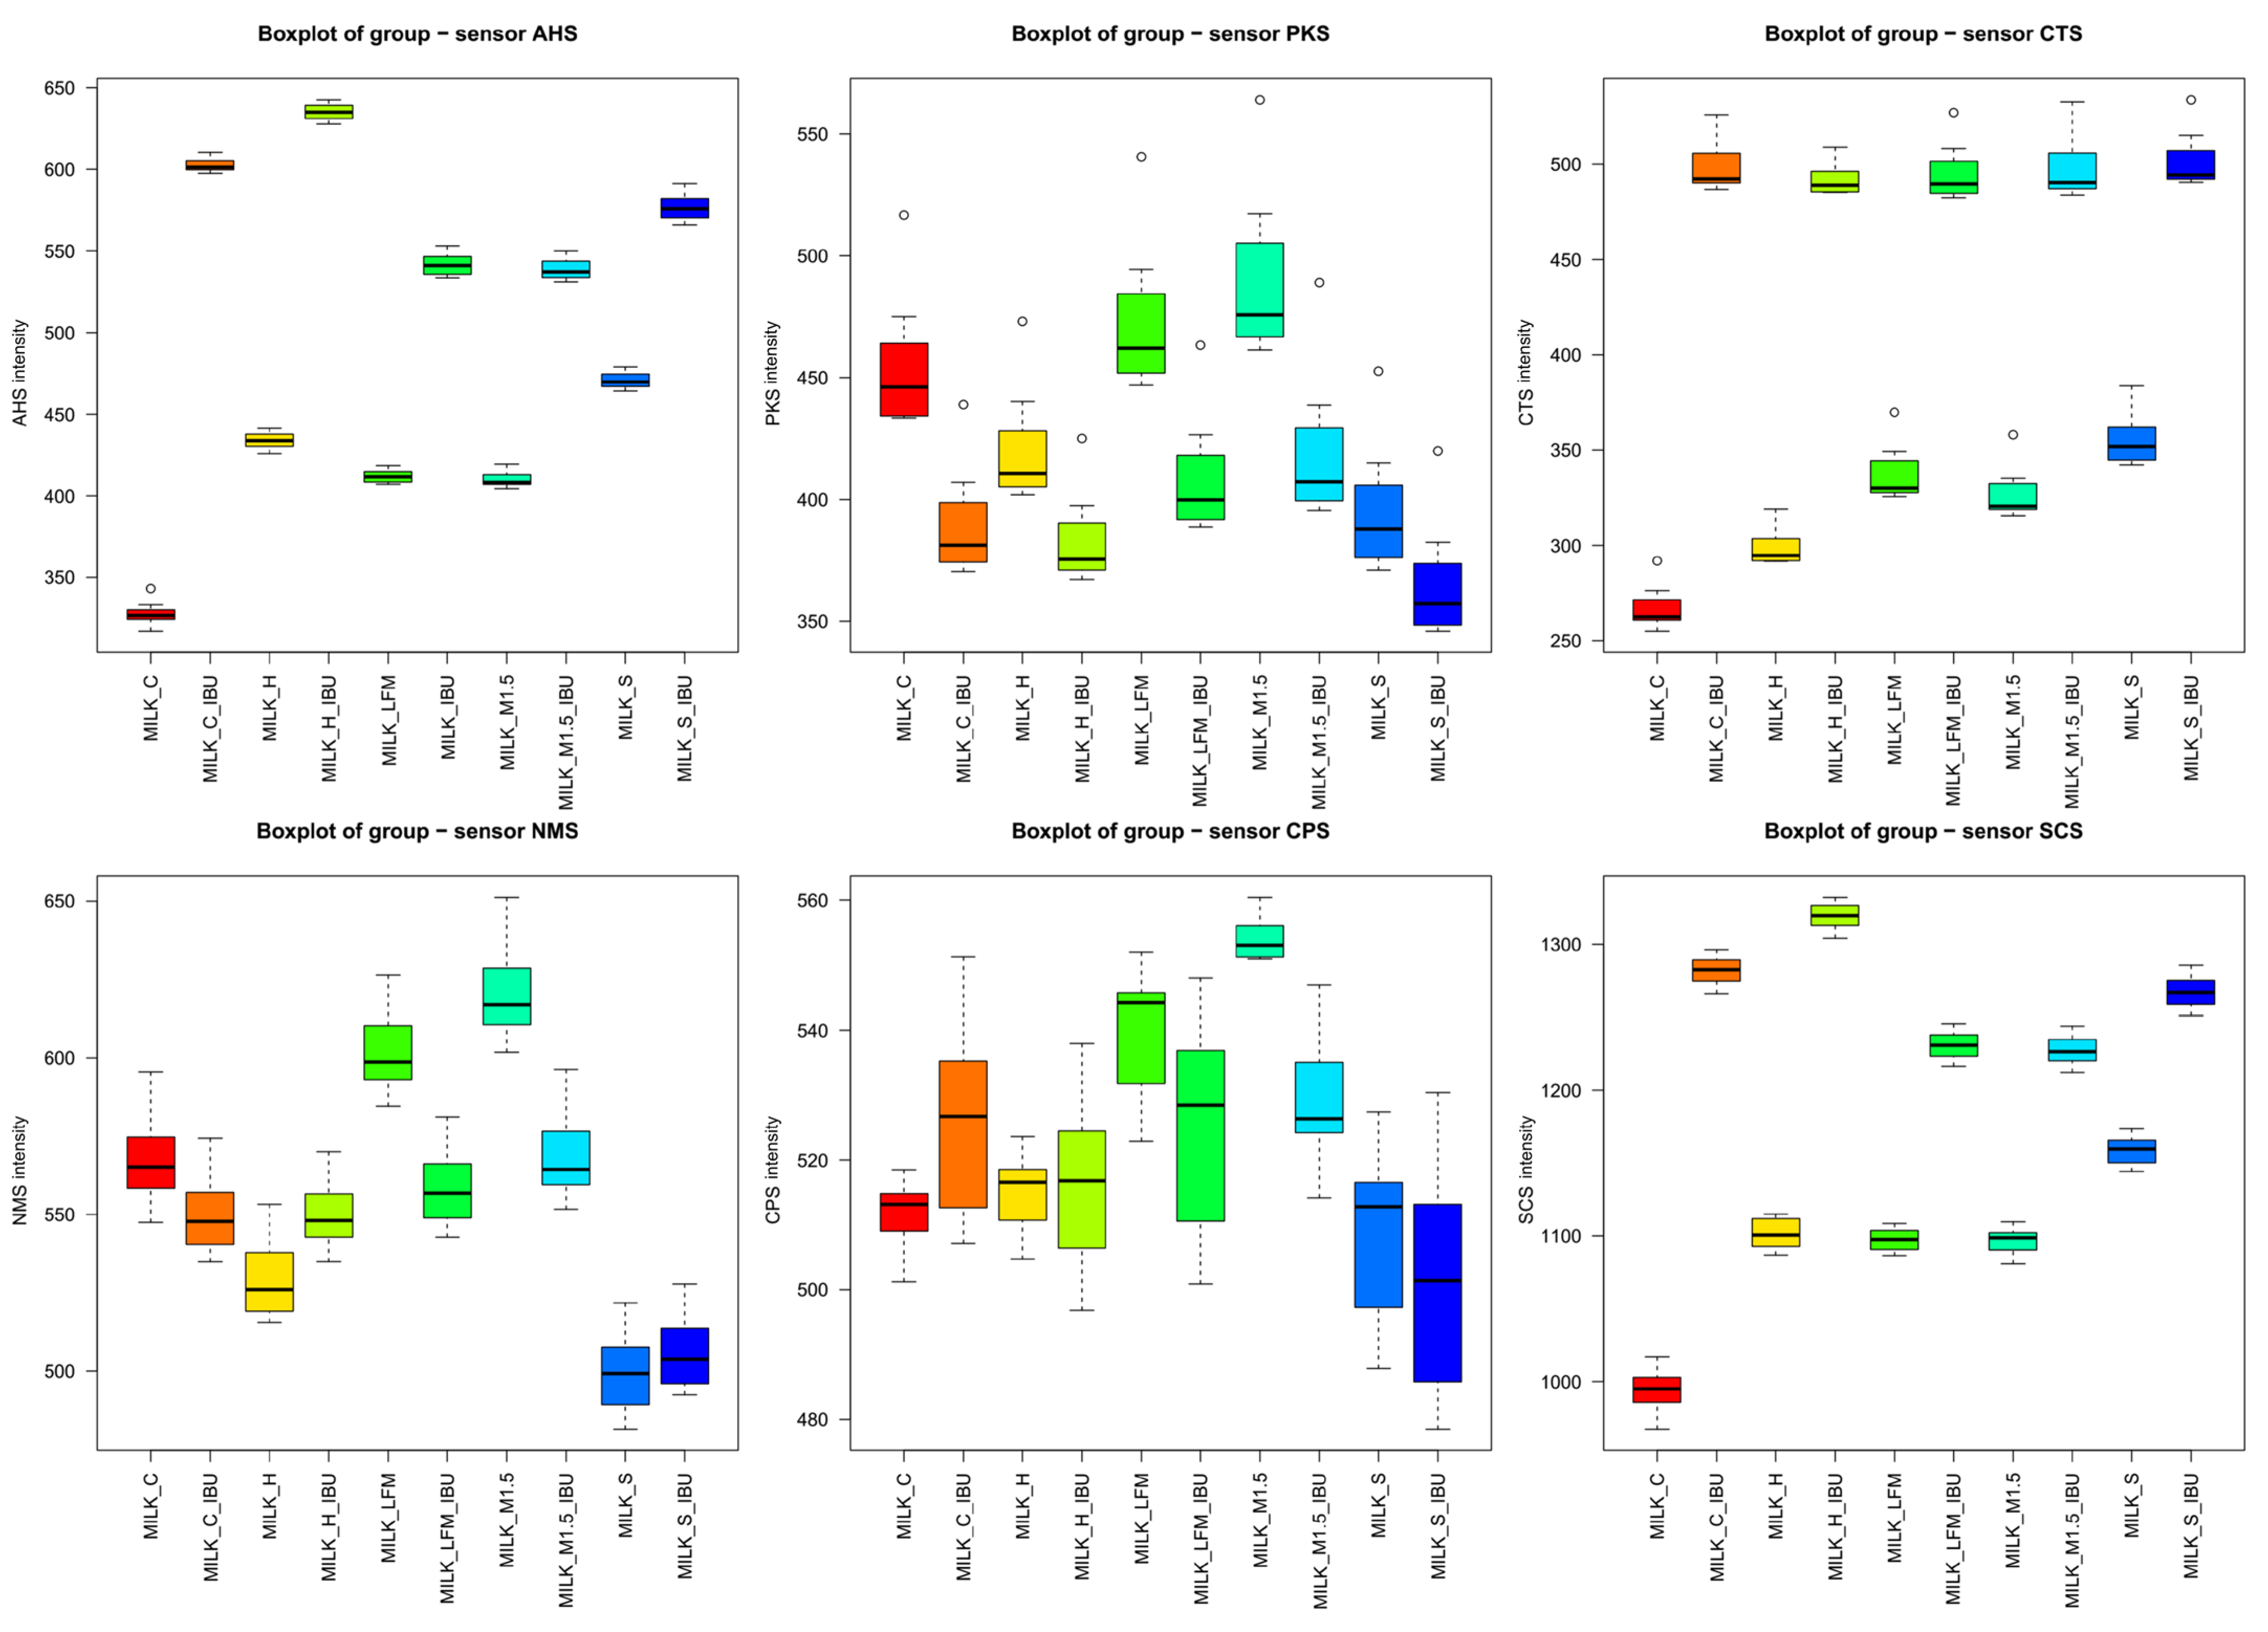
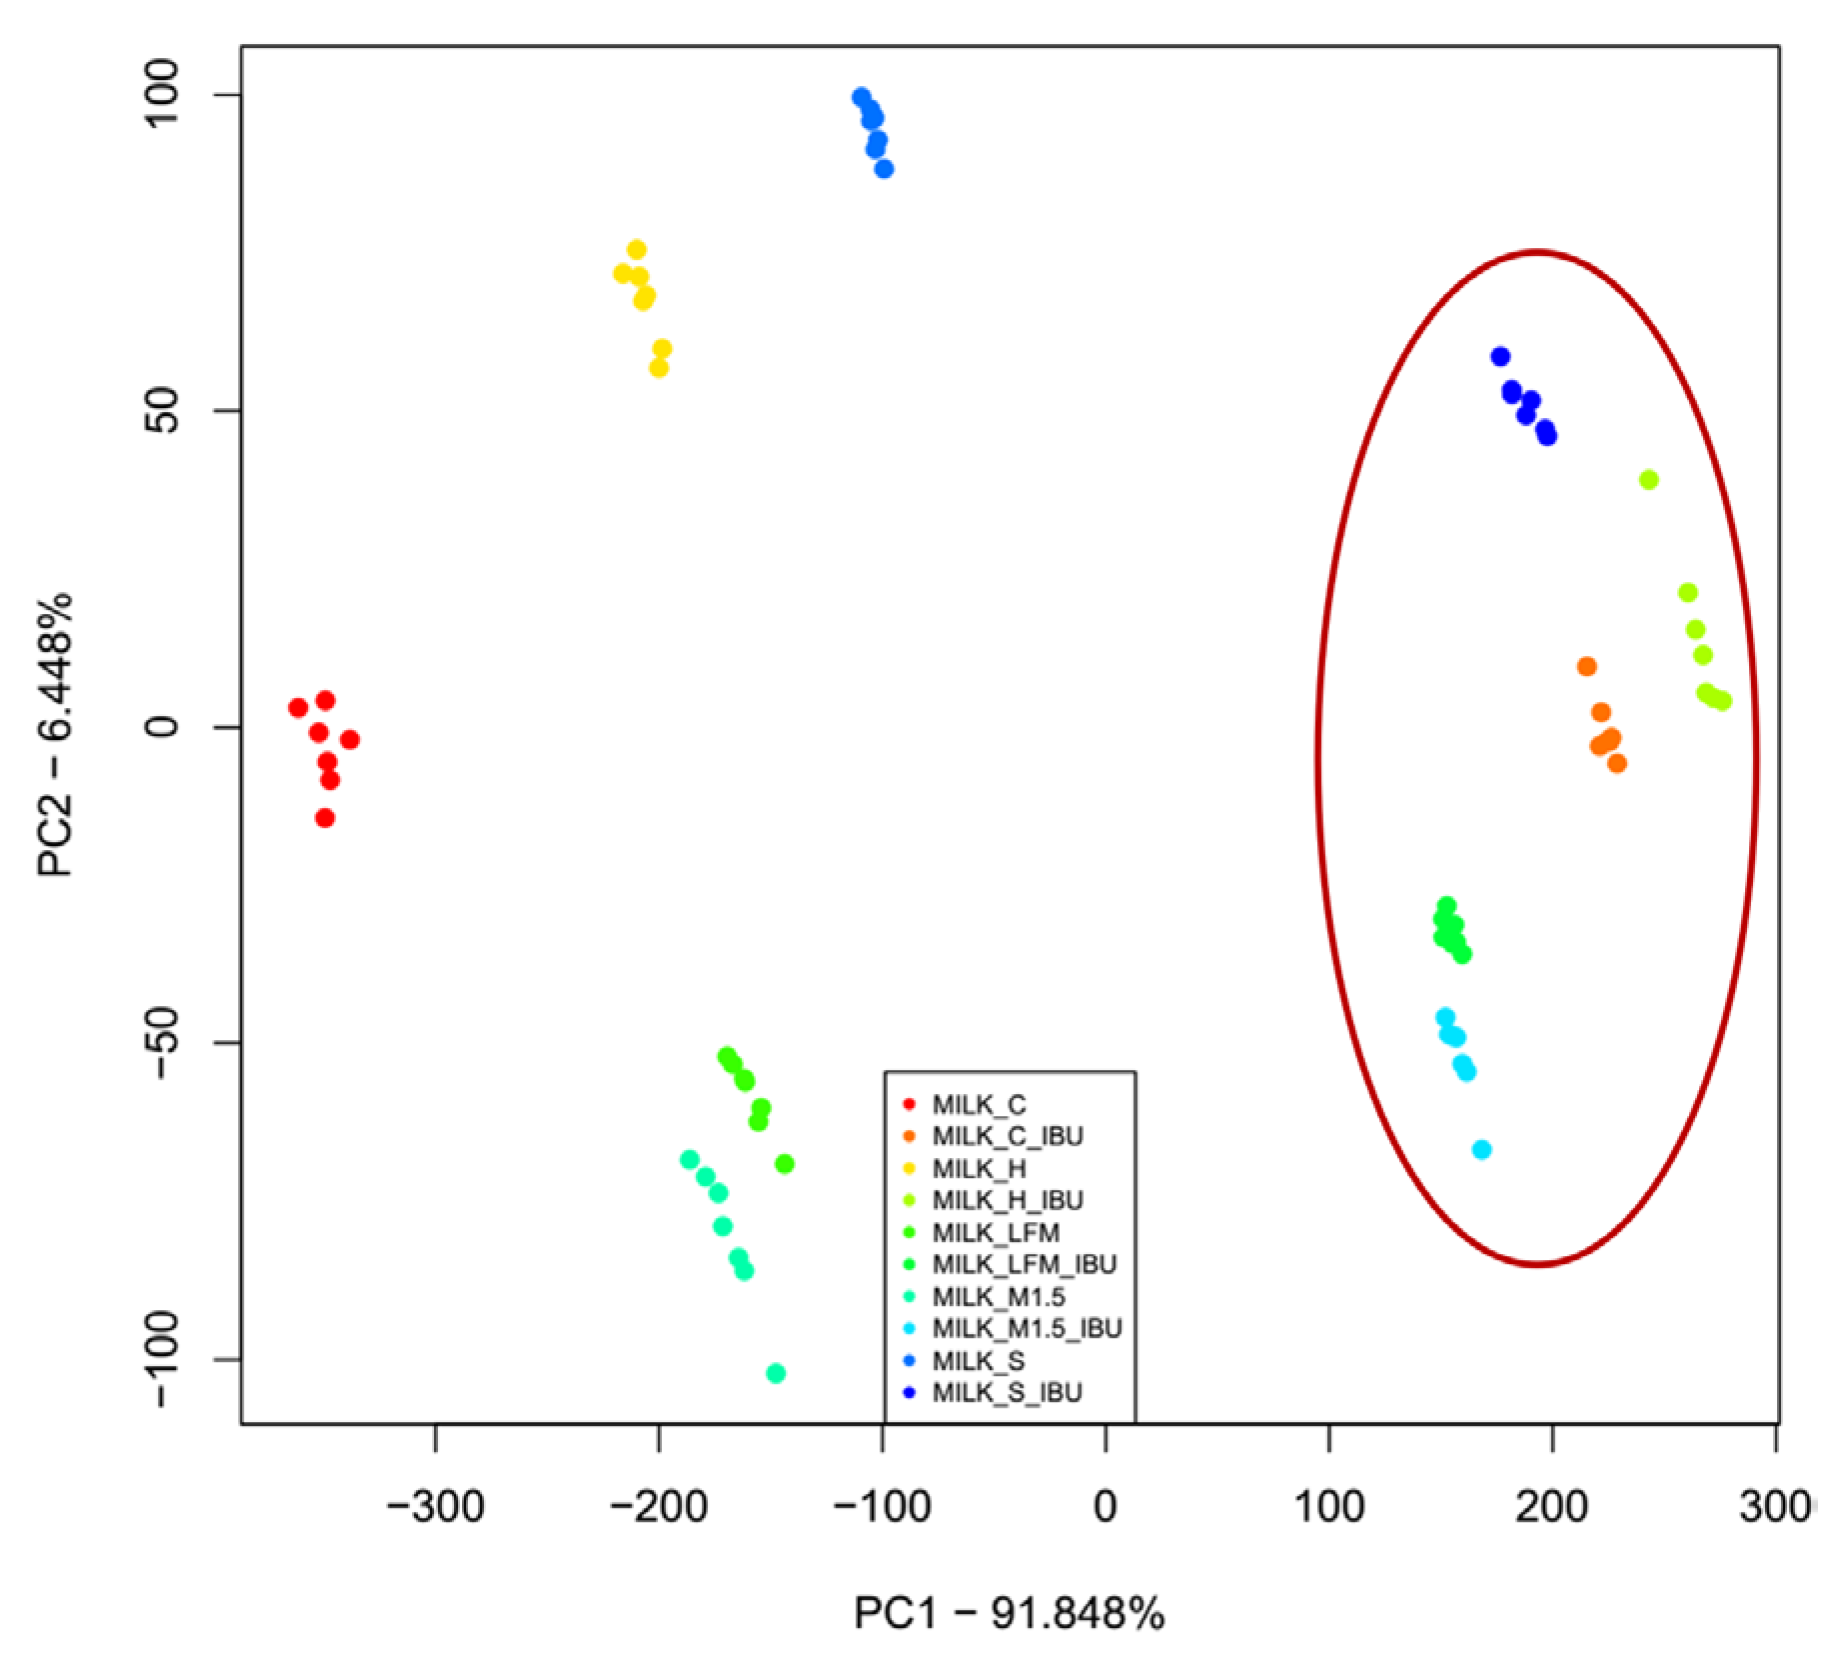
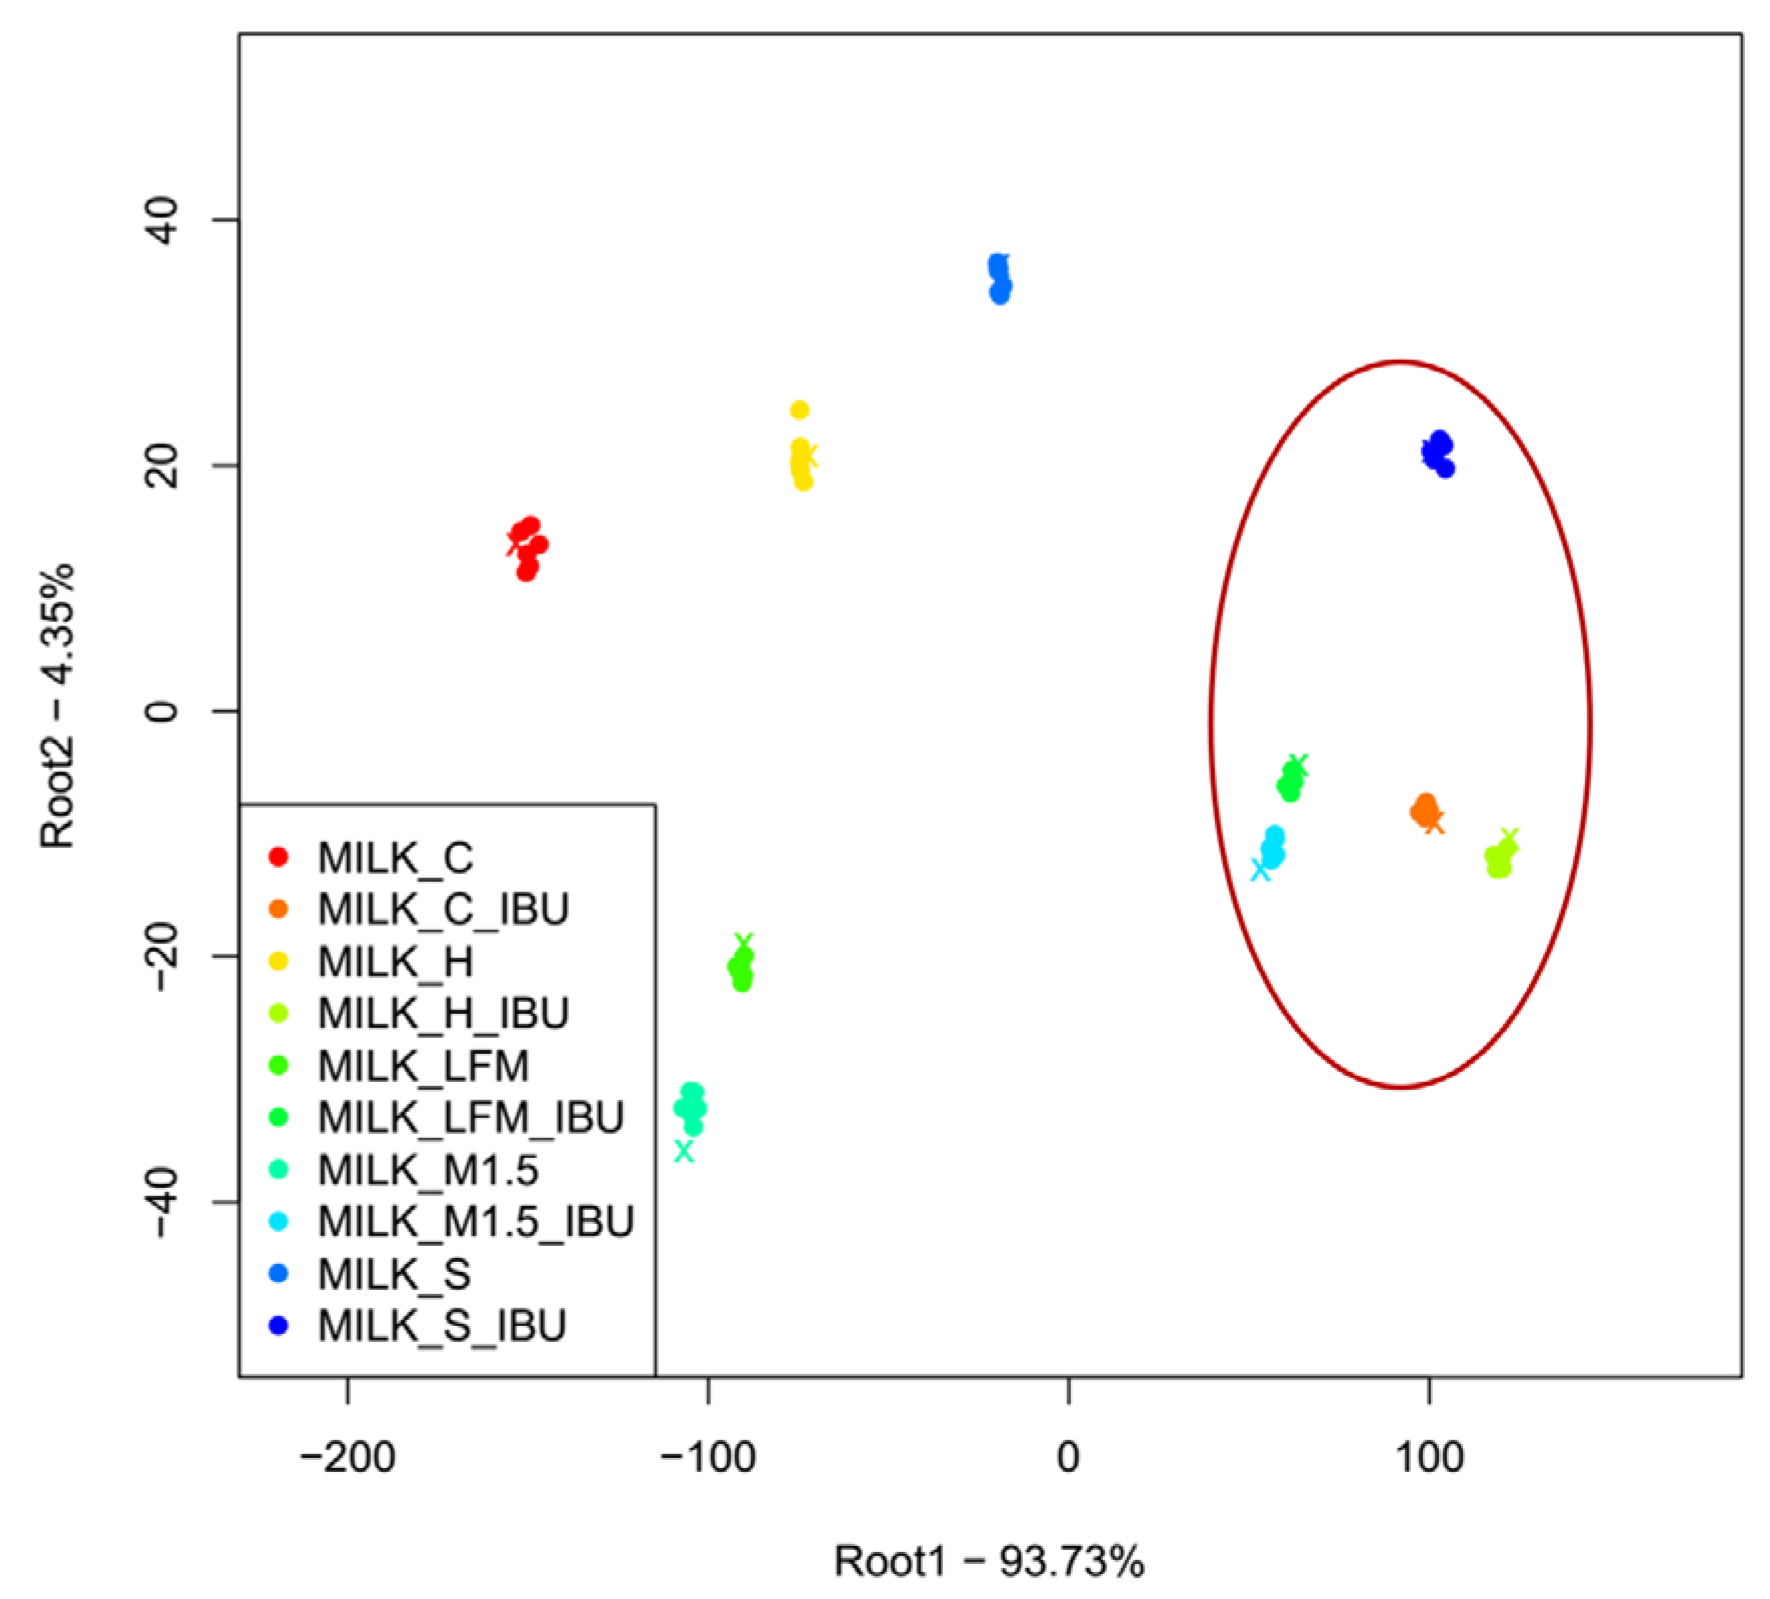
3.5. Electronic Tongue
3.6. Pharmaceutical Characterisation of the ODTs
3.6.1. Mass, Water Content, and Disintegration Time
3.6.2. Effect of the Environmental Factors on the Structure
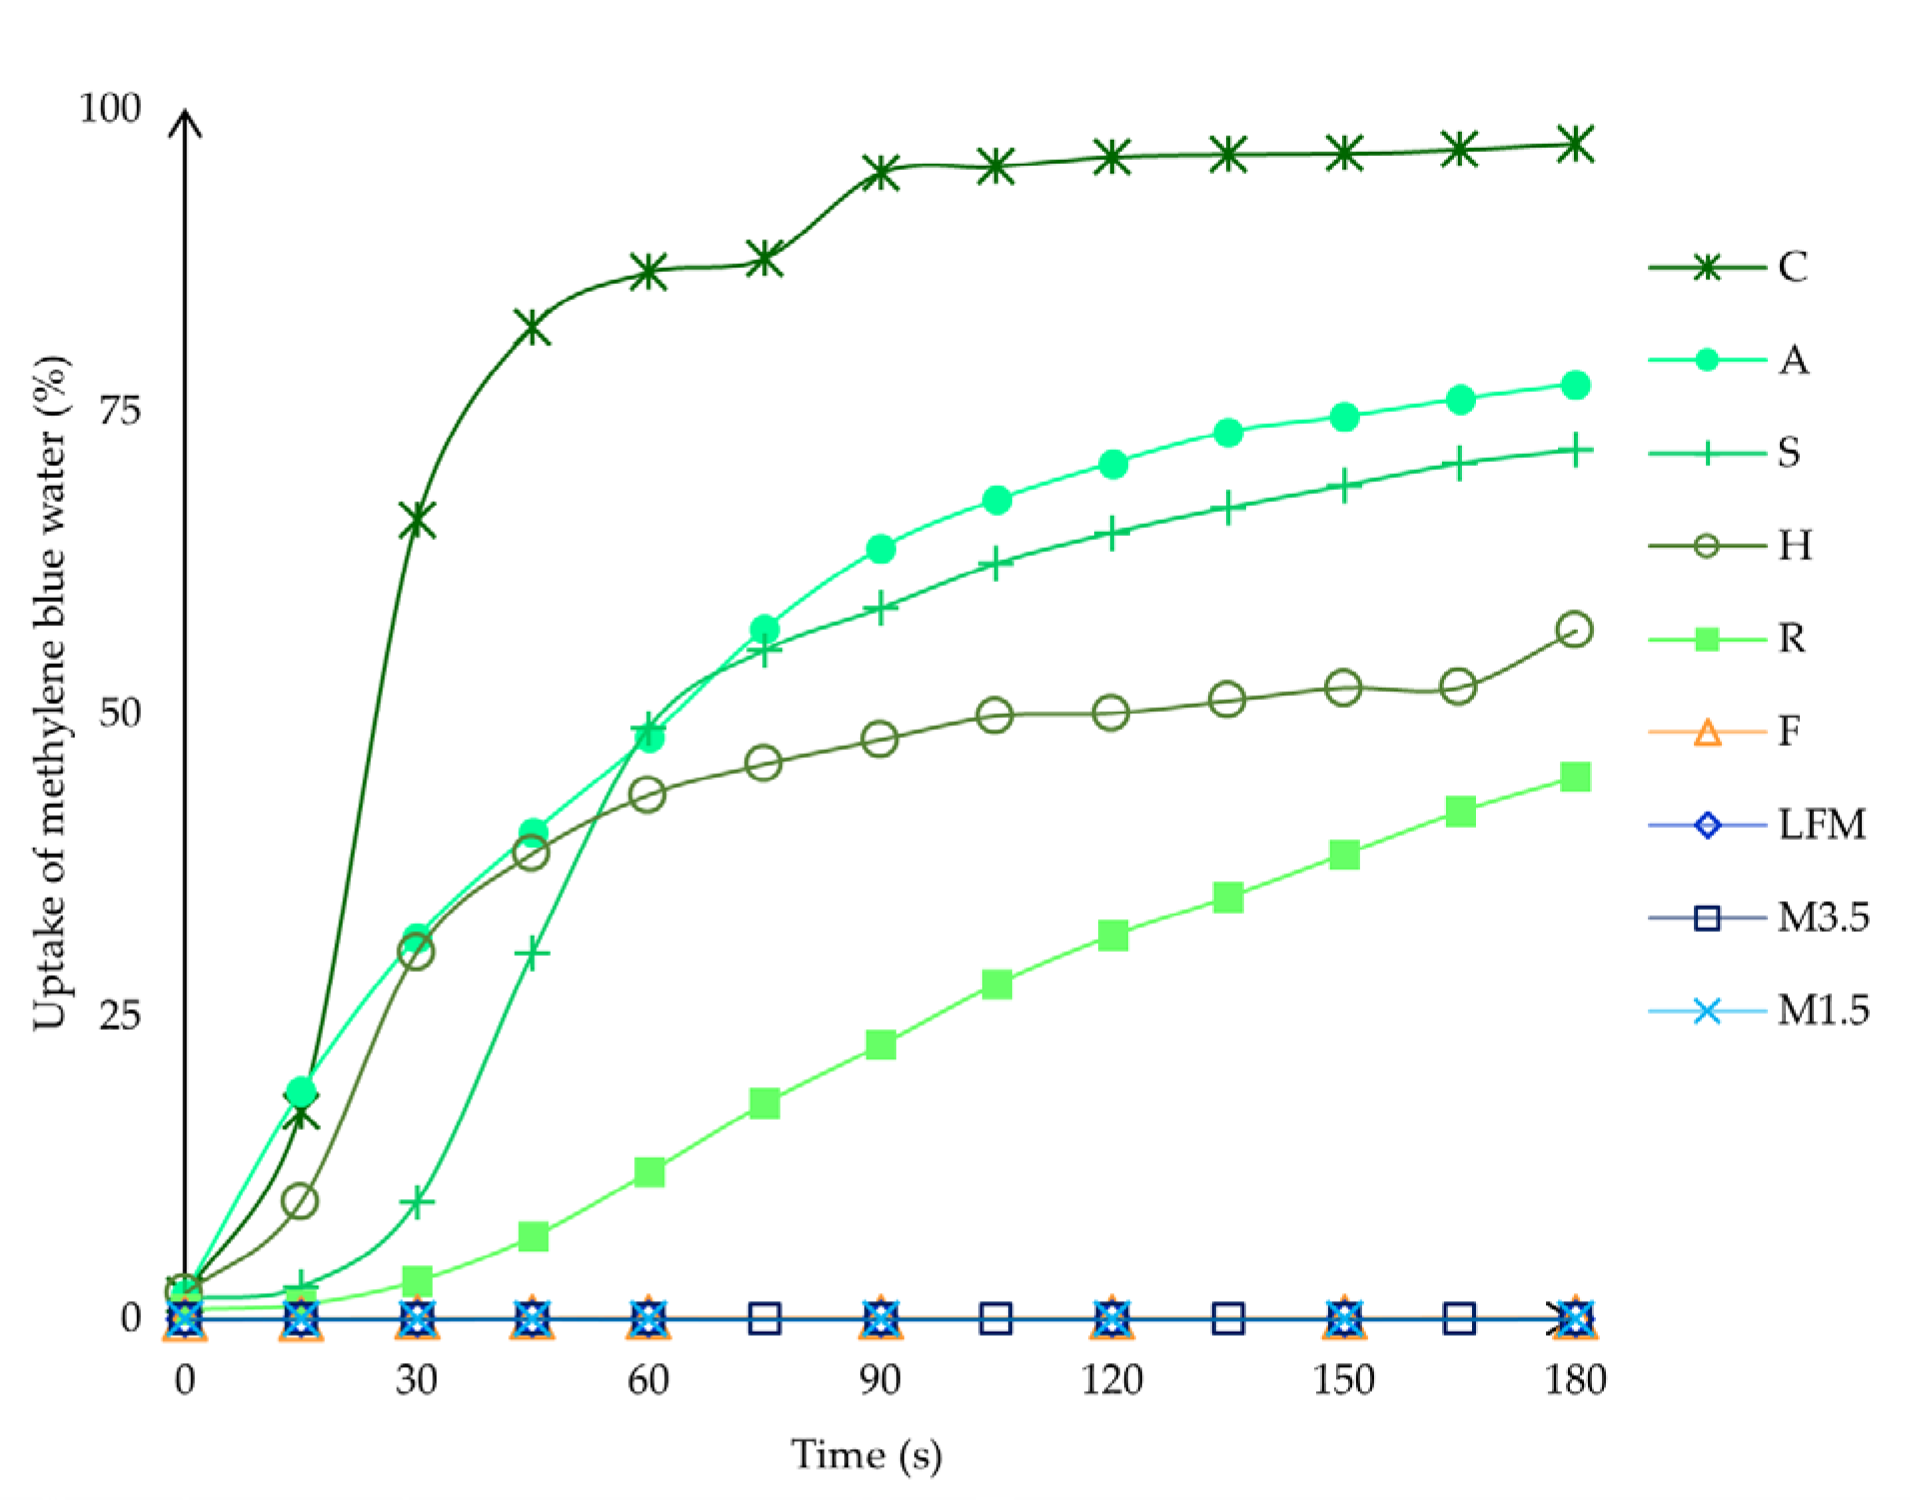
3.6.3. Results of the Methylene Blue Water Uptake
3.6.4. API Content Determined with HPLC-DAD
4. Conclusions
Author Contributions
Funding
Institutional Review Board Statement
Informed Consent Statement
Data Availability Statement
Conflicts of Interest
References
- GLOBAL REPORT—2017 Global Drug Delivery & Formulation Report: Part 1, a Global Review. Available online: https://www.proquest.com/docview/2008938105/abstract/C83043300BCB4024PQ/1 (accessed on 5 December 2024).
- Krekeler, B.N.; Broadfoot, C.K.; Johnson, S.; Connor, N.P.; Rogus-Pulia, N. Patient Adherence to Dysphagia Recommendations: A Systematic Review. Dysphagia 2018, 33, 173–184. [Google Scholar] [CrossRef] [PubMed]
- Blaszczyk, A.; Brandt, N.; Ashley, J.; Tuders, N.; Doles, H.; Stefanacci, R.G. Crushed Tablet Administration for Patients with Dysphagia and Enteral Feeding: Challenges and Considerations. Drugs Aging 2023, 40, 895–907. [Google Scholar] [CrossRef] [PubMed]
- Marquis, J.; Schneider, M.-P.; Payot, V.; Cordonier, A.-C.; Bugnon, O.; Hersberger, K.E.; Arnet, I. Swallowing Difficulties with Oral Drugs among Polypharmacy Patients Attending Community Pharmacies. Int. J. Clin. Pharm. 2013, 35, 1130–1136. [Google Scholar] [CrossRef] [PubMed]
- Drumond, N.; Stegemann, S. Better Medicines for Older Patients: Considerations between Patient Characteristics and Solid Oral Dosage Form Designs to Improve Swallowing Experience. Pharmaceutics 2020, 13, 32. [Google Scholar] [CrossRef]
- Király, M.; Sántha, K.; Kállai-Szabó, B.; Pencz, K.M.; Ludányi, K.; Kállai-Szabó, N.; Antal, I. Development and Dissolution Study of a β-Galactosidase Containing Drinking Straw. Pharmaceutics 2022, 14, 769. [Google Scholar] [CrossRef]
- Kállai-Szabó, N.; Farkas, D.; Lengyel, M.; Basa, B.; Fleck, C.; Antal, I. Microparticles and Multi-Unit Systems for Advanced Drug Delivery. Eur. J. Pharm. Sci. 2024, 194, 106704. [Google Scholar] [CrossRef]
- Cornilă, A.; Iurian, S.; Tomuță, I.; Porfire, A. Orally Dispersible Dosage Forms for Paediatric Use: Current Knowledge and Development of Nanostructure-Based Formulations. Pharmaceutics 2022, 14, 1621. [Google Scholar] [CrossRef]
- Kállai-Szabó, N.; Lengyel, M.; Farkas, D.; Barna, Á.T.; Fleck, C.; Basa, B.; Antal, I. Review on Starter Pellets: Inert and Functional Cores. Pharmaceutics 2022, 14, 1299. [Google Scholar] [CrossRef]
- Zajicek, A.; Fossler, M.J.; Barrett, J.S.; Worthington, J.H.; Ternik, R.; Charkoftaki, G.; Lum, S.; Breitkreutz, J.; Baltezor, M.; Macheras, P.; et al. A Report from the Pediatric Formulations Task Force: Perspectives on the State of Child-Friendly Oral Dosage Forms. AAPS J. 2013, 15, 1072–1081. [Google Scholar] [CrossRef]
- Montero-Padilla, S.; Velaga, S.; Morales, J.O. Buccal Dosage Forms: General Considerations for Pediatric Patients. AAPS PharmSciTech 2017, 18, 273–282. [Google Scholar] [CrossRef]
- Alyami, H.; Koner, J.; Huynh, C.; Terry, D.; Mohammed, A.R. Current Opinions and Recommendations of Paediatric Healthcare Professionals—The Importance of Tablets: Emerging Orally Disintegrating versus Traditional Tablets. PLoS ONE 2018, 13, e0193292. [Google Scholar] [CrossRef] [PubMed]
- Barbagallo, M.; Sacerdote, P. Ibuprofen in the Treatment of Children’s Inflammatory Pain: A Clinical and Pharmacological Overview. Minerva Pediatr. 2018, 71, 82–99. [Google Scholar] [CrossRef] [PubMed]
- Basa, B.; Jakab, G.; Kállai-Szabó, N.; Borbás, B.; Fülöp, V.; Balogh, E.; Antal, I. Evaluation of Biodegradable PVA-Based 3D Printed Carriers during Dissolution. Materials 2021, 14, 1350. [Google Scholar] [CrossRef] [PubMed]
- Ghourichay, M.P.; Kiaie, S.H.; Nokhodchi, A.; Javadzadeh, Y. Formulation and Quality Control of Orally Disintegrating Tablets (ODTs): Recent Advances and Perspectives. BioMed Res. Int. 2021, 2021, 6618934. [Google Scholar] [CrossRef] [PubMed]
- Williams III, R.O.; Reynolds, T.D.; Cabelka, T.D.; Sykora, M.A.; Mahaguna, V. Investigation of Excipient Type and Level on Drug Release from Controlled Release Tablets Containing HPMC. Pharm. Dev. Technol. 2002, 7, 181–193. [Google Scholar] [CrossRef]
- Abrantes, C.G.; Duarte, D.; Reis, C.P. An Overview of Pharmaceutical Excipients: Safe or Not Safe? J. Pharm. Sci. 2016, 105, 2019–2026. [Google Scholar] [CrossRef]
- Eccles, R. What Is the Role of Over 100 Excipients in Over the Counter (OTC) Cough Medicines? Lung 2020, 198, 727–734. [Google Scholar] [CrossRef]
- Dave, V.S.; Saoji, S.D.; Raut, N.A.; Haware, R.V. Excipient Variability and Its Impact on Dosage Form Functionality. J. Pharm. Sci. 2015, 104, 906–915. [Google Scholar] [CrossRef]
- Pockle, R.D.; Masareddy, R.S.; Patil, A.S.; Patil, P.D. A Comprehensive Review on Pharmaceutical Excipients. Ther. Deliv. 2023, 14, 443–458. [Google Scholar] [CrossRef]
- Elder, D.P.; Kuentz, M.; Holm, R. Pharmaceutical Excipients—Quality, Regulatory and Biopharmaceutical Considerations. Eur. J. Pharm. Sci. 2016, 87, 88–99. [Google Scholar] [CrossRef]
- Salim, M.; Eason, T.; Boyd, B.J. Opportunities for Milk and Milk-Related Systems as ‘New’ Low-Cost Excipient Drug Delivery Materials. Adv. Drug Deliv. Rev. 2022, 183, 114139. [Google Scholar] [CrossRef] [PubMed]
- Gallo, A.; Pellegrino, S.; Lipari, A.; Pero, E.; Ibba, F.; Cacciatore, S.; Marzetti, E.; Landi, F.; Montalto, M. Lactose Malabsorption and Intolerance: What Is the Correct Management in Older Adults? Clin. Nutr. 2023, 42, 2540–2545. [Google Scholar] [CrossRef] [PubMed]
- Misselwitz, B.; Pohl, D.; Frühauf, H.; Fried, M.; Vavricka, S.R.; Fox, M. Lactose Malabsorption and Intolerance: Pathogenesis, Diagnosis and Treatment. United Eur. Gastroenterol. J. 2013, 1, 151–159. [Google Scholar] [CrossRef] [PubMed]
- Dominici, S.; Marescotti, F.; Sanmartin, C.; Macaluso, M.; Taglieri, I.; Venturi, F.; Zinnai, A.; Facioni, M.S. Lactose: Characteristics, Food and Drug-Related Applications, and Its Possible Substitutions in Meeting the Needs of People with Lactose Intolerance. Foods 2022, 11, 1486. [Google Scholar] [CrossRef] [PubMed]
- Király, M.; Kiss, B.D.; Horváth, P.; Drahos, L.; Mirzahosseini, A.; Pálfy, G.; Antal, I.; Ludányi, K. Investigating Thermal Stability Based on the Structural Changes of Lactase Enzyme by Several Orthogonal Methods. Biotechnol. Rep. 2021, 30, e00637. [Google Scholar] [CrossRef]
- Gallo, A.; Marzetti, E.; Pellegrino, S.; Montalto, M. Lactose Malabsorption and Intolerance in Older Adults. Curr. Opin. Clin. Nutr. Metab. Care 2024, 27, 333–337. [Google Scholar] [CrossRef]
- Reyes-Jurado, F.; Soto-Reyes, N.; Dávila-Rodríguez, M.; Lorenzo-Leal, A.C.; Jiménez-Munguía, M.T.; Mani-López, E.; López-Malo, A. Plant-Based Milk Alternatives: Types, Processes, Benefits, and Characteristics. Food Rev. Int. 2023, 39, 2320–2351. [Google Scholar] [CrossRef]
- Moss, R.; Barker, S.; Falkeisen, A.; Gorman, M.; Knowles, S.; McSweeney, M.B. An Investigation into Consumer Perception and Attitudes towards Plant-Based Alternatives to Milk. Food Res. Int. 2022, 159, 111648. [Google Scholar] [CrossRef]
- Jaeger, S.R.; Dupas De Matos, A.; Frempomaa Oduro, A.; Hort, J. Sensory Characteristics of Plant-Based Milk Alternatives: Product Characterisation by Consumers and Drivers of Liking. Food Res. Int. 2024, 180, 114093. [Google Scholar] [CrossRef]
- Xie, A.; Dong, Y.; Liu, Z.; Li, Z.; Shao, J.; Li, M.; Yue, X. A Review of Plant-Based Drinks Addressing Nutrients, Flavor, and Processing Technologies. Foods 2023, 12, 3952. [Google Scholar] [CrossRef]
- Vilimi, Z.; Pápay, Z.E.; Basa, B.; Orekhova, X.; Kállai-Szabó, N.; Antal, I. Microfluidic Rheology: An Innovative Method for Viscosity Measurement of Gels and Various Pharmaceuticals. Gels 2024, 10, 464. [Google Scholar] [CrossRef] [PubMed]
- Aouadi, B.; Zaukuu, J.-L.Z.; Vitális, F.; Bodor, Z.; Fehér, O.; Gillay, Z.; Bazar, G.; Kovacs, Z. Historical Evolution and Food Control Achievements of Near Infrared Spectroscopy, Electronic Nose, and Electronic Tongue—Critical Overview. Sensors 2020, 20, 5479. [Google Scholar] [CrossRef] [PubMed]
- Documentation of Ibuprofen Sodium Salt. Available online: https://www.sigmaaldrich.com/HU/en/product/sial/i1892 (accessed on 9 December 2024).
- Siow, C.R.S.; Wan Sia Heng, P.; Chan, L.W. Application of Freeze-Drying in the Development of Oral Drug Delivery Systems. Expert. Opin. Drug Deliv. 2016, 13, 1595–1608. [Google Scholar] [CrossRef] [PubMed]
- Adams, G. The Principles of Freeze-Drying. In Cryopreservation and Freeze-Drying Protocols; Day, J.G., Stacey, G.N., Eds.; Methods in Molecular Biology; Humana Press: Totowa, NJ, USA, 2007; Volume 368, pp. 15–38. ISBN 978-1-58829-377-0. [Google Scholar]
- Council of Europe 2. 9.5. Uniformity of Mass of Single-Dose Preparations. Eur. Pharmacopoeia 2024, 11, 4523. [Google Scholar]
- Council of Europe 2. 9.1. Disintegration of Tablets and Capsules. Eur. Pharmacopoeia 2024, 11, 4523. [Google Scholar]
- Council of Europe 2. 5.32. Water: Micro Determination. Eur. Pharmacopoeia 2024, 11, 4523. [Google Scholar]
- Hooper, P.; Lasher, J.; Alexander, K.S.; Baki, G. A New Modified Wetting Test and an Alternative Disintegration Test for Orally Disintegrating Tablets. J. Pharm. Biomed. Anal. 2016, 120, 391–396. [Google Scholar] [CrossRef]
- Sutthapitaksakul, L.; Thanawuth, K.; Huanbutta, K.; Sriamornsak, P. Effect of a Superdisintegrant on Disintegration of Orally Disintegrating Tablets Determined by Simulated Wetting Test and in Vitro Disintegration Test. Pharmazie 2022, 77, 287–290. [Google Scholar] [CrossRef]
- Pabari, R.M.; Ramtoola, Z. Effect of a Disintegration Mechanism on Wetting, Water Absorption, and Disintegration Time of Orodispersible Tablets. J. Young Pharm. 2012, 4, 157–163. [Google Scholar] [CrossRef]
- Farkas, D.; Madarász, L.; Nagy, Z.K.; Antal, I.; Kállai-Szabó, N. Image Analysis: A Versatile Tool in the Manufacturing and Quality Control of Pharmaceutical Dosage Forms. Pharmaceutics 2021, 13, 685. [Google Scholar] [CrossRef]
- Vilimi, Z.; Király, M.; Barna, Á.T.; Pápay, Z.E.; Budai, L.; Ludányi, K.; Kállai-Szabó, N.; Antal, I. Formulation of Emulgels Containing Clotrimazole for the Treatment of Vaginal Candidiasis. Gels 2024, 10, 730. [Google Scholar] [CrossRef] [PubMed]
- Council of Europe 2. 9.6. Uniformity of Content of Single-Dose Preparations. Eur. Pharmacopoeia 2024, 11, 4523. [Google Scholar]
- Fructuoso, I.; Romão, B.; Han, H.; Raposo, A.; Ariza-Montes, A.; Araya-Castillo, L.; Zandonadi, R.P. An Overview on Nutritional Aspects of Plant-Based Beverages Used as Substitutes for Cow’s Milk. Nutrients 2021, 13, 2650. [Google Scholar] [CrossRef] [PubMed]
- Jeske, S.; Zannini, E.; Arendt, E.K. Evaluation of Physicochemical and Glycaemic Properties of Commercial Plant-Based Milk Substitutes. Plant Foods Hum. Nutr. 2017, 72, 26–33. [Google Scholar] [CrossRef]
- Craig, W.J.; Fresán, U. International Analysis of the Nutritional Content and a Review of Health Benefits of Non-Dairy Plant-Based Beverages. Nutrients 2021, 13, 842. [Google Scholar] [CrossRef]
- Katidi, A.; Xypolitaki, K.; Vlassopoulos, A.; Kapsokefalou, M. Nutritional Quality of Plant-Based Meat and Dairy Imitation Products and Comparison with Animal-Based Counterparts. Nutrients 2023, 15, 401. [Google Scholar] [CrossRef]
- Präger, L.; Simon, J.C.; Treudler, R. Food Allergy—New Risks through Vegan Diet? Overview of New Allergen Sources and Current Data on the Potential Risk of Anaphylaxis. JDDG J. Der Dtsch. Dermatol. Ges. 2023, 21, 1308–1313. [Google Scholar] [CrossRef]
- Daszkiewicz, T.; Florek, M.; Murawska, D.; Jabłońska, A. A Comparison of the Quality of UHT Milk and Its Plant-Based Analogs. J. Dairy Sci. 2024, 107, 10299–10309. [Google Scholar] [CrossRef]
- Bodor, Z.; Benedek, C.; Behling, H.; Kovacs, Z. Fusion of Electronic Tongue and NIRS for the Detection of Heat Treatment of Honey. LWT 2023, 186, 115219. [Google Scholar] [CrossRef]
- Podrażka, M.; Bączyńska, E.; Kundys, M.; Jeleń, P.S.; Witkowska Nery, E. Electronic Tongue—A Tool for All Tastes? Biosensors 2017, 8, 3. [Google Scholar] [CrossRef]
- Kazsoki, A.; Palcsó, B.; Omer, S.M.; Kovacs, Z.; Zelkó, R. Formulation of Levocetirizine-Loaded Core–Shell Type Nanofibrous Orally Dissolving Webs as a Potential Alternative for Immediate Release Dosage Forms. Pharmaceutics 2022, 14, 1442. [Google Scholar] [CrossRef] [PubMed]
- Kovacs, Z.; Szöllősi, D.; Zaukuu, J.-L.Z.; Bodor, Z.; Vitális, F.; Aouadi, B.; Zsom-Muha, V.; Gillay, Z. Factors Influencing the Long-Term Stability of Electronic Tongue and Application of Improved Drift Correction Methods. Biosensors 2020, 10, 74. [Google Scholar] [CrossRef] [PubMed]
- Németh, D.; Balázs, G.; Daood, H.G.; Kovács, Z.; Bodor, Z.; Zinia Zaukuu, J.-L.; Szentpéteri, V.; Kókai, Z.; Kappel, N. Standard Analytical Methods, Sensory Evaluation, NIRS and Electronic Tongue for Sensing Taste Attributes of Different Melon Varieties. Sensors 2019, 19, 5010. [Google Scholar] [CrossRef] [PubMed]
- Imam, M.; Nagpal, K. The Electronic Tongue: An Advanced Taste-Sensing Multichannel Sensory Tool with Global Selectivity for Application in the Pharmaceutical and Food Industry. Pharm. Dev. Technol. 2023, 28, 318–332. [Google Scholar] [CrossRef]


| g/100 mL | Milk | Formula | Plant-Based Drinks | ||||||
|---|---|---|---|---|---|---|---|---|---|
| LFM | M3.5 | M1.5 | F | S | H | R | C | A | |
| Energy (kcal) | 44 | 62 | 44 | 151 | 39 | 29 | 47 | 20 | 24 |
| Fat | 1.50 | 3.50 | 1.50 | 5.00 | 1.80 | 1.60 | 1.00 | 0.80 | 1.10 |
| - Saturated fatty acid | 1.00 | 2.30 | 1.00 | 0.60 | 0.30 | 0.20 | 0.10 | 0.80 | 0.10 |
| Carbohydrates | 4.70 | 4.70 | 4.70 | 15.60 | 2.50 | 3.20 | 9.50 | 2.70 | 2.70 |
| - Sugar | 4.70 | 4.70 | 4.70 | 9.70 | 2.50 | 3.20 | 3.30 | 1.90 | 2.40 |
| Fibre | n.s. | n.s. | n.s. | 0.70 | 0.50 | 0.30 | 0.00 | 0.10 | 0.30 |
| Protein | 3.00 | 3.00 | 3.00 | 9.80 | 3.00 | 0.40 | 0.10 | 0.10 | 0.50 |
| Salt | 0.13 | 0.13 | 0.13 | 0.12 | 0.09 | 0.14 | 0.09 | 0.13 | 0.15 |
| Vitamin | n.s. | n.s. | n.s. | * | n.s. | n.s. | n.s. | n.s. | n.s. |
| - ergocalciferol (μg) | n.s. | n.s. | n.s. | n.s. | 0.75 | 0.75 | 0.75 | 0.75 | 0.75 |
| - α-tocopherol (mg) | n.s. | n.s. | n.s. | 2.3 | n.s. | 1.8 | n.s. | n.s. | n.s. |
| - riboflavin (mg) | n.s. | n.s. | n.s. | 0.31 | 0.21 | 0.21 | n.s. | n.s. | 1.8 |
| - Cyanocobalamin (μg) | n.s. | n.s. | n.s. | 0.12 | 0.38 | 0.38 | 0.38 | 0.38 | 0.38 |
| Minerals | n.s. | n.s. | n.s. | ** | n.s. | n.s. | n.s. | n.s. | n.s. |
| - Calcium (mg) | 120 | 120 | 120 | 280 | 120 | 120 | 120 | 120 | 120 |
| Code Name | Mass (mg) (n = 20; avg ± SD) | Water Content (%) (n = 5; avg ± SD) | Disintegration Time (s) (n = 6; avg ± SD) |
|---|---|---|---|
| LFM | 161 ± 4.2 | 3.23 ± 0.514 | 35.5 ± 16.57 |
| M3.5 | 189 ± 9.8 | 3.53 ± 0.413 | 74.7 ± 24.22 |
| M1.5 | 155 ± 4.6 | 4.34 ± 0.336 | 21.3 ± 6.53 |
| F | 473 ± 12.2 | 4.17 ± 0.306 | 300 ± 0.00 |
| S | 135 ± 4.0 | 4.15 ± 0.496 | 12.7 ± 5.89 |
| H | 87 ± 4.7 | 3.59 ± 0.454 | 8.7 ± 3.50 |
| C | 66 ± 1.0 | 3.19 ± 0.599 | 14.0 ± 9.63 |
| R | 160 ± 3.3 | 3.01 ± 0.455 | 3.3 ± 1.63 |
| A | 76 ± 2.5 | 3.52 ± 0.105 | 26.5 ± 9.95 |
| ODT Type | ||||||
|---|---|---|---|---|---|---|
| M1.5 | LFM | S | H | C | ||
| Sample number | 1 | 102.31 ± 0.421 | 96.98 ± 0.332 | 107.68 ± 0.942 | 105.84 ± 0.159 | 98.39 ± 0.438 |
| 2 | 101.15 ± 0.367 | 94.29 ± 0.321 | 100.57 ± 0.137 | 95.64 ± 1.566 | 101.15 ± 0.367 | |
| 3 | 105.33 ± 0.733 | 97.55 ± 0.475 | 96.64 ± 0.808 | 97.98 ± 0.219 | 103.2 ± 0.178 | |
| 4 | 107.89 ± 1.755 | 93.79 ± 0.327 | 105.45 ± 0.626 | 101.81 ± 0.161 | 107.45 ± 0.784 | |
| 5 | 85.02 ± 1.143 | 94.35 ± 0.643 | 101.21 ± 0.501 | 100.65 ± 1.614 | 92.91 ± 1.363 | |
| 6 | 100.2 ± 0.369 | 90.38 ± 0.427 | 94.96 ± 1.132 | 99.82 ± 0.855 | 107.87 ± 0.888 | |
| 7 | 95.39 ± 0.467 | 92.08 ± 0.018 | 95.74 ± 0.548 | 105.55 ± 3.854 | 100.35 ± 0.237 | |
| 8 | 99.46 ± 0.513 | 101.84 ± 1.030 | 91.77 ± 0.589 | 92.92 ± 0.134 | 99.98 ± 0.155 | |
| 9 | 97.2 ± 0.279 | 88.29 ± 0.449 | 102.83 ± 0.477 | 97.98 ± 0.219 | 94.29 ± 0.944 | |
| 10 | 106.04 ± 1.455 | 90.85 ± 0.071 | 103.15 ± 1.508 | 101.81 ± 0.161 | 98.38 ± 0.209 | |
| Minimum % | 85.02 | 88.29 | 91.77 | 92.92 | 92.91 | |
| Maximum % | 107.89 | 101.84 | 107.68 | 105.84 | 107.87 | |
| QC | Accuracy | 97.72 | 100.76 | 104.48 | 96.07 | 101.29 |
| Precision | 2.83 | 0.92 | 1.56 | 3.77 | 1.37 | |
| R2 value | 0.9992 | 0.9945 | 0.9992 | 0.9998 | 0.9996 | |
Disclaimer/Publisher’s Note: The statements, opinions and data contained in all publications are solely those of the individual author(s) and contributor(s) and not of MDPI and/or the editor(s). MDPI and/or the editor(s) disclaim responsibility for any injury to people or property resulting from any ideas, methods, instructions or products referred to in the content. |
© 2025 by the authors. Licensee MDPI, Basel, Switzerland. This article is an open access article distributed under the terms and conditions of the Creative Commons Attribution (CC BY) license (https://creativecommons.org/licenses/by/4.0/).
Share and Cite
Demeter, A.K.; Farkas, D.; Király, M.; Kovács, Z.; Ludányi, K.; Antal, I.; Kállai-Szabó, N. Study on Lyophilised Orodispersible Tablets from Plant-Based Drinks as Bulking Agents. Pharmaceutics 2025, 17, 195. https://doi.org/10.3390/pharmaceutics17020195
Demeter AK, Farkas D, Király M, Kovács Z, Ludányi K, Antal I, Kállai-Szabó N. Study on Lyophilised Orodispersible Tablets from Plant-Based Drinks as Bulking Agents. Pharmaceutics. 2025; 17(2):195. https://doi.org/10.3390/pharmaceutics17020195
Chicago/Turabian StyleDemeter, Adrienn Katalin, Dóra Farkas, Márton Király, Zoltán Kovács, Krisztina Ludányi, István Antal, and Nikolett Kállai-Szabó. 2025. "Study on Lyophilised Orodispersible Tablets from Plant-Based Drinks as Bulking Agents" Pharmaceutics 17, no. 2: 195. https://doi.org/10.3390/pharmaceutics17020195
APA StyleDemeter, A. K., Farkas, D., Király, M., Kovács, Z., Ludányi, K., Antal, I., & Kállai-Szabó, N. (2025). Study on Lyophilised Orodispersible Tablets from Plant-Based Drinks as Bulking Agents. Pharmaceutics, 17(2), 195. https://doi.org/10.3390/pharmaceutics17020195