Author Contributions
Conceptualization, A.B. and F.A.B.; methodology, F.F.E.-S. and M.S.I.; software, Y.A.M.M.E.; validation, Y.A.M.M.E. and A.M.A.-M.; formal analysis, F.F.E.-S., M.S.I. and E.A.M.; investigation, F.F.E.-S., M.S.I. and E.A.M.; resources, A.B. and F.A.B.; data curation, All.; writing—original draft preparation, All; writing—review and editing, All.; visualization, A.M.A.-M.; supervision, A.B. and F.A.B.; funding acquisition, A.B. All authors have read and agreed to the published version of the manuscript.
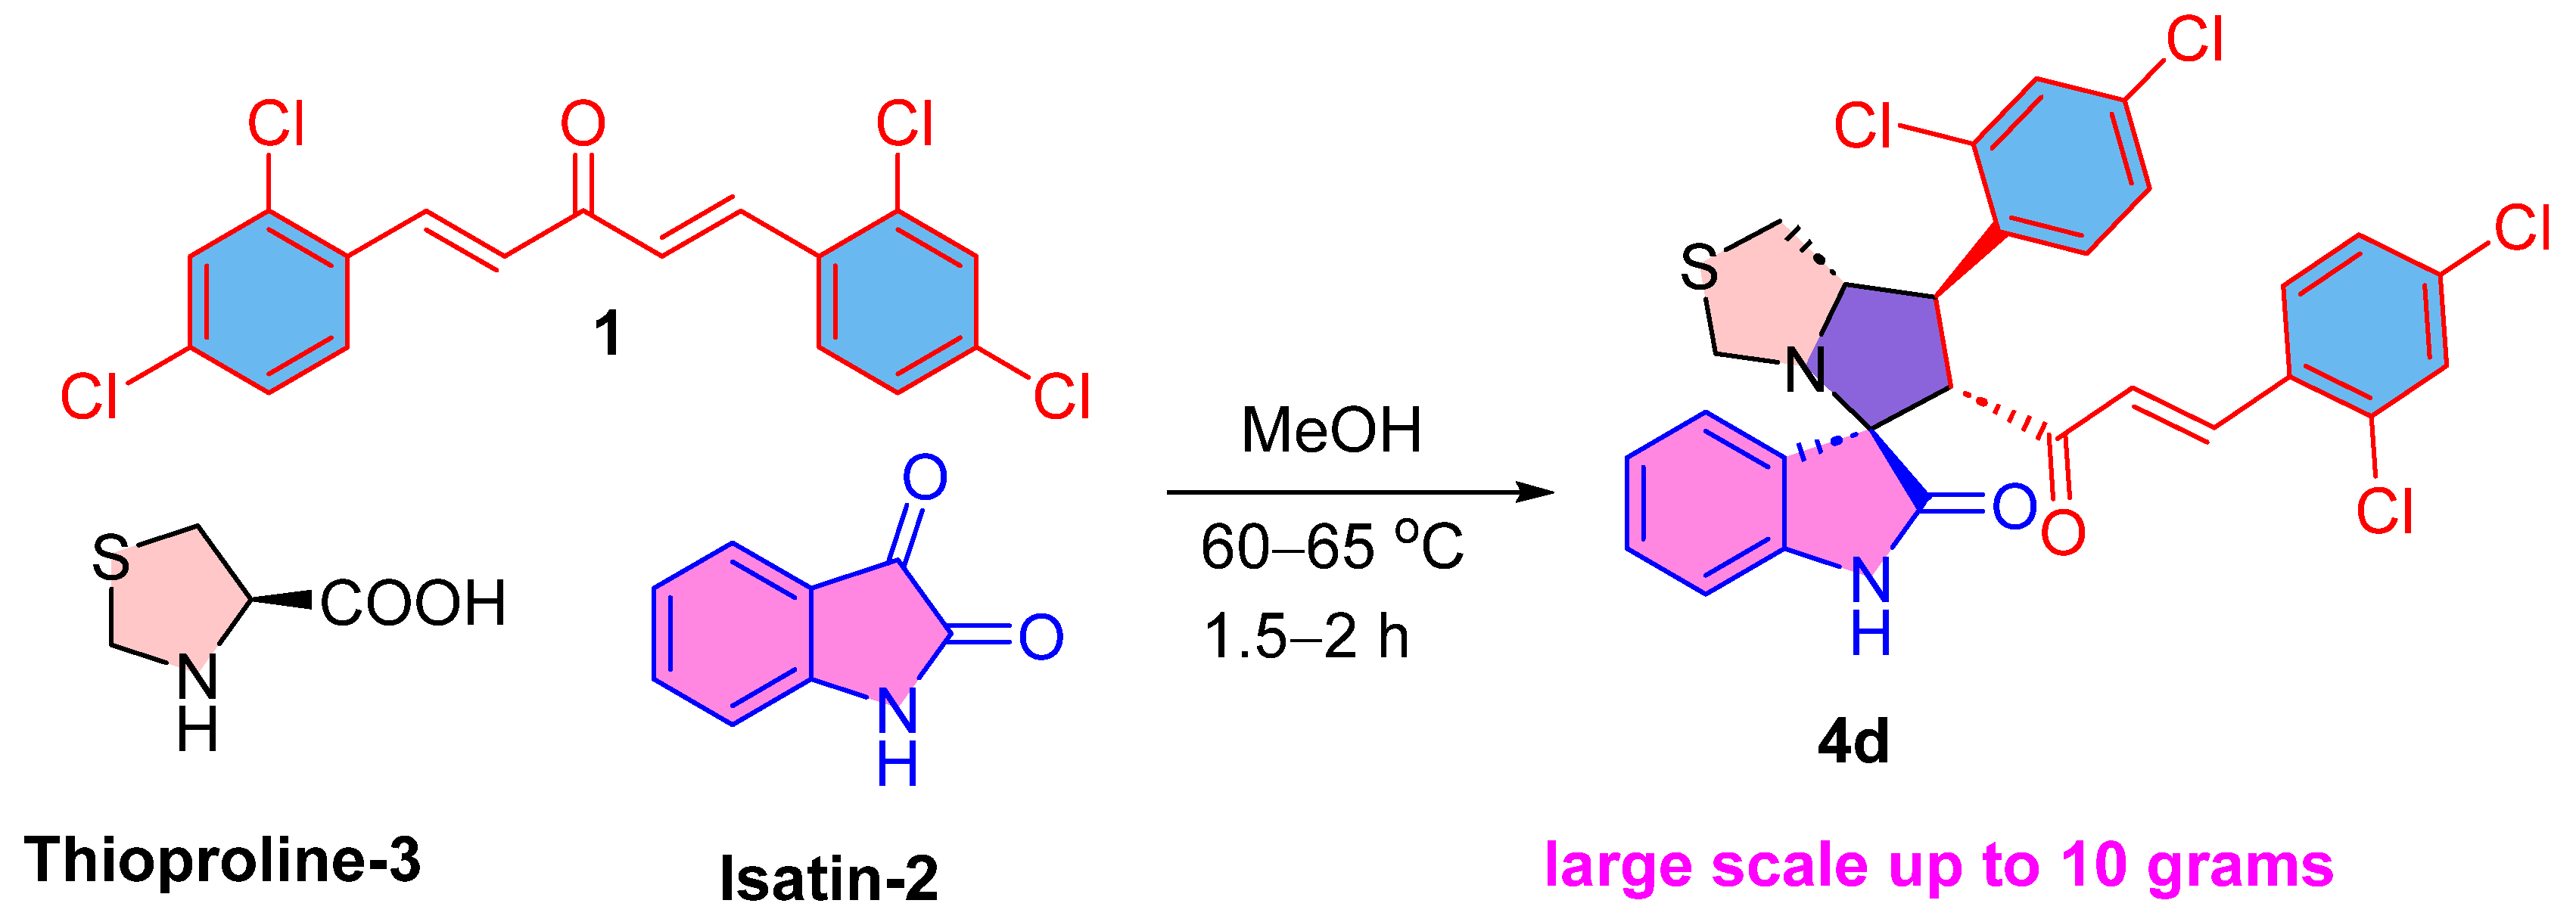
Scheme 1.
The synthesis of drug candidate 4d.
Scheme 1.
The synthesis of drug candidate 4d.
Figure 1.
H&E staining of normal liver showed normal liver architecture with normal liver cells and lobules in all tested groups: (A) 10% DMSO, (B) 50 mg/kg compound 4d, (C,D) 200 mg/kg compound 4d. Compound 4d did not cause any morphological changes in hepatic cells (×200).
Figure 1.
H&E staining of normal liver showed normal liver architecture with normal liver cells and lobules in all tested groups: (A) 10% DMSO, (B) 50 mg/kg compound 4d, (C,D) 200 mg/kg compound 4d. Compound 4d did not cause any morphological changes in hepatic cells (×200).
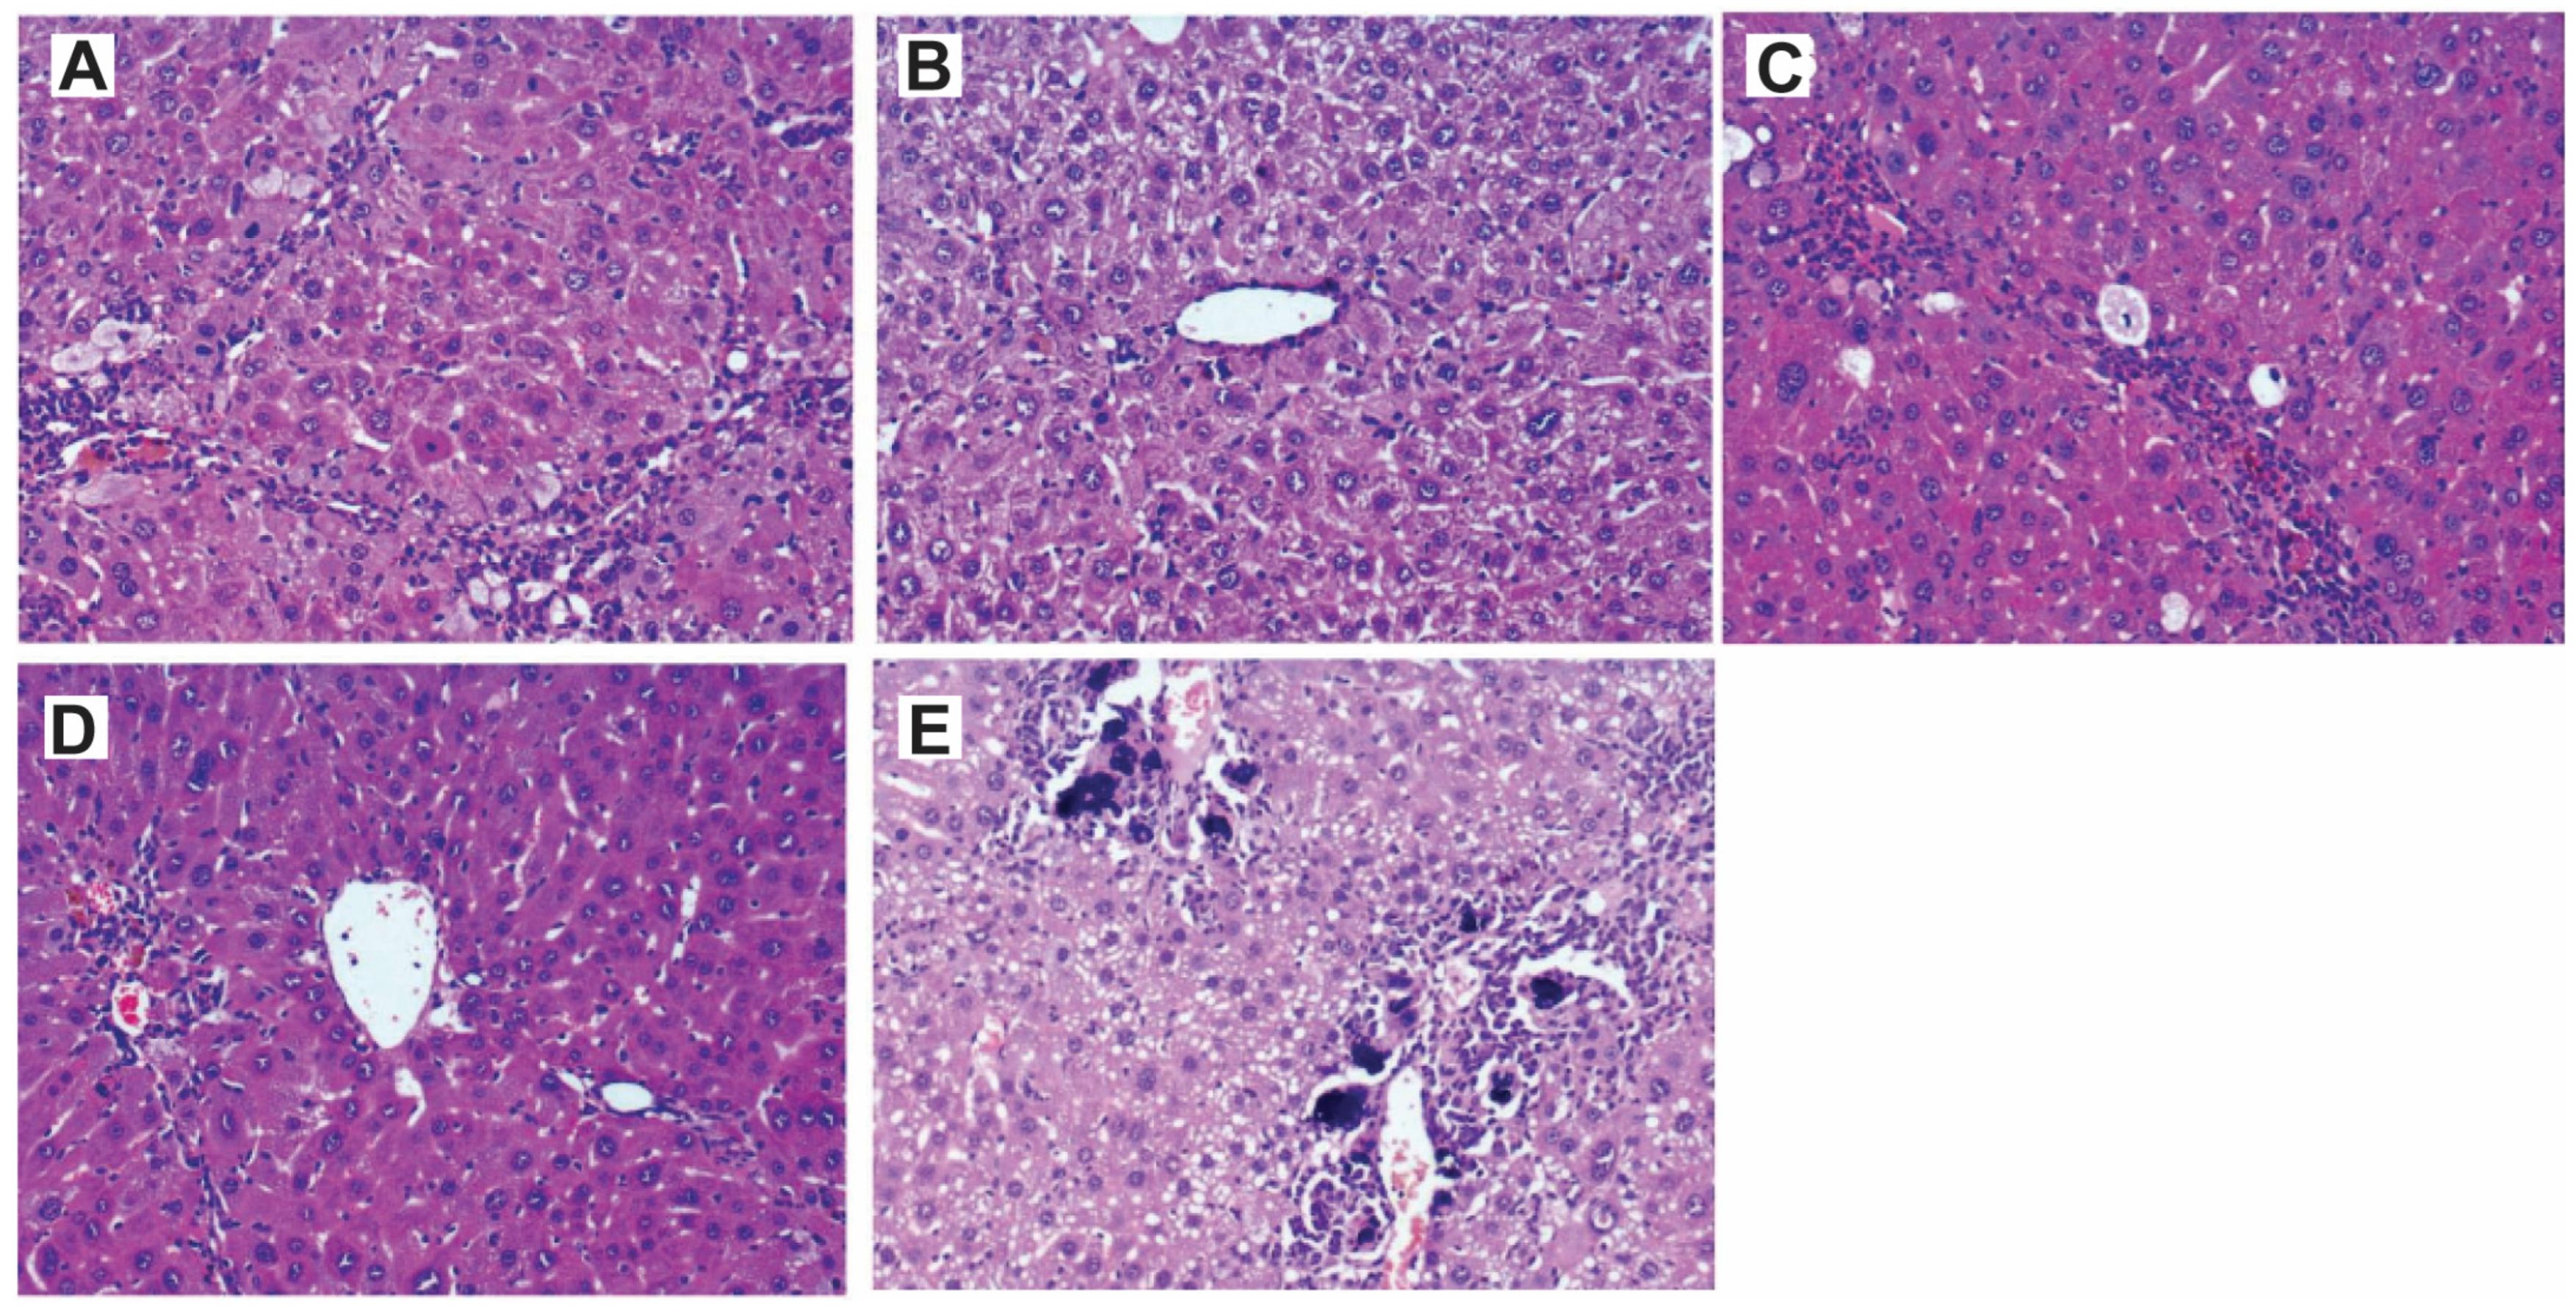
Figure 2.
H&E staining of liver tissues showing the efficacy of compound 4d in ameliorating the liver damage caused by CCl4 treatment. (A) Slides for CCl4-treated mice showed large cell dysplasia (premalignant). The liver architecture was disturbed, and there were cirrhotic nodules with bridging fibrosis. (B) Slides showed preserved liver architecture of the group treated with 50 mg/kg/daily for 14 days with mild inflammatory cellular infiltrate in portal tracts, and the liver cells showed no nuclear changes and no mitotic activity. (C) The group treated with one dose of 200 mg/kg for 6 h, the same histopathological pattern of (A) with anisonucleosis (nuclei vary in size) and minimal mitotic activity. (D) The group treated with a single dose of 200 mg/kg for 24 h showed mild inflammatory cellular infiltrate in portal tracts and the nuclei showed minimal anisonucleosis and lower mitotic activity. (E) The group treated with a single dose of 200 mg/kg for 48 h showed cirrhotic nodules with bridging fibrosis and intense inflammatory cellular infiltrate in portal tracts. The liver cells showed microvascular steatosis with numerous calcification foci were present in the portal tracts. The mitotic activity was low (HE, ×: 100).
![Pharmaceutics 17 00093 g002 Pharmaceutics 17 00093 g002]()
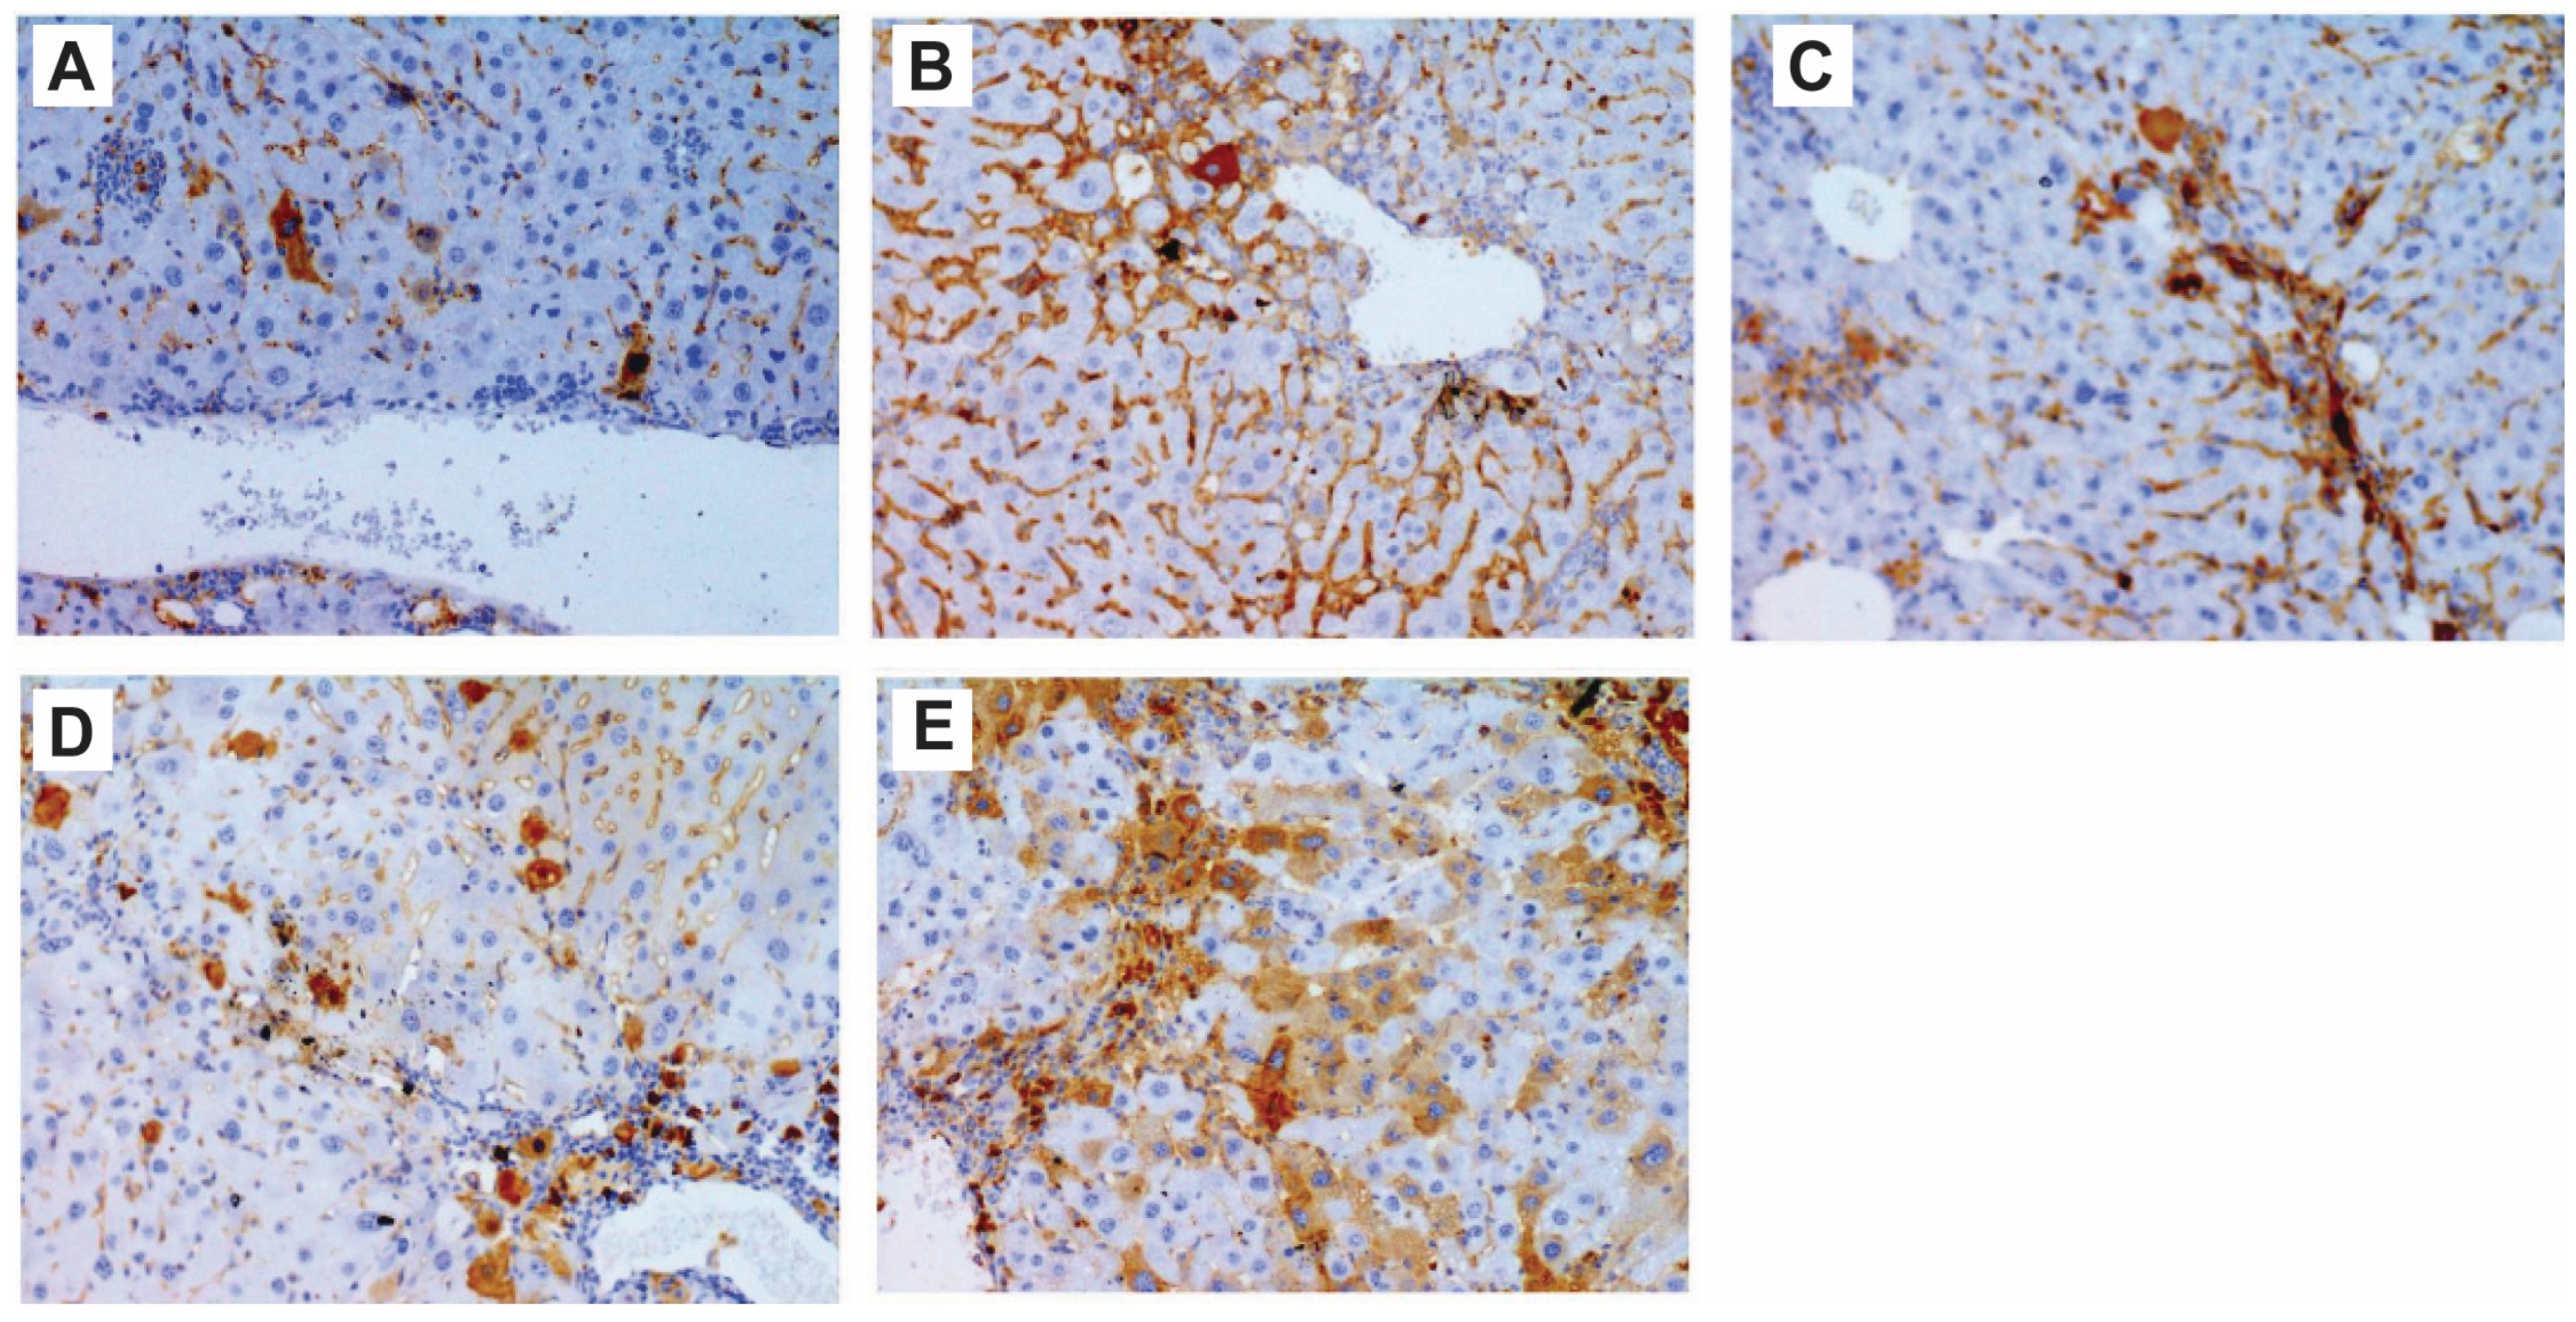
Figure 3.
Immunohistochemistry showing activation of p53 after compound 4d treatment in CCl4-treated mice. (A) Group treated with CCl4 showed low level of p53, while (B) group treated daily with low dose of compound 4d for 14 days showed higher level of detected p53 in liver sections. (C) Group treated with one dose of 200 mg/kg for 6 h. (D) Group treated with one dose of 200 mg/kg for 24 h. (E) Group treated with one dose of 200 mg/kg for 48 h. (C–E) groups showed activation of p53 in a time-dependent manner (200×).
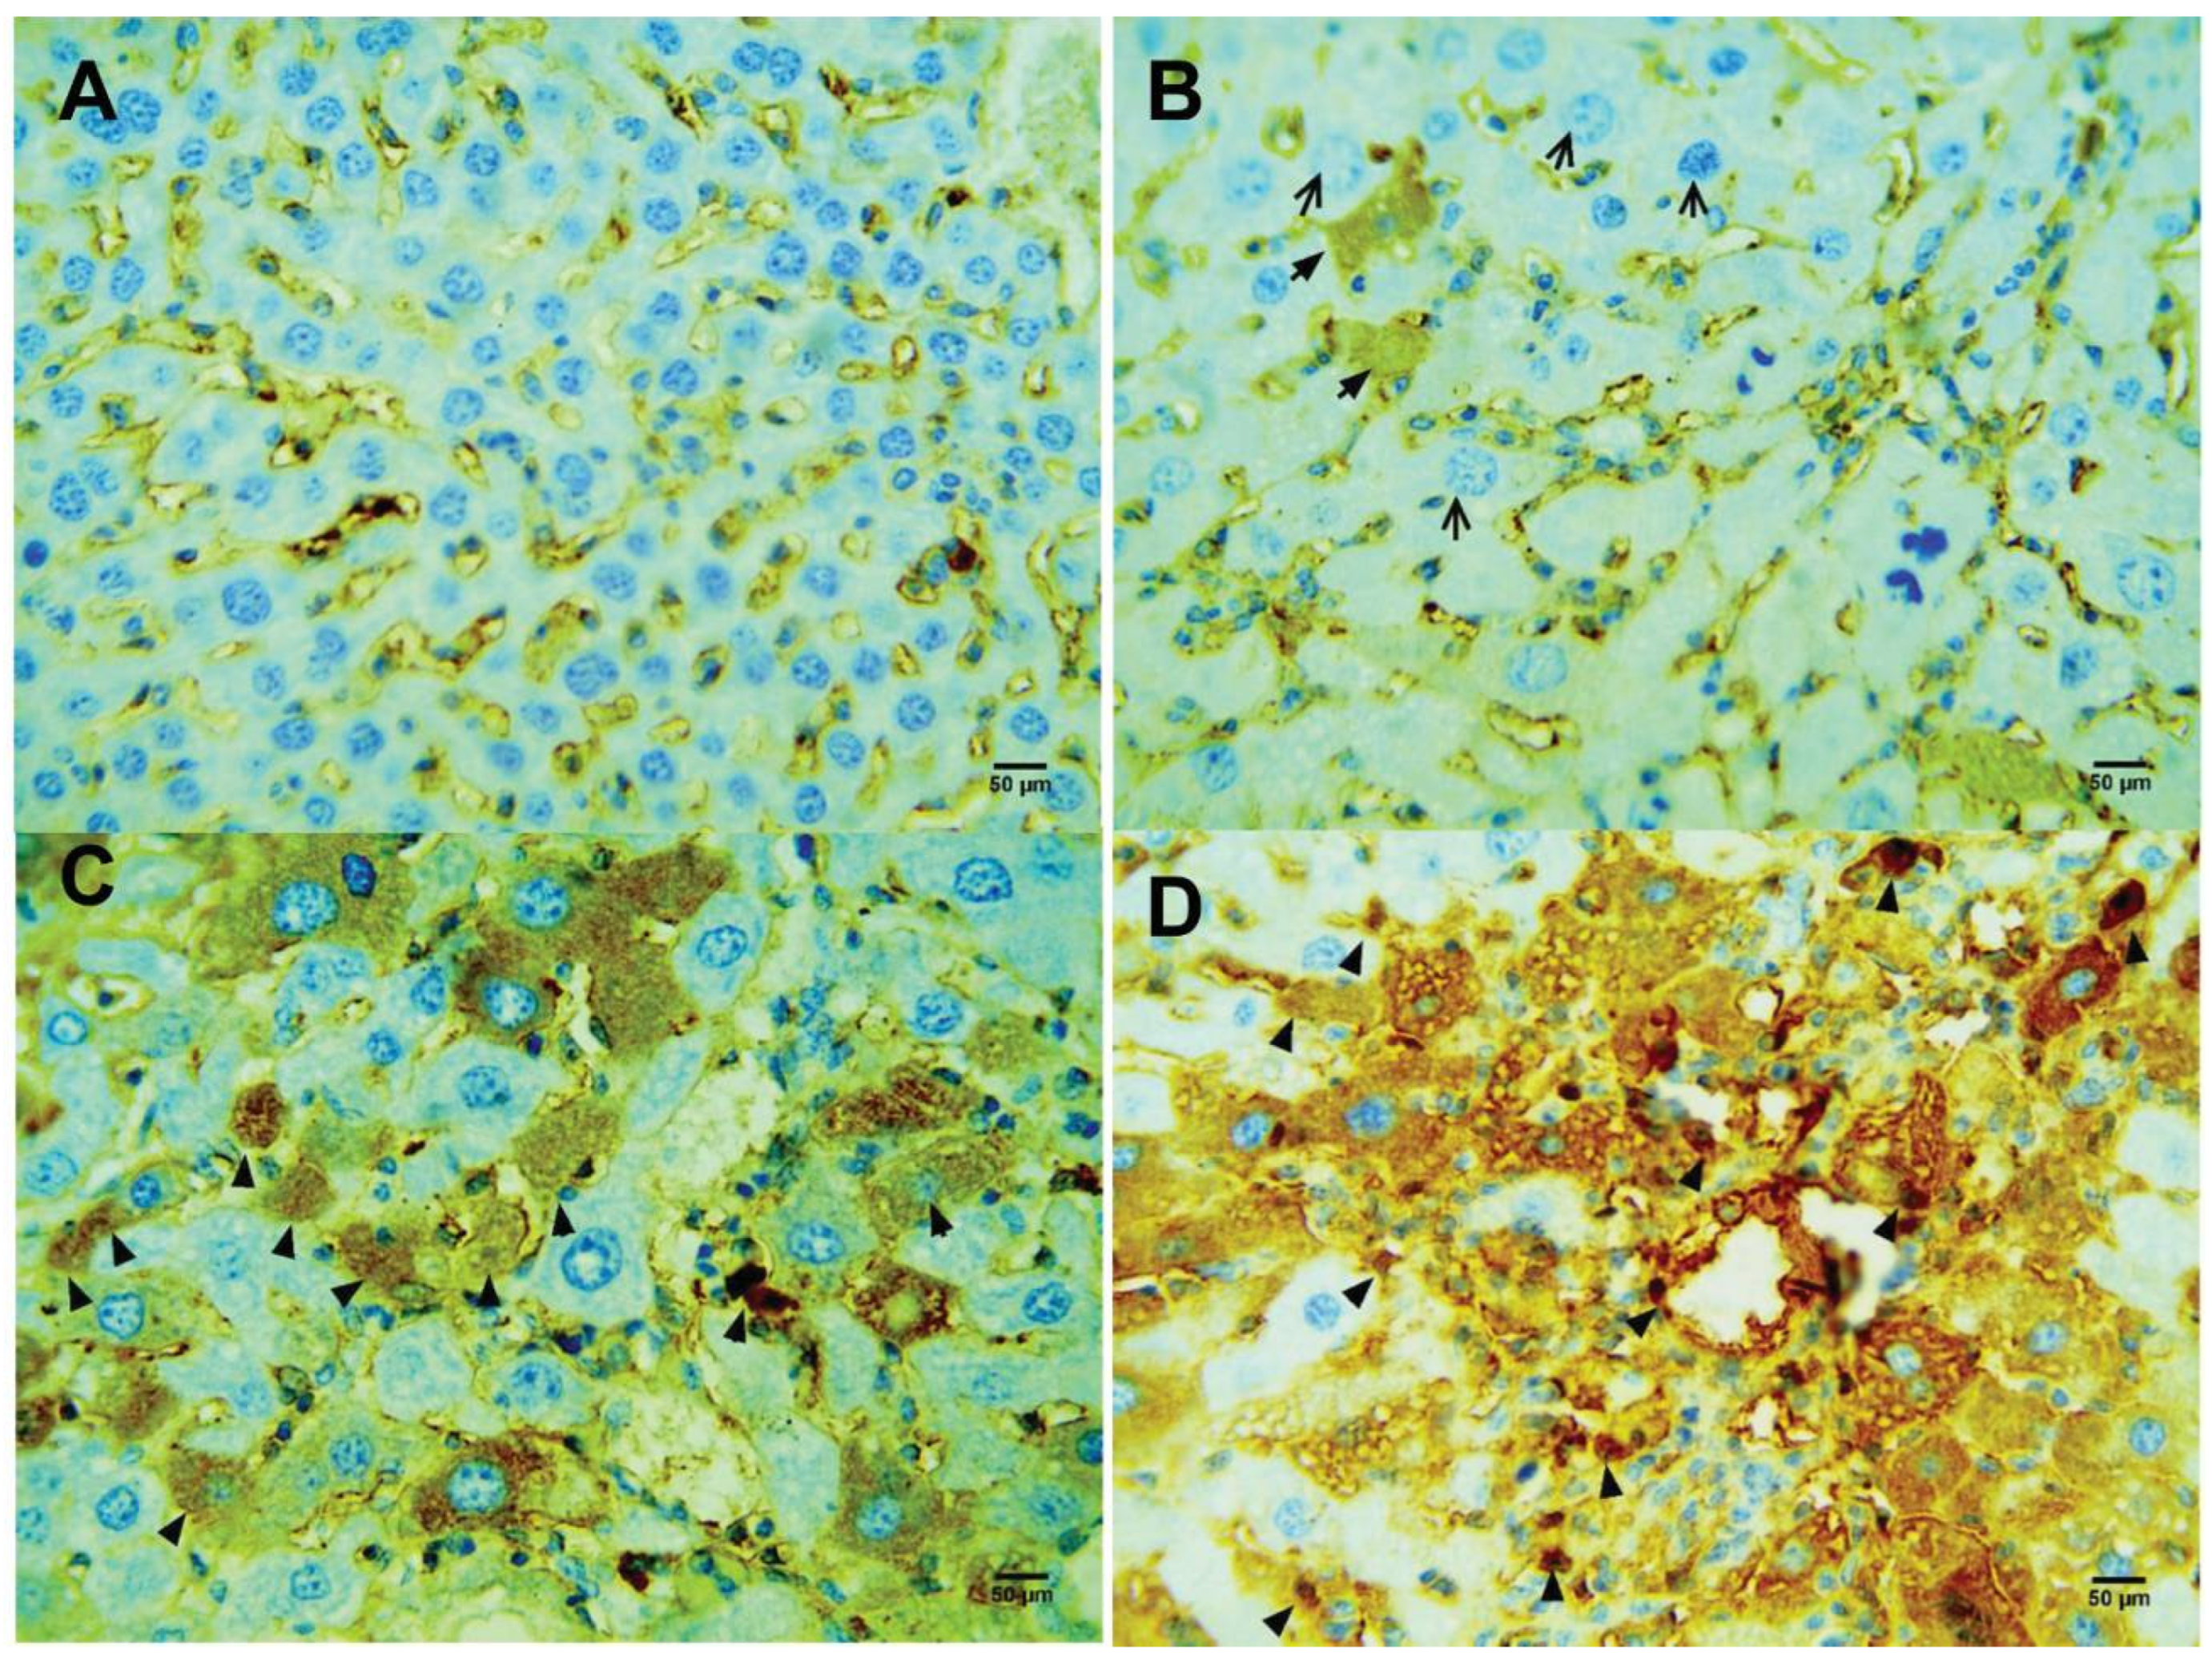
Figure 4.
Compound 4d induced activation of caspase 3 (black arrow). (A) Control healthy mice. (B) CCl4-treated mice. (C) CCl4-treated mic treated with 50 mg/kg/14 d. (D) CCl4-treated mice treated with 200 mg/kg/48 h.
Figure 4.
Compound 4d induced activation of caspase 3 (black arrow). (A) Control healthy mice. (B) CCl4-treated mice. (C) CCl4-treated mic treated with 50 mg/kg/14 d. (D) CCl4-treated mice treated with 200 mg/kg/48 h.
Figure 5.
Compound 4d increased the level of proliferative index Ki-67 (black arrow). (A) Control healthy mice. (B) CCl4-treated mice. (C) CCl4-treated mic treated with 50 mg/kg/14 d. (D) CCl4-treated mice treated with 200 mg/kg/48 h.
Figure 5.
Compound 4d increased the level of proliferative index Ki-67 (black arrow). (A) Control healthy mice. (B) CCl4-treated mice. (C) CCl4-treated mic treated with 50 mg/kg/14 d. (D) CCl4-treated mice treated with 200 mg/kg/48 h.
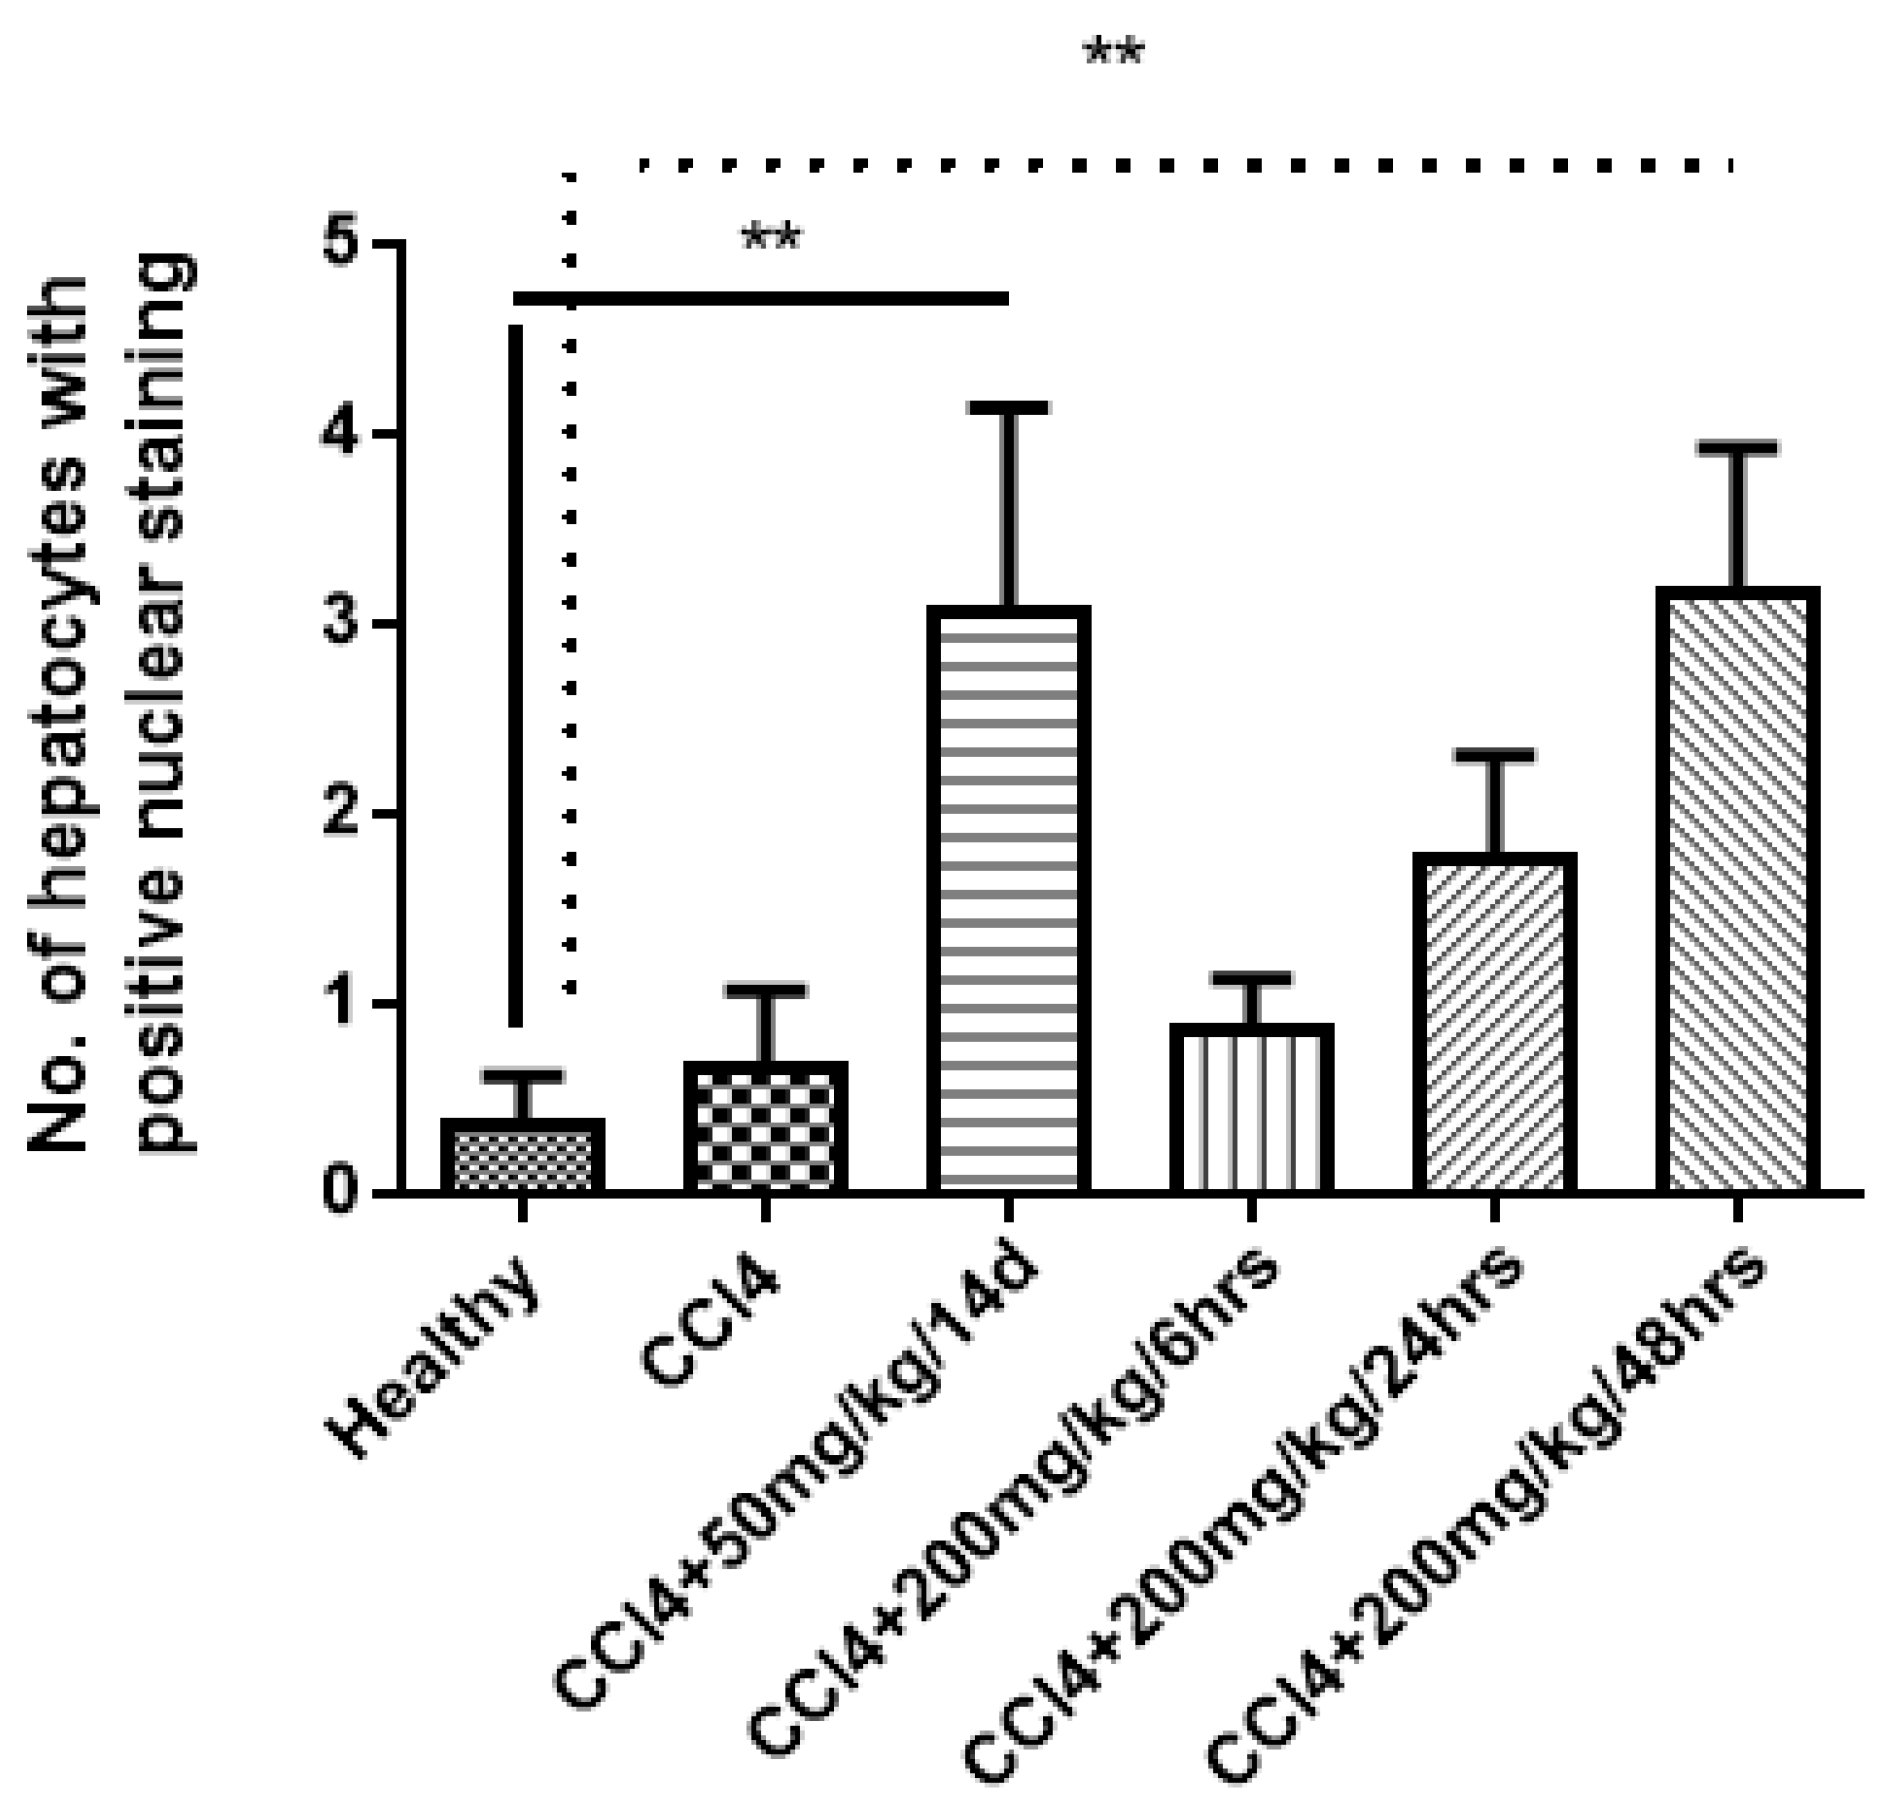
Figure 6.
Significant increase in Ki-67 nuclear staining in hepatocytes after treatment of mice with compound 4d. Statistical analysis was performed by one-way analysis of variance (ANOVA) with Duncan’s multiple comparisons of the means to compare difference between means. ** p value < 0.05 is considered significant.
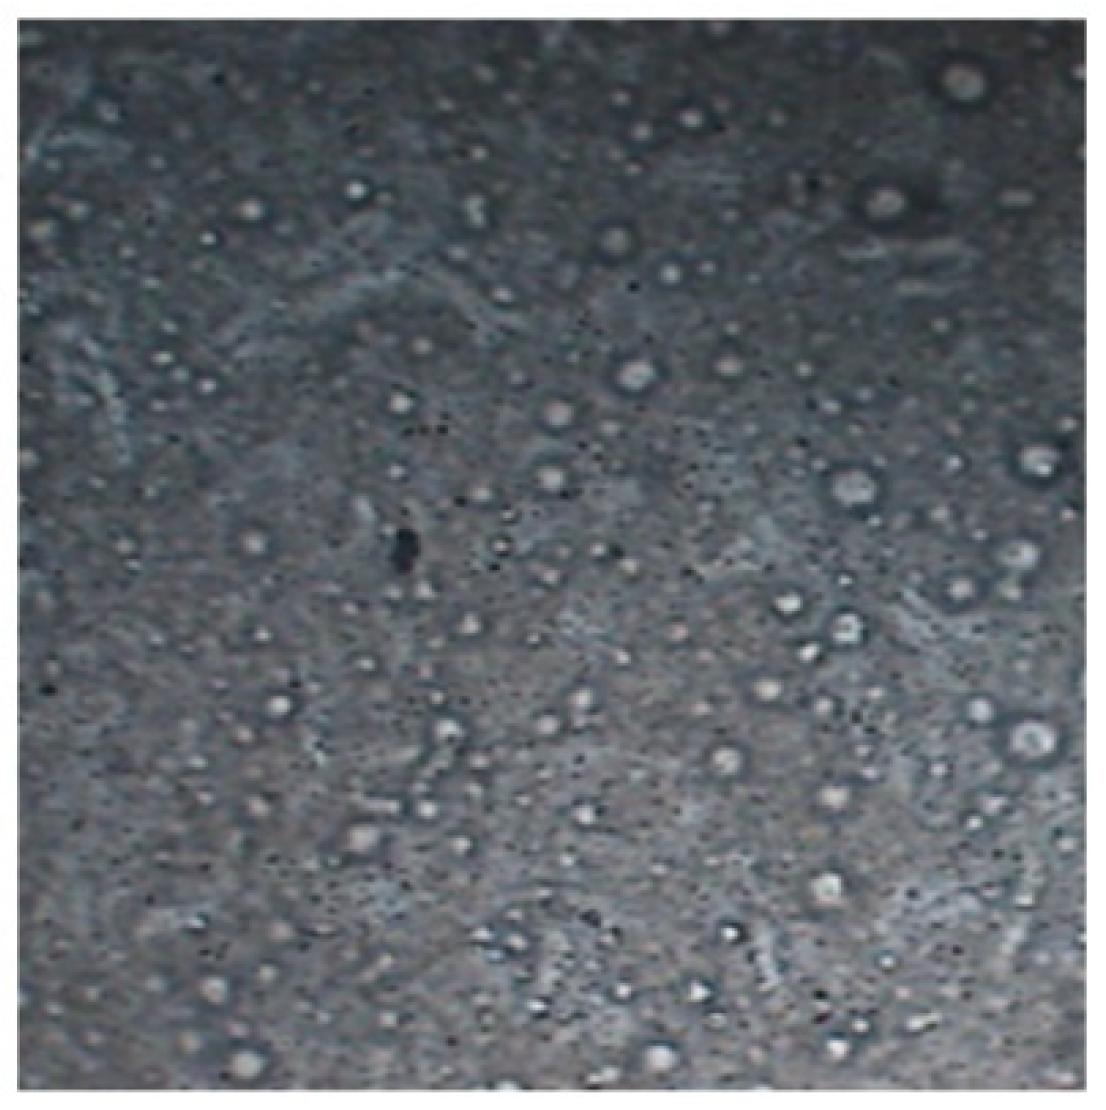
Figure 7.
Optical photomicrograph of 4d-loaded proniosomes after hydration at 25 °C with magnification of (40×).
Figure 7.
Optical photomicrograph of 4d-loaded proniosomes after hydration at 25 °C with magnification of (40×).
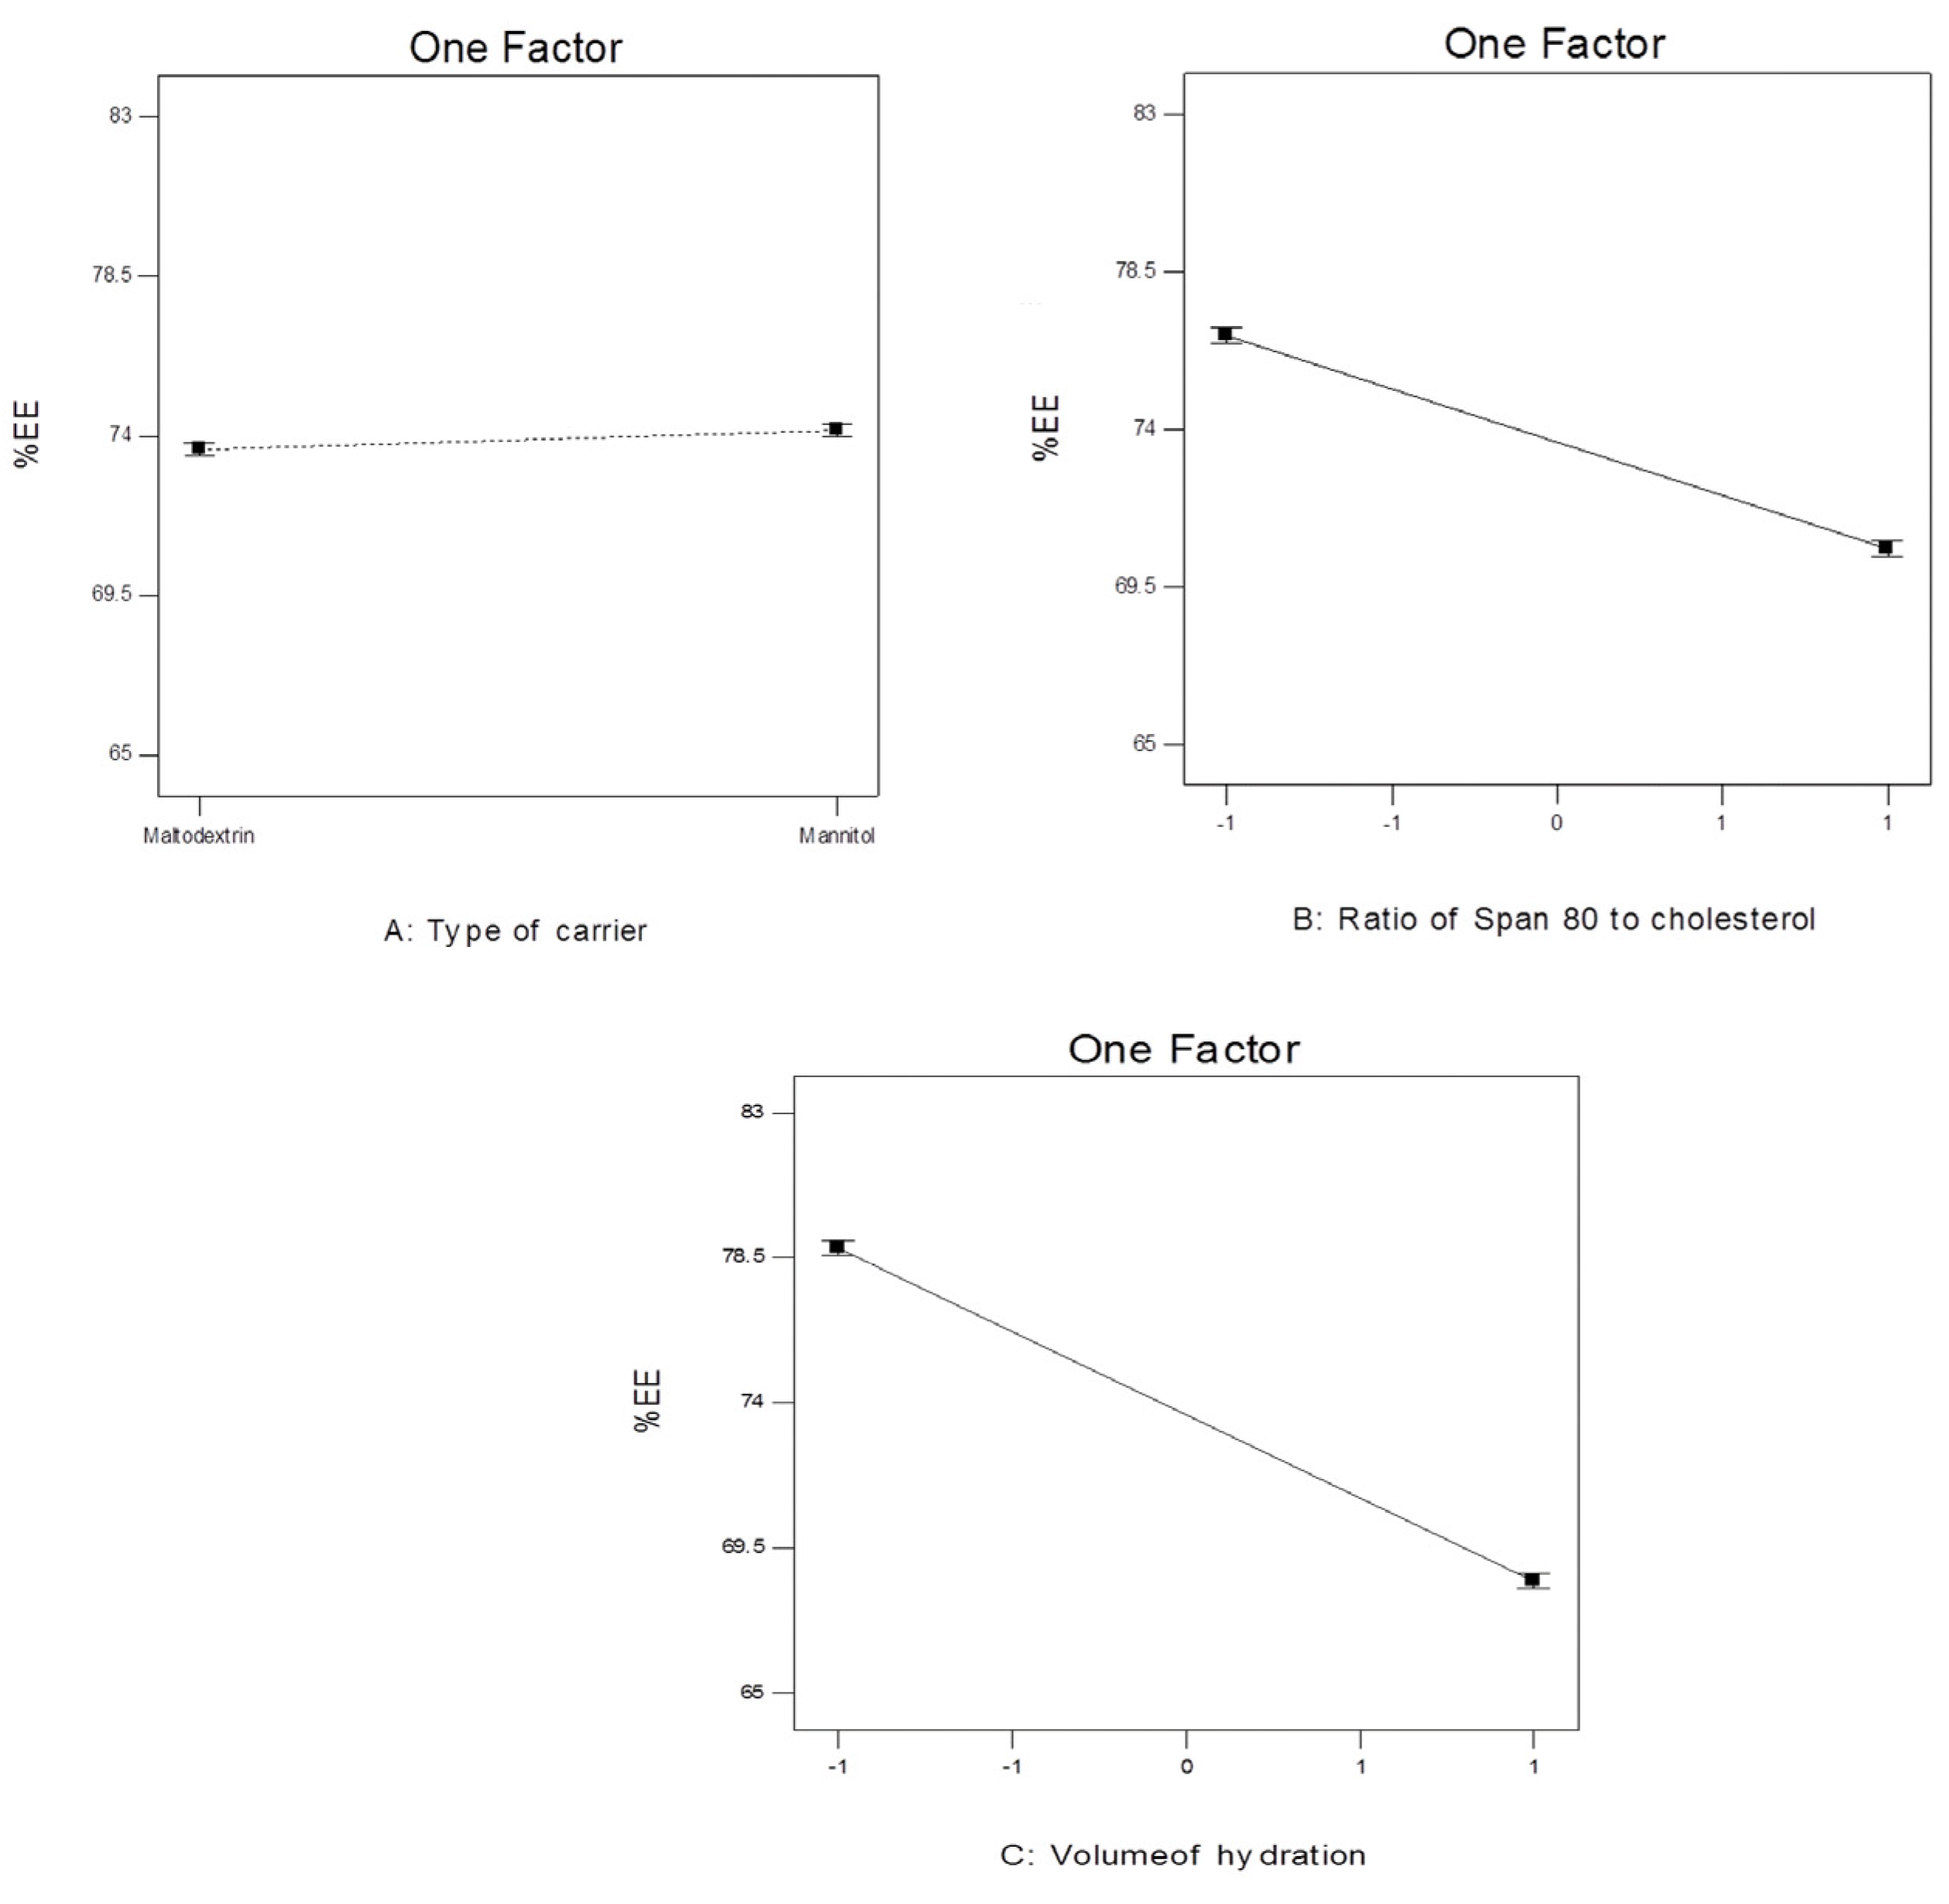
Figure 8.
The effect of different independent variables on EE% of 4d-loaded proniosomes.
Figure 8.
The effect of different independent variables on EE% of 4d-loaded proniosomes.
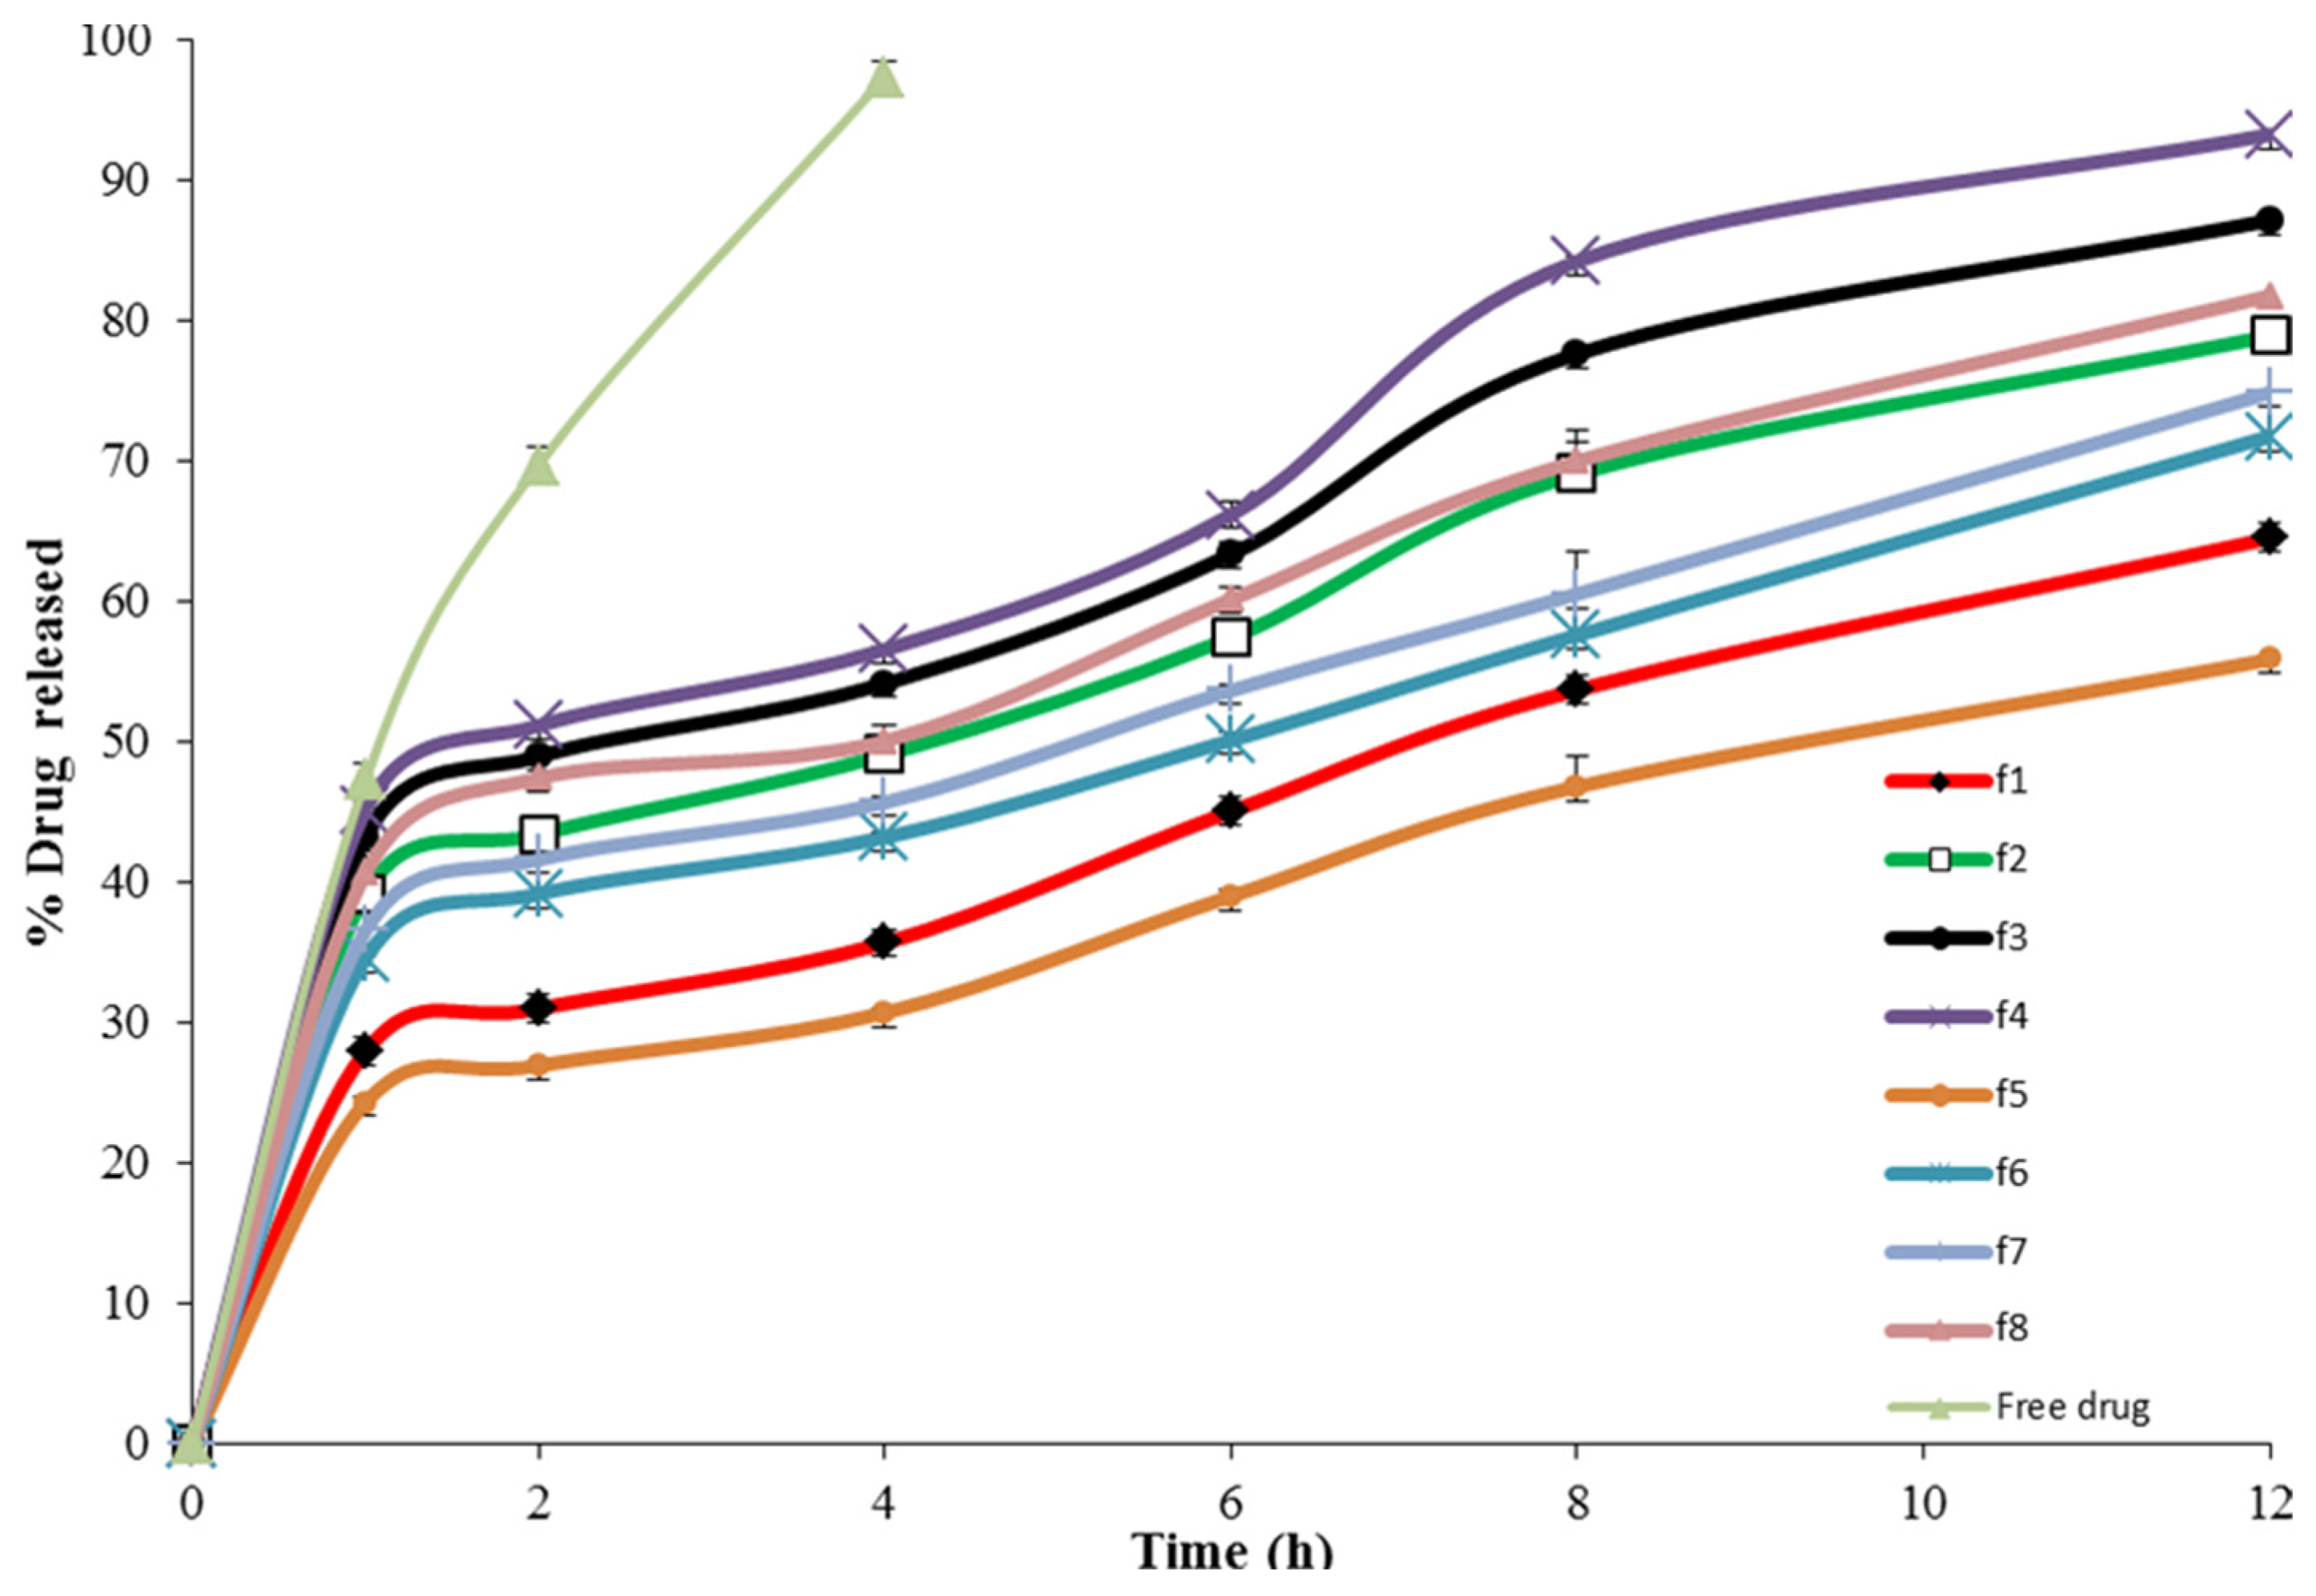
Figure 9.
In vitro release of 4d-loaded proniosomes.
Figure 9.
In vitro release of 4d-loaded proniosomes.
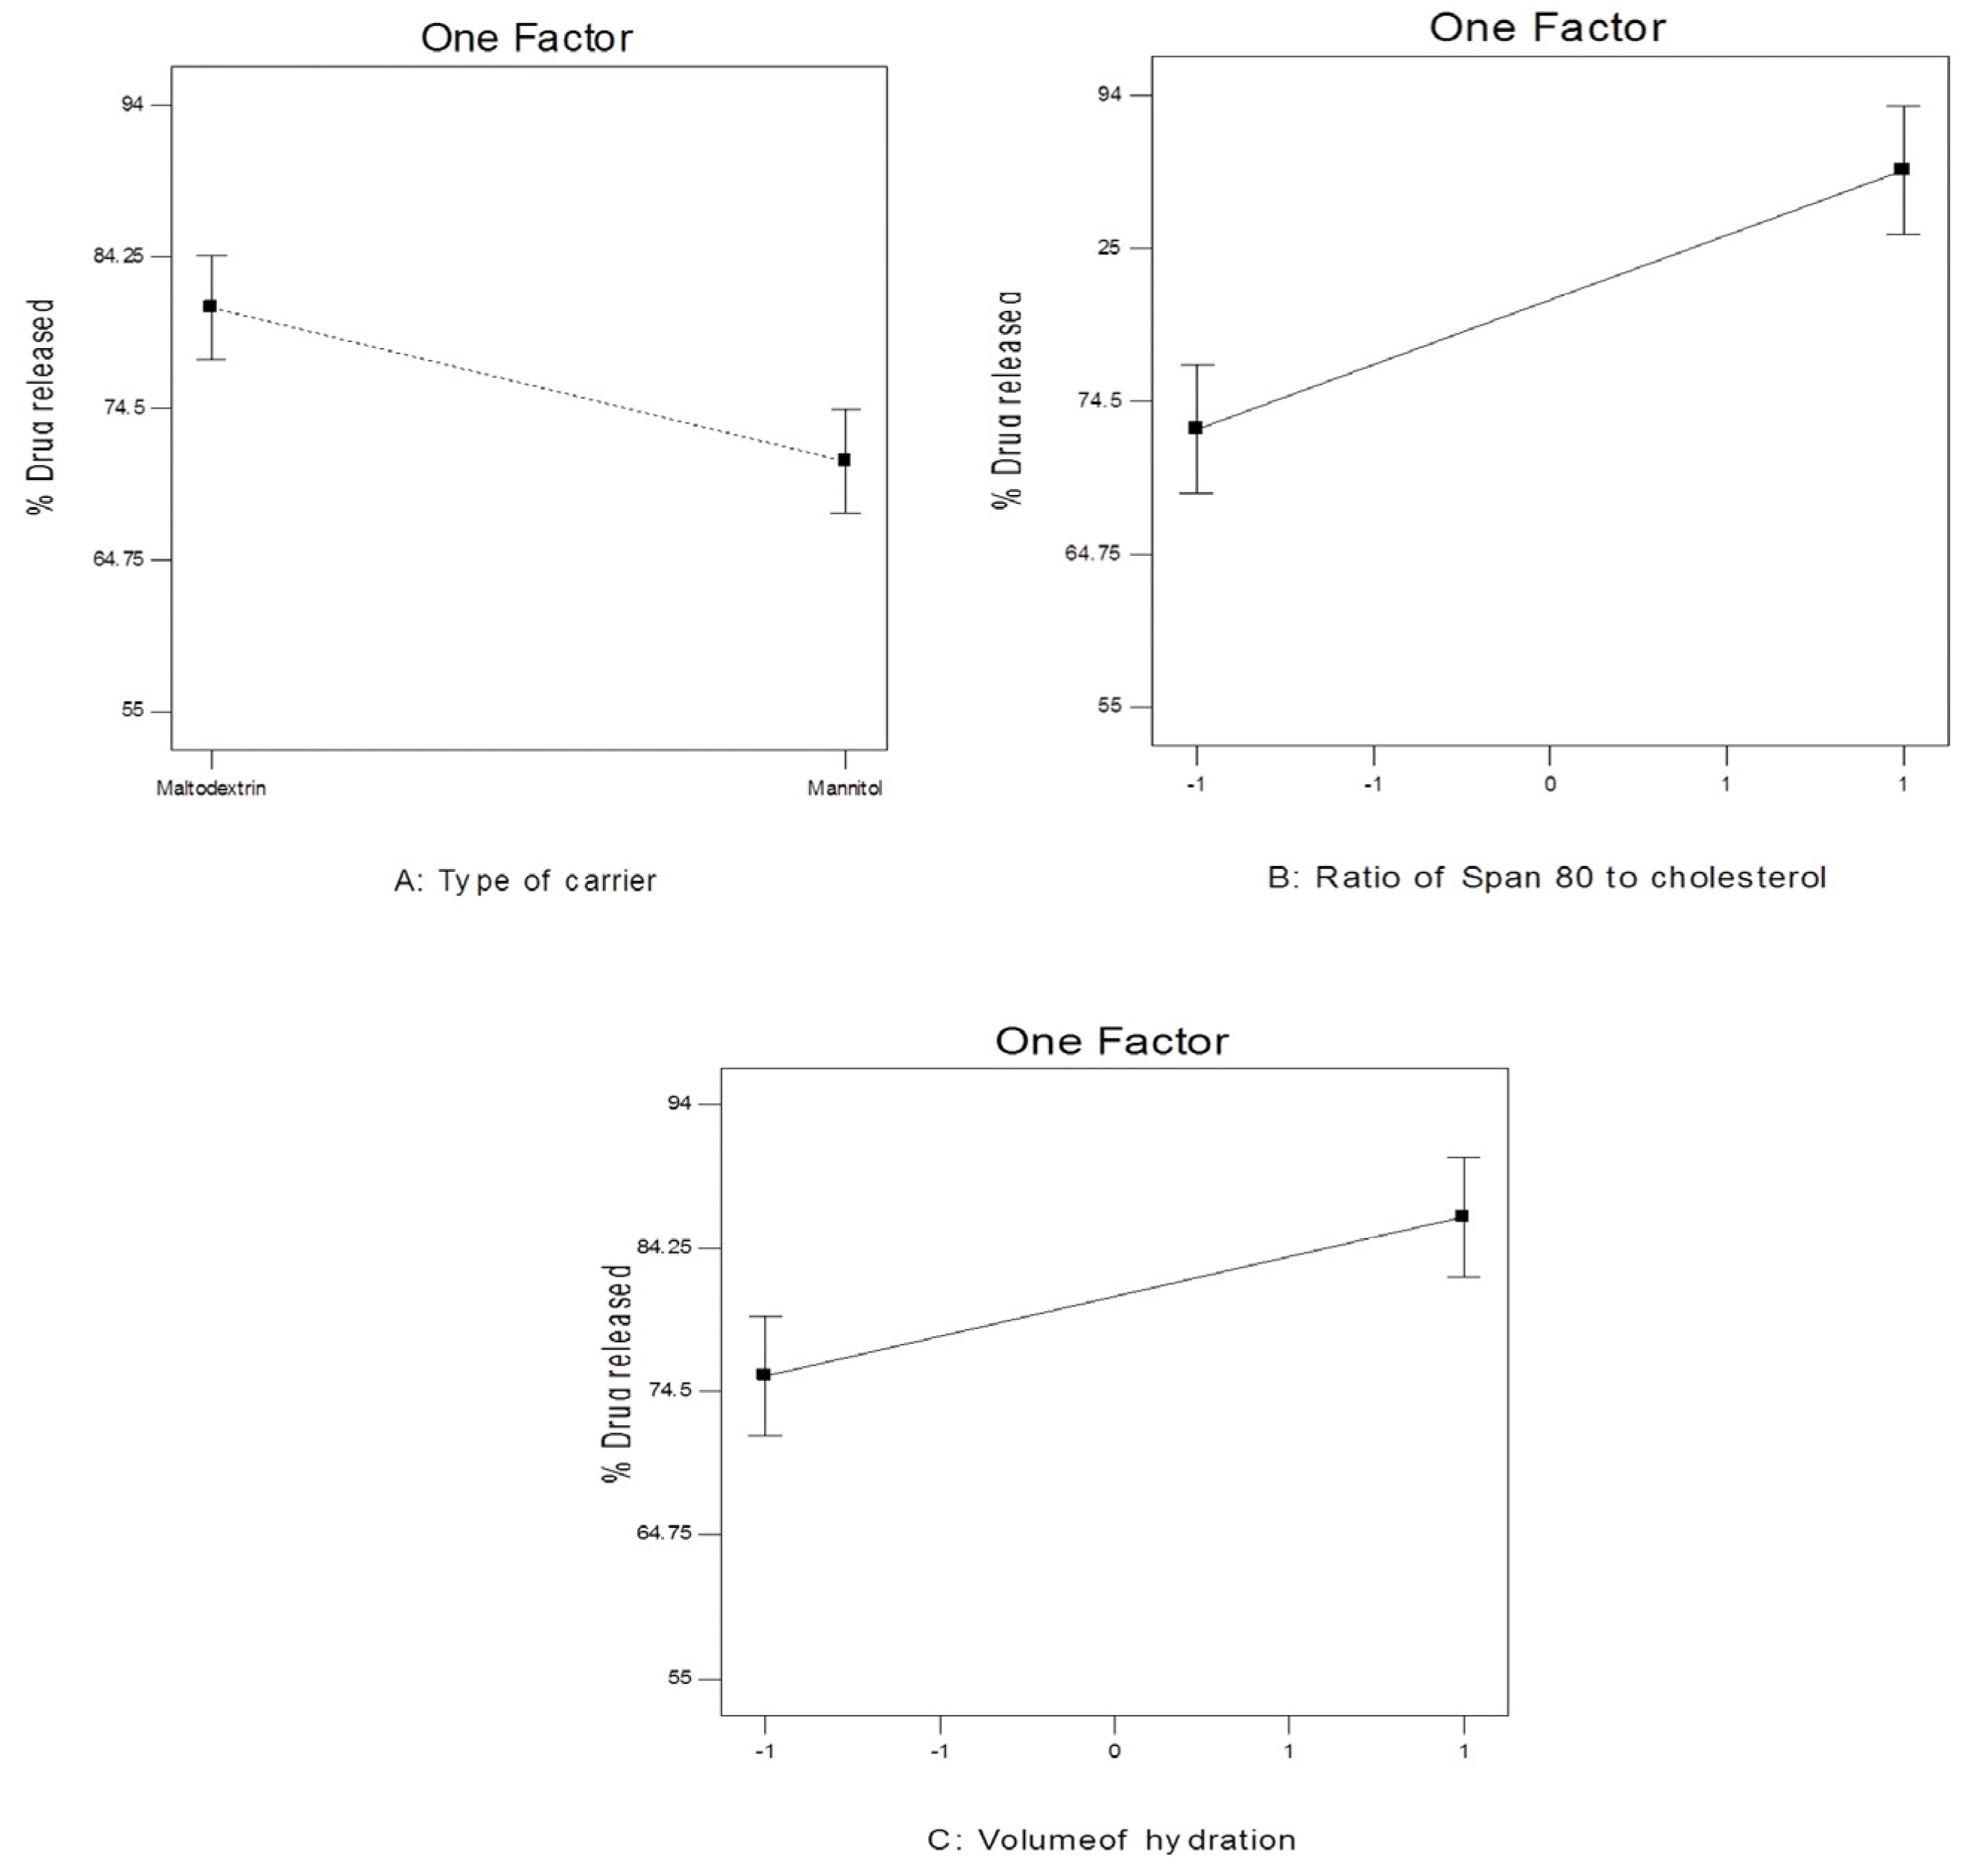
Figure 10.
The effect of different independent variables on Q12h of 4d-loaded proniosomes.
Figure 10.
The effect of different independent variables on Q12h of 4d-loaded proniosomes.
Figure 11.
Linearity plots of 4d-loaded proniosomes shown as observed versus predicted values (a) Y1 and (b) Y2.
Figure 11.
Linearity plots of 4d-loaded proniosomes shown as observed versus predicted values (a) Y1 and (b) Y2.
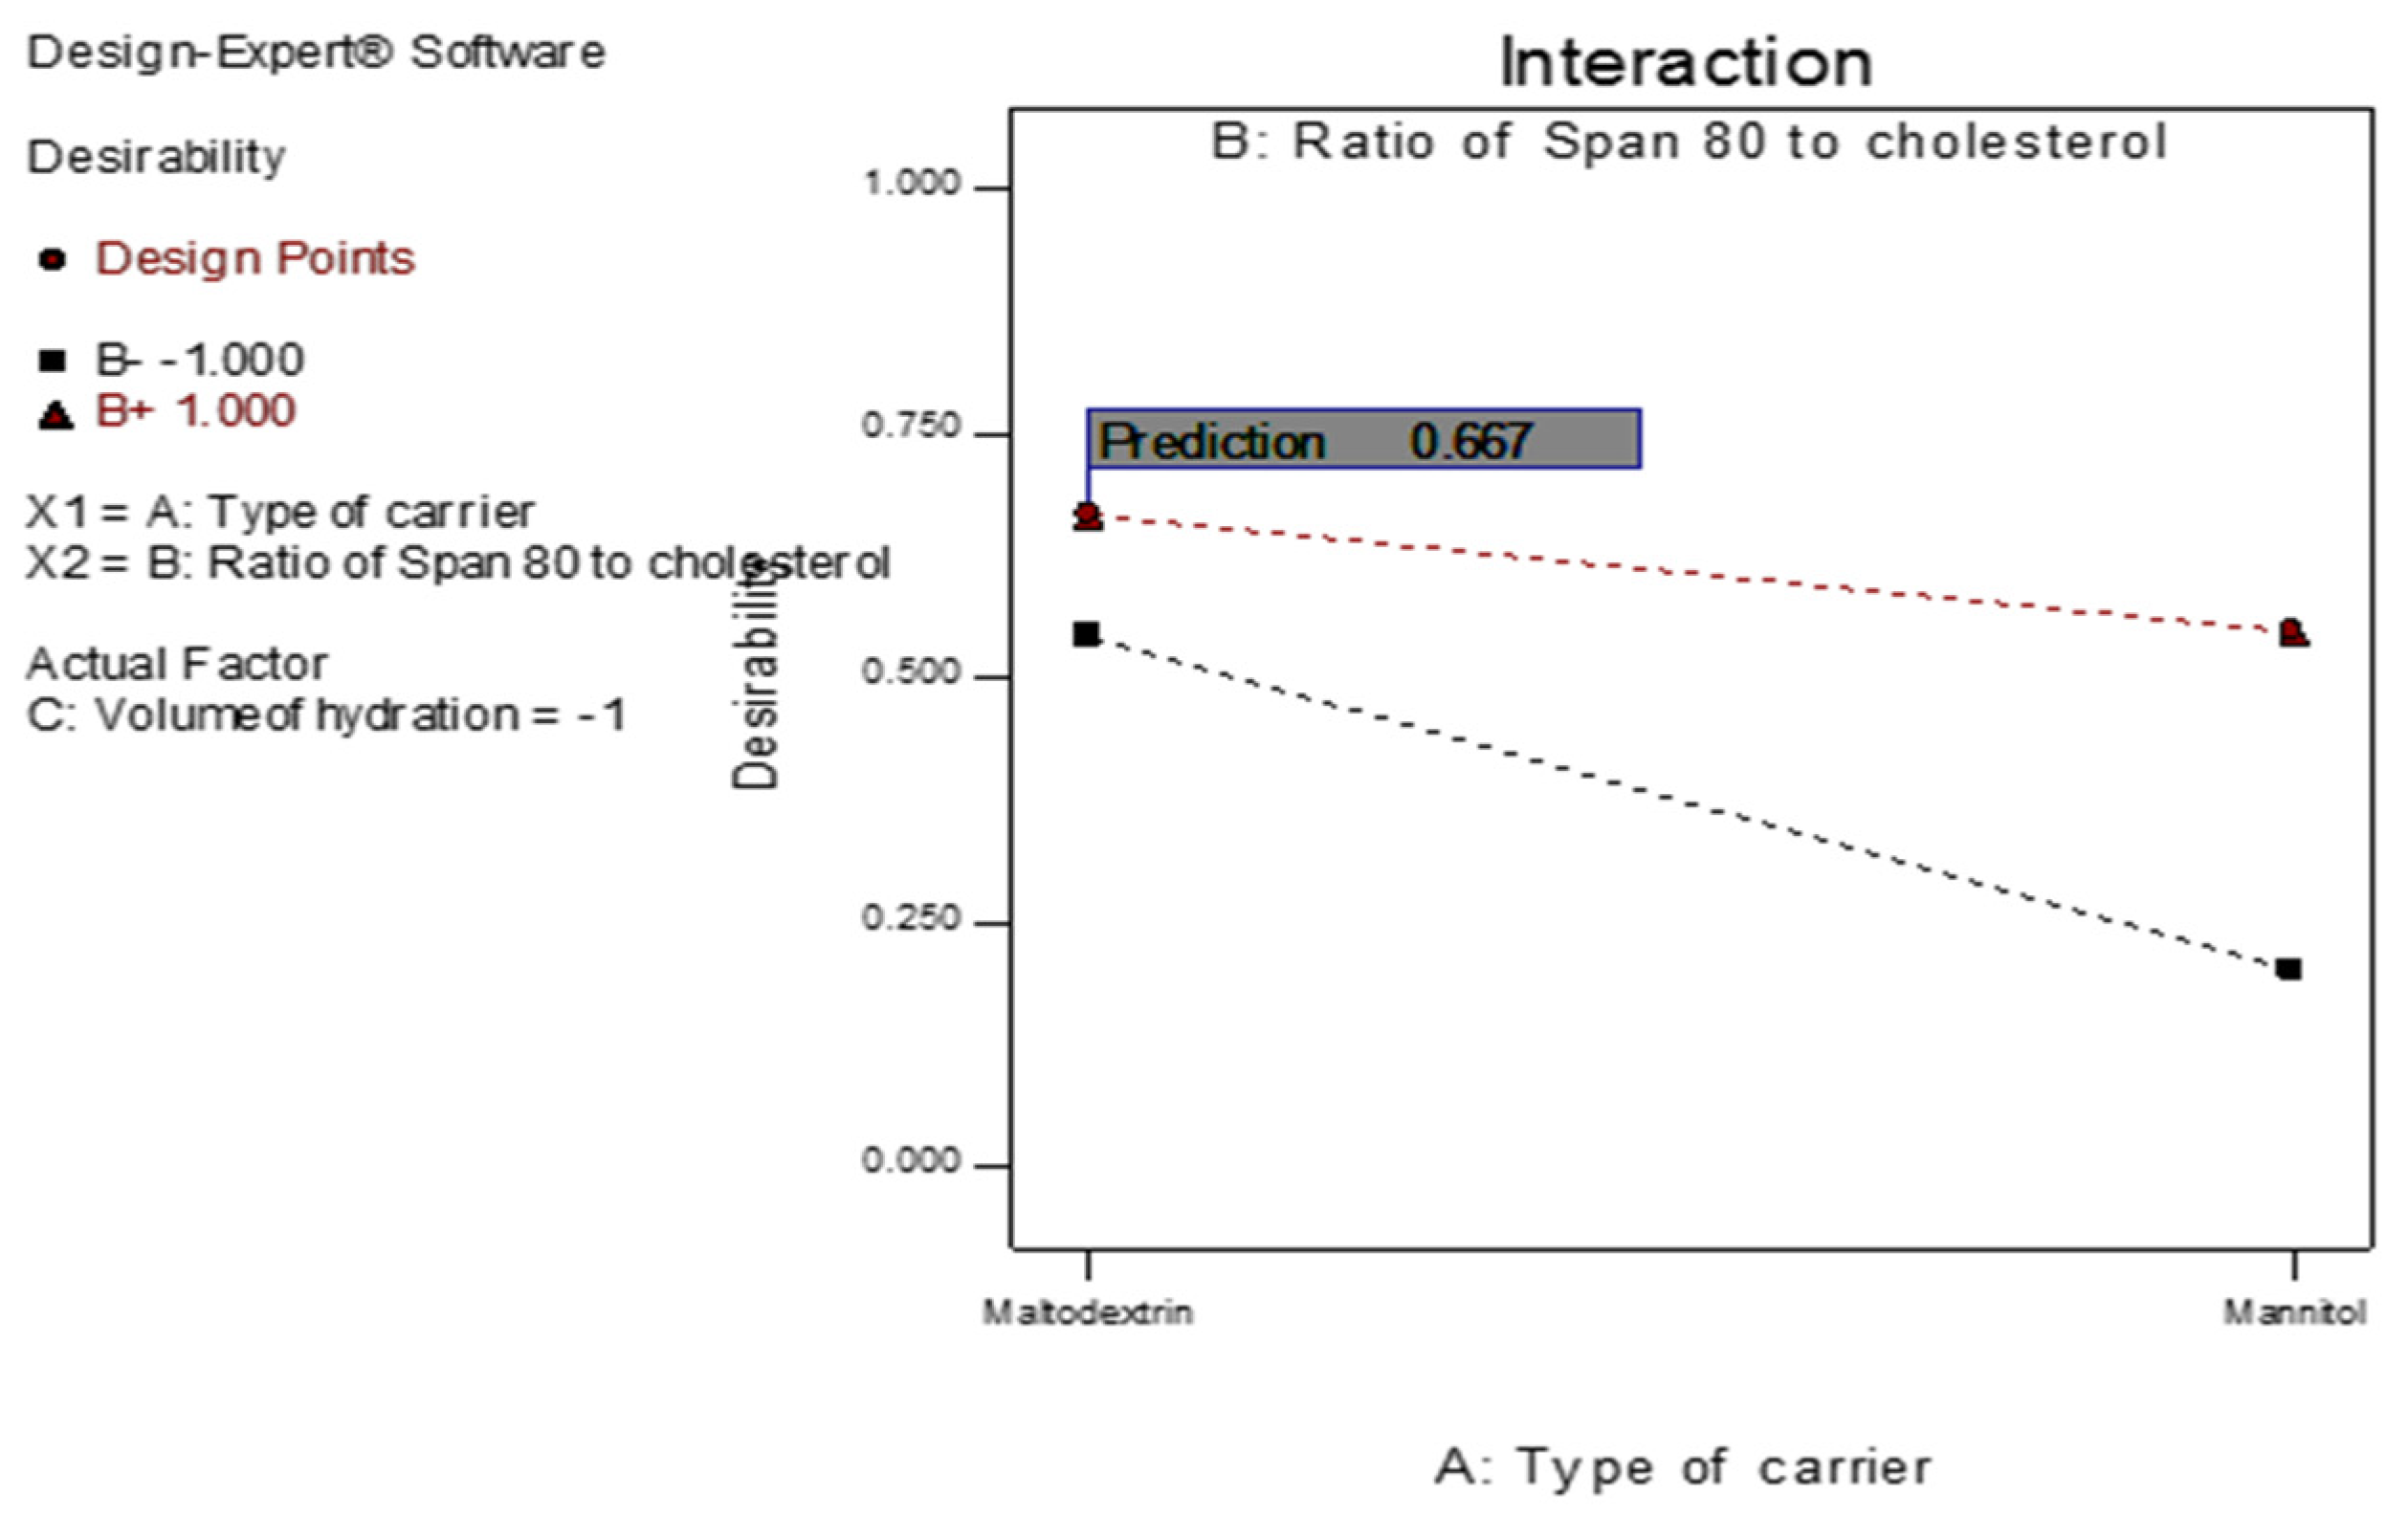
Figure 12.
The overall desirability of the 4d-loaded proniosomes as a function of independent variables.
Figure 12.
The overall desirability of the 4d-loaded proniosomes as a function of independent variables.
Figure 13.
In vitro release profile of the optimized proniosomal formula and the conventional niosomes.
Figure 13.
In vitro release profile of the optimized proniosomal formula and the conventional niosomes.
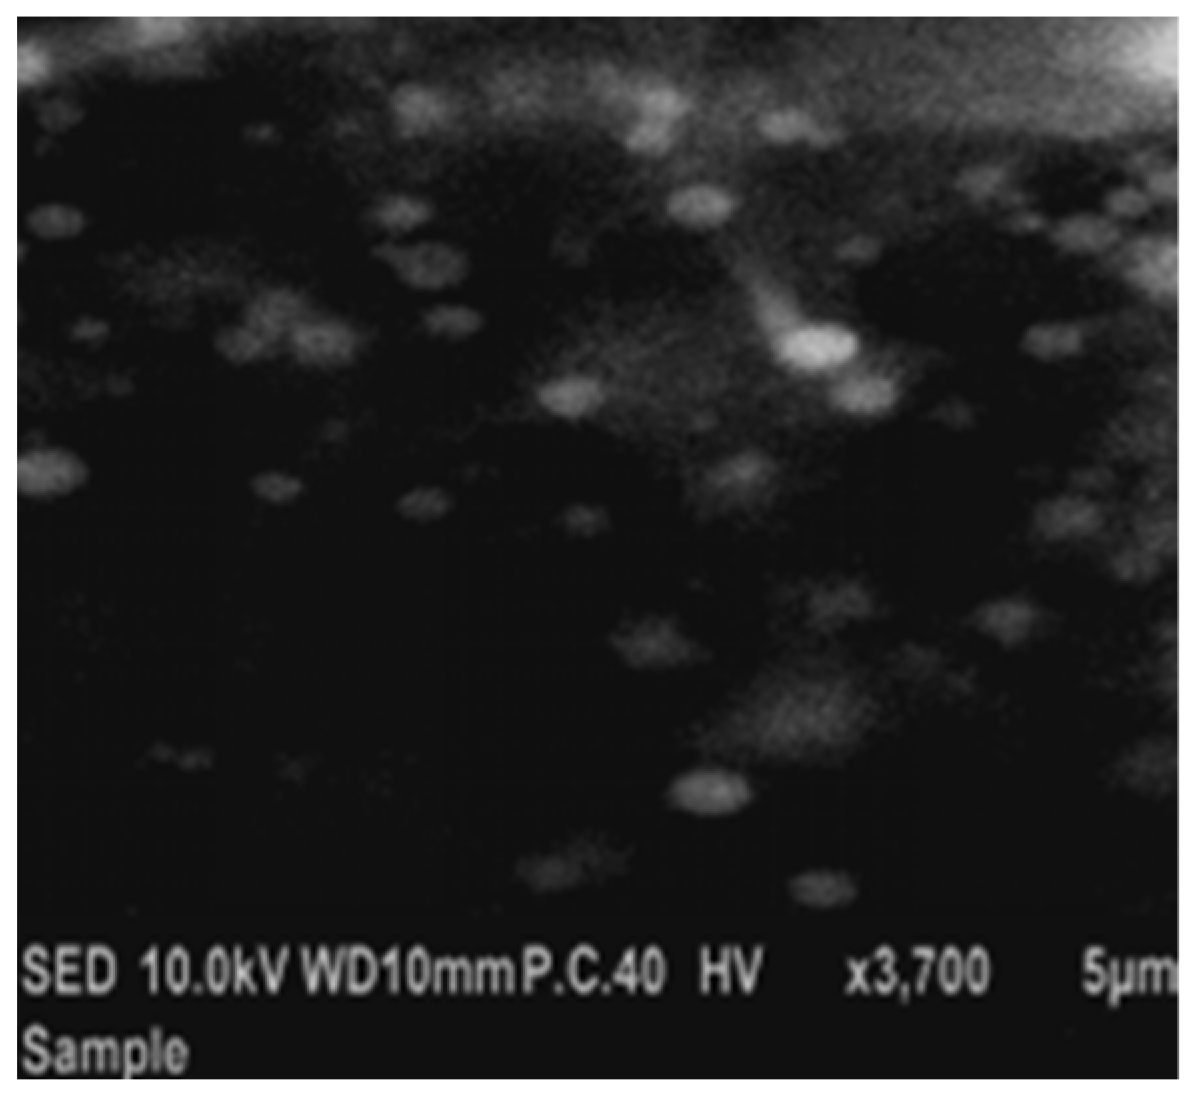
Figure 14.
Scanning electron micrograph of the optimized 4d-loaded proniosomal formula (F3).
Figure 14.
Scanning electron micrograph of the optimized 4d-loaded proniosomal formula (F3).
Figure 15.
Particle size distribution curve of the optimized 4d-loaded proniosomal formula (F3).
Figure 15.
Particle size distribution curve of the optimized 4d-loaded proniosomal formula (F3).
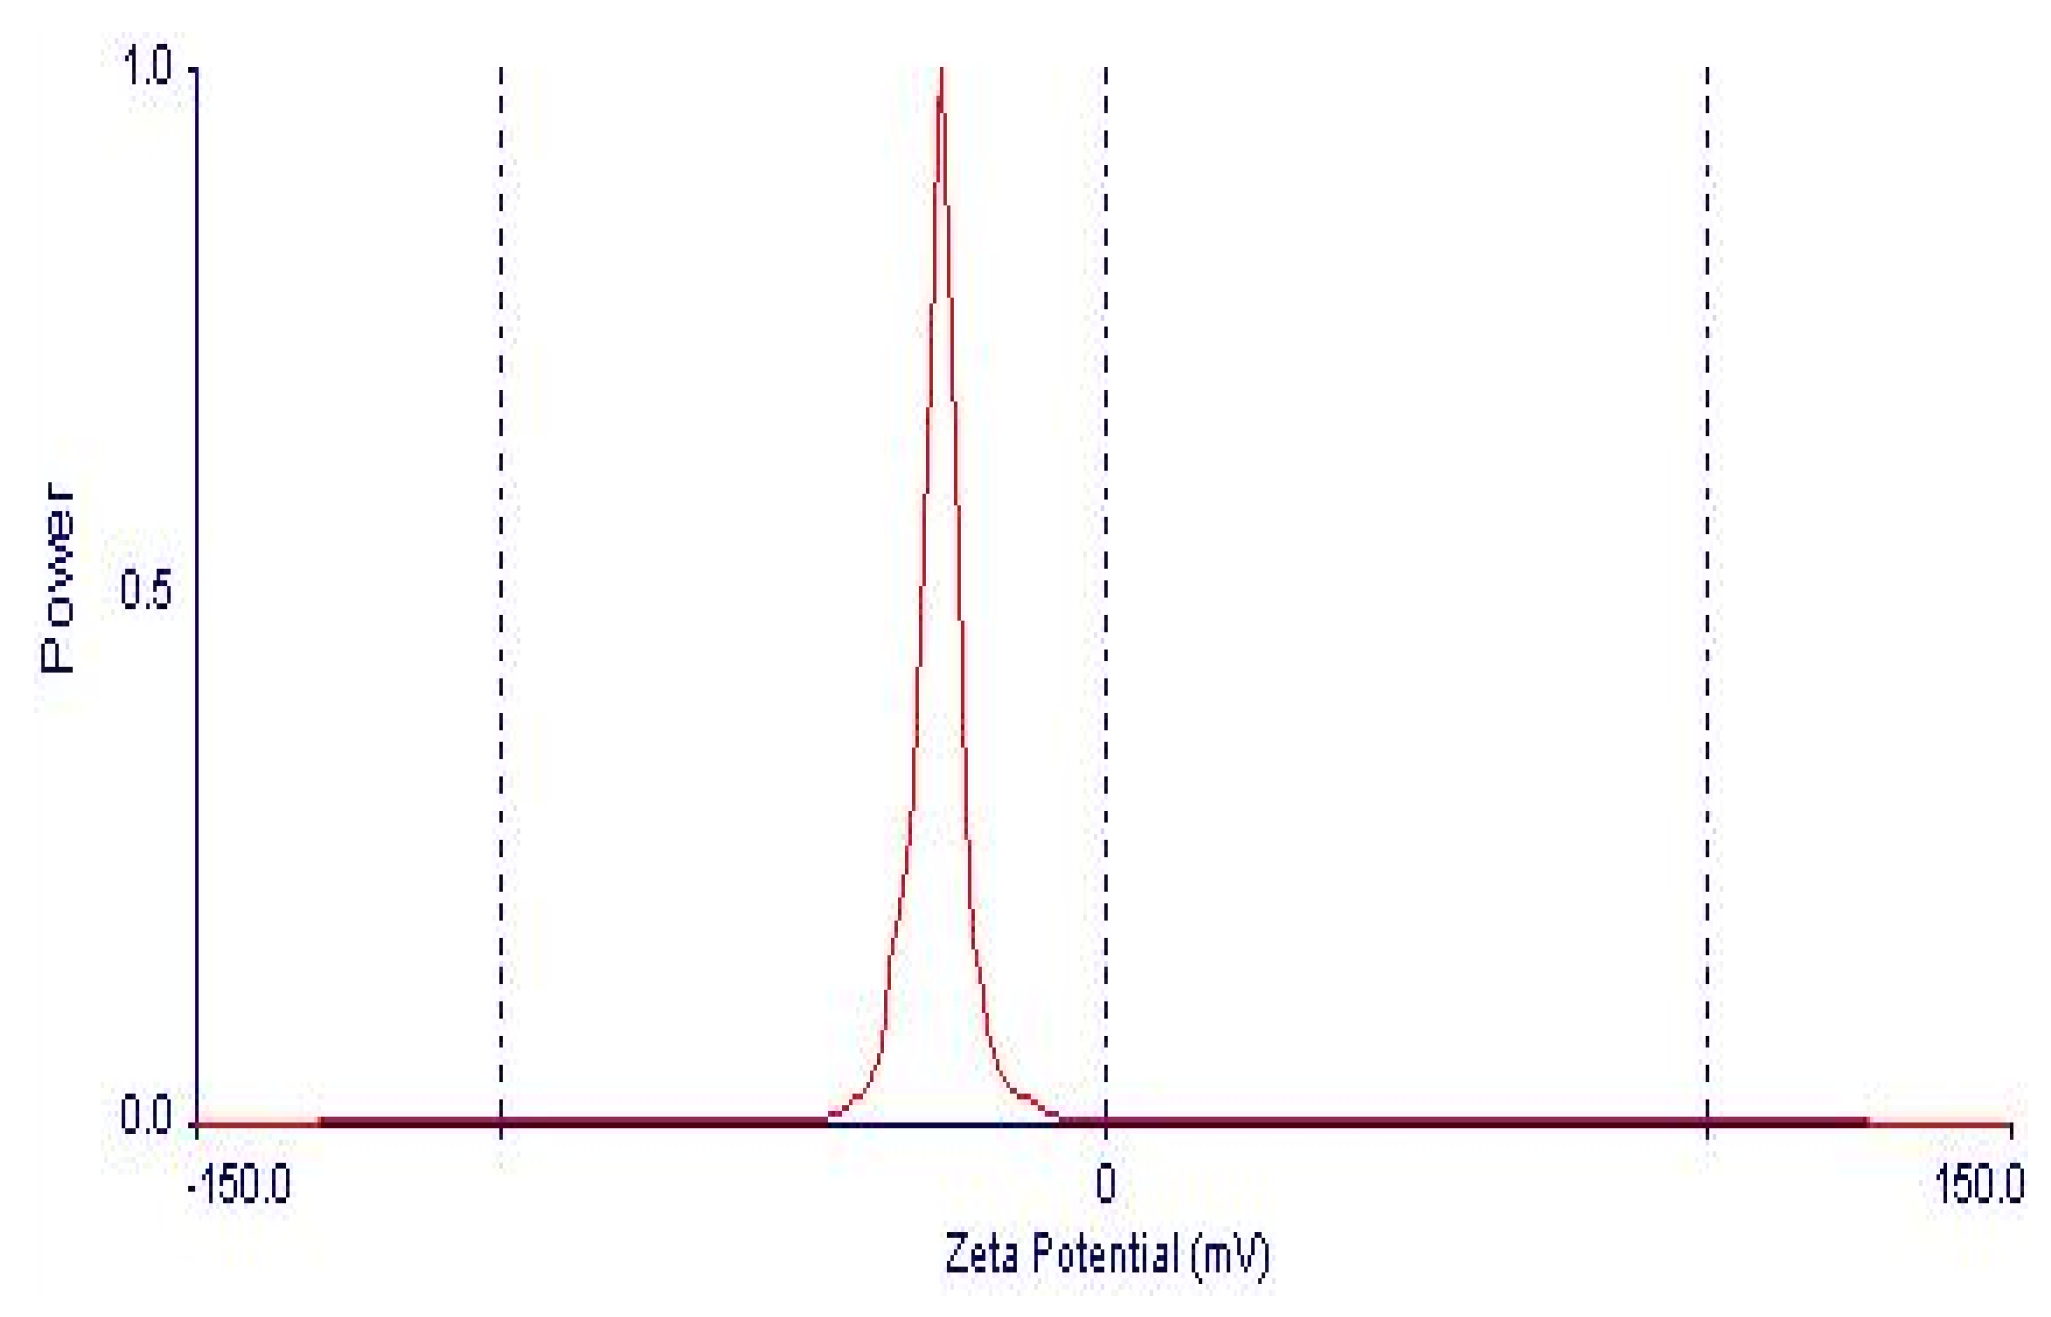
Figure 16.
Zeta potential distribution of 4d-loaded proniosomal formula (F3).
Figure 16.
Zeta potential distribution of 4d-loaded proniosomal formula (F3).
Figure 17.
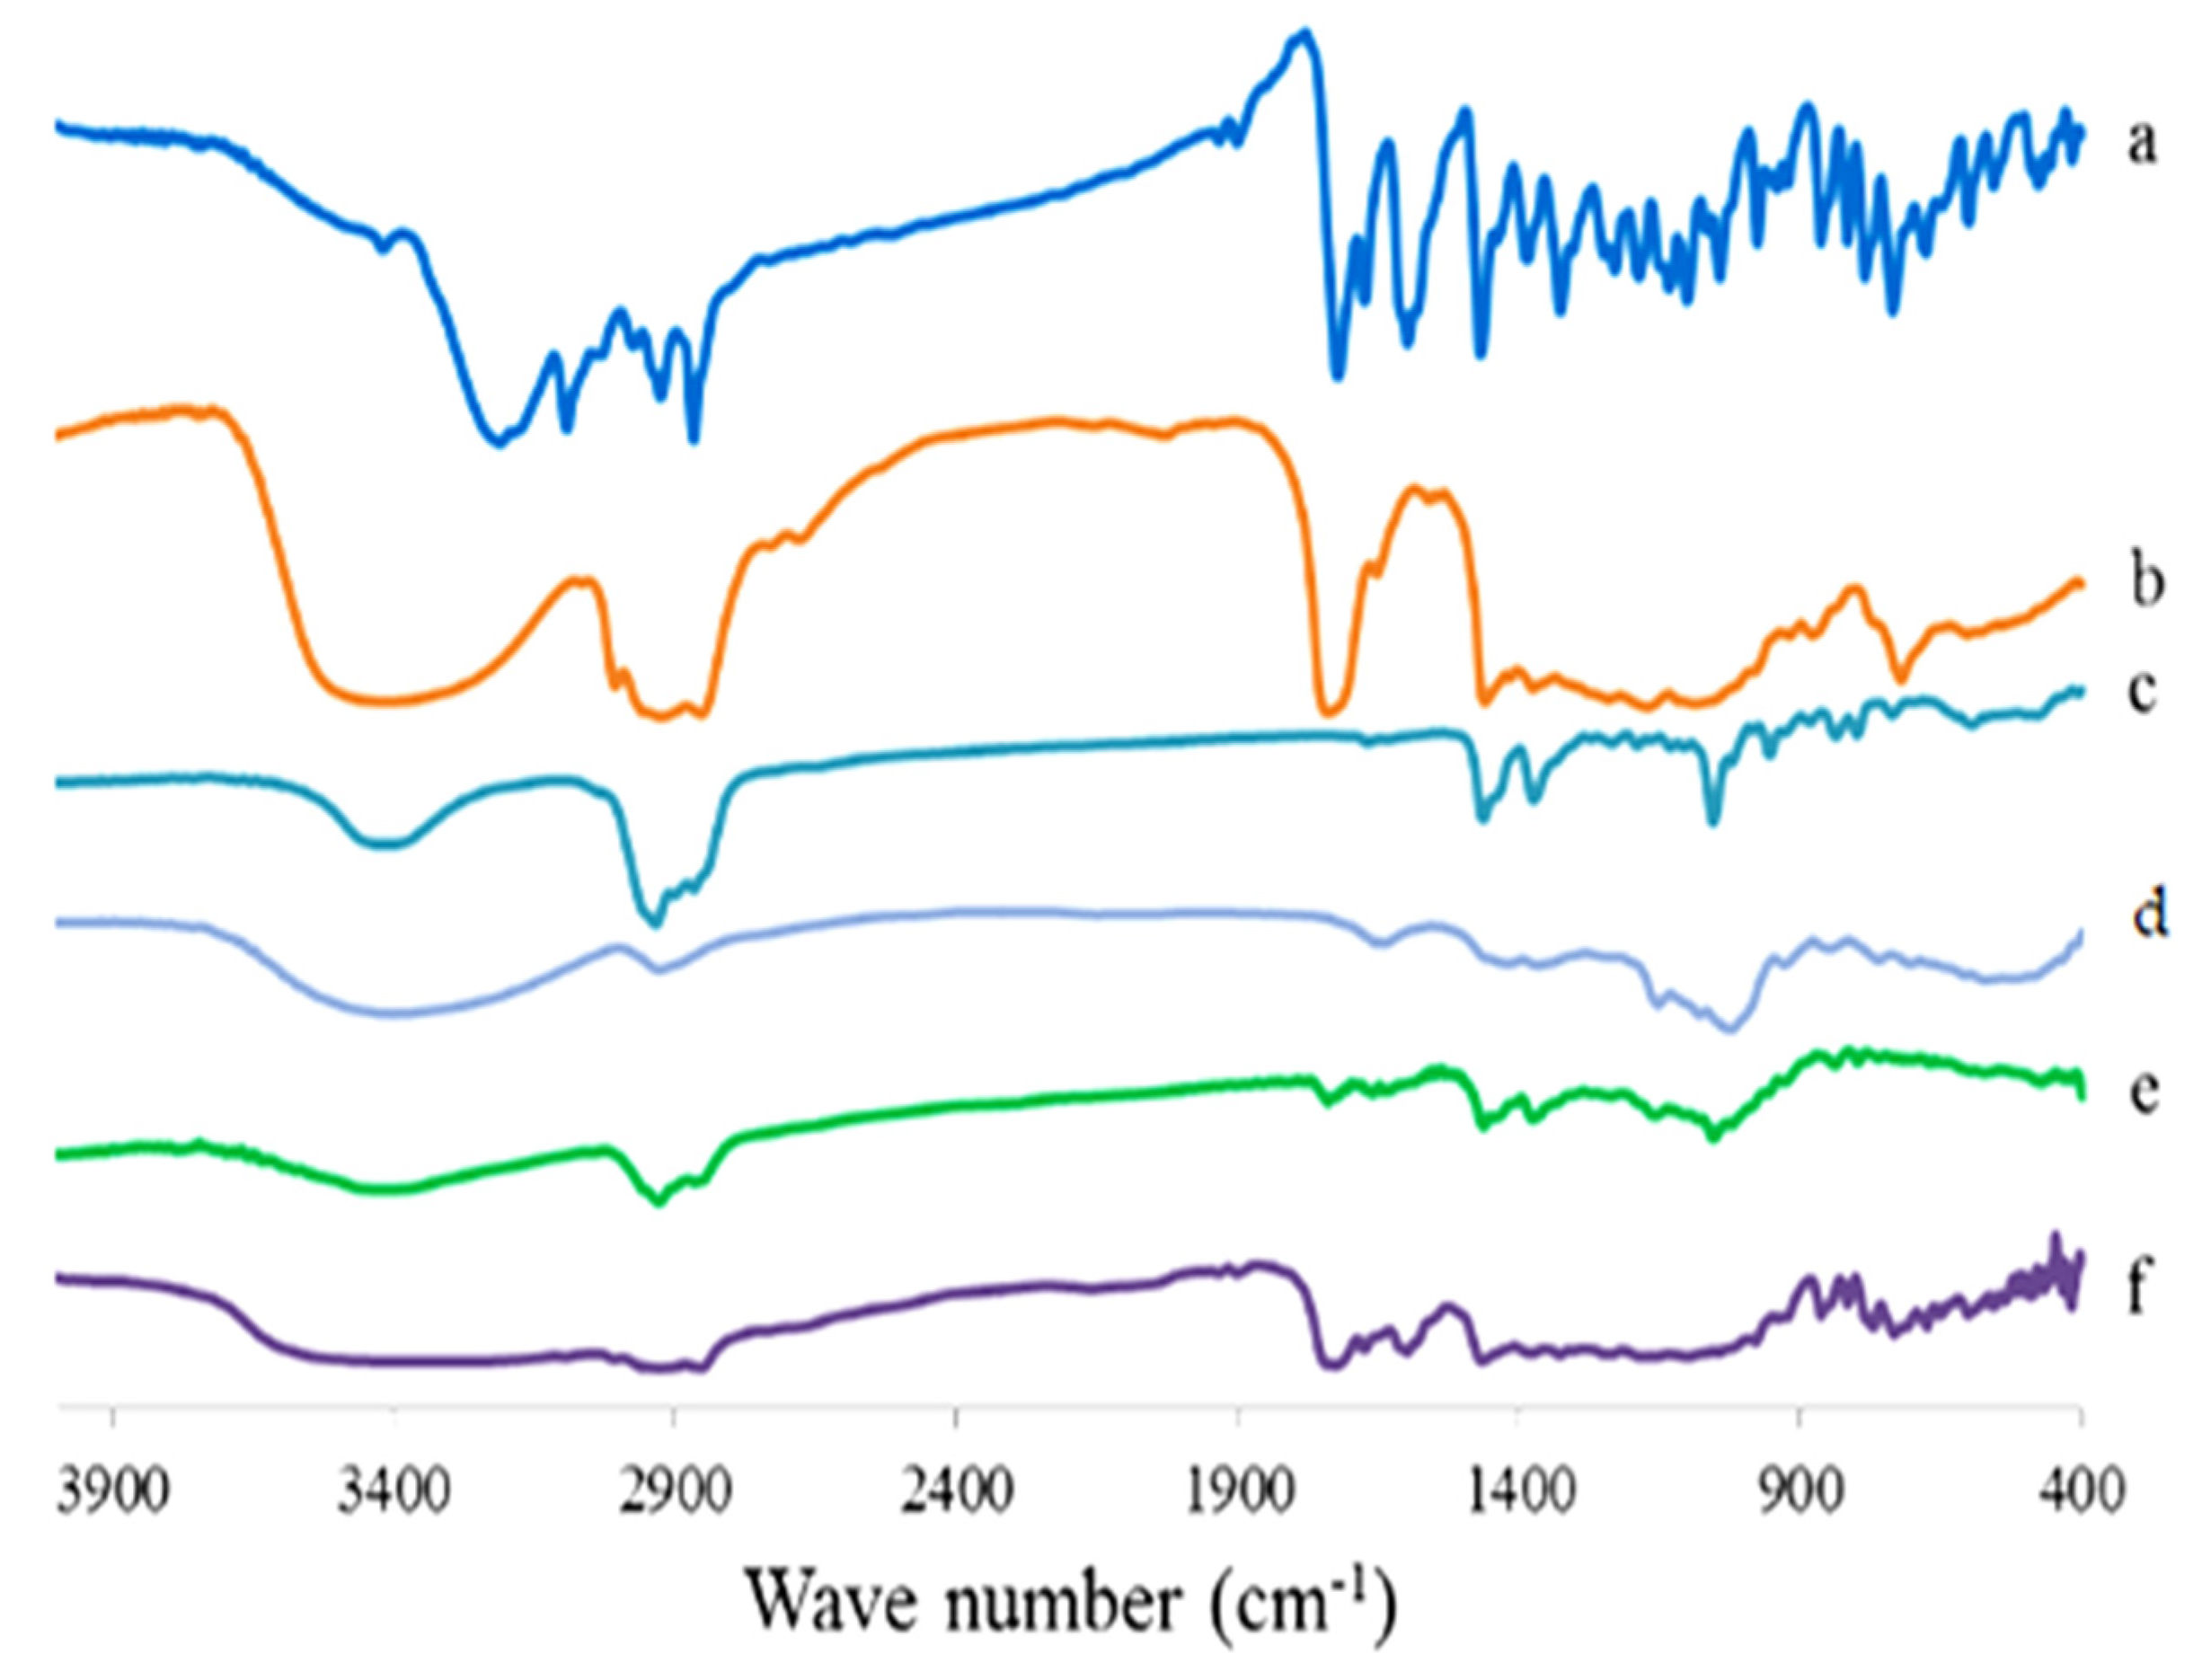
FTIR spectrum of 4d compound (a), Sorbitan monooleate (b), CHOL (c), maltodextrin (d), plain proniosomes (e), and the optimized 4d proniosomal formula (F3) (f).
Figure 17.
FTIR spectrum of 4d compound (a), Sorbitan monooleate (b), CHOL (c), maltodextrin (d), plain proniosomes (e), and the optimized 4d proniosomal formula (F3) (f).
Figure 18.
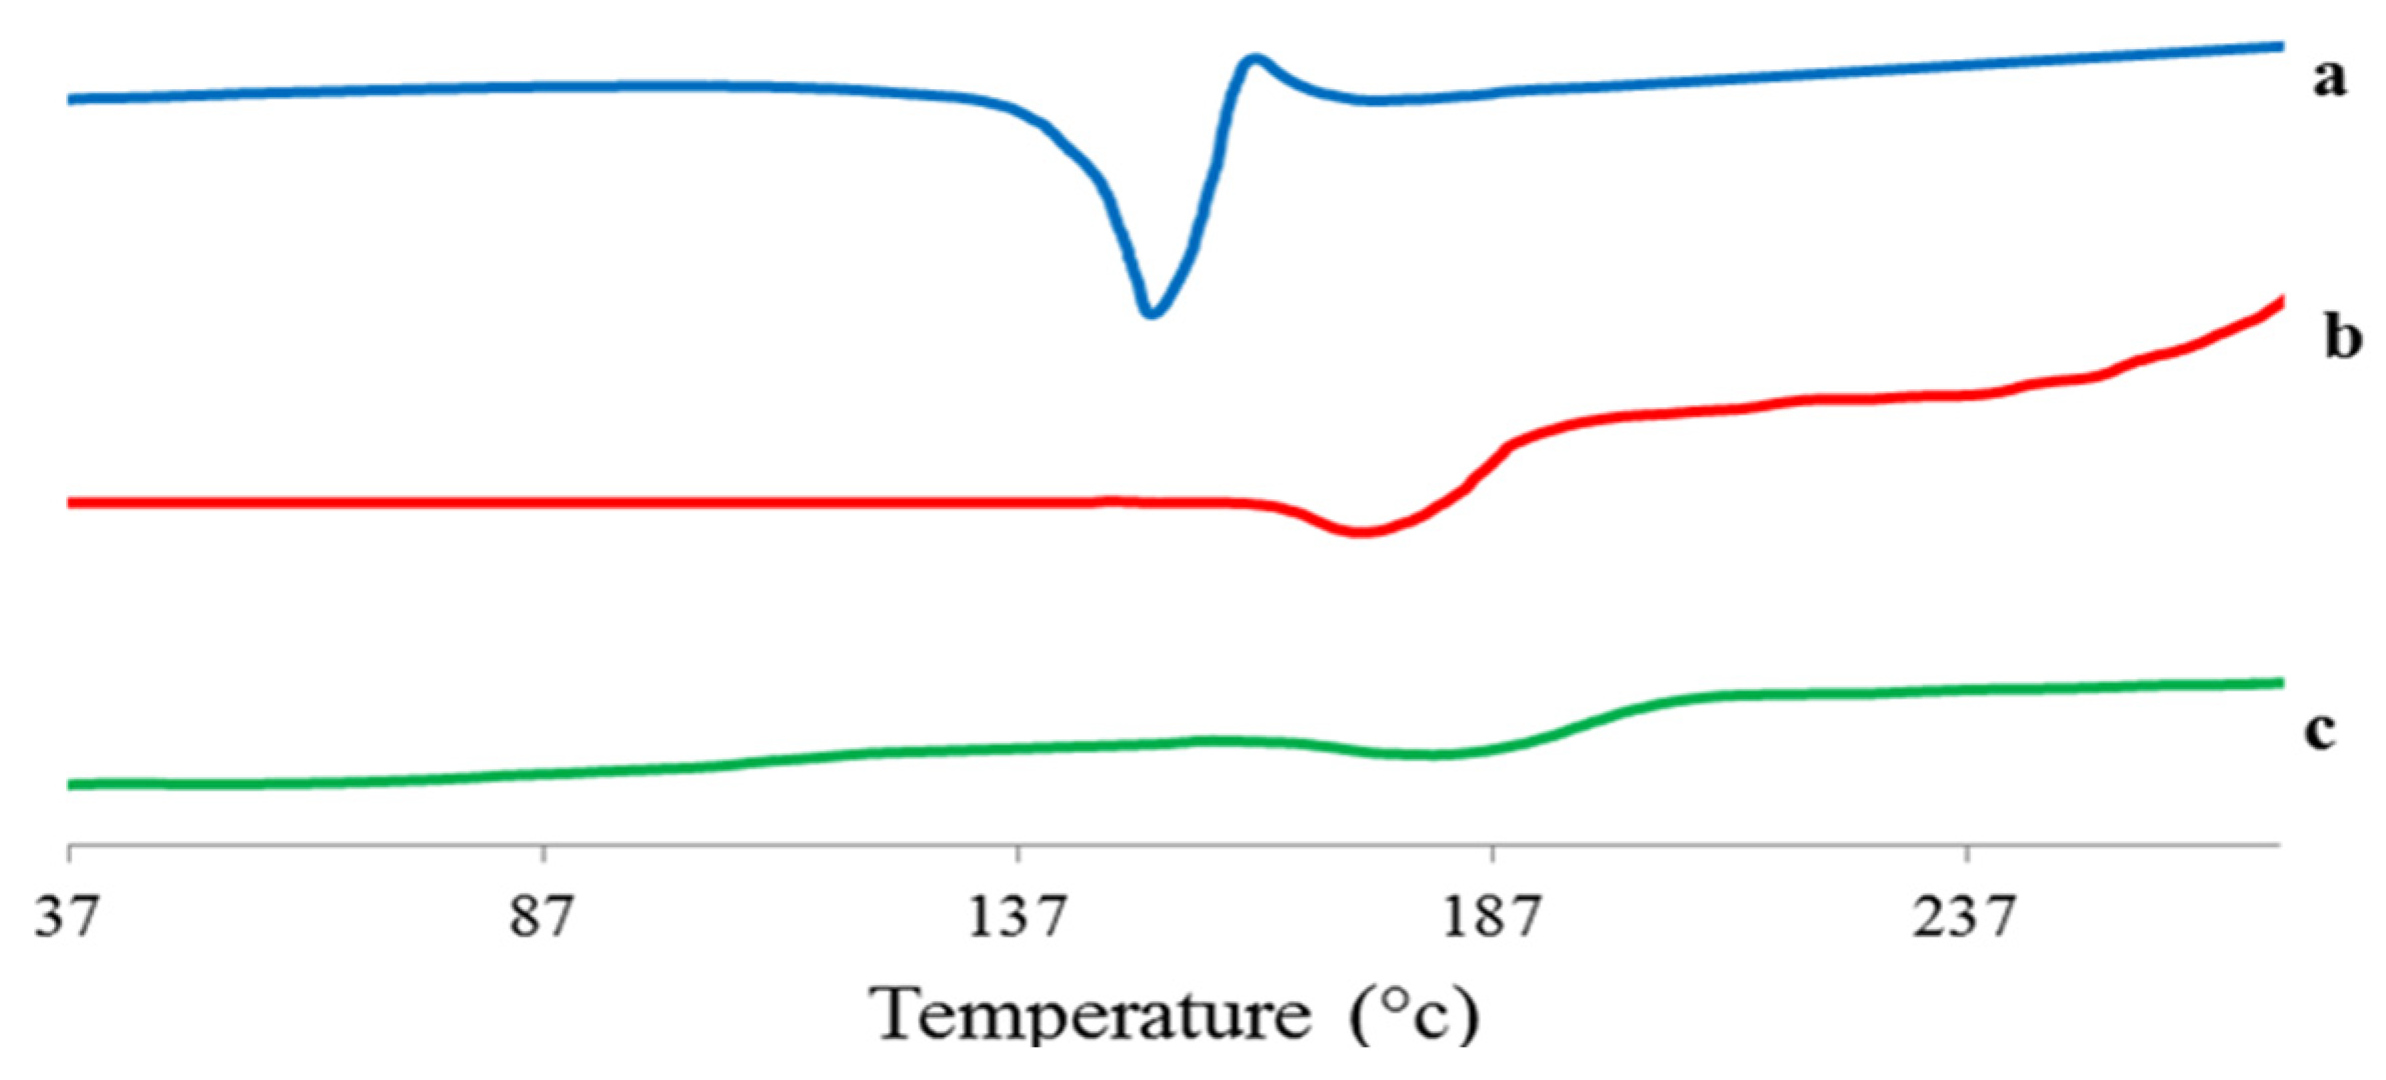
DSC thermogram of 4d (a), plain proniosomes (b), and the optimized 4d–loaded proniosomal formula (F3) (c).
Figure 18.
DSC thermogram of 4d (a), plain proniosomes (b), and the optimized 4d–loaded proniosomal formula (F3) (c).
Figure 19.
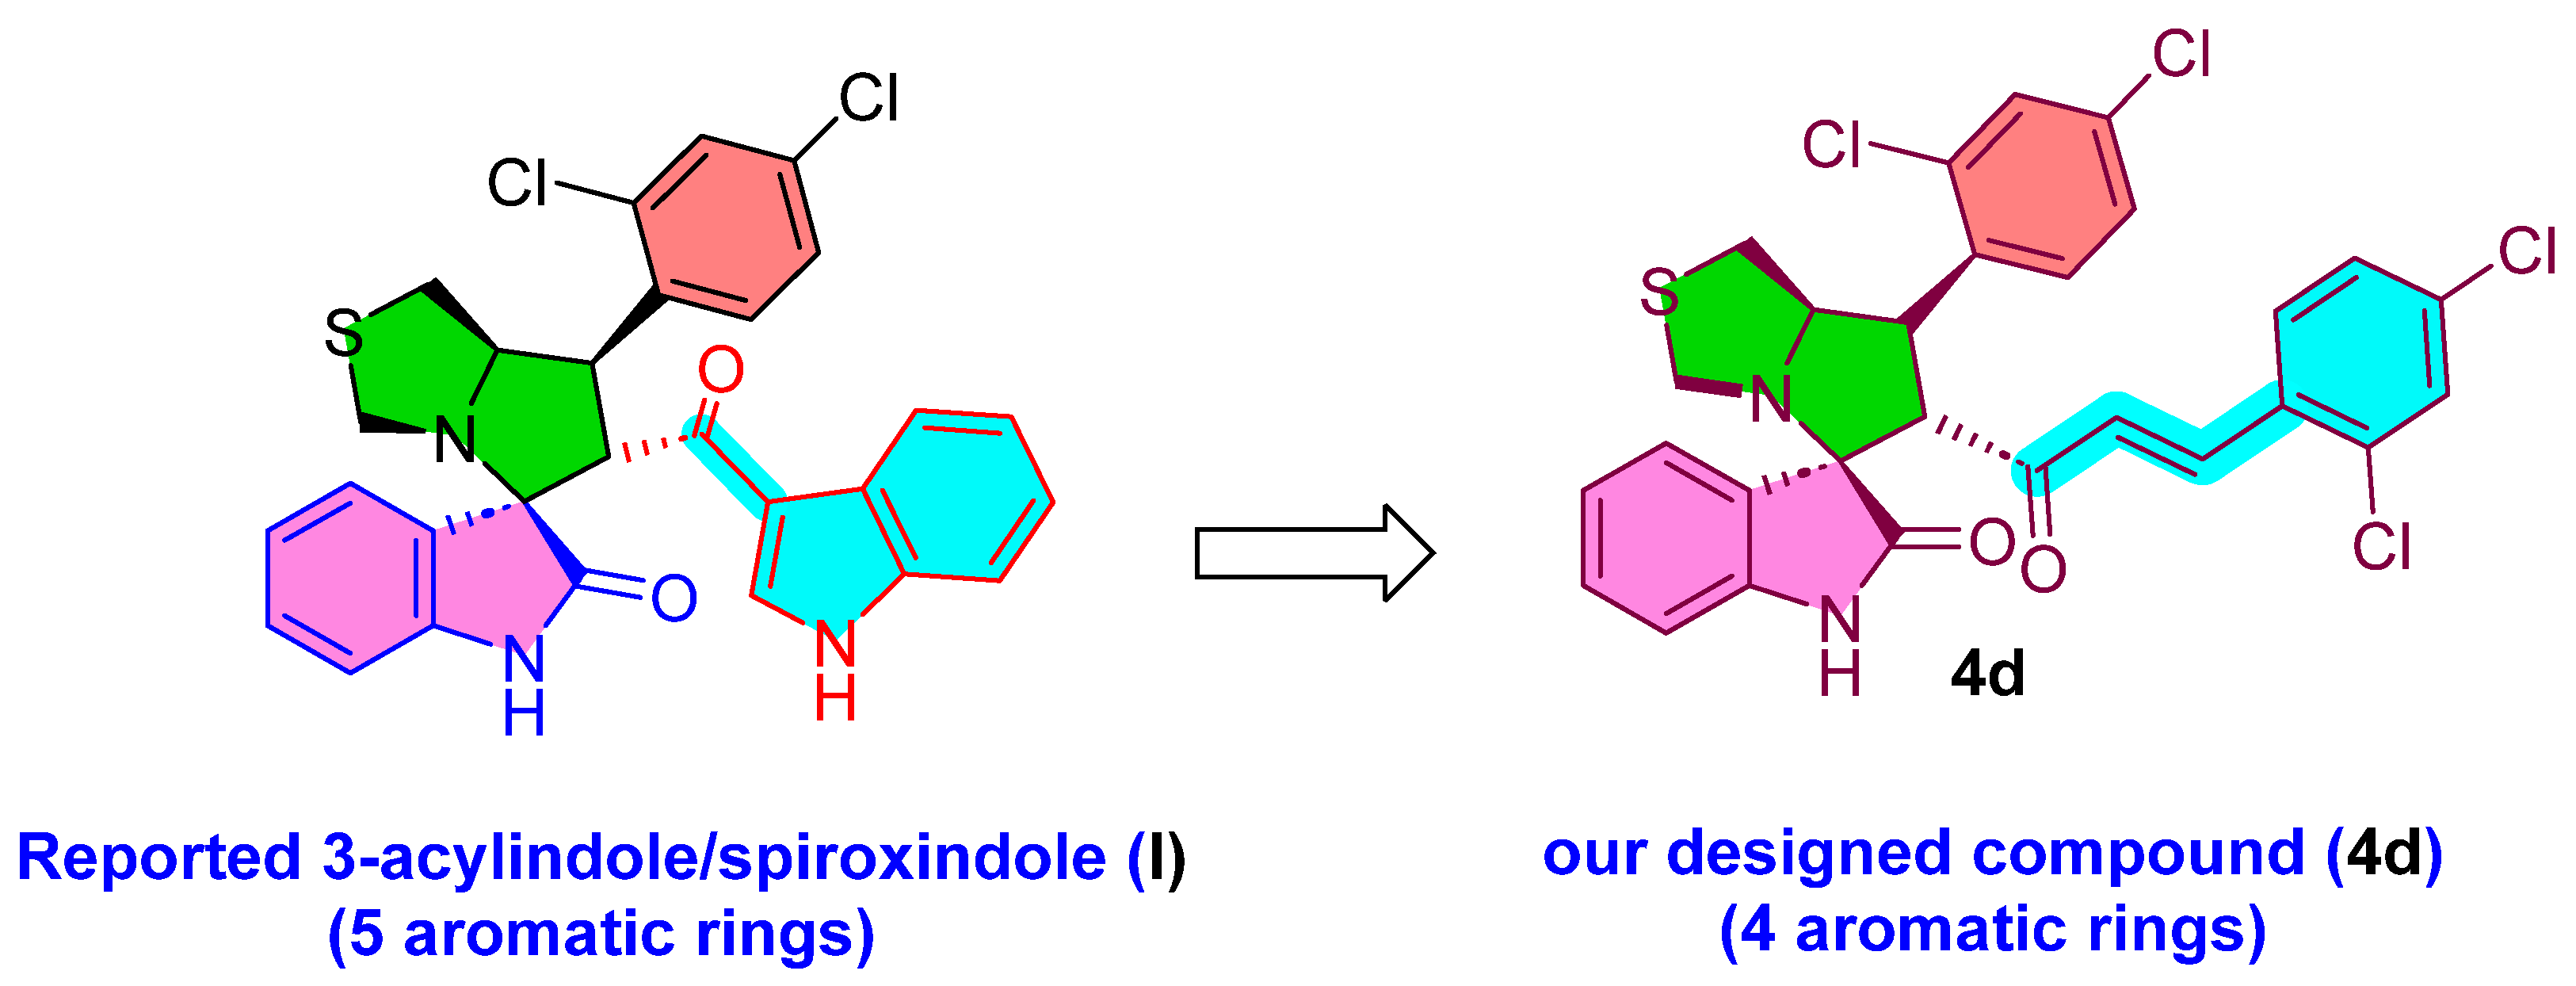
Designed the compound 4d.
Figure 19.
Designed the compound 4d.
Figure 20.
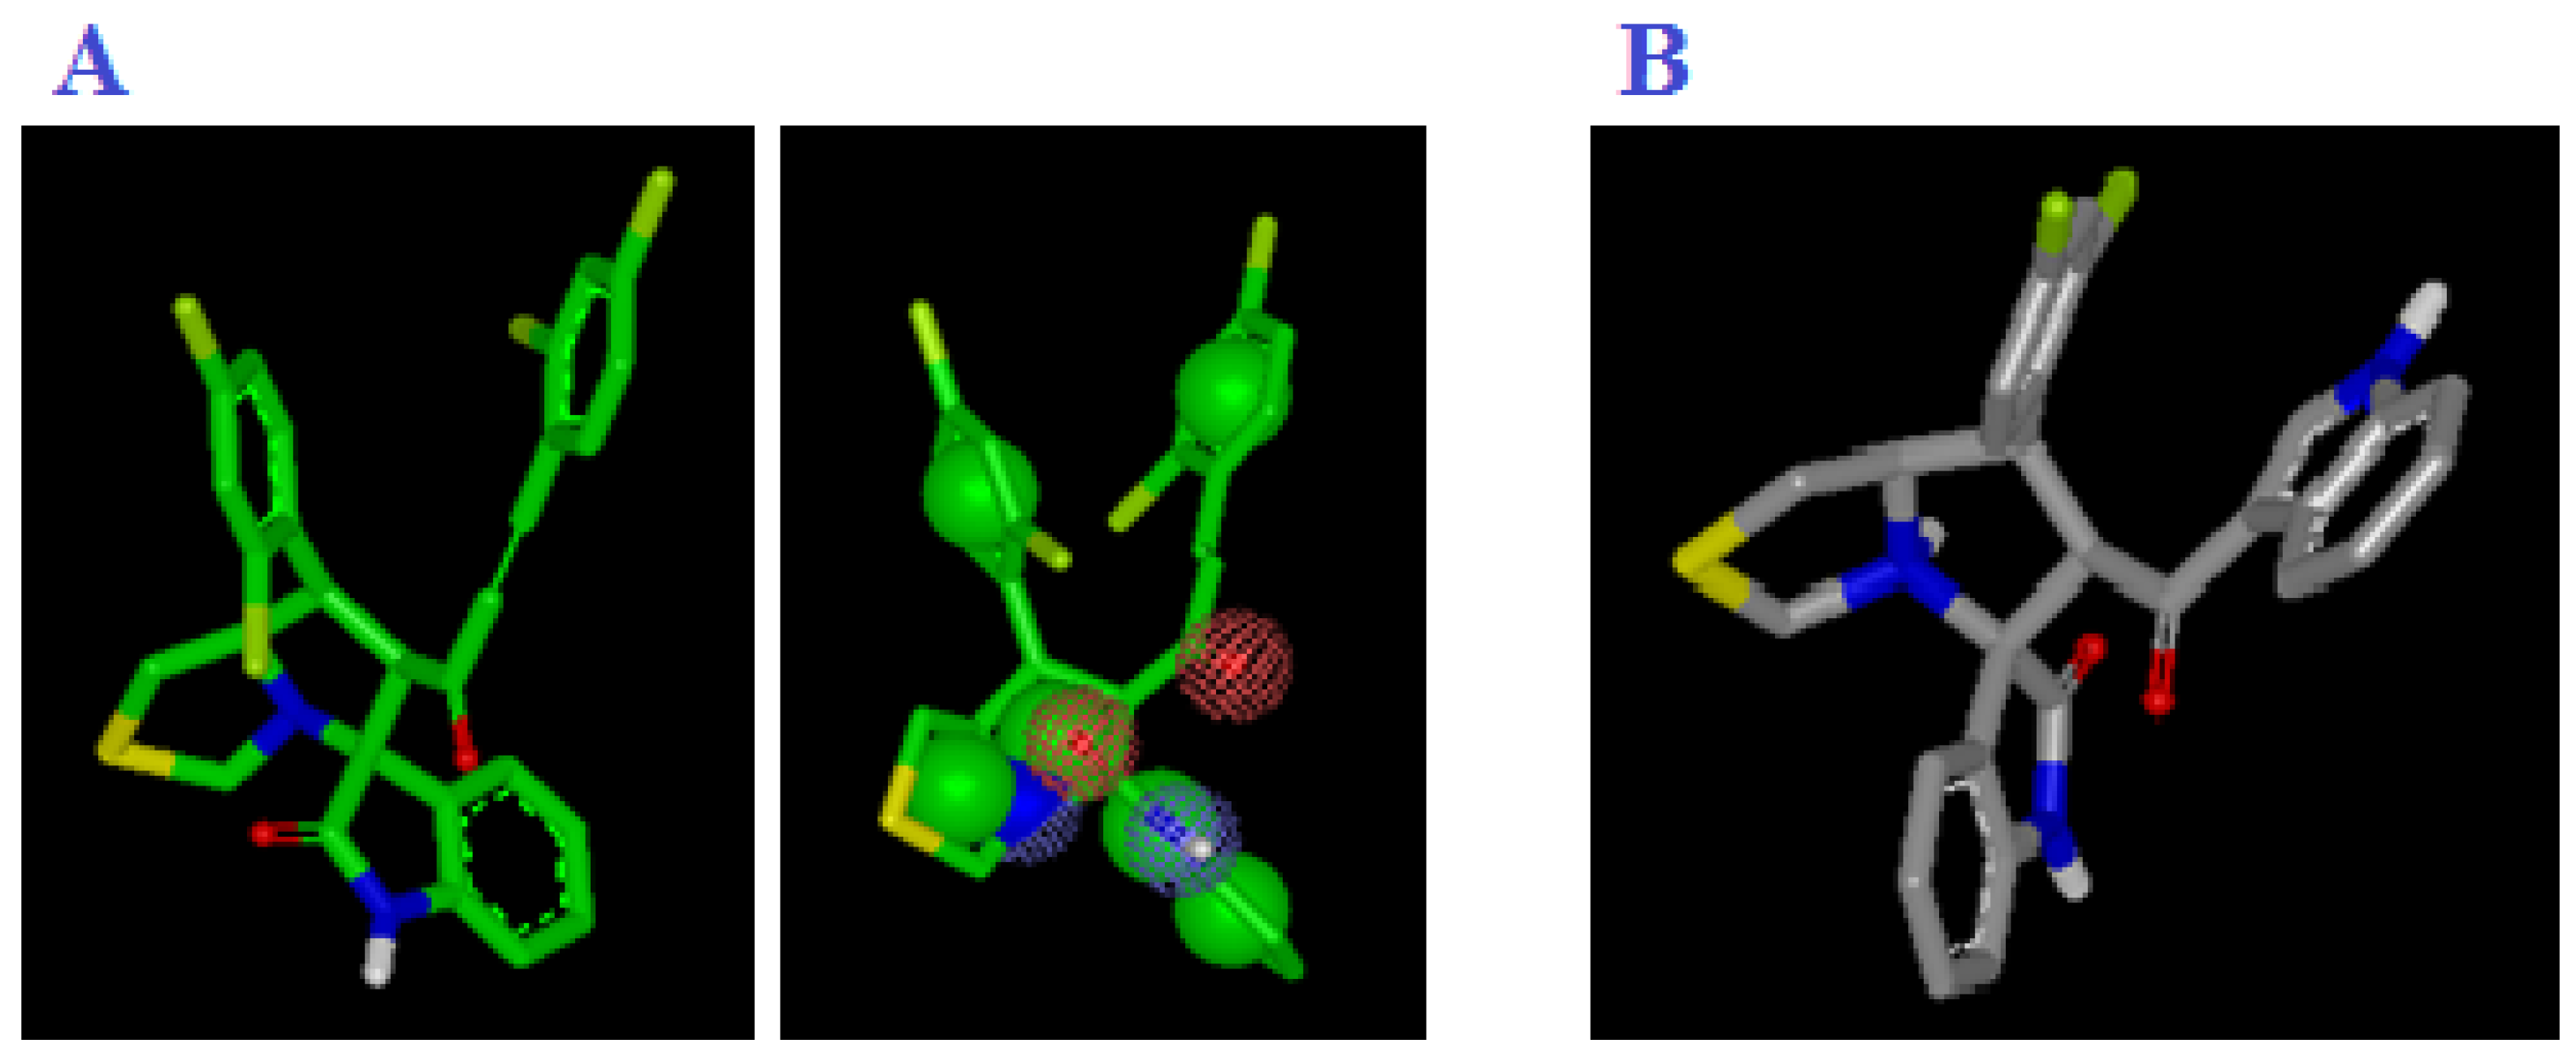
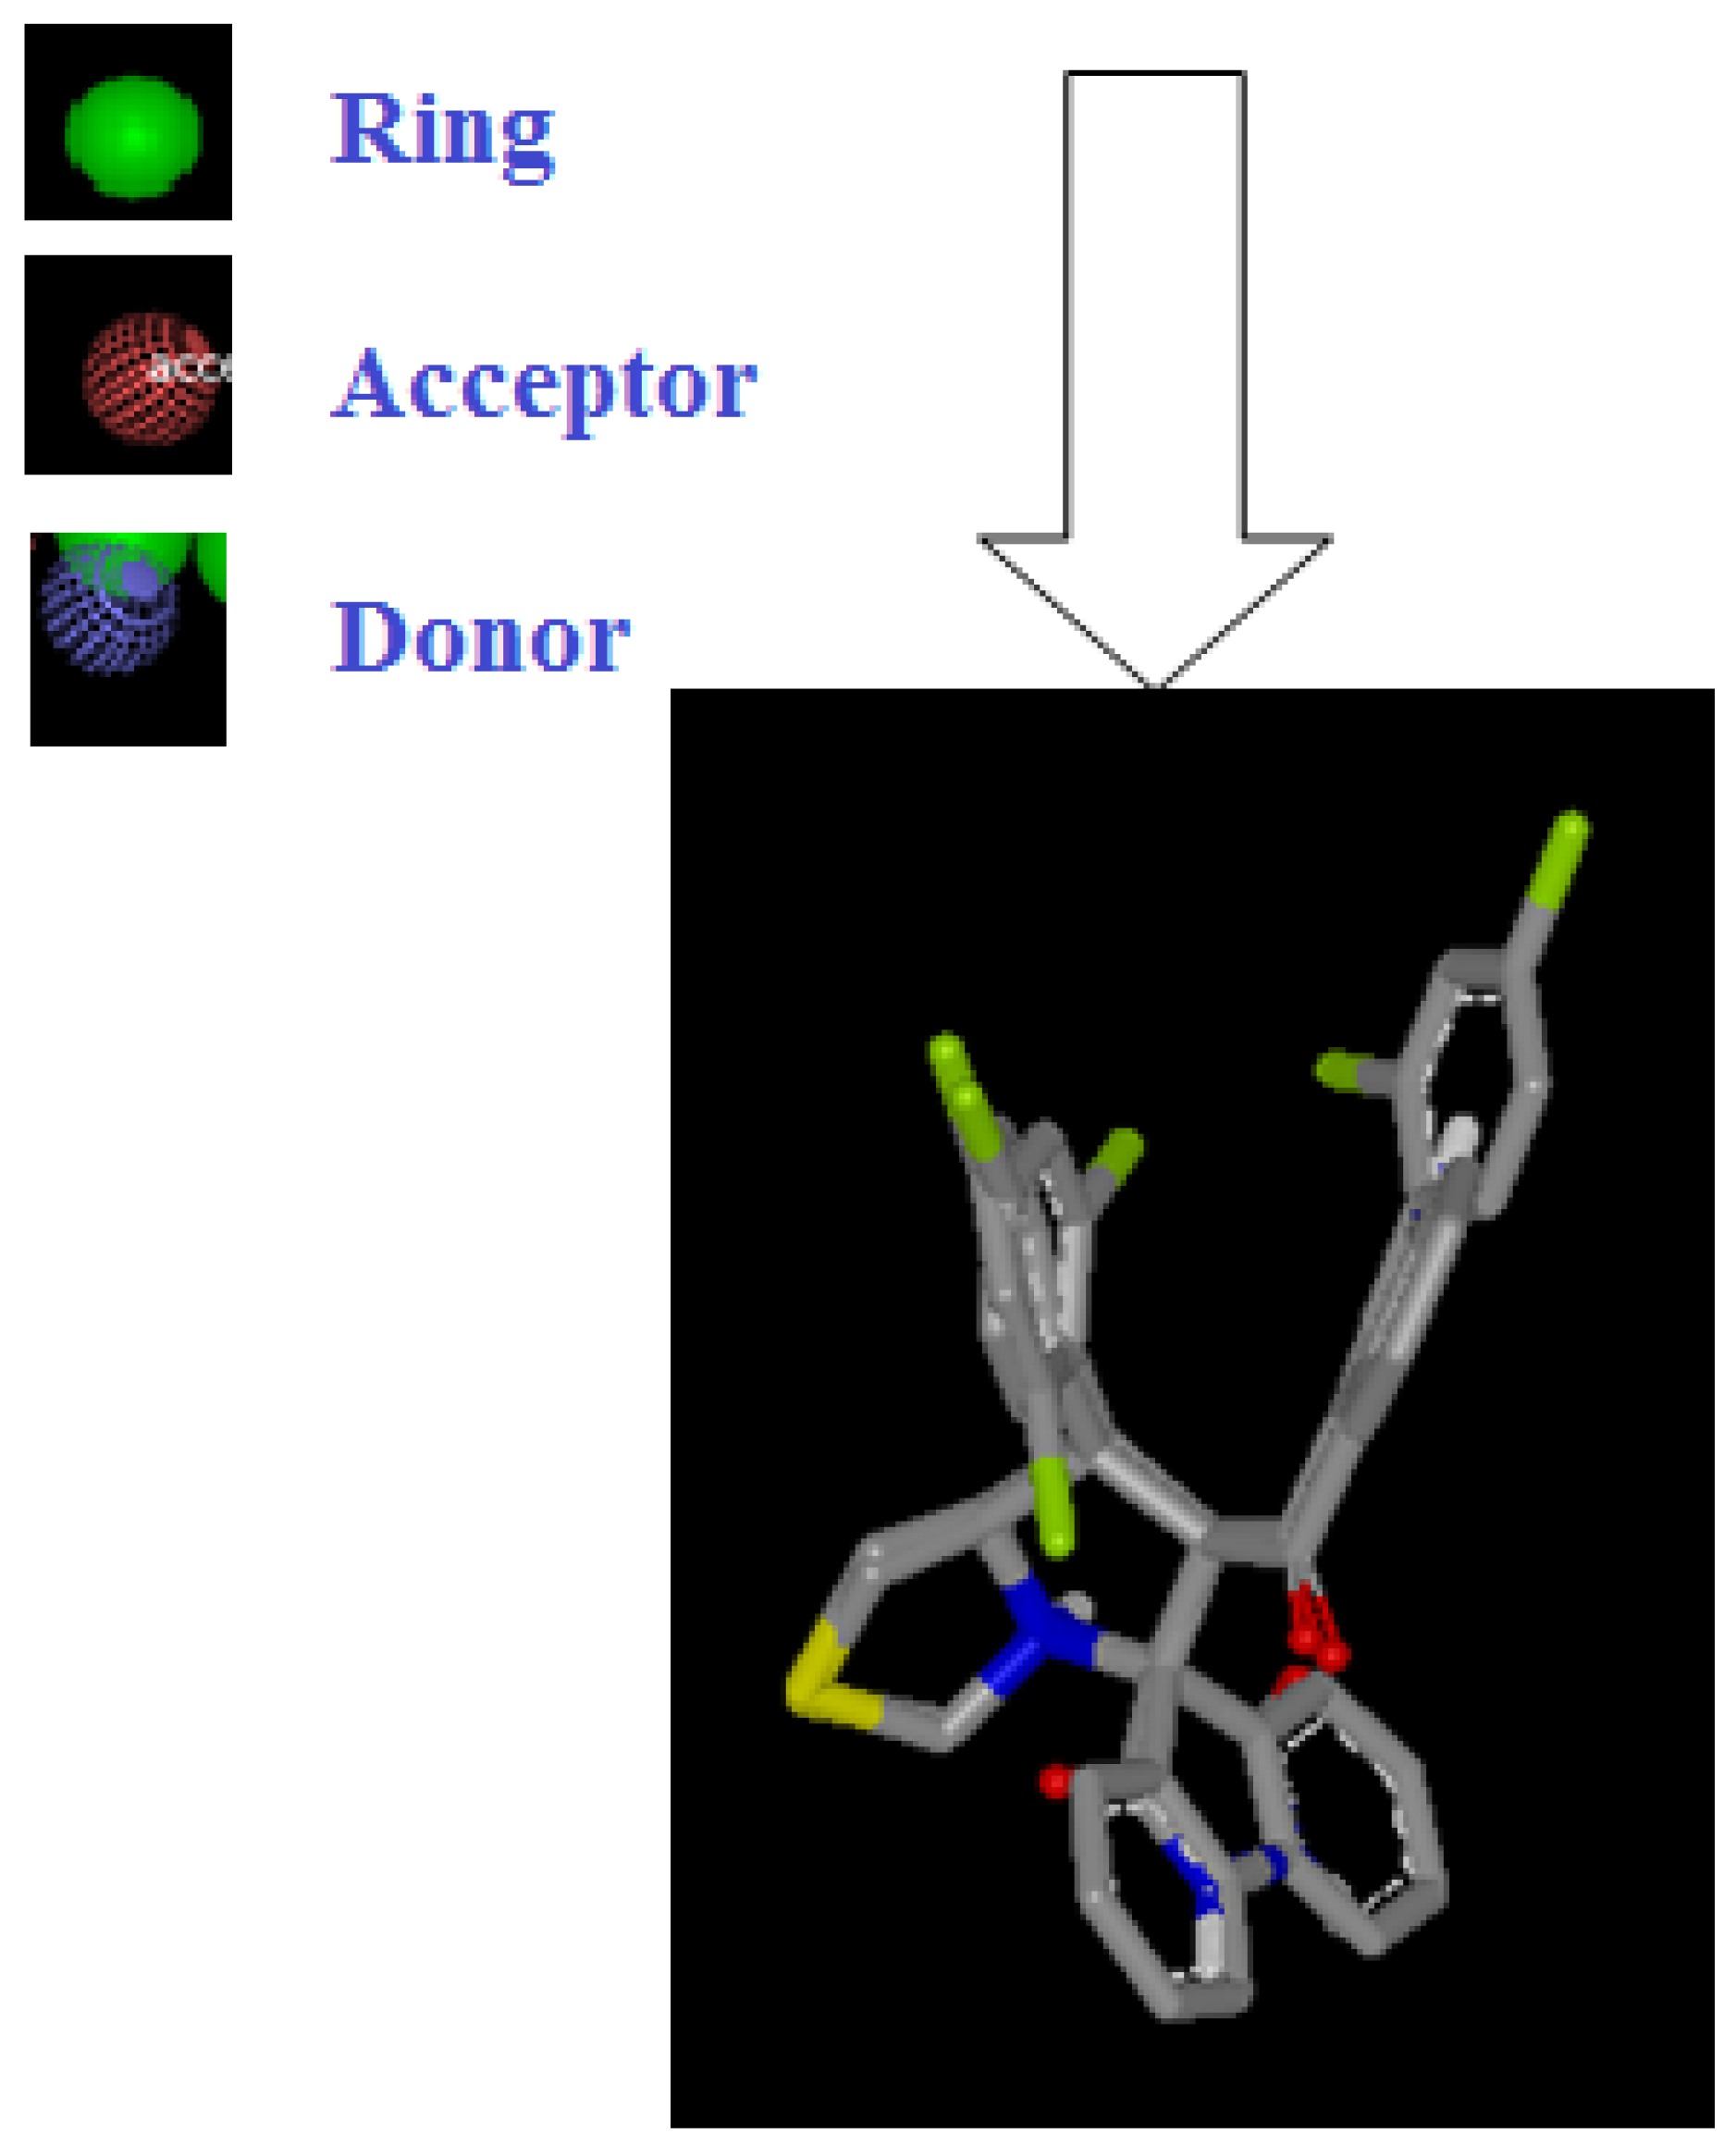
(A) Representation shape and color atoms of compound 4d by vROCS application; (B) representation shape and color atoms of compound I vROCS application.
Figure 20.
(A) Representation shape and color atoms of compound 4d by vROCS application; (B) representation shape and color atoms of compound I vROCS application.
Figure 21.
Representation shape of compound 4d overlay compound I vROCS application.
Figure 21.
Representation shape of compound 4d overlay compound I vROCS application.
Table 1.
Prescreening study for formulation of 4d-loaded proniosomes.
Table 1.
Prescreening study for formulation of 4d-loaded proniosomes.
| Formula | Time of Hydration (min) | * EE% |
|---|
| P1 | 2 | 81.94 ± 1.35 |
| P2 | 5 | 82.07 ± 1.79 |
| P3 | 30 | 82.04 ± 1.86 |
Table 2.
Experimental runs, independent variables, and dependent variables in 23 factorial design used for optimization of 4d-loaded proniosomes.
Table 2.
Experimental runs, independent variables, and dependent variables in 23 factorial design used for optimization of 4d-loaded proniosomes.
| Formula Code | | Variables |
|---|
| Independent | | Dependent |
|---|
| X1 | X2 | X3 | Y1 * | Y2 * |
|---|
| F1 | −1 | −1 | −1 | 81.94 ± 1.35 | 64.51 ± 1.59 |
| F2 | −1 | −1 | 1 | 71.38 ± 1.24 | 78.92 ± 1.97 |
| F3 # | −1 | 1 | −1 | 75.52 ± 1.23 | 87.16 ± 1.78 |
| F4 | −1 | 1 | 1 | 65.64 ± 1.34 | 93.26 ± 1.48 |
| F5 | 1 | −1 | −1 | 82.06 ± 2.31 | 55.87 ± 1.84 |
| F6 | 1 | −1 | 1 | 71.94 ± 1.33 | 71.76 ± 2.32 |
| F7 | 1 | 1 | −1 | 75.92 ± 1.38 | 74.88 ± 1.26 |
| F8 | 1 | | 1 | 65.93 ± 1.29 | 81.78 ± 1.42 |
| Independent Variables | Low (−1) | High (+1) |
| X1: Type of carrier | Maltodextrin | Mannitol |
| X2: Ratio of Sorbitan monooleate to CHOL (µmolar ratio) | 140:60 | 160:40 |
| X3: Volume of hydration (ml) | 10 | 15 |
Table 3.
Output data of the 23 factorial design of 4d-loaded proniosomes.
Table 3.
Output data of the 23 factorial design of 4d-loaded proniosomes.
| Responses | R2 | Adjusted R2 | Predicted R2 | Adequate Precision |
|---|
| EE% (Y1) | 0.9995 | 0.9992 | 0.9981 | 128.20 |
| Q12h (Y2) | 0.9549 | 0.9211 | 0.8197 | 15.52 |
Table 4.
ANOVA for the 23 factorial design of 4d-loaded proniosomes.
Table 4.
ANOVA for the 23 factorial design of 4d-loaded proniosomes.
| Depndent Variable | Source | SS | Df | MS | F-Value | p-Value |
|---|
| Y1 | Model | 279.64 | 3 | 93.21 | 2794 | <0.0001 |
| X1 | 0.23 | 1 | 0.23 | 7.03 | 0.0569 |
| X2 | 73.87 | 1 | 73.87 | 2214.22 | <0.0001 |
| X3 | 205.54 | 1 | 205.54 | 6160.74 | <0.0001 |
| Y2 | Model | 974.89 | 3 | 324.96 | 28.24 | 0.0038 |
| X1 | 195.64 | 1 | 195.64 | 17.00 | 0.0146 |
| X2 | 544.86 | 1 | 544.86 | 47.36 | 0.0023 |
| X3 | 234.38 | 1 | 234.38 | 20.37 | 0.0107 |
Table 5.
The calculated correlation coefficients for the in vitro release of 4d-loaded proniosomes employing different kinetic orders.
Table 5.
The calculated correlation coefficients for the in vitro release of 4d-loaded proniosomes employing different kinetic orders.
| Formula | Zero Order | First Order | Higuchi Model | Hixson Crowell | Korsmeyer–Pappas |
|---|
| F1 | 0.9950 | −0.9933 | 0.9809 | 0.9949 | 0.9858 |
| F2 | 0.9925 | −0.9897 | 0.9829 | 0.9926 | 0.9855 |
| F3 | 0.9869 | −0.9691 | 0.9720 | 0.9806 | 0.9698 |
| F4 | 0.9821 | −0.9711 | 0.9726 | 0.9800 | 0.9715 |
| F5 | 0.9936 | −0.9933 | 0.9792 | 0.9939 | 0.9866 |
| F6 | 0.9973 | −0.9847 | 0.9760 | 0.9905 | 0.9748 |
| F7 | 0.9979 | −0.9856 | 0.9798 | 0.9917 | 0.9775 |
| F8 | 0.9939 | −0.9805 | 0.9789 | 0.9897 | 0.9768 |
Table 6.
Effect of storage on the properties of the optimized proniosomal formula and the corresponding niosomal formula.
Table 6.
Effect of storage on the properties of the optimized proniosomal formula and the corresponding niosomal formula.
| Parameter | Proniosomal Formula | Niosomal Formula |
|---|
| Fresh | Stored | Fresh | Stored |
|---|
| Drug content (%) | 98.85 ± 1.45 | 96.63 ± 2.18 | 99.23 ± 1.45 | 91.84 ± 1.79 |
| EE (%) | 75.52 ± 1.23 | 71.33 ± 1.47 | 77.06 ± 1.33% | 50.13 ± 2.11% |
Table 7.
Summary of ligand efficiency scores for target compound-4d to be considered during fragment-based drug discovery (FBDD).
Table 7.
Summary of ligand efficiency scores for target compound-4d to be considered during fragment-based drug discovery (FBDD).
| | NNHA | Clog P (log K) | HCT-116 | HepG2 | PC-3 |
|---|
| 2 | 0.85 | 1.8 |
|---|
| pIC50 | LE | LLE | IC50 | LE | LEE | pIC50 | LE | LEE |
|---|
| Target compound-4d | 37 | 1.19 | 5.69 | 0.21 | 4.5 | 6.07 | 0.22 | 4.88 | 5.74 | 0.21 | 4.55 |
