


Prediction of Protein Targets in Ovarian Cancer Using a Ru-Complex and Carbon Dot Drug Delivery Therapeutic Nanosystems: A Bioinformatics and µ-FTIR Spectroscopy Approach
 , , , ,
  , , , , and
Abstract

1. Introduction
2. Materials and Methods
2.1. Materials
2.2. Bioinformatics Analysis
2.3. Preparation of A2780 Cells for µFTIR
2.4. Synchrotron Radiation Fourier Transform Infrared Micro-Spectroscopy (µFTIR)
2.5. Data Processing and Statistical Evaluation
3. Results and Discussion
3.1. Predicting Targets and Underlying Therapeutic Mechanisms of RuCN, RuCN/CDs, and RuCN/N-CDs in A2780 Ovarian Cancer Cells
PPI Networks
3.2. µFTIR Spectroscopy Study of Alterations of Cancer Cell Proteins’ Secondary Structures
Changes in Individual Secondary Structures of Proteins
3.3. Synergy of Bioinformatics and the FTIR Micro-Spectroscopy Approach
4. Conclusions
Supplementary Materials
Author Contributions
Funding
Institutional Review Board Statement
Informed Consent Statement
Data Availability Statement
Acknowledgments
Conflicts of Interest
References
- Desai, A.; Xu, J.; Aysola, K.; Qin, Y.; Okoli, C.; Hariprasad, R.; Chinemerem, U.; Gates, C.; Reddy, A.; Danner, O.; et al. Epithelial Ovarian Cancer: An Overview. World J. Transl. Med. 2014, 3, 1–8. [Google Scholar] [CrossRef] [PubMed]
- Gavas, S.; Quazi, S.; Karpiński, T.M. Nanoparticles for Cancer Therapy: Current Progress and Challenges. Nanoscale Res. Lett. 2021, 16, 173. [Google Scholar] [CrossRef] [PubMed]
- Bhatia, S.N.; Chen, X.; Dobrovolskaia, M.A.; Lammers, T. Cancer Nanomedicine. Nat. Rev. Cancer 2022, 22, 550–556. [Google Scholar] [CrossRef]
- Attia, M.F.; Anton, N.; Wallyn, J.; Omran, Z.; Vandamme, T.F. An Overview of Active and Passive Targeting Strategies to Improve the Nanocarriers Efficiency to Tumour Sites. J. Pharm. Pharmacol. 2019, 71, 1185–1198. [Google Scholar] [CrossRef]
- Bazak, R.; Houri, M.; Achy, S.E.; Hussein, W.; Refaat, T. Passive Targeting of Nanoparticles to Cancer: A Comprehensive Review of the Literature. Mol. Clin. Oncol. 2014, 2, 904–908. [Google Scholar] [CrossRef] [PubMed]
- Zhou, Y.; Lih, T.M.; Pan, J.; Höti, N.; Dong, M.; Cao, L.; Hu, Y.; Cho, K.-C.; Chen, S.-Y.; Eguez, R.V.; et al. Proteomic Signatures of 16 Major Types of Human Cancer Reveal Universal and Cancer-Type-Specific Proteins for the Identification of Potential Therapeutic Targets. J. Hematol. Oncol. 2020, 13, 170. [Google Scholar] [CrossRef] [PubMed]
- van der Watt, P.J.; Ngarande, E.; Leaner, V.D. Overexpression of Kpnβ1 and Kpnα2 Importin Proteins in Cancer Derives from Deregulated E2F Activity. PLoS ONE 2011, 6, e27723. [Google Scholar] [CrossRef] [PubMed]
- Li, S.; Huang, S.; Peng, S.-B. Overexpression of G Protein-Coupled Receptors in Cancer Cells: Involvement in Tumor Progression. Int. J. Oncol. 2005, 27, 1329–1338. [Google Scholar] [CrossRef]
- Schmit, K.; Michiels, C. TMEM Proteins in Cancer: A Review. Front. Pharmacol. 2018, 9, 1345. [Google Scholar] [CrossRef]
- Otto, T.; Sicinski, P. Cell Cycle Proteins as Promising Targets in Cancer Therapy. Nat. Rev. Cancer 2017, 17, 93–115. [Google Scholar] [CrossRef]
- Fabbro, D.; Ruetz, S.; Buchdunger, E.; Cowan-Jacob, S.W.; Fendrich, G.; Liebetanz, J.; Mestan, J.; O’Reilly, T.; Traxler, P.; Chaudhuri, B.; et al. Protein Kinases as Targets for Anticancer Agents: From Inhibitors to Useful Drugs. Pharmacol. Ther. 2002, 93, 79–98. [Google Scholar] [CrossRef] [PubMed]
- Golbaghi, G.; Pitard, I.; Lucas, M.; Haghdoost, M.M.; de Los Santos, Y.L.; Doucet, N.; Patten, S.A.; Sanderson, J.T.; Castonguay, A. Synthesis and Biological Assessment of a Ruthenium(II) Cyclopentadienyl Complex in Breast Cancer Cells and on the Development of Zebrafish Embryos. Eur. J. Med. Chem. 2020, 188, 112030. [Google Scholar] [CrossRef] [PubMed]
- Bruce, M.I.; Windsor, N.J. Cyclopentadienyl-Ruthenium and -Osmium Chemistry. IV. Convenient High-Yield Synthesis of Some Cyclopentadienyl Ruthenium or Osmium Tertiary Phosphine Halide Complexes. Aust. J. Chem. 1977, 30, 1601–1604. [Google Scholar] [CrossRef]
- Gill, T.P.; Mann, K.R. Photochemical Properties of the Cyclopentadienyl(.Eta.6-Benzene)Ruthenium(II) Cation. The Synthesis and Reactions of a Synthetically Useful Intermediate: The Cyclopentadienyltris(Acetonitrile)Ruthenium(II) Cation. Organometallics 1982, 1, 485–488. [Google Scholar] [CrossRef]
- Streu, C.; Carroll, P.J.; Kohli, R.K.; Meggers, E. Synthesis of Cyclopentadienyl Ruthenium Complexes Bearing Pendant Chelating Picolinates through an Electrophilic Precursor. J. Organomet. Chem. 2008, 693, 551–556. [Google Scholar] [CrossRef] [PubMed]
- Bregman, H.; Meggers, E. Ruthenium Half-Sandwich Complexes as Protein Kinase Inhibitors: An N-Succinimidyl Ester for Rapid Derivatizations of the Cyclopentadienyl Moiety. Org. Lett. 2006, 8, 5465–5468. [Google Scholar] [CrossRef] [PubMed]
- Zhang, L.; Carroll, P.; Meggers, E. Ruthenium Complexes as Protein Kinase Inhibitors. Org. Lett. 2004, 6, 521–523. [Google Scholar] [CrossRef] [PubMed]
- Nešić, M.D.; Dučić, T.; Gonçalves, M.; Stepić, M.; Algarra, M.; Soto, J.; Gemović, B.; Bandosz, T.J.; Petković, M. Biochemical Changes in Cancer Cells Induced by Photoactive Nanosystem Based on Carbon Dots Loaded with Ru-Complex. Chem.-Biol. Interact. 2022, 360, 109950. [Google Scholar] [CrossRef]
- Algarra, M.; Campos, B.; Radotic, K.; Mutavdzic, D.; Bandosz, T.; Jimenez-Jimenez, J.; Rodriguez-Castellon, E.; Esteves da Silva, J. Luminescent Carbon Nanoparticles: Effects of Chemical Functionalization, and Evaluation of Ag+ Sensing Properties. J. Mater. Chem. A 2014, 2, 8342–8351. [Google Scholar] [CrossRef]
- Houdová, D.; Soto, J.; Castro, R.; Rodrigues, J.; Soledad Pino-González, M.; Petković, M.; Bandosz, T.J.; Algarra, M. Chemically Heterogeneous Carbon Dots Enhanced Cholesterol Detection by MALDI TOF Mass Spectrometry. J. Colloid Interface Sci. 2021, 591, 373–383. [Google Scholar] [CrossRef]
- Veljkovic, V.A. Theoretical Approach to the Preselection of Carcinogens and Chemical Carcinogenesis; Gordon and Breach Science Publishers: London, UK, 1980; ISBN 978-0-677-05490-2. [Google Scholar]
- Sencanski, M.; Perovic, V.; Pajovic, S.B.; Adzic, M.; Paessler, S.; Glisic, S. Drug Repurposing for Candidate SARS-CoV-2 Main Protease Inhibitors by a Novel In Silico Method. Molecules 2020, 25, 3830. [Google Scholar] [CrossRef]
- Papatheodorou, I.; Moreno, P.; Manning, J.; Fuentes, A.M.-P.; George, N.; Fexova, S.; Fonseca, N.A.; Füllgrabe, A.; Green, M.; Huang, N.; et al. Expression Atlas Update: From Tissues to Single Cells. Nucleic Acids Res. 2020, 48, D77–D83. [Google Scholar] [CrossRef] [PubMed]
- Veljković, N.V.; Glišić, S.; Prljić, J.; Perović, V.R.; Botta, M.; Veljković, V. Discovery of New Therapeutic Targets by the Informational Spectrum Method. Curr. Protein Pept. Sci. 2008, 9, 493–506. [Google Scholar] [CrossRef] [PubMed]
- Veljkovic, N.; Glisic, S.; Perovic, V.; Veljkovic, V. The Role of Long-Range Intermolecular Interactions in Discovery of New Drugs. Expert Opin. Drug Discov. 2011, 6, 1263–1270. [Google Scholar] [CrossRef] [PubMed]
- Ma, X.; Xiong, Y.; Lee, L.T.O. Application of Nanoparticles for Targeting G Protein-Coupled Receptors. Int. J. Mol. Sci. 2018, 19, 2006. [Google Scholar] [CrossRef] [PubMed]
- Sherman, B.T.; Hao, M.; Qiu, J.; Jiao, X.; Baseler, M.W.; Lane, H.C.; Imamichi, T.; Chang, W. DAVID: A Web Server for Functional Enrichment Analysis and Functional Annotation of Gene Lists (2021 Update). Nucleic Acids Res. 2022, 50, W216–W221. [Google Scholar] [CrossRef] [PubMed]
- Ashburner, M.; Ball, C.A.; Blake, J.A.; Botstein, D.; Butler, H.; Cherry, J.M.; Davis, A.P.; Dolinski, K.; Dwight, S.S.; Eppig, J.T.; et al. Gene Ontology: Tool for the Unification of Biology. The Gene Ontology Consortium. Nat. Genet. 2000, 25, 25–29. [Google Scholar] [CrossRef] [PubMed]
- Gene Ontology Consortium. The Gene Ontology Resource: Enriching a GOld Mine. Nucleic Acids Res. 2021, 49, D325–D334. [Google Scholar] [CrossRef]
- Köhler, S.; Gargano, M.; Matentzoglu, N.; Carmody, L.C.; Lewis-Smith, D.; Vasilevsky, N.A.; Danis, D.; Balagura, G.; Baynam, G.; Brower, A.M.; et al. The Human Phenotype Ontology in 2021. Nucleic Acids Res. 2021, 49, D1207–D1217. [Google Scholar] [CrossRef]
- Human Phenotype Ontology. Available online: https://hpo.jax.org/app/browse/term/HP:0100615 (accessed on 16 April 2024).
- Szklarczyk, D.; Gable, A.L.; Lyon, D.; Junge, A.; Wyder, S.; Huerta-Cepas, J.; Simonovic, M.; Doncheva, N.T.; Morris, J.H.; Bork, P.; et al. STRING V11: Protein-Protein Association Networks with Increased Coverage, Supporting Functional Discovery in Genome-Wide Experimental Datasets. Nucleic Acids Res. 2019, 47, D607–D613. [Google Scholar] [CrossRef]
- Zhao, Y.; Aguilar, A.; Bernard, D.; Wang, S. Small-Molecule Inhibitors of the MDM2-P53 Protein-Protein Interaction (MDM2 Inhibitors) in Clinical Trials for Cancer Treatment. J. Med. Chem. 2015, 58, 1038–1052. [Google Scholar] [CrossRef]
- Shariati, M.; Meric-Bernstam, F. Targeting AKT for Cancer Therapy. Expert Opin. Investig. Drugs 2019, 28, 977–988. [Google Scholar] [CrossRef] [PubMed]
- Derenne, A.; Mignolet, A.; Goormaghtigh, E. FTIR Spectral Signature of Anticancer Drug Effects on PC-3 Cancer Cells: Is There Any Influence of the Cell Cycle? Analyst 2013, 138, 3998–4005. [Google Scholar] [CrossRef] [PubMed]
- Mignolet, A.; Derenne, A.; Smolina, M.; Wood, B.R.; Goormaghtigh, E. FTIR Spectral Signature of Anticancer Drugs. Can Drug Mode of Action Be Identified? Biochim. Biophys. Acta 2016, 1864, 85–101. [Google Scholar] [CrossRef]
- Krimm, S.; Bandekar, J. Vibrational Spectroscopy and Conformation of Peptides, Polypeptides, and Proteins. Adv. Protein Chem. 1986, 38, 181–364. [Google Scholar] [CrossRef]
- Usoltsev, D.; Sitnikova, V.; Kajava, A.; Uspenskaya, M. Systematic FTIR Spectroscopy Study of the Secondary Structure Changes in Human Serum Albumin under Various Denaturation Conditions. Biomolecules 2019, 9, 359. [Google Scholar] [CrossRef] [PubMed]
- Travlou, N.; Giannakoudakis, D.; Algarra, M.; Labella, A.; Rodríguez-Castellon, E.; Bandos, T. S- and N-doped carbon quantum dots: Surface chemistry dependent antibacterial activity. Carbon 2018, 135, 104–111. [Google Scholar] [CrossRef]
- Myshakina, N.S.; Ahmed, Z.; Asher, S.A. Dependence of Amide Vibrations on Hydrogen Bonding. J. Phys. Chem. B 2008, 112, 11873–11877. [Google Scholar] [CrossRef]
- Barth, A. Infrared Spectroscopy of Proteins. Biochim. Biophys. Acta 2007, 1767, 1073–1101. [Google Scholar] [CrossRef]
- Fabian, H.; Naumann, D. (Eds.) Protein Folding and Misfolding: Shining Light by Infrared Spectroscopy; Biological and Medical Physics, Biomedical Engineering; Springer: Berlin/Heidelberg, Germany, 2012; ISBN 978-3-642-22229-0. [Google Scholar] [CrossRef]
- Jackson, M.; Mantsch, H.H. The Use and Misuse of FTIR Spectroscopy in the Determination of Protein Structure. Crit. Rev. Biochem. Mol. Biol. 1995, 30, 95–120. [Google Scholar] [CrossRef]
- Sadat, A.; Joye, I.J. Peak Fitting Applied to Fourier Transform Infrared and Raman Spectroscopic Analysis of Proteins. Appl. Sci. 2020, 10, 5918. [Google Scholar] [CrossRef]
- Usoltsev, D.; Sitnikova, V.; Kajava, A.; Uspenskaya, M. FTIR Spectroscopy Study of the Secondary Structure Changes in Human Serum Albumin and Trypsin under Neutral Salts. Biomolecules 2020, 10, 606. [Google Scholar] [CrossRef]
- Kunachowicz, D.; Ściskalska, M.; Jakubek, M.; Kizek, R.; Kepinska, M. Structural Changes in Selected Human Proteins Induced by Exposure to Quantum Dots, Their Biological Relevance and Possible Biomedical Applications. NanoImpact 2022, 26, 100405. [Google Scholar] [CrossRef]
- Kreuzer, M.; Dučić, T.; Hawlina, M.; Andjelic, S. Synchrotron-Based FTIR Microspectroscopy of Protein Aggregation and Lipids Peroxidation Changes in Human Cataractous Lens Epithelial Cells. Sci. Rep. 2020, 10, 15489. [Google Scholar] [CrossRef] [PubMed]
- Piccirilli, F.; Schirò, G.; Vetri, V.; Lupi, S.; Perucchi, A.; Militello, V. Decoding Vibrational States of Concanavalin A Amyloid Fibrils. Biophys. Chem. 2015, 199, 17–24. [Google Scholar] [CrossRef] [PubMed]
- Titus, J.; Ghimire, H.; Viennois, E.; Merlin, D.; Unil Perera, A.G. Protein Secondary Structure Analysis of Dried Blood Serum Using Infrared Spectroscopy to Identify Markers for Colitis Screening. J. Biophotonics 2018, 11, e201700057. [Google Scholar] [CrossRef]
- Bellisola, G.; Della Peruta, M.; Vezzalini, M.; Moratti, E.; Vaccari, L.; Birarda, G.; Piccinini, M.; Cinque, G.; Sorio, C. Tracking Infrared Signatures of Drugs in Cancer Cells by Fourier Transform Microspectroscopy. Analyst 2010, 135, 3077–3086. [Google Scholar] [CrossRef] [PubMed]
- Movasaghi, Z.; Rehman, S.; Ur Rehman, D.I. Fourier Transform Infrared (FTIR) Spectroscopy of Biological Tissues. Appl. Spectrosc. Rev. 2008, 43, 134–179. [Google Scholar] [CrossRef]
- Wong, P.T.; Wong, R.K.; Caputo, T.A.; Godwin, T.A.; Rigas, B. Infrared Spectroscopy of Exfoliated Human Cervical Cells: Evidence of Extensive Structural Changes during Carcinogenesis. Proc. Natl. Acad. Sci. USA 1991, 88, 10988–10992. [Google Scholar] [CrossRef]
- Wu, B.-B.; Gong, Y.-P.; Wu, X.-H.; Chen, Y.-Y.; Chen, F.-F.; Jin, L.-T.; Cheng, B.-R.; Hu, F.; Xiong, B. Fourier Transform Infrared Spectroscopy for the Distinction of MCF-7 Cells Treated with Different Concentrations of 5-Fluorouracil. J. Transl. Med. 2015, 13, 108. [Google Scholar] [CrossRef]
- Rigas, B.; Morgello, S.; Goldman, I.S.; Wong, P.T. Human Colorectal Cancers Display Abnormal Fourier-Transform Infrared Spectra. Proc. Natl. Acad. Sci. USA 1990, 87, 8140–8144. [Google Scholar] [CrossRef]
- Bishop, J.M. Viral Oncogenes. Cell 1985, 42, 23–38. [Google Scholar] [CrossRef]
- Veena, M.S.; Wilken, R.; Zheng, J.-Y.; Gholkar, A.; Venkatesan, N.; Vira, D.; Ahmed, S.; Basak, S.K.; Dalgard, C.L.; Ravichandran, S.; et al. P16 Protein and Gigaxonin Are Associated with the Ubiquitination of NFκB in Cisplatin-Induced Senescence of Cancer Cells. J. Biol. Chem. 2014, 289, 34921–34937. [Google Scholar] [CrossRef]
- Pramono, A.A.; Rather, G.M.; Herman, H.; Lestari, K.; Bertino, J.R. NAD- and NADPH-Contributing Enzymes as Therapeutic Targets in Cancer: An Overview. Biomolecules 2020, 10, 358. [Google Scholar] [CrossRef]
- Nešić, M.D.; Dučić, T.; Algarra, M.; Popović, I.; Stepić, M.; Gonçalves, M.; Petković, M. Lipid Status of A2780 Ovarian Cancer Cells after Treatment with Ruthenium Complex Modified with Carbon Dot Nanocarriers: A Multimodal SR-FTIR Spectroscopy and MALDI TOF Mass Spectrometry Study. Cancers 2022, 14, 1182. [Google Scholar] [CrossRef]

| Protein Group | Protein | Part of the Protein with a Known Secondary Structure | Secondary Structure | Contribution of α-Helices and β-Sheets to the Protein Structure |
|---|---|---|---|---|
| NADH [ubiquinone] dehydrogenases | NDUFA1 | 1–70 (70 aa) | 5 helices 11 helix–helix interactions, 5 beta turns, 1 gamma turn | 45.45% |
| NDUFA3 | 2–84 (84 aa) | 1 sheet 1 strand 4 helices 9 helix–helix interactions, 4 beta turns, 2 gamma turns | 8.30% 33.33% | |
| NDUFA8 | 4–172 (172 aa) | 1 sheet 1 strand 7 helices 14 helix–helix interactions, 17 beta turns, 4 gamma turns 1 disulphide | 3.22% 22.58% | |
| NDUFB1 | 3–58 (58 aa) | 4 helices 10 helix–helix interactions, 6 beta turns | 40% | |
| NDUFB5 | 52–189 (189 aa) | 6 helices 20 helix–helix interactions, 5 beta turns, 2 gamma turns | 46.15% | |
| NDUFB7 | 3–124 (137 aa) | 5 helices 4 helix–helix interactions, 9 beta turns, 3 gamma turns, 1 disulphide | 29% | |
| NDUFS1 | 30–716 (727 aa) | 6 sheets 1 beta alpha beta unit, 6 beta hairpins, 3 beta bulges, 15 strands 27 helices 33 helix–helix interactions, 82 beta turns, 14 gamma turns | 17.65% 3.92% | |
| NDUFS5 | 2–105 (106 aa) | 7 helices 8 helix–helix interactions, 13 beta turns, 4 gamma turns, 2 disulphides | 26.92% | |
| NDUFS6 | 29–123 (124 aa) | 2 sheets 1 beta hairpin, 4 strands 2 helices 1 helix–helix interaction, 11 beta turns,1 gamma turn | 9.52% 9.52% | |
| Mitochondrial ribosomal proteins | MRPL18 | 1–180 (180 aa) | 2 sheets 2 beta hairpins, 1 beta bulge, 5 strands 5 helices 12 helix–helix interactions, 12 beta turns, 3 gamma turns | 6.66% 16.66% |
| MRPL21 | 1–205 (205 aa) | 3 sheets 3 beta hairpins, 5 beta bulges, 10 strands 1 helix 1 helix–helix interaction, 11 beta turns, 1 gamma turn | 8.82% 2.94% | |
| MRPL36 | 1–103 (103 aa) | 1 sheet 2 beta hairpins, 3 strands 1 helix 6 beta turns | 7.69% 7.69% | |
| MRPL50 | 1–158 (158 aa) | 1 sheet 1 strand 5 helices 4 helix–helix interactions, 10 beta turns | 5.88% 29.41% | |
| MRPS30 | 1–439 (439 aa) | 2 sheets 1 beta alpha beta unit, 3 beta hairpins, 3 beta bulges, 12 strands 12 helices 14 helix–helix interactions, 29 beta turns, 10 gamma turns | 2.81% 16.90% | |
| Mitochondrial ATP synthase subunits | ATP6V1F | 1–119 (119 aa) | 1 sheet 2 beta alpha beta units, 1 beta bulge, 3 strands 4 helices 6 helix–helix interactions, 17 beta turns, 3 gamma turns | 6.89% 13.79% |
| NADH-ubiquinone oxidoreductases | MT-ND3 | 1–115 (115 aa) | 4 helices 22 helix–helix interactions, 7 beta turns, 2 gamma turns | 30.70% |
| MT-ND6 | 1–174 (174 aa) | 9 helices 30 helix–helix interactions, 12 beta turns, 6 gamma turns | 33.33% | |
| Cytochrome b-c1 complex subunits | UQCRH | 17–91 (91 aa) | 4 helices 7 helix–helix interactions, 5 beta turns, 1 gamma turn | 40% |
| UQCR1 | 2–63 (63 aa) | 3 helices 6 helix–helix interactions, 6 beta turns | 33.33% | |
| HIG1 domain family member 1A, mitochondrial | HIGD1A | 1–93 (93 aa) | 3 helices 1 helix–helix interaction, 5 beta turns 7 gamma turns | 20% |
| Dual specificity protein phosphatase 18 | DUSP18 | 1–188 (188 aa) | 2 sheets 2 beta hairpins, 1 beta bulge, 7 strands 8 helices 8 helix–helix interactions, 8 beta turns, 4 gamma turns | 6.25% 5.00% |
| Cytochrome c oxidase subunit 7B, mitochondrial | COX7B | 30–78 (80 aa) | 1 helix 3 helix–helix interactions, 2 beta turns | 33.33% |
| HPO Protein | ISM Protein in the PPI Network of HPO Protein | S/N Value in the CS of ISM Protein and RuCN |
|---|---|---|
| MDM2 (6) | YWHAQ | 11.68431 |
| RASSF3 | 9.9321 | |
| SFN(AKT1)—2 | 8.26526 | |
| UBE2E3 | 7.55273 | |
| ARRB1 (PRKN)—2 | 7.40497 | |
| YWHAZ (AKT1, FGFR2)—3 | 6.60843 | |
| SQSTM1 | 13.47355 | |
| PRKN (6) | LIMK1 | 11.41166 |
| PSMB4 | 10.03283 | |
| RHOT2 | 9.66055 | |
| CDK5 | 7.97013 | |
| ARRB1 (MDM2)—2 | 7.40497 | |
| SFN (MDM2)—2 | 8.26526 | |
| HSPB1 (TP53)—2 | 8.24698 | |
| SMAD3 (SMAD4, TGFBR2)—3 | 8.13051 | |
| AKT1 (5) | EGLN1 | 7.58537 |
| YWHAZ (FGFR2, MDM2)—3 | 6.60843 | |
| KDM6B | 14.78335 | |
| SMAD4 (4) | ACVR1B (TGFBR2)—2 | 9.87143 |
| RAN | 9.42564 | |
| SMAD3 (AKT1, TGFBR2)—3 | 8.13051 | |
| ACACA | 10.60752 | |
| BRCA1 (3) | TERF2IP (MRE11, NBN, RAD50)—4 | 9.37372 |
| FAM111A | 6.8921 | |
| BCL9 | 13.42896 | |
| CTNNB1 (3) | CTNNA1 (CDH1)—2 | 10.23149 |
| PSEN2 | 8.155 | |
| BAK1 | 16.43688 | |
| TP53 (3) | HSPB1 (AKT1)—2 | 8.24698 |
| BCL2L2 | 7.12573 | |
| MRE11 (2) | TERF2IP (BRCA1, NBN, RAD50)—4 | 9.37372 |
| CHAMP1 (RAD50)—2 | 9.33687 | |
| RAD50 (2) | TERF2IP (BRCA1, MRE11, NBN)—4 | 9.37372 |
| CHAMP1 (MRE11)—2 | 9.33687 | |
| TGFBR2 (2) | ACVR1B (SMAD4)—2 | 9.87143 |
| SMAD3 (AKT1, SMAD4)—3 | 8.13051 | |
| CDH1 (1) | CTNNA1 (CTNNB1)—2 | 10.23149 |
| CDKN2A (1) | PSMC3 | 7.13755 |
| CHEK2 (1) | GINS2 | 6.01104 |
| DICER1 (1) | TARBP2 | 6.7722 |
| EWSR1 (1) | EIF4H | 10.70126 |
| FGFR2 (1) | YWHAZ (AKT1, MDM2)—3 | 6.60843 |
| GATA4 (1) | FOS | 11.15809 |
| IDH1 (1) | DAZAP1 | 10.26606 |
| LMNA (1) | LMNB2 | 11.67122 |
| MSH2 (1) | FBXO5 | 8.00492 |
| NBN (1) | TERF2IP (BRCA1, MRE11, RAD50)—4 | 9.37372 |
| PALB2 (1) | MORF4L2 | 8.04956 |
| RAD51 (1) | RAD51AP1 | 14.51291 |
| RAD51D (1) | AMOTL2 | 7.63458 |
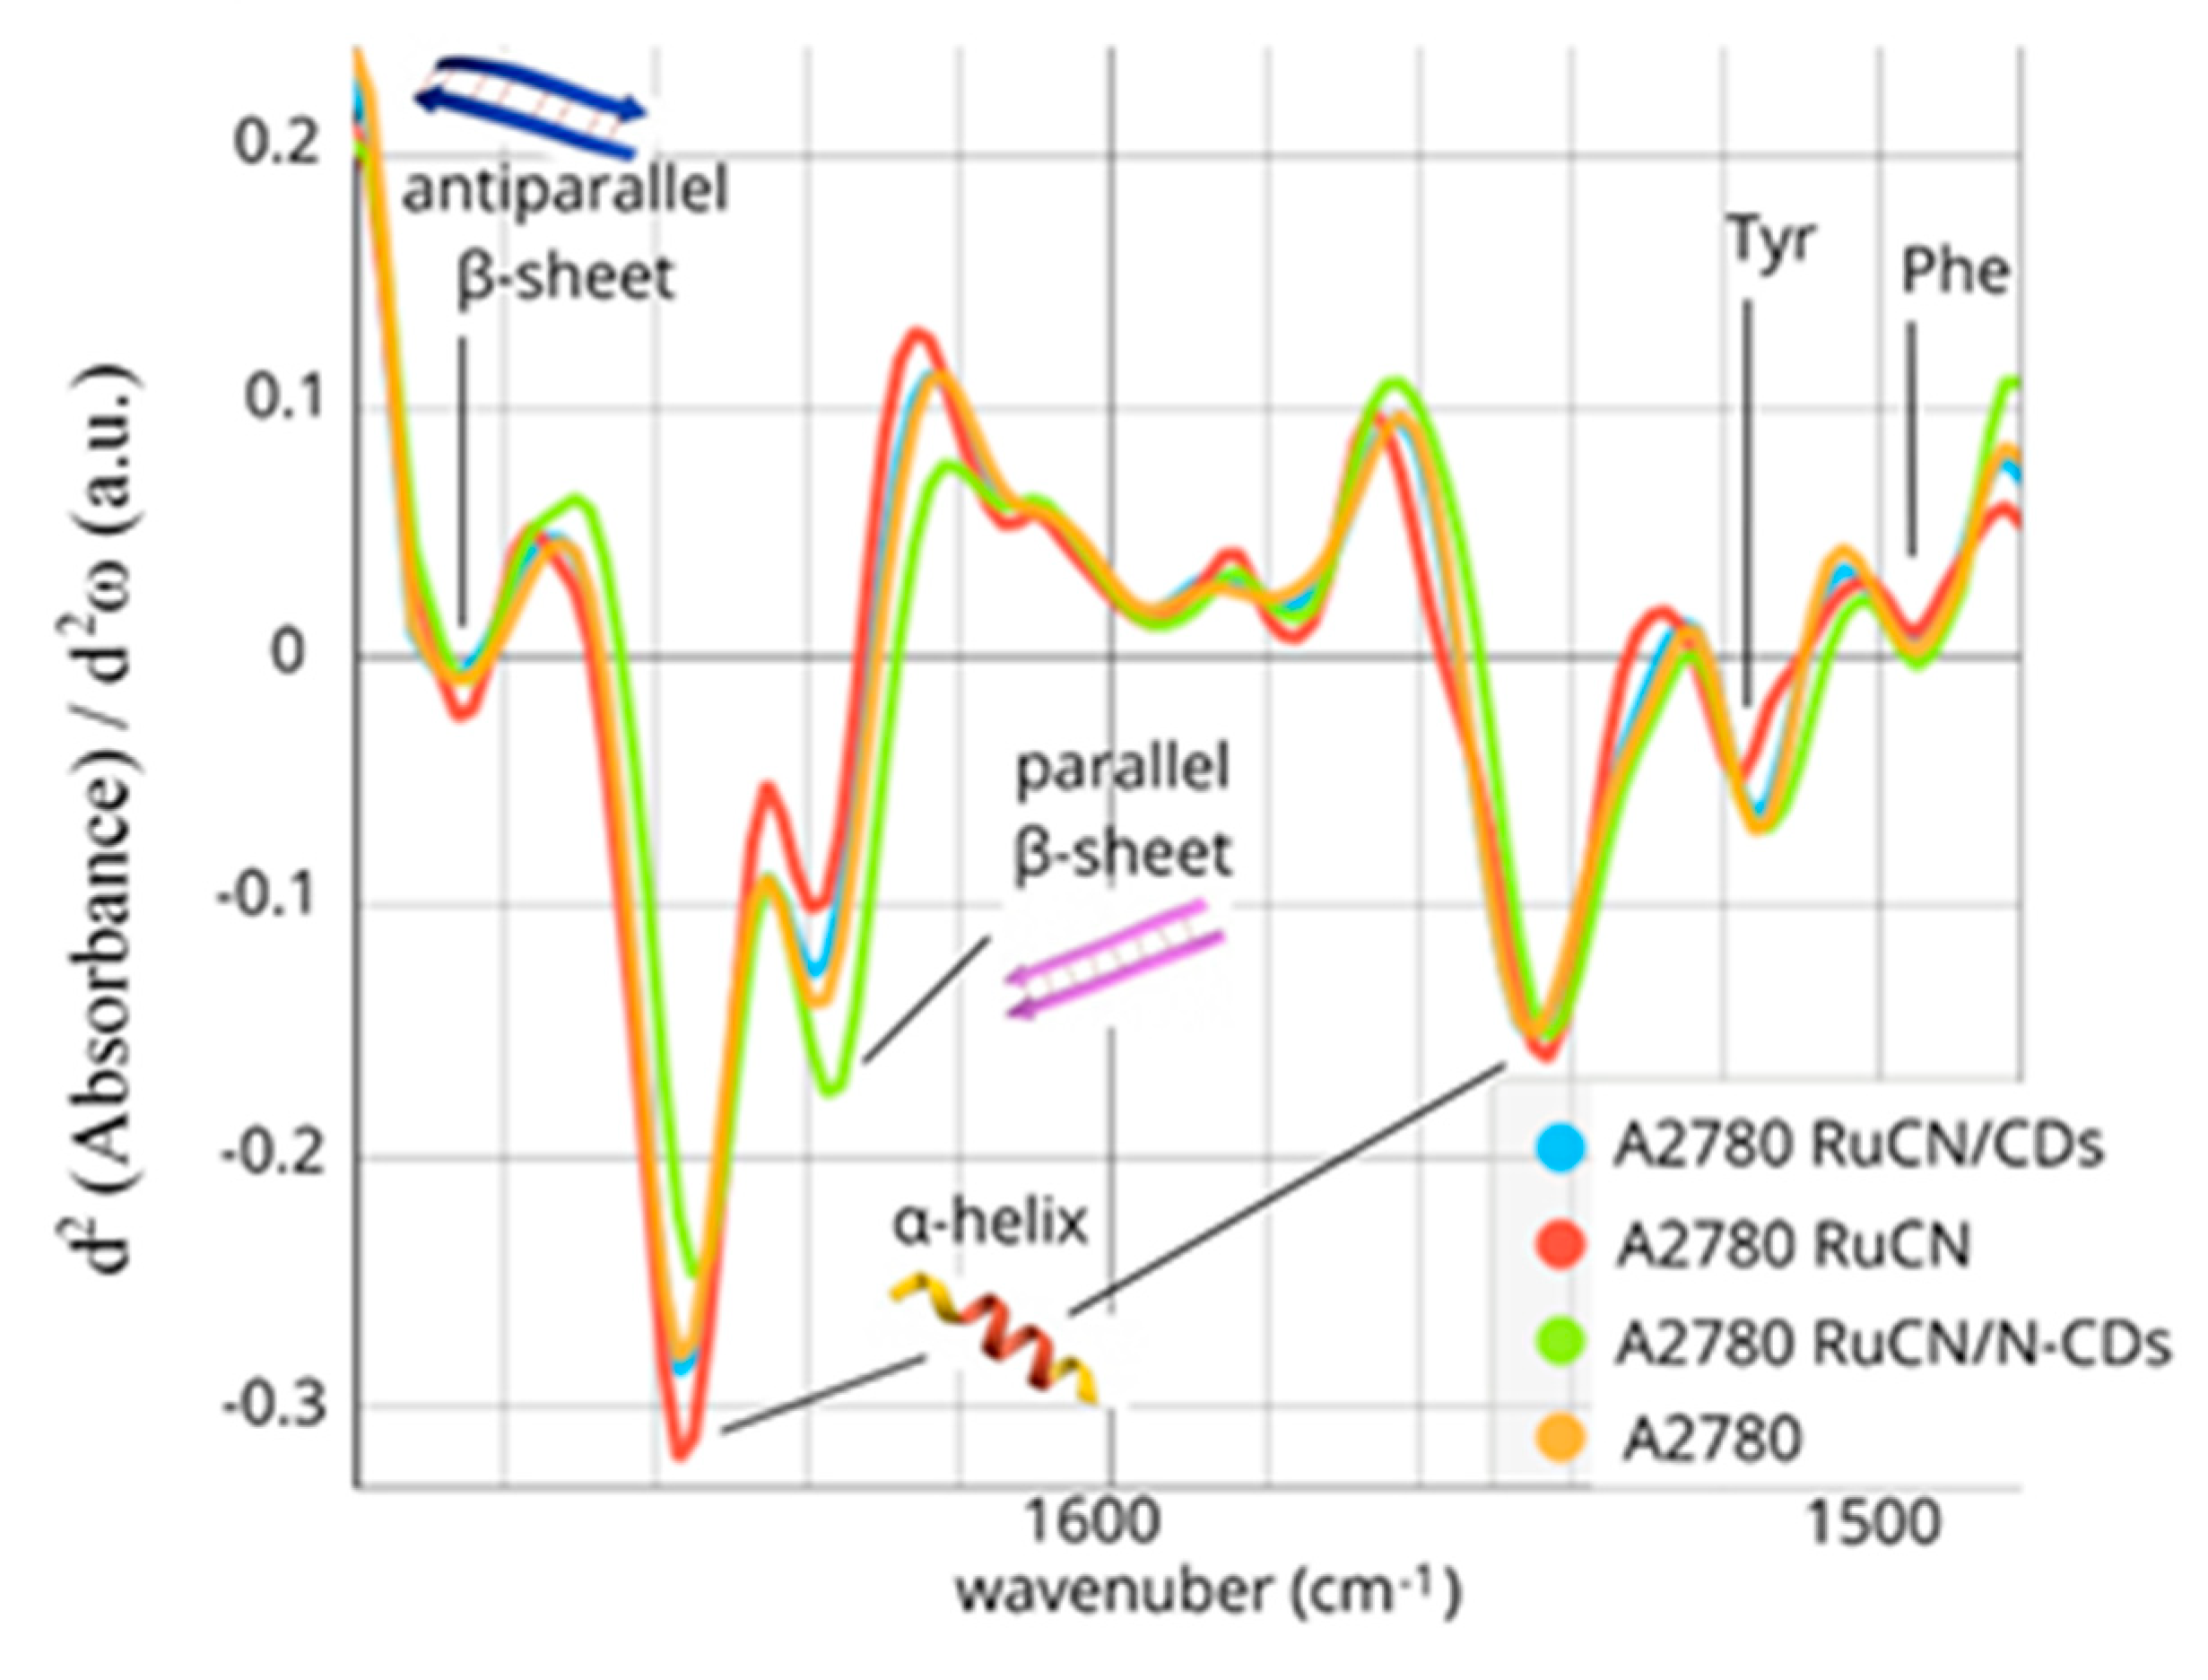
| Frequency (cm−1) | Band Assignment |
|---|---|
| 1685 | Antiparallel β-sheet |
| 1656 | α-helix |
| 1635 | Parallel β-sheet |
| 1543 | α-helix |
| 1515 | Tyrosine (Tyr) |
| 1495 | Phenylalanine (Phe) |
Disclaimer/Publisher’s Note: The statements, opinions and data contained in all publications are solely those of the individual author(s) and contributor(s) and not of MDPI and/or the editor(s). MDPI and/or the editor(s) disclaim responsibility for any injury to people or property resulting from any ideas, methods, instructions or products referred to in the content. |
© 2024 by the authors. Licensee MDPI, Basel, Switzerland. This article is an open access article distributed under the terms and conditions of the Creative Commons Attribution (CC BY) license (https://creativecommons.org/licenses/by/4.0/).
Share and Cite
Nešić, M.D.; Dučić, T.; Gemović, B.; Senćanski, M.; Algarra, M.; Gonçalves, M.; Stepić, M.; Popović, I.A.; Kapuran, Đ.; Petković, M. Prediction of Protein Targets in Ovarian Cancer Using a Ru-Complex and Carbon Dot Drug Delivery Therapeutic Nanosystems: A Bioinformatics and µ-FTIR Spectroscopy Approach. Pharmaceutics 2024, 16, 997. https://doi.org/10.3390/pharmaceutics16080997
Nešić MD, Dučić T, Gemović B, Senćanski M, Algarra M, Gonçalves M, Stepić M, Popović IA, Kapuran Đ, Petković M. Prediction of Protein Targets in Ovarian Cancer Using a Ru-Complex and Carbon Dot Drug Delivery Therapeutic Nanosystems: A Bioinformatics and µ-FTIR Spectroscopy Approach. Pharmaceutics. 2024; 16(8):997. https://doi.org/10.3390/pharmaceutics16080997
Chicago/Turabian StyleNešić, Maja D., Tanja Dučić, Branislava Gemović, Milan Senćanski, Manuel Algarra, Mara Gonçalves, Milutin Stepić, Iva A. Popović, Đorđe Kapuran, and Marijana Petković. 2024. "Prediction of Protein Targets in Ovarian Cancer Using a Ru-Complex and Carbon Dot Drug Delivery Therapeutic Nanosystems: A Bioinformatics and µ-FTIR Spectroscopy Approach" Pharmaceutics 16, no. 8: 997. https://doi.org/10.3390/pharmaceutics16080997
APA StyleNešić, M. D., Dučić, T., Gemović, B., Senćanski, M., Algarra, M., Gonçalves, M., Stepić, M., Popović, I. A., Kapuran, Đ., & Petković, M. (2024). Prediction of Protein Targets in Ovarian Cancer Using a Ru-Complex and Carbon Dot Drug Delivery Therapeutic Nanosystems: A Bioinformatics and µ-FTIR Spectroscopy Approach. Pharmaceutics, 16(8), 997. https://doi.org/10.3390/pharmaceutics16080997