
Enhancing Osteoporosis Treatment through Targeted Nanoparticle Delivery of Risedronate: In Vivo Evaluation and Bioavailability Enhancement


 , ,
, ,
Abstract
: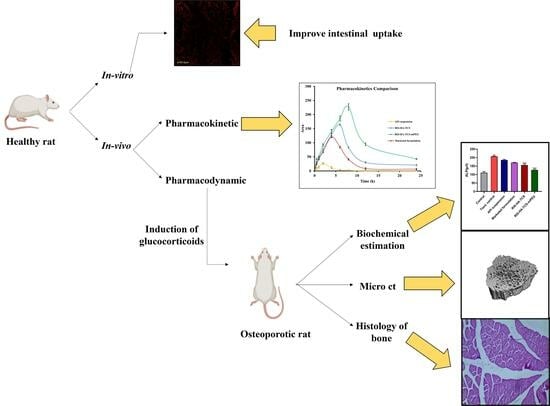
1. Introduction
2. Materials and Methods
2.1. Materials
2.2. Preparation of RIS-HA-TCS-mPEG Nanoparticles
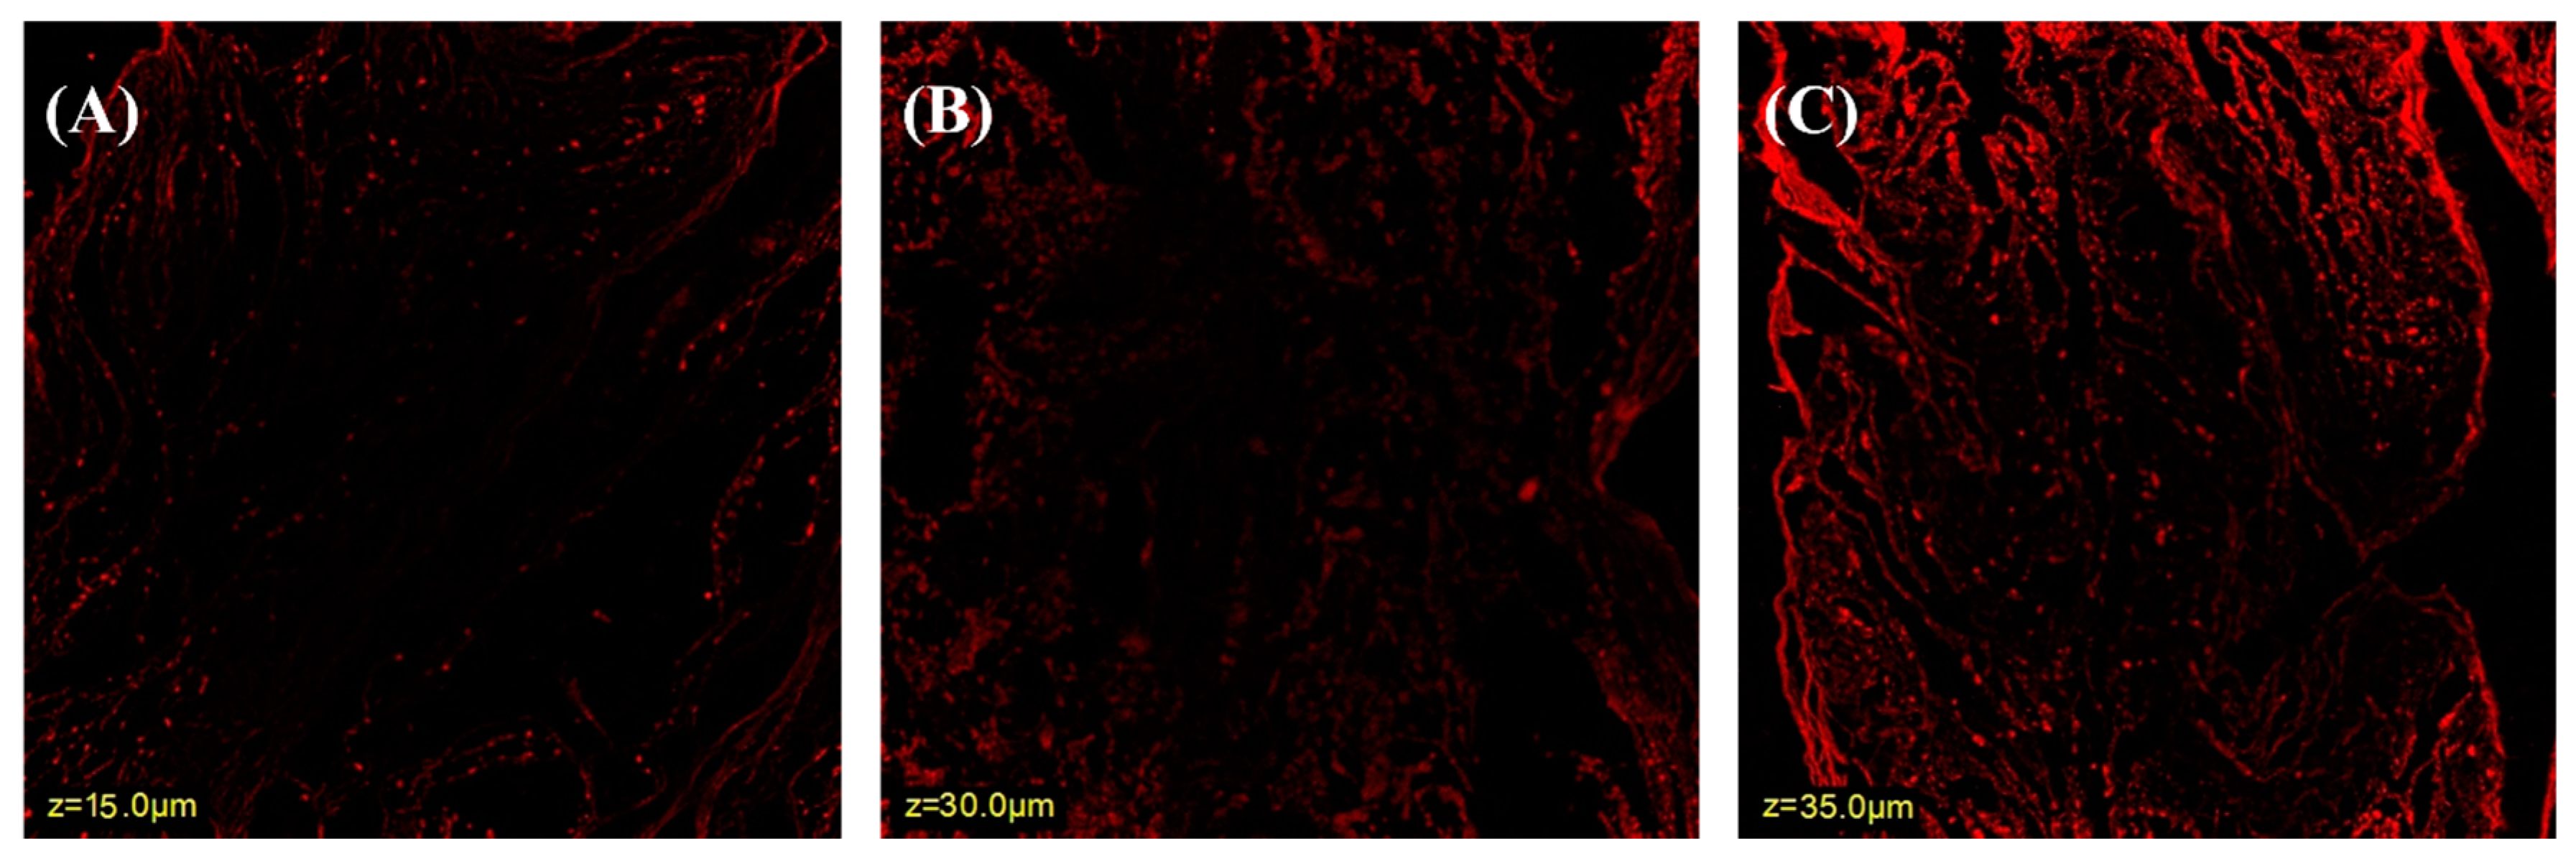
2.3. Confocal Laser Scanning Microscope (CLSM)
2.4. In Vivo Pharmacodynamic Studies
2.4.1. Animals
2.4.2. Study Design
2.4.3. Biochemical Analysis
2.4.4. Histology of Bone’s Internal Structure
2.4.5. Micro-Computed Tomography (µCT) Analysis of Bone
2.5. In Vivo Pharmacokinetic Studies
Animal Dosing and Sample Collection
2.6. In Vivo Histopathological Study of Organs
2.7. Shelf-Life Determination
3. Results and Discussion
3.1. Preparation of RIS -HA-TCS-mPEG Nanoparticles
3.2. Confocal Laser Scanning Microscopy
3.3. In Vivo Pharmacodynamic Study
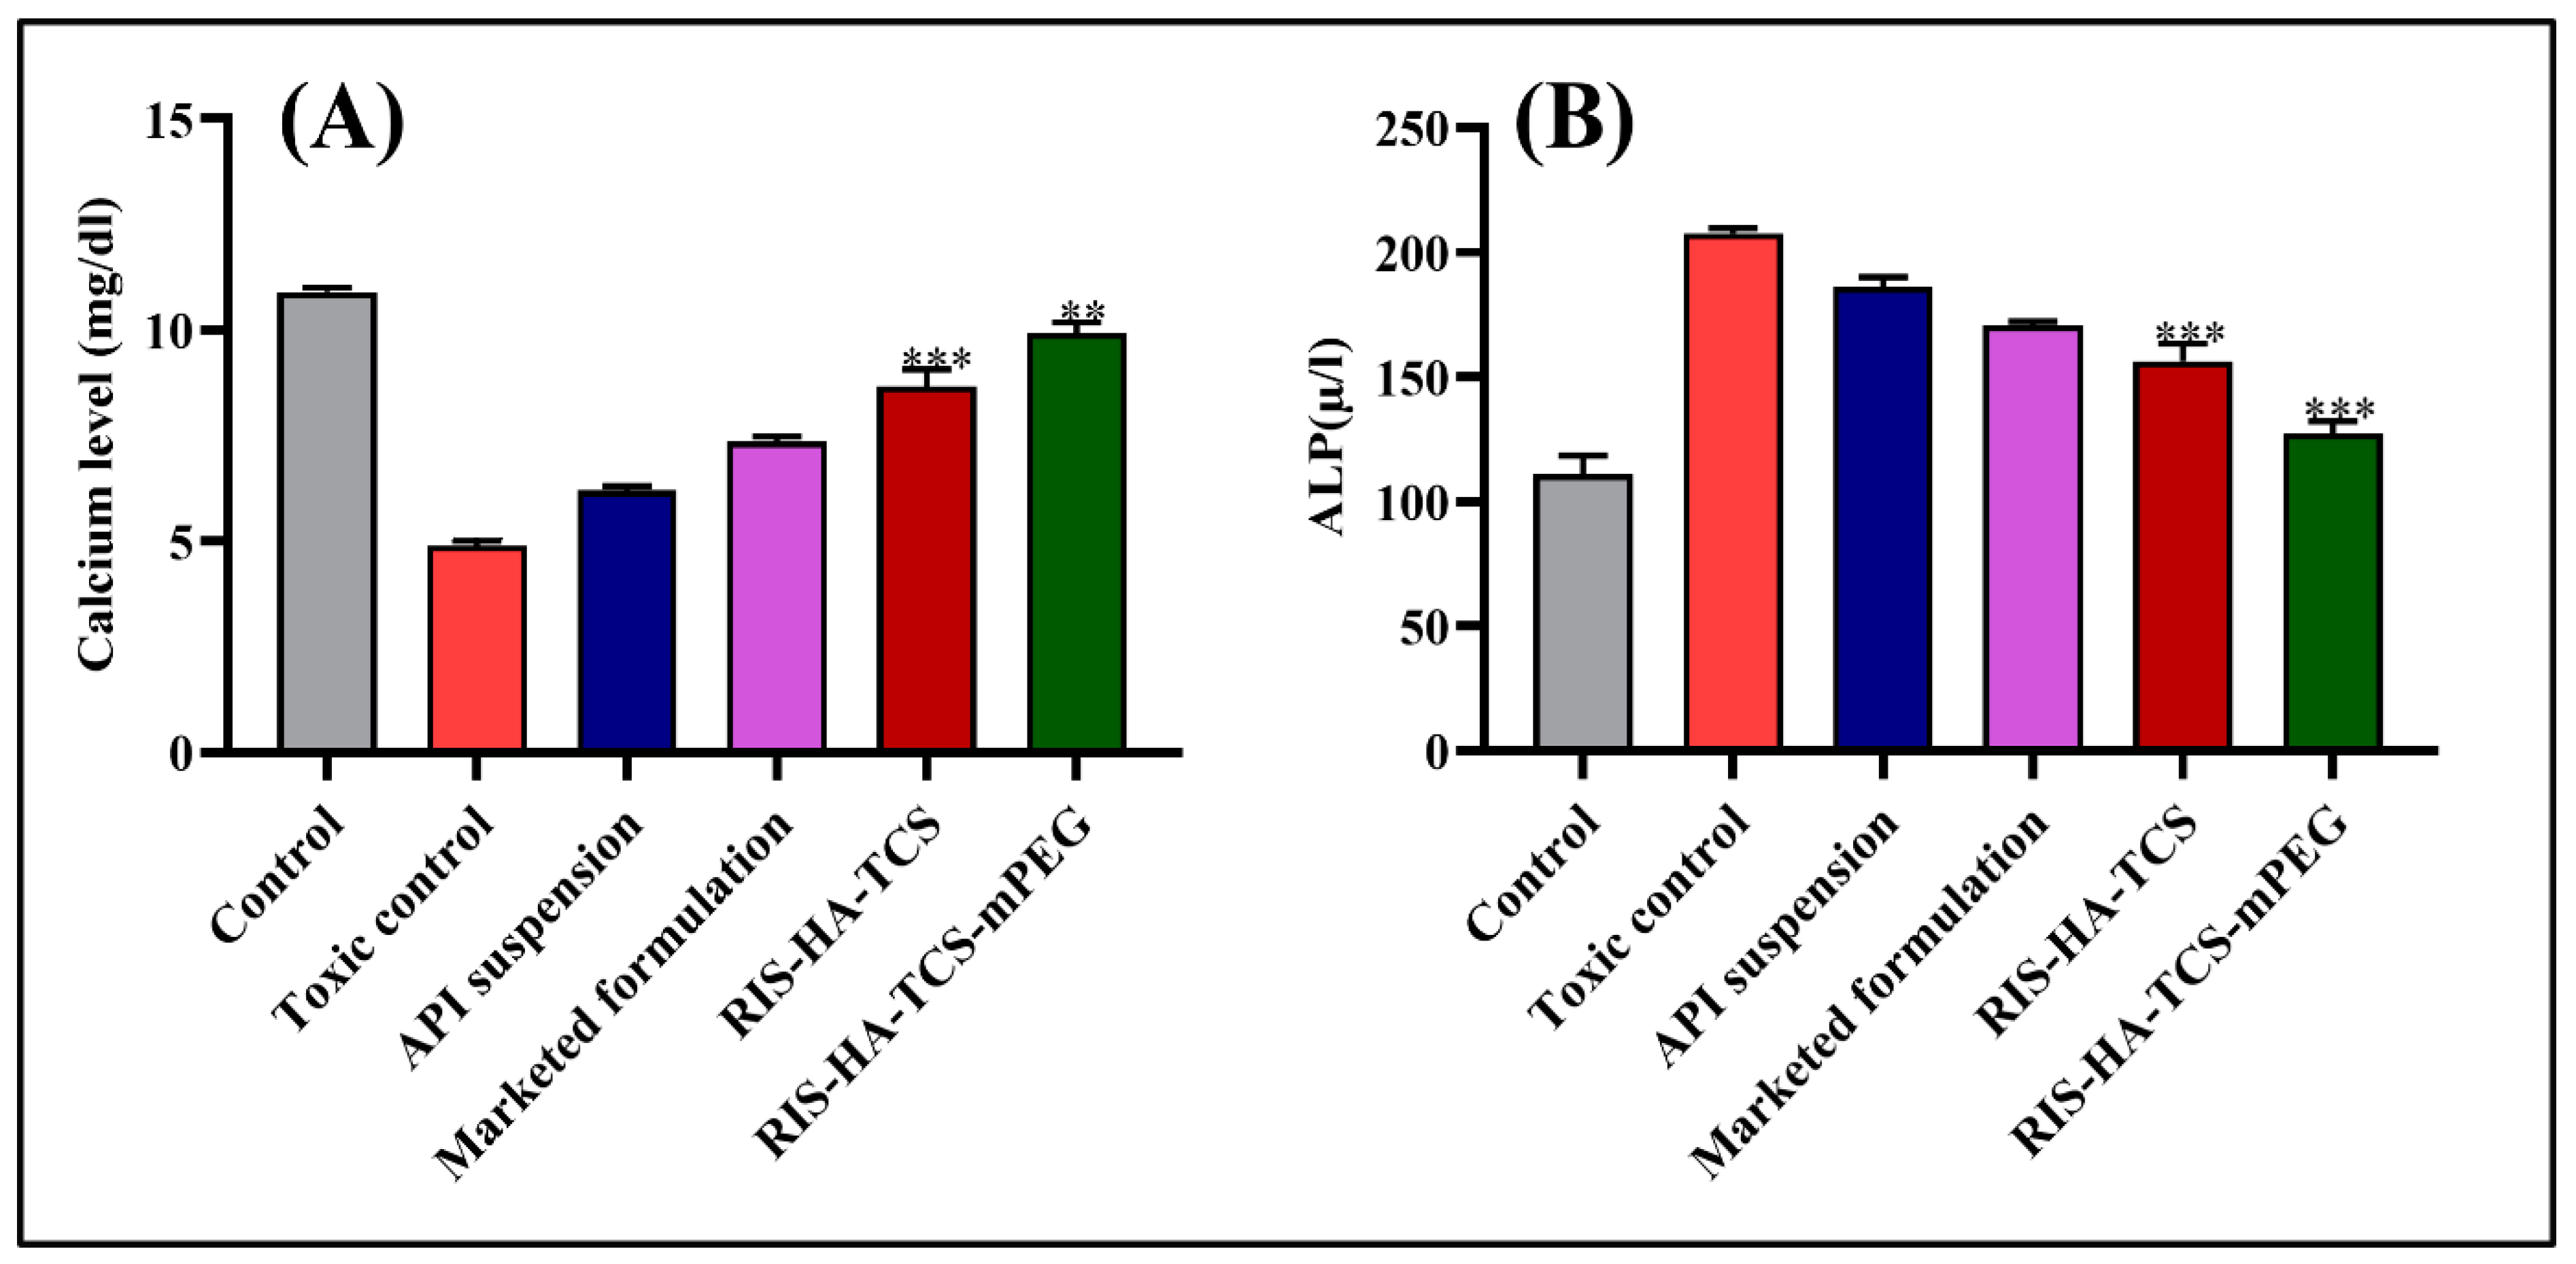
3.3.1. Biochemical Estimation
Estimation of Calcium Level
Alkaline Phosphatase Activity
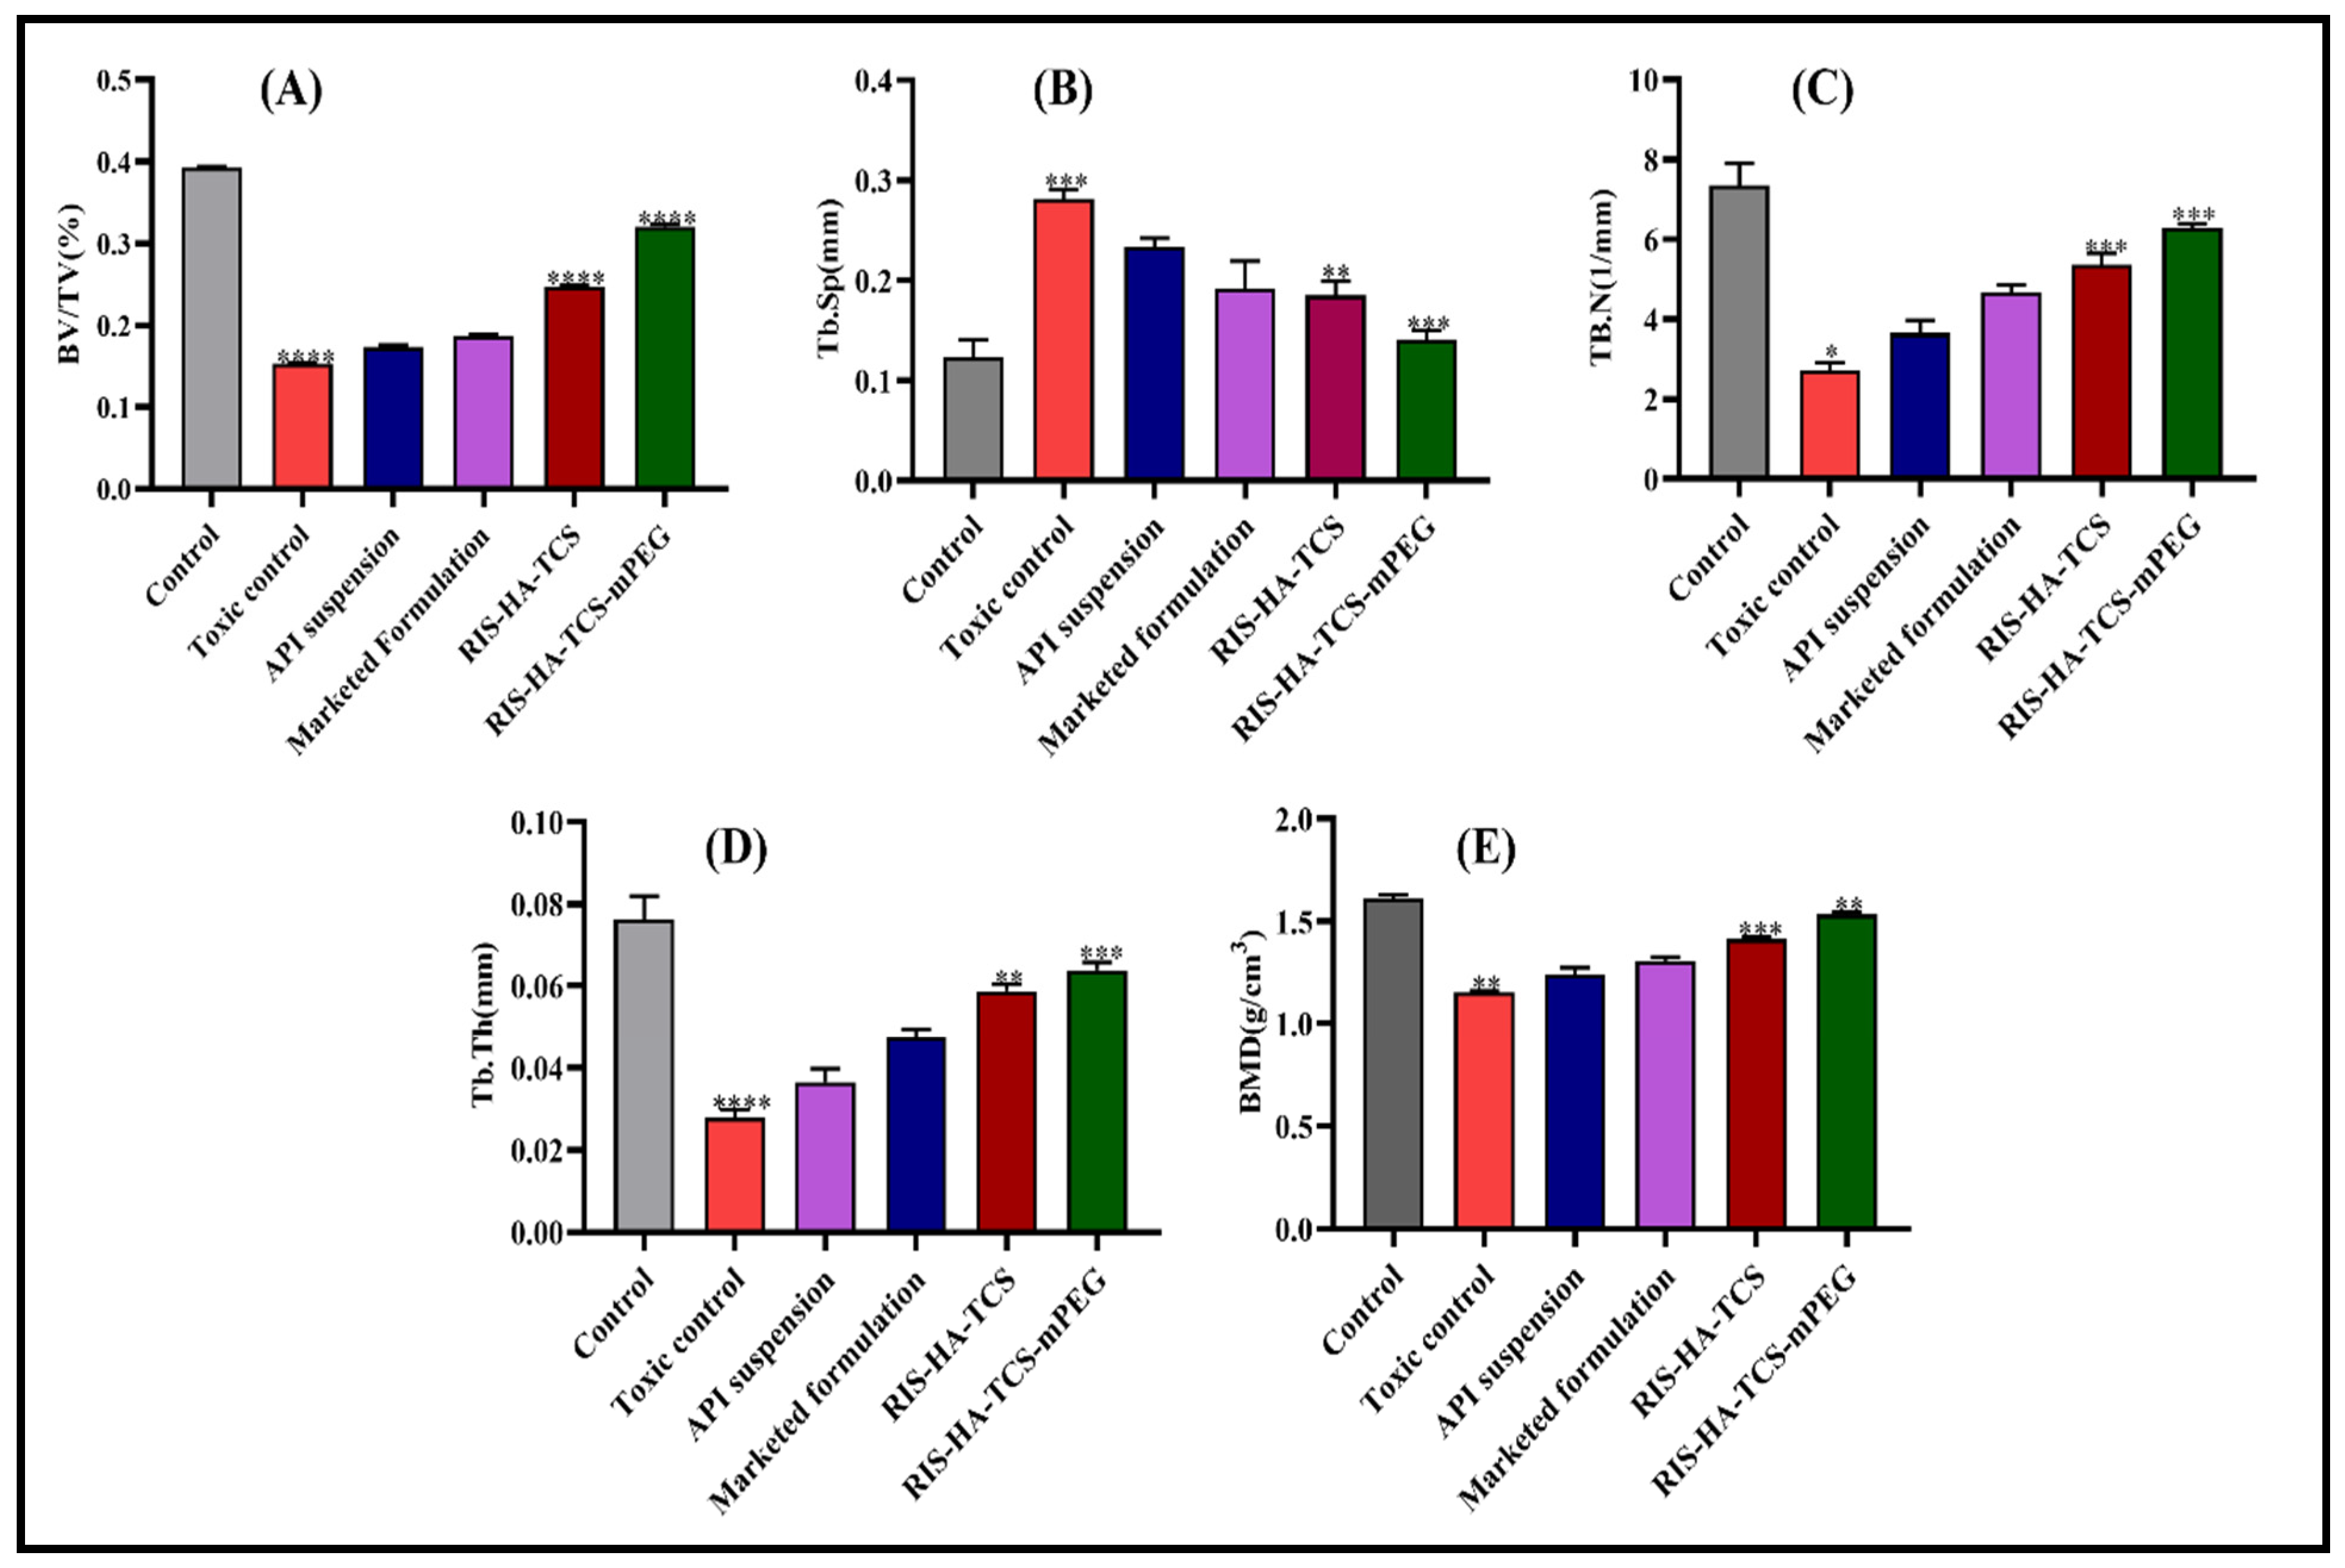
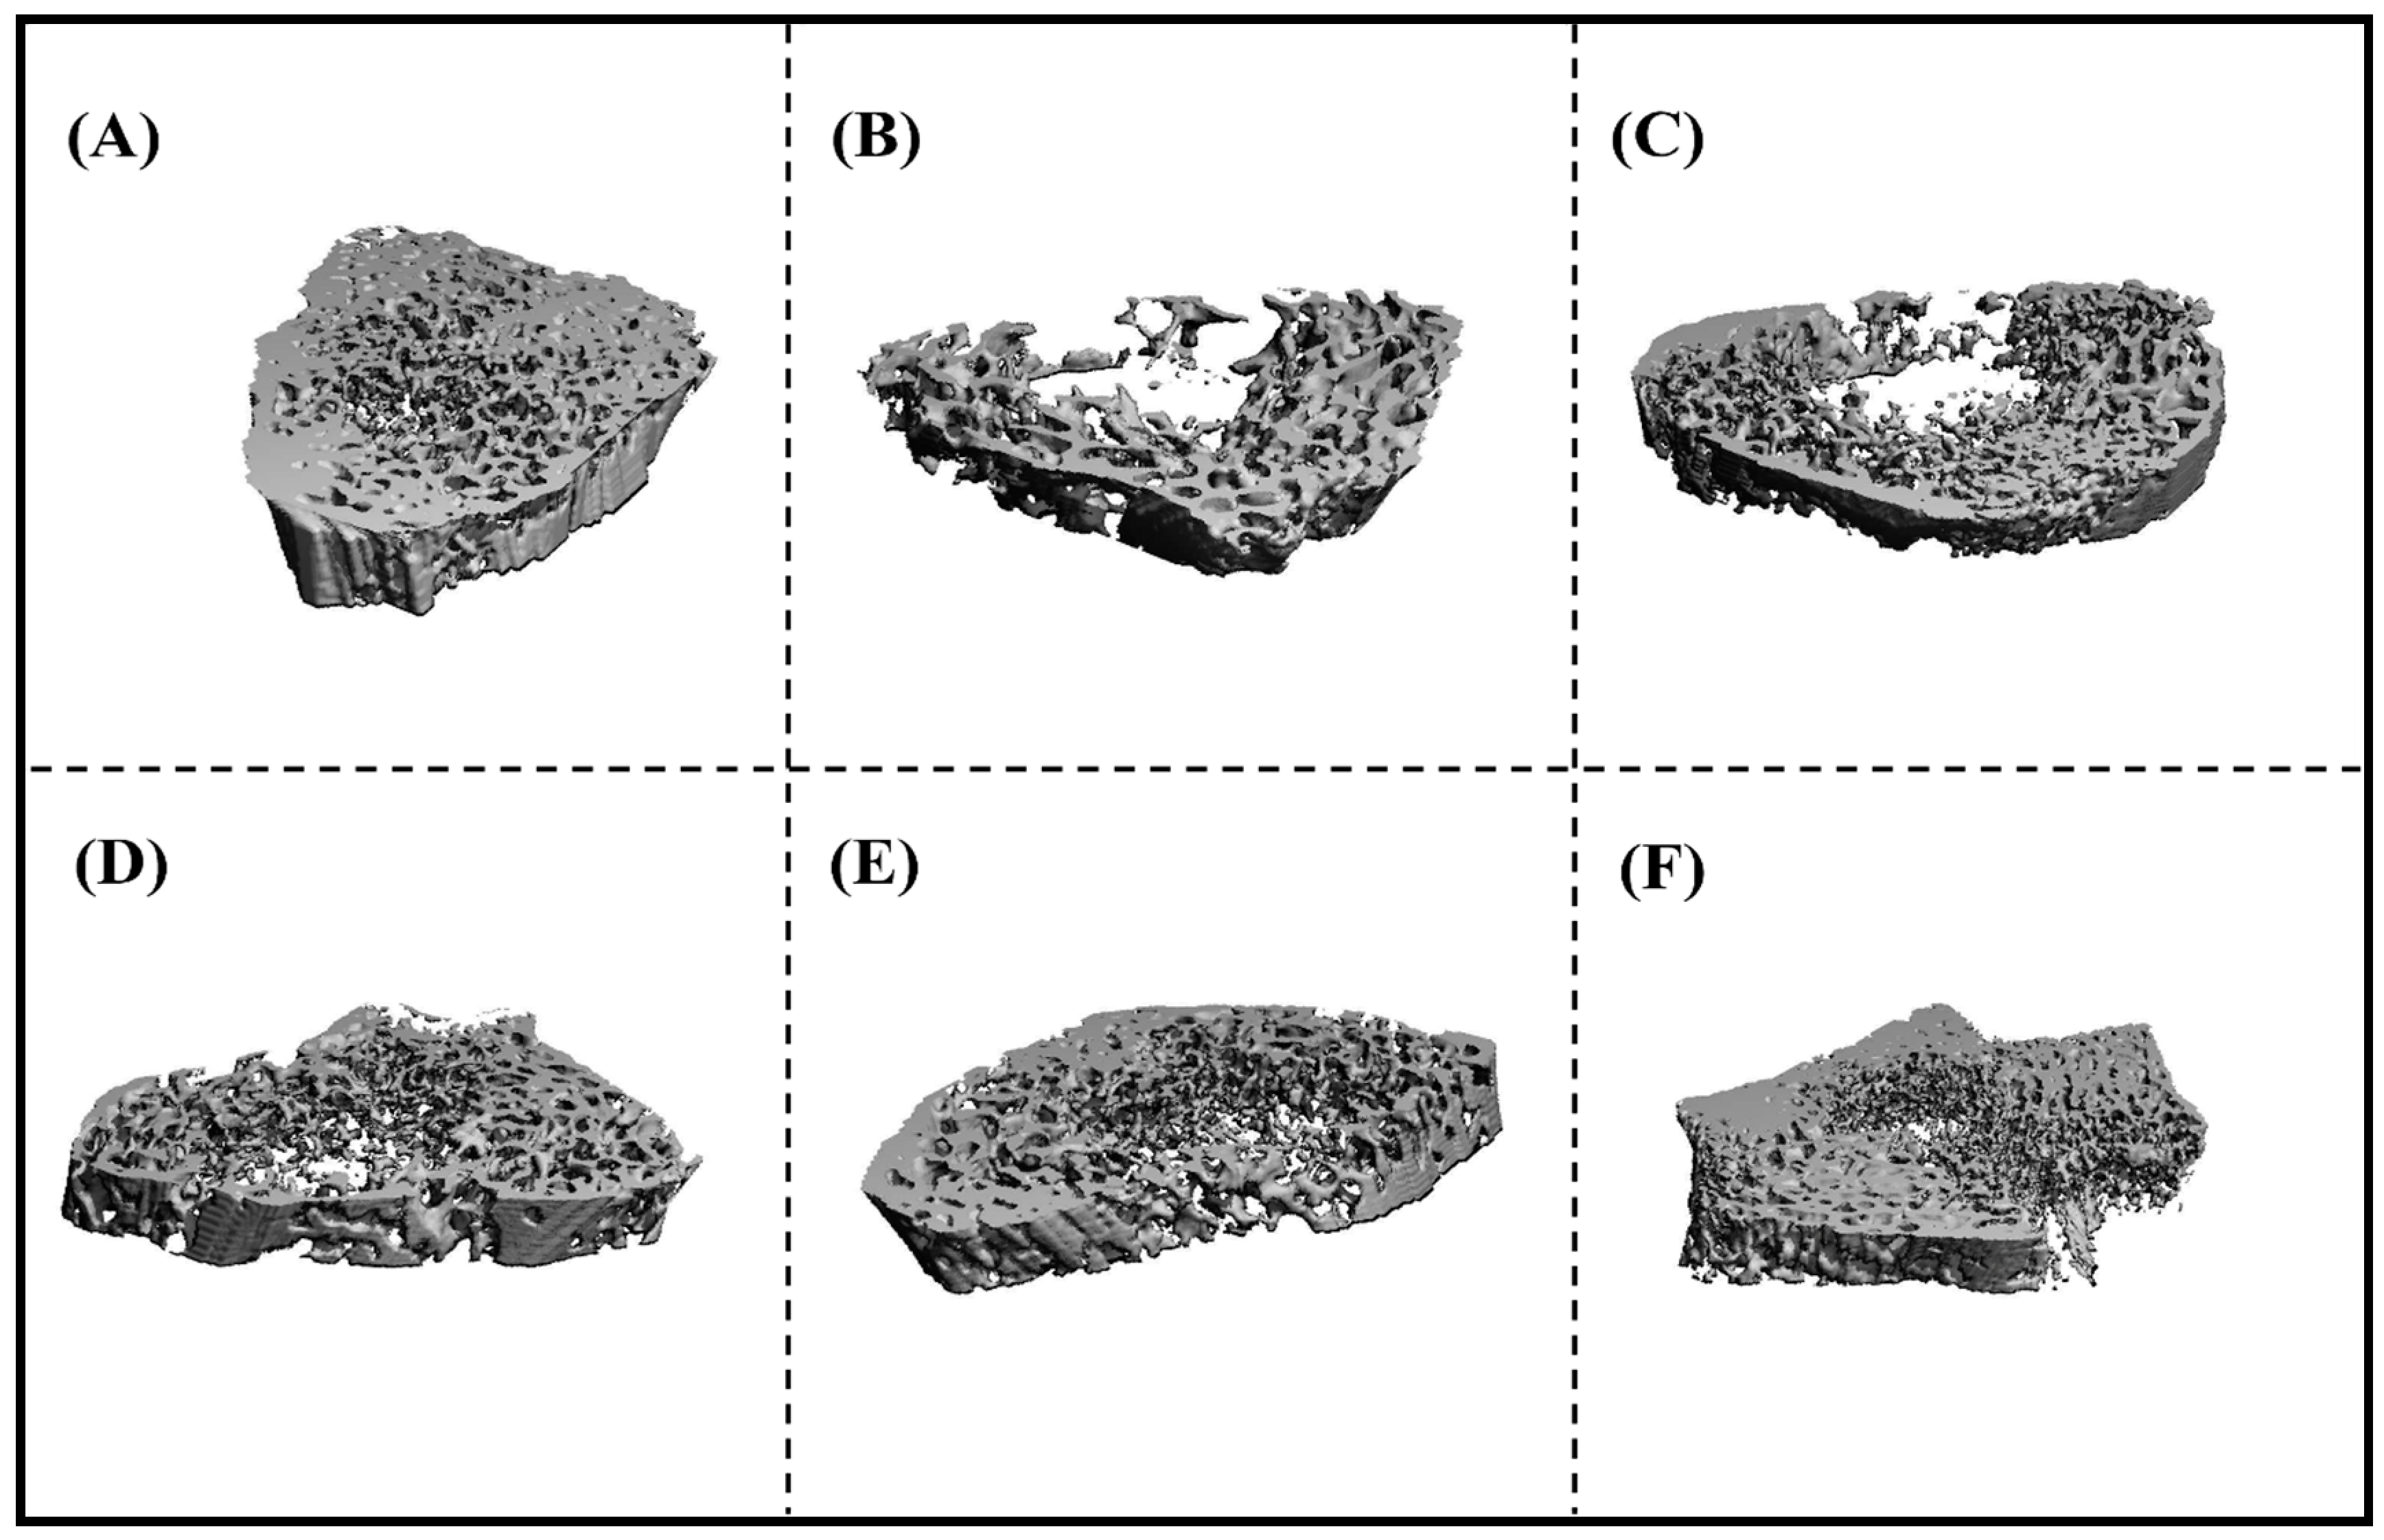
3.3.2. Microcomputed Tomography (µCT) Analysis
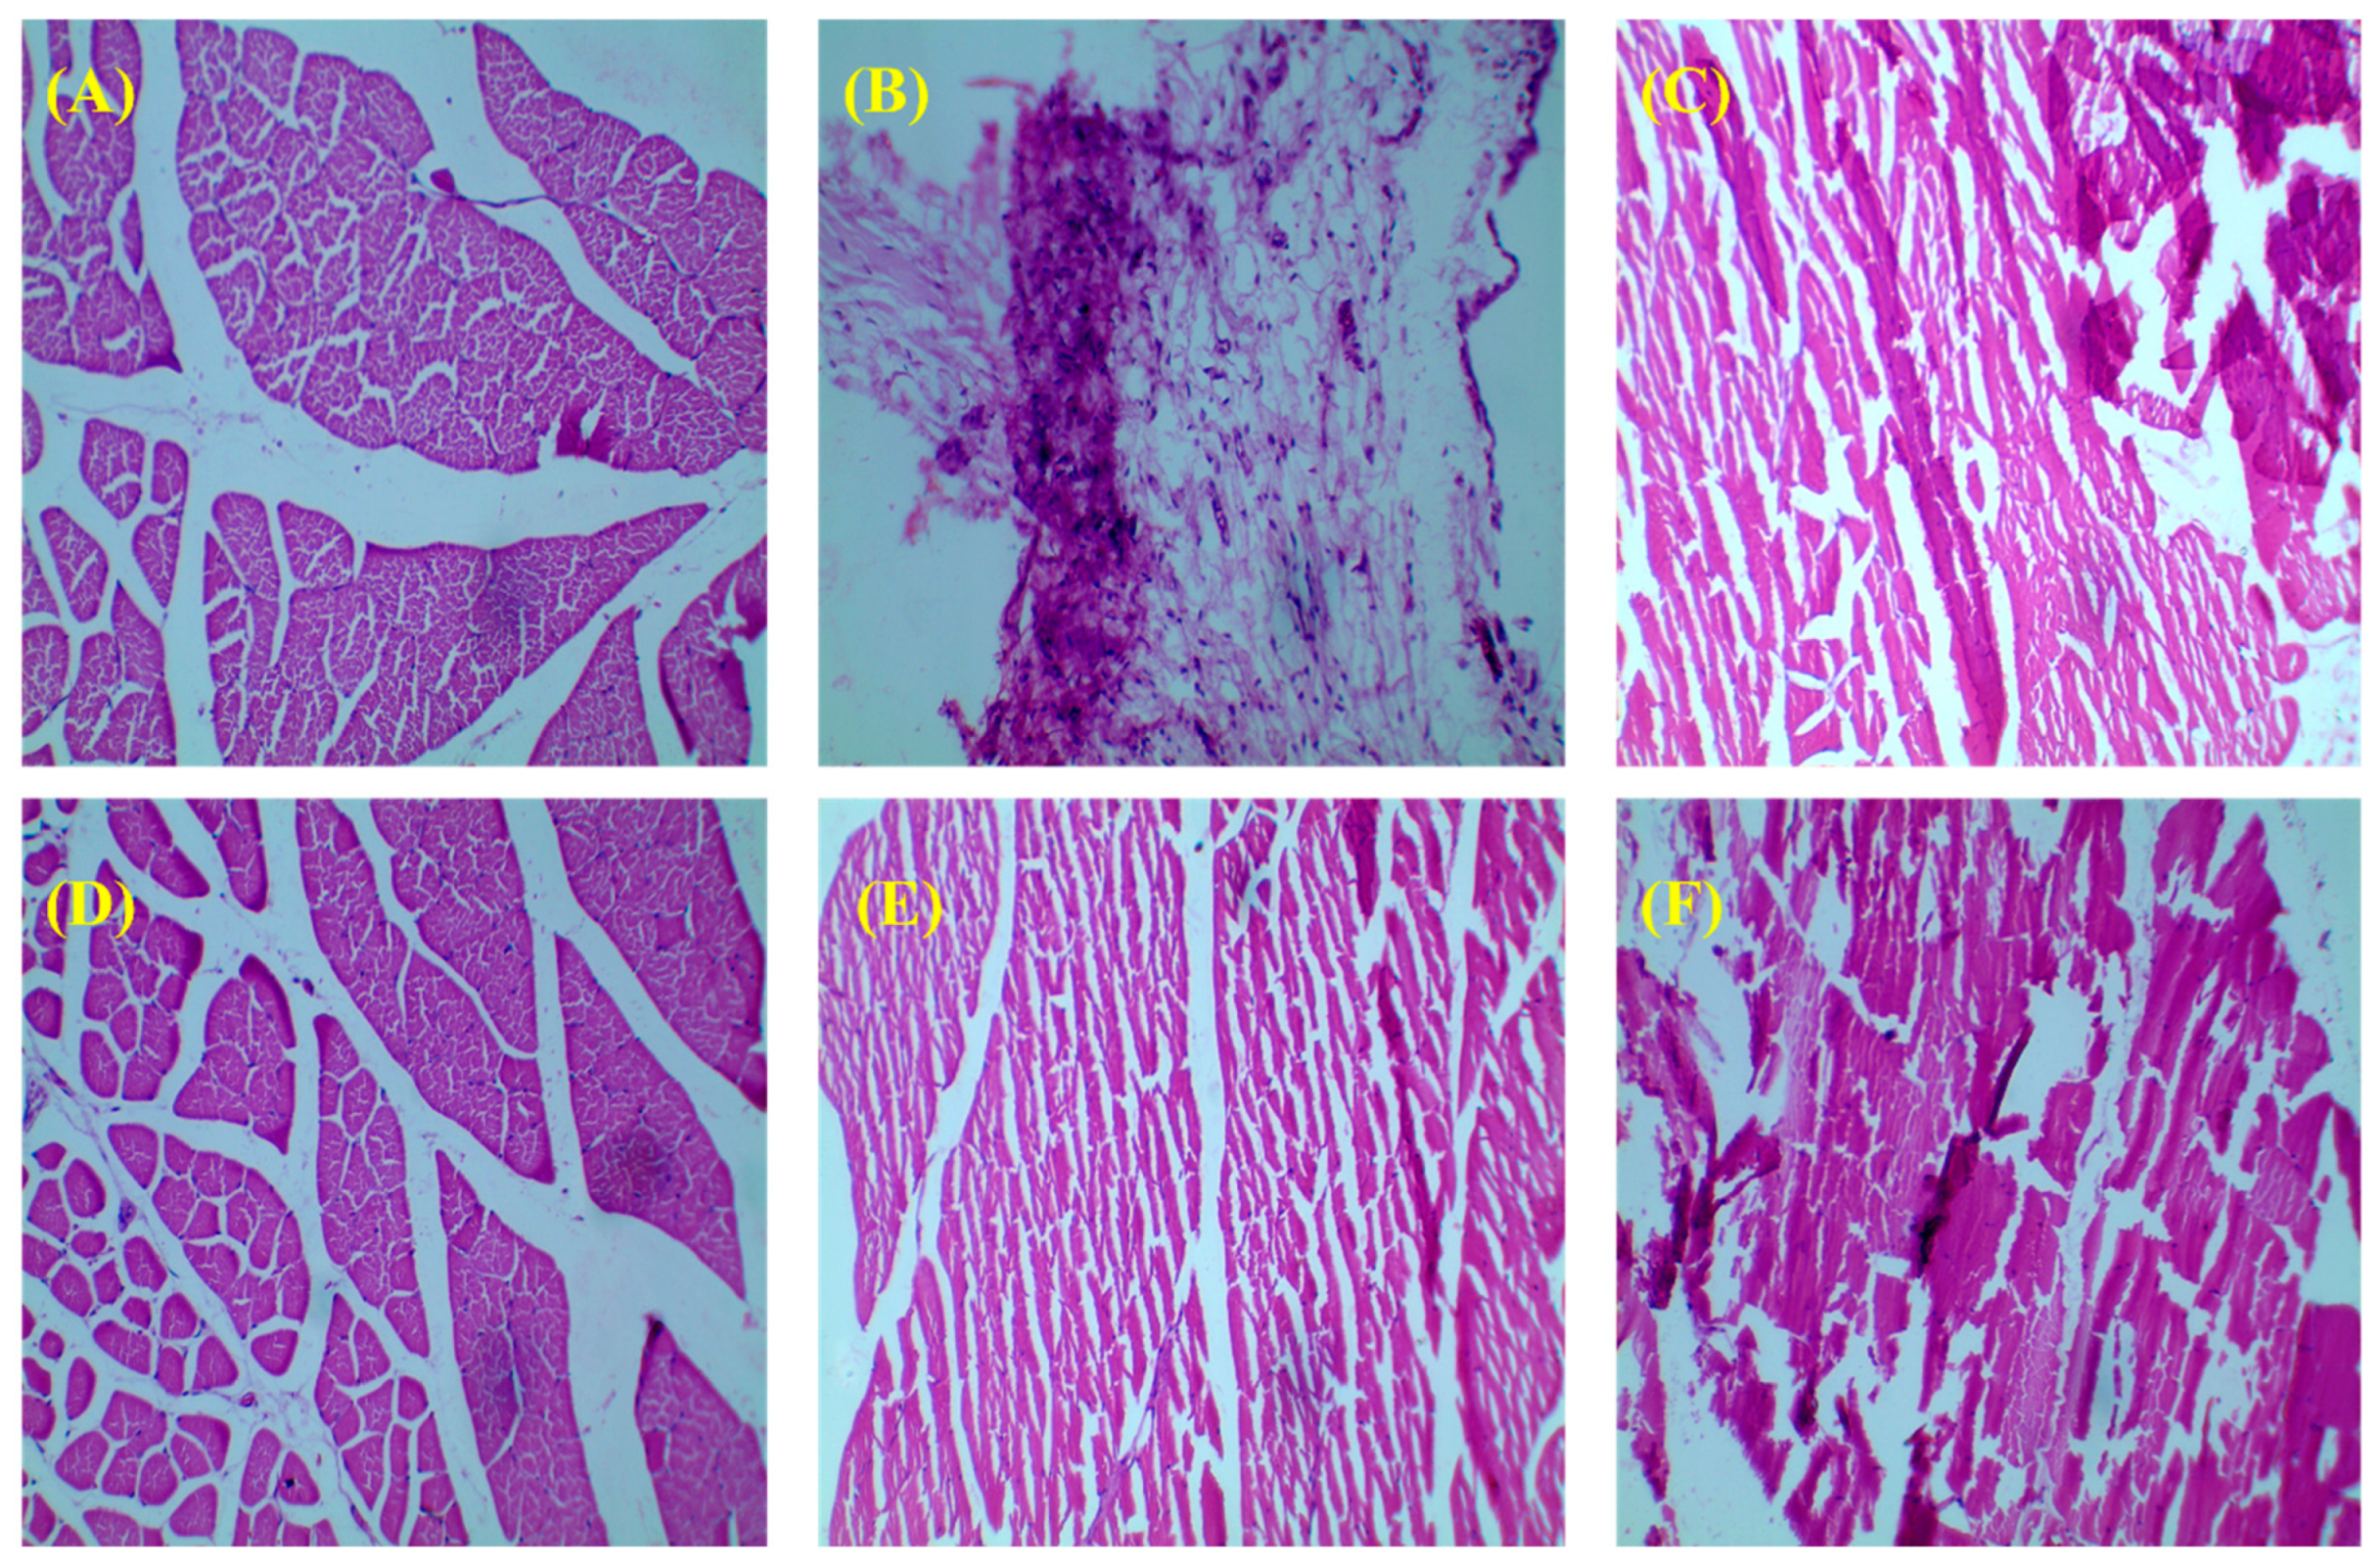
3.3.3. Histology of Bone
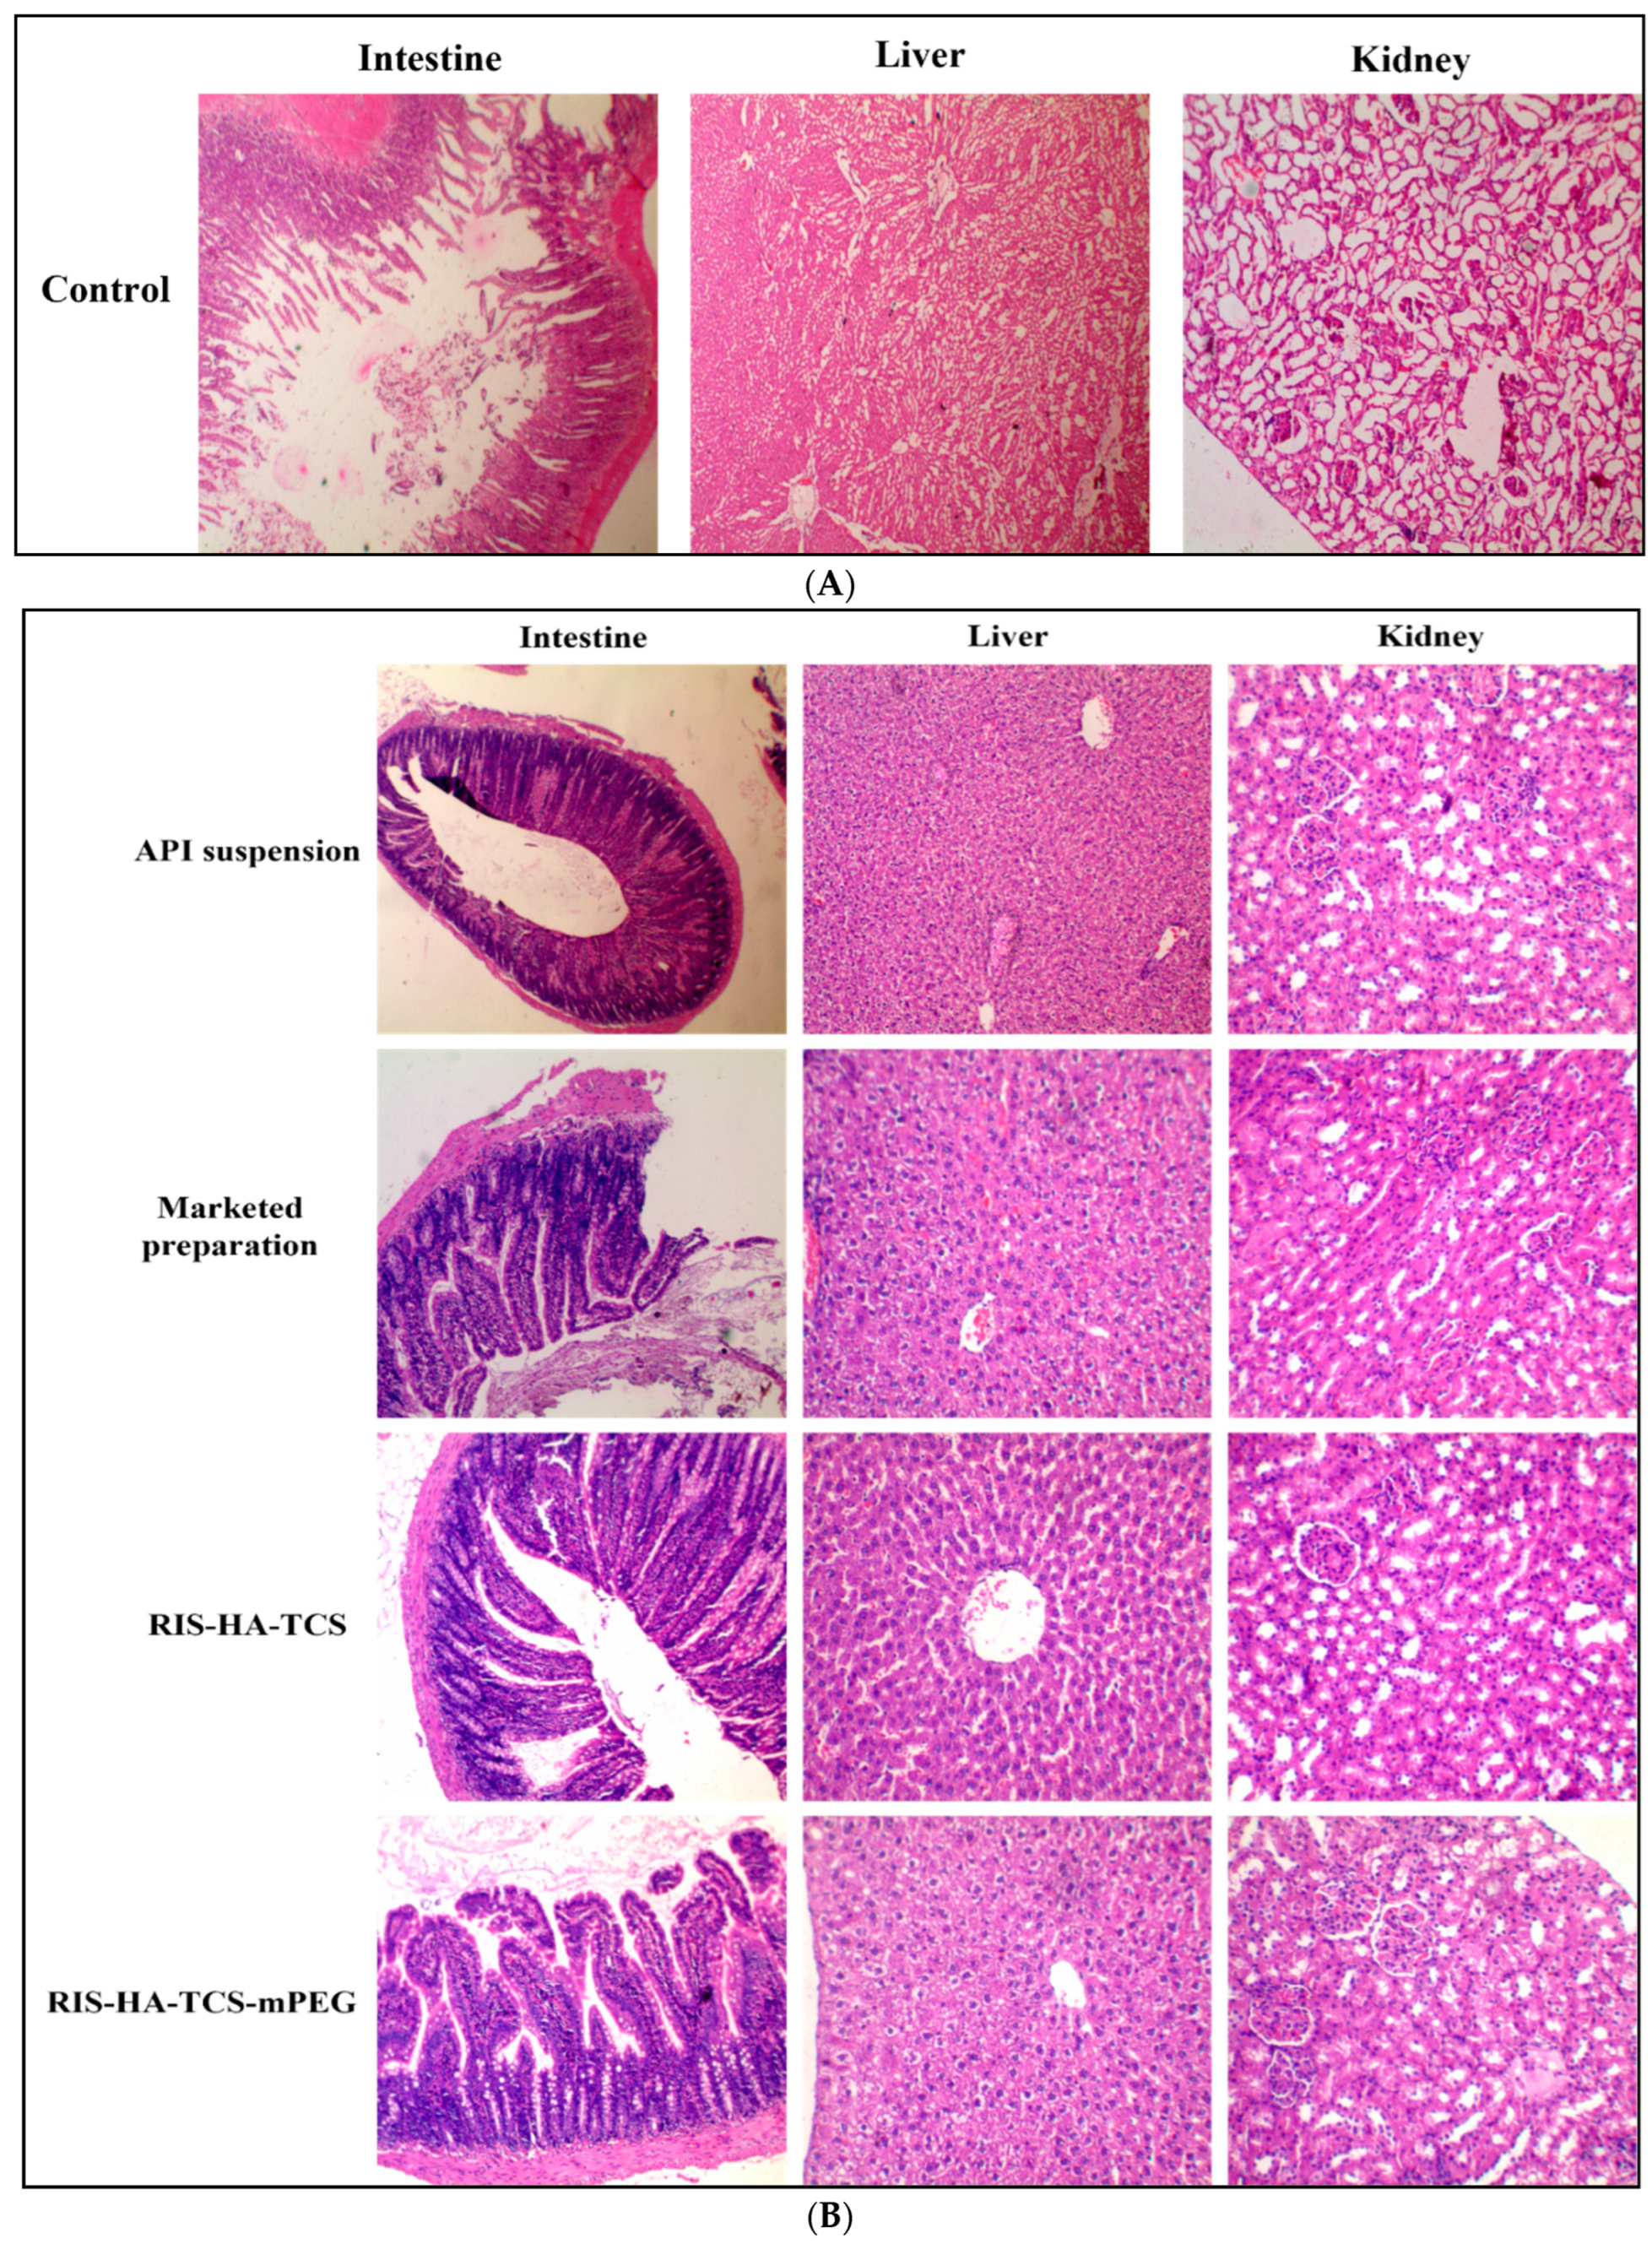
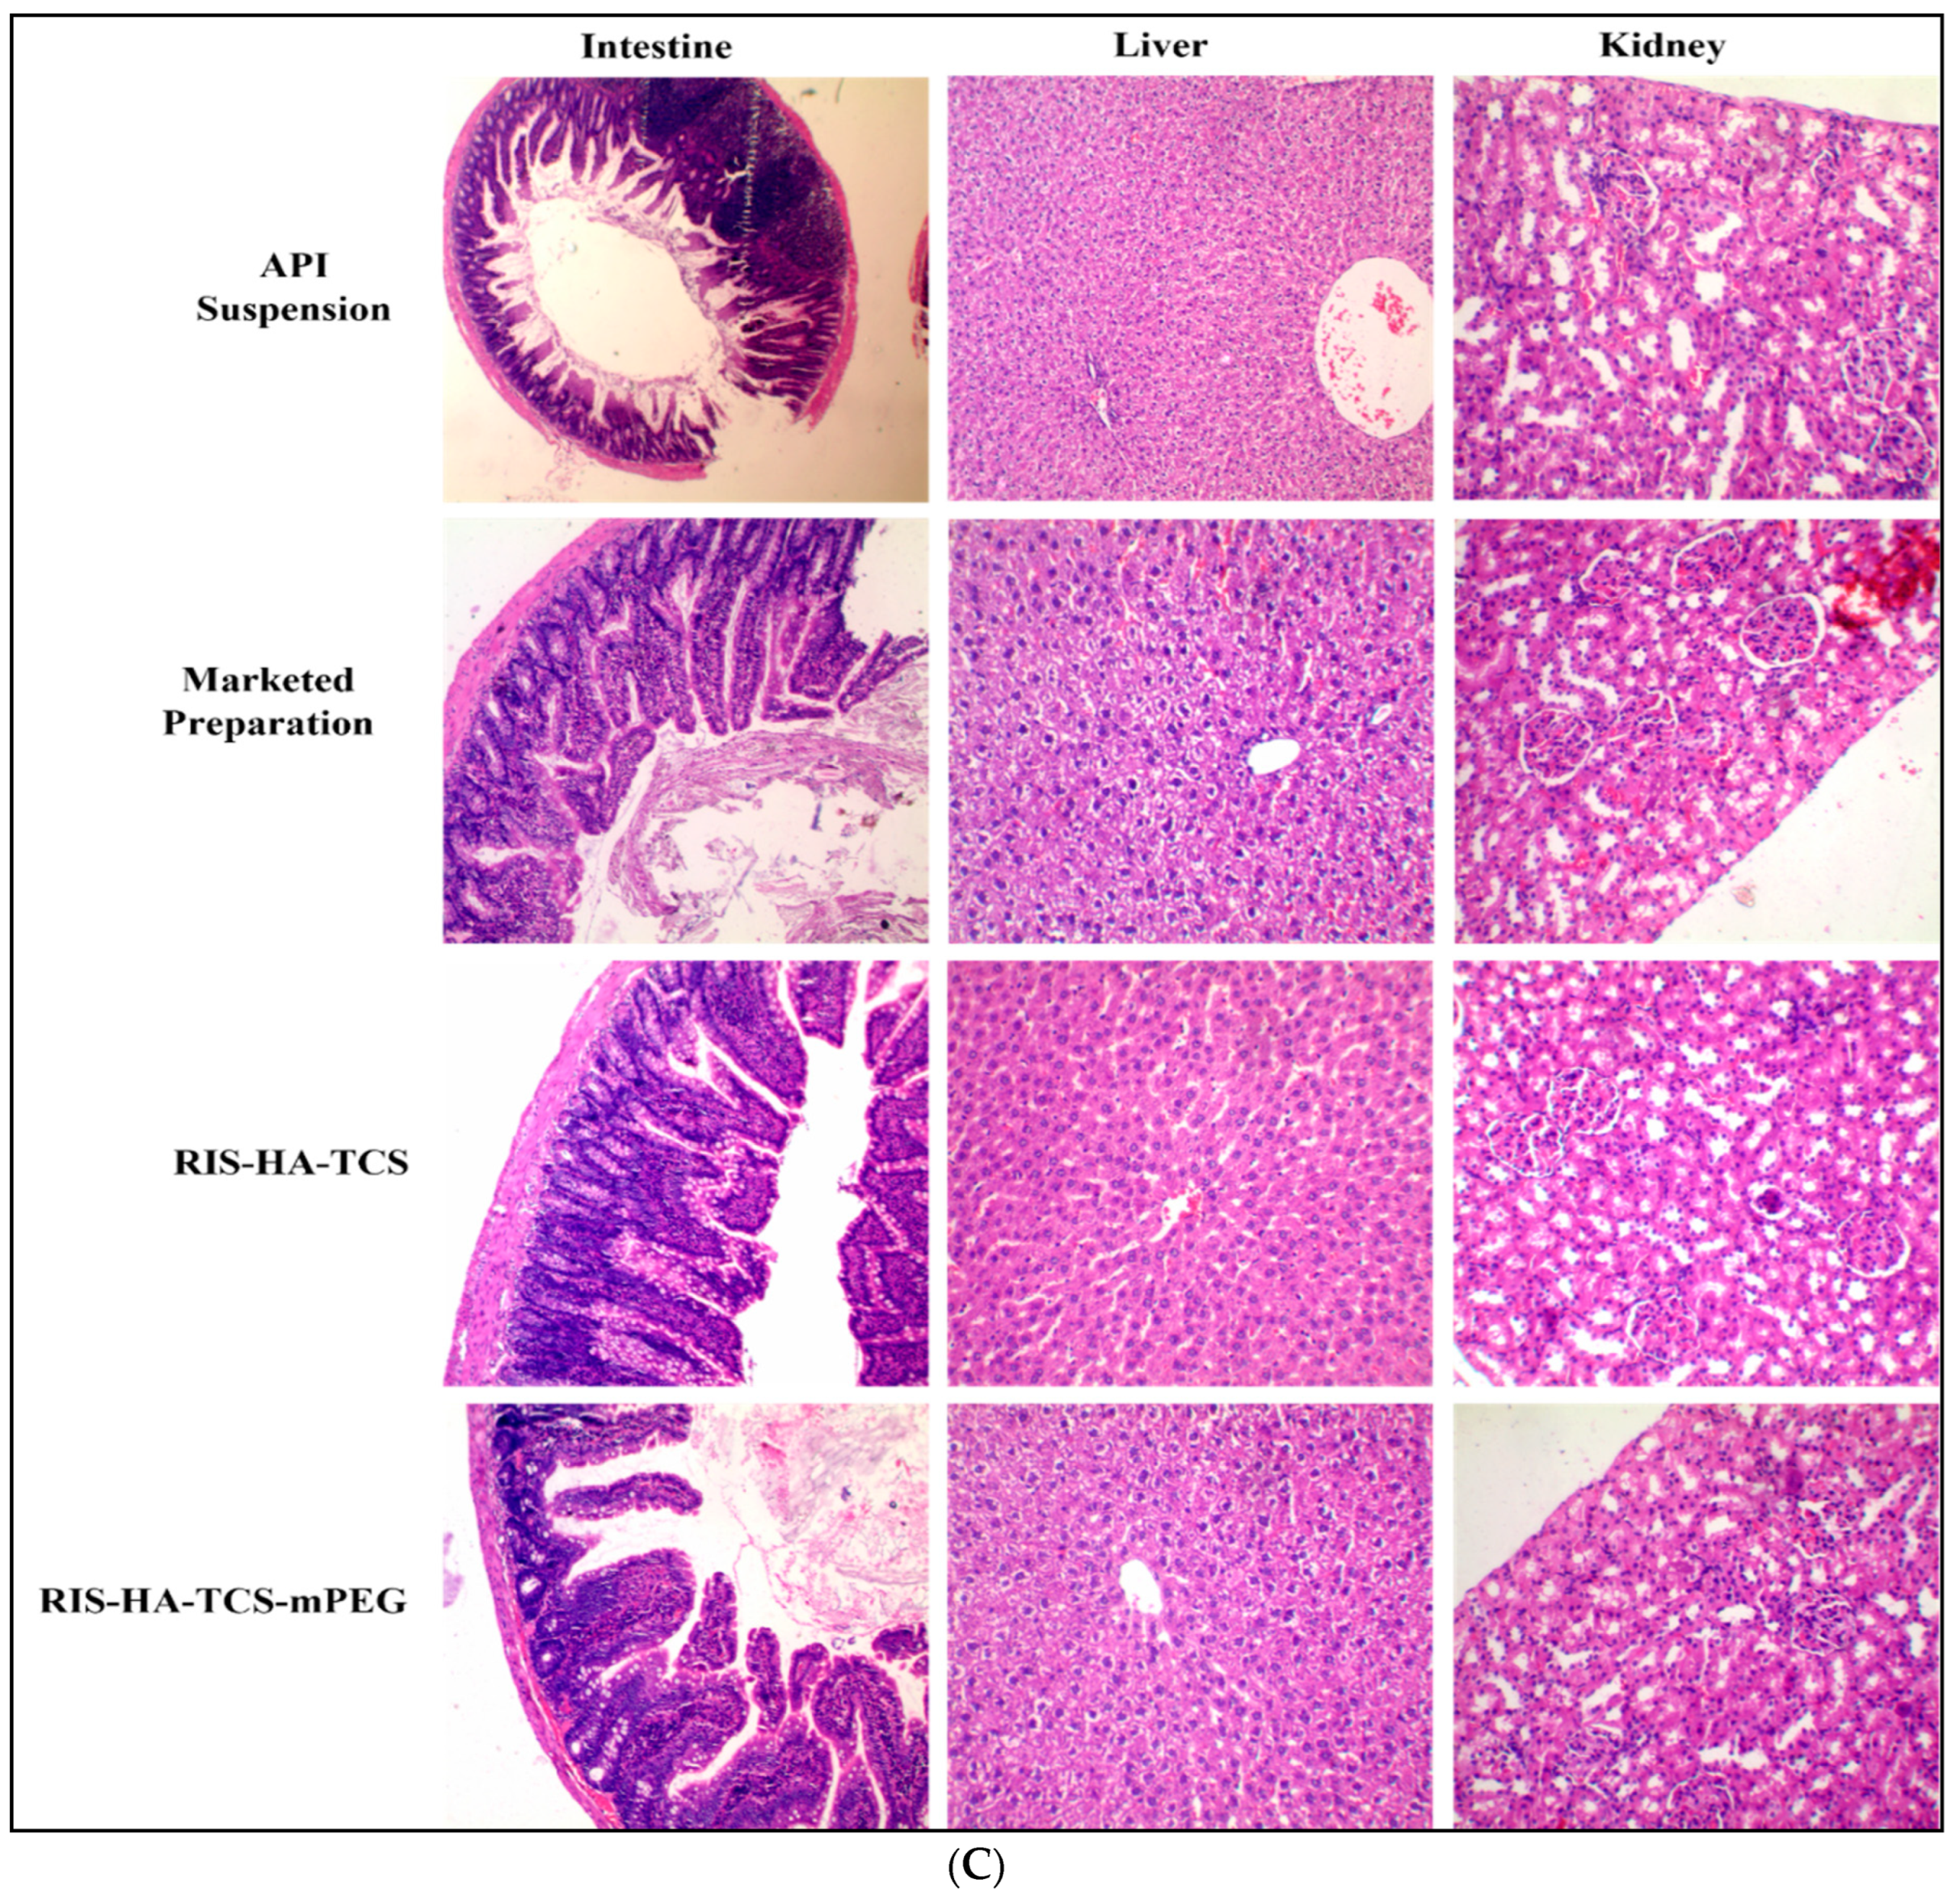
3.3.4. Histopathology of Other Organs
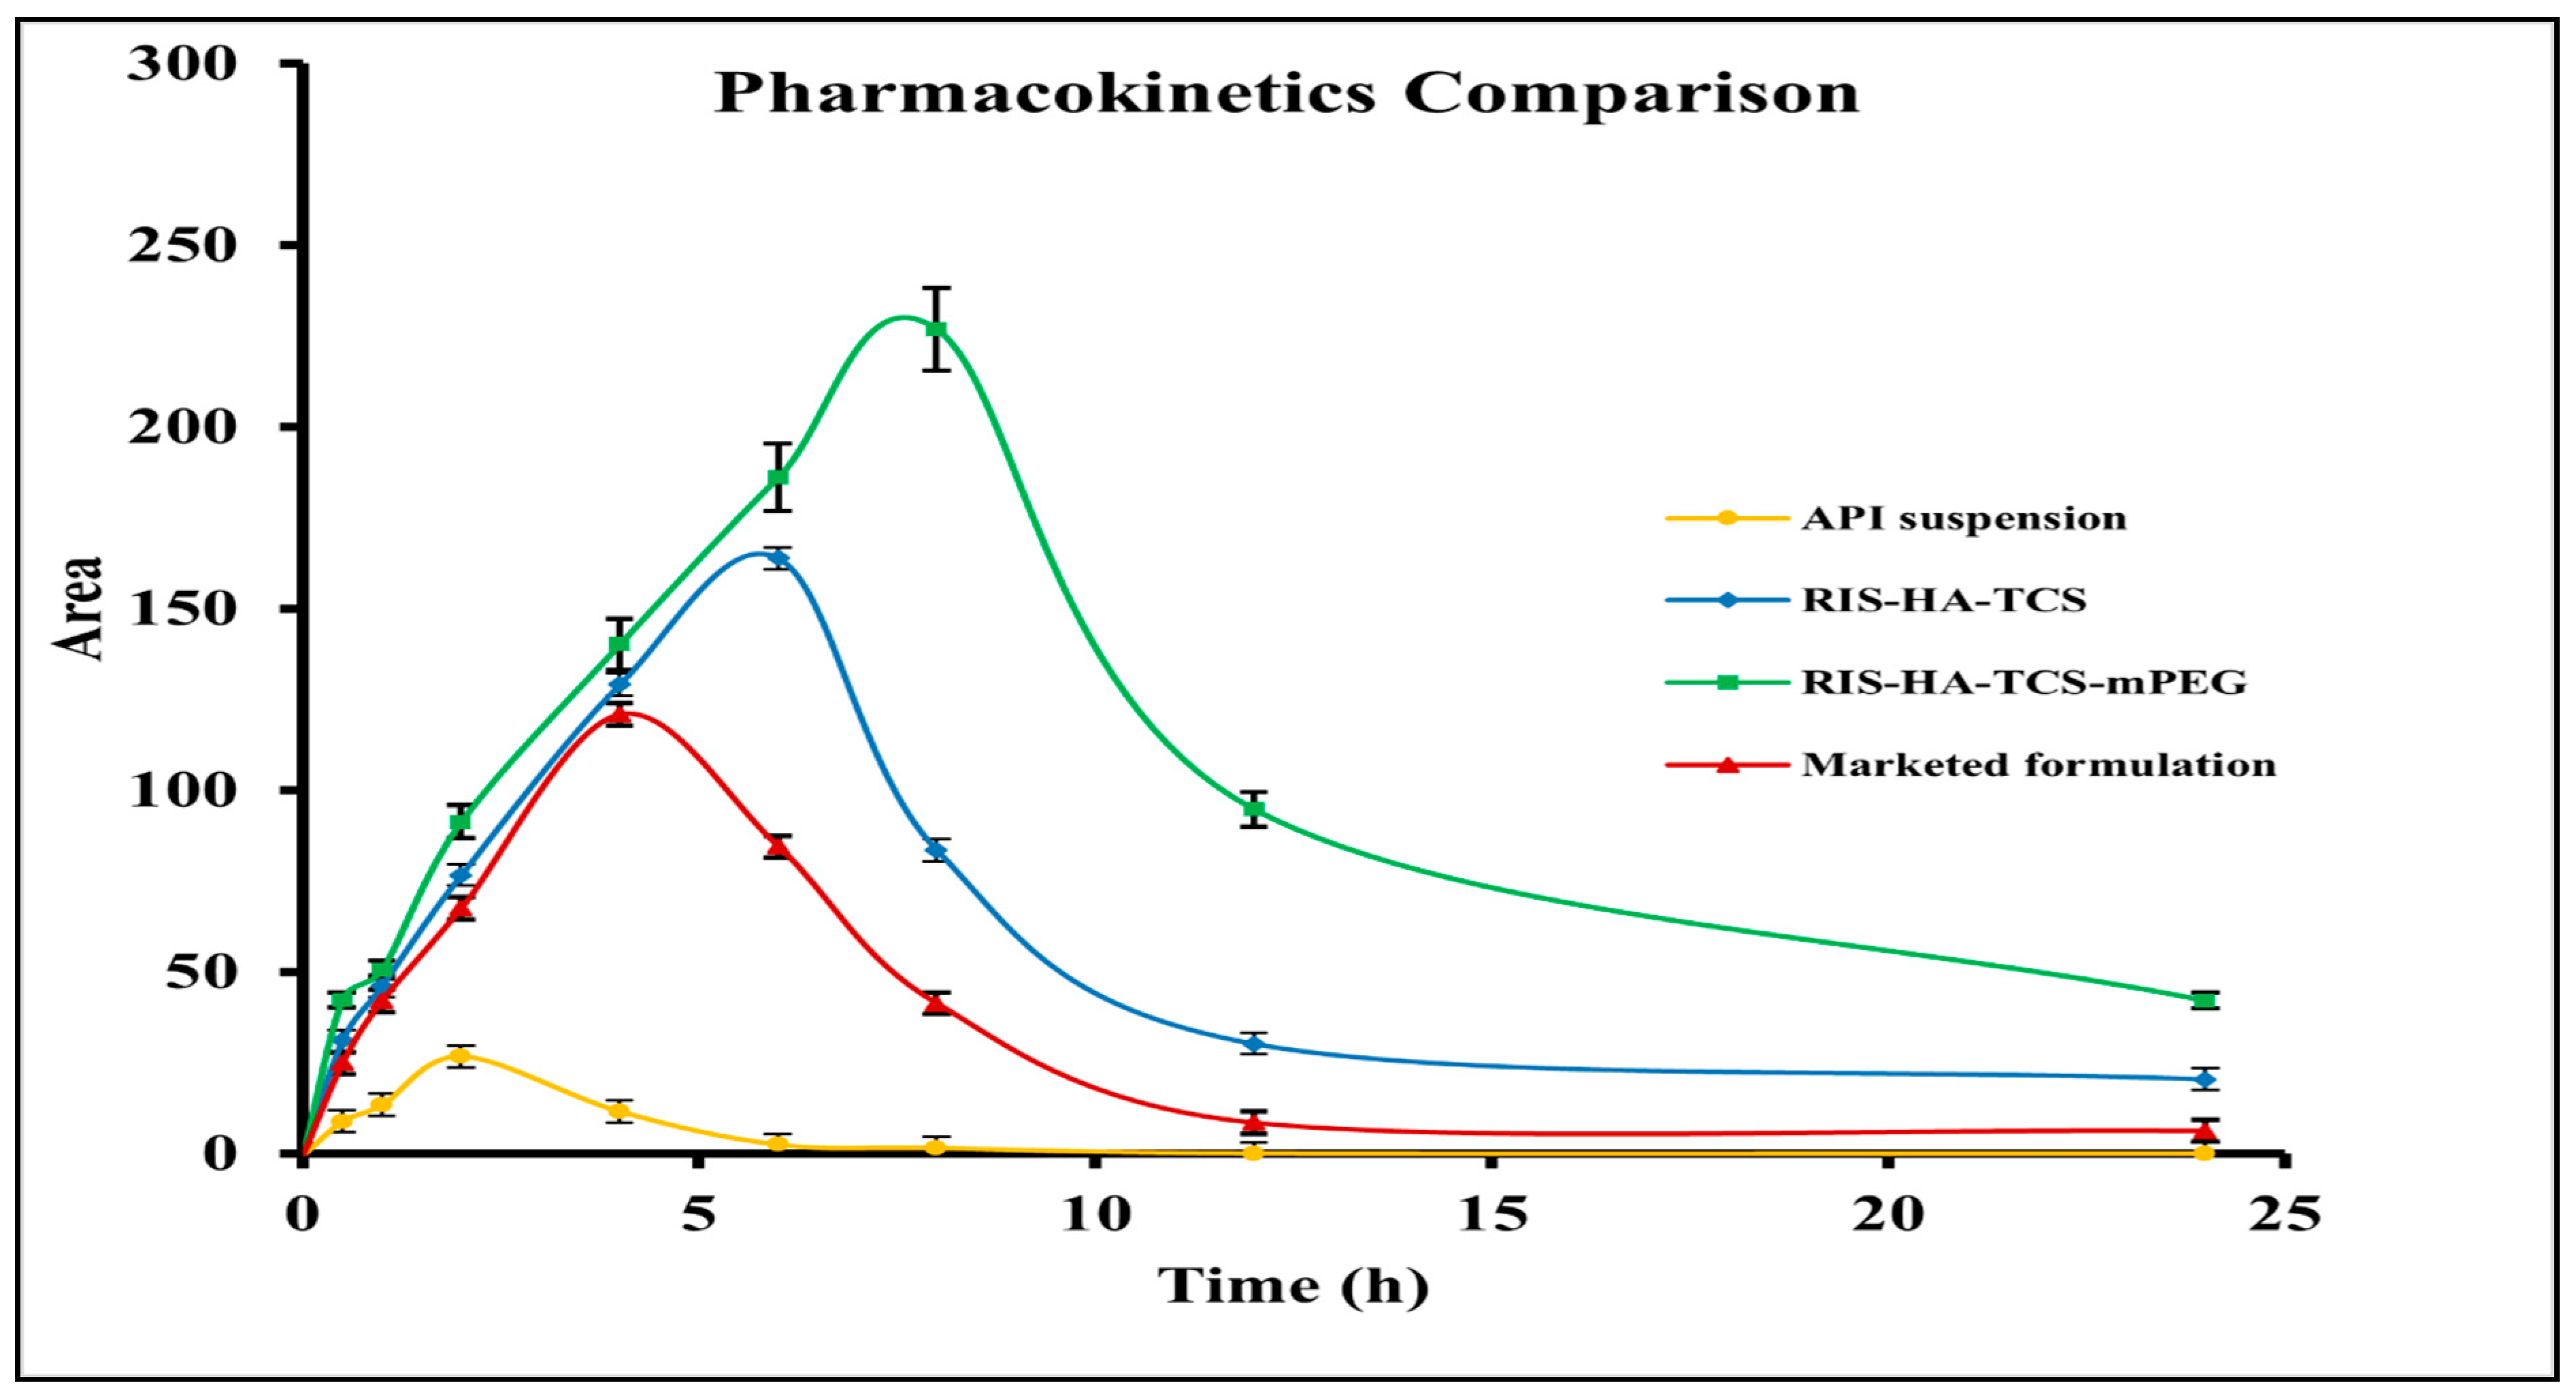
3.4. In Vivo Pharmacokinetic Study
3.5. Stability Studies
4. Conclusions
Author Contributions
Funding
Institutional Review Board Statement
Informed Consent Statement
Data Availability Statement
Acknowledgments
Conflicts of Interest
References
- Rawat, P.; Manglani, K.; Gupta, S.; Kalam, A.; Vohora, D.; Ahmad, F.J.; Talegaonkar, S. Design and Development of Bioceramic Based Functionalized PLGA Nanoparticles of Risedronate for Bone Targeting: In-vitro Characterization and Pharmacodynamic Evaluation. Pharm. Res. 2015, 32, 3149–3158. [Google Scholar] [CrossRef] [PubMed]
- Khajuria, D.K.; Disha, C.; Vasireddi, R.; Razdan, R.; Mahapatra, D.R. Risedronate/zinc-hydroxyapatite based nanomedicine for osteoporosis. Mater. Sci. Eng. C Mater. Biol. Appl. 2016, 63, 78–87. [Google Scholar] [CrossRef]
- Vaculikova, E.; Placha, D.; Pisarcik, M.; Peikertova, P.; Dedkova, K.; Devinsky, F.; Jampilek, J. Preparation of risedronate nanoparticles by solvent evaporation technique. Molecules 2014, 19, 17848–17861. [Google Scholar] [CrossRef] [PubMed]
- Wu, M.-Y.; Kao, I.-F.; Fu, C.-Y.; Yen, S.-K. Effects of Adding Chitosan on Drug Entrapment Efficiency and Release Duration for Paclitaxel-Loaded Hydroxyapatite—Gelatin Composite Microspheres. Pharmaceutics 2023, 15, 2025. [Google Scholar] [CrossRef] [PubMed]
- Lin, L.; Chow, K.L.; Leng, Y. Study of hydroxyapatite osteoinductivity with an osteogenic differentiation of mesenchymal stem cells. J. Biomed. Mater. Res. Part A 2009, 89A, 326–335. [Google Scholar] [CrossRef] [PubMed]
- Sun, J.S.; Liu, H.C.; Chang, W.H.; Li, J.; Lin, F.H.; Tai, H.C. Influence of hydroxyapatite particle size on bone cell activities: An in vitro study. J. Biomed. Mater. Res. 1998, 39, 390–397. [Google Scholar] [CrossRef]
- Rothe, R.; Hauser, S.; Neuber, C.; Laube, M.; Schulze, S.; Rammelt, S.; Pietzsch, J. Adjuvant Drug-Assisted Bone Healing: Advances and Challenges in Drug Delivery Approaches. Pharmaceutics 2020, 12, 428. [Google Scholar] [CrossRef]
- Mondal, A.; Nayak, A.K.; Chakraborty, P.; Banerjee, S.; Nandy, B.C. Natural Polymeric Nanobiocomposites for Anti-Cancer Drug Delivery Therapeutics: A Recent Update. Pharmaceutics 2023, 15, 2064. [Google Scholar] [CrossRef]
- Thanou, M.; Florea, B.I.; Langemeÿer, M.W.; Verhoef, J.C.; Junginger, H.E. N-trimethylated chitosan chloride (TMC) improves the intestinal permeation of the peptide drug buserelin in vitro (Caco-2 cells) and in vivo (rats). Pharm. Res. 2000, 17, 27–31. [Google Scholar] [CrossRef]
- Thanou, M.; Nihot, M.T.; Jansen, M.; Verhoef, J.C.; Junginger, H.E. Mono-N-carboxymethyl chitosan (MCC), a polyampholytic chitosan derivative, enhances the intestinal absorption of low molecular weight heparin across intestinal epithelia in vitro and in vivo. J. Pharm. Sci. 2001, 90, 38–46. [Google Scholar] [CrossRef]
- Baumann, H.; Faust, V. Concepts for improved regioselective placement of O-sulfo, N-sulfo, N-acetyl, and N-carboxymethyl groups in chitosan derivatives. Carbohydr. Res. 2001, 331, 43–57. [Google Scholar] [CrossRef] [PubMed]
- Bernkop-Schnürch, A.; Krajicek, M.E. Mucoadhesive polymers as platforms for peroral peptide delivery and absorption: Synthesis and evaluation of different chitosan-EDTA conjugates. J. Control. Release 1998, 50, 215–223. [Google Scholar] [CrossRef] [PubMed]
- Zhang, J.; Xia, W.; Liu, P.; Cheng, Q.; Tahirou, T.; Gu, W.; Li, B. Chitosan modification and pharmaceutical/biomedical applications. Mar. Drugs 2010, 8, 1962–1987. [Google Scholar] [CrossRef] [PubMed]
- Inamdar, N.N.; Mourya, V. Thiolated Chitosan Preparation, Properties, and Applications. In Chitin and Chitosan Derivatives; Kim, S.-K., Ed.; CRC Press: Boca Raton, FL, USA; Taylor and Francis: Abingdon, UK, 2013; pp. 85–108. [Google Scholar]
- Hirsjärvi, S.; Sancey, L.; Dufort, S.; Belloche, C.; Vanpouille-Box, C.; Garcion, E.; Coll, J.-L.; Hindré, F.; Benoît, J.-P. Effect of particle size on the biodistribution of lipid nanocapsules: Comparison between nuclear and fluorescence imaging and counting. Int. J. Pharm. 2013, 453, 594–600. [Google Scholar] [CrossRef] [PubMed]
- Hirabayashi, H.; Takahashi, T.; Fujisaki, J.; Masunaga, T.; Sato, S.; Hiroi, J.; Tokunaga, Y.; Kimura, S.; Hata, T. Bone-specific delivery and sustained release of diclofenac, a non-steroidal anti-inflammatory drug, via bisphosphonic prodrug based on the Osteotropic Drug Delivery System (ODDS). J. Control. Release 2001, 70, 183–191. [Google Scholar] [CrossRef] [PubMed]
- Sahana, H.; Khajuria, D.K.; Razdan, R.; Mahapatra, D.R.; Bhat, M.R.; Suresh, S.; Rao, R.R.; Mariappan, L. Improvement in bone properties by using risedronate adsorbed hydroxyapatite novel nanoparticle based formulation in a rat model of osteoporosis. J. Biomed. Nanotechnol. 2013, 9, 193–201. [Google Scholar] [CrossRef]
- Ossipov, D.A. Bisphosphonate-modified biomaterials for drug delivery and bone tissue engineering. Expert Opin. Drug Deliv. 2015, 12, 1443–1458. [Google Scholar] [CrossRef]
- Saifi, Z.; Ralli, T.; Rizwanullah, M.; Alam, M.; Vohora, D.; Mir, S.R.; Amin, S.; Ameen, S. BBD Driven Fabrication of Hydroxyapatite Engineered Risedronate Loaded Thiolated Chitosan Nanoparticles and Their In Silico, In-Vitro and Ex-vivo Studies. Preprints 2023, 2023081682. [Google Scholar] [CrossRef]
- Alhalmi, A.; Amin, S.; Khan, Z.; Beg, S.; Al, O.; Saleh, A.; Kohli, K. Nanostructured Lipid Carrier-Based Codelivery of Raloxifene and Naringin: Formulation, Optimization, In Vitro, Ex Vivo, In Vivo Assessment, and Acute Toxicity Studies. Pharmaceutics 2022, 14, 1771. [Google Scholar] [CrossRef]
- Rizwanullah, M.; Amin, S.; Ahmad, J. Improved pharmacokinetics and antihyperlipidemic efficacy of rosuvastatin-loaded nanostructured lipid carriers. J. Drug Target. 2017, 25, 58–74. [Google Scholar] [CrossRef]
- Cevc, G.; Gebauer, D.; Stieber, J.; Schätzlein, A.; Blume, G. Ultraflexible vesicles, Transfersomes, have an extremely low pore penetration resistance and transport therapeutic amounts of insulin across the intact mammalian skin. Biochim. Biophys. Acta-Biomembr. 1998, 1368, 201–215. [Google Scholar] [CrossRef] [PubMed]
- Banji, D.; Banji, O.J.F.; Chiluka, V.L.; Abbagoni, S. Role of Triticum aestivum aqueous extract in glucocorticoid induced osteoporosis in rats. Indian J. Exp. Biol. 2014, 52, 153–158. [Google Scholar] [PubMed]
- Bozzo, R.D.O.; Rocha, R.G.; Haiter Neto, F.; Paganini, G.A.; Cavalcanti, M.G.P. Linear density analysis of bone repair in rats using digital direct radiograph. J. Appl. Oral Sci. 2004, 12, 317–321. [Google Scholar] [CrossRef]
- Mori, S.; Sawai, T.; Teshima, T.; Kyogoku, M. A new decalcifying technique for immunohistochemical studies of calcified tissue, especially applicable to cell surface marker demonstration. J. Histochem. Cytochem. 1988, 36, 111–114. [Google Scholar] [CrossRef]
- Jia, H.-J.; Li, W.; Zhao, K. Determination of risedronate in rat plasma samples by ion-pair high-performance liquid chromatography with UV detector. Anal. Chim. Acta 2006, 562, 171–175. [Google Scholar] [CrossRef]
- Elmowafy, M.; Ibrahim, H.M.; Ahmed, M.A.; Shalaby, K.; Salama, A.; Hefesha, H. Atorvastatin-loaded nanostructured lipid carriers (NLCs): Strategy to overcome oral delivery drawbacks. Drug Deliv. 2017, 24, 932–941. [Google Scholar] [CrossRef]
- Soni, K.; Mujtaba, A.; Kohli, K. Lipid drug conjugate nanoparticle as a potential nanocarrier for the oral delivery of pemetrexed diacid: Formulation design, characterization, ex vivo, and in vivo assessment. Int. J. Biol. Macromol. 2017, 103, 139–151. [Google Scholar] [CrossRef]
- Kang, H.; Mintri, S.; Menon, A.V.; Lee, H.Y.; Choi, H.S.; Kim, J. Pharmacokinetics, Pharmacodynamics and Toxicology of Theranostic Nanoparticles. Nanoscale 2015, 7, 18848–18862. [Google Scholar] [CrossRef] [PubMed]
- Miller, H.A.; Frieboes, H.B. Pharmacokinetic/pharmacodynamics modeling of drug-loaded PLGA nanoparticles targeting heterogeneously vascularized tumor tissue. Pharm. Res. 2019, 36, 185. [Google Scholar] [CrossRef]
- Regidor, D.L.; Kovesdy, C.P.; Mehrotra, R.; Rambod, M.; Jing, J.; McAllister, C.J.; Van Wyck, D.; Kopple, J.D.; Kalantar-Zadeh, K. Serum alkaline phosphatase predicts mortality among maintenance hemodialysis patients. J. Am. Soc. Nephrol. 2008, 19, 2193–2203. [Google Scholar] [CrossRef]
- Kim, J.S.; Jang, S.W.; Son, M.; Kim, B.M.; Kang, M.J. Enteric-coated tablet of risedronate sodium in combination with phytic acid, a natural chelating agent, for improved oral bioavailability. Eur. J. Pharm. Sci. 2016, 82, 45–51. [Google Scholar] [CrossRef]
- Frenkel, B.; White, W.; Tuckermann, J. Glucocorticoid-Induced Osteoporosis. Adv. Exp. Med. Biol. 2015, 872, 179–215. [Google Scholar] [CrossRef]
- Cranney, A.; Wells, G.; Willan, A.; Griffith, L.; Zytaruk, N.; Robinson, V.; Black, D.; Adachi, J.; Shea, B.; Tugwell, P.; et al. II. Meta-Analysis of Alendronate for the Treatment of Postmenopausal Women. Endocr. Rev. 2002, 23, 508–516. [Google Scholar] [CrossRef]
- Rodan, G.A.; Martin, T.J. Therapeutic Approaches to Bone Diseases. Science 2000, 289, 1508–1514. [Google Scholar] [CrossRef] [PubMed]
- Nissen-Meyer, L.S.H.; Svalheim, S.; Taubøll, E.; Reppe, S.; Lekva, T.; Solberg, L.B.; Melhus, G.; Reinholt, F.P.; Gjerstad, L.; Jemtland, R. Levetiracetam, phenytoin, and valproate act differently on rat bone mass, structure, and metabolism. Epilepsia 2007, 48, 1850–1860. [Google Scholar] [CrossRef] [PubMed]
- Zhang, X.; Chen, G.; Zhang, T.; Ma, Z.; Wu, B. Effects of PEGylated lipid nanoparticles on the oral absorption of one BCS II drug: A mechanistic investigation. Int. J. Nanomed. 2014, 9, 5503–5514. [Google Scholar] [CrossRef]
- Wang, Y.; Pi, C.; Feng, X.; Hou, Y.; Zhao, L.; Wei, Y. The influence of nanoparticle properties on oral bioavailability of drugs. Int. J. Nanomed. 2020, 15, 6295–6310. [Google Scholar] [CrossRef] [PubMed]
- Suk, J.S.; Xu, Q.; Kim, N.; Hanes, J.; Ensign, L.M. PEGylation as a strategy for improving nanoparticle-based drug and gene delivery. Adv. Drug Deliv. Rev. 2016, 99, 28–51. [Google Scholar] [CrossRef] [PubMed]
- Rawat, P.; Ahmad, I.; Thomas, S.C.; Pandey, S.; Vohora, D.; Gupta, S.; Ahmad, F.J.; Talegaonkar, S. Revisiting bone targeting potential of novel hydroxyapatite based surface modified PLGA nanoparticles of risedronate: Pharmacokinetic and biochemical assessment. Int. J. Pharm. 2016, 506, 253–261. [Google Scholar] [CrossRef] [PubMed]
- Kuskov, A.; Nikitovic, D.; Berdiaki, A.; Shtilman, M.; Tsatsakis, A. Amphiphilic Poly-N-vinylpyrrolidone Nanoparticles as Carriers for Nonsteroidal, Anti-Inflammatory Drugs: Pharmacokinetic, Anti-Inflammatory, and Ulcerogenic Activity Study. Pharmaceutics 2022, 14, 925. [Google Scholar] [CrossRef]


| S.No. | Name of Groups | Dose | Route |
|---|---|---|---|
| A. | Control (normal saline) | - | Oral |
| B. | DEXA-induced Osteoporotic Model (dexamethasone) | 4 mg/2 mL subcutaneously for 4 weeks, once per week | Subcutaneous(s.c.) |
| C. | DEXA-induced Osteoporotic Model + API suspension | 3.05 mg/kg | Oral |
| D. | DEXA-induced Osteoporotic Model + Marketed preparation (Risofos, 35 mg/week) | 3.05 mg/kg | Oral |
| E. | DEXA-induced Osteoporotic Model + RIS-HA-TCS | 3.05 mg/kg | Oral |
| F. | DEXA-induced Osteoporotic Model + RIS-HA-TCS-mPEG | 3.05 mg/kg | Oral |
| Parameters | Drug Suspension | Marketed Preparation | RIS-HA-TCS | RIS-HA-TCS-mPEG |
|---|---|---|---|---|
| Cmax (µg/mL) | 31.99 | 127.38 | 163.89 | 226.84 |
| Thalf (h) | 2.80 | 4.61 | 6.74 | 7.57 |
| Tmax (h) | 2 | 4 | 6 | 8 |
| AUC0–24 (µg/mL*h) | 266.67 | 893.52 | 1366.08 | 2299.53 |
| AUMC0–24 (µg/mL*h2) | 1644.59 | 6393.20 | 17,820.64 | 37,985.44 |
| Kel (h−1) | 0.24 | 0.15 | 0.10 | 0.09 |
| MRT | 6.1 | 7.16 | 13.05 | 16.51 |
| Frel | - | 3.3 | 5.1 | 8.6 |
| Tem | Time (Days) | RIS-HA-TCS | RIS-HA-TCS-mPEG | ||||||||
|---|---|---|---|---|---|---|---|---|---|---|---|
| Precipitate Formation | Re-Dispersibility | Particle Size± SD nm | PDI ± SD | % EE ± SD | Precipitate Formation | Re-Dispersibility | Particle Size ± SD nm | PDI ± SD | % EE ± SD | ||
| 25 °C | 0 | NO | YES | 252.10 ± 2.4 | 0.239 ± 0.015 | 85.03 ± 2.2 | NO | YES | 264.8 ± 1.9 | 0.120 ± 0.007 | 91.10 ± 1.3 |
| 30 | NO | YES | 258.13 ± 1.19 | 0.242 ± 0.010 | 80.7 ± 1.8 | NO | YES | 266.0 ± 0.8 | 0.131 ± 0.002 | 89.60 ± 1.6 | |
| 60 | NO | YES | 263.4 ± 2.46 | 0.253 ± 0.010 | 73.5 ± 2.9 | NO | YES | 268.83 ± 0.7 | 0.146 ± 0.011 | 85.03 ± 2.2 | |
| 90 | NO | YES | 280.7 ± 2.7 | 0.268 ± 0.007 | 64.9 ± 2.6 | NO | YES | 269.03 ± 0.9 | 0.160 ± 0.007 | 83.93 ± 1.8 | |
| 40 °C | 0 | NO | YES | 252.10 ± 2.4 | 0.239 ± 0.015 | 85.03 ± 2.2 | NO | YES | 264.8 ± 1.9 | 0.120 ± 0.007 | 91.10 ± 1.3 |
| 30 | NO | YES | 265.4 ± 1.91 | 0.267 ± 0.002 | 74.2 ± 1.7 | NO | YES | 269.5 ± 0.611 | 0.147 ± 0.011 | 89.10 ± 3.7 | |
| 60 | NO | YES | 217 ± 1.93 | 0.273 ± 0.003 | 65.1 ± 2.8 | NO | YES | 272.4 ± 0.88 | 0.183 ± 0.005 | 86.3 ± 0.6 | |
| 90 | NO | YES | 306.3 ± 2.67 | 0.285 ± 0.004 | 59.2 ± 1.4 | NO | YES | 280.3 ± 1.09 | 0.204 ± 0.021 | 79.2 ± 0.8 | |
Disclaimer/Publisher’s Note: The statements, opinions and data contained in all publications are solely those of the individual author(s) and contributor(s) and not of MDPI and/or the editor(s). MDPI and/or the editor(s) disclaim responsibility for any injury to people or property resulting from any ideas, methods, instructions or products referred to in the content. |
© 2023 by the authors. Licensee MDPI, Basel, Switzerland. This article is an open access article distributed under the terms and conditions of the Creative Commons Attribution (CC BY) license (https://creativecommons.org/licenses/by/4.0/).
Share and Cite
Saifi, Z.; Shafi, S.; Ralli, T.; Jain, S.; Vohora, D.; Mir, S.R.; Alhalmi, A.; Noman, O.M.; Alahdab, A.; Amin, S. Enhancing Osteoporosis Treatment through Targeted Nanoparticle Delivery of Risedronate: In Vivo Evaluation and Bioavailability Enhancement. Pharmaceutics 2023, 15, 2339. https://doi.org/10.3390/pharmaceutics15092339
Saifi Z, Shafi S, Ralli T, Jain S, Vohora D, Mir SR, Alhalmi A, Noman OM, Alahdab A, Amin S. Enhancing Osteoporosis Treatment through Targeted Nanoparticle Delivery of Risedronate: In Vivo Evaluation and Bioavailability Enhancement. Pharmaceutics. 2023; 15(9):2339. https://doi.org/10.3390/pharmaceutics15092339
Chicago/Turabian StyleSaifi, Zoya, Sadat Shafi, Tanya Ralli, Shreshta Jain, Divya Vohora, Showkat Rasool Mir, Abdulsalam Alhalmi, Omar M. Noman, Ahmad Alahdab, and Saima Amin. 2023. "Enhancing Osteoporosis Treatment through Targeted Nanoparticle Delivery of Risedronate: In Vivo Evaluation and Bioavailability Enhancement" Pharmaceutics 15, no. 9: 2339. https://doi.org/10.3390/pharmaceutics15092339
APA StyleSaifi, Z., Shafi, S., Ralli, T., Jain, S., Vohora, D., Mir, S. R., Alhalmi, A., Noman, O. M., Alahdab, A., & Amin, S. (2023). Enhancing Osteoporosis Treatment through Targeted Nanoparticle Delivery of Risedronate: In Vivo Evaluation and Bioavailability Enhancement. Pharmaceutics, 15(9), 2339. https://doi.org/10.3390/pharmaceutics15092339