
Phenotyping Indices of CYP450 and P-Glycoprotein in Human Volunteers and in Patients Treated with Painkillers or Psychotropic Drugs

 ,
,  , , ,
, , ,  , , , and
Abstract
1. Introduction
2. Materials and Methods
2.1. Part 1: Determination of Phenotypic Indices from a Literature Review
2.1.1. Studies Selection
2.1.2. Data Collected
2.1.3. Statistical Analysis and Phenotypic Indices Calculation
2.2. Part 2: Comparison with Phenotypic Assessment in Patients
2.2.1. Subjects
2.2.2. Study Design
2.2.3. Analytical Methods
2.2.4. Pharmacokinetic Analysis
- -
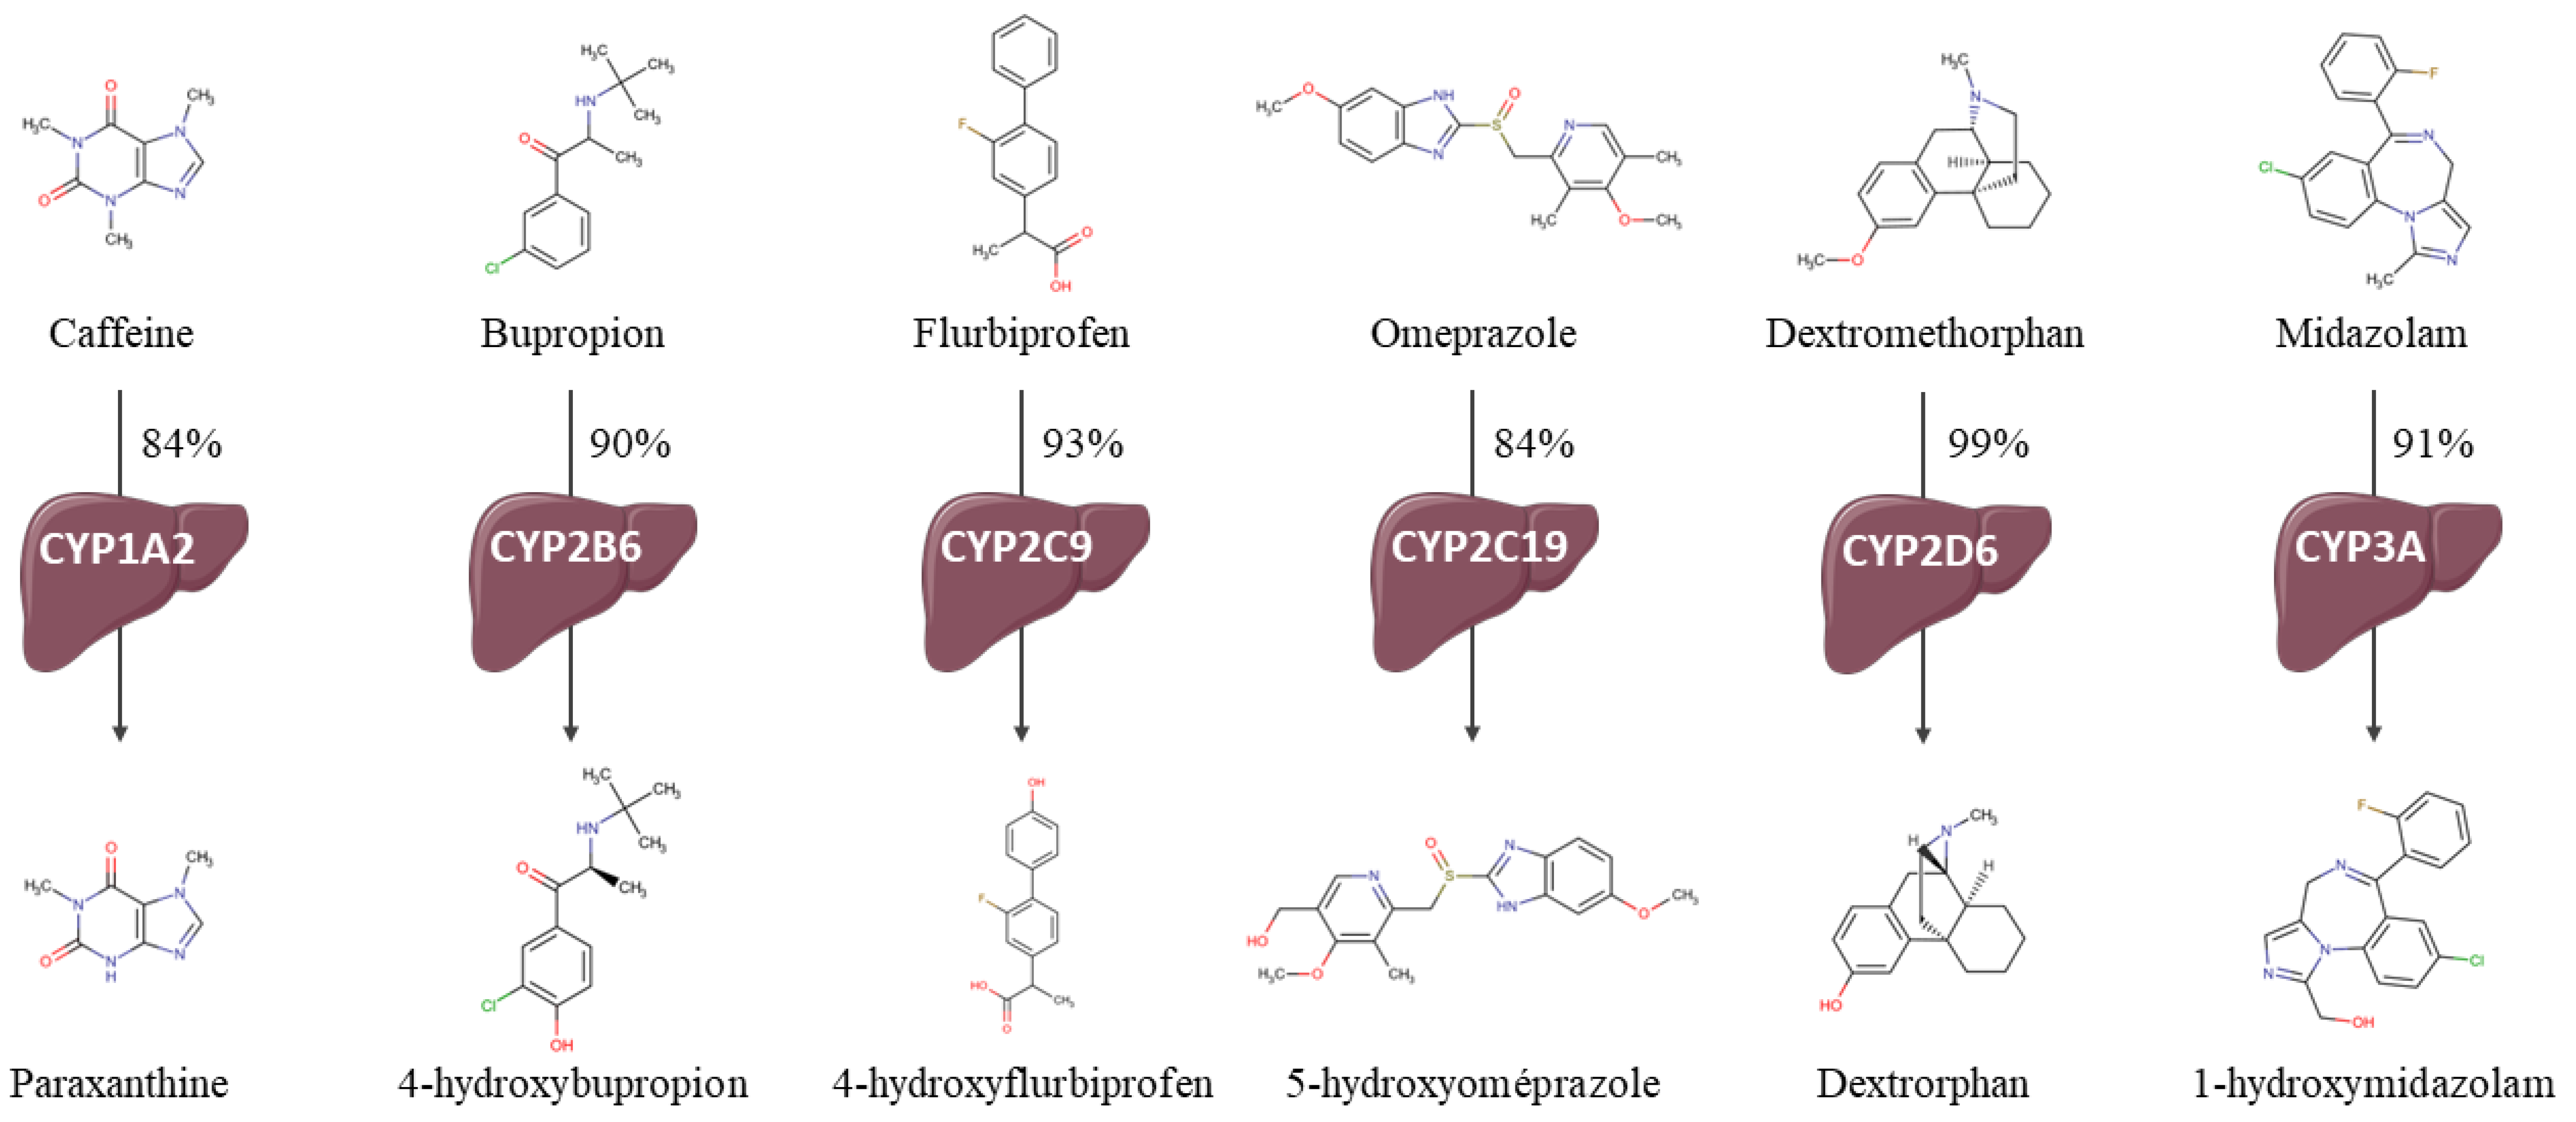
- CYP1A2—paraxanthine/caffeine MR (par/caf).
- -
- CYP2B6—4-hydroxybupropion/bupropion MR (OH-bup/bup).
- -
- CYP2C19—5-hydroxyomeprazole/omeprazole MR (OH-opz/opz).
- -
- CYP2C9—4-hydroxyflurbiprofen/flurbiprofen MR (OH-flb/flb).
- -
- CYP2D6—dextrorphan/dextromethorphan MR (dor/dem).
- -
- CYP3A—1-hydroxymidazolam/midazolam MR (OH-mdz/mdz).
2.2.5. Sensitivity Analysis
2.2.6. Correlation between Single-Point and AUC0–6h MRs
2.2.7. Comparison to Phenotypic Indices from the Literature
3. Results
3.1. Part 1: Determination of Phenotypic Indices in Human Volunteers Based on the Literature Analysis
3.1.1. Studies Included
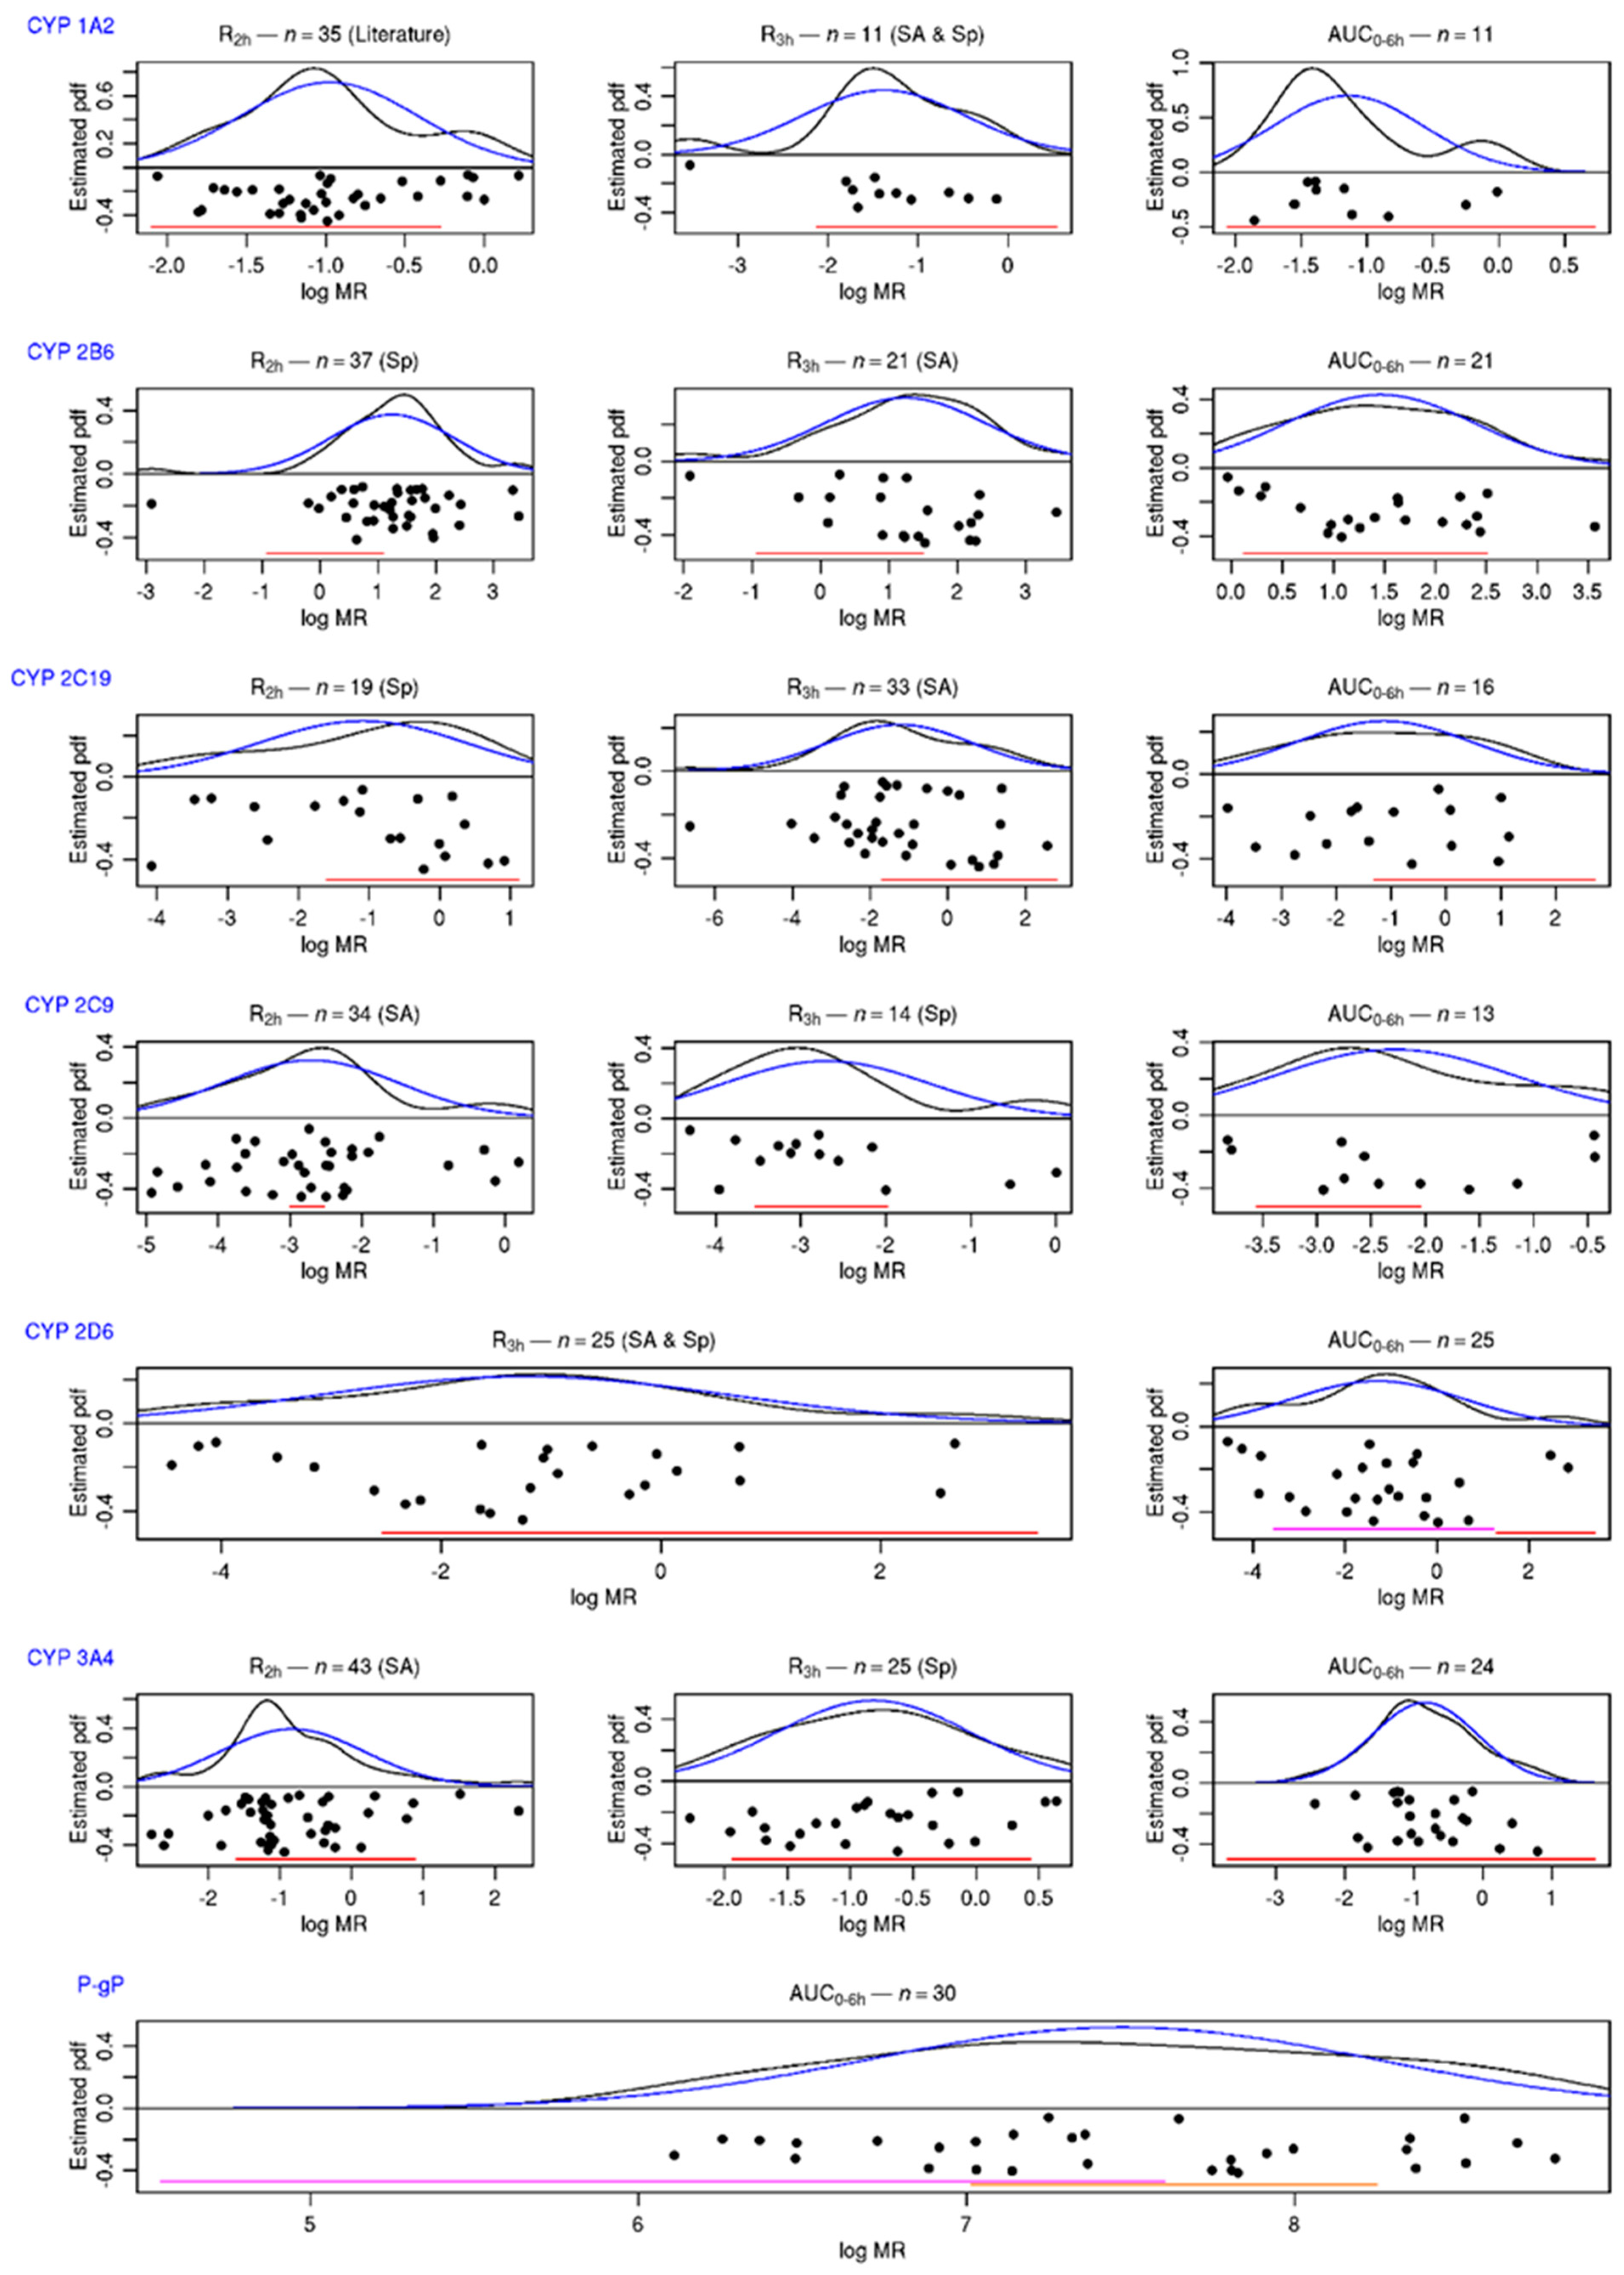
3.1.2. 95%/95%, Tolerance Intervals of Metabolic Indices
3.2. Part 2: Comparison to Phenotypic Assessment in Patients
3.2.1. Subjects
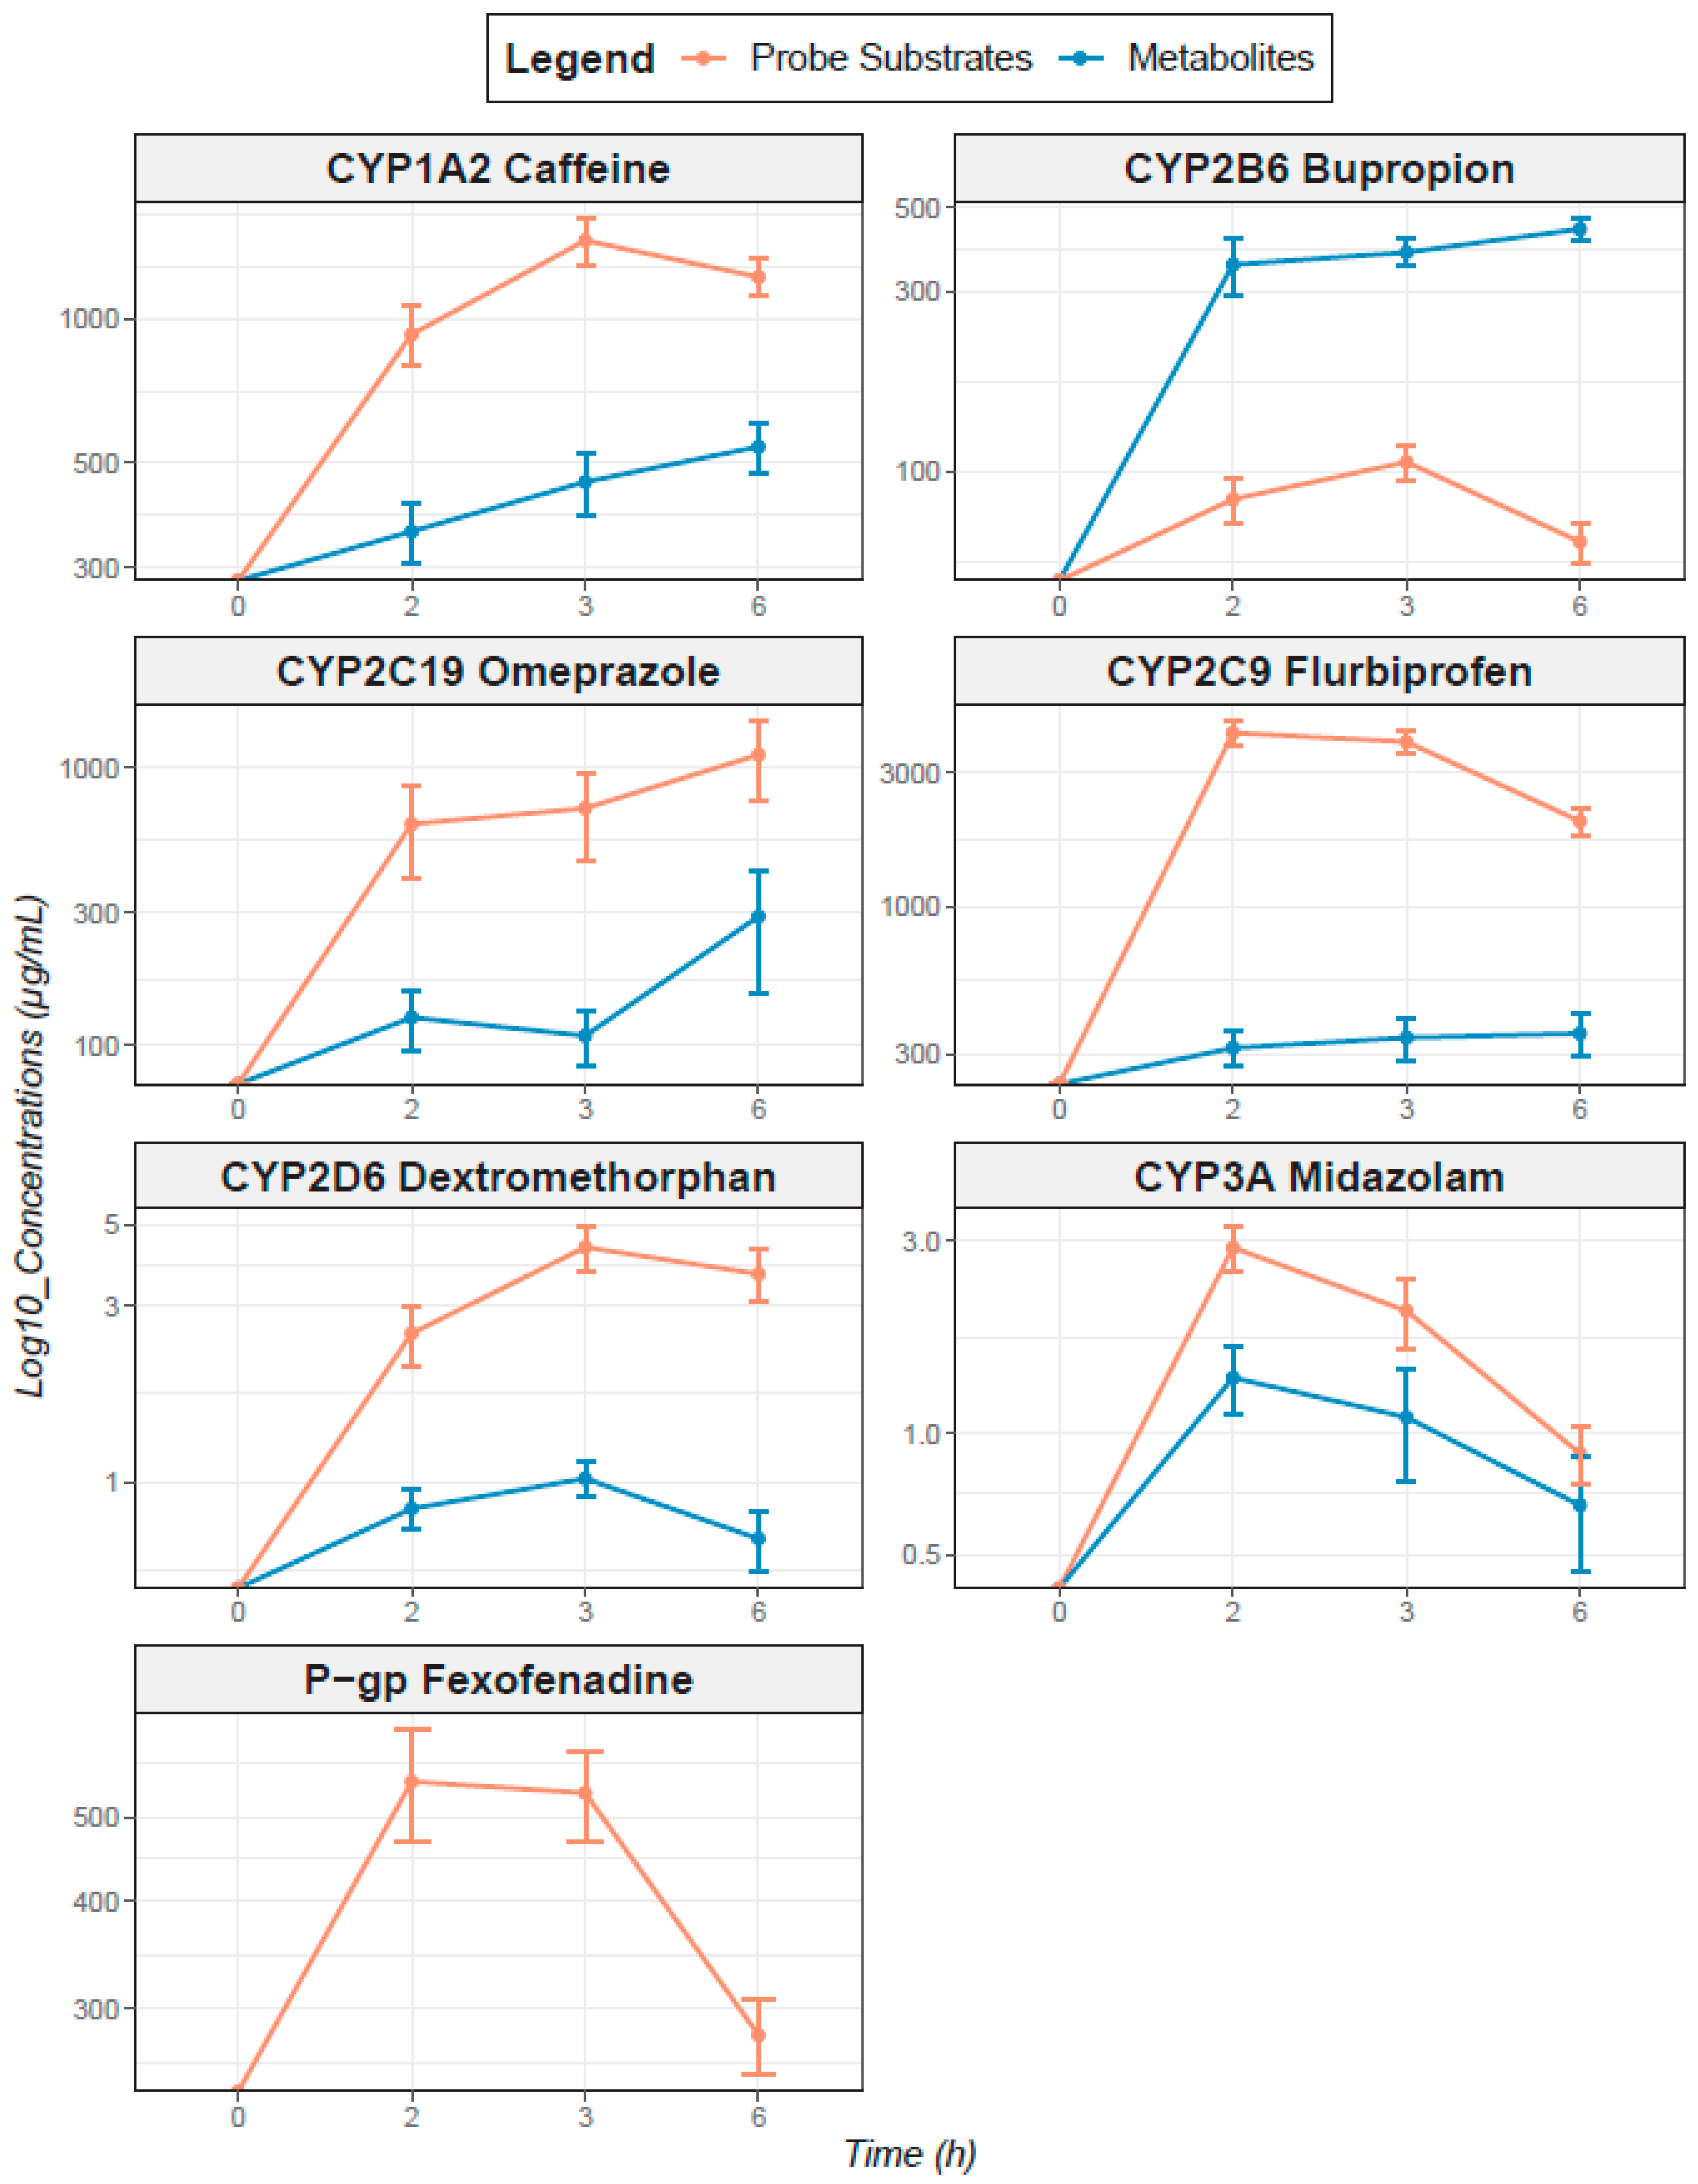
3.2.2. Pharmacokinetics of Probe Cocktail Drugs and Their Specific CYP-Mediated Metabolites
3.2.3. Comparison to Phenotypic Indices from the Literature Analysis
4. Discussion
Author Contributions
Funding
Institutional Review Board Statement
Informed Consent Statement
Data Availability Statement
Acknowledgments
Conflicts of Interest
Appendix A

| Antidepressants |
| Venlafaxine |
| Fluoxetine |
| Mirtazapine |
| Clomipramine |
| Paroxetine |
| Sertraline |
| Escitalopram |
| Duloxetine |
| Vortioxetine |
| Mianserine |
| Agomelatine |
| Citalopram |
| Fluvoxamine |
| Amitriptyline |
| Milnacipran |
| Dosulepine |
| Bupropion |
| Phenelzine |
| Tianeptine |
| Trimipramine |
| Antipsychotics |
| Quetiapine |
| Aripiprazole |
| Olanzapine |
| Risperidone |
| Amisulpride |
| Clozapine |
| Chlorpromazine |
| Loxapine |
| Amitriptyline |
| Cyamemazine |
| Ropinirole |
| Haloperidol |
| Alimemazine |
| Levomepromazine |
| Lithium |
| Antiepileptics |
| Lamotrigine |
| Valproate |
| Carbamazepine |
| Oxcarbazepine |
| Topiramate |
| Eslicarbazepine |
| Primidone |
| Pregabaline |
| Valpromide |
| Anxiolytics |
| Diazepam |
| Alprazolam |
| Lorazepam |
| Bromazepam |
| Prazepam |
| Oxazepam |
| Clobazam |
| Hypnotics |
| Lormetazepam |
| Zopiclone |
| Zolpidem |
| Others |
| Pramipexole |
| Dexamphetamine |
| Melatonin |
| Liothyronine |
| Methylphenidate |
| Analgesics |
| Tramadol |
| Opium |
| Codeine |
| Ketamine |
| Neurological and psychiatric disorders |
| Sedation |
| Headache |
| Dizziness |
| Anxiety |
| Tiredness |
| Restlessness |
| Tension |
| Muscular disorders |
| Dystonia |
| Shakiness |
| Hypokinesia/Akinesia |
| Muscle spasm |
| Metabolic disorders |
| Weight loss |
| Weight gain |
| Hyper- or hypoglycemia |
| Cardiovascular disorders |
| Hyper- or hypotension |
| Tachy- or bradycardia |
| QT interval prolongation |
| Palpitation |
| Digestive disorders |
| Nausea/vomiting |
| Diarrhea |
| Dry mouth |
| Other disorders |
| Polyuria |
| Incontinence |
| Sexual disorders |
| Blurred vision |
| Drug | Source | Tmax | Fraction Excreted Unchanged in Urines | Metabolite Urinary Elimination | SPC Comments on Urinary Elimination |
|---|---|---|---|---|---|
| Omeprazole | EMA | 1–2 h | “Almost none” | 80% | |
| FDA | 0.5–3.5 h | “Little” | 77% | ||
| Caffeine | EMA | 0.5–2 h | 1% | NA | Very important variation depending on hepatic and renal function |
| FDA | 0.5–2 h | 1% | NA | Very important variation depending on hepatic and renal function | |
| Dextromethorphan | EMA | 2 h | 5 to 20% (depending on urine pH) | NA | |
| FDA | 3 h | 2 to 26% (depending on 2 D6 activity) | 20–60% | Very important variation if renal impairment | |
| Bupropion | EMA | 3 h | 0.5% | 87% | |
| FDA | 2 h | 0.5% | 87% | ||
| Midazolam | EMA | NA | <1% | 60–80% | |
| FDA | NA | 0.5% | NA | ||
| Flurbiprofen | EMA | 1 h 30 min | 20–25% | 75–80% | |
| FDA | 2 h | <3% | 70% | Very important variation if renal impairment |
| CYP450 | Substrate Probe | Metabolite | Internal Standard | MRM Transitions (m/z) Substrate /Metabolite | Collision Energy (eV) Substrate /Metabolite | Polarity Mode | Calibration Curves (ng/mL) Substrate /Metabolite | Lower Limit of Quantification (ng/mL) | 3 Levels of Internal Quality Controls (ng/mL) Substrate/ Metabolite |
|---|---|---|---|---|---|---|---|---|---|
| 1A2 | Caffeine | Paraxanthine | Caffeine-13C3 | 195.0→138.0/ 181.0→124.0 | 23/30 | + | 25–5000/ 25–5000 | 12.5 | 30/750/4000 30/750/4000 |
| 2B6 | Bupropion | (±)-Hydroxybupropion | Bupropion-D9 | 240.1→184.0/ 256.1→238.0 | 11/10 | + | 5–1000/ 5–1000 | 2.5 | 15/200/750 15/200/750 |
| 2C9 | Flurbiprofen | 4′Hydroxyflurbiprofen | Flurbiprofen-D3 | 243.1→199.0/ 259.0→215.0 | 13/15 | - | 100–15,000/ 50–5000 | 50 | 200/2000/7500 75/750/1500 |
| 2C19 | Omeprazole | 5-Hydroxyomeprazole | Omeprazole-D3 | 346.0→198.0/ 362.0→213.9 | 12/13 | + | 1–500/ 1–500 | 0.5 | 2.5/75/400 2.5/75/400 |
| 2D6 | Dextromethorphan | Dextrorphan | Dextrorphan-D3 | 272.1→215.0/ 258.1→201.0 | 11/22 | + | 0.1–50/ 0.1–50 | 0.05 | 0.25/2.5/30 0.25/2.5/30 |
| 3A4 | Midazolam | α-Hydroxymidazolam | Midazolam-D4 | 326.0→291.0/ 342.1→198.0 | 25/29 | + | 0.1–50/ 0.1–50 | 0.05 | 0.25/2.5/30 0.25/2.5/30 |
| P-gp | Fexofenadine | - | Fexofenadine-D6 | 502.2→466.2 | 16 | + | 10–1000 | 5 | 25/200/750 |
| Cocktail Drugs | Cocktail | Number of Healthy Subjects | Analytical Methods | Dose Formulations | Phenotyping Indices (MR Except Fexofenadine) | References |
|---|---|---|---|---|---|---|
| Caffeine | Geneva | 10 | LCMS-MS | 100 mg homemade capsule | AUC0–8h: 0.56 a ± 0.24 b | [21] |
| Caffeine | Geneva | 30 | LCMS-MS | 100 mg homemade capsule | AUC0–8h: 0.41 d T2h: 0.31 d | [36] |
| Caffeine | With tolbutamide, omeprazole, dextromethorphan, midazolam | 14 | LCMS-MS | 100 mg ND | * “Normal” metabolizer (n = 2): t4h 0.239 a ± 0.059 b * “Increased” metabolizer (n = 12): t4h 0.514 a ± 0.143 b | [17] |
| Caffeine | With efavirenz, losartan, omeprazole, metoprolol, midazolam | 16 | LCMS-MS | 100 mg Tablet | T2h: 0.32 d [0.29–0.38] c T4h: 0.46 d [0.41–0.55] c T6h: 0.64 d [0.58–0.79] c T8h: 0.80 d [0.71–0.97] c AUC0–24h: 0.63 d [0.58–0.71]c | [37] |
| Caffeine | With tolbutamide, debrisoquine, chlorzoxazone, midazolam | 12 | LCMS-MS | 50 mg ND | T6.5h: 0.86 d [0.67–1.10]c | [11] |
| Caffeine | With mephenytoin, debrisoquine, chlorzoxazone, dapsone | 14 | HPLC-UV | 100 mg ND | Alone: T8h: 0.77 ± 0.25 b In cocktail: T8h 0.73 a ± 0.21 b | [5] |
| Caffeine | With flurbiprofen, mephenytoin, debrisoquine, dapsone, chlorzoxazone | 24 | HPLC-UV | 100 mg ND | T8h: 0.755 a ± 0.314 b | [38] |
| Caffeine | With flurbiprofen, mephenytoin, debrisoquine, dapsone, chlorzoxazone | 17 | UPLCMS-MS | 100 mg ND | * T8h: 0.79a ± 0.25 b | [39] |
| Caffeine | Alone | 30 | HPLC-UV | 100 mg tablet | AUC0–24h: 0.79 a ± 0.19 b | [40] |
| Caffeine | With losartan, dextromethorphan, omeprazole, midazolam | 14 | LCMS-MS | 200 mg tablet | AUC0–∞: 0.489 d | [41] |
| Caffeine | With paracetamol, dextromethorphan, midazolam, omeprazole, repaglinide, tolbutamide, rosuvastatin | 10 | LCMS-MS | 73 mg ND | * AUC0–∞: 0.64 d ± 0.13 | [7] |
| Caffeine | With omeprazole, losartan, debrisoquine, quinine | 24 | HPLC-UV | 20 mg tablet | T3.5–4h: 0.63 a [0.30–1.14] c | [12] |
| Caffeine | With omeprazole, tolbutamide, debrisoquine, midazolam | 16 | LCMS-MS | 100 mg ND | T2–3h 0.52 a | [13] |
| Bupropion | Geneva | 30 | LCMS-MS | 25 mg homemade capsule | AUC0–24h: 4.98 d T3h: 2.73 d | [36] |
| Bupropion | Geneva | 10 | LCMS-MS | 25 mg homemade capsule | AUC0–8h: 3.95 a ± 1.43 b | [21] |
| Flurbiprofen | Geneva | 30 | LCMS-MS | 25 mg homemade capsule | AUC0–24h: 0.043 d T3h: 0.0446 d | [36] |
| Flurbiprofen | Geneva | 10 | LCMS-MS | 25 mg homemade capsule | AUC0–8h: 0.062 a ± 0.014 b | [21] |
| Omeprazole | Geneva | 10 | LCMS-MS | 5 mg gastro-resistant capsule | AUC0–8h: 2.40 a ±1.56 b | [21] |
| Omeprazole | Geneva | 30 | LCMS-MS | 5 mg gastro-resistant capsule | AUC0–8h: 0.66 d AUC2,3,6h: 0.79 d T3h: 0.99 d | [36] |
| Omeprazole | With caffeine, dextromethorphan, midazolam | 12 | HPLC-UV | 40 mg delayed-release capsule | T2h: 0.60 e [0.16–1.47] c | [6] |
| Omeprazole | With caffeine, warfarin, dextromethorphan, midazolam | 12 | HPLC-UV | 40 mg delayed-release capsule | * T2h: 0.55 e [0.33–0.74] c | [42] |
| Omeprazole | With caffeine, efavirenz, losartan, metoprolol, midazolam | 16 | LCMS-MS | 10 mg gastro-resistant capsule | * T2h: 0.93 d [0.68–1] c * IM et EM: T4h: [0.5–5] c * PM (n = 1): T4h: 0.05 * T6h: 3.57 d [1.8–5.5] c * AUC0–24h: 1.12 d [0.85–1] c | [37] |
| Omeprazole | With caffeine, tolbutamide, debrisoquine, midazolam | 16 | LCMS-MS | 40 mg ND | T2–3h: 0.45 a | [13] |
| Omeprazole | With caffeine, losartan, debrisoquine, quinine | 24 | HPLC-UV | 20 mg tablet | * T3–3.5h: 1.13 a [0.33–5.88] c | [12] |
| Omeprazole | With caffeine, losartan, dextromethorphan, midazolam | 14 | LCMS-MS | 20 mg gastro-resistant capsule | AUC0–∞: 0.214 d | [43] |
| Omeprazole | With paracetamol, dextromethorphan, midazolam, caffeine, repaglinide, tolbutamide, rosuvastatin | 10 | LCMS-MS | 10 mg ND | * AUC0–∞: 1.28 d ± 0.48 | [7] |
| Dextromethorphan | Geneva | 10 | LCMS-MS | 10 mg homemade capsule | EM: AUC0–8h: 4.40 a ± 3.11 b IM: AUC0–8h: 0.40 a ± 0.32 b | [21] |
| Dextromethorphan | Geneva | 30 | LCMS-MS | 10 mg homemade capsule | AUC0–8h: 1.73 d T3h: 1.63 d | [36] |
| Dextromethorphan | With caffeine, tolbutamide, omeprazole, midazolam | 14 | LCMS-MS | 30 mg ND | * Ø activity (n = 3): T4h: 0.0043 a ± 0.0081 b * Normal (n = 11): T4h 1.69 a ± 2.49 b | [17] |
| Dextromethorphan | With caffeine, omeprazole, losartan, midazolam | 14 | LCMS-MS | 30 mg liquid-filled capsule | AUC0–∞: 2.9 d | [41] |
| Dextromethorphan | With paracetamol, midazolam, caffeine, repaglinide, tolbutamide, rosuvastatin | 10 | LCMS-MS | 18 mg ND | * EM (n = 9): AUC0–∞: 5 d ± 6.45 b * PM (n = 1): AUC0–∞: 0.012 d | [7] |
| Dextromethorphan | Alone | 11 | NA | 30 mg tablet | * AUC0–∞: 2.85 d ± 3.28 | [44] |
| Midazolam | Geneva | 10 | LCMS-MS | 1 mg homemade capsule | AUC0–8h: 0.48 a ± 0.16 b | [21] |
| Midazolam | Geneva | 30 | LCMS-MS | 1mg homemade capsule | AUC0–8h: 0.48 d T2h: 0.50 d | [36] |
| Midazolam | With caffeine, efavirenz, losartan, metoprolol, dextromethorphan | 16 | LCMS-MS | 2 mg oral solution | * T2h: 0.76d [0.56–0.86] c * T4h: 0.66d [0.51–0.75] c * T6h: 0.61d [0.43–0.74] c * AUC0–24h: 0.65d [0.48–0.73] c | [37] |
| Midazolam | With caffeine, tolbutamide, debrisoquine, dextromethorphan | 16 | LCMS-MS | 3.75 mg ND | T2h–3h: 0.91 a | [13] |
| Midazolam | With caffeine, losartan, omeprazole, dextromethorphan | 14 | LCMS-MS | 7.5 mg film-coated tablet | AUC0–∞: 0.589 d | [41] |
| Midazolam | With paracetamol, omeprazole, midazolam, caffeine, repaglinide, tolbutamide, rosuvastatin | 10 | LCMS-MS | 4 mg ND | * AUC0–∞: 1.3 d | [7] |
| Midazolam | Alone | 10 | HPLC-UV | 8 mg tablet | * AUC0–∞: 0.19 a | [45] |
| Fexofenadine | Geneva | 10 | LCMS-MS | 25 mg homemade capsule | AUC2–3–6h: 117.7 a ± 58.3 b AUC0–8h: 139.6 a ± 68.0 b AUC0–∞: 181.3 a ± 78.0 b | [21] |
| Fexofenadine | Geneva | 30 | LCMS-MS | 25 mg homemade capsule | In cocktail: AUC0–8h: 140.8 a ± 74.2 b Alone: AUC0–8h: 235.5 a ± 92.8 b | [24] |
| Fexofenadine | Alone | 12 | HPLC-FD | 120 mg tablet | AUC0–24h: 2075 a ± 557 b | [46] |
| Fexofenadine | Alone | 12 | LCMS-MS | 120 mg Tablet | AUC0–∞: 3507 a ± 972 b | [47] |
| Fexofenadine | Alone | 16 | LCMS-MS | 120 mg tablet | AUC0–∞: 1568 e | [48] |
| Fexofenadine | Alone | 12 | HPLC-FD | 60 mg tablet | AUC0–∞: 2075 a ± 46 b | [49] |
| Fexofenadine | Alone | 10 | HPLC-FD | 60 mg tablet | AUC0–∞: 1529 a ± 452 b | [50] |
| Fexofenadine | Alone | 25 | HPLC-UV | 180 mg tablet | AUC0–∞: 3028 a | [51] |
| Fexofenadine | With caffeine, losartan, omeprazole, dextromethorphan, midazolam | 14 | LCMS-MS | 30 mg tablet | AUC0–∞: 528 a | [41] |
| Phenotyping Indices | MRs | AUC | |||||||||||
|---|---|---|---|---|---|---|---|---|---|---|---|---|---|
| 1 A2 (Caffeine) | 2B6 (Bupropion) | 2C9 (Flurbiprofen) | 2C19 (Omeprazole) | 2D6 (Dextromethorphan) | 3A4 (Midazolam) | P-gp (Fexofenadine) | |||||||
| Patient | AUC0–6h | T2h | AUC0–6h | T3h | AUC0–6h | T3h | AUC0–6h | T3h | AUC0–6h | T3h | AUC0–6h | T2h | f-AUC0–6h |
| 1 | 0.45 | 9.44 | 9.58 | 0.12 | 3.90 | 0.14 | 0.11 | 0.28 | 0.30 | 5007 | |||
| 2 | 0.93 | 2.94 | 2.41 | 0.06 | 0.14 | 0.11 | 0.10 | 0.55 | 0.57 | 1513 | |||
| 3 | 0.37 | 0.08 | 0.41 | ||||||||||
| 4 | 0.09 | 0.08 | 1009 | ||||||||||
| 5 | 1.38 | ||||||||||||
| 6 | 0.80 | ||||||||||||
| 7 | 0.67 | 2972 | |||||||||||
| 8 | 0.06 | ||||||||||||
| 9 | 0.52 | 12.34 | 10.04 | 0.06 | 0.05 | 3.15 | 3.28 | 0.64 | 0.75 | 0.19 | 0.23 | 584 | |
| 10 | 0.25 | 0.36 | 3.13 | 3.35 | 0.09 | 0.45 | 0.06 | 0.02 | 0.02 | 0.79 | 0.72 | 2737 | |
| 11 | 0.38 | 1.34 | 1.14 | 0.03 | 0.10 | 0.18 | 0.03 | 0.04 | 0.04 | 0.65 | 0.68 | 2096 | |
| 12 | 0.21 | 0.6 | 35.34 | 31.44 | 0.02 | 0.02 | 0.43 | 0.39 | 1.28 | 1.14 | 5874 | ||
| 13 | 0.31 | 0.34 | 11.47 | 8.88 | 0.13 | 0.08 | 0.87 | 0.99 | 0.59 | 0.53 | 0.75 | 0.69 | 4194 |
| 14 | 0.37 | 0.02 | 0.19 | 0.33 | |||||||||
| 15 | 0.4 | 0.04 | 0.16 | ||||||||||
| 16 | 0.31 | ||||||||||||
| 17 | 0.66 | 7.92 | 7.53 | 0.01 | 0.06 | 0.05 | 1.02 | 0.96 | 0.29 | 0.32 | 1586 | ||
| 18 | 0.43 | 0.23 | 11.1 | 10.17 | 0.05 | 0.08 | 1.88 | 0.33 | 0.31 | 1.54 | 1.26 | 6593 | |
| 19 | 0.29 | 0.06 | 0.18 | 0.24 | |||||||||
| 20 | 0.26 | 0.03 | 0.29 | ||||||||||
| 21 | 0.37 | 0.07 | 0.02 | 0.02 | 0.01 | 0.01 | 0.30 | 0.28 | 653 | ||||
| 22 | 0.24 | ||||||||||||
| 23 | 0.32 | 0.03 | 0.07 | 0.27 | 0.34 | 0.16 | 0.13 | 1260 | |||||
| 24 | 0.44 | 10.02 | 8.99 | 0.11 | 0.08 | 0.08 | 0.23 | 0.20 | 0.16 | 0.17 | 978 | ||
| 25 | 0.31 | 4.07 | 2.48 | 0.09 | 0.20 | 0.12 | 0.17 | 0.21 | 0.35 | 0.31 | 1127 | ||
| 26 | 0.36 | 2.66 | 2.49 | 0.12 | 0.11 | 0.10 | 1.98 | 2.04 | 0.66 | 0.72 | 1131 | ||
| 27 | 0.33 | 0.47 | 5.49 | 4.79 | 0.06 | 0.06 | 0.38 | 0.42 | 0.76 | 0.87 | 0.29 | 0.31 | 2455 |
| 28 | 0.27 | 0.97 | 0.15 | 0.03 | 1.11 | 1.34 | 0.02 | 0.03 | 0.35 | 0.34 | 2510 | ||
| 29 | 0.23 | 0.18 | 0.54 | 0.59 | 0.06 | 0.07 | 10.28 | 450 | |||||
| 30 | 0.76 | 1.08 | 1.08 | 17.28 | 12.73 | 2.21 | 2.15 | 521 | |||||
| 31 | 2.37 | ||||||||||||
| 32 | 0.9 | 0.09 | 0.14 | 0.16 | |||||||||
| 33 | 0.19 | 0.11 | 0.28 | ||||||||||
| 34 | 0.29 | ||||||||||||
| 35 | 0.16 | 1.96 | 1.32 | 0.05 | 0.75 | 0.20 | 0.35 | 0.35 | 0.36 | 0.33 | 1574 | ||
| 36 | 0.29 | 0.30 | 1410 | ||||||||||
| 37 | 0.31 | 0.03 | 0.34 | 0.39 | |||||||||
| 38 | 0.21 | 5.09 | 4.16 | 0.01 | 0.27 | 0.01 | 0.01 | 0.50 | 0.48 | 4234 | |||
| 39 | 0.13 | 0.02 | 0.07 | ||||||||||
| 40 | 0.15 | 3.65 | 4.55 | 651 | |||||||||
| 41 | 0.05 | 12.87 | 0.32 | 836 | |||||||||
| 42 | 0.21 | 0.28 | 1.07 | 0.72 | 0.20 | 0.17 | 2.59 | 4.03 | 0.25 | 0.28 | 0.87 | 0.80 | 5029 |
| 43 | 0.25 | 0.27 | 1.39 | 1.11 | 0.64 | 1.21 | 2.72 | 2.21 | 12.01 | 14.47 | 2460 | ||
| 44 | 0.16 | 0.17 | 5.15 | 3.42 | 0.32 | 0.01 | 0.01 | 0.20 | 0.19 | 0.50 | 0.32 | 1265 | |
| 45 | 0.78 | 1.24 | 3.51 | 3.53 | 0.65 | 0.87 | 0.40 | 1.63 | 1.16 | 0.39 | 0.21 | 2315 | |
| 46 | 0.99 | 0.9 | 2.58 | 4.59 | 0.08 | 0.06 | 0.24 | 0.07 | 0.79 | 2.05 | 4310 | ||


References
- Guengerich, F.P. Cytochrome P450s and Other Enzymes in Drug Metabolism and Toxicity. AAPS J. 2006, 8, E101–E111. [Google Scholar] [CrossRef]
- Glaeser, H. Importance of P-Glycoprotein for Drug–Drug Interactions. Handb. Exp. Pharmacol. 2010, 201, 285–297. [Google Scholar]
- Zanger, U.M.; Schwab, M. Cytochrome P450 Enzymes in Drug Metabolism: Regulation of Gene Expression, Enzyme Activities, and Impact of Genetic Variation. Pharmacol. Ther. 2013, 138, 103–141. [Google Scholar] [CrossRef] [PubMed]
- König, J.; Müller, F.; Fromm, M.F. Transporters and Drug-Drug Interactions: Important Determinants of Drug Disposition and Effects. Pharmacol. Rev. 2013, 65, 944–966. [Google Scholar] [CrossRef] [PubMed]
- Frye, R.F.; Matzke, G.R.; Adedoyin, A.; Porter, J.A.; Branch, R.A. Validation of the Five-Drug “Pittsburgh Cocktail” Approach for Assessment of Selective Regulation of Drug-Metabolizing Enzymes. Clin. Pharmacol. Ther. 1997, 62, 365–376. [Google Scholar] [CrossRef]
- Streetman, D. Combined Phenotypic Assessment of CYP1A2, CYP2C19, CYP2D6, CYP3A, N-Acetyltransferase-2, and Xanthine Oxidase with the “Cooperstown Cocktail”. Clin. Pharmacol. Ther. 2000, 68, 375–383. [Google Scholar] [CrossRef]
- Lenuzza, N.; Duval, X.; Nicolas, G.; Thévenot, E.; Job, S.; Videau, O.; Narjoz, C.; Loriot, M.-A.; Beaune, P.; Becquemont, L.; et al. Safety and Pharmacokinetics of the CIME Combination of Drugs and Their Metabolites after a Single Oral Dosing in Healthy Volunteers. Eur. J. Drug Metab. Pharmacokinet. 2014, 41, 125–138. [Google Scholar] [CrossRef] [PubMed]
- de Andrés, F.; Sosa-Macías, M.; LLerena, A. A Rapid and Simple LC–MS/MS Method for the Simultaneous Evaluation of CYP1A2, CYP2C9, CYP2C19, CYP2D6 and CYP3A4 Hydroxylation Capacity. Bioanalysis 2014, 6, 683–696. [Google Scholar] [CrossRef]
- Puris, E.; Pasanen, M.; Gynther, M.; Häkkinen, M.R.; Pihlajamäki, J.; Keränen, T.; Honkakoski, P.; Raunio, H.; Petsalo, A. A Liquid Chromatography-Tandem Mass Spectrometry Analysis of Nine Cytochrome P450 Probe Drugs and Their Corresponding Metabolites in Human Serum and Urine. Anal. Bioanal. Chem. 2016, 409, 251–268. [Google Scholar] [CrossRef]
- Zhu, B. Assessment of Cytochrome P450 Activity by a Five-Drug Cocktail Approach. Clin. Pharmacol. Ther. 2001, 70, 455–461. [Google Scholar] [CrossRef]
- Blakey, G.E.; Lockton, J.A.; Perrett, J.; Norwood, P.; Russell, M.; Aherne, Z.; Plume, J. Pharmacokinetic and Pharmacodynamic Assessment of a Five-Probe Metabolic Cocktail for CYPs 1A2, 3A4, 2C9, 2D6 and 2E1. Br. J. Clin. Pharmacol. 2004, 57, 162–169. [Google Scholar] [CrossRef]
- Christensen, M. The Karolinska Cocktail for Phenotyping of Five Human Cytochrome P450 Enzymes. Clin. Pharmacol. Ther. 2003, 73, 517–528. [Google Scholar] [CrossRef]
- Yin, O.Q.P.; Lam, S.S.L.; Lo, C.M.Y.; Chow, M.S.S. Rapid Determination of Five Probe Drugs and Their Metabolites in Human Plasma and Urine by Liquid Chromatography/Tandem Mass Spectrometry: Application to Cytochrome P450 Phenotyping Studies. Rapid Commun. Mass Spectrom. 2004, 18, 2921–2933. [Google Scholar] [CrossRef] [PubMed]
- Ryu, J.Y.; Song, I.S.; Sunwoo, Y.E.; Shon, J.H.; Liu, K.H.; Cha, I.J.; Shin, J.G. Development of the “Inje Cocktail” for High-Throughput Evaluation of Five Human Cytochrome P450 Isoforms in Vivo. Clin. Pharmacol. Ther. 2007, 82, 531–540. [Google Scholar] [CrossRef]
- Ghassabian, S.; Chetty, M.; Tattam, B.N.; Chem, M.C.; Glen, J.; Rahme, J.; Stankovic, Z.; Ramzan, I.; Murray, M.; McLachlan, A.J. A High-Throughput Assay Using Liquid Chromatography-Tandem Mass Spectrometry for Simultaneous In Vivo Phenotyping of 5 Major Cytochrome P450 Enzymes in Patients. Ther. Drug Monit. 2009, 31, 239–246. [Google Scholar] [CrossRef] [PubMed]
- Turpault, S.; Brian, W.; Van Horn, R.; Santoni, A.; Poitiers, F.; Donazzolo, Y.; Boulenc, X. Pharmacokinetic Assessment of a Five-Probe Cocktail for CYPs 1A2, 2C9, 2C19, 2D6 and 3A. Br. J. Clin. Pharmacol. 2009, 68, 928–935. [Google Scholar] [CrossRef]
- Wohlfarth, A.; Naue, J.; Lutz-Bonengel, S.; Dresen, S.; Auwärter, V. Cocktail Approach for In Vivo Phenotyping of 5 Major CYP450 Isoenzymes: Development of an Effective Sampling, Extraction, and Analytical Procedure and Pilot Study with Comparative Genotyping. J. Clin. Pharmacol. 2012, 52, 1200–1214. [Google Scholar] [CrossRef]
- Trueck, C.; Hsin, C.; Scherf-Clavel, O.; Schaeffeler, E.; Lenssen, R.; Gazzaz, M.; Gersie, M.; Taubert, M.; Quasdorff, M.; Schwab, M.; et al. A Clinical Drug-Drug Interaction Study Assessing a Novel Drug Transporter Phenotyping Cocktail with Adefovir, Sitagliptin, Metformin, Pitavastatin, and Digoxin. Clin. Pharmacol. Ther. 2019, 106, 1398–1407. [Google Scholar] [CrossRef]
- Prueksaritanont, T.; Tatosian, D.A.; Chu, X.; Railkar, R.; Evers, R.; Chavez-Eng, C.; Lutz, R.; Zeng, W.; Yabut, J.; Chan, G.H.; et al. Validation of a Microdose Probe Drug Cocktail for Clinical Drug Interaction Assessments for Drug Transporters and CYP3A. Clin. Pharmacol. Ther. 2016, 101, 519–530. [Google Scholar] [CrossRef] [PubMed]
- Stopfer, P.; Giessmann, T.; Hohl, K.; Sharma, A.; Ishiguro, N.; Taub, M.E.; Zimdahl-Gelling, H.; Gansser, D.; Wein, M.; Ebner, T.; et al. Pharmacokinetic Evaluation of a Drug Transporter Cocktail Consisting of Digoxin, Furosemide, Metformin, and Rosuvastatin. Clin. Pharmacol. Ther. 2016, 100, 259–267. [Google Scholar] [CrossRef]
- Bosilkovska, M.; Samer, C.F.; Déglon, J.; Rebsamen, M.; Staub, C.; Dayer, P.; Walder, B.; Desmeules, J.A.; Daali, Y. Geneva Cocktail for Cytochrome P450 and P-Glycoprotein Activity Assessment Using Dried Blood Spots. Clin. Pharmacol. Ther. 2014, 96, 349–359. [Google Scholar] [CrossRef] [PubMed]
- Bosilkovska, M.; Déglon, J.; Samer, C.; Walder, B.; Desmeules, J.; Staub, C.; Daali, Y. Simultaneous LC–MS/MS Quantification of P-Glycoprotein and Cytochrome P450 Probe Substrates and Their Metabolites in DBS and Plasma. Bioanalysis 2014, 6, 151–164. [Google Scholar] [CrossRef]
- Young, D.S. Tolerance: An R Package for Estimating Tolerance Intervals. J. Stat. Softw. 2010, 36, 1–39. [Google Scholar] [CrossRef]
- Bosilkovska, M.; Magliocco, G.; Desmeules, J.; Samer, C.; Daali, Y. Interaction between Fexofenadine and CYP Phenotyping Probe Drugs in Geneva Cocktail. J. Pers. Med. 2019, 9, 45. [Google Scholar] [CrossRef]
- Delage, C.; Darnaud, L.; Etain, B.; Vignes, M.; Ly, T.-K.; Frapsauce, A.; Veyrier, M.; Delavest, M.; Marlinge, E.; Hennion, V.; et al. Cytochromes P450 and P-Glycoprotein Phenotypic Assessment to Optimize Psychotropic Pharmacotherapy: A Retrospective Analysis of Four Years of Practice in Psychiatry. J. Pers. Med. 2022, 12, 1869. [Google Scholar] [CrossRef] [PubMed]
- Samer, C.F.; Lorenzini, K.I.; Rollason, V.; Daali, Y.; Desmeules, J.A. Applications of CYP450 Testing in the Clinical Setting. Mol. Diagn. Ther. 2013, 17, 165–184. [Google Scholar] [CrossRef]
- Borges, S.; Li, L.; Hamman, M.A.; Jones, D.R.; Hall, S.D.; Christopher Gorski, J. Dextromethorphan to Dextrorphan Urinary Metabolic Ratio Does Not Reflect Dextromethorphan Oral Clearance. Drug Metab. Dispos. 2005, 33, 1052–1055. [Google Scholar] [CrossRef]
- Hôpitaux Universitaires de Genève. Drug Interactions, Cytochromes P450 and P-Glycoprotein (Pgp). Available online: https://www.hug.ch/sites/interhug/files/structures (accessed on 12 January 2022).
- Ing Lorenzini, K.; Desmeules, J.; Rollason, V.; Bertin, S.; Besson, M.; Daali, Y.; Samer, C.F. CYP450 Genotype-Phenotype Concordance Using the Geneva Micrococktail in a Clinical Setting. Front. Pharmacol. 2021, 12, 730637. [Google Scholar] [CrossRef] [PubMed]
- Lloret-Linares, C.; Bosilkovska, M.; Daali, Y.; Gex-Fabry, M.; Heron, K.; Bancila, V.; Michalopoulos, G.; Perroud, N.; Richard-Lepouriel, H.; Aubry, J.M.; et al. Phenotypic Assessment of Drug Metabolic Pathways and P-Glycoprotein in Patients Treated with Antidepressants in an Ambulatory Setting. J. Clin. Psychiatry 2018, 79, 16m11387. [Google Scholar] [CrossRef] [PubMed]
- Gloor, Y.; Lloret-Linares, C.; Bosilkovska, M.; Perroud, N.; Richard-Lepouriel, H.; Aubry, J.-M.; Daali, Y.; Desmeules, J.A.; Besson, M. Drug Metabolic Enzyme Genotype-Phenotype Discrepancy: High Phenoconversion Rate in Patients Treated with Antidepressants. Biomed. Pharmacother. 2022, 152, 113202. [Google Scholar] [CrossRef]
- Ajami, N.E.; Gupta, S.; Maurya, M.R.; Nguyen, P.; Li, J.Y.-S.; Shyy, J.Y.-J.; Chen, Z.; Chien, S.; Subramaniam, S. Systems Biology Analysis of Longitudinal Functional Response of Endothelial Cells to Shear Stress. Proc. Natl. Acad. Sci. USA 2017, 114, 10990–10995. [Google Scholar] [CrossRef]
- Ahn, S.I.; Sei, Y.J.; Park, H.-J.; Kim, J.; Ryu, Y.; Choi, J.J.; Sung, H.-J.; MacDonald, T.J.; Levey, A.I.; Kim, Y. Microengineered Human Blood-Brain Barrier Platform for Understanding Nanoparticle Transport Mechanisms. Nat. Commun. 2020, 11, 175. [Google Scholar] [CrossRef]
- Waring, R.H. Cytochrome P450: Genotype to Phenotype. Xenobiotica 2020, 50, 9–18. [Google Scholar] [CrossRef]
- Eap, C.B.; Gründer, G.; Baumann, P.; Ansermot, N.; Conca, A.; Corruble, E.; Crettol, S.; Dahl, M.L.; de Leon, J.; Greiner, C.; et al. Tools for Optimising Pharmacotherapy in Psychiatry (Therapeutic Drug Monitoring, Molecular Brain Imaging and Pharmacogenetic Tests): Focus on Antidepressants. World J. Biol. Psychiatry 2021, 22, 561–628. [Google Scholar] [CrossRef]
- Bosilkovska, M.; Samer, C.; Déglon, J.; Thomas, A.; Walder, B.; Desmeules, J.; Daali, Y. Evaluation of Mutual Drug-Drug Interaction within Geneva Cocktail for Cytochrome P450 Phenotyping Using Innovative Dried Blood Sampling Method. Basic Clin. Pharmacol. Toxicol. 2016, 119, 284–290. [Google Scholar] [CrossRef] [PubMed]
- Derungs, A.; Donzelli, M.; Berger, B.; Noppen, C.; Krähenbühl, S.; Haschke, M. Effects of Cytochrome P450 Inhibition and Induction on the Phenotyping Metrics of the Basel Cocktail: A Randomized Crossover Study. Clin. Pharmacokinet. 2016, 55, 79–91. [Google Scholar] [CrossRef] [PubMed]
- Zgheib, N.; Frye, R.; Tracy, T.; Romkes, M.; Branch, R. Validation of Incorporating Flurbiprofen into the Pittsburgh Cocktail. Clin. Pharmacol. Ther. 2006, 80, 257–263. [Google Scholar] [CrossRef] [PubMed]
- Stewart, N.A.; Buch, S.C.; Conrads, T.P.; Branch, R.A. A UPLC-MS/MS Assay of the “Pittsburgh Cocktail”: Six CYP Probe-Drug/Metabolites from Human Plasma and Urine Using Stable Isotope Dilution. Analyst 2011, 136, 605–612. [Google Scholar] [CrossRef]
- Perera, V.; Gross, A.S.; Xu, H.; McLachlan, A.J. Pharmacokinetics of Caffeine in Plasma and Saliva, and the Influence of Caffeine Abstinence on CYP1A2 Metrics. J. Pharm. Pharmacol. 2011, 63, 1161–1168. [Google Scholar] [CrossRef]
- Kim, D.-S.; Kim, Y.; Jeon, J.-Y.; Kim, M.-G. Effect of Red Ginseng on Cytochrome P450 and P-Glycoprotein Activities in Healthy Volunteers. J. Ginseng Res. 2016, 40, 375–381. [Google Scholar] [CrossRef] [PubMed]
- Chainuvati, S. Combined Phenotypic Assessment of Cytochrome P450 1A2, 2C9, 2C19, 2D6, and 3A, N-Acetyltransferase-2, and Xanthine Oxidase Activities with the “Cooperstown 5+1 Cocktail”. Clin. Pharmacol. Ther. 2003, 74, 437–447. [Google Scholar] [CrossRef]
- Ohura, N.; Yamamoto, K.; Ichioka, S.; Sokabe, T.; Nakatsuka, H.; Baba, A.; Shibata, M.; Nakatsuka, T.; Harii, K.; Wada, Y.; et al. Global Analysis of Shear Stress-Responsive Genes in Vascular Endothelial Cells. J. Atheroscler. Thromb. 2003, 10, 304–313. [Google Scholar] [CrossRef]
- Jetter, A.; Fätkenheuer, G.; Frank, D.; Klaassen, T.; Seeringer, A.; Doroshyenko, O.; Kirchheiner, J.; Hein, W.; Schömig, E.; Fuhr, U.; et al. Do Activities of Cytochrome P450 (CYP)3A, CYP2D6 and P-Glycoprotein Differ between Healthy Volunteers and HIV-Infected Patients? Antivir. Ther. 2010, 15, 975–983. [Google Scholar] [CrossRef] [PubMed]
- Uchida, S.; Yamada, H.; Li, X.D.; Maruyama, S.; Ohmori, Y.; Oki, T.; Watanabe, H.; Umegaki, K.; Ohashi, K.; Yamada, S. Effects of Ginkgo Biloba Extract on Pharmacokinetics and Pharmacodynamics of Tolbutamide and Midazolam in Healthy Volunteers. J. Clin. Pharmacol. 2006, 46, 1290–1298. [Google Scholar] [CrossRef]
- Kim, K.-A.; Park, J.-Y. Effect of Metronidazole on the Pharmacokinetics of Fexofenadine, a P-Glycoprotein Substrate, in Healthy Male Volunteers. Eur. J. Clin. Pharmacol. 2010, 66, 721–725. [Google Scholar] [CrossRef] [PubMed]
- Bedada, S.K.; Boga, P.K.; Kotakonda, H.K. The Effect of Diosmin on the Pharmacokinetics of Fexofenadine in Healthy Human Volunteers. Xenobiotica 2016, 47, 230–235. [Google Scholar] [CrossRef]
- van Heeswijk, R.P.G.; Bourbeau, M.; Campbell, P.; Seguin, I.; Chauhan, B.M.; Foster, B.C.; Cameron, D.W. Time-Dependent Interaction Between Lopinavir/Ritonavir and Fexofenadine. J. Clin. Pharmacol. 2006, 46, 758–767. [Google Scholar] [CrossRef]
- Kim, K.-A.; Park, P.-W.; Park, J.-Y. Short-Term Effect of Quercetin on the Pharmacokinetics of Fexofenadine, a Substrate of P-Glycoprotein, in Healthy Volunteers. Eur. J. Clin. Pharmacol. 2009, 65, 609–614. [Google Scholar] [CrossRef]
- Luo, J.; Imai, H.; Ohyama, T.; Hashimoto, S.; Hasunuma, T.; Inoue, Y.; Kotegawa, T.; Ohashi, K.; Uemura, N. The Pharmacokinetic Exposure to Fexofenadine Is Volume-Dependently Reduced in Healthy Subjects Following Oral Administration with Apple Juice. Clin. Transl. Sci. 2016, 9, 201–206. [Google Scholar] [CrossRef]
- Mendoza, L.; Begany, P.; Dyrhonova, M.; Emritte, N.; Svobodova, X. Bioequivalence of Two Fexofenadine Formulations in Healthy Human Volunteers after Single Oral Administration. Biomed. Pap. 2007, 151, 65–67. [Google Scholar] [CrossRef] [PubMed]

| CYP450 (Cocktail probe) | MRs | Decreased Activity | Normal Activity | Increased Activity | |
| CYP1A2 (caffeine) | AUC0–6h | <0.13 | 0.13–2.07 | >2.07 | |
| t2h | <0.12 | 0.12–0.76 | >0.76 | ||
| t3h | <0.12 | 0.12–1.72 | >1.72 | ||
| CYP2B6 (bupropion) | AUC0–6h | <1.13 | 1.13–12.22 | >12.22 | |
| t3h | <0.39 | 0.39–4.45 | >4.45 | ||
| CYP2C19 (omeprazole) | AUC0–6h | <0.27 | 0.27–15.09 | >15.09 | |
| t2h | <0.20 | 0.20–3.06 | >3.06 | ||
| t3h | <0.18 | 0.18–16.49 | >16.49 | ||
| CYP2C9 (flurbiprofen) | AUC0–6h | <0.03 | 0.03–0.13 | >0.13 | |
| t3h | <0.03 | 0.03–0.14 | >0.14 | ||
| CYP2D6 (dextromethorphan) | AUC0–6h | <0.03 | IM 0.03–3.4 | EM 3.4–31.2 | >31.2 |
| t3h | <0.08 | 0.08–30.6 | >30.6 | ||
| CYP3A (midazolam) | AUC0–6h | <0.02 | 0.02–5.10 | >5.10 | |
| t2h | <0.20 | 0.20–2.42 | >2.42 | ||
| t3h | <0.14 | 0.14–1.54 | >1.54 | ||
| Transporter (molecule) | AUC (µg/L*h) | Decreased Activity | Normal Activity | Increased Activity | |
| P-gp (120 mg) (fexofenadine in Geneva cocktail) | AUC0–6h | >1538 | 167–1538 | <167 | |
| P-gp (120 mg) (fexofenadine alone) | AUC0–6h | >3486 | 1229–3486 | <1229 | |
| Median | Range | |
|---|---|---|
| Age (years) | 49 | 21–85 |
| BMI (kg/m2) | 27.4 | 17.9–41.6 |
| AST (UI/mL) | 24 | 15–92 |
| ALT (UI/mL) | 22 | 5–160 |
| GGT (UI/mL) | 35 | 10–211 |
| PAL (UI/mL) | 73 | 38–113 |
| Albumin (mg/L) | 40 | 17–51 |
| Protein (mg/L) | 67 | 53–85 |
| CKD-Epi (mL/min/1.73 m2) | 85 | 52–130 |
| N | % | |
| Female | 32 | 70 |
| Smoker | 11 | 24 |
| Psychiatric disorders | 41 | 89 |
| Pain disorders | 5 | 11 |
| CYP or Transporter | Number of Subjects | Sampling Time | Phenotyping Indices | Sensitivity Analysis | Correlation between Single-Time and AUC0–6h MRs | ||||
|---|---|---|---|---|---|---|---|---|---|
| Geo Mean a | CV (%) b | mSA | CV (%) | nSA | rS | pS | |||
| CYP1A2 | 34 11 11 11 | T2h T3h T6h AUC0–6h | 0.37 0.25 0.40 0.32 | 61 74 77 70 | 1442 4686 3030 | 88 78 63 | 1 (9%) 8 (73%) 2 (18%) | 0.56 0.91 0.72 | 0.075 <0.001 * 0.017 * |
| CYP2B6 | 36 21 21 21 | T2h T3h T6h AUC0–6h | 3.39 3.44 7.90 4.30 | 120 116 117 114 | 201 335 148 | 108 75 85 | 4 (19%) 17 (81%) 0 (0%) | 0.98 0.94 0.95 | <0.001 * <0.001 * <0.001 * |
| CYP2C19 | 19 32 23 16 | T2h T3h T6h AUC0–6h | 0.34 0.29 0.45 0.32 | 101 203 167 126 | 357 720 285 | 235 200 197 | 7 (43.7%) 7 (43.7%) 4 (25%) | 0.95 0.94 0.89 | <0.001 * <0.001 * <0.001 * |
| CYP2C9 | 33 14 13 13 | T2h T3h T6h AUC0–6h | 0.07 0.07 0.15 0.10 | 174 176 134 120 | 4206 10,760 4806 | 104 63 71 | 1 (8%) 9 (69%) 3 (23%) | 0.34 0.66 0.93 | 0.255 0.017 * <0.001 * |
| CYP2D6 | 40 25 25 25 | T2h T3h T6h AUC0–6h | 0.37 0.29 0.23 0.28 | 275 241 309 256 | 5 10 6 | 126 98 111 | 2 (8%) 23 (92%) 0 (0%) | 0.97 0.99 0.91 | <0.001 * <0.001 * <0.001 * |
| CYP3A | 42 25 25 24 | T2h T3h T6h AUC0–6h | 0.43 0.44 0.54 0.43 | 197 81 256 86 | 7 5 2 | 95 141 109 | 22 (92%) 2 (8%) 0 (0%) | 0.94 0.98 0.90 | <0.001 * <0.001 * <0.001 * |
| P-gp | 30 | f-AUC0–6 | 1760 | 75 | |||||
| CYP450 | Single-Point MR | n | Agreement Probability | Number (%) of Mispredicted AUC Class | Best Time to Predict AUC according to: |
|---|---|---|---|---|---|
| CYP1A2 | T2h | 11 | 0.82 [0.48; 0.98] | 2 (18%) | |
| T3h | 11 | 0.91 [0.59; 0.99] | 1 (9%) | SA; Sp | |
| CYP2B6 | T2h | 21 | 0.52 [0.30; 0.74] | 10 (47%) | Sp |
| T3h | 21 | 0.62 [0.38; 0.82] | 8 (38%) | SA | |
| CYP2C19 | T2h | 16 | 0.81 [0.54; 0.96] | 3 (18%) | Sp |
| T3h | 16 | 1 | 0 (0%) | SA | |
| CYP2C9 | T3h | 13 | 0.77 [0.46; 0.95] | 3 (23%) | SA |
| T6h | 13 | 0.54 [0.25; 0.81] | 6 (46%) | Sp | |
| CYP2D6 | T3h | 25 | 0.92 [0.70; 0.98] | 2 (8%) | SA, Sp |
| CYP3A | T2h | 24 | 0.88 [0.68; 0.97] | 3 (12%) | SA |
| T3h | 24 | 0.83 [0.63; 0.95] | 4 (16%) | Sp |
Disclaimer/Publisher’s Note: The statements, opinions and data contained in all publications are solely those of the individual author(s) and contributor(s) and not of MDPI and/or the editor(s). MDPI and/or the editor(s) disclaim responsibility for any injury to people or property resulting from any ideas, methods, instructions or products referred to in the content. |
© 2023 by the authors. Licensee MDPI, Basel, Switzerland. This article is an open access article distributed under the terms and conditions of the Creative Commons Attribution (CC BY) license (https://creativecommons.org/licenses/by/4.0/).
Share and Cite
Darnaud, L.; Delage, C.; Daali, Y.; Trouvin, A.-P.; Perrot, S.; Khoudour, N.; Merise, N.; Labat, L.; Etain, B.; Bellivier, F.; et al. Phenotyping Indices of CYP450 and P-Glycoprotein in Human Volunteers and in Patients Treated with Painkillers or Psychotropic Drugs. Pharmaceutics 2023, 15, 979. https://doi.org/10.3390/pharmaceutics15030979
Darnaud L, Delage C, Daali Y, Trouvin A-P, Perrot S, Khoudour N, Merise N, Labat L, Etain B, Bellivier F, et al. Phenotyping Indices of CYP450 and P-Glycoprotein in Human Volunteers and in Patients Treated with Painkillers or Psychotropic Drugs. Pharmaceutics. 2023; 15(3):979. https://doi.org/10.3390/pharmaceutics15030979
Chicago/Turabian StyleDarnaud, Léa, Clément Delage, Youssef Daali, Anne-Priscille Trouvin, Serge Perrot, Nihel Khoudour, Nadia Merise, Laurence Labat, Bruno Etain, Frank Bellivier, and et al. 2023. "Phenotyping Indices of CYP450 and P-Glycoprotein in Human Volunteers and in Patients Treated with Painkillers or Psychotropic Drugs" Pharmaceutics 15, no. 3: 979. https://doi.org/10.3390/pharmaceutics15030979
APA StyleDarnaud, L., Delage, C., Daali, Y., Trouvin, A.-P., Perrot, S., Khoudour, N., Merise, N., Labat, L., Etain, B., Bellivier, F., Lloret-Linares, C., Bloch, V., Curis, E., & Declèves, X. (2023). Phenotyping Indices of CYP450 and P-Glycoprotein in Human Volunteers and in Patients Treated with Painkillers or Psychotropic Drugs. Pharmaceutics, 15(3), 979. https://doi.org/10.3390/pharmaceutics15030979