
Modification of the Linker Amino Acid in the Cell-Penetrating Peptide NickFect55 Leads to Enhanced pDNA Transfection for In Vivo Applications

 , , and
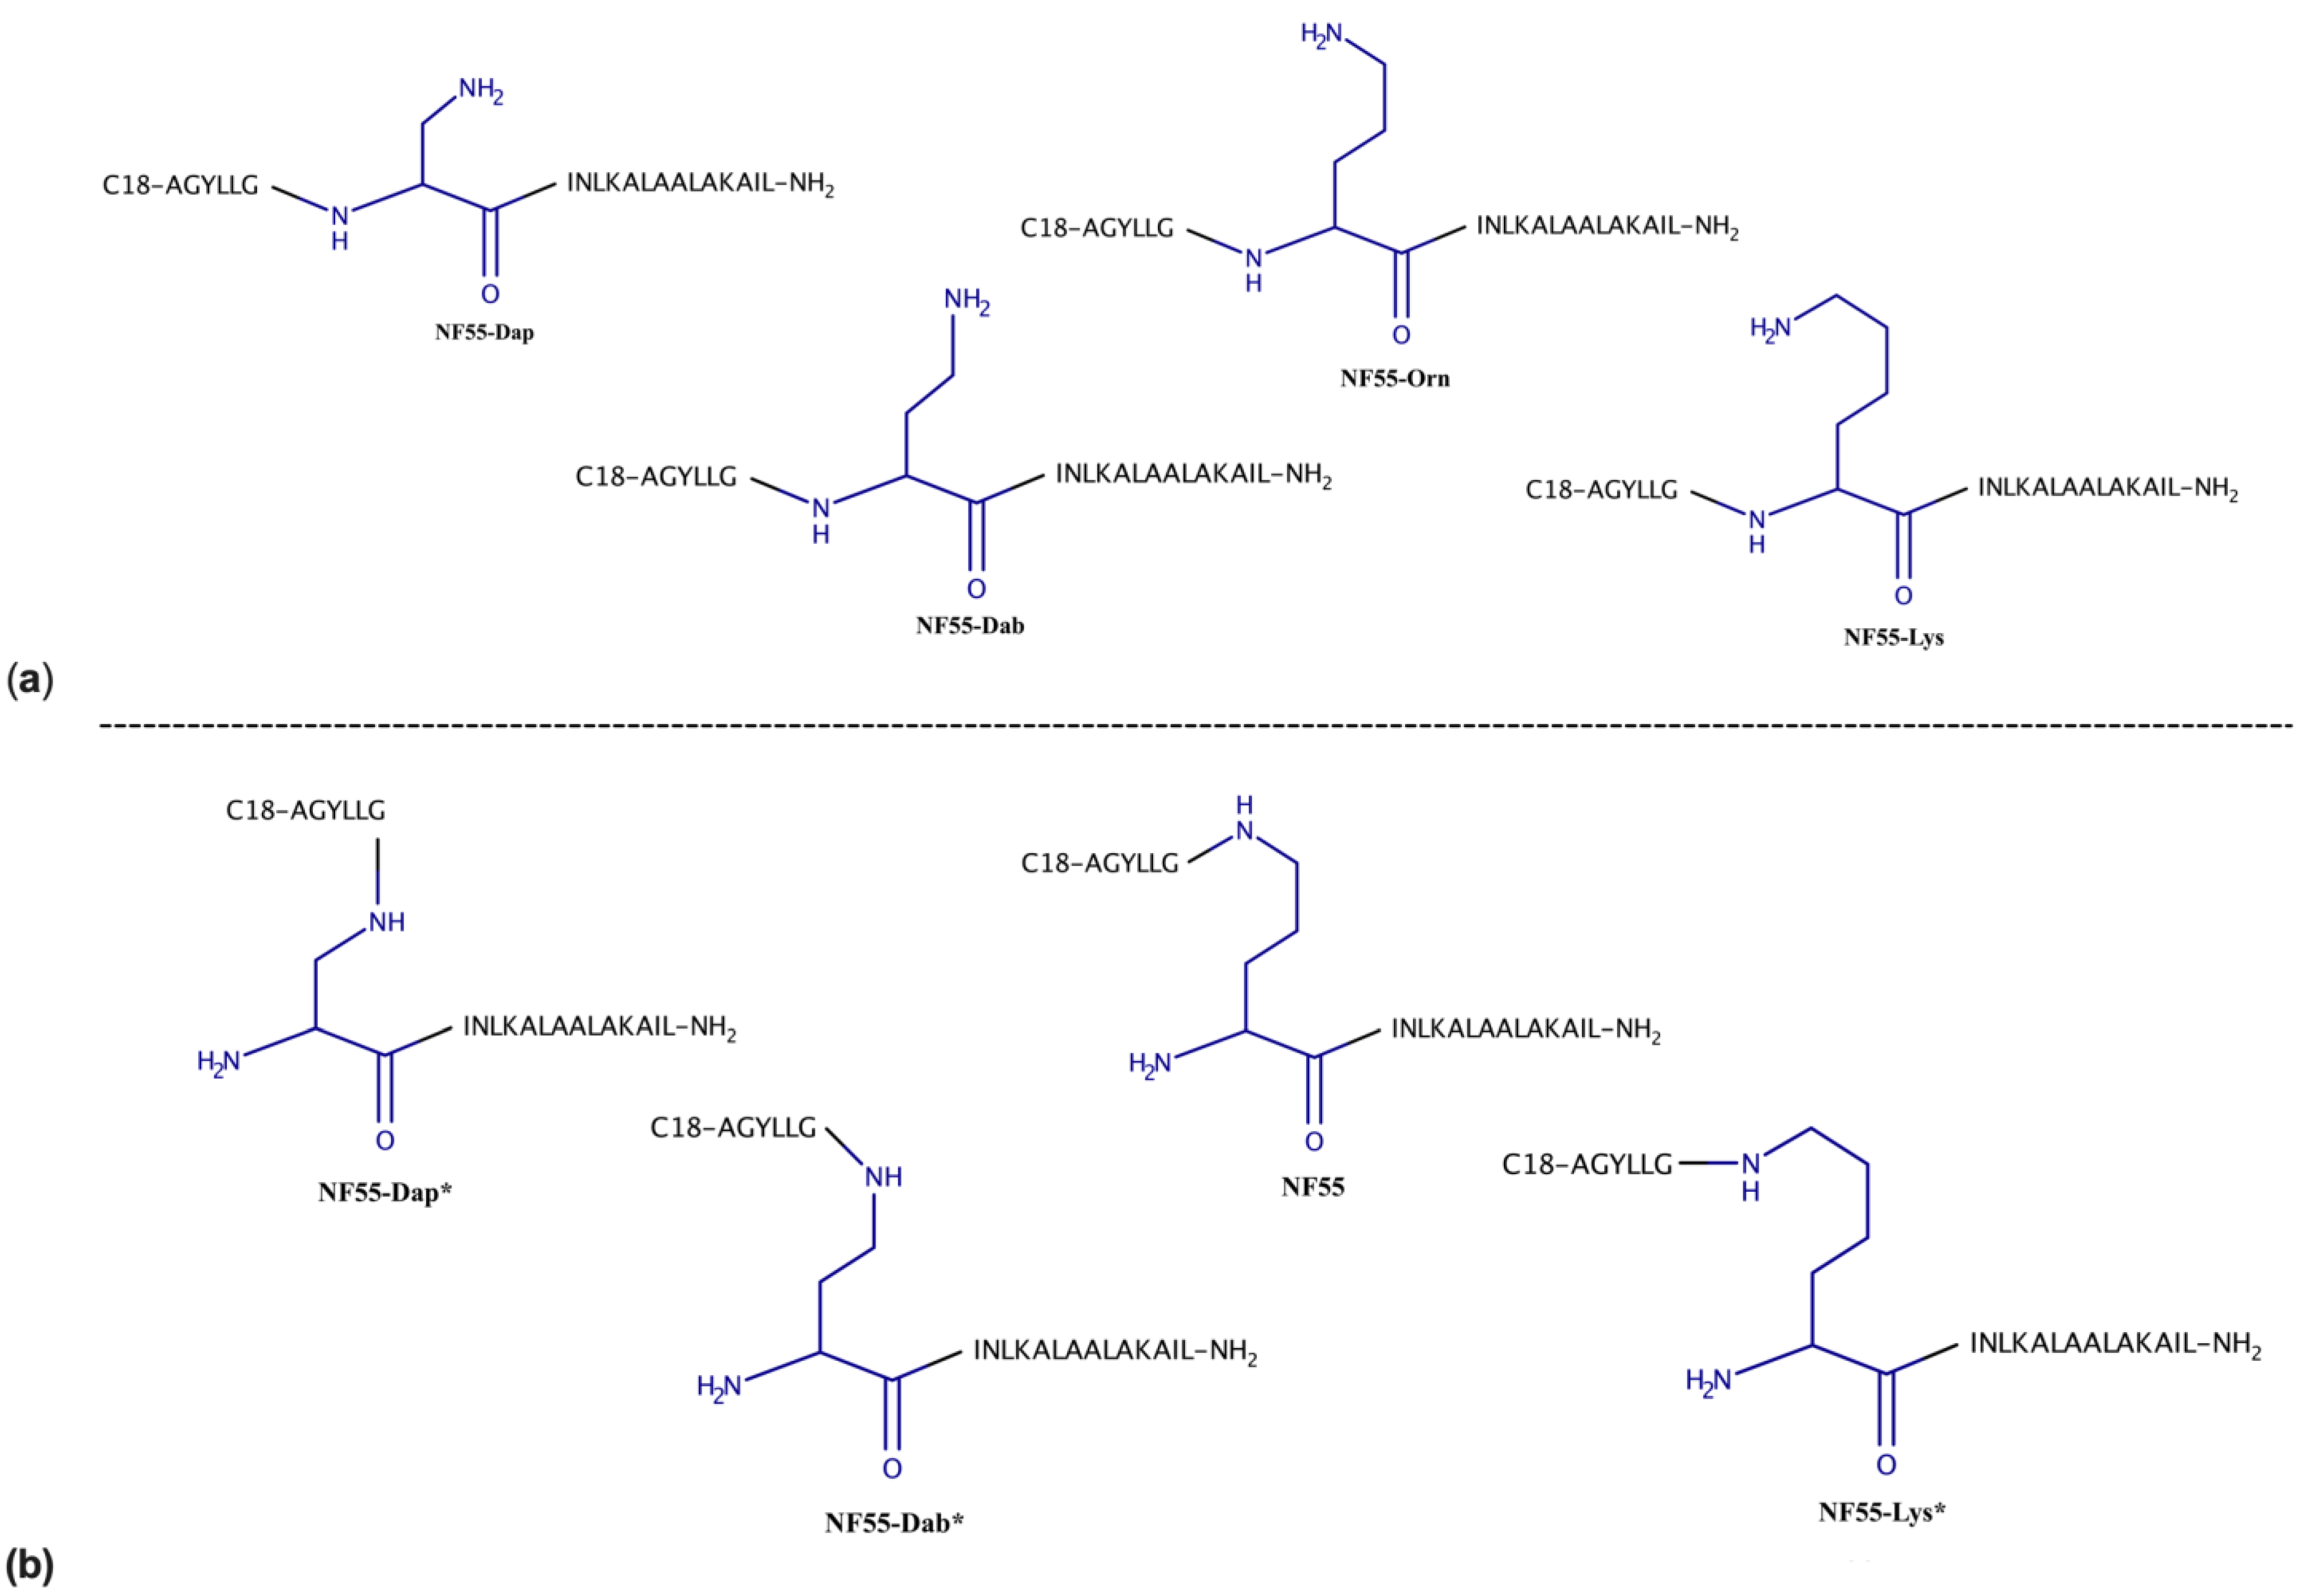
Abstract
1. Introduction
2. Materials and Methods
2.1. Peptide Synthesis
2.2. The Formation of CPP–pDNA Complexes
2.3. Characterisation of the CPPs
2.4. The Assessment of ξ-Potential of the CPP–pDNA Complexes
2.5. The Assessment of the CPP–pDNA Complex Formation by Quantitation of Nucleic Acid Intercalating Dye, the Stability of the Complexes towards Enzymatic Degradation by Proteinase K, and pDNA Displacement from the Complexes by Heparin Sodium Salt
2.6. The Assessment of the CPP–pDNA Complex Formation by Gel Migration Assay
2.7. The Analysis of the Nanoscopic Structure of the CPP–pDNA Complexes by Atomic Force Microscopy Combined with Infrared Spectroscopy (AFM-IR)
2.8. Cell Culture Maintenance
2.9. The Transfection of pDNA in Cell Culture
2.10. The Quantification of Reporter Levels In Vivo
2.11. Bioluminescence Live Animal Imaging
2.12. The Quantification of Luciferase Activity from the Tissues Ex Vivo
2.13. The Assessment of Safety of the NF55 Analogues
2.14. Statistical Analysis
3. Results and Discussion
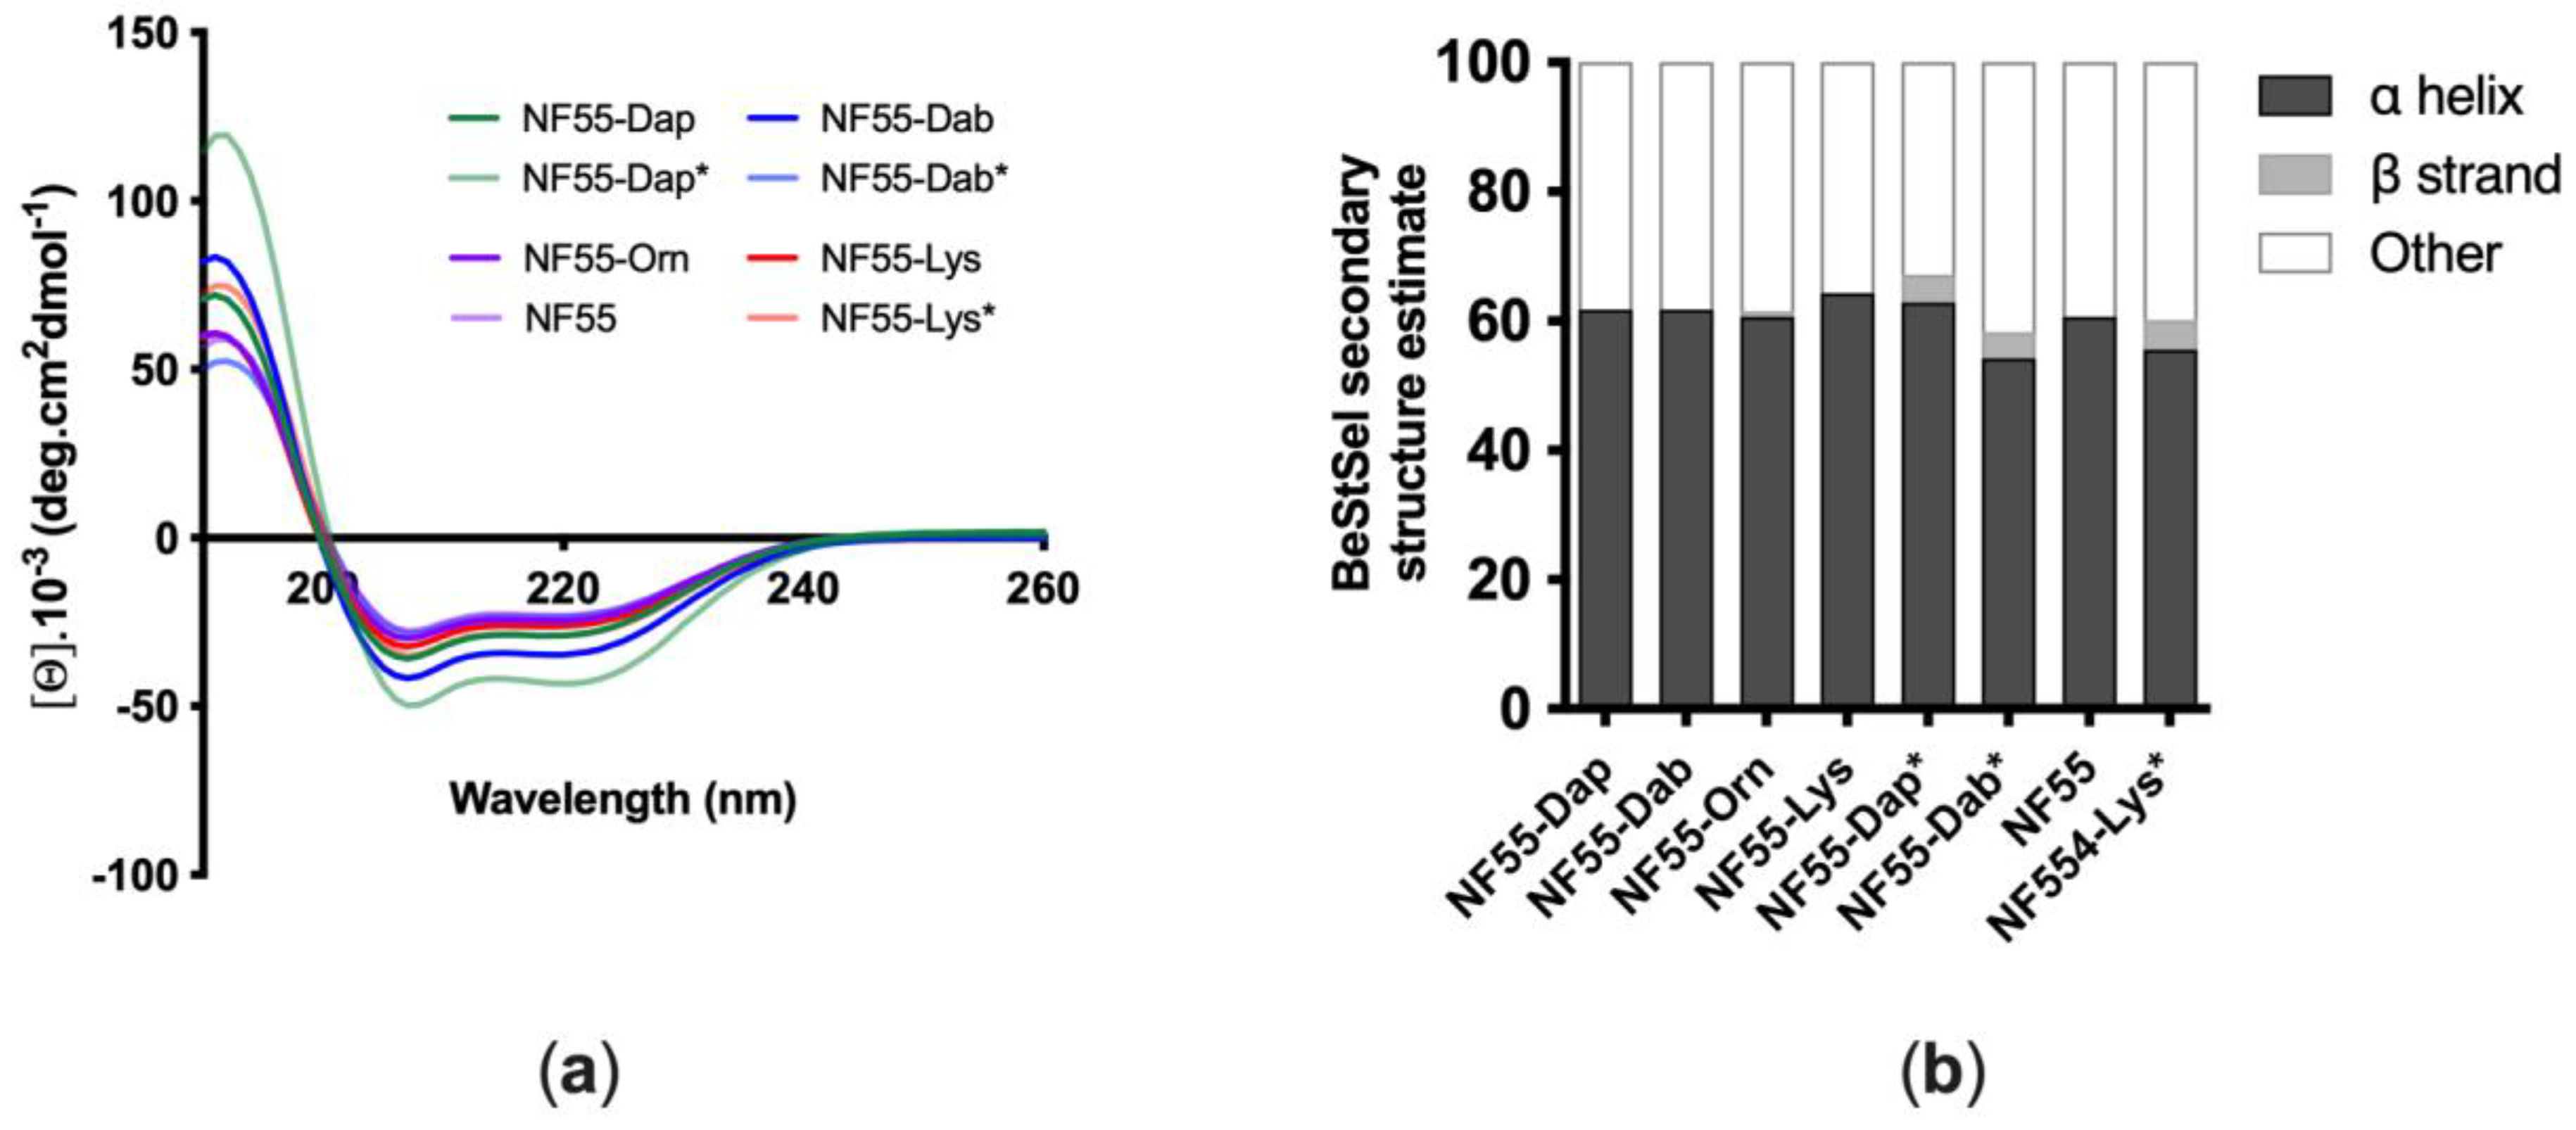
3.1. Design and Characterization of Peptides
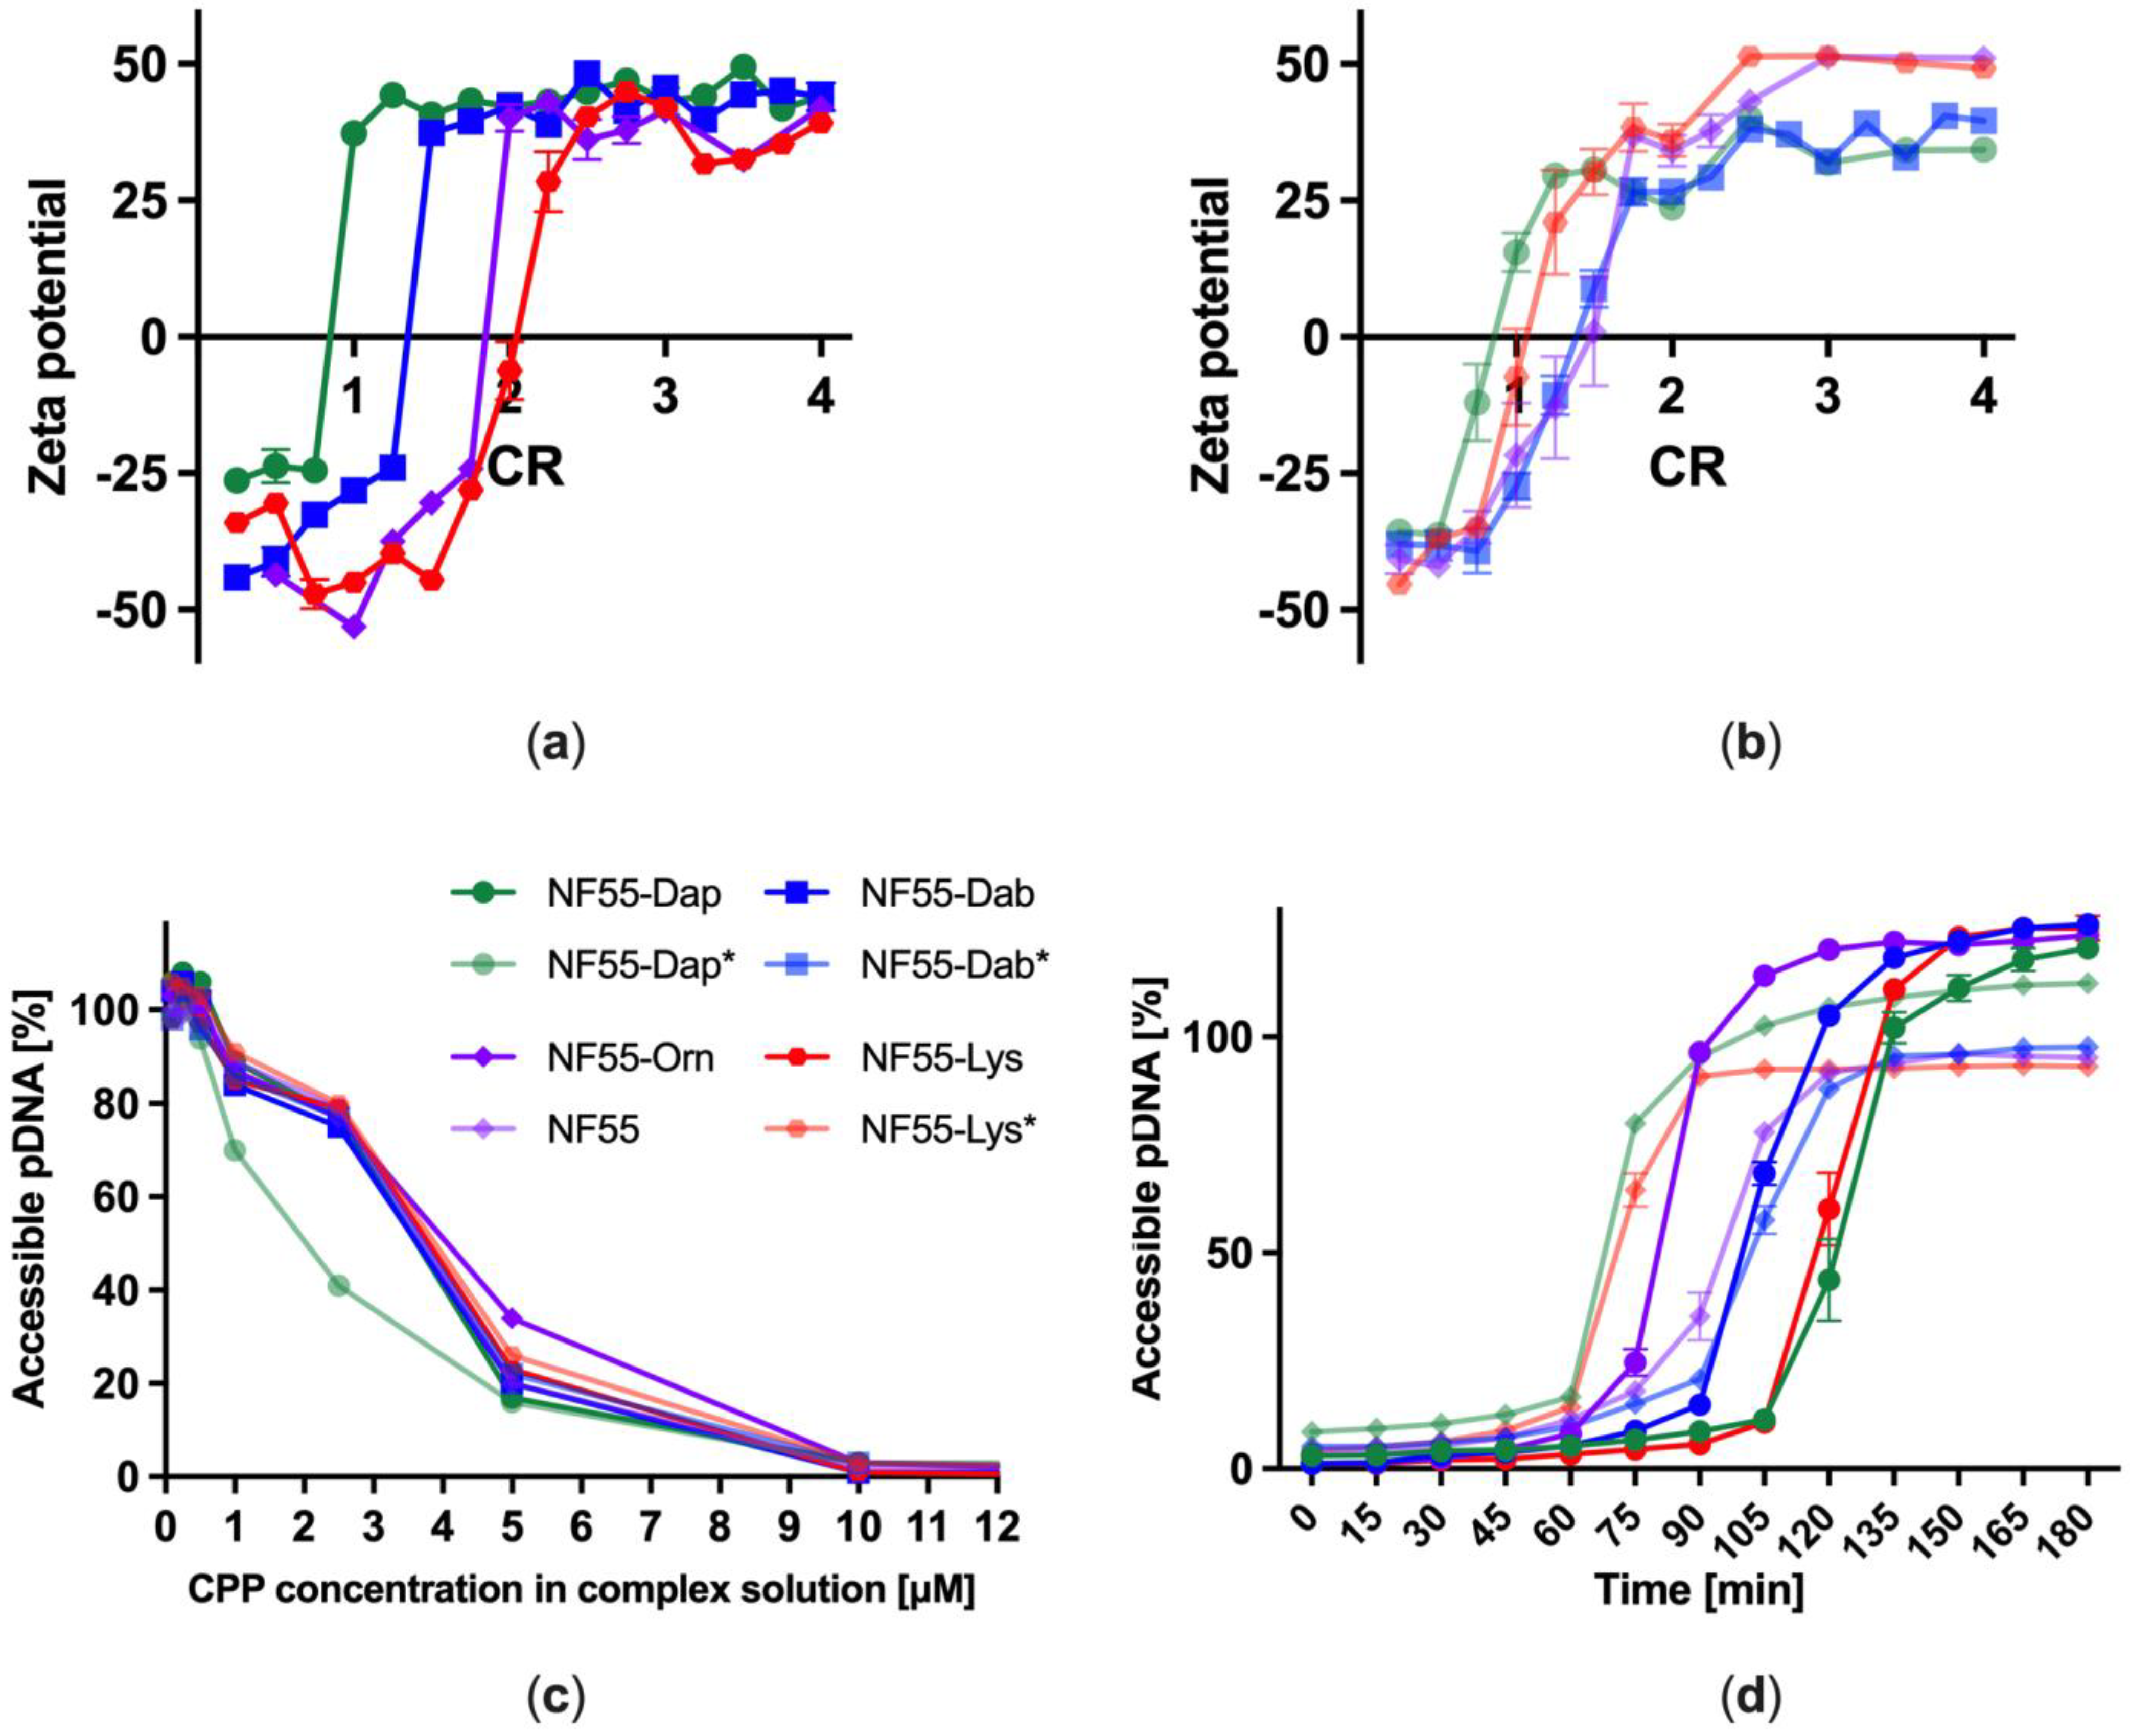
3.2. Complexation of Plasmid DNA and Stability of CPP–pDNA Complexes
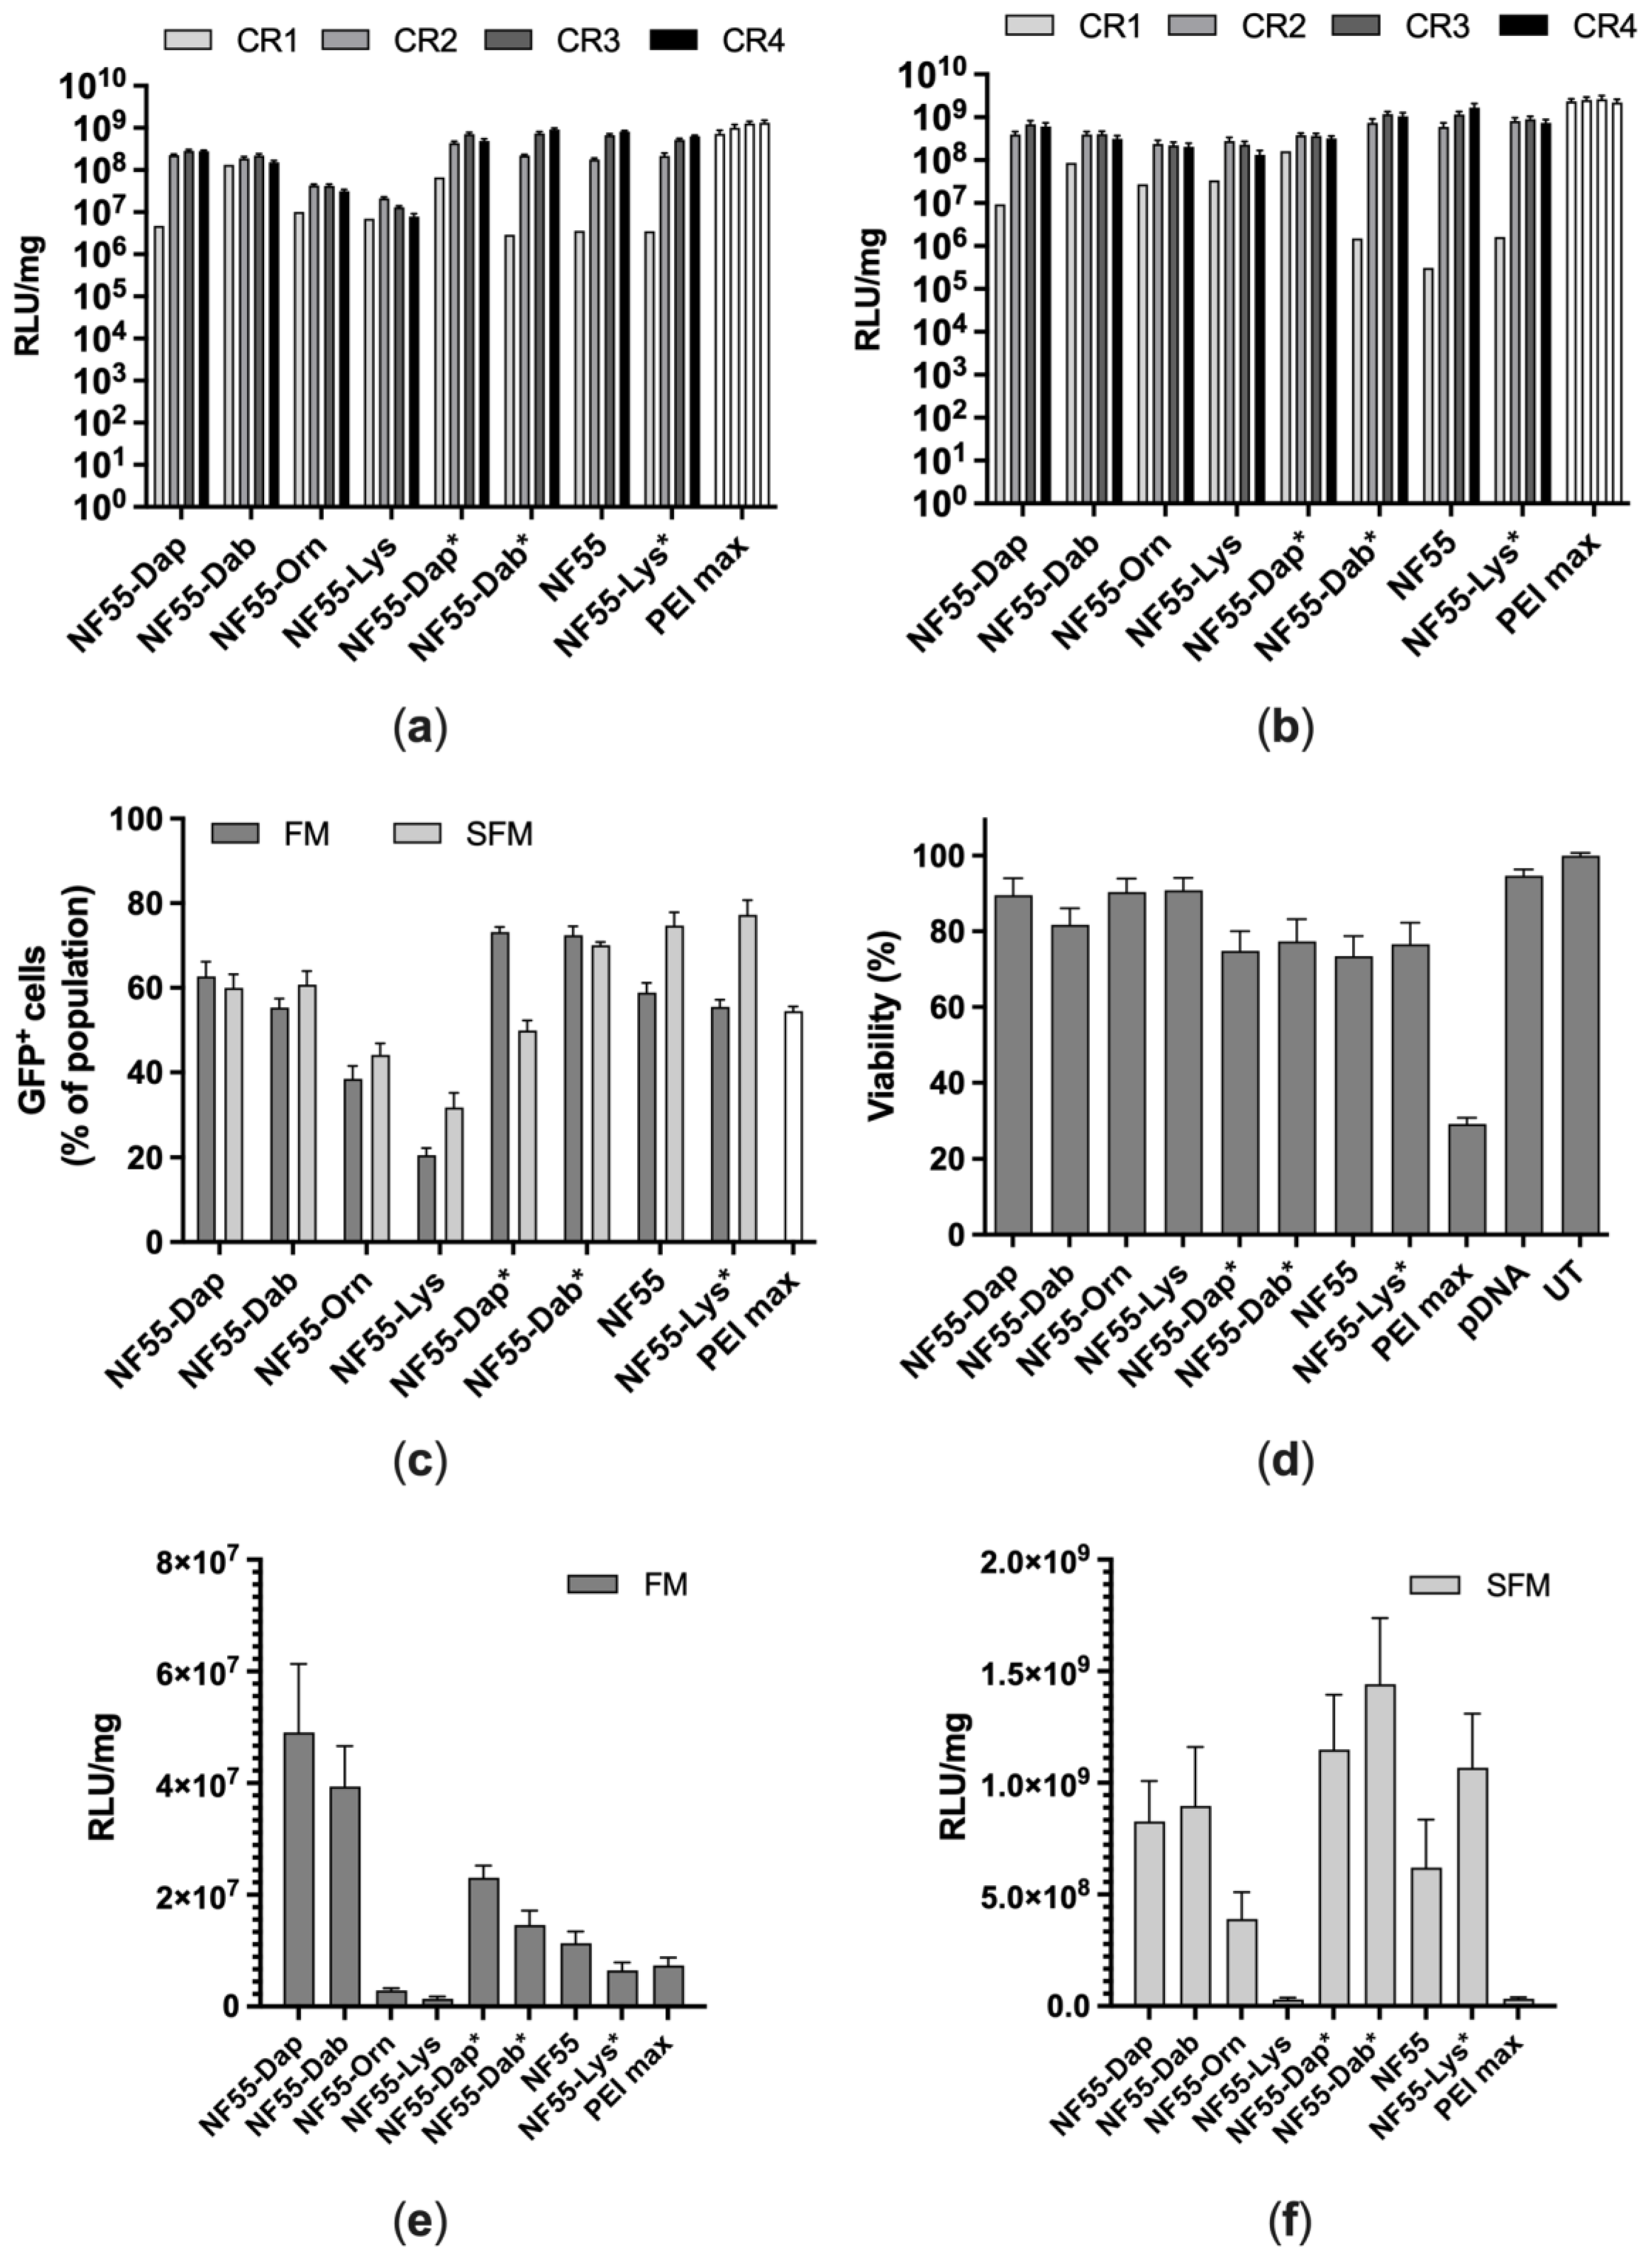
3.3. Transfection of CHO-K1 and A549 Cells
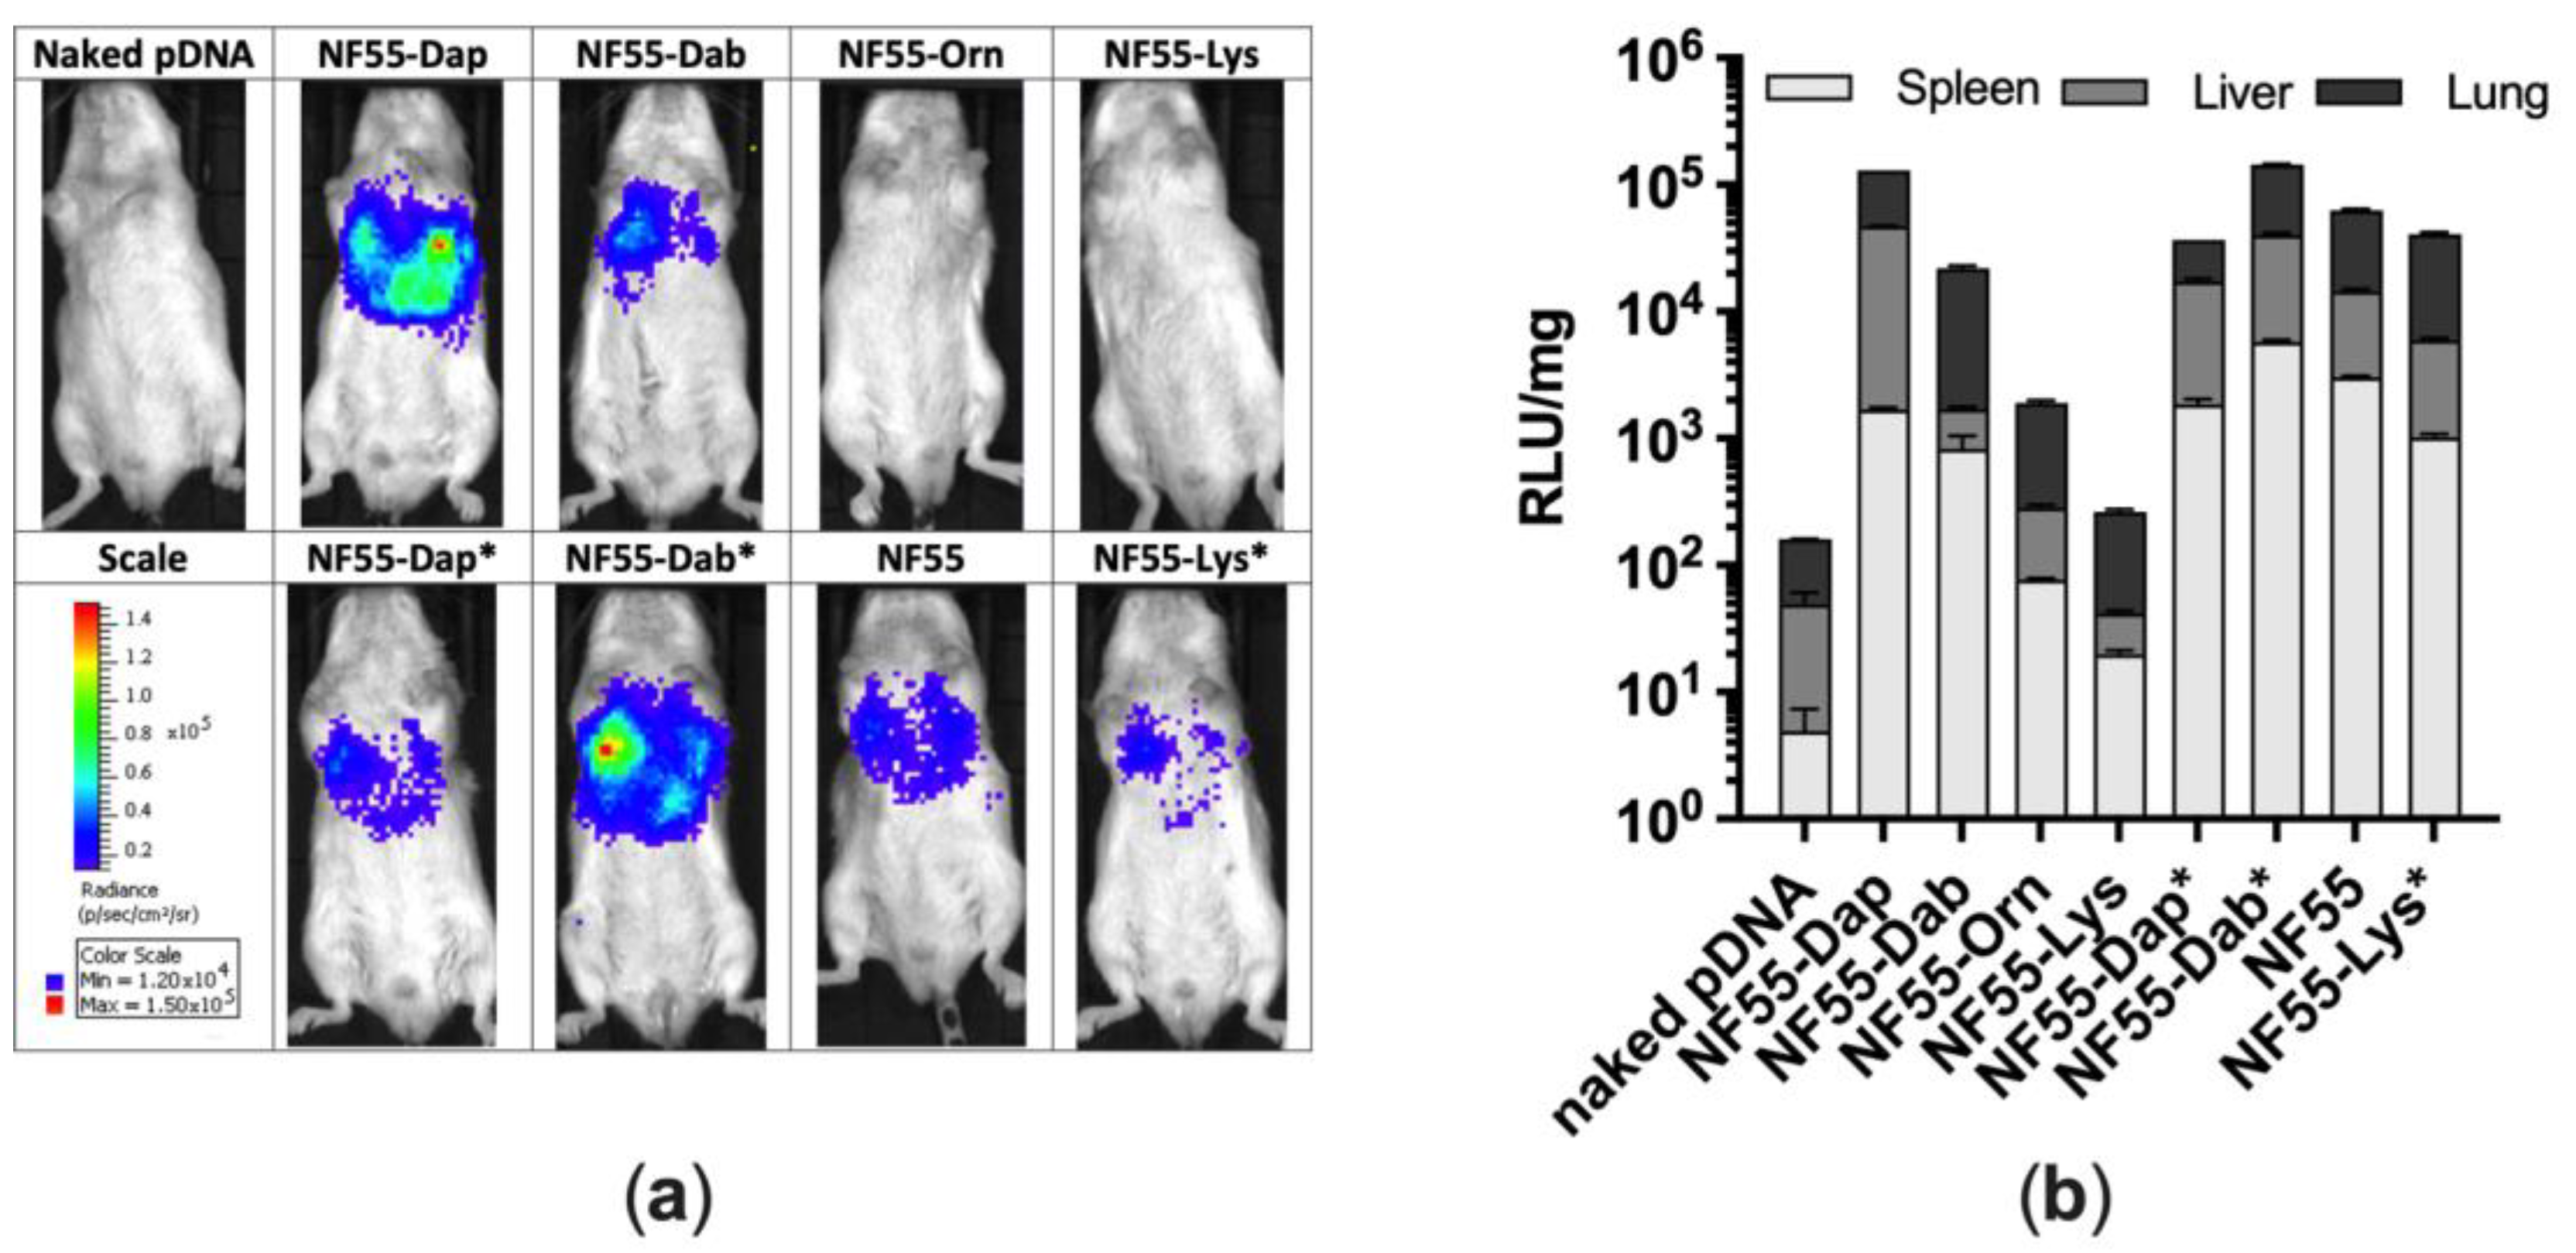
3.4. Assessment of Transfection Efficiency of NF55 Analogues In Vivo
4. Conclusions
Supplementary Materials
Author Contributions
Funding
Institutional Review Board Statement
Informed Consent Statement
Data Availability Statement
Acknowledgments
Conflicts of Interest
References
- Kulkarni, J.A.; Witzigmann, D.; Thomson, S.B.; Chen, S.; Leavitt, B.R.; Cullis, P.R.; van der Meel, R. The Current Landscape of Nucleic Acid Therapeutics. Nat. Nanotechnol. 2021, 16, 630–643. [Google Scholar] [CrossRef] [PubMed]
- Mendes, B.B.; Conniot, J.; Avital, A.; Yao, D.; Jiang, X.; Zhou, X.; Sharf-Pauker, N.; Xiao, Y.; Adir, O.; Liang, H.; et al. Nanodelivery of Nucleic Acids. Nat. Rev. Methods Prim. 2022, 2, 24. [Google Scholar] [CrossRef] [PubMed]
- Hu, B.; Zhong, L.; Weng, Y.; Peng, L.; Huang, Y.; Zhao, Y.; Liang, X.-J. Therapeutic siRNA: State of the Art. Signal Transduct. Target. Ther. 2020, 5, 101. [Google Scholar] [CrossRef] [PubMed]
- Zhangh, M.; Huang, Y. siRNA Modification and Delivery for Drug Development. Trends Mol. Med. 2022, 28, 892–893. [Google Scholar] [CrossRef] [PubMed]
- Desale, K.; Kuche, K.; Jain, S. Cell-Penetrating Peptides (CPPs): An Overview of Applications for Improving the Potential of Nanotherapeutics. Biomater. Sci. 2021, 9, 1153–1188. [Google Scholar] [CrossRef] [PubMed]
- Arukuusk, P.; Pärnaste, L.; Oskolkov, N.; Copolovici, D.-M.; Margus, H.; Padari, K.; Möll, K.; Maslovskaja, J.; Tegova, R.; Kivi, G.; et al. New Generation of Efficient Peptide-Based Vectors, NickFects, for the Delivery of Nucleic Acids. Biochim. Biophys. Acta Biomembr. 2013, 1828, 1365–1373. [Google Scholar] [CrossRef]
- Porosk, L.; Nebogatova, J.; Härk, H.H.; Vunk, B.; Arukuusk, P.; Toots, U.; Ustav, M.; Langel, Ü.; Kurrikoff, Ü. Predicting Transiently Expressed Protein Yields: Comparison of Transfection Methods in CHO and HEK293. Pharmaceutics 2022, 14, 1949. [Google Scholar] [CrossRef]
- Freimann, K.; Arukuusk, P.; Kurrikoff, K.; Vasconcelos, L.D.F.; Veiman, K.-L.; Uusna, J.; Margus, H.; Garcia-Sosa, A.T.; Pooga, M.; Langel, Ü. Optimization of in vivo DNA Delivery with NickFect Peptide Vectors. J. Control. Release 2016, 241, 135–143. [Google Scholar] [CrossRef]
- Kurrikoff, K.; Freimann, K.; Veiman, K.-L.; Peets, E.M.; Piirsoo, A.; Langel, Ü. Effective Lung-Targeted RNAi in Mice with Peptide-Based Delivery of Nucleic Acid. Sci. Rep. 2019, 9, 19926. [Google Scholar] [CrossRef]
- Guidotti, G.; Brambilla, L.; Rossi, D. Cell-Penetrating Peptides: From Basic Research to Clinics. Trends Pharmacol. Sci. 2017, 38, 406–424. [Google Scholar] [CrossRef]
- Xie, J.; Bi, Y.; Zhang, H.; Dong, S.; Teng, L.; Lee, R.J.; Yang, Z. Cell-Penetrating Peptides in Diagnosis and Treatment of Human Diseases: From Preclinical Research to Clinical Application. Front. Pharmacol. 2020, 11, 697. [Google Scholar] [CrossRef] [PubMed]
- BeStSel. Available online: https://bestsel.elte.hu/index.php (accessed on 25 May 2022).
- Nečas, D.; Klapetek, P. Gwyddion: An Open-Source Software for SPM Data Analysis. Cent. Eur. J. Phys. 2012, 10, 181–188. [Google Scholar] [CrossRef]
- Eiríksdóttir, E.; Konate, K.; Langel, Ü.; Divita, G.; Deshayes, S. Secondary Structure of Cell-Penetrating Peptides Controls Membrane Interaction and Insertion. Biochim. Biophys. Acta Biomembr. 2010, 1798, 1119–1128. [Google Scholar] [CrossRef]
- Ladokhin, A.S.; Fernández-Vidal, M.; White, S.H. CD Spectorscopy of Peptides and Proteins Bound to Large Unilamellar Vesicles. J. Membr. Biol. 2010, 236, 247–253. [Google Scholar] [CrossRef] [PubMed]
- Rasmussen, M.K.; Pedersen, J.N.; Marie, R. Size and Surface Charge Characterization of Nanoparticles with a Salt Gradient. Nat. Commun. 2020, 11, 2337. [Google Scholar] [CrossRef] [PubMed]
- Huang, D.; Korolev, N.; Eom, K.D.; Tam, J.P.; Nordenskiöld, L. Design and Biophysical Characterization of Novel Polycationic ϵ-Peptides for DNA Compaction and Delivery. Biomacromolecules 2008, 1, 321–330. [Google Scholar] [CrossRef]
- Sheppard, E.C.; Rogers, S.; Harmer, N.J.; Chahwan, R. A Universal Fluorescence-Based Toolkit for Real-Time Quantification of DNA and RNA Nuclease Activity. Sci. Rep. 2019, 9, 8853. [Google Scholar] [CrossRef]
- Kurrikoff, K.; Veiman, K.-L.; Künnapuu, K.; Peets, E.M.; Lehto, T.; Pärnaste, L.; Arukuusk, P.; Langel, Ü. Effective in vivo Gene Delivery with Reduced Toxicity, Achieved by Charge and Fatty Acid-Modified Cell Penetrating Peptide. Sci. Rep. 2017, 7, 17056. [Google Scholar] [CrossRef]
- Barth, A. Infrared Spectroscopy of Proteins. Biochim. Biophys. Acta Biomembr. 2007, 1767, 1073–1101. [Google Scholar] [CrossRef]
- Kong, J.; Yu, S. Fourier Transform Infrared Spectroscopic Analysis of Protein Secondary Structures. Acta Biochim. Biophys. Sin. 2007, 39, 549–559. [Google Scholar] [CrossRef]
- Marcelino, A.M.C.; Gierasch, L.M. Roles of Beta-Turns in Protein Folding: From Peptide Models to Protein Engineering. Biopolymers 2008, 89, 380–391. [Google Scholar] [CrossRef] [PubMed]
- Huang, K.T.; Chen, Y.H.; Walker, A.M. Inaccuracies in MTS Assays: Major Distorting Effects of Medium, Serum Albumin, and Fatty Acids. BioTechniques 2018, 37, 406–412. [Google Scholar] [CrossRef] [PubMed]
- Kwon, T.; Chandimali, N.; Huynh, D.L.; Zhang, J.J.; Kim, N.; Bak, Y.; Yoon, D.-Y.; Yu, D.-Y.; Lee, J.C.; Gera, M.; et al. BRM270 Inhibits Cancer Stem Cell Maintenance via microRNA Regulation in Chemoresistant A549 Lung Adenocarcinoma Cells. Cell Death Dis. 2018, 9, 244. [Google Scholar] [CrossRef]
- Chittasupho, C.; Lirdprapamongkol, K.; Kewsuwan, P.; Sarisuta, N. Targeted Delivery of Doxorubicin to A549 Lung Cancer Cells by CXCR4 Antagonist Conjugated PLGA Nanoparticles. Eur. J. Pharm. Biopharm. 2014, 88, 529–538. [Google Scholar] [CrossRef]
- Huang, P.-H.; Duan, X.-B.; Tang, Z.-Z.; Zou, Z.-X.; Song, W.-M.; Gao, G.; Li, D.; Nie, F.-Q.; Yan, X.; Fu, Y.-X.; et al. Betulinaldehyde Exhibits Effective Anti-Tumor Effects in A549 Cells by Regulating Intracellular Autophagy. Sci. Rep. 2023, 13, 743. [Google Scholar] [CrossRef]


Disclaimer/Publisher’s Note: The statements, opinions and data contained in all publications are solely those of the individual author(s) and contributor(s) and not of MDPI and/or the editor(s). MDPI and/or the editor(s) disclaim responsibility for any injury to people or property resulting from any ideas, methods, instructions or products referred to in the content. |
© 2023 by the authors. Licensee MDPI, Basel, Switzerland. This article is an open access article distributed under the terms and conditions of the Creative Commons Attribution (CC BY) license (https://creativecommons.org/licenses/by/4.0/).
Share and Cite
Härk, H.H.; Porosk, L.; de Mello, L.R.; Arukuusk, P.; da Silva, E.R.; Kurrikoff, K. Modification of the Linker Amino Acid in the Cell-Penetrating Peptide NickFect55 Leads to Enhanced pDNA Transfection for In Vivo Applications. Pharmaceutics 2023, 15, 883. https://doi.org/10.3390/pharmaceutics15030883
Härk HH, Porosk L, de Mello LR, Arukuusk P, da Silva ER, Kurrikoff K. Modification of the Linker Amino Acid in the Cell-Penetrating Peptide NickFect55 Leads to Enhanced pDNA Transfection for In Vivo Applications. Pharmaceutics. 2023; 15(3):883. https://doi.org/10.3390/pharmaceutics15030883
Chicago/Turabian StyleHärk, Heleri H., Ly Porosk, Lucas R. de Mello, Piret Arukuusk, Emerson R. da Silva, and Kaido Kurrikoff. 2023. "Modification of the Linker Amino Acid in the Cell-Penetrating Peptide NickFect55 Leads to Enhanced pDNA Transfection for In Vivo Applications" Pharmaceutics 15, no. 3: 883. https://doi.org/10.3390/pharmaceutics15030883
APA StyleHärk, H. H., Porosk, L., de Mello, L. R., Arukuusk, P., da Silva, E. R., & Kurrikoff, K. (2023). Modification of the Linker Amino Acid in the Cell-Penetrating Peptide NickFect55 Leads to Enhanced pDNA Transfection for In Vivo Applications. Pharmaceutics, 15(3), 883. https://doi.org/10.3390/pharmaceutics15030883