Article

In Vivo Relevance of a Biphasic In Vitro Dissolution Test for the Immediate Release Tablet Formulations of Lamotrigine

by
Tuba Incecayir
* and
Muhammed Enes Demir
Department of Pharmaceutical Technology, Faculty of Pharmacy, Gazi University, 06330 Ankara, Turkey
*
Author to whom correspondence should be addressed.
Pharmaceutics 2023, 15(10), 2474; https://doi.org/10.3390/pharmaceutics15102474
Submission received: 14 September 2023 / Revised: 7 October 2023 / Accepted: 12 October 2023 / Published: 17 October 2023

Abstract

:
Biphasic in vitro dissolution testing is an attractive approach to reflect on the interplay between drug dissolution and absorption for predicting the bioperformance of drug products. The purpose of this study was to investigate the in vivo relevance of a biphasic dissolution test for the immediate release (IR) formulations of a Biopharmaceutics Classification System (BCS) Class II drug, lamotrigine (LTG). The biphasic dissolution test was performed using USP apparatus II with the dual paddle modification. A level A in vitro-in vivo correlation (IVIVC) was constructed between the in vitro partition into the octanol and absorption data of the reference product. A good relation between in vitro data and absorption was obtained (r2 = 0.881). The one-compartment open model was introduced to predict the human plasma profiles of the test product. The generic product was found to be bioequivalent to the original product in terms of 80–125% bioequivalence (BE) criteria (85.9–107% for the area under the plasma concentration curve (AUC) and 82.7–97.6% for the peak plasma concentration (Cmax) with a 90% confidence interval (CI)). Overall, it was revealed that the biphasic dissolution test offers a promising ability to estimate the in vivo performance of IR formulations of LTG, providing considerable time and cost savings in the development of generic drug products.

Graphical Abstract

1. Introduction

In vitro dissolution testing is an essential step in drug product development and a routine manufacturing process for quality control purposes, as well as in the establishment of in vitro-in vivo correlations (IVIVC) and the prediction of the in vivo behavior of drug formulations [1]. Compendial dissolution tests, which aim for sink conditions, are usually carried out in buffer solutions and are adequately used for quality control. However, the ability of a dissolution test to perform in vivo prediction mainly depends on its in vivo relevance. In pharmaceutical research, there is a continuous search for physiologically relevant dissolution media, conditions, and in vitro tools to predict the in vivo behavior of oral formulations in the human gastrointestinal (GI) tract and understand the effects that the main processes on oral bioavailability (BA) of drugs in humans [2,3,4,5,6].
For poorly water-soluble drugs, drug dissolution mainly depends on the pH and dissolution of the medium composition (buffer type, capacity, and volume) [7]. Thus, maintaining sink conditions for the complete dissolution and characterization of these drugs can be challenging. Moreover, Biopharmaceutics Classification System (BCS) Class II drugs (low solubility-high permeability) that exhibit dissolution rate-limited absorption are considered to be good candidates for IVIVCs and develop in vivo predictive dissolution tests reflecting in vivo solubility, release, and absorption to forecast the in vivo behavior of their orally administered formulations [5,6,8].
One attractive approach is the use of biphasic dissolution systems to afford sink conditions and better reflect the interplay between drug dissolution and absorption to predict the in vivo behavior of formulations containing BCS Class II drugs. Biphasic systems depend on a dissolution medium comprising immiscible aqueous and organic phases [9]. In a biphasic dissolution system, drug partition into the organic solvent occurs, depending on the drug’s lipophilicity following initial dissolution in the aqueous phase. Moreover, the organic solvent can create a more realistic drug supersaturation in the buffer [10]. The organic phase (octanol) is considered to mimic the absorption of the drug through the intestine, maintaining sink conditions [11]. In biphasic dissolution test studies, the best organic solvent is considered to be octanol [12]. Therefore, it is commonly used for biphasic systems due to its suitable physicochemical properties, such as water insolubility (0.05 g/100 g water) and low density (specific gravity of 0.825 at 20 °C), permitting the ease of sampling and low volatility (boiling point at 195 °C); this prevents evaporation at 37 °C and keeps the upper phase volume constant [13,14].
Niebergall et al. were the first to investigate the partitioning rates of salicylic acid tablets in a vessel containing 250 mL of octanol and aqueous phases [15]. Similarly, using a biphasic system, Gibaldi and Feldman also determined the first-order dissolution rates of benzoic and salicylic acids [16]. The correlation between a biphasic system and in vivo results was first investigated for oral ibuprofen formulations by Stead et al., resulting in a promising IVIVC but requiring improvement [17]. Different system configurations for biphasic dissolution testing have been reported in the literature, including a USP apparatus II with dual paddle, a basket–paddle hybrid stirrer, and a USP apparatus IV coupled with a USP apparatus II [13,18,19]. Lately, a miniaturized system (miBIdi-pH, 50 and 15 mL of aqueous and organic phases, respectively) was developed to investigate the supersaturation, precipitation, and absorption kinetics of six BCS II model drugs (griseofulvin, ibuprofen, dipyridamole, telmisartan, fenofibrate, and itraconazole) [20,21]. In a recent study, small-scale biphasic systems were proposed to assess the intraluminal performance of poorly soluble, ionizable compounds in early drug development due to the limited quantities of drug substances available [22]. The latest studies on mathematical models to express the partitioning kinetics of a compound between aqueous (buffered solutions) and organic (octanol) phases and mass transport analysis on the partitioning kinetics of BCS II drugs (ibuprofen, nimesulide, and piroxicam) provides a deep understanding of biphasic testing [23,24]. In the last 50 years, studies have demonstrated that biphasic dissolution tests can be applied to different dosages, such as controlled-release formulations, soft gelatin capsules, tablet formulations, lipid-filled capsules, self-emulsifying drug delivery systems, nanoemulsions, and lipid-based solid dispersions. They have a promising potential to discriminate formulations, conduct IVIVCs, and predict in vivo behavior, maintaining sink conditions [18,25,26,27,28,29,30,31].
The purpose of the present study is to investigate the in vivo relevance of a biphasic dissolution test for the immediate release (IR) formulations of a BCS Class II drug, lamotrigine (LTG). This study describes the application of a biphasic dissolution test to establish an IVIVC for IR formulations (reference and test) containing 200 mg of LTG (CAS 84057-84-1) and investigates its relevance regarding in vivo absorption in humans. To the best of the authors’ knowledge, there is no study on biphasic dissolution testing for oral formulations of LTG in the literature.
LTG, a phenyltriazine class anticonvulsant, shows efficacy against partial and generalized epilepsies. It blocks voltage-sensitive sodium channels and inhibits the release of excitatory neurotransmitters [32]. As a BCS Class II drug, it is adequately absorbed from the GI tract with a BA approaching 98% and the peak plasma concentration (Cmax) occurring within about 3 h postdose [33,34]. The steady-state elimination half-life (t1/2) is 25 to 30 h in healthy young adults [35]. The total urinary recovery of the oral dose is 70%, mainly in the form of glucuronide conjugate [36].
Conventional and biphasic dissolution tests for bioequivalent IR formulations (reference and test) of LTG (200 mg) were evaluated in the present study. Previously reported plasma concentration–time curves after the oral administration of the LTG reference formulation in healthy volunteers were used to correlate these data with the results obtained from the biphasic dissolution test [37]. Based on this correlation, a model-dependent approach was introduced to estimate the in vivo performance of the IR product of LTGs in humans.

2. Materials and Methods

2.1. Materials

LTG (purity: 99.9%) was kindly provided by Sanovel Pharmaceuticals (Istanbul, Turkey). Sodium chloride, sodium hydroxide, hydrochloric acid, n-octanol, and potassium phosphate monobasic were supplied from Sigma-Aldrich (Steinheim, Germany). Two commercial IR (soluble and chewable) tablets of 200 mg of LTG were obtained from a local pharmacy. The commercial reference, A8158013, and test, 19143001, tablets were employed. The chemicals were of analytical reagent grade.

2.2. Single Phase In Vitro Dissolution Test

A conventional dissolution test of the drug products was conducted using a 708-DS Agilent dissolution apparatus (Agilent Technologies, Selangor, Malaysia) under sink and non-sink conditions. The commercial IR tablets were tested using USP dissolution apparatus II, with 900 mL of the dissolution medium (pH 1.2 HCl and pH 6.8 phosphate buffers (50 mM)) at 37 °C and the paddle rotating at 50 rpm. Withdrawn samples (5 mL) at predetermined times were filtered using a 0.45 µm Chromafil®CA45/25 syringe filter, and an equivalent amount of fresh medium was added into each vessel after sampling. The determination of LTG was performed using the spectrophotometric method. The tests were carried out in six replications. The cumulative percentage was dissolved (mean ± standard deviation (SD)) and plotted versus time.

2.3. Biphasic In Vitro Dissolution Test

A biphasic dissolution test was carried out using paddle-modified USP apparatus II (Figure 1). An additional paddle (stainless steel, grade 316) was fixed above the compendial paddle. The phosphate buffer (pH 6.8, 50 mM, 300 mL) and octanol (200 mL) were used as the aqueous and organic phases of the dissolution media, respectively. The paddle speed was set to 50 rpm at 37 °C. The aqueous and organic phases were mutually saturated with stirring for 30 min prior to the dissolution run. The commercial IR tablets were introduced into the aqueous phase using a tube passed through the organic phase to avoid the tablet’s contact with the octanol. The volume of octanol (200 mL) was selected based on in vitro partitioning into octanol, as well as the saturation solubility (CS) of LTG into octanol (4.14 mg/mL) to provide the relative sink condition in 200 mL of octanol. The partitioning rate coefficient of LTG into octanol (kp) was calculated with linear regression using Equation (1) [24].
  F o ,   t = 1 e k p t  
where Fo,t is the fraction of LTG in the organic medium, and t is time.
Increasing the organic phase from 200 to 300 mL did not affect the kp value of LTG (0.62 vs. 0.66 h−1), while the rotating speed of 75 rpm increased the kp value approximately two times (1.4 h−1) compared to 50 rpm in the present study. The effect of the rotating speed on the partitioning rate was also confirmed for dipyridamole by other researchers [21]. However, a paddle speed of 50 rpm was used to avoid undesirable mixing and turbulence, which occurred at the interface of the two phases at 75 rpm in the present study, as recommended by the others [24].
The additional paddle was put at the center of the octanol phase to provide sufficient stirring. The aqueous phase volume (300 mL) ensured that the USP II compendial paddle was entirely in the aqueous phase. Samples (5 mL) were withdrawn from the aqueous and organic phases at 15, 30, 45, 60, 90, 120, 180, and 240 min, respectively, and filtered using a 0.45 µm syringe filter (Chromafil®CA45/25, Macherey-Nagel GmbH and Co.KG, Dueren, Germany), and equivalent amounts of respective fresh media were added. Withdrawn samples were analyzed using the spectrophotometric method. The tests were performed in triplicate. The mean cumulative percent (mean ± SD) in the aqueous buffer and octanol was plotted as a function of time.

2.4. Assay

The samples were analyzed by spectrophotometry using a Cary 60 UV-Vis spectrophotometer (Agilent Technologies, Santa Clara, CA, USA). The absorbance of the samples in the two-dissolution media (pH 1.2 and pH 6.8) and in octanol were measured at 265, 305, and 310 nm, respectively. The concentration of LTG was determined by the calibration curves of each corresponding dissolution medium. Linearity was obtained in a calibration range of 7.5–35 μg/mL (r2 = 0.999). Accuracy ranged from 98.3% to 101%. The relative SD of within-day and between-day precision values was less than 1.0%. The limit of quantification (LOQ) and the limit of detection (LOD) values were 3.0 and 1.0 µg/mL in octanol, respectively. LOQ values were 1.2 and 0.9 µg/mL, and LOD values were 0.4 and 0.3 µg/mL at pH 1.2 and pH 6.8 in dissolution media, respectively.

2.5. In Vitro Data Analysis

Dose number (DO), defined as the mass divided by an uptake volume of 250 mL and the solubility of the drug, was calculated using Equation (2) [38]:
D O = M O C S . V O
where MO is the highest dose (mg), VO is the initial gastric volume, and CS is the saturation solubility (mg/mL).
All data were shown as the mean ± SD. The similarity of drug products was determined using the f2 similarity test [39]. f2 values were calculated using Equation (3):
f 2 = 50   l o g 100 1 + 1 n t = 1 n R t T t 2
where n is the sample number, Rt and Tt are the cumulative percentages of the reference and test products dissolved at time point t, respectively. The calculated f2 > 50 points correspond to the similarity of the two profiles.

2.6. Prediction of In Vivo Plasma Profiles from the Correlation Between Absorption and In Vitro Partitioning Data

LTG’s fraction of dose-absorbed (Fabs) values (%) was derived from the published data of the reference product in healthy volunteers to assess the in vivo relevance of the biphasic dissolution test [37]. Fabs values were calculated from the plasma data of LTG using the Wagner–Nelson method (Equation (4)) [37,40].
F a b s = k d 0 t C t d t + C t k d 0 C t d t
where C(t) is the plasma drug concentration (µg/mL) and kd is the elimination rate constant (h−1).
In vivo and in vitro data were compared using a point-to-point relationship between the calculated Fabs and the fraction of LTG partitioned into the octanol at 15, 30, 60, 120, and 240 min for reference. The relationship between in vivo and in vitro data was investigated using linear regression. All calculations were carried out using Microsoft Excel 2013. Using the level A IVIVC, Fabs values of each healthy subject were found for the test product. Each subject’s absorption rate constant (ka) values for the test were calculated using the Wagner–Nelson method. The one-compartment open model was used for pharmacokinetic (PK) analysis. Plasma concentrations for the test (Cp) were predicted with Equation (5) using the ka values calculated by the Wagner–Nelson method, as well as the elimination rate constant (kd = 0.0279 ± 0.0123 h−1) and volume of distribution (Vd = 72.0 ± 9.9 L) data specific to each subject for the reference. Thus, the plasma concentration profiles of LTG versus time for the test product were obtained for each healthy subject. The area under the plasma concentration curve (AUC0→∞) values were calculated from zero to infinity using the trapezoidal rule method.
C p = F F * D V d k a k a     k d e k d t e k a t
where Cp is the drug concentration in the plasma (µg/mL), FF* is the bioavailability constant, D is the drug dose (µg), Vd is the volume of distribution (mL), ka is the absorption rate constant (h−1), kd is the elimination rate constant (h−1), and t is time (h).

2.7. Bioequivalence (BE) Analysis

BA criteria (Cmax and AUC0→∞) were calculated. The bioequivalence (BE) of the generic versus original was assessed based on two one-sided test procedures, in which the 90% confidence intervals (CI) were calculated. The 80–125% limits were used as the acceptance criteria for BE.

3. Results

3.1. Single Phase In Vitro Dissolution Test

Single-phase dissolution profiles in pH 1.2 and pH 6.8 dissolution media are presented in Figure 2. The dissolution of the products was rapid at pH 1.2 (>80% in 15 min) due to the sink condition in 900 mL of pH 1.2 HCl, which is the recommended medium for LTG tablets using the FDA dissolution database [41]. In a pH 1.2 medium, the drug release was 83% and 98% after 15 min for the reference and test, respectively (Figure 2). By contrast, the solubility of LTG at pH 6.8 was low (0.136 mg/mL), resulting in a non-sink condition in 900 mL of a pH 6.8 phosphate buffer. The drug release was much slower at pH 6.8 (75% and 60% in 1 h for the reference and test, respectively) compared to pH 1.2 (Figure 2). The test and reference dissolution profiles differed at pH 6.8 (f2 = 41). The CS values, calculated DO, and relative sink conditions (CS/CD) at 37 °C are presented in Table 1. The sink condition is considered to be provided for CS/CD values greater than three [42]. Therefore, the sink condition was provided in a pH 1.2 HCl medium. DO was less than one at pH 1.2; however, the value was greater than one (5.9) at pH 6.8 medium.

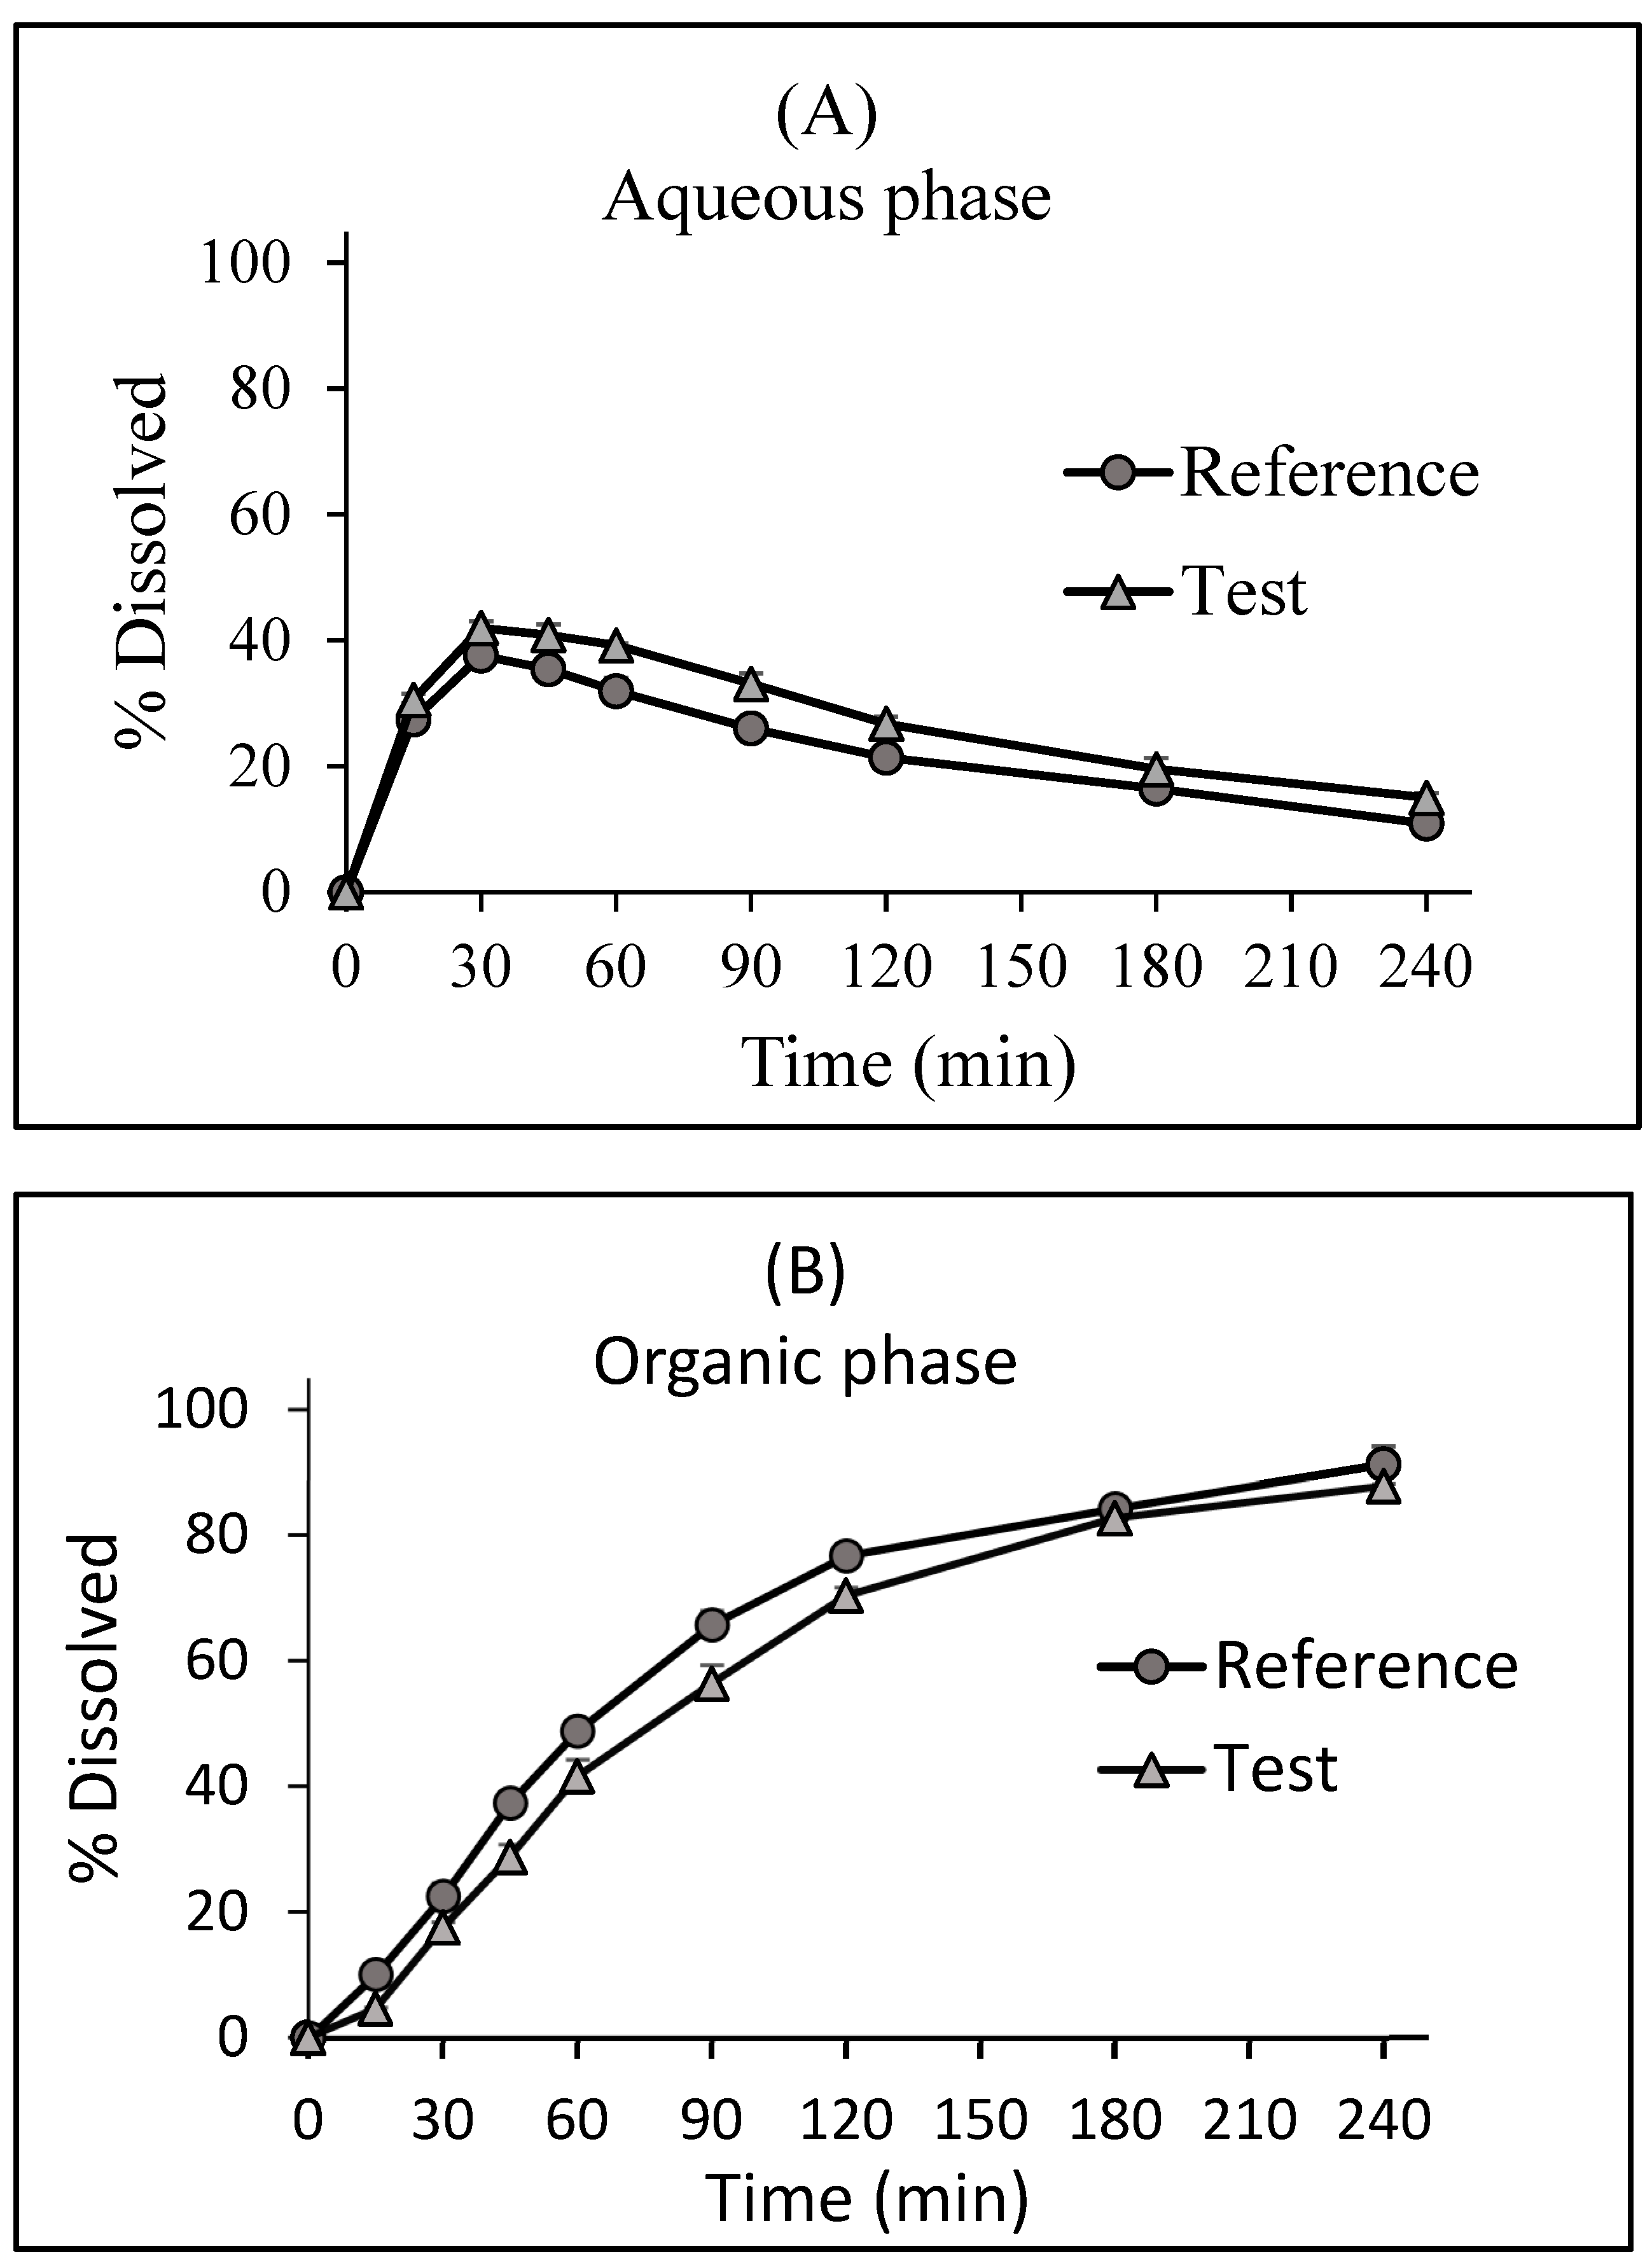
3.2. Biphasic In Vitro Dissolution Test

Biphasic dissolution profiles in the buffer, octanol, and the sum of two phases are presented in Figure 3. The test and reference dissolution profiles were similar in aqueous (f2 = 63.7) and organic phases (f2 = 59.4). In addition, the kp values for the reference and test were 0.66 and 0.63 h−1, respectively, indicating similar partitioning into the octanol from both products. The biphasic dissolution study demonstrated the highest percentage of LTG dissolved by the products at 30 min and the relative slowdown between 30 min–4 h in the buffer phase. The partitioning of LTG into the organic phase was relatively slow after 15 min, accelerated between 15 min and 2 h, and continued to increase slowly between 2 and 4 h for the reference and test products.

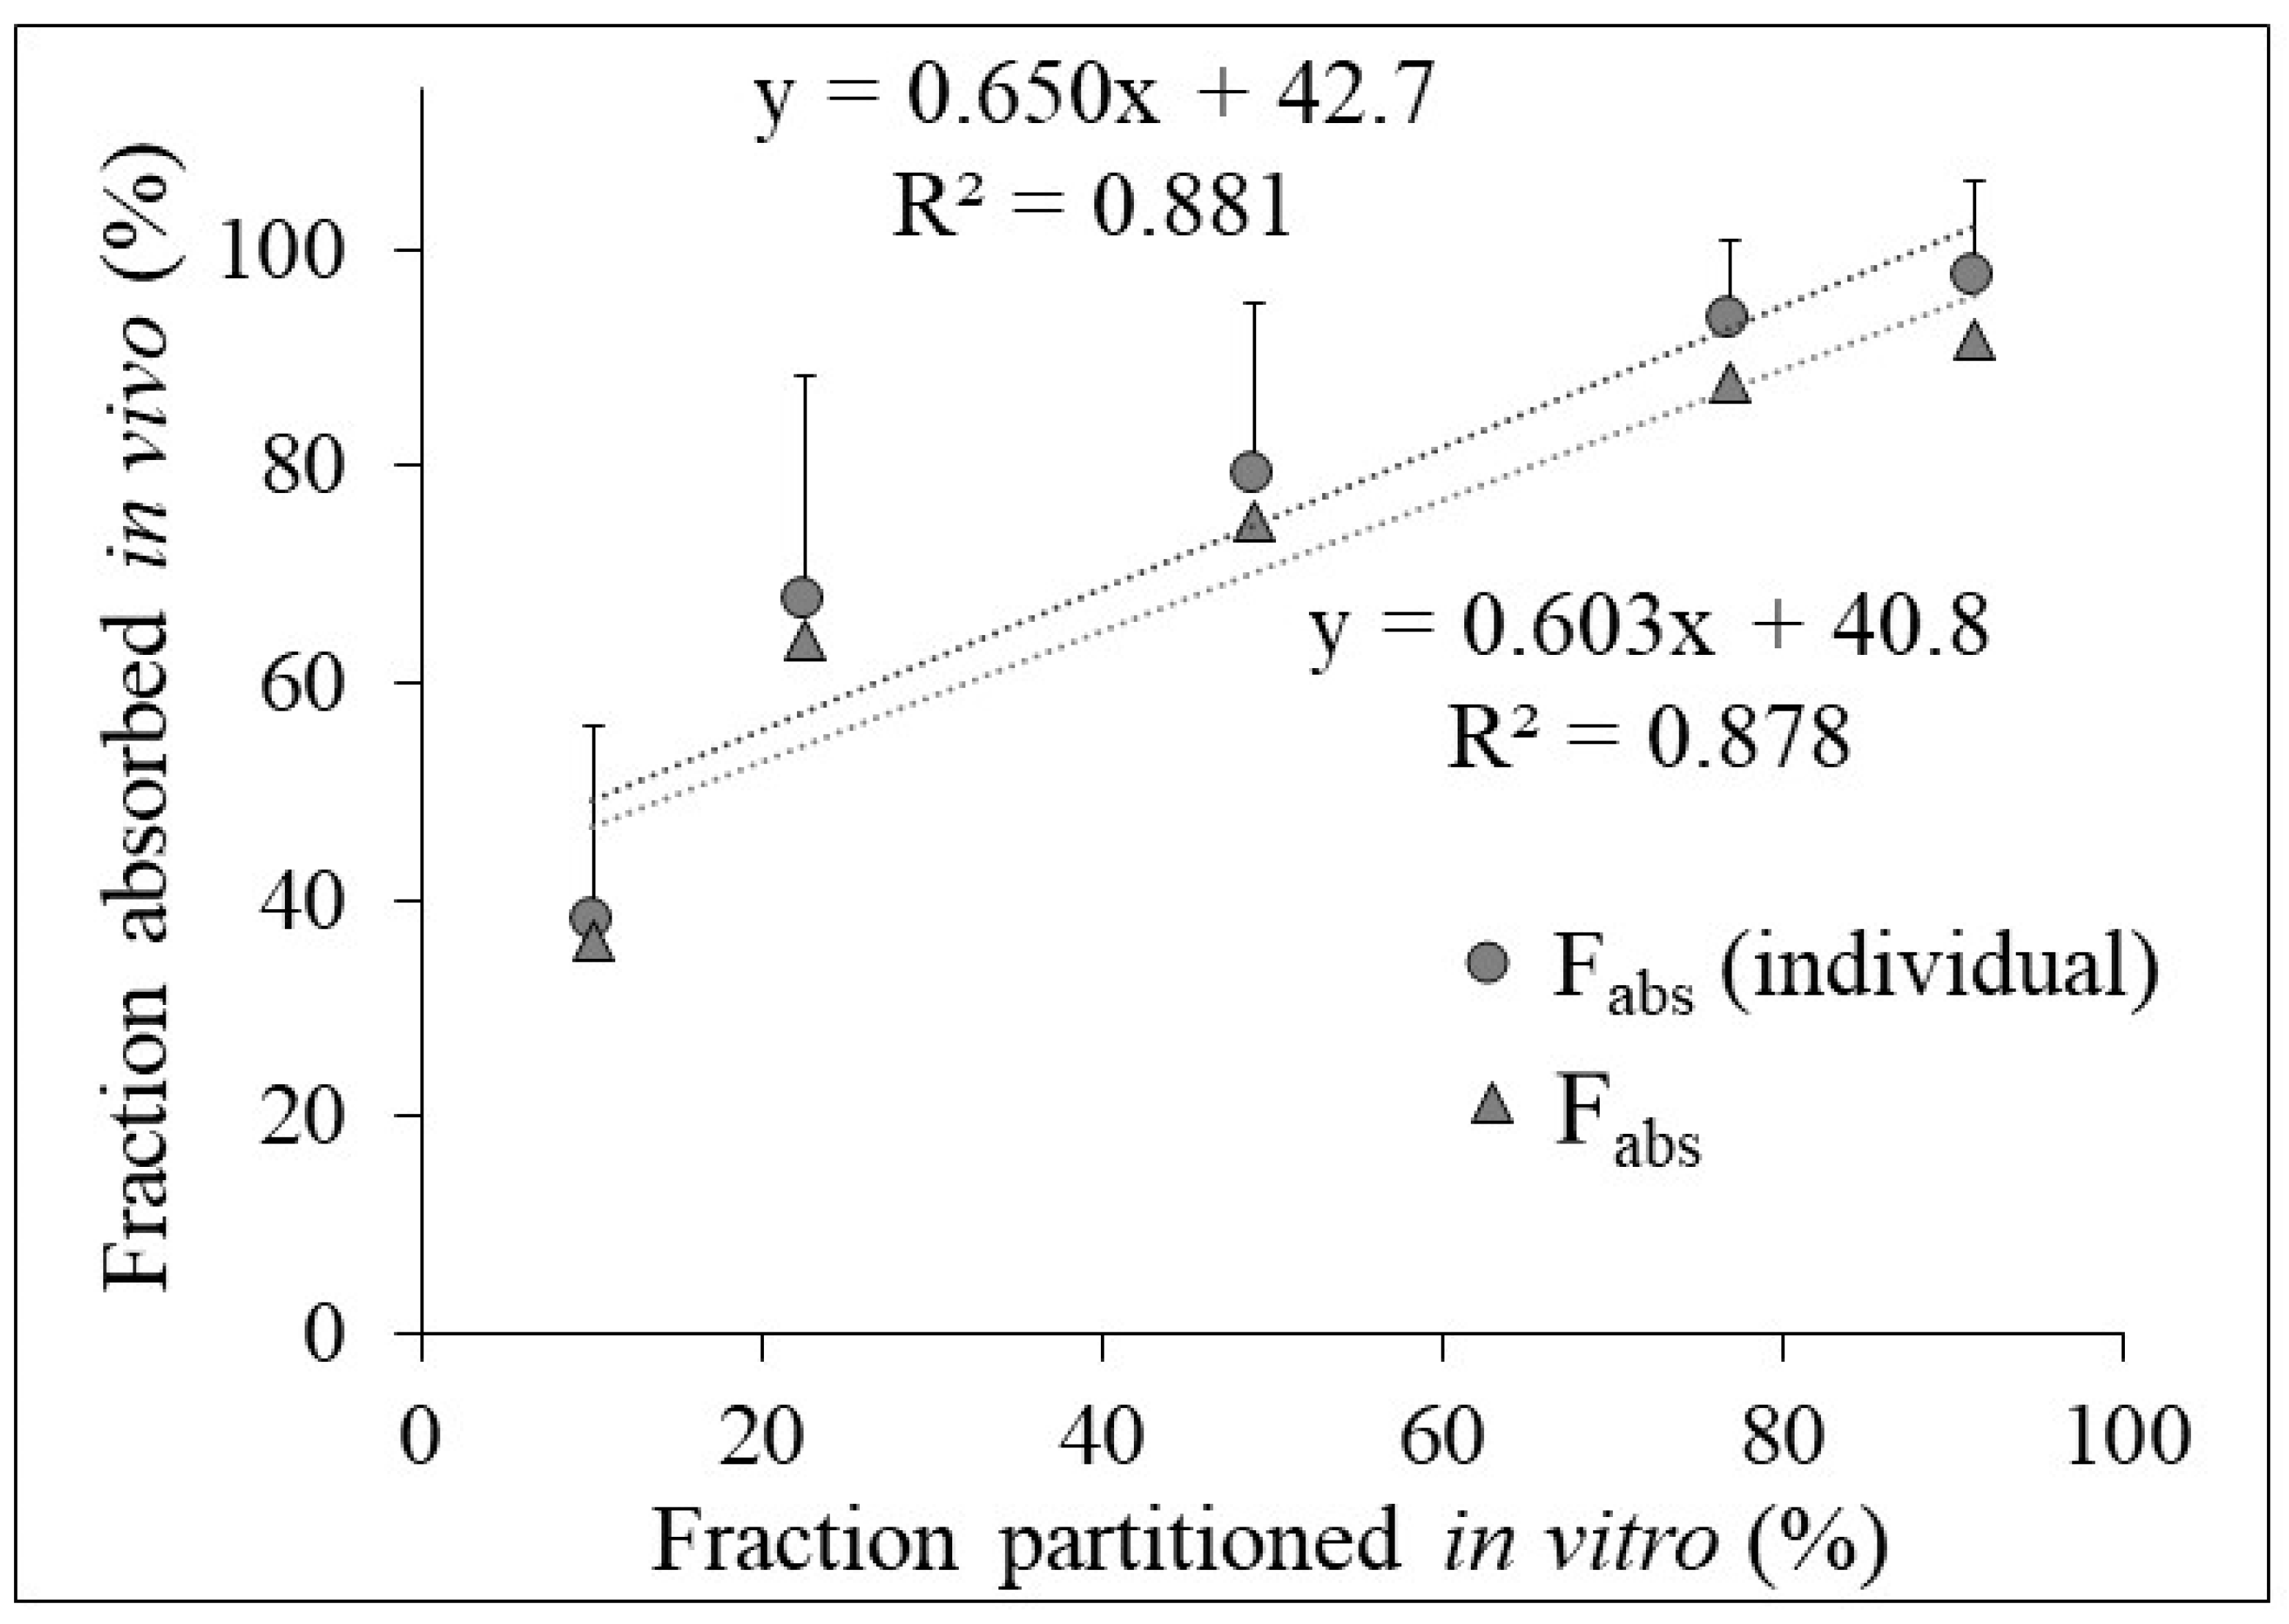
3.3. Relation between In Vivo Absorption and In Vitro Partitioning Data

The correlation between the calculated LTG’s Fabs (%) and the fraction of LTG partitioned into octanol (%) for the reference is presented in Figure 4. An adequate correlation was captured between in vitro partitioning into the organic phase and in vivo Fabs values calculated from individual and mean plasma drug concentration data for the reference (r2 = 0.881 and 0.878, respectively). The calculated mean ka value of the test was 1.33 ± 0.61 h−1, while the observed mean ka value of the reference was 2.26 ± 1.09 h−1.

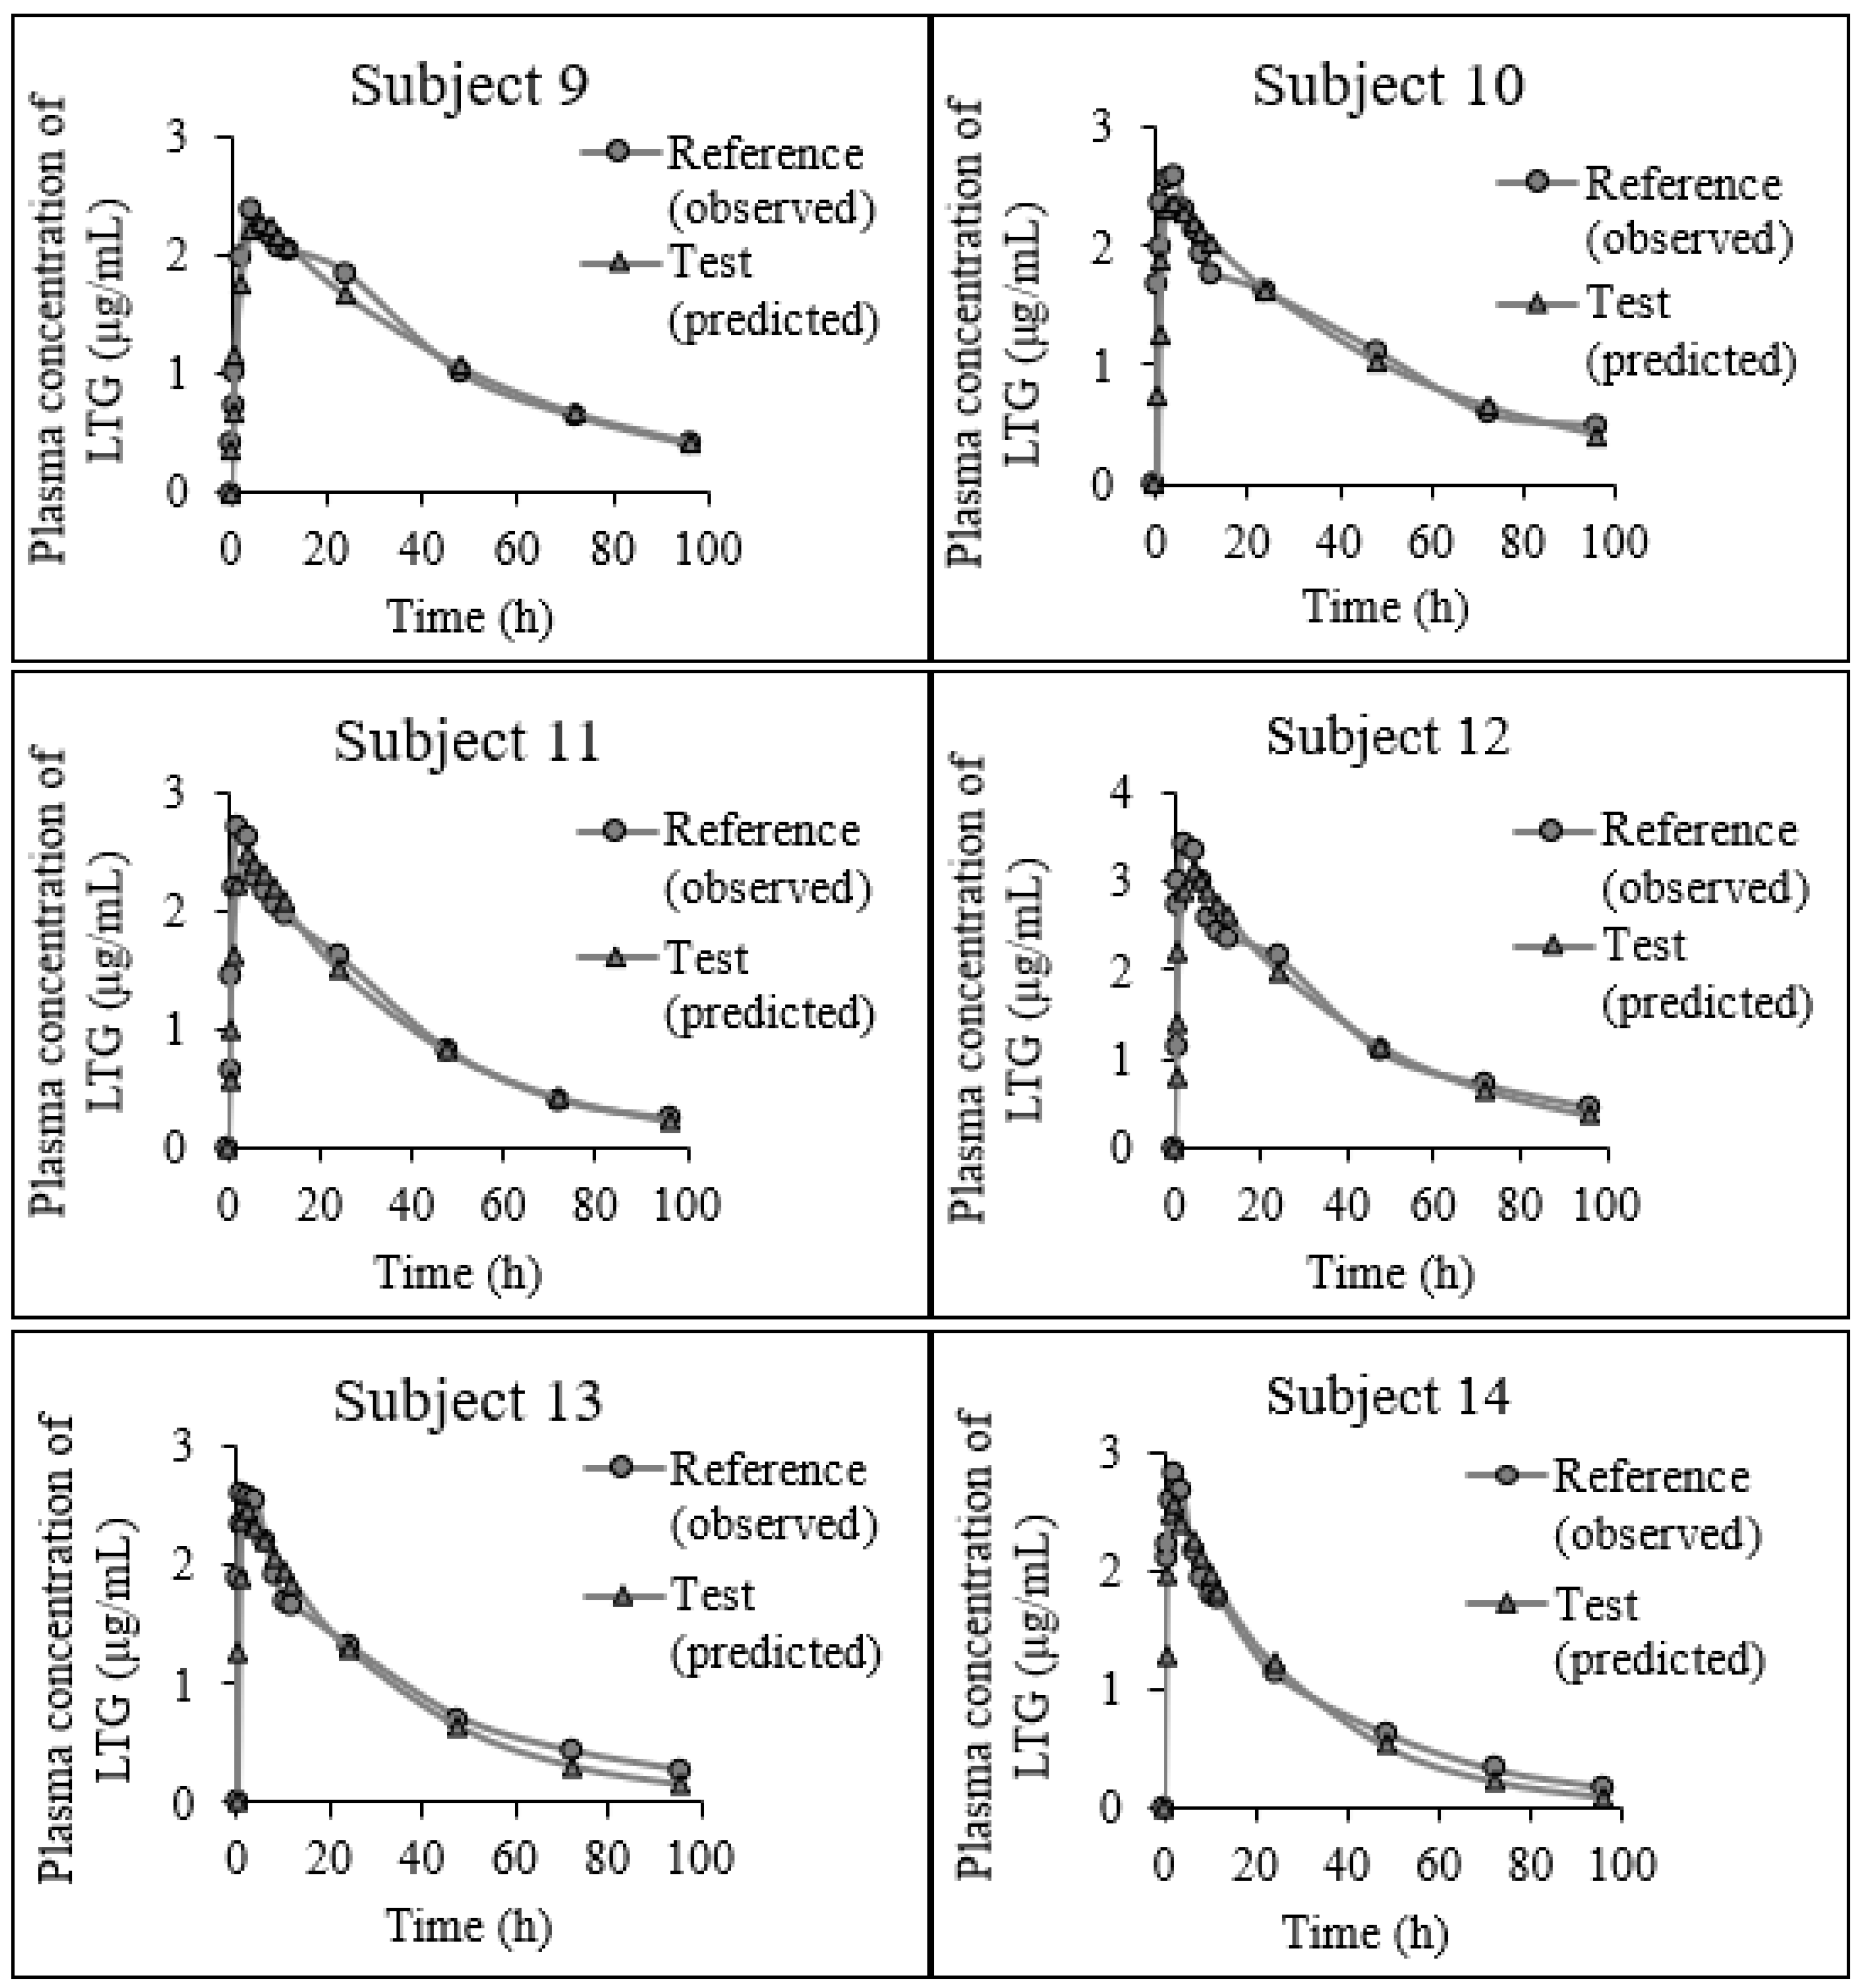
3.4. Prediction of In Vivo Plasma Profiles from the Biphasic In Vitro Data

The predicted individual and mean plasma profiles of LTG for the test product compared to the observed plasma profiles for the reference in healthy volunteers are presented in Figure 5 and Figure 6, respectively.
The AUC, Cmax, and time to reach Cmax (tmax) values are shown in Table 2. The generic product was found to be bioequivalent to the original product in terms of 80–125% BE criteria with a 90% Cl.

4. Discussion

The present study investigated the in vivo relevance of a biphasic dissolution test for LTG’s reference and test IR tablets. Plasma profiles for the test product were predicted in humans from biphasic dissolution data and compared with the in vivo results of the reference. LTG (MW: 256), a BCS Class II drug, was selected based on its high permeability and poor solubility in this study. Furthermore, previously reported human plasma data for the reference product of LTG were available to correlate in vitro and in vivo data [37].
LTG is a weak base with a pKa of 5.7 and a log P of 1.93 [43,44]. Due to the basic structure, it demonstrates a pH-dependent solubility (3.63 and 0.136 mg/mL at pH 1.2 and 6.8, respectively). The physicochemical properties of drugs are among the critical factors affecting their GI absorption [45]. Accordingly, the high unionized fractions of LTG at jejunal (~pH 6.0) and ileal (~pH 7.4) pHs could explain its rapid absorption after the oral dose (tmax = 1–3 h [46]). Thus, the lipophilic structure, basic characteristics, and pH-dependent profile of the unionized fraction of LTG revealed its high intestinal permeability. In addition, the Do of LTG (0.22 (pH 1.2) and 5.9 (pH 6.8)) indicate complete dissolution in the fasting stomach (pH 1.4–2.1; [47]). However, LTG seems to be in a supersaturated state in the upper intestine (pH 4.4–6.6; [47]), where it can be rapidly and extensively absorbed from its primary site of absorption before precipitating at high pH values of the distal regions of the small intestine. It has been reported that these basic drugs can be well absorbed in this supersaturated state from the intestinal mucosa [48,49].
When considered together with the results of the dissolution study at pH 1.2, it appears that more than 85% of the highest dose (200 mg) of LTG is released in the stomach within 10–20 min and is then rapidly absorbed in the upper intestine. However, conventional single-phase dissolution tests are unlikely to estimate the in vivo behavior of oral formulations of LTG. It highlights the need for a dissolution test to simulate in vivo behavior and be used in developing and evaluating oral formulations containing poorly water-soluble drugs. It was demonstrated that the biphasic dissolution test can accurately reflect in vivo drug release, solubility, and absorption for the evaluation of IR formulations of LTG in the present study. In the biphasic dissolution test, the octanol phase reflected the intestinal absorption of LTG. It has also been widely used in other biphasic dissolution studies in the literature since octanol can mimic biological membranes [50,51,52,53]. LTG has a suitable solubility in octanol (4.14 mg/mL) and a high affinity to octanol, making this drug a good candidate for the biphasic dissolution test. Indeed, the sink condition was maintained in 200 mL of the octanol phase for LTG in this study. Generally, a volume of 300–500 mL is suggested to be of in vivo relevance [3], complying with the present study. Consequently, the in vitro similarity of the formulations was verified in both phases.
The partitioning of LTG from the buffer into octanol from the reference and test was rapid between 15 min and 2 h due to rapid drug release from dosage forms, whereas the slow partitioning after 2 h was related to the equilibrium of two phases rather than drug release, which is consistent with the previous findings in other studies [52,54]. The partitioning of the drug from the buffer medium into the organic solvent is considered to be an important parameter for optimizing biphasic tests, reflecting the absorption [55,56]. Since the relationship between kp (in vitro) and ka (in vivo) is important, the proximity of the two rate constants, kp, and ka, can be used to develop a physiologically meaningful in vitro test. This approach recognizes that the drug exhibits high absorption in vivo with first-order absorption kinetics [24]. In the case of the present biphasic test, the in vivo ka (2.26 h−1) value was approximately three times higher than the calculated in vitro kp value for the reference. Therefore, the in vitro system was considered to be close to in vivo conditions and appropriate for evaluating the IR tablet formulations of LTG. Moreover, similar drug partitioning into the octanol phase was obtained for the reference and test formulations, suggesting the similarity of the formulations.
The present study suggests that the target release percentage of LTG in the organic phase is approximately 70–75% within 2 h, 80% within 3 h, and 90% within 4 h to achieve good in vivo performance to develop bioequivalent IR formulations of LTG. The partitioning of LTG into the organic phase within 4 h is also consistent with the finding that LTG is rapidly and completely absorbed from the GI tract, considering that the transit time from the small intestine is approximately 4 h in the fasting state [46,57].
It is essential to establish a correlation between in vitro and in vivo and to predict the in vivo plasma profiles through compartmental models to evaluate the in vivo significance of biphasic dissolution tests. Although IVIVCs have been described for controlled release formulations in the guidelines, good correlations between in vitro data from biphasic dissolution tests and in vivo human data have been found for IR formulations of BCS Class II drugs (celecoxib, deferasirox, racecadotril, ritonavir, and fenofibrate) over the last decade [10,28,51,54,55]. Among these, level A IVIVC was only established for deferasirox, ritonavir, and fenofibrate [10,54,55]. In a recent study by Denninger et al., the commercial solid dosage forms of five drugs (aprepitant, celecoxib, itraconazole, nimodipine, and ritonavir) were investigated in a newly developed small-scale system consisting of 50 mL of organic and aqueous phases [58]. The investigators established a level A IVIVC between the drugs’ profiles in the organic phase and human plasma. Then, they predicted each drug’s in vivo plasma profiles via compartmental modeling, suggesting that the in vitro system could predict in vivo profiles [58].
In the present study, LTG’s Fabs were calculated using deconvolution. The Wagner–Nelson method was used to obtain Fabs values from the plasma concentration–time curves for the reference product of LTG. The mean Fabs value calculated separately from each plasma profile from 14 healthy volunteers was close to that calculated from mean data. There is a good correlation (r2 = 0.999) between the time-dependent Fabs values calculated using these two methods, and the difference between these values is in the range of 4.6–6.1%. Therefore, it is concluded that the mean and separate plasma profiles can be used to establish the point-to-point correlation between the partition data and Fabs values, as pointed out by others [10]. However, each plasma profile of the reference was evaluated separately for the correlation to predict the time–plasma concentration profiles of the test for each healthy volunteer in the present study. The correlation between the in vivo Fabs and in vitro fraction of LTG partitioned into octanol was used for the predictions since the dissolution data from the octanol phase are generally used to establish IVIVC for solid dosage forms [10,28,54].
The correlation between in vivo and in vitro data was successfully applied to predict human plasma profiles for the test product using the compartmental model. The ka value of the reference (ka = 2.26 ± 1.09 h−1) was 1.7 times higher than that of the test product (ka = 1.33 ± 0.61 h−1), calculated using the Wagner–Nelson method. Similarly, the observed tmax for the reference was 2.5 h, whereas tmax was estimated to be 3.7 h for the test. The assessment of BE for the test versus reference ensured that the generic drug does not differ from the reference drug, which was in good agreement with the knowledge that the two formulations are bioequivalent.
Overall, biphasic in vitro dissolution testing seems to be a convenient procedure to estimate the performance of drug products containing poorly water-soluble active pharmaceuticals, providing potential in vitro-in vivo relationships. The present study found a high correlation between in vitro partitioning and absorption data of LTG’s IR formulation for the first time. The plasma profiles were estimated based on in vitro partition and drug disposition. It was concluded that the described biphasic test is likely to provide a discriminative and predictive power for the IR formulations of LTG. Consequently, this approach may result in considerable time and cost savings when developing oral formulations containing BCS Class II drugs.

Author Contributions

Conceptualization, T.I.; methodology, T.I.; software, T.I. and M.E.D.; validation, T.I. and M.E.D.; formal analysis, T.I. and M.E.D.; investigation, T.I. and M.E.D.; resources, T.I. and M.E.D.; data curation, T.I. and M.E.D.; writing—original draft preparation, T.I. and M.E.D.; writing—review and editing, T.I. and M.E.D.; visualization, T.I. and M.E.D.; supervision, T.I.; project administration, T.I. All authors have read and agreed to the published version of the manuscript.

Funding

This research received no external funding.

Institutional Review Board Statement

The previously reported human study was conducted in accordance with the Declaration of Helsinki and approved by the local Ethics Committee of Gazi University Hospital, Ankara, Turkey. (protocol code: 2003/65, date of approval: 26 June 2003).

Informed Consent Statement

Informed consent was obtained from all subjects involved in the previously reported human study.

Data Availability Statement

The data presented in this study are available in this article.

Acknowledgments

The authors would like to thank Sanovel Pharmaceuticals (Istanbul, Turkey) for kindly providing the LTG drug substance. The authors also thank Ilbeyi Agabeyoglu for proofreading the manuscript.

Conflicts of Interest

The authors declare no conflict of interest.

References

  1. Grady, H.; Elder, D.; Webster, G.K.; Mao, Y.; Lin, Y.; Flanagan, T.; Mann, J.; Blanchard, A.; Cohen, M.J.; Lin, J.; et al. Industry’s view on using quality control, biorelevant, and clinically relevant dissolution tests for pharmaceutical development, registration, and commercialization. J. Pharm. Sci. 2018, 107, 34–41. [Google Scholar] [CrossRef] [PubMed]
  2. Galia, E.; Nicolaides, E.; Hörter, D.; Löbenberg, R.; Reppas, C.; Dressman, J.B. Evaluation of various dissolution media for predicting in vivo performance of class I and II drugs. Pharm. Res. 1998, 15, 698–705. [Google Scholar] [CrossRef] [PubMed]
  3. Klein, S. The use of biorelevant dissolution media to forecast the in vivo performance of a drug. AAPS J. 2010, 12, 397–406. [Google Scholar] [CrossRef]
  4. Lehto, P.; Kortejärvi, H.; Liimatainen, A.; Ojala, K.; Kangas, H.; Hirvonen, J.; Tanninen, V.P.; Peltonen, L. Use of conventional surfactant media as surrogates for FaSSIF in simulating in vivo dissolution of BCS class II drugs. Eur. J. Pharm. Biopharm. 2011, 78, 531–538. [Google Scholar] [CrossRef] [PubMed]
  5. Matsui, K.; Tsume, Y.; Amidon, G.E.; Amidon, G.L. In vitro dissolution of fluconazole and dipyridamole in gastrointestinal simulator (GIS), predicting in vivo dissolution and drug-drug interaction caused by acid-reducing agents. Mol. Pharm. 2015, 12, 2418–2428. [Google Scholar] [CrossRef] [PubMed]
  6. Hens, B.; Sinko, P.D.; Job, N.; Dean, M.; Al-Gousous, J.; Salehi, N.; Ziff, R.M.; Tsume, Y.; Bermejo, M.; Paixão, P.; et al. Formulation predictive dissolution (fPD) testing to advance oral drug product development: An introduction to the US FDA funded ‘21st Century BA/BE’ project. Int. J. Pharm. 2018, 548, 120–127. [Google Scholar] [CrossRef] [PubMed]
  7. Yu, L.X.; Amidon, G.L.; Polli, J.E.; Zhao, H.; Mehta, M.U.; Conner, D.P.; Shah, V.P.; Lesko, L.J.; Chen, M.-L.; Lee, V.H.L.; et al. Biopharmaceutics classification system: The scientific basis for biowaiver extensions. Pharm. Res. 2002, 19, 921–925. [Google Scholar] [CrossRef]
  8. Hanif, M.; Shoaib, M.H.; Yousuf, R.I.; Zafar, F. Development of in vitro-in vivo correlations for newly optimized nimesulide formulations. PLoS ONE 2018, 13, e0203123. [Google Scholar] [CrossRef]
  9. Phillips, D.J.; Pygall, S.R.; Cooper, V.B.; Mann, J.C. Overcoming sink limitations in dissolution testing: A review of traditional methods and the potential utility of biphasic systems. J. Pharm. Pharmacol. 2012, 64, 1549–1559. [Google Scholar] [CrossRef]
  10. Xu, H.; Vela, S.; Shi, Y.; Marroum, P.; Gao, P. In vitro characterization of ritonavir drug products and correlation to human in vivo performance. Mol. Pharm. 2017, 14, 3801–3814. [Google Scholar] [CrossRef]
  11. Jede, C.; Henze, L.J.; Meiners, K.; Bogdahn, M.; Wedel, M.; van Axel, V. Development and application of a dissolution-transfer-partitioning system (DTPS) for biopharmaceutical drug characterization. Pharmaceutics 2023, 15, 1069. [Google Scholar] [CrossRef] [PubMed]
  12. Gabriëls, M.; Plaizier-Vercammen, J. Design of a dissolution system for the evaluation of the release rate characteristics of artemether and dihydroartemisinin from tablets. Int. J. Pharm. 2004, 274, 245–260. [Google Scholar] [CrossRef] [PubMed]
  13. Grundy, J.S.; Anderson, K.E.; Rogers, J.A.; Foster, R.T. Studies on dissolution testing of the nifedipine gastrointestinal therapeutic system. I. Description of a two-phase in vitro dissolution test. J. Control. Release 1997, 48, 1–8. [Google Scholar] [CrossRef]
  14. Heigoldt, U.; Sommer, F.; Daniels, R.; Wagner, K.-G. Predicting in vivo absorption behavior of oral modified release dosage forms containing pH-dependent poorly soluble drugs using a novel pH-adjusted biphasic in vitro dissolution test. Eur. J. Pharm. Biopharm. 2010, 76, 105–111. [Google Scholar] [CrossRef] [PubMed]
  15. Niebergall, P.J.; Patil, M.Y.; Sugita, E.T. Simultaneous determination of dissolution and partitioning rates in vitro. J. Pharm. Sci. 1967, 56, 943–947. [Google Scholar] [CrossRef] [PubMed]
  16. Gibaldi, M.; Feldman, S. Establishment of sink conditions in dissolution rate determinations. Theoretical considerations and application to nondisintegrating dosage forms. J. Pharm. Sci. 1967, 56, 1238–1242. [Google Scholar] [CrossRef]
  17. Stead, J.A.; Freeman, M.; John, E.G.; Ward, G.T.; Whiting, B. Ibuprofen tablets: Dissolution and bioavailability studies. Int. J. Pharm. 1983, 14, 59–72. [Google Scholar] [CrossRef]
  18. Chaudhary, R.S.; Gangwal, S.S.; Gupta, V.K.; Shah, Y.N.; Jindal, K.C.; Khanna, S. Dissolution system for nifedipine sustained release formulations. Drug Dev. Ind. Pharm. 1994, 20, 1267–1274. [Google Scholar] [CrossRef]
  19. Vangani, S.; Li, X.; Zhou, P.; Del-Barrio, M.-A.; Chiu, R.; Cauchon, N.; Gao, P.; Medina, C.; Jasti, B. Dissolution of poorly water-soluble drugs in biphasic media using USP 4 and fiber optic system. Clin. Res. Regul. Aff. 2009, 26, 8–19. [Google Scholar] [CrossRef]
  20. Frank, K.J.; Locher, K.; Zecevic, D.E.; Fleth, J.; Wagner, K.G. In vivo predictive mini-scale dissolution for weak bases: Advantages of pH-shift in combination with an absorptive compartment. Eur. J. Pharm. Sci. 2014, 61, 32–39. [Google Scholar] [CrossRef]
  21. Locher, K.; Borghardt, J.M.; Frank, K.J.; Kloft, C.; Wagner, K.G. Evolution of a mini-scale biphasic dissolution model: Impact of model parameters on partitioning of dissolved API and modelling of in vivo-relevant kinetics. Eur. J. Pharm. Biopharm. 2016, 105, 166–175. [Google Scholar] [CrossRef] [PubMed]
  22. O’Dwyer, P.J.; Box, K.J.; Imanidis, G.; Vertzoni, M.; Reppas, C. On the usefulness of four in vitro methods in assessing the intraluminal performance of poorly soluble, ionisable compounds in the fasted state. Eur. J. Pharm. Sci. 2022, 168, 106034. [Google Scholar] [CrossRef]
  23. Grassi, M.; Coceani, N.; Magarotto, L. Modelling partitioning of sparingly soluble drugs in a two-phase liquid system. Int. J. Pharm. 2002, 239, 157–169. [Google Scholar] [CrossRef] [PubMed]
  24. Mudie, D.M.; Shi, Y.; Ping, H.; Gao, P.; Amidon, G.L.; Amidon, G.E. Mechanistic analysis of solute transport in an in vitro physiological two-phase dissolution apparatus. Biopharm. Drug Dispos. 2012, 33, 378–402. [Google Scholar] [CrossRef] [PubMed]
  25. Takahashi, M.; Mochizuki, M.; Itoh, T.; Ohta, M. Studies on dissolution tests for soft gelatin capsules. IV. Dissolution test of nifedipine soft gelatin capsule containing water soluble vehicles by the rotating dialysis cell method. Chem. Pharm. Bull. 1994, 42, 333–336. [Google Scholar] [CrossRef] [PubMed]
  26. Hoa, N.T.; Kinget, R. Design and evaluation of two-phase partition–dissolution method and its use in evaluating artemisinin tablets. J. Pharm. Sci. 1996, 85, 1060–1063. [Google Scholar] [CrossRef] [PubMed]
  27. Pillay, V.; Fassihi, R. A new method for dissolution studies of lipid-filled capsules employing nifedipine as a model drug. Pharm. Res. 1999, 16, 333–337. [Google Scholar] [CrossRef]
  28. Shi, Y.; Gao, P.; Gong, Y.; Ping, H. Application of a biphasic test for characterization of in vitro drug release of immediate release formulations of celecoxib and its relevance to in vivo absorption. Mol. Pharm. 2010, 7, 1458–1465. [Google Scholar] [CrossRef]
  29. Yukuyama, M.N.; Zuo, J.; Park, C.; Yousef, M.; Henostroza, M.A.B.; de Araujo, G.L.B.; Bou-Chacra, N.A.; Löbenberg, R. Biphasic dissolution combined with modified cylinder method-A new promising method for dissolution test in drug-loaded nanoemulsions. Int. J. Pharm. 2023, 632, 122554. [Google Scholar] [CrossRef]
  30. Pestieau, A.; Krier, F.; Lebrun, P.; Brouwers, A.; Streel, B.; Evrard, B. Optimization of a PGSS (particles from gas saturated solutions) process for a fenofibrate lipid-based solid dispersion formulation. Int. J. Pharm. 2015, 485, 295–305. [Google Scholar] [CrossRef]
  31. Denninger, A.; Becker, T.; Westedt, U.; Wagner, K.G. Advanced in vivo prediction by introducing biphasic dissolution data into PBPK models. Pharmaceutics 2023, 15, 1978. [Google Scholar] [CrossRef] [PubMed]
  32. Fitton, A.; Goa, K.L. Lamotrigine. An update of its pharmacology and therapeutic use in epilepsy. Drugs 1995, 50, 691–713. [Google Scholar] [CrossRef] [PubMed]
  33. Rambeck, B.; Wolf, P. Lamotrigine clinical pharmacokinetics. Clin. Pharmacokinet. 1993, 25, 433–443. [Google Scholar] [CrossRef]
  34. Vaithianathan, S.; Raman, S.; Jiang, W.; Ting, T.Y.; Kane, M.A.; Polli, J.E.; Raman, S.; Jiang, W.; Ting, T.Y.; Kane, M.A.; et al. Biopharmaceutic risk assessment of brand and generic lamotrigine tablets. Mol. Pharm. 2015, 12, 2436–2443. [Google Scholar] [CrossRef] [PubMed]
  35. Goa, K.L.; Ross, S.R.; Chrisp, P. Lamotrigine: A review of its pharmacological properties and clinical efficacy in epilepsy. Drugs 1993, 46, 152–176. [Google Scholar] [CrossRef]
  36. Cohen, A.F.; Land, G.S.; Breimer, D.D.; Yuen, W.C.; Winton, C.; Peck, A.W. Lamotrigine, a new anticonvulsant: Pharmacokinetics in normal humans. Clin. Pharmacol. Ther. 1987, 42, 535–541. [Google Scholar] [CrossRef]
  37. Incecayir, T.; Agabeyoglu, I.; Gucuyener, K. Comparison of plasma and saliva concentrations of lamotrigine in healthy volunteers. Arzneimittelforschung 2007, 57, 517–521. [Google Scholar] [CrossRef]
  38. Amidon, G.L.; Lennernäs, H.; Shah, V.P.; Crison, J.R. A theoretical basis for a biopharmaceutic drug classification: The correlation of in vitro drug product dissolution and in vivo bioavailability. Pharm. Res. 1995, 12, 413–420. [Google Scholar] [CrossRef]
  39. United States Food and Drug Administration, Department of Health and Human Services, Center for Drug Evaluation and Research (CDER). Dissolution Testing of Immediate Release Solid Oral Dosage Forms, Guidance for Industry; U.S. Government Printing Office: Washington, DC, USA, 1997.
  40. Wagner, J.G. Estimation of theophylline absorption rate by means of the Wagner-Nelson equation. J. Allergy Clin. Immunol. 1986, 78, 681–688. [Google Scholar] [CrossRef]
  41. United States Food and Drug Administration. Dissolution Methods for Lamotrigine. 2008. Available online: https://www.accessdata.fda.gov/scripts/cder/dissolution/dsp_SearchResults.cfm (accessed on 15 August 2023).
  42. The United States Pharmacopeial Convention. General Chapter <1092> The Dissolution Procedure: Development and Vali-dation. In United States Pharmacopoeia and National Formulary-USP 44-NF 39; The United States Pharmacopeial Convention: North Bethesda, MD, USA, 2021; p. 4/23.
  43. United States Food and Drug Administration. Approved Label Text. 2015. Available online: https://www.accessdata.fda.gov/drugsatfda_docs/label/2015/020241s045s051lbl.pdf (accessed on 15 August 2023).
  44. The Metabolomics Innovation Centre. The Toxin and Toxin Target Database (T3DB). Lamotrigine. 2014. Available online: http://www.t3db.ca/toxins/T3D2570 (accessed on 15 August 2023).
  45. Malan, S.F.; Chetty, D.J.; du Plessis, J. Physicochemical properties of drugs and membrane permeability. S. Afr. J. Sci. 2002, 98, 385–391. Available online: https://hdl.handle.net/10520/EJC97511 (accessed on 11 October 2023).
  46. Btaiche, I.F.; Woster, P.S. Gabapentin and lamotrigine: Novel antiepileptic drugs. Am. J. Health-Syst. Pharm. 1995, 52, 61–69. [Google Scholar] [CrossRef] [PubMed]
  47. Dressman, J.B.; Amidon, G.L.; Reppas, C.; Shah, V.P. Dissolution testing as a prognostic tool for oral drug absorption: Immediate release dosage forms. Pharm. Res. 1998, 15, 11–22. [Google Scholar] [CrossRef] [PubMed]
  48. Bevernage, J.; Brouwers, J.; Brewster, M.E.; Augustijns, P. Evaluation of gastrointestinal drug supersaturation and precipitation: Strategies and issues. Int. J. Pharm. 2013, 453, 25–35. [Google Scholar] [CrossRef]
  49. Incecayir, T. The effects of surfactants on the solubility and dissolution profiles of a poorly water-soluble basic drug, carvedilol. Pharmazie 2015, 70, 784–790. Available online: https://pubmed.ncbi.nlm.nih.gov/26817275/ (accessed on 11 October 2023). [PubMed]
  50. Franc, A.; Muselík, J.; Goněc, R.; Vetchý, D. Biphasic dissolution method for quality control and assurance of drugs containing active substances in the form of weak acid salts. Acta Pharm. 2016, 66, 139–145. [Google Scholar] [CrossRef] [PubMed]
  51. Deng, J.; Staufenbiel, S.; Hao, S.; Wang, B.; Dashevskiy, A.; Bodmeier, R. Development of a discriminative biphasic in vitro dissolution test and correlation with in vivo pharmacokinetic studies for differently formulated racecadotril granules. J. Control. Rel. 2017, 255, 202–209. [Google Scholar] [CrossRef]
  52. Silva, D.A.; Al-Gousous, J.; Davies, N.M.; Chacra, N.B.; Webster, G.K.; Lipka, E.; Amidon, G.L.; Löbenberg, R. Biphasic dissolution as an exploratory method during early drug product development. Pharmaceutics 2020, 12, 420. [Google Scholar] [CrossRef]
  53. Rothwell, J.A.; Day, A.J.; Morgan, M.R.A. Experimental determination of octanol−water partition coefficients of quercetin and related flavonoids. J. Agric. Food Chem. 2005, 53, 4355–4360. [Google Scholar] [CrossRef]
  54. Al Durdunji, A.; AlKhatib, H.S.; Al-Ghazawi, M. Development of a biphasic dissolution test for deferasirox dispersible tablets and its application in establishing an in vitro-in vivo correlation. Eur. J. Pharm. Biopharm. 2016, 102, 9–18. [Google Scholar] [CrossRef]
  55. Xu, H.; Shi, Y.; Vela, S.; Marroum, P.; Gao, P. Developing quantitative in vitro-in vivo correlation for fenofibrate immediate-release formulations with the biphasic dissolution-partition test method. J. Pharm. Sci. 2018, 107, 476–487. [Google Scholar] [CrossRef]
  56. Denninger, A.; Westedt, U.; Rosenberg, J.; Wagner, K.G. A rational design of a biphasic dissolution setup-modelling of biorelevant kinetics for a ritonavir hot-melt extruded amorphous solid dispersion. Pharmaceutics 2020, 12, 237. [Google Scholar] [CrossRef] [PubMed]
  57. Koziolek, M.; Grimm, M.; Becker, D.; Iordanov, V.; Zou, H.; Shimizu, J.; Wanke, C.; Garbacz, G.; Weitschies, W. Investigation of pH and temperature profiles in the GI tract of fasted human subjects using the Intellicap® system. J. Pharm. Sci. 2015, 104, 2855–2863. [Google Scholar] [CrossRef] [PubMed]
  58. Denninger, A.; Westedt, U.; Wagner, K.G. Shared IVIVR for five commercial enabling formulations using the BiPHa+ biphasic dissolution assay. Pharmaceutics 2021, 13, 285. [Google Scholar] [CrossRef] [PubMed]
Figure 1. Schematic depiction of USP apparatus II with the additional paddle in the present study.
Pharmaceutics 15 02474 g001
Figure 2. Dissolution profiles of 200 mg lamotrigine (LTG) reference and test tablets in the single phase dissolution test under (A) Sink condition (pH 1.2 hydrochloric acid, 900 mL) and (B) Non-sink condition (pH 6.8 phosphate buffer, 900 mL). Data were obtained using USP Apparatus II with a rotation speed of 50 rpm at 37 ± 0.5 °C (mean ± standard deviation (SD); n = 6).
Pharmaceutics 15 02474 g002
Figure 3. Dissolution profiles of 200 mg of the LTG reference and test tablets from the (A) aqueous (pH 6.8 phosphate buffer), (B) organic (octanol) phases, and (C) sum of two phases (total) in the biphasic dissolution test. Data were obtained using the paddle-modified USP Apparatus II with a rotation speed of 50 rpm and 37 ± 0.5 °C (mean ± SD; n = 3).
Pharmaceutics 15 02474 g003aPharmaceutics 15 02474 g003b
Figure 4. Correlation between LTG’s fraction of the dose absorbed (Fabs) and the fraction of LTG partitioned into the organic phase between 0 and 4 h for the reference. (The circles represent the individual plasma data; the triangles represent the mean plasma data in healthy volunteers).
Pharmaceutics 15 02474 g004
Figure 5. The plasma concentration–time profiles of LTG in 14 healthy volunteers (The circles represent the observed plasma profiles for the reference; the triangles represent the predicted plasma profiles for the test).
Pharmaceutics 15 02474 g005aPharmaceutics 15 02474 g005b
Figure 6. The mean plasma concentration–time profiles of LTG in healthy volunteers (The circles represent the observed plasma profile for the reference; the triangles represent the predicted plasma profile for the test) Data are presented as the mean ± SD, n = 14.
Pharmaceutics 15 02474 g006
Table 1. Saturation solubility (CS) values, relative sink conditions (CS/CD), and dose numbers (DO) of lamotrigine (LTG) in hydrochloric acid (pH = 1.2) and a phosphate buffer (pH = 6.8) at 37 °C.
MediumCS 1 (mg/mL)CS/CD 2DO 3
pH 1.2 hydrochloric acid 3.63 ± 0.0116.30.22
pH 6.8 phosphate buffer 0.136 ± 0.0010.6115.9
1 CS is the saturation solubility of LTG; 2 CD is the theoretical concentration of the drug, assuming complete dissolution of 200 mg LTG tablet in 900 mL dissolution medium; 3 Do is the dose number.
Table 2. Bioavailability (BA) criteria for test and reference products.
TestReference
BA CriteriaMean ± SD 1CV% 2Mean ± SDCV%BE Limits for 90 % CI 3
AUC (µg/mL.h) 4119 ± 24.921.0123 ± 14.3 *11.685.9–107
Cmax (µg/mL) 52.61 ± 0.3915.12.90 ± 0.26 *8.9682.7–97.6
tmax (h) 63.7 ± 1.128.82.4 ± 0.7 *29.2
1 standard deviation; 2 coefficient of variation; 3 confidence interval; 4 area under the LTG concentration–time profile calculated over the 0 to infinity time interval; 5 peak plasma concentration of LTG; 6 time to reach Cmax, * Data are obtained from Incecayir et al. 2007 [37].
Disclaimer/Publisher’s Note: The statements, opinions and data contained in all publications are solely those of the individual author(s) and contributor(s) and not of MDPI and/or the editor(s). MDPI and/or the editor(s) disclaim responsibility for any injury to people or property resulting from any ideas, methods, instructions or products referred to in the content.

