

Glycyrrhizin-Based Hydrogels Accelerate Wound Healing of Normoglycemic and Diabetic Mouse Skin

 , , , , , , and
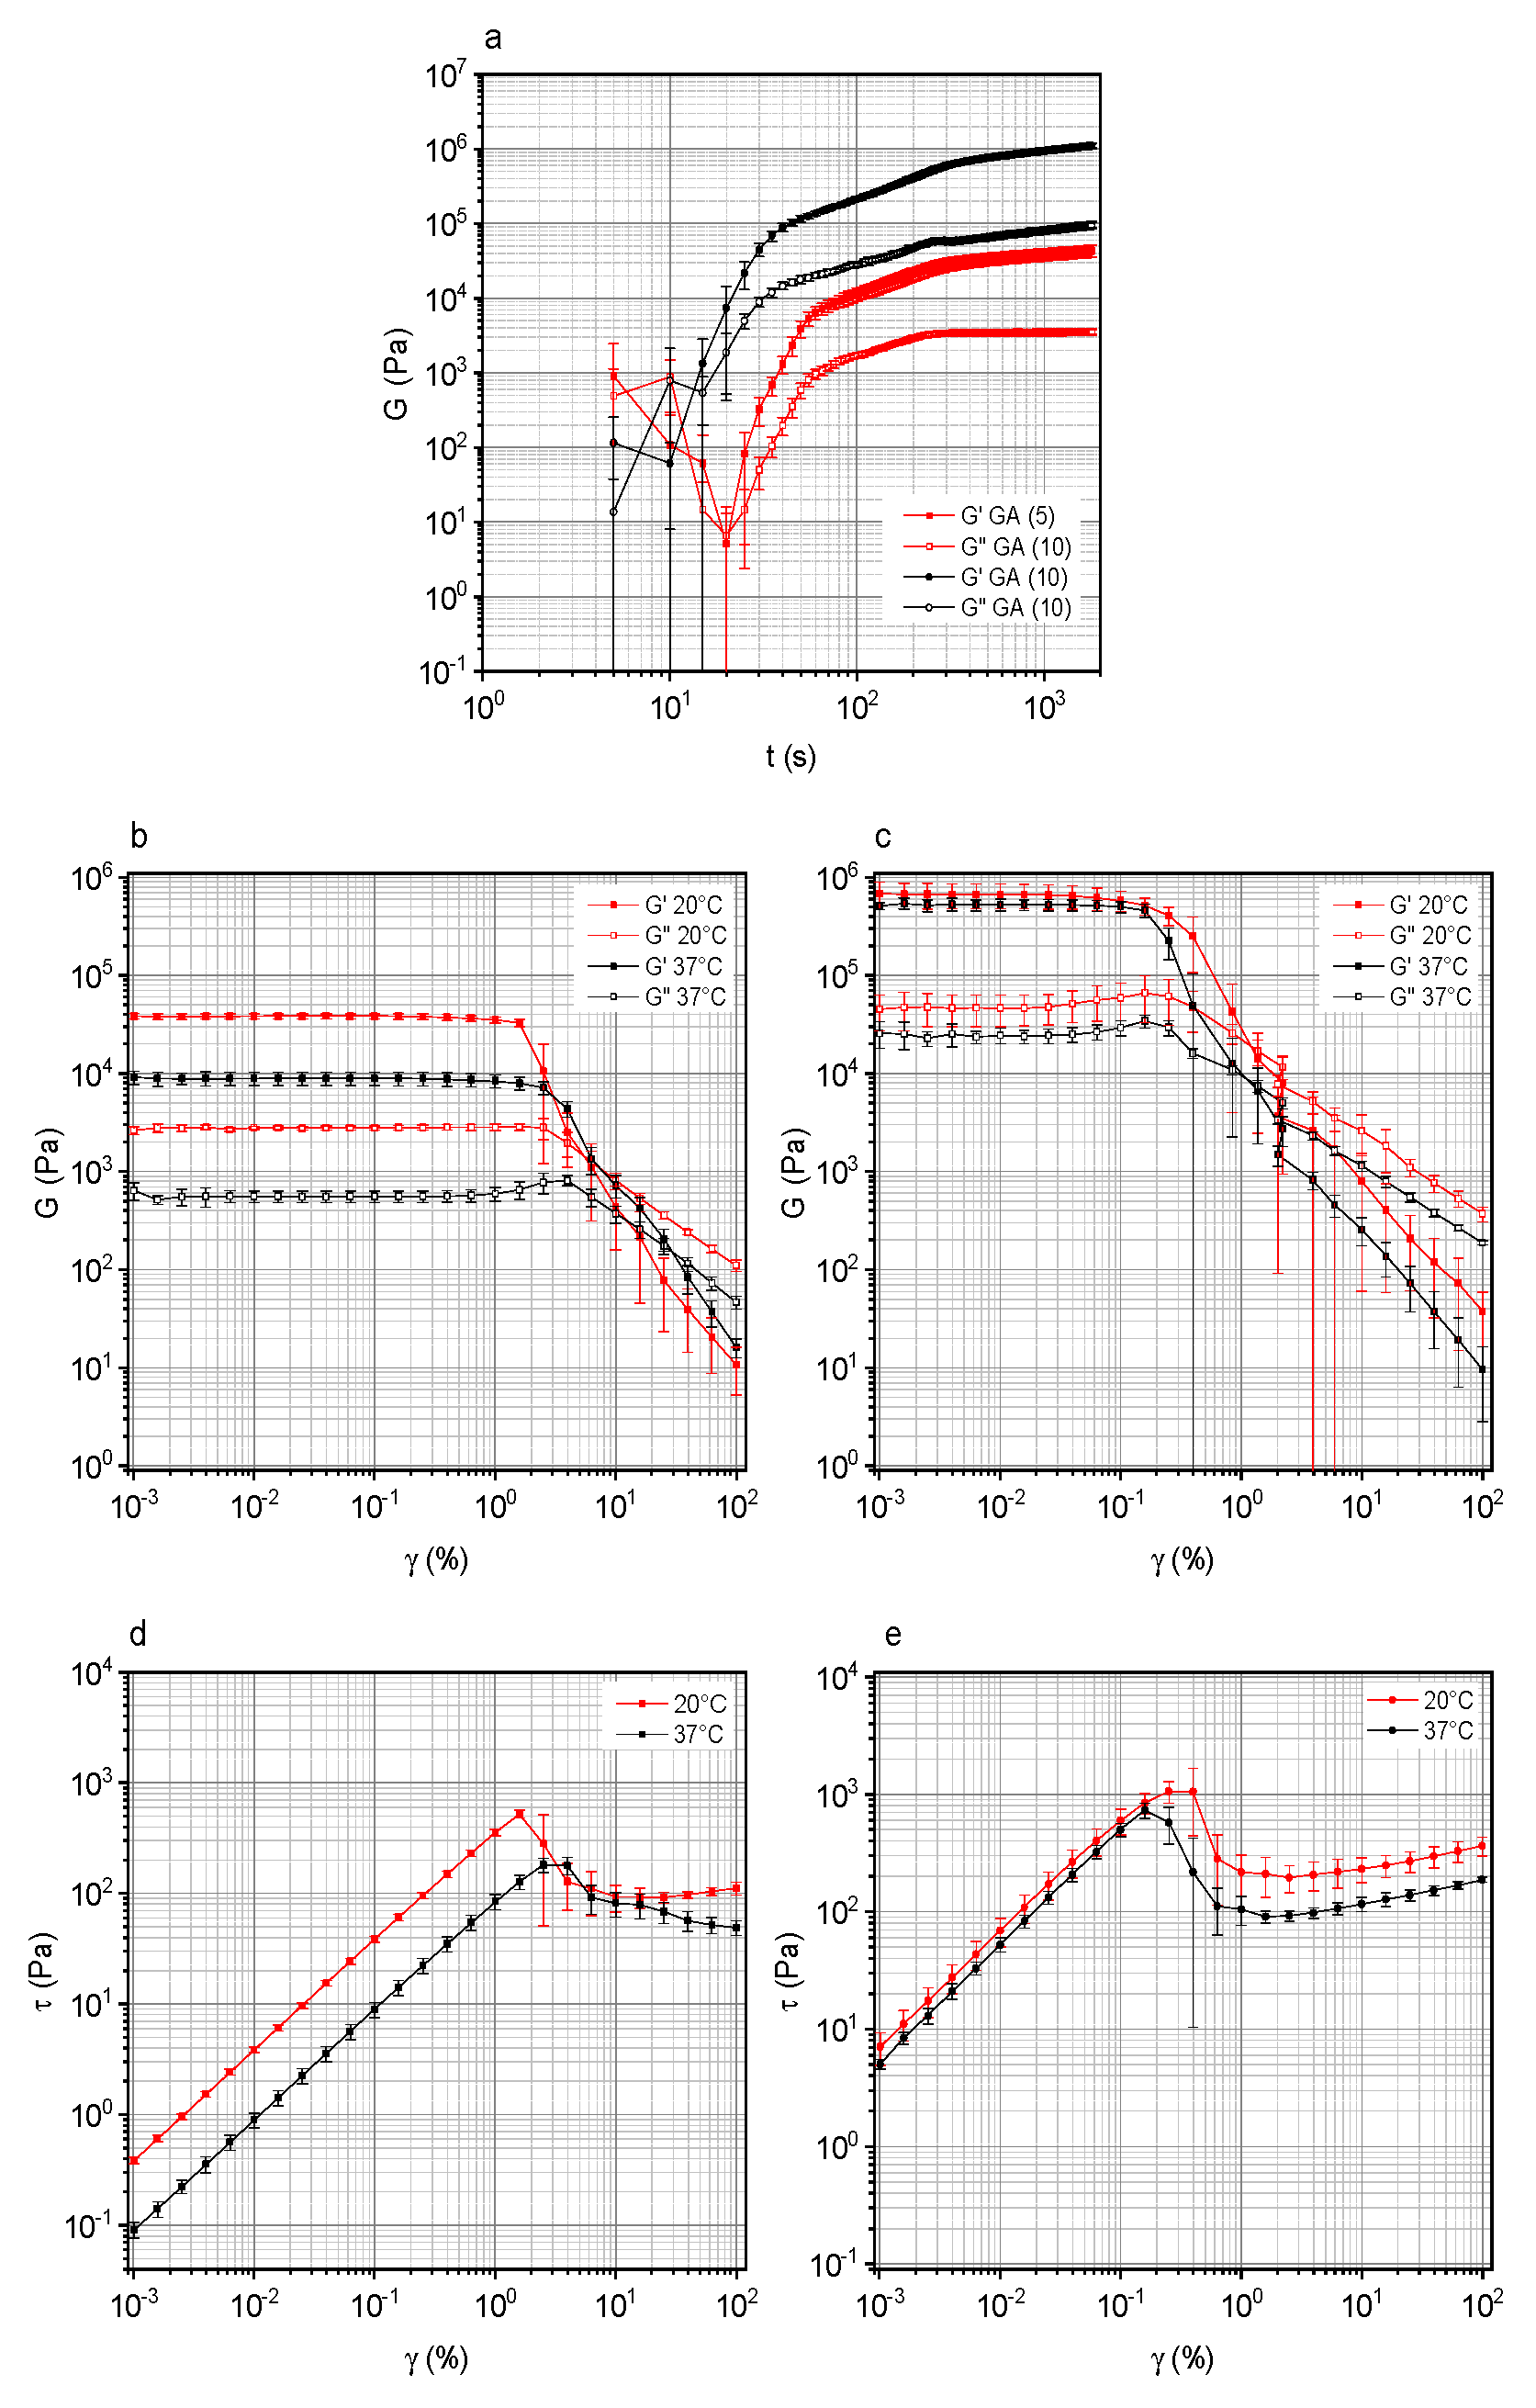
Abstract
1. Introduction
2. Experimental Section
2.1. Materials
2.2. Procedures/Data
2.2.1. Methods
2.2.2. Mice
2.2.3. Skin Wound Healing Studies
2.2.4. Skin Histology and Immunofluorescence
2.2.5. ELISA
2.2.6. Statistical Analysis
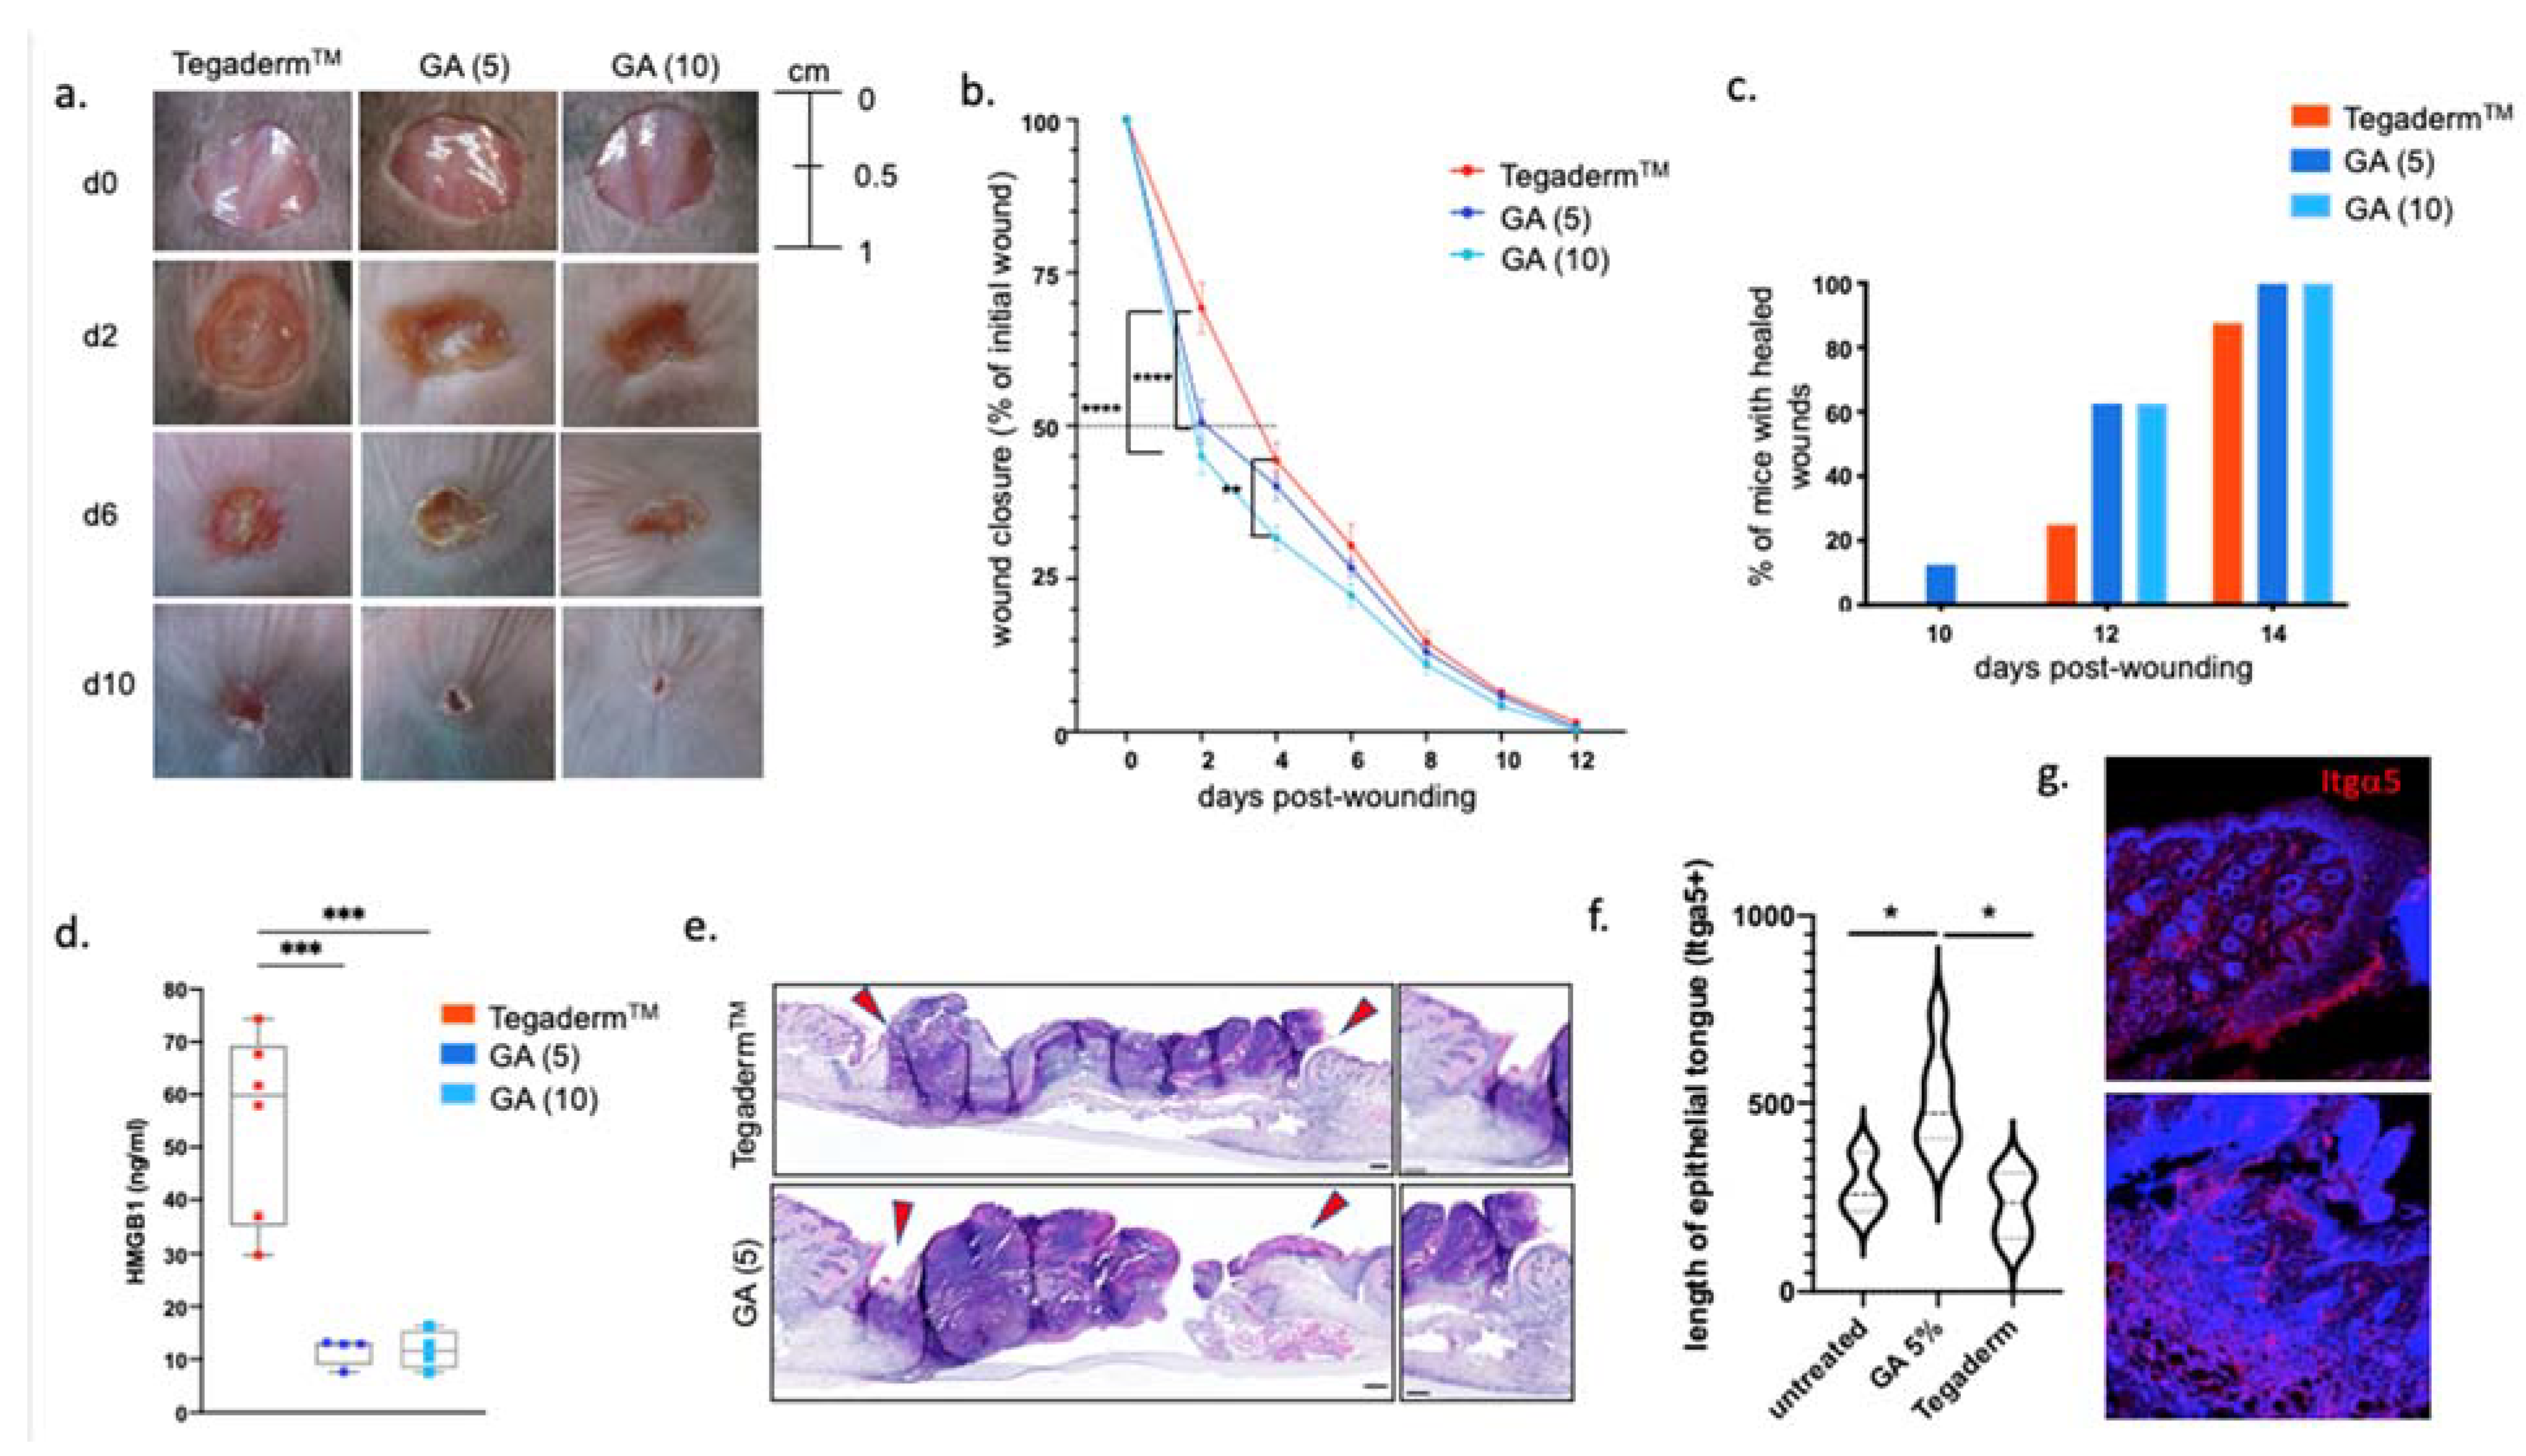
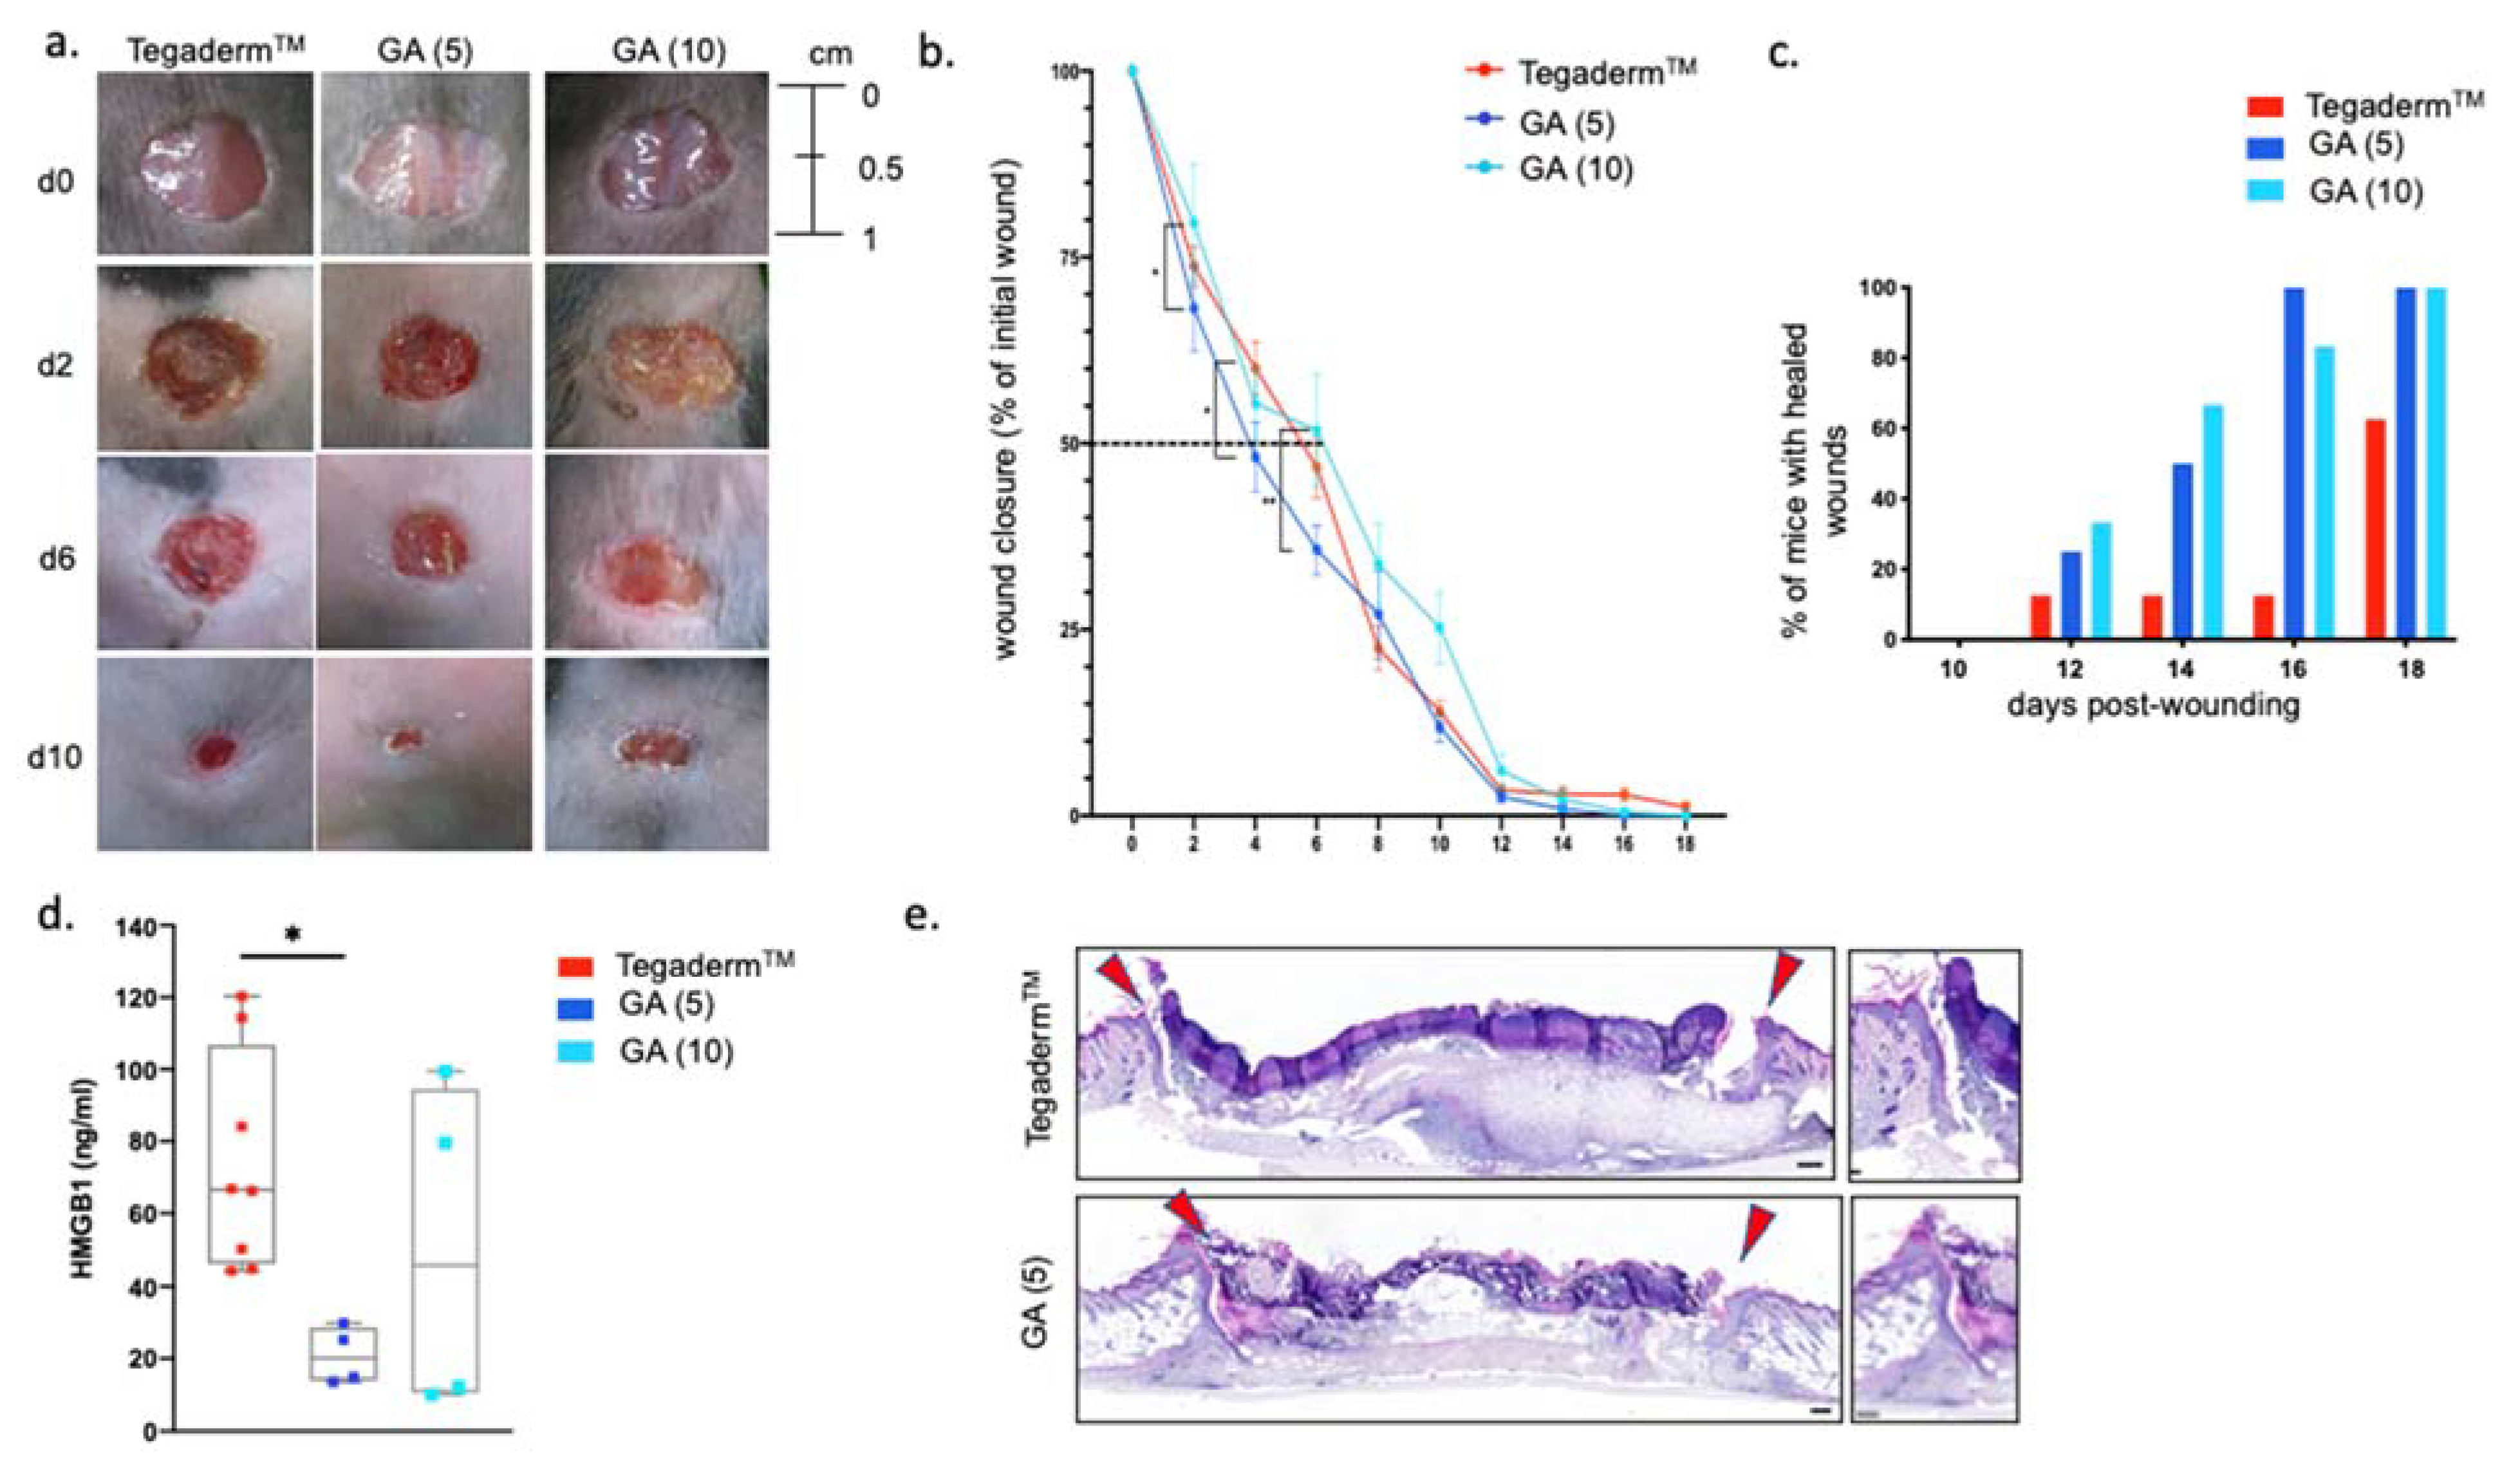
3. Results and Discussion
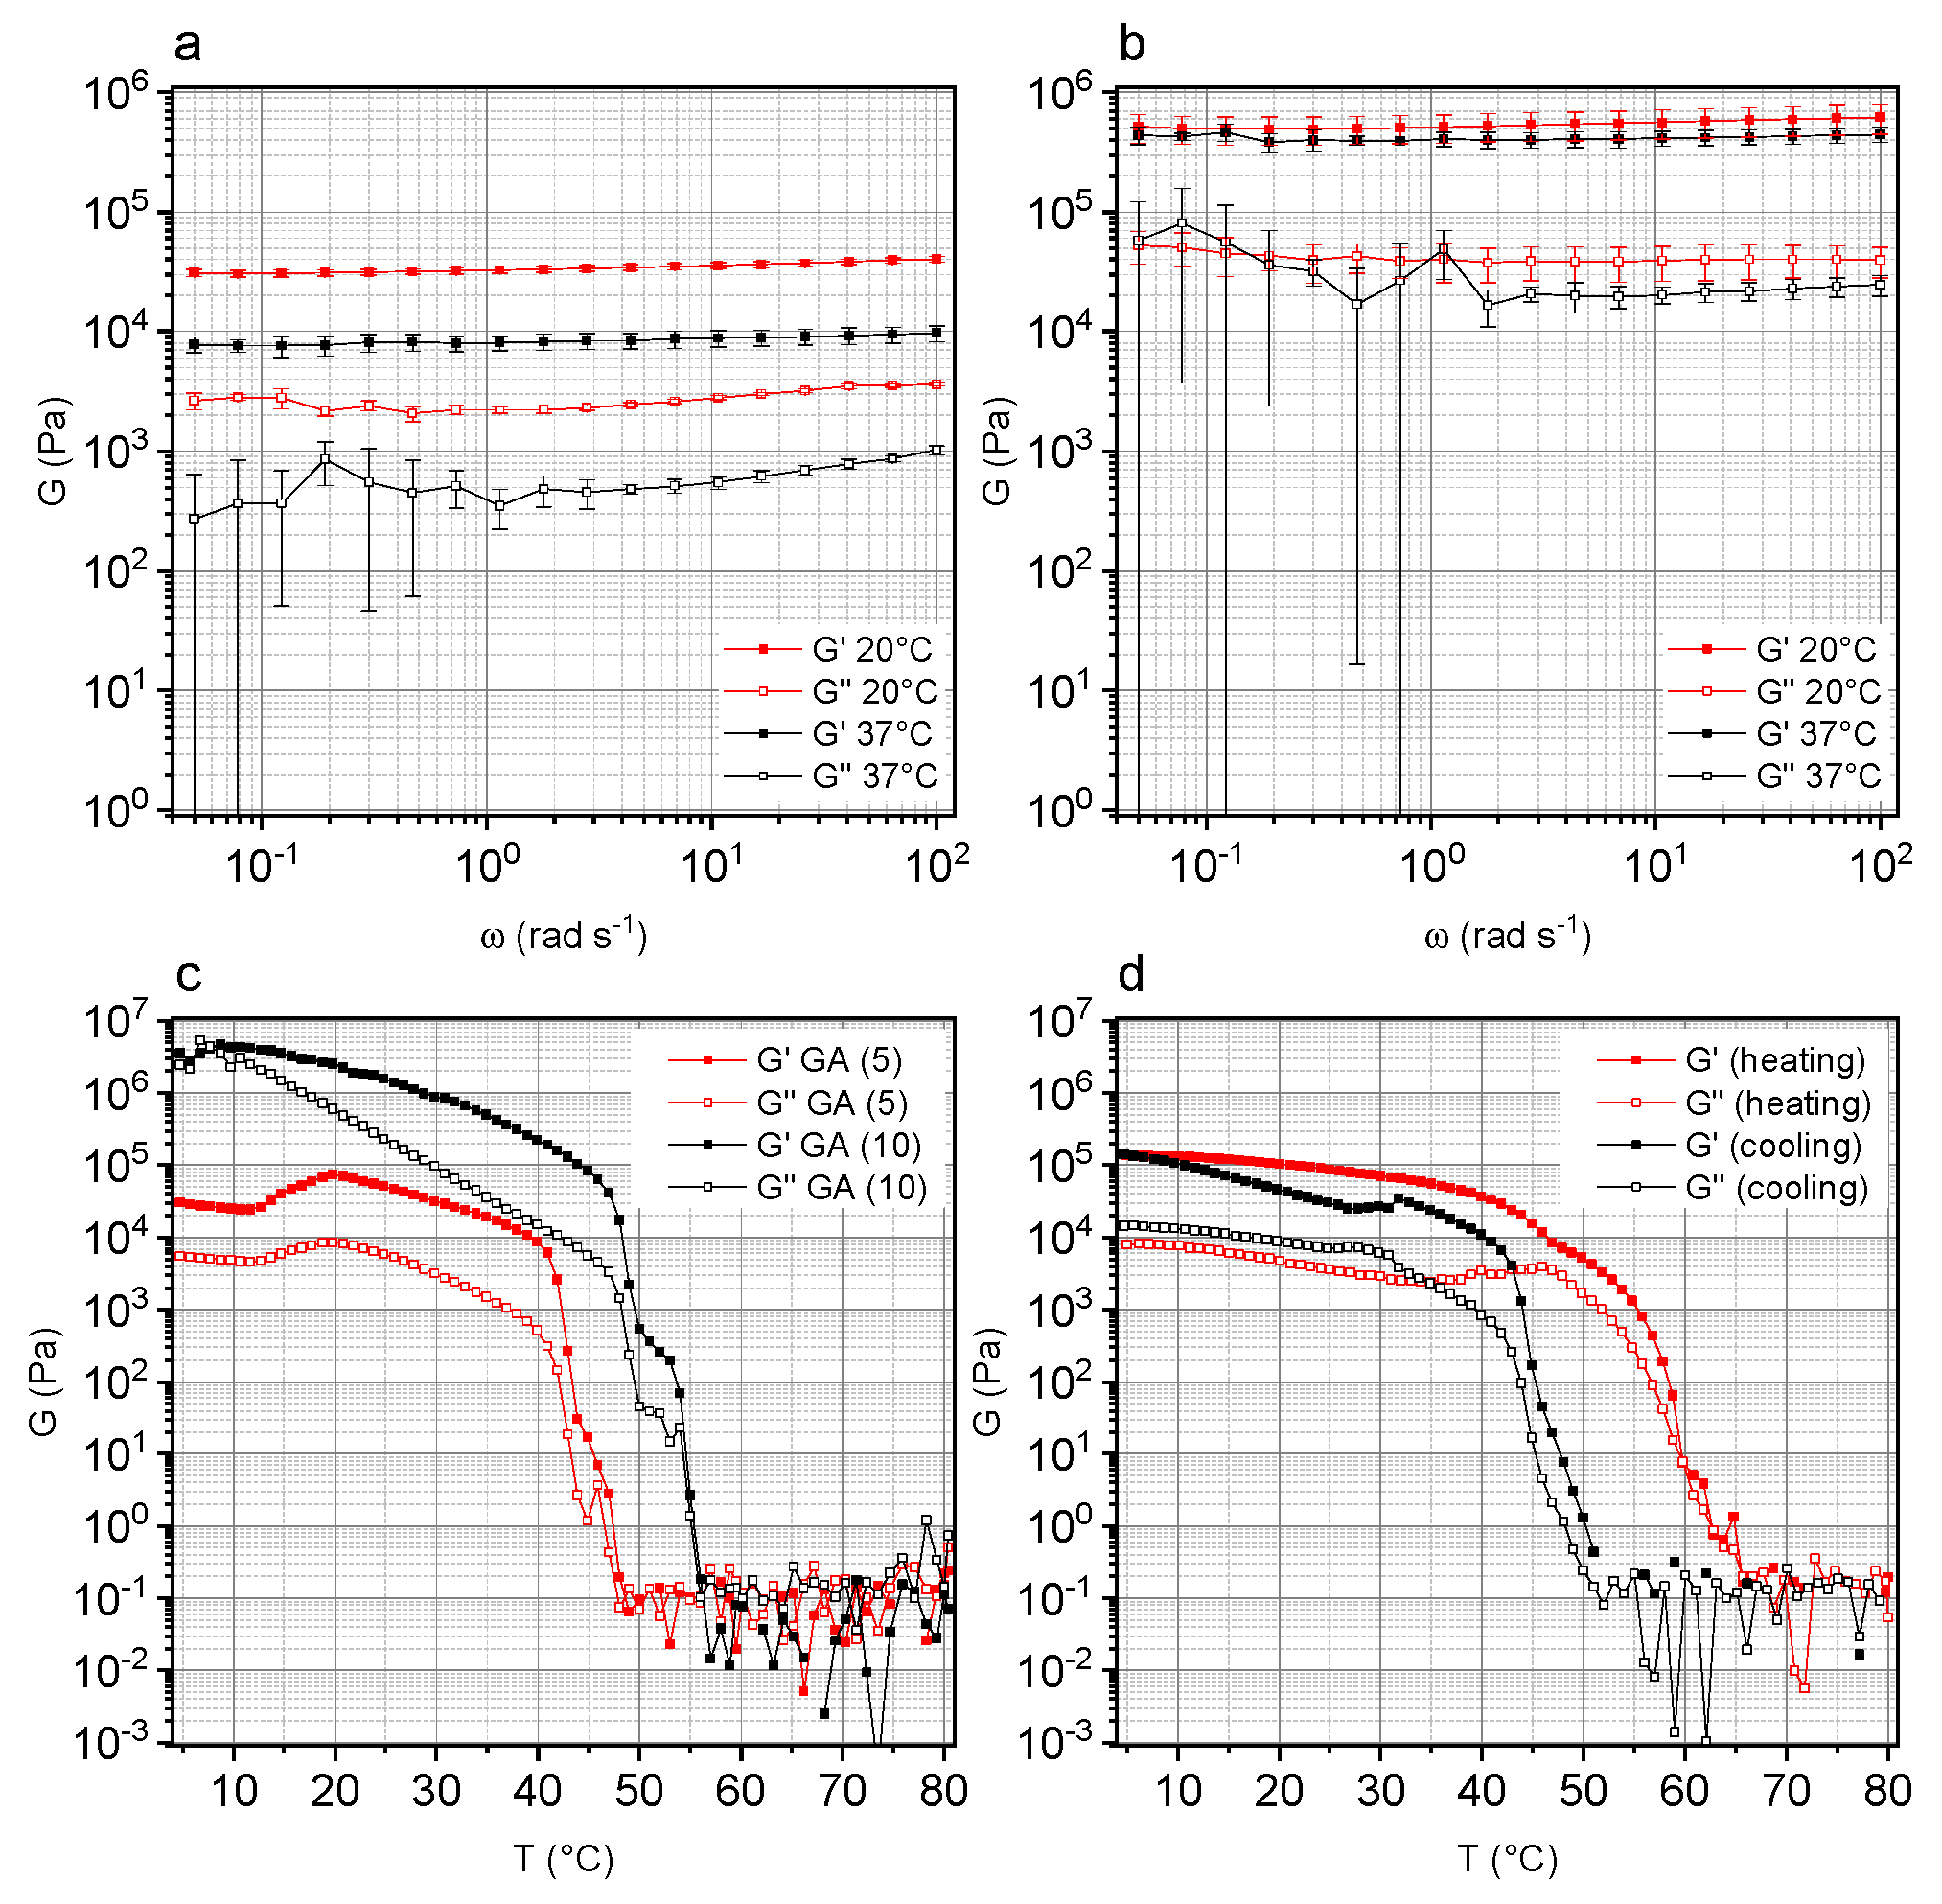
3.1. Rheological Properties of GA-Based Hydrogels as a Function of GA Concentration
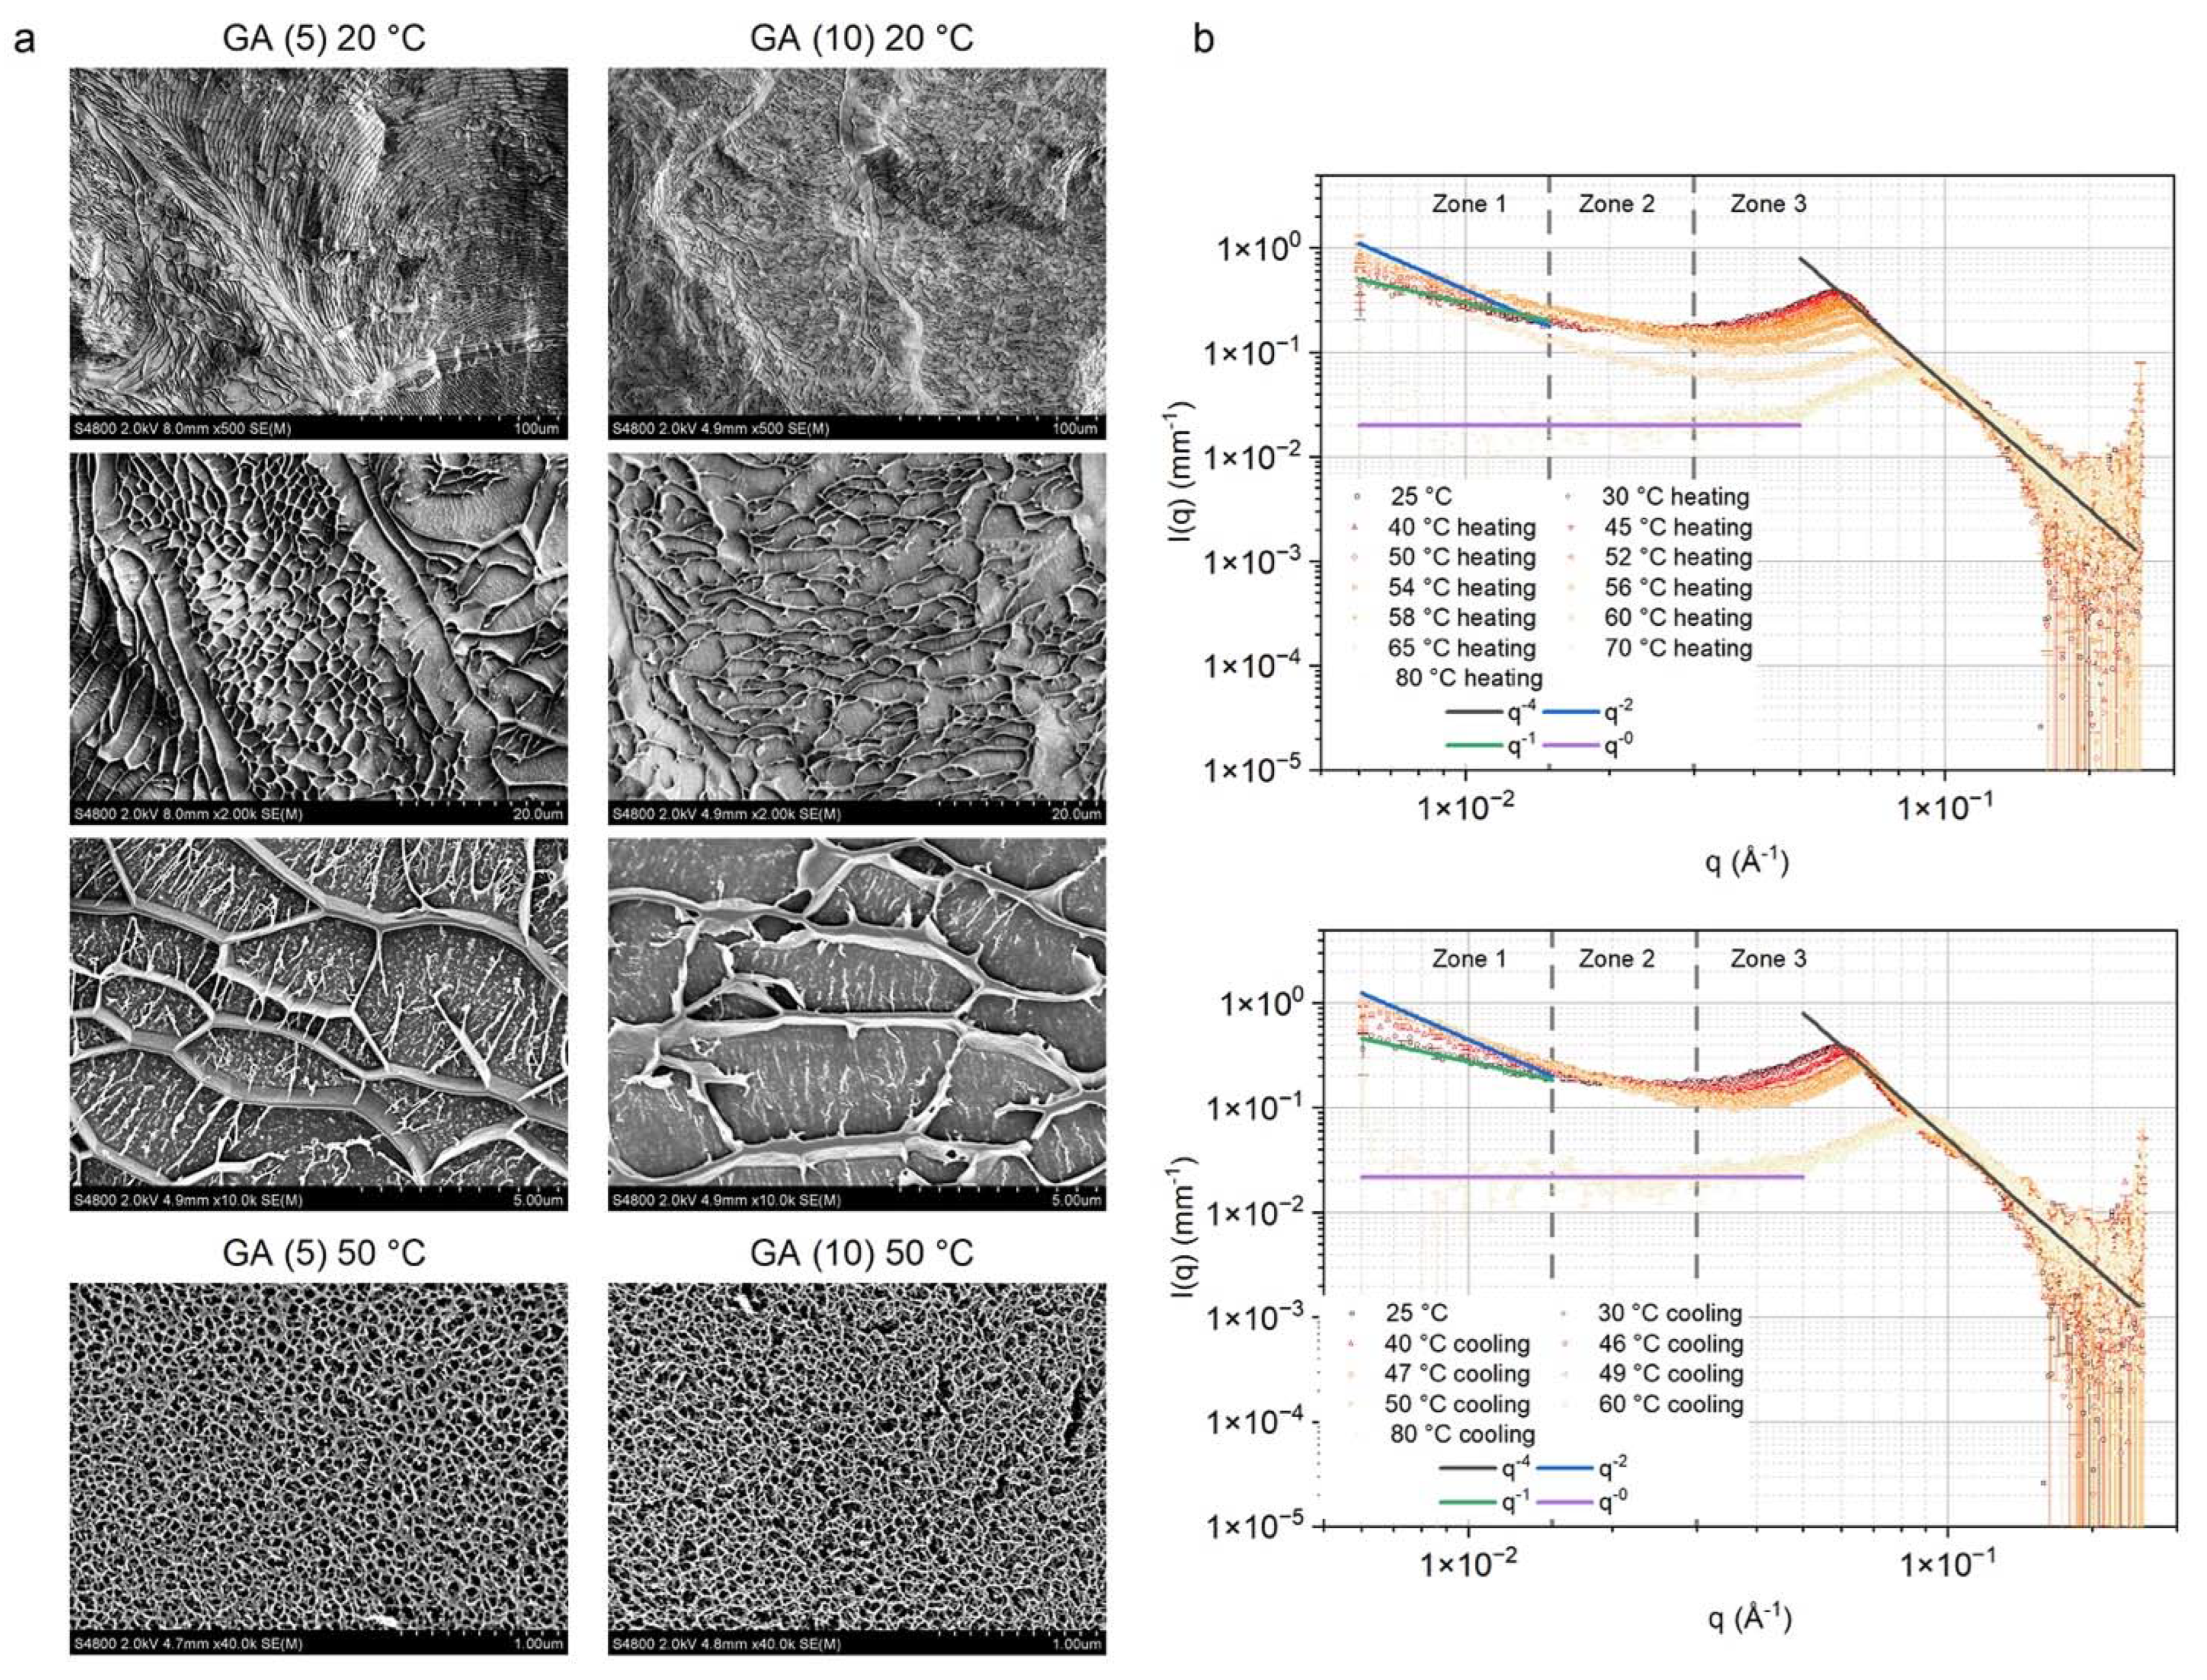
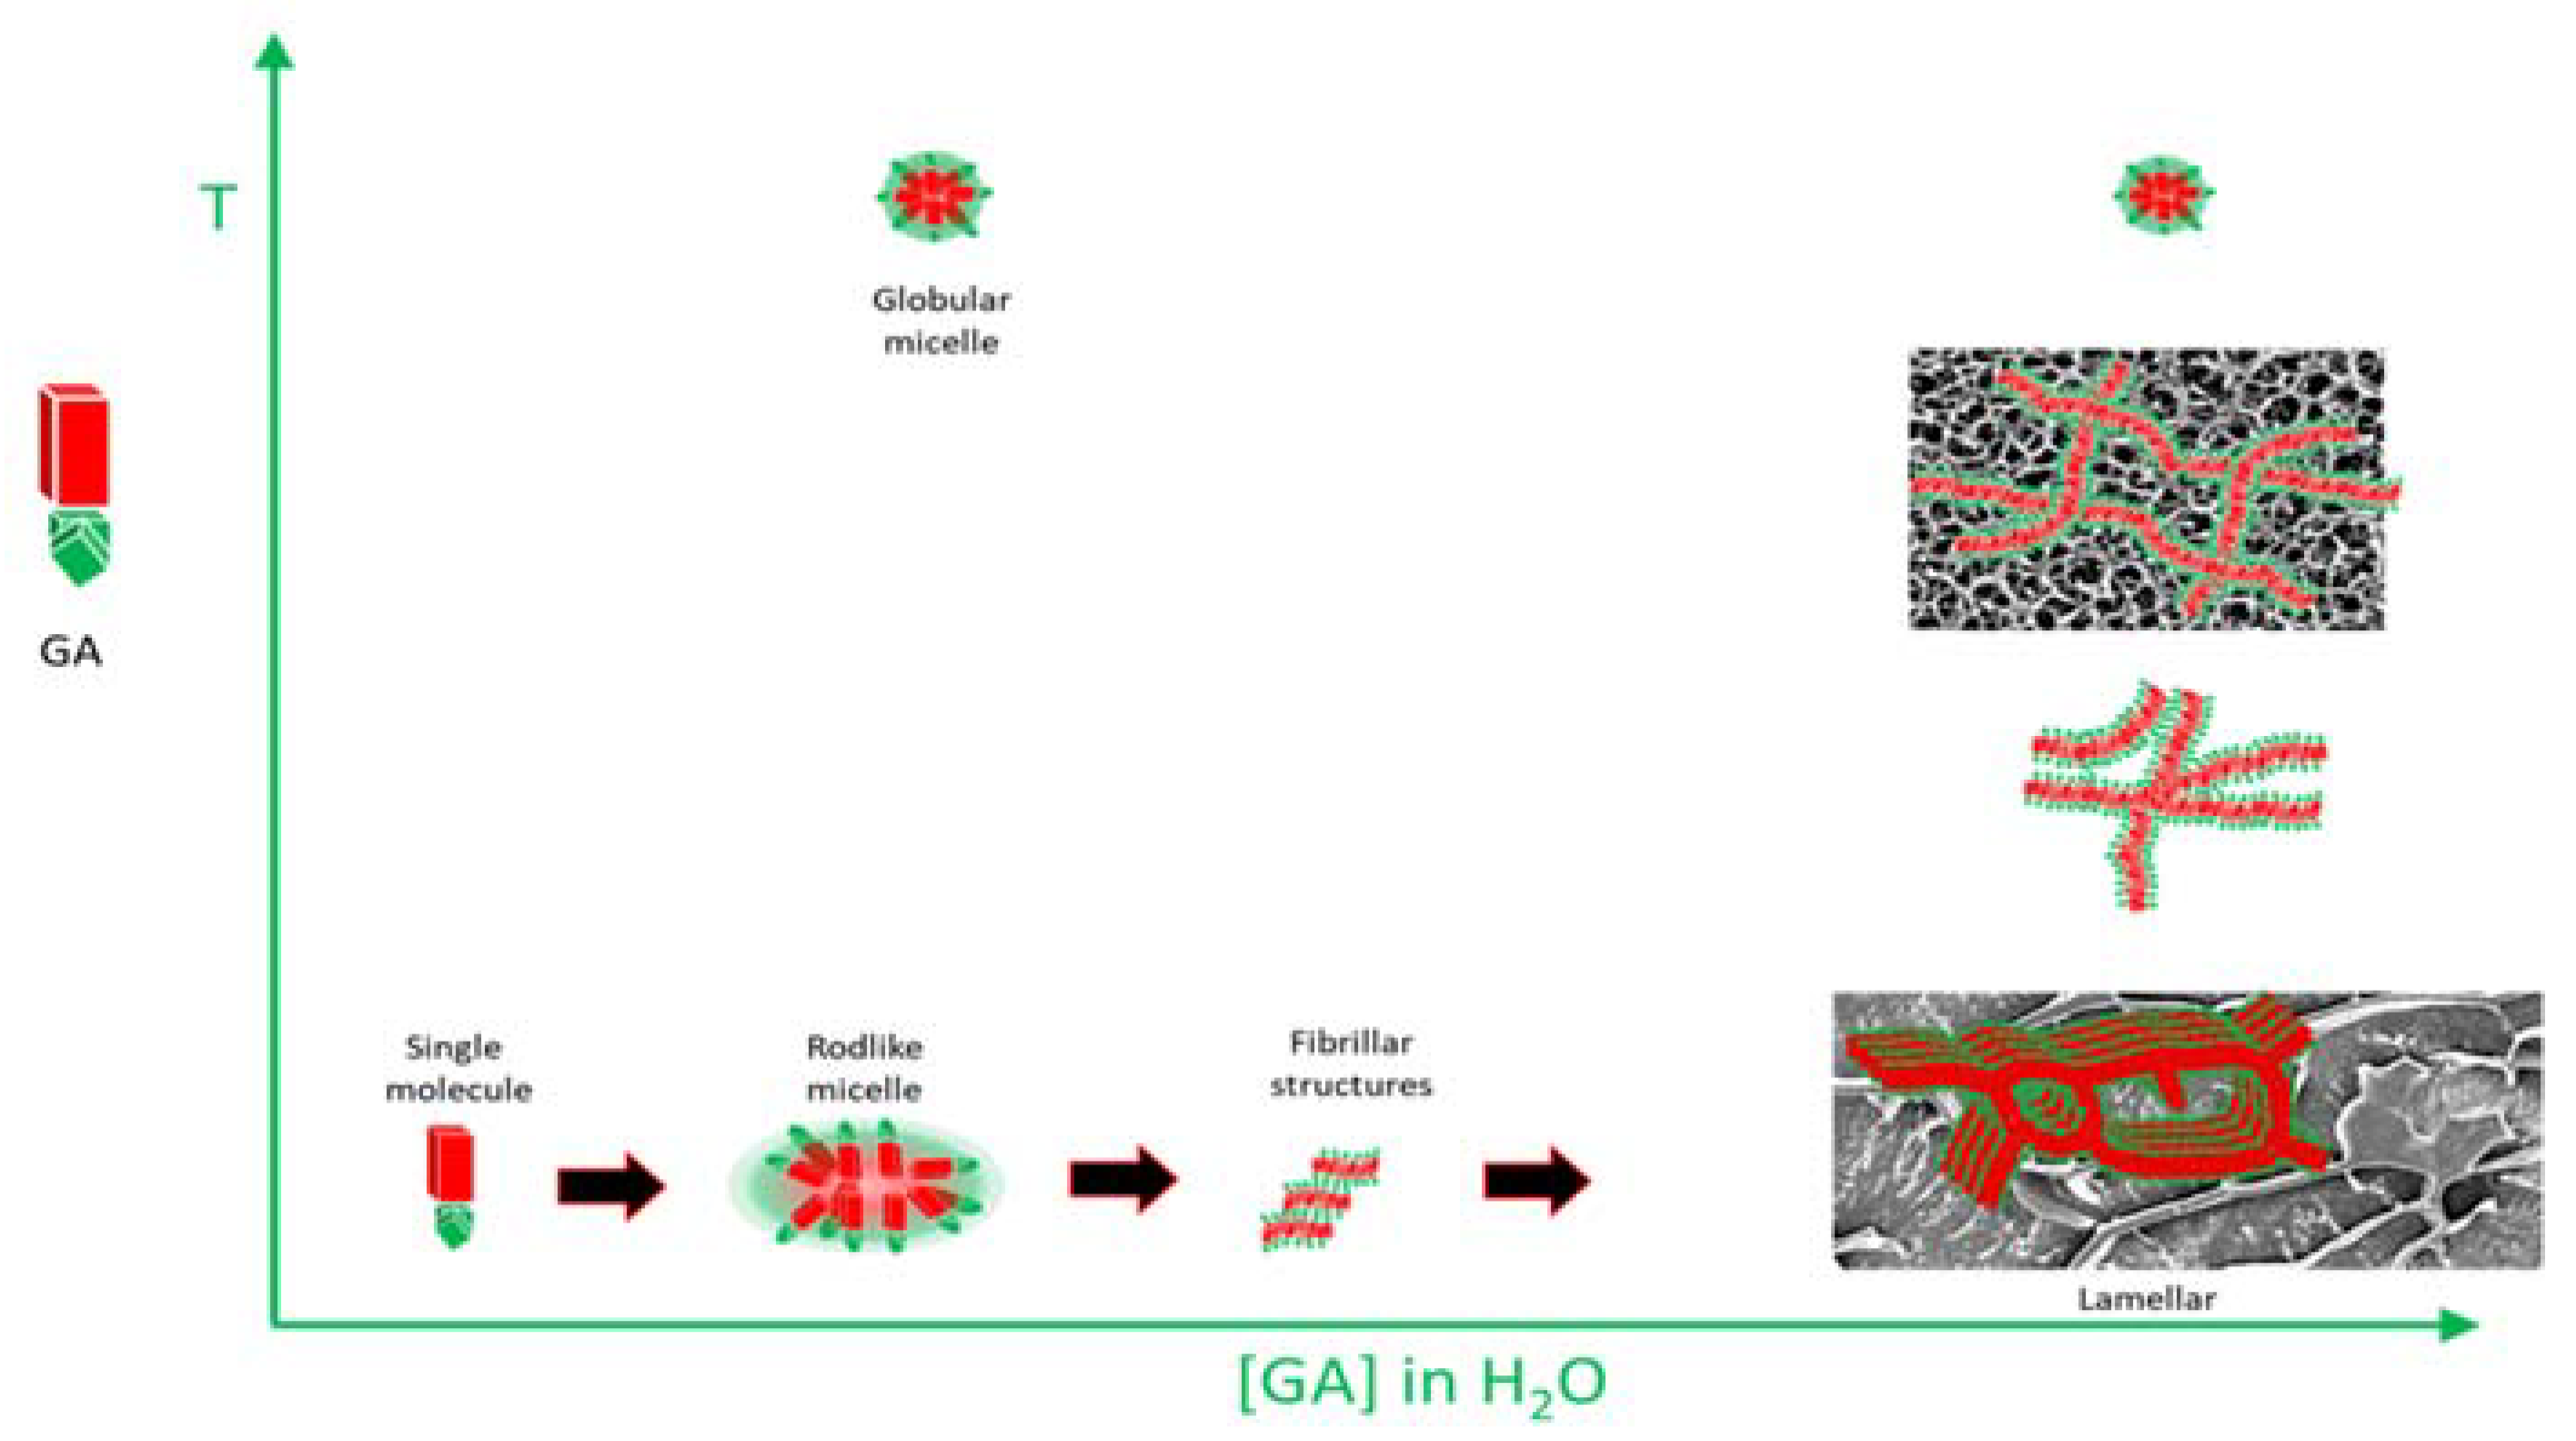
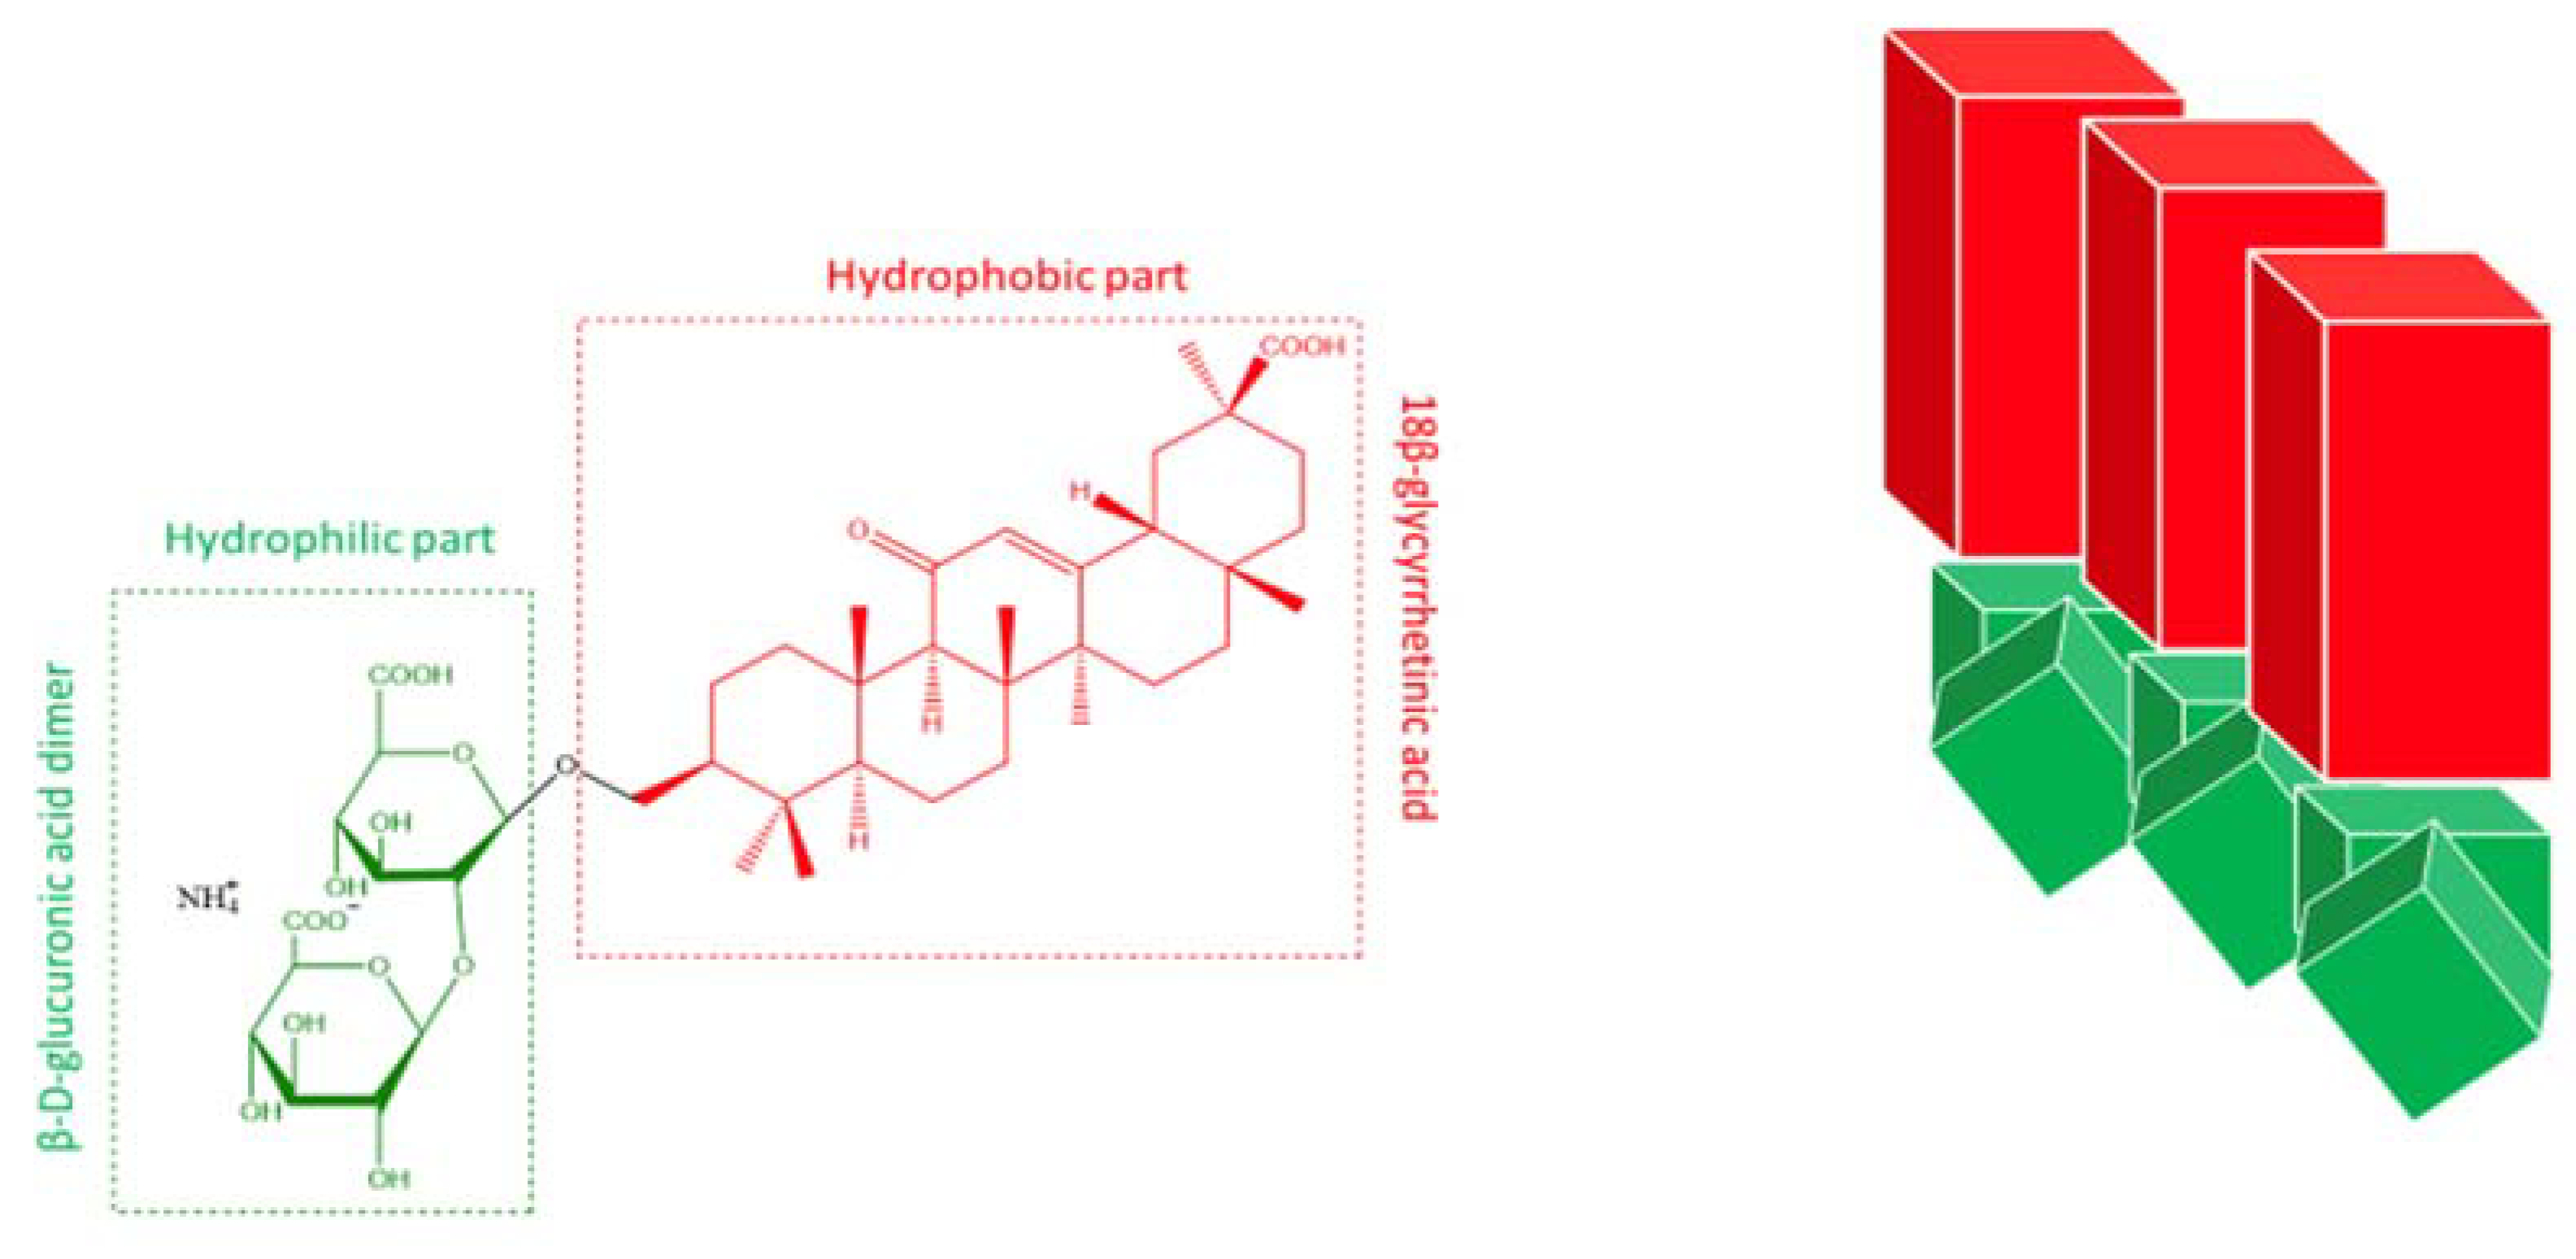
3.2. Structural study
3.3. GA-Based Hydrogels Accelerate Wound Closure of Murine Skin Wounds in Normoglycemic and Diabetic Conditions
4. Conclusions
Supplementary Materials
Author Contributions
Funding
Institutional Review Board Statement
Data Availability Statement
Acknowledgments
Conflicts of Interest
References
- Dekoninck, S.; Blanpain, C. Stem cell dynamics, migration and plasticity during wound healing. Nat. Cell Biol. 2019, 21, 18–24. [Google Scholar] [CrossRef] [PubMed]
- Boateng, J.S.; Matthews, K.H.; Stevens, H.N.; Eccleston, G.M. Wound healing dressings and drug delivery systems: A review. Pharm. Sci. 2008, 97, 2892–2923. [Google Scholar] [CrossRef]
- Darwin, E.; Tomic-Canic, M. He5. aling Chronic Wounds: Current Challenges and Potential Solutions. Curr. Dermatol. Rep. 2018, 7, 296–302. [Google Scholar] [CrossRef] [PubMed]
- Sen, C.K. Human Wound and Its Burden: Updated 2020 Compendium of Estimates. Adv. Wound Care (New Rochelle) 2021, 10, 281–292. [Google Scholar] [CrossRef] [PubMed]
- Gupta, S.; Andersen, C.; Black, J.; de Leon, J.; Fife, C.; Ii, J.C.L.; Niezgoda, J.; Snyder, R.; Sumpio, B.; Tettelbach, W.; et al. Management of Chronic Wounds: Diagnosis, Preparation, Treatment, and Follow-up. Wounds 2017, 29, S19–S36. [Google Scholar]
- Moura, L.I.F.; Dias, A.M.A.; Carvalho, E.; de Sousa, H.C. Recent advances on the development of wound dressings for diabetic foot ulcer treatment--A review. Acta Biomater. 2013, 9, 7093–7114. [Google Scholar] [CrossRef]
- Wong, S.L.; Demers, M.; Martinod, K.; Gallant, M.; Wang, Y.; Goldfine, A.B.; Kahn, C.R.; Wagner, D.D. Diabetes primes neutrophils to undergo NETosis, which impairs wound healing. Nat. Med. 2015, 21, 815–819. [Google Scholar] [CrossRef]
- Brinkmann, V.; Reichard, U.; Goosmann, C.; Fauler, B.; Uhlemann, Y.; Weiss, D.S.; Weinrauch, Y.; Zychlinsky, A. Neutrophil extracellular traps kill bacteria. Science 2004, 303, 1532–1535. [Google Scholar] [CrossRef]
- Hoste, E.; Maueröder, C.; van Hove, L.; Catrysse, L.; Vikkula, H.-K.; Sze, M.; Maes, B.; Karjosukarso, D.; Martens, L.; Gonçalves, A.; et al. Epithelial HMGB1 Delays Skin Wound Healing and Drives Tumor Initiation by Priming Neutrophils for NET Formation. Cell Rep. 2019, 29, 2689–2701.e4. [Google Scholar] [CrossRef]
- Scaffidi, P.; Misteli, T.; Bianchi, M.E. Release of chromatin protein HMGB1 by necrotic cells triggers inflammation. Nature 2002, 418, 191–195. [Google Scholar] [CrossRef]
- Straino, S.; di Carlo, A.; Mangoni, A.; de Mori, R.; Guerra, L.; Maurelli, R.; Panacchia, L.; di Giacomo, F.; Palumbo, R.; di Campli, C.; et al. High-mobility group box 1 protein in human and murine skin: Involvement in wound healing. Investig. Dermatol. 2008, 128, 1545–1553. [Google Scholar] [CrossRef] [PubMed]
- Hoste, E.; Arwert, E.N.; Lal, R.; South, A.P.; Salas-Alanis, J.C.; Murrell, D.F.; Donati, G.; Watt, F.M. Innate sensing of microbial products promotes wound-induced skin cancer. Nat. Commun. 2015, 6, 5932. [Google Scholar] [CrossRef] [PubMed]
- Ramaswami, S.; Behrendt, J.; Gulyas, H.; Otterpohl, R. Pretreatment of Wastewater from Licorice Processing-A Preliminary Evaluation Water Environ. Res. 2016, 88, 2032–2039. [Google Scholar]
- Conidi, C.; Fucà, L.; Drioli, E.; Cassano, A. A Membrane-Based Process for the Recovery of Glycyrrhizin and Phenolic Compounds from Licorice Wastewaters. Molecules 2019, 24, 2279. [Google Scholar] [CrossRef] [PubMed]
- Colvin, D.M. A review on comparison of the extraction methods used in licorice root: Their principle, strength and limitation. Med. Aromat. Plants 2018, 7, 1–4. [Google Scholar] [CrossRef]
- Omar, H.R.; Komarova, I.; Abdelmalak, H.D.; Yerramadha, M.R.; Ali, Y.; Ghonemi, M.; Rashad, R.; Fathy, A.; Helal, E.; Camporesi, E.M. Licorice abuse: Time to send a warning message. Ther. Adv. Endocrinol. Metab. 2012, 3, 125–138. [Google Scholar] [CrossRef]
- Nazari, S.; Rameshrad, M.; Hosseinzadeh, H. Toxicological Effects of Glycyrrhiza glabra (Licorice): A Review Phytother. Res. 2017, 31, 1635–1650. [Google Scholar]
- 18. Cosmetic Ingredient Review Expert Panel. Final report on the safety assessment of Glycyrrhetinic Acid, Potassium Glycyrrhetinate, Disodium Succinoyl Glycyrrhetinate, Glyceryl Glycyrrhetinate, Glycyrrhetinyl Stearate, Stearyl Glycyrrhetinate, Glycyrrhizic Acid, Ammonium Glycyrrhizate, Dipotassium Glycyrrhizate, Disodium Glycyrrhizate, Trisodium Glycyrrhizate, Methyl Glycyrrhizate, and Potassium Glycyrrhizinate. Int. J. Toxicol. 2007, 26 (Suppl. S2), 79–112.
- Mollica, L.; de Marchis, F.; Spitaleri, A.; Dallacosta, C.; Pennacchini, D.; Zamai, M.; Agresti, A.; Trisciuoglio, L.; Musco, G.; Bianchi, M.E. Glycyrrhizin binds to high-mobility group box 1 protein and inhibits its cytokine activities. Chem. Biol. 2007, 431–441. [Google Scholar] [CrossRef]
- Hoever, G.; Baltina, L.; Michaelis, M.; Kondratenko, R.; Baltina, L.; Tolstikov, G.A.; Doerr, H.W.; Cinatl, J.J. Antiviral activity of glycyrrhizic acid derivatives against SARS-coronavirus. Med. Chem. 2005, 48, 1256–1259. [Google Scholar] [CrossRef]
- Ashfaq, U.; Masoud, M.; Nawaz, Z.; Riazussin, S.J. Glycyrrhizin as antiviral agent against Hepatitis C Virus. Transl. Med. 2011, 9, 112. [Google Scholar] [CrossRef] [PubMed]
- Hirabayashi, K.; Iwata, S.; Matsumoto, H.; Mori, T.; Shigeta, S.; Ito, M.; Baba, M. Antiviral activities of glycyrrhizin and its modified compounds against human immunodeficiency virus type 1 (HIV-1) and herpes simplex virus type 1 (HSV-1) in vitro. Chem. Pharm. Bull. 1991, 39, 112–115. [Google Scholar] [CrossRef] [PubMed]
- Wolkerstorfer, A.; Kurz, H.; Bachhofner, N.; Szolar, O.H.J. Glycyrrhizin inhibits influenza A virus uptake into the cell. Antivir. Res. 2009, 83, 171–178. [Google Scholar] [CrossRef] [PubMed]
- Sato, K.S.; Goto, W.; Yamamura, J.; Kurokawa, M.; Kageyama, S.; Takahara, T.; Watanabe, A.; Shiraki, K. Therapeutic basis of glycyrrhizin on chronic hepatitis B. Antivir. Res. 1996, 30, 171–177. [Google Scholar] [CrossRef] [PubMed]
- Sela, M.N.; Steinberg, D.; Segal, R. Inhibition of the activity of glucosyltransferase from Streptococcus mutans by glycyrrhizin. Oral Microbiol. Immunol. 1987, 2, 125–128. [Google Scholar] [CrossRef]
- Segal, R.; Pisanty, S.; Wormser, R.; Azaz, E.; Sela, M.N. Anticariogenic activity of licorice and glycyrrhizine I: Inhibition of in vitro plaque formation by Streptococcus mutans. J. Pharm. Sci. 1985, 74, 79–81. [Google Scholar] [CrossRef]
- Peng, X.; Ekanayaka, S.A.; McClellan, S.A.; Barrett, R.P.; Vistisen, K.; Hazlett, L.D. Characterization of Three Ocular Clinical Isolates of P. aeruginosa: Viability, Biofilm Formation, Adherence, Infectivity, and Effects of Glycyrrhizin. Pathogens 2017, 6, 52. [Google Scholar] [CrossRef]
- Rohinishree, Y.S.; Negi, P.S. Effect of licorice extract on cell viability, biofilm formation and exotoxin production by Staphylococcus aureus. J. Food Sci. Technol. 2016, 53, 1092–1100. [Google Scholar] [CrossRef]
- Hazlett, L.D.; Ekanayaka, S.A.; McClellan, S.A.; Francis, R. Glycyrrhizin Use for Multi-Drug Resistant Pseudomonas aeruginosa: In Vitro and In Vivo Studies. Investig. Opthalmology Vis. Sci. 2019, 60, 2978. [Google Scholar] [CrossRef]
- Ekanayaka, S.A.; McClellan, S.A.; Barrett, R.P.; Hazlett, L.D. Topical Glycyrrhizin Is Therapeutic for Pseudomonas aeruginosa Keratitis. J. Ocul. Pharmacol. Ther. 2018, 34, 239–249. [Google Scholar] [CrossRef]
- Ekanayaka, S.A.; McClellan, S.A.; Barrett, R.P.; Kharotia, S.; Hazlett, L.D. Glycyrrhizin Reduces HMGB1 and Bacterial Load in Pseudomonas aeruginosa Keratitis. Investig. Opthalmology Vis. Sci. 2016, 57, 5799. [Google Scholar] [CrossRef] [PubMed]
- Somayajulu, M.; McClellan, S.A.; Pitchaikannu, A.; Bessert, D.; Liu, L.; Steinle, J.; Hazlett, L.D. Effects of Glycyrrhizin Treatment on Diabetic Cornea. J. Ocul. Pharmacol. Ther. 2021, 37, 12–23. [Google Scholar] [CrossRef] [PubMed]
- Zhao, X.; Zhang, H.; Gao, Y.; Lin, Y.; Hu, J. A Simple Injectable Moldable Hydrogel Assembled from Natural Glycyrrhizic Acid with Inherent Antibacterial Activity. ACS Appl. Bio. Mater. 2020, 3, 648–653. [Google Scholar] [CrossRef] [PubMed]
- Vitali, R.; Palone, F.; Cucchiara, S.; Negroni, A.; Cavone, L.; Costanzo, M.; Aloi, M.; Dilillo, A.; Stronati, L. Dipotassium Glycyrrhizate Inhibits HMGB1-Dependent Inflammation and Ameliorates Colitis in Mice. PLoS ONE 2013, 8. [Google Scholar] [CrossRef] [PubMed]
- Yamashita, T.; Asano, Y.; Taniguchi, T.; Nakamura, K.; Saigusa, R.; Miura, S.; Toyama, T.; Takahashi, T.; Ichimura, Y.; Yoshizaki, A.; et al. Glycyrrhizin Ameliorates Fibrosis, Vasculopathy, and Inflammation in Animal Models of Systemic Sclerosis. Investig. Dermatol. 2017, 137, 631–640. [Google Scholar] [CrossRef] [PubMed]
- Vitali, R.; Palone, F.; Pierdomenico, M.; Negroni, A.; Cucchiara, S.; Aloi, M.; Oliva, S.; Stronati, L. Dipotassium glycyrrhizate via HMGB1 or AMPK signaling suppresses oxidative stress during intestinal inflammation. Biochem. Pharmacol. 2015, 97, 292–299. [Google Scholar] [CrossRef]
- Kao, T.C.; Shyu, M.H.; Yen, G.C. Glycyrrhizic acid and 18beta-glycyrrhetinic acid inhibit inflammation via PI3K/Akt/GSK3beta signaling and glucocorticoid receptor activation. J. Agric. Food Chem. 2010, 58, 8623–8629. [Google Scholar] [CrossRef]
- Luo, P.; Liu, D.; Li, J. Pharmacological perspective: Glycyrrhizin may be an efficacious therapeutic agent for COVID-19. Int. J. Antimicrob. Agents 2020, 55, 105995. [Google Scholar] [CrossRef]
- Azaz, E.; Segal, R. Glycyrrizin as gelling agent. Pharm.Acta Helv 1980, 55, 183–186. [Google Scholar]
- Yoshioka, H.; Honda, K.; Kondo, M.J. Spin probe study of the aqueous solutions of α- and β-glycyrrhizins. Colloid Interface Sci. 1983, 93, 540–544. [Google Scholar] [CrossRef]
- Yoshioka, H.J. Kinetics of the gel-sol transition of the aqueous solutions of β-glycyrrhizin studied by the temperature jump-spin probe method. Colloid Interface Sci. 1985, 105, 65–72. [Google Scholar] [CrossRef]
- Saha, A.; Adamcik, J.; Bolisetty, S.; Handschin, S.; Mezzenga, R. Fibrillar networks of glycyrrhizic acid for hybrid nanomaterials with catalytic features. Angew. Chem. 2015, 127, 5498–5502. [Google Scholar] [CrossRef]
- Qian, Y.; Zheng, Y.; Jin, J.; Wu, X.; Xu, K.; Dai, M.; Niu, Q.; Zheng, H.; He, X.; Shen, J. Immunoregulation in Diabetic Wound Repair with a Photoenhanced Glycyrrhizic Acid Hydrogel Scaffold. Adv. Mater. 2022, 2200521. [Google Scholar] [CrossRef]
- Aswathy, S.H.; Narendrakumar, U.; Manjubala, I. Commercial hydrogels for biomedical applications. Heliyon 2020, 6, e03719. [Google Scholar] [CrossRef] [PubMed]
- Gibaud, T.; Frelat, D.; Manneville, S. Heterogeneous yielding dynamics in a colloidal gel. Soft Matter 2010, 6, 3482–3488. [Google Scholar] [CrossRef]
- Bonn, D.; Kellay, H.; Prochnow, M.; Ben-Djemiaa, K.; Meunier, J. Delayed fracture of an inhomogeneous soft solid. Science 1998, 280, 265–267. [Google Scholar] [CrossRef] [PubMed]
- Hyun, K.; Kim, S.H.; Ahn, K.H.; Lee, S.J. Large Amplitude Oscillatory Shear as a Way to Classify the Complex Fluids. J. Non-Newton. Fluid Mech. 2002, 107, 51–65. [Google Scholar] [CrossRef]
- Ralla, T.; Salminen, H.; Braun, K.; Edelmann, M.; Dawid, C.; Hofmann, T.; Weiss, J. Investigations into the Structure-Function relationship of the naturally-derived surfactant glycyrrhzin: Emulsion stability. Food Biophys. 2020, 15, 288–296. [Google Scholar] [CrossRef]
- Koga, K.; Takekoshi, K.; Kawashima, S.; Taniguchi, M.; Murakami, M. Clove oil prevents glycyrrhizin gel formation in aqueous solution. Chem. Pharm. Bull. 2004, 52, 1507–1510. [Google Scholar] [CrossRef][Green Version]
- Tykarska, E.; Gdaniec, M. Toward better understanding of isomorphism of glycyrrhizic acid and its mono- and dibasic salts. Cryst. Growth Des. 2013, 13, 1301–1308. [Google Scholar] [CrossRef]
- Matsuoka, K.; Miyajima, R.; Ishida, Y.; Karasawa, S.; Yoshimura, T. Aggregate formation of glycyrrhizic acid. Colloids Surf. A Physicochem. Eng. Asp. 2016, 500, 112–117. [Google Scholar] [CrossRef]
- Tykarska, E.; Dutkiewicz, Z.; Baranowski, D.; Gdaniec, Z.; Gdaniec, M. Effect of neighbors on the conformational preferences of glycosidic linkages in glycyrrhizic acid and its mono- and dideprotonated forms: X-ray, NMR, and computational studies. Cryst. Growth Des. 2014, 14, 5871–5880. [Google Scholar] [CrossRef]
- Langer, D.; Wicher, B.; Szczołko, W.; Gdaniec, M.; Tykarska, E. Self-assembly modes of glycyrrhetinic acid esters in view of the crystal packing of triterpene molecules. Acta Crystallogr. Sect. B Struct. Sci. Cryst. Eng. Mater. 2016, 72, 584–592. [Google Scholar] [CrossRef] [PubMed]
- Petrova, S.S.; Schlotgauer, A.A.; Kruppa, A.I.; Leshina, T.V. Self-association of glycyrrhizic acid. NMR study. Z. Fur Phys. Chem. 2017, 231, 839–855. [Google Scholar] [CrossRef]
- Chen, T.L.; Chen, S.H.; Tai, T.Y.; Chao, C.C.; Park, S.S.; Guengerich, E.P.; Ueng, T.H. Induction and Suppression of Renal and Hepatic Cytochrome P450-Dependent Monooxygenases by Acute and Chronic Streptozotocin Diabetes in Hamsters. Arch. Toxicol. 1996, 70, 202–208. [Google Scholar] [CrossRef]
- Michaels, J.; Churgin, S.S.; Blechman, K.M.; Greives, M.R.; Aarabi, S.; Galiano, R.D.; Gurtner, G.C. db/db mice exhibit severe wound-healing impairments compared with other murine diabetic strains in a silicone-splinted excisional wound model. Wound Repair Regen. 2007, 15, 665–670. [Google Scholar] [CrossRef]


Disclaimer/Publisher’s Note: The statements, opinions and data contained in all publications are solely those of the individual author(s) and contributor(s) and not of MDPI and/or the editor(s). MDPI and/or the editor(s) disclaim responsibility for any injury to people or property resulting from any ideas, methods, instructions or products referred to in the content. |
© 2022 by the authors. Licensee MDPI, Basel, Switzerland. This article is an open access article distributed under the terms and conditions of the Creative Commons Attribution (CC BY) license (https://creativecommons.org/licenses/by/4.0/).
Share and Cite
Mees, M.A.; Boone, F.; Bouwen, T.; Vanaerschot, F.; Titeca, C.; Vikkula, H.-K.; Catrysse, L.; Vananroye, A.; Koos, E.; Alexandris, S.; et al. Glycyrrhizin-Based Hydrogels Accelerate Wound Healing of Normoglycemic and Diabetic Mouse Skin. Pharmaceutics 2023, 15, 27. https://doi.org/10.3390/pharmaceutics15010027
Mees MA, Boone F, Bouwen T, Vanaerschot F, Titeca C, Vikkula H-K, Catrysse L, Vananroye A, Koos E, Alexandris S, et al. Glycyrrhizin-Based Hydrogels Accelerate Wound Healing of Normoglycemic and Diabetic Mouse Skin. Pharmaceutics. 2023; 15(1):27. https://doi.org/10.3390/pharmaceutics15010027
Chicago/Turabian StyleMees, Maarten A., Fleur Boone, Thomas Bouwen, Frederik Vanaerschot, Charlotte Titeca, Hanna-Kaisa Vikkula, Leen Catrysse, Anja Vananroye, Erin Koos, Stelios Alexandris, and et al. 2023. "Glycyrrhizin-Based Hydrogels Accelerate Wound Healing of Normoglycemic and Diabetic Mouse Skin" Pharmaceutics 15, no. 1: 27. https://doi.org/10.3390/pharmaceutics15010027
APA StyleMees, M. A., Boone, F., Bouwen, T., Vanaerschot, F., Titeca, C., Vikkula, H.-K., Catrysse, L., Vananroye, A., Koos, E., Alexandris, S., Rosenfeldt, S., Eyley, S., Koetz, J., van Loo, G., Thielemans, W., & Hoste, E. (2023). Glycyrrhizin-Based Hydrogels Accelerate Wound Healing of Normoglycemic and Diabetic Mouse Skin. Pharmaceutics, 15(1), 27. https://doi.org/10.3390/pharmaceutics15010027