3.1. Calorimetric Assessment of the Binary Phase Diagram
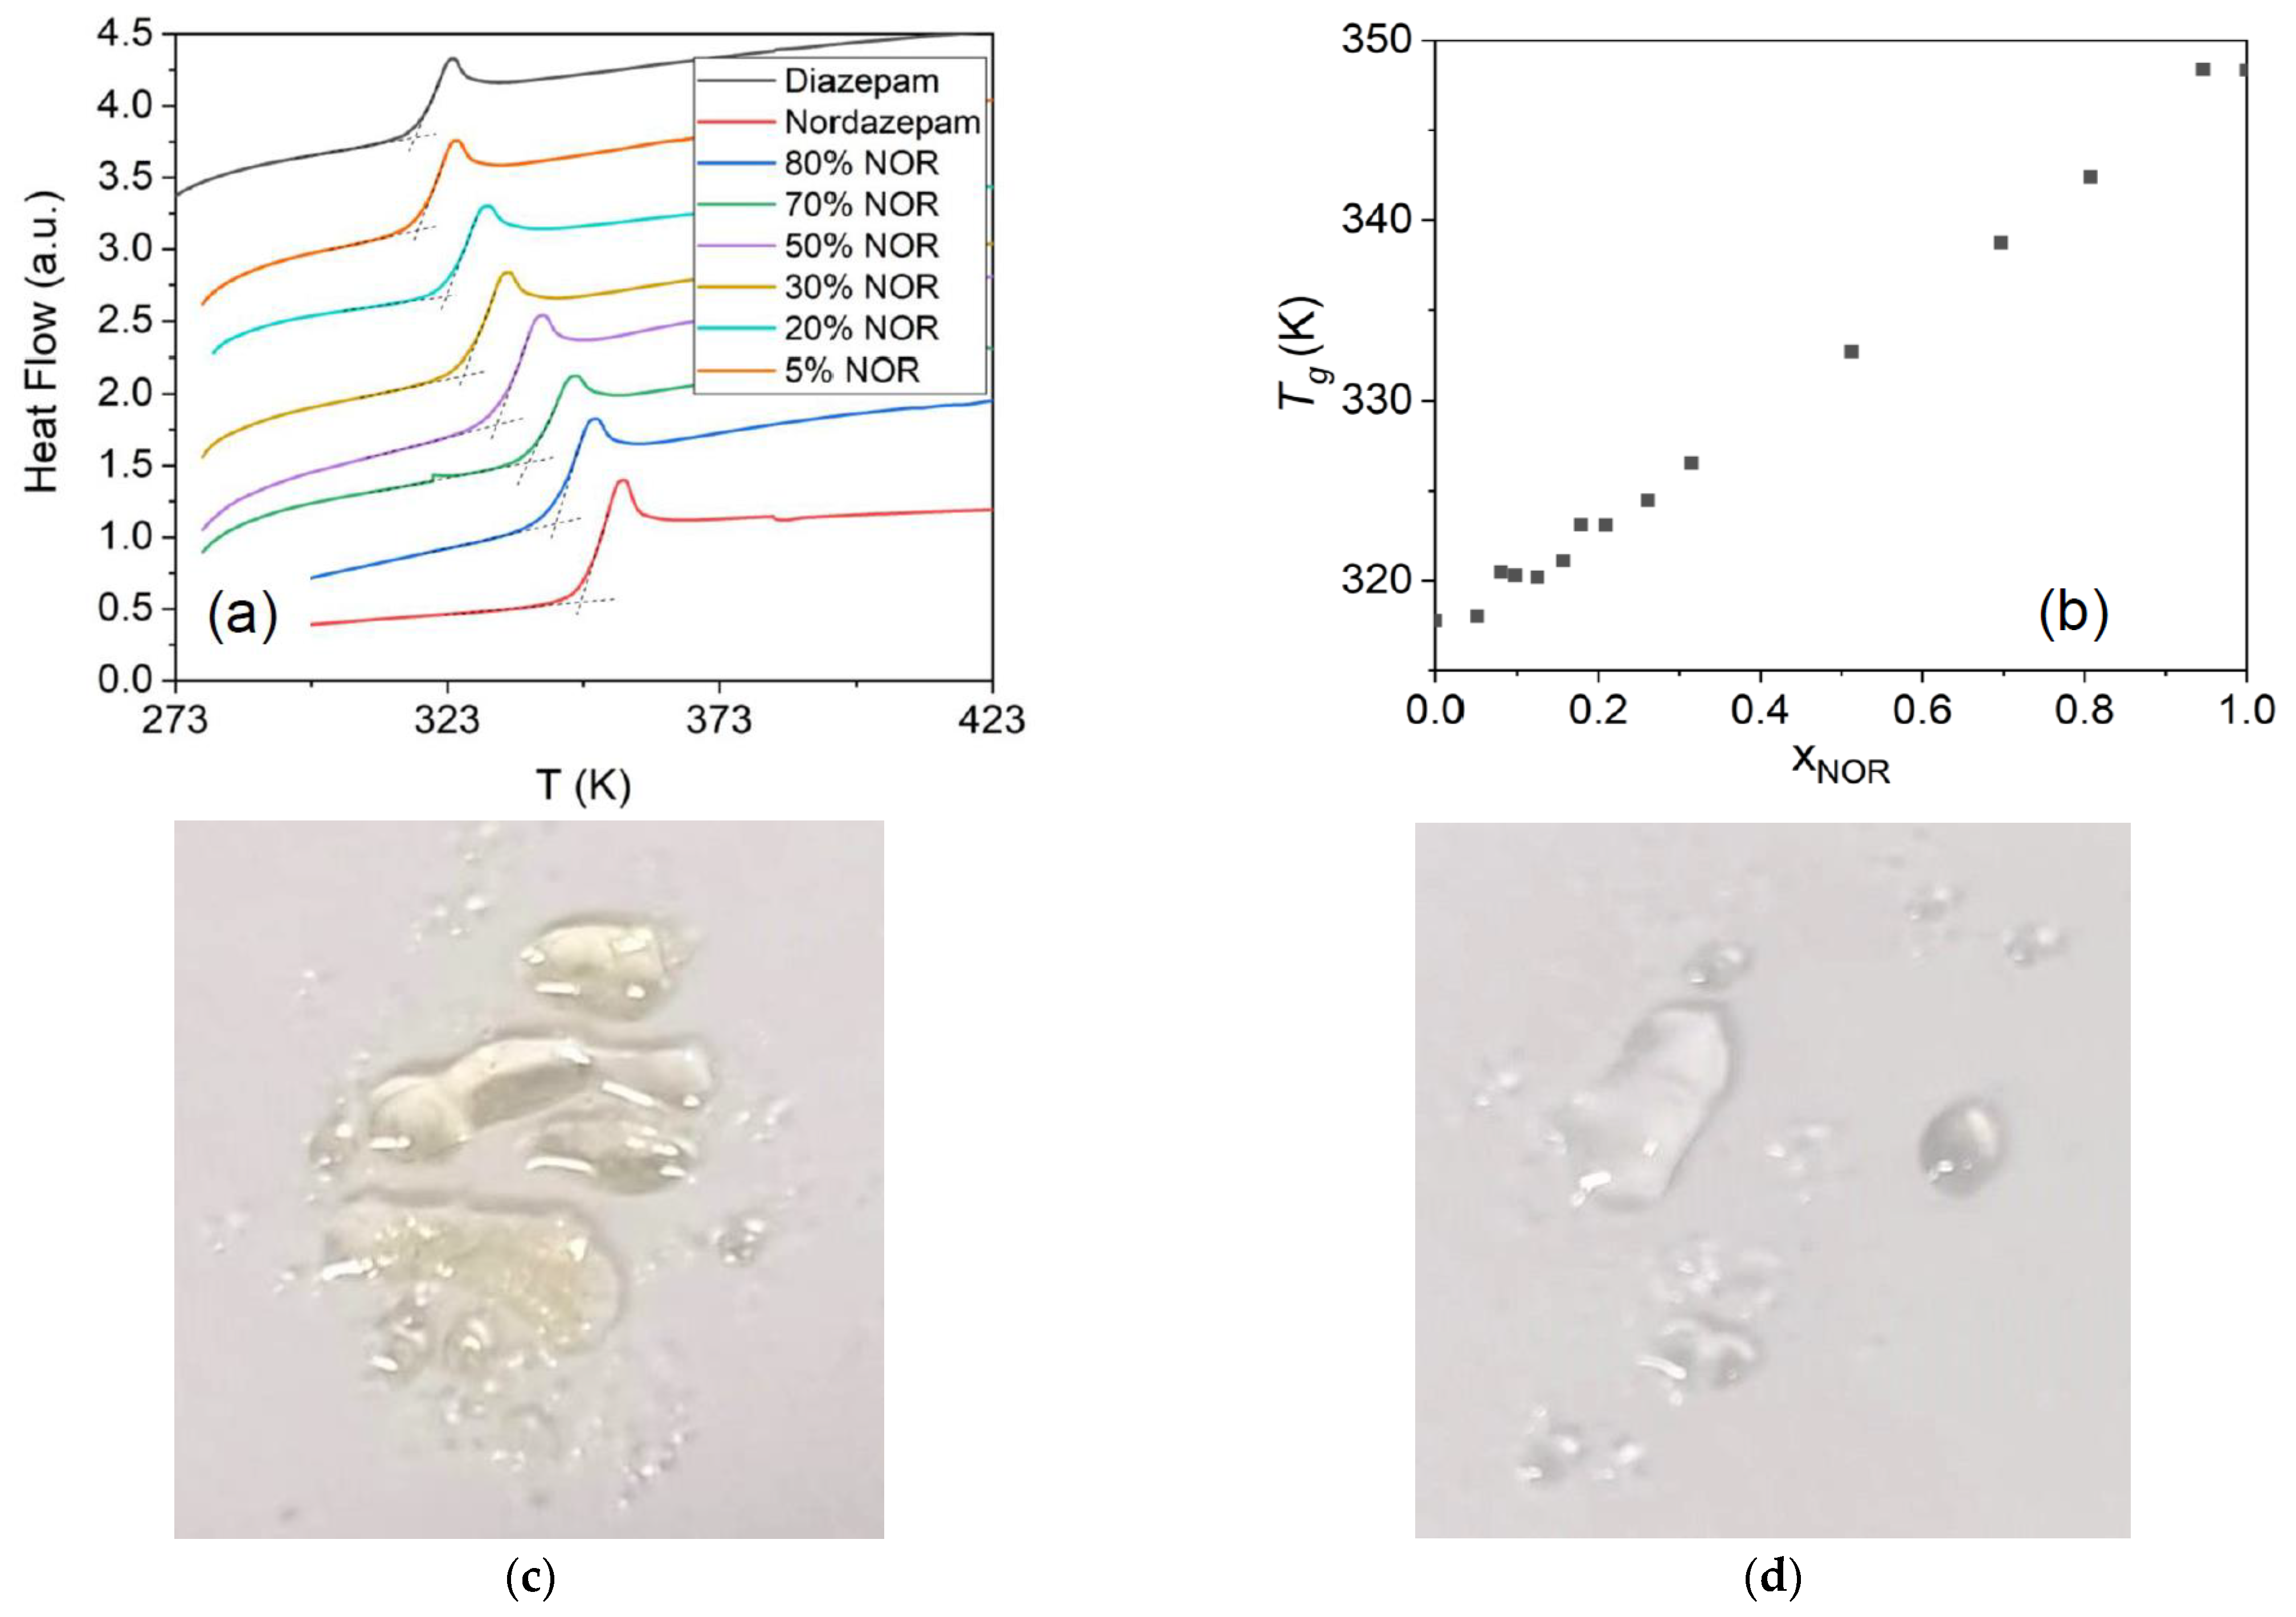
The result of the mechanical mixing process can be characterized by analyzing the DSC traces, a selection of which is shown in
Figure 1a. The full series of thermograms is available in the
Supplementary Material file,
Figures S1–S13. The bottom and top thermograms shown in
Figure 1a correspond, respectively, to pure crystalline nordazepam (hereafter, NOR), which displays a melting point at 487 K, and pure crystalline diazepam (hereafter DIA), which melts at 404 K. In most DSC traces of the mechanically obtained crystalline mixtures, two melting peaks are observed, namely the eutectic peak at lower temperature, corresponding to the melting of the eutectic crystalline mixture (see below), and the so-called liquidus peak at higher temperature, corresponding to the melting of the NOR- or DIA-rich solid phase.
The resulting equilibrium-phase diagram (see
Section 2 for technical details) is depicted in
Figure 1b, where both melting peaks are displayed as a function of concentration. The shape of the diagram is the typical one for eutectic mixtures of immiscible crystalline components, with the coexistence of solid and liquid phases between the eutectic line (common eutectic temperature, stars) and the liquidus line (final melting point, filled squares) [
22]. The first melting peak at lower temperature is, in fact, virtually independent of temperature and corresponds to the eutectic melting point. Averaging the melting onset for the different concentrations studied yields a eutectic point of
Te = 395.4 ± 1.2 K, which is lower than the melting temperatures of either of the pure solids. The liquidus line, with a final melting point that decreases as one moves away from the pure compounds, indicates the typical melting-point depression that occurs when impurities are added to a pure substance or when, as in this case, the entropic contribution to the free energy of the liquid mixture enlarges its temperature range of stability compared to the pure crystalline solids.
As visible in
Figure 1a, the eutectic composition has a single melting peak. In fact, the eutectic composition has the unique property that it remains unchanged also when the eutectic binary mixture is melted or crystallized (in contrast, the compositions of the two phases coexisting between the eutectic and liquidus line, especially the liquid phase, vary with temperature in the same interval).
We found no experimental evidence for a tendency of the two drugs to mix in the crystalline state. The two involved molecules differ by the substitution of a methyl group linked to a nitrogen atom of the diazepinic ring in DIA by a single hydrogen atom in NOR, thus forming a primary amine. As reported in a previous study by some of us, this modification leads to the presence of H-bond interactions in crystalline NOR (while they are fundamentally absent in DIA) and thus to a higher melting point in NOR and in significant differences between the two crystal structures [
23], thus rationalizing the lack of miscibility in the crystalline state. On the other hand, it is shown in the following sections that the extent of hydrogen bonding in the liquid phases is comparatively small, and that the main interaction arises from dispersion forces. Therefore, it is possible that the similar chemical structure of DIA and NOR leads to similar dispersion interactions, and that this facilitates the formation of a liquid eutectic mixture, in the sense that there is no large enthalpic contribution to oppose mixing in the liquid state.
The final phase-transition temperatures (liquidus lines) can be theoretically calculated for every mixture by assuming the simplified Schroeder–van Laar–Le Chatelier equation [
24], which describes the behavior of binary systems that are immiscible in the crystalline state and show ideal mixing in the liquid state:
where
xj is the molar fraction of the
j component (where either
j = DIA or
j = NOR);
and
are the melting enthalpy (measured in J mol
−1) and the melting temperature (in K) of the pure compounds, respectively; and
and
are the melting temperatures of nordazepam- and diazepam-rich phases of the binary mixture (for completely immiscible solids, these are basically pure crystalline NOR domains and pure crystalline DIA domains, respectively). The dashed lines in
Figure 1b correspond to the predictions of the Schroeder–van Laar–Le Chatelier Equation (4). Although the latter do not coincide perfectly with the experimentally measured temperatures, the difference at concentrations close to either of the pure compounds is compatible with the experimental uncertainty in the determination of the melting enthalpies of the pure components in the mixtures. As guides to the eye, we also show fits of the experimental data points with functions of the form
a +
b/
T, i.e., linear in the inverse temperature (continuous lines).
The experimental determination of the eutectic composition is obtained by considering the variation with sample composition of eutectic enthalpy, i.e., the experimental transition enthalpy at
Te (area under the DSC trace in the region of the lower-temperature transition) as a function of composition. The eutectic enthalpy of the mechanically obtained binary samples as a function of concentration (Tammann diagram) is displayed in
Figure 1c. It can be observed that it reaches a maximum for x
NOR = 0.18, which coincides with the intercept of two straight-line fits (dashed lines in
Figure 1c). As visible in the inset to
Figure 1c, where we compare the line shape of the x
NOR = 0.18 sample with those of the x
NOR = 0.15 and 0.20 mixtures, the eutectic composition displays the smallest width of melting feature, as expected from the coincidence of eutectic and liquidus lines for this sample. The experimental eutectic molar fraction of x
NOR = 0.18 implies that the eutectic composition corresponds to a ratio of DIA to NOR molecules between 4:1 and 5:1.
The sample at the eutectic composition obviously exhibits the lower melting point of all binary mixtures. This aspect is important because NOR decomposes upon melting, as is visible in the thermogravimetry scans displayed in
Figure 1d, which compares the curves measured on the pure compounds and the equimolar mixture (x
NOR = x
DIA = 50%). The onset of intense mass loss in pure NOR is above 500 K, but a (weaker) onset of mass loss is detected already at the melting point of this compound. Degradation of pure NOR in the liquid phase is confirmed by the fact that the compound acquires color (see below). On the other hand, the TGA trace of pure DIA displays a constant mass in a relatively large temperature range near the melting point of this compound. This shows that the vapor pressure of DIA is negligible at
Tm. The TGA curve of pure DIA and of the equimolar mixture both display an onset of the mass loss at yet a lower temperature (470 K) than NOR. This temperature is well above the melting point of pure DIA, which, in fact, is known to be chemically stable upon melting and beyond and to degrade only at a much higher temperature.
The most important observation is that the eutectic melting temperature (T
e = 395.4 ± 1.2 K) lies more than 100 K below the melting point of pure NOR and more than 70 K below the onset of mass loss of either of the pure compounds and of the mixtures. This is visible experimentally in the inset to
Figure 1d, where we showed, in the same graph, the DSC trace and the derivative of the TGA trace of the eutectic sample, which confirms visually that the eutectic melting endotherm takes place at significantly lower temperature than any mass loss that might be related to sublimation or decomposition of the sample (in the main panel, the position of the liquidus line is shown for the equimolar mixture in order to allow for a comparison with the TGA derivative). This indicates that the liquid eutectic NOR–DIA mixture can be obtained by simple annealing without any degradation of the two drugs, as further discussed below.
In order to obtain liquid mixtures and supercool them to study the nonequilibrium-phase diagram, all the samples presented in
Figure 1 were heated above their corresponding liquidus lines and then rapidly cooled to below room temperature at a rate of 10 K/min to reach the glass state. Selected DSC thermograms acquired upon heating the resulting glassy mixtures are displayed in
Figure 2a (the whole series of traces is available in the
Supplementary Information file). All curves display a single step-like feature, signaling the discontinuity in specific heat across the glass-transition temperature (
Tg), which is unique for a given concentration. In the case of the pure NOR sample, the
Tg obtained with our procedure is indicative of the true glass transition of these samples, despite the possible presence of impurities caused by thermal degradation, since the latter does not alter the
Tg value much [
25]. The glass transition was accompanied in all cases by a small enthalpy recovery peak due to the ageing of the glassy mixtures. The onset
Tg temperatures are shown as a function of NOR molar fraction in
Figure 2b, where it may be observed that the
Tg varies linearly with composition. The linear dependence of
Tg upon the composition confirms the ideal behavior of the DIA–NOR mixtures.
As discussed above, the melting temperature of the eutectic concentration is lower than any onset of mass loss in TGA and more than 100 K below the melting point of NOR, which suggests that, while pure NOR degrades upon melting, this effect is absent in our mixtures. The effect of thermal degradation of NOR upon melting is visible in
Figure 2c, where it can be observed that pure NOR acquires a yellowish color upon melting in air (we observed, instead, a dark blue color for the degradation product when NOR was heated in a sealed heat-resistant glass vessel (not shown)). In contrast, the eutectic mixture is colorless above the eutectic point, as is visible in
Figure 2d. This further proves the thermal stability of the amorphous eutectic NOR–DIA mixture and confirms that glassy NOR–DIA samples can be obtained by a simple heating procedure.
No melting or cold-crystallization peak is observed for any of the concentrations studied in subsequent DSC experiments below or above
Tg, thus indicating that the amorphous binary samples did not show a strong tendency toward recrystallization. In fact, we obtained amorphous binary mixtures which were kinetically stable against recrystallization for long periods of time (at least weeks) for all molar fractions, which is impressive since even molar concentrations as low as 5% appeared to be sufficient to kinetically stabilize the amorphous binary mixture. In particular, the eutectic glass mixture was found to be kinetically stable for at least 2 months at room temperature. The nature of intermolecular interactions and their possible role for both the miscibility and kinetic stability of the amorphous mixtures are investigated in
Section 3.3.
3.2. Dielectric Characterization of Amorphous Mixtures
We employed dielectric spectroscopy to characterize the electric properties and molecular dynamics of the pure amorphous compounds, as well as two amorphous binary mixtures with different molar fractions, namely the eutectic concentration (taken to be xNOR = 0.18 based on our enthalpy measurements) and the equimolar mixture (xNOR = 0.50). This second concentration was chosen to better study the effect of heteromolecular (NOR–DIA) interactions.
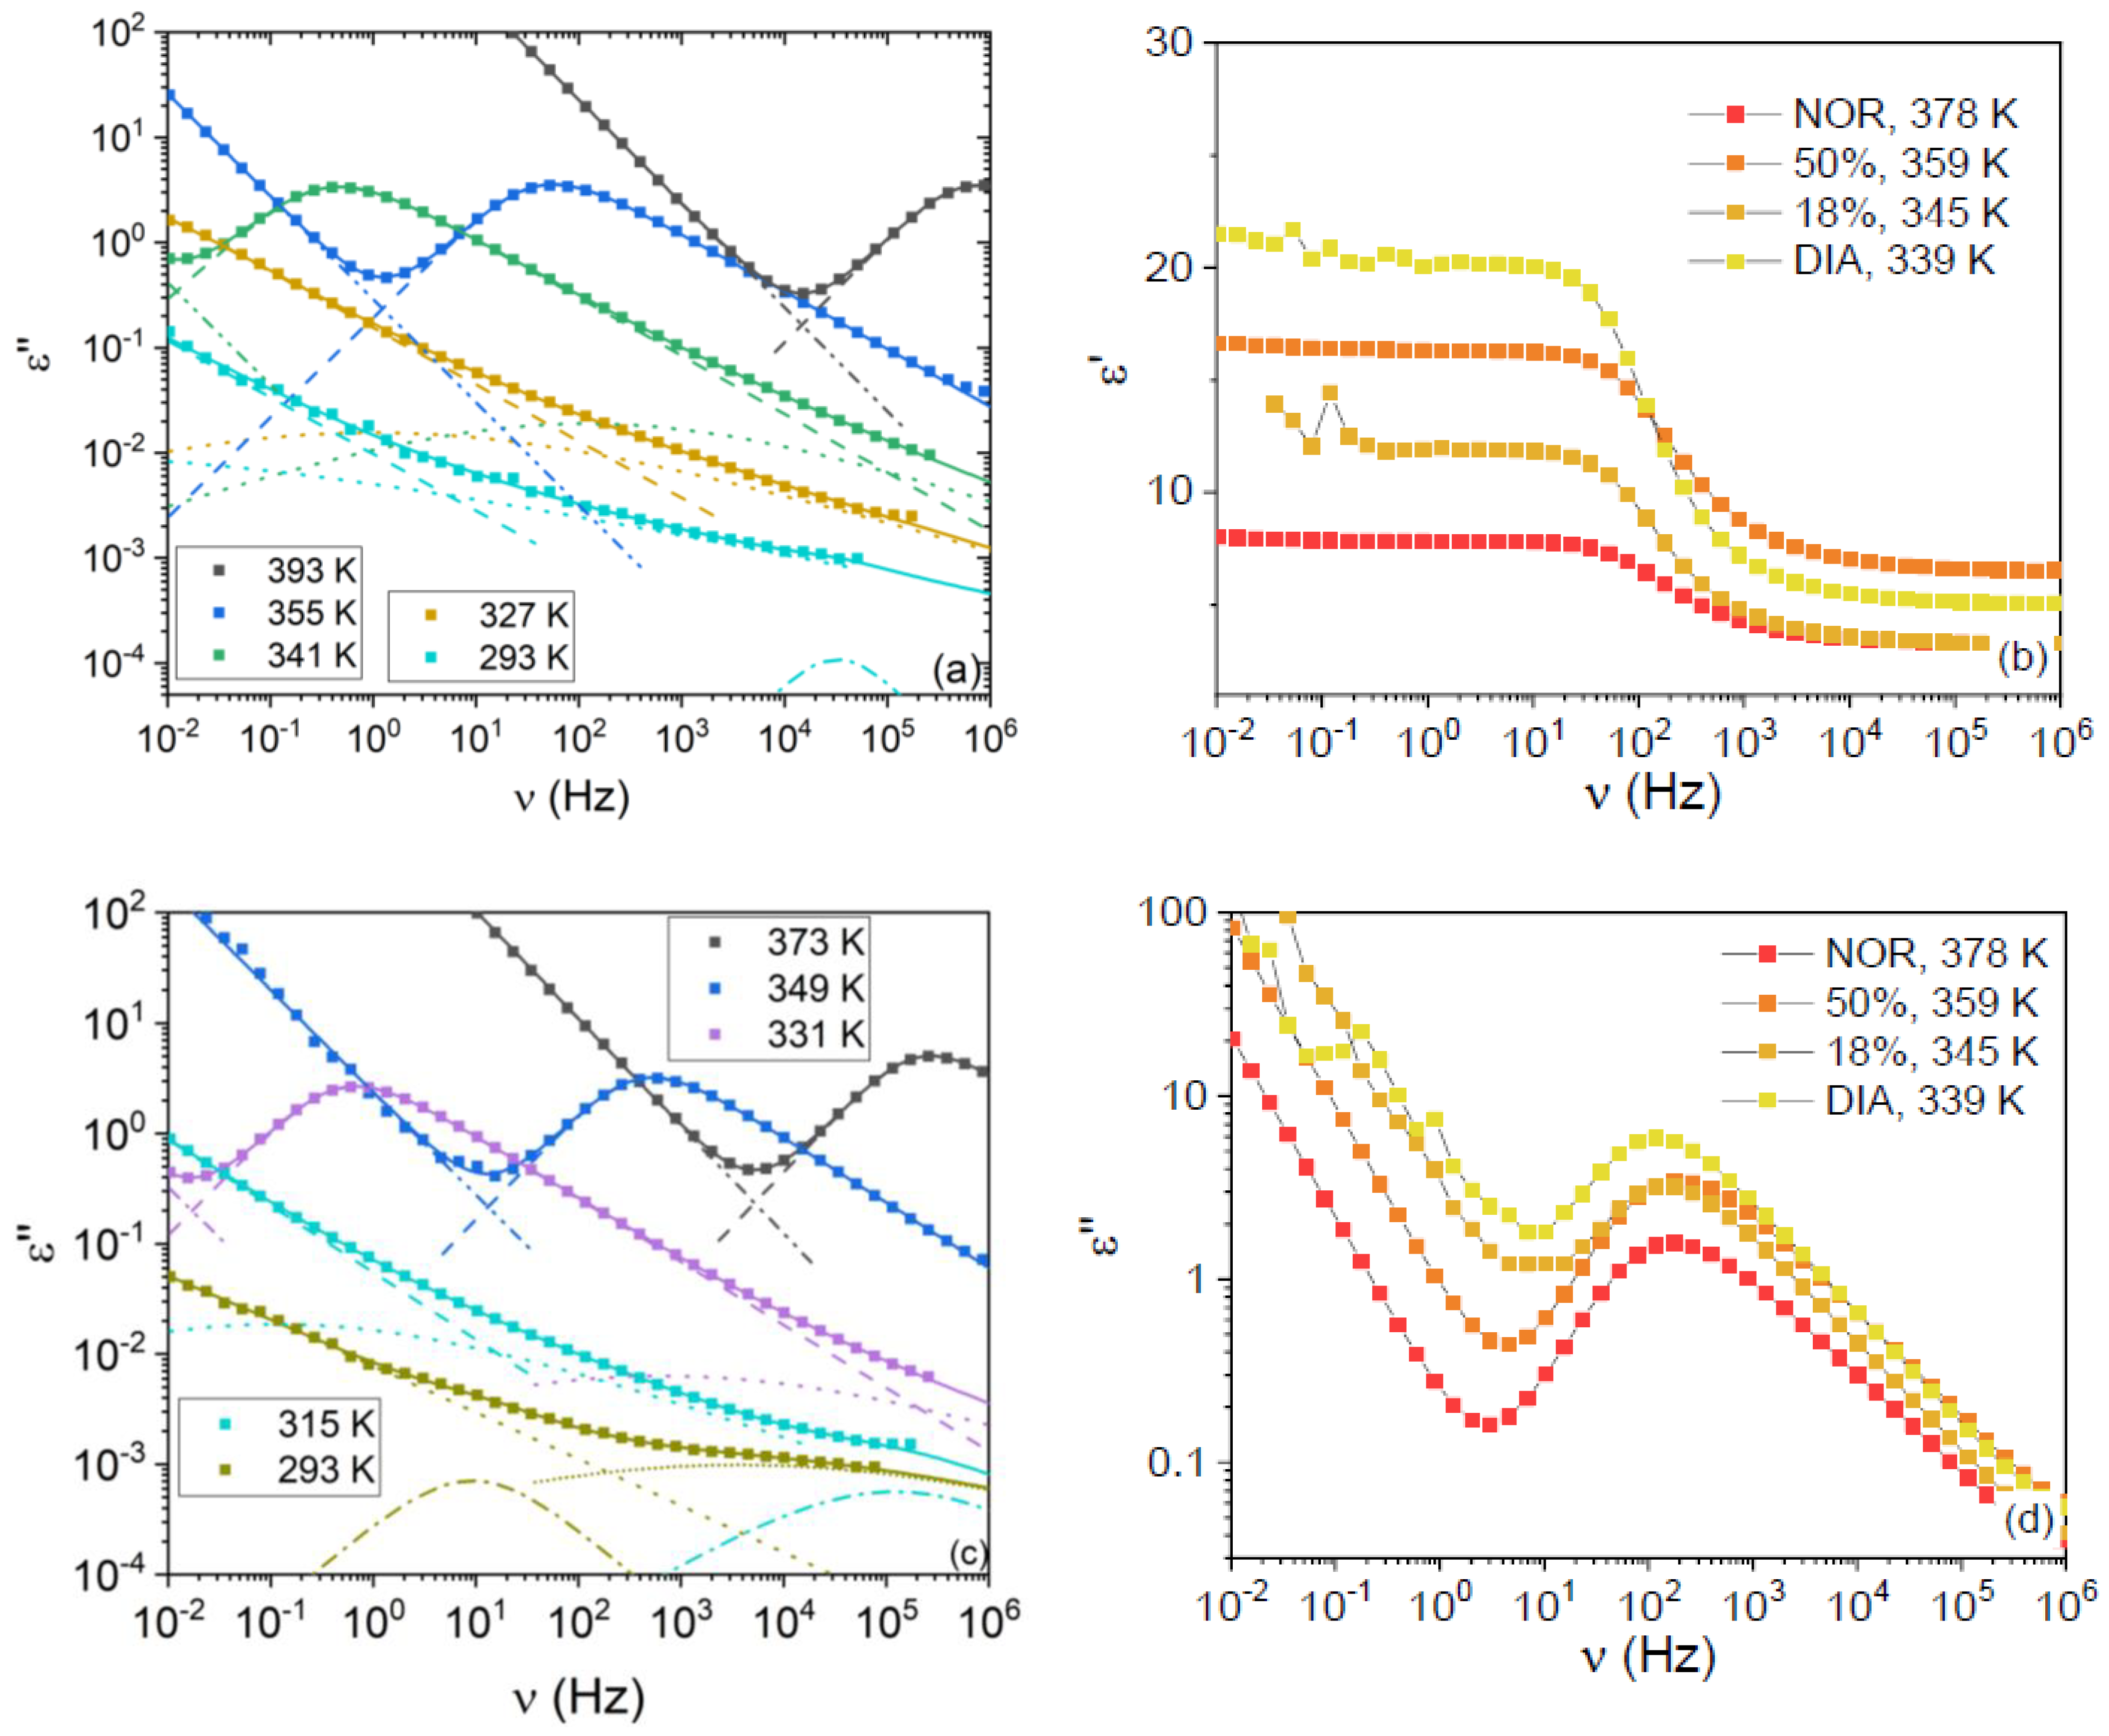
Typical imaginary permittivity spectra of the two studied mixtures are displayed in
Figure 3a,c for the mixtures with x
NOR = 0.18 and x
NOR = 0.50, respectively. The most intense relaxation in the spectra acquired above the
Tg of the samples is the primary α relaxation, while secondary relaxations (which are labeled as β, γ, and γ’ in order of increasing relaxation frequencies) can be observed as shoulders to the latter peak or as broad low-intensity features below
Tg. The α relaxation followed the expected behavior with sample composition at fixed temperature, being peaked at a frequency intermediate between that of the pure compounds, in agreement with our calorimetric
Tg measurements. In correspondence with the α relaxation peak of the imaginary permittivity, the real permittivity displays a step-like decrease from its static value (ε
s, the zero-frequency limit of the real part of the dielectric function) to its high-frequency value (where “high frequency” is defined based on the available experimental range in dielectric spectroscopy).
Figure 3b,d display the comparison between the real and imaginary permittivity spectra of the four studied samples, at different temperatures chosen, so that the α relaxation was peaked at roughly the same frequency in all spectra. It can be observed in
Figure 3d that the dielectric strength of the α relaxation is similar for both mixtures and is, in both cases, intermediate between those of the pure DIA and NOR liquids. Nevertheless, the static permittivity is different, as is visible in
Figure 3b, with the ε
s of the x
NOR = 0.18 sample being lower than that of the x
NOR = 0.50 sample and closer to the static permittivity of pure liquid NOR. As visible in the plot, such a higher value of the static dielectric permittivity is actually associated with a higher value of the high-frequency dielectric function, rather than with an increase of the orientational polarization contribution. The origin of such an increase in the high-frequency response is beyond the scope of this contribution.
All spectra were fitted by using the procedure detailed in
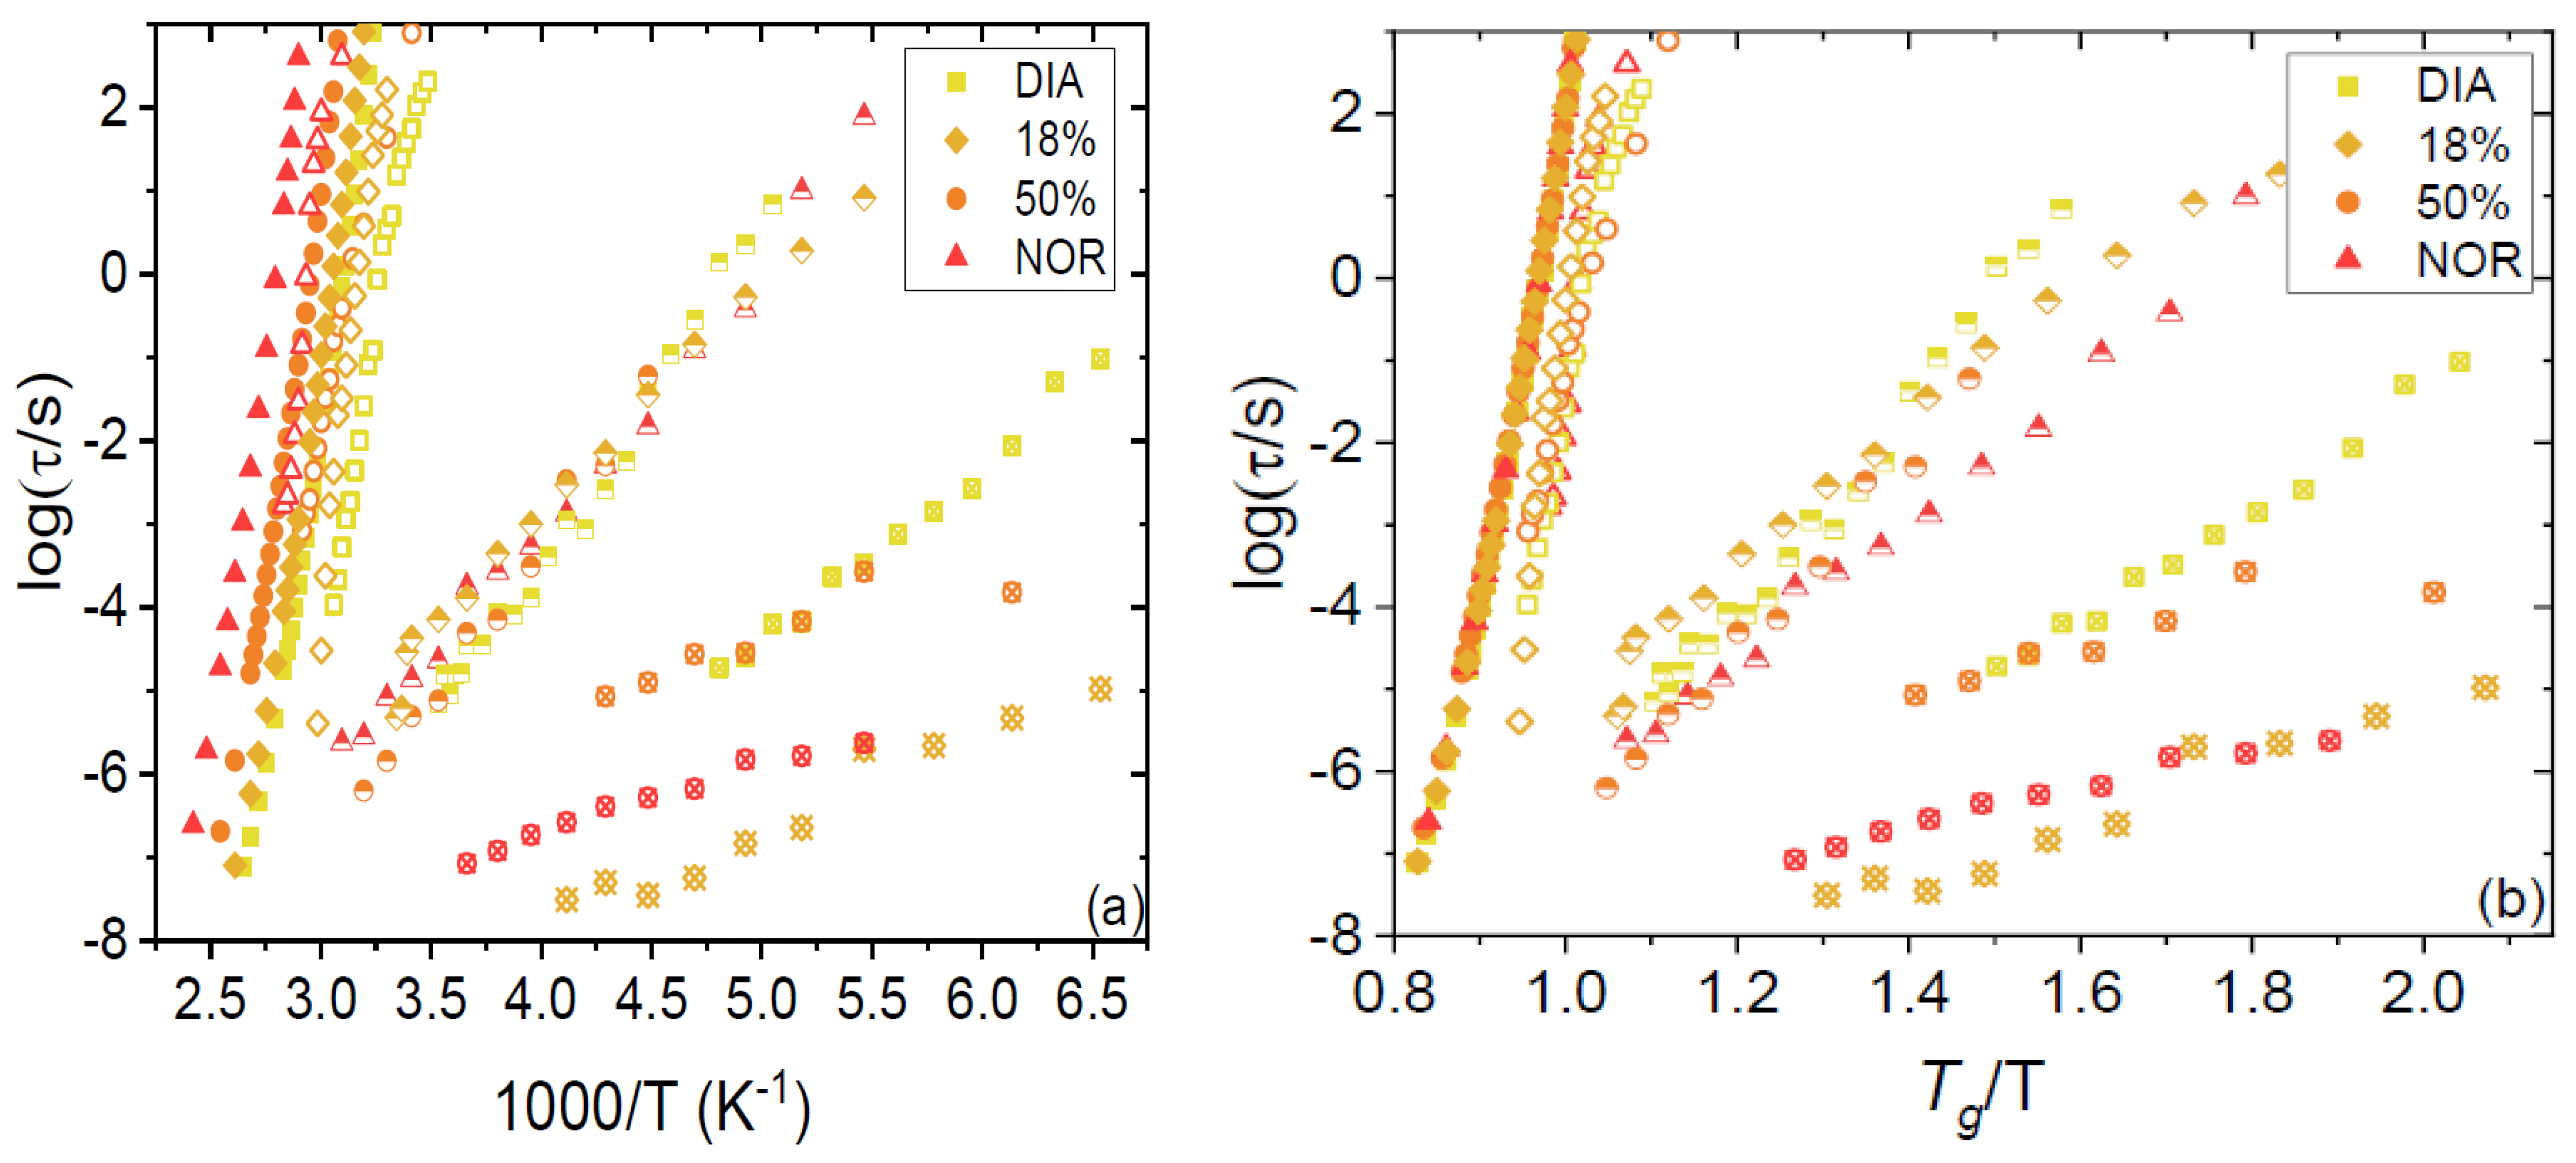
Section 2. The obtained relaxation times for both the primary and secondary relaxations are plotted as Arrhenius and Angell relaxation maps in
Figure 4a,b, respectively. It may be observed that both the α (filled markers) and β relaxations (open markers) are well superposed in the Angell representation. The first finding indicates that the so-called kinetic fragility (which is a measure of the curvature of the Angell plot at
T/
Tg = 1) of both amorphous compounds, as well as their binary mixtures, is very similar (see below). The superposition of β relaxation times indicates that such a relaxation process is the subdiffusive Johari–Goldstein relaxation, which represents the local single-molecule analogue of the cooperative α relaxation [
26,
27,
28].
By convention, the temperature at which the α relaxation time reaches a characteristic time of 100 s is defined as the dynamic
Tg. The dynamic
Tg values for the 18% and 50% amorphous mixtures were 317 and 328 K, respectively, values that are very close to the calorimetric glass-transition temperatures (see
Table 1) of the same samples. The temperature dependence of the α relaxation could be well described by the Vogel–Fulcher–Tamman function [
29,
30,
31], which is typical of cooperative structural relaxations [
32]:
The fit parameters appearing in Equation (5) are reported in
Table 1 for the four samples investigated. From these parameters, the so-called kinetic fragility,
mp [
33,
34], is determined as follows:
As is visible in the table, the fragility of all studied samples was virtually the same and roughly equal to 71 (average value). This value is in agreement with previously found values for the pure compounds [
23,
35], and its constancy is in line with the ideal behavior of the DIA–NOR liquid mixture (see [
36] for an example of non-ideal behavior of the fragility index).
The secondary processes displayed, instead, a simply activated (Arrhenius) behavior. The corresponding activation energies are reported in
Table 1. The order of magnitude of the activation energies for the mixtures is in line with previous dielectric spectroscopy studies on the pure compounds. They are all a factor of two larger than the activation energy reported in a recent study of the pure compounds by means of thermally stimulated currents’ characterization [
35].
Only one Johari–Goldstein relaxation was detected, as may be expected for a homogeneous liquid mixture. In fact, the other relaxations visible in
Figure 4 were previously observed in the pure compounds, where they were assigned to intramolecular relaxation modes. In particular, the γ process (half-filled markers) is present in both pure DIA and NOR, where it was unambiguously identified as the inter-conformational relaxation process corresponding to the ring inversion dynamics of the seven-membered diazepinic ring [
23]. As visible in the Arrhenius plot of
Figure 4a, such inter-conformer relaxation dynamics takes place at basically the same rate in all four studied samples; that is, its characteristic time is basically independent of composition for a fixed temperature.
Moreover, the fastest process (crossed markers) was detected previously in the pure compounds [
23]. The fastest relaxation of DIA is shown here to be visible also in the eutectic DIA–NOR mixture, while the fastest relaxation of NOR is detected also in the equimolar mixture. These fast relaxations were tentatively assigned to rigid small-angle rotations of the (fused-ring) benzodiazepinic structure about its bond with the phenyl ring. This interpretation may hold in the case of pure DIA, where this process is significantly slower and displays a higher activation energy compared to NOR (
Figure 4a). In the latter compound, instead, the very short relaxation time, the low activation energy, and the low spectral intensity of this feature all suggest that the origin of this relaxation might be associated with the rotation of the benzene ring itself. In fact, although such a conjugated ring possesses per se no dipole moment, a change in its orientation might affect the electron distribution in the fused benzodiazepinic ring, which could lead to a small change in the molecular dipole moment and/or hydrogen bonding motif upon rotation of the benzene ring, which would lead to a small but detectable signal in the BDS spectra.
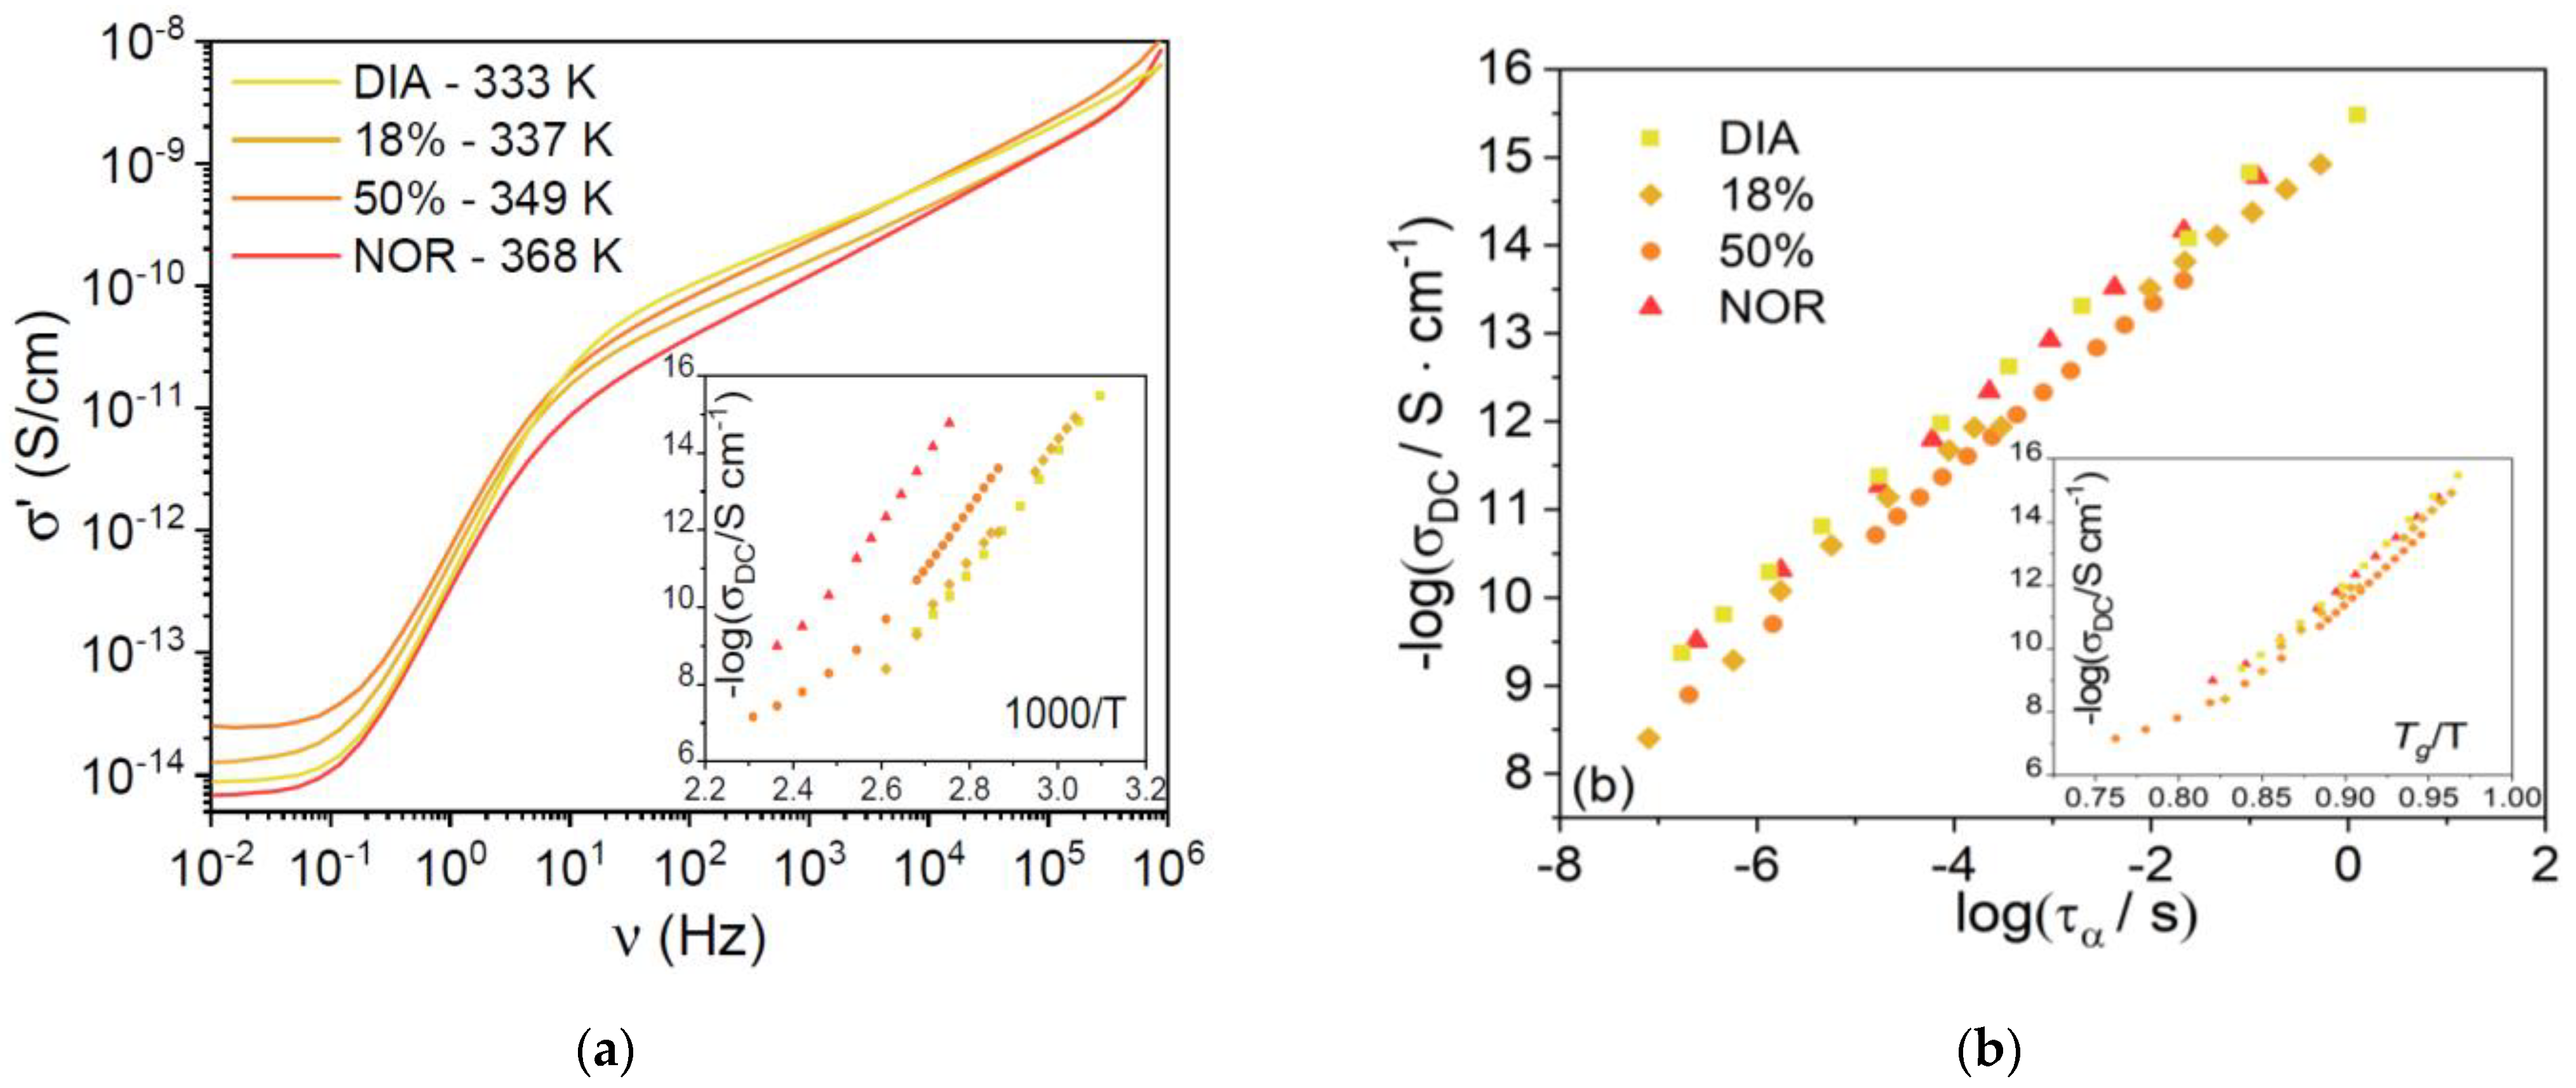
Figure 5a shows typical high-temperature AC conductivity spectra (vs. frequency) for each supercooled liquid sample, at temperatures chosen such that the ratio
T/
Tg was roughly constant and equal to 1.75 ÷ 1.78 for all four samples. The AC spectra display a plateau at low frequency, corresponding to the DC electric conductivity, σ
DC, of the liquid phases. It can be seen that the σ
DC value is very similar for all samples at this rescaled temperature. In
Figure 5b, we plot the logarithm of σ
DC against the logarithm of the structural relaxation time, τ
α. A linear correlation is observed in all three compounds, with slopes of 0.93 ± 0.06 for DIA and 0.93 ± 0.02 for NOR. Such values are virtually identical for the two pharmaceuticals studied and very close to the value of 1 expected from the Stokes–Einstein relation [
37,
38]. This result indicates that the diffusion of charged species is coupled to the α relaxation, rather than to the intramolecular γ and γ’ conformational dynamics, implying that the DC electric conductivity of the amorphous drugs is due to the viscosity-limited diffusion of ionic impurities [
39,
40,
41,
42]. The ionic character of the charge conduction is also confirmed by the curvature of the Angell plot of σ
DC shown in the inset to
Figure 5b. The fact that the DC conductivity is basically the same for both compounds under isochronal conditions. (
Figure 5b shows that the microscopic mechanism for ion diffusion is similar in both liquid benzodiazepine derivatives.)
3.3. FTIR and DFT Study
We employed FTIR spectroscopy and DFT simulations to obtain information on the interactions between the two pure APIs in the amorphous mixture.
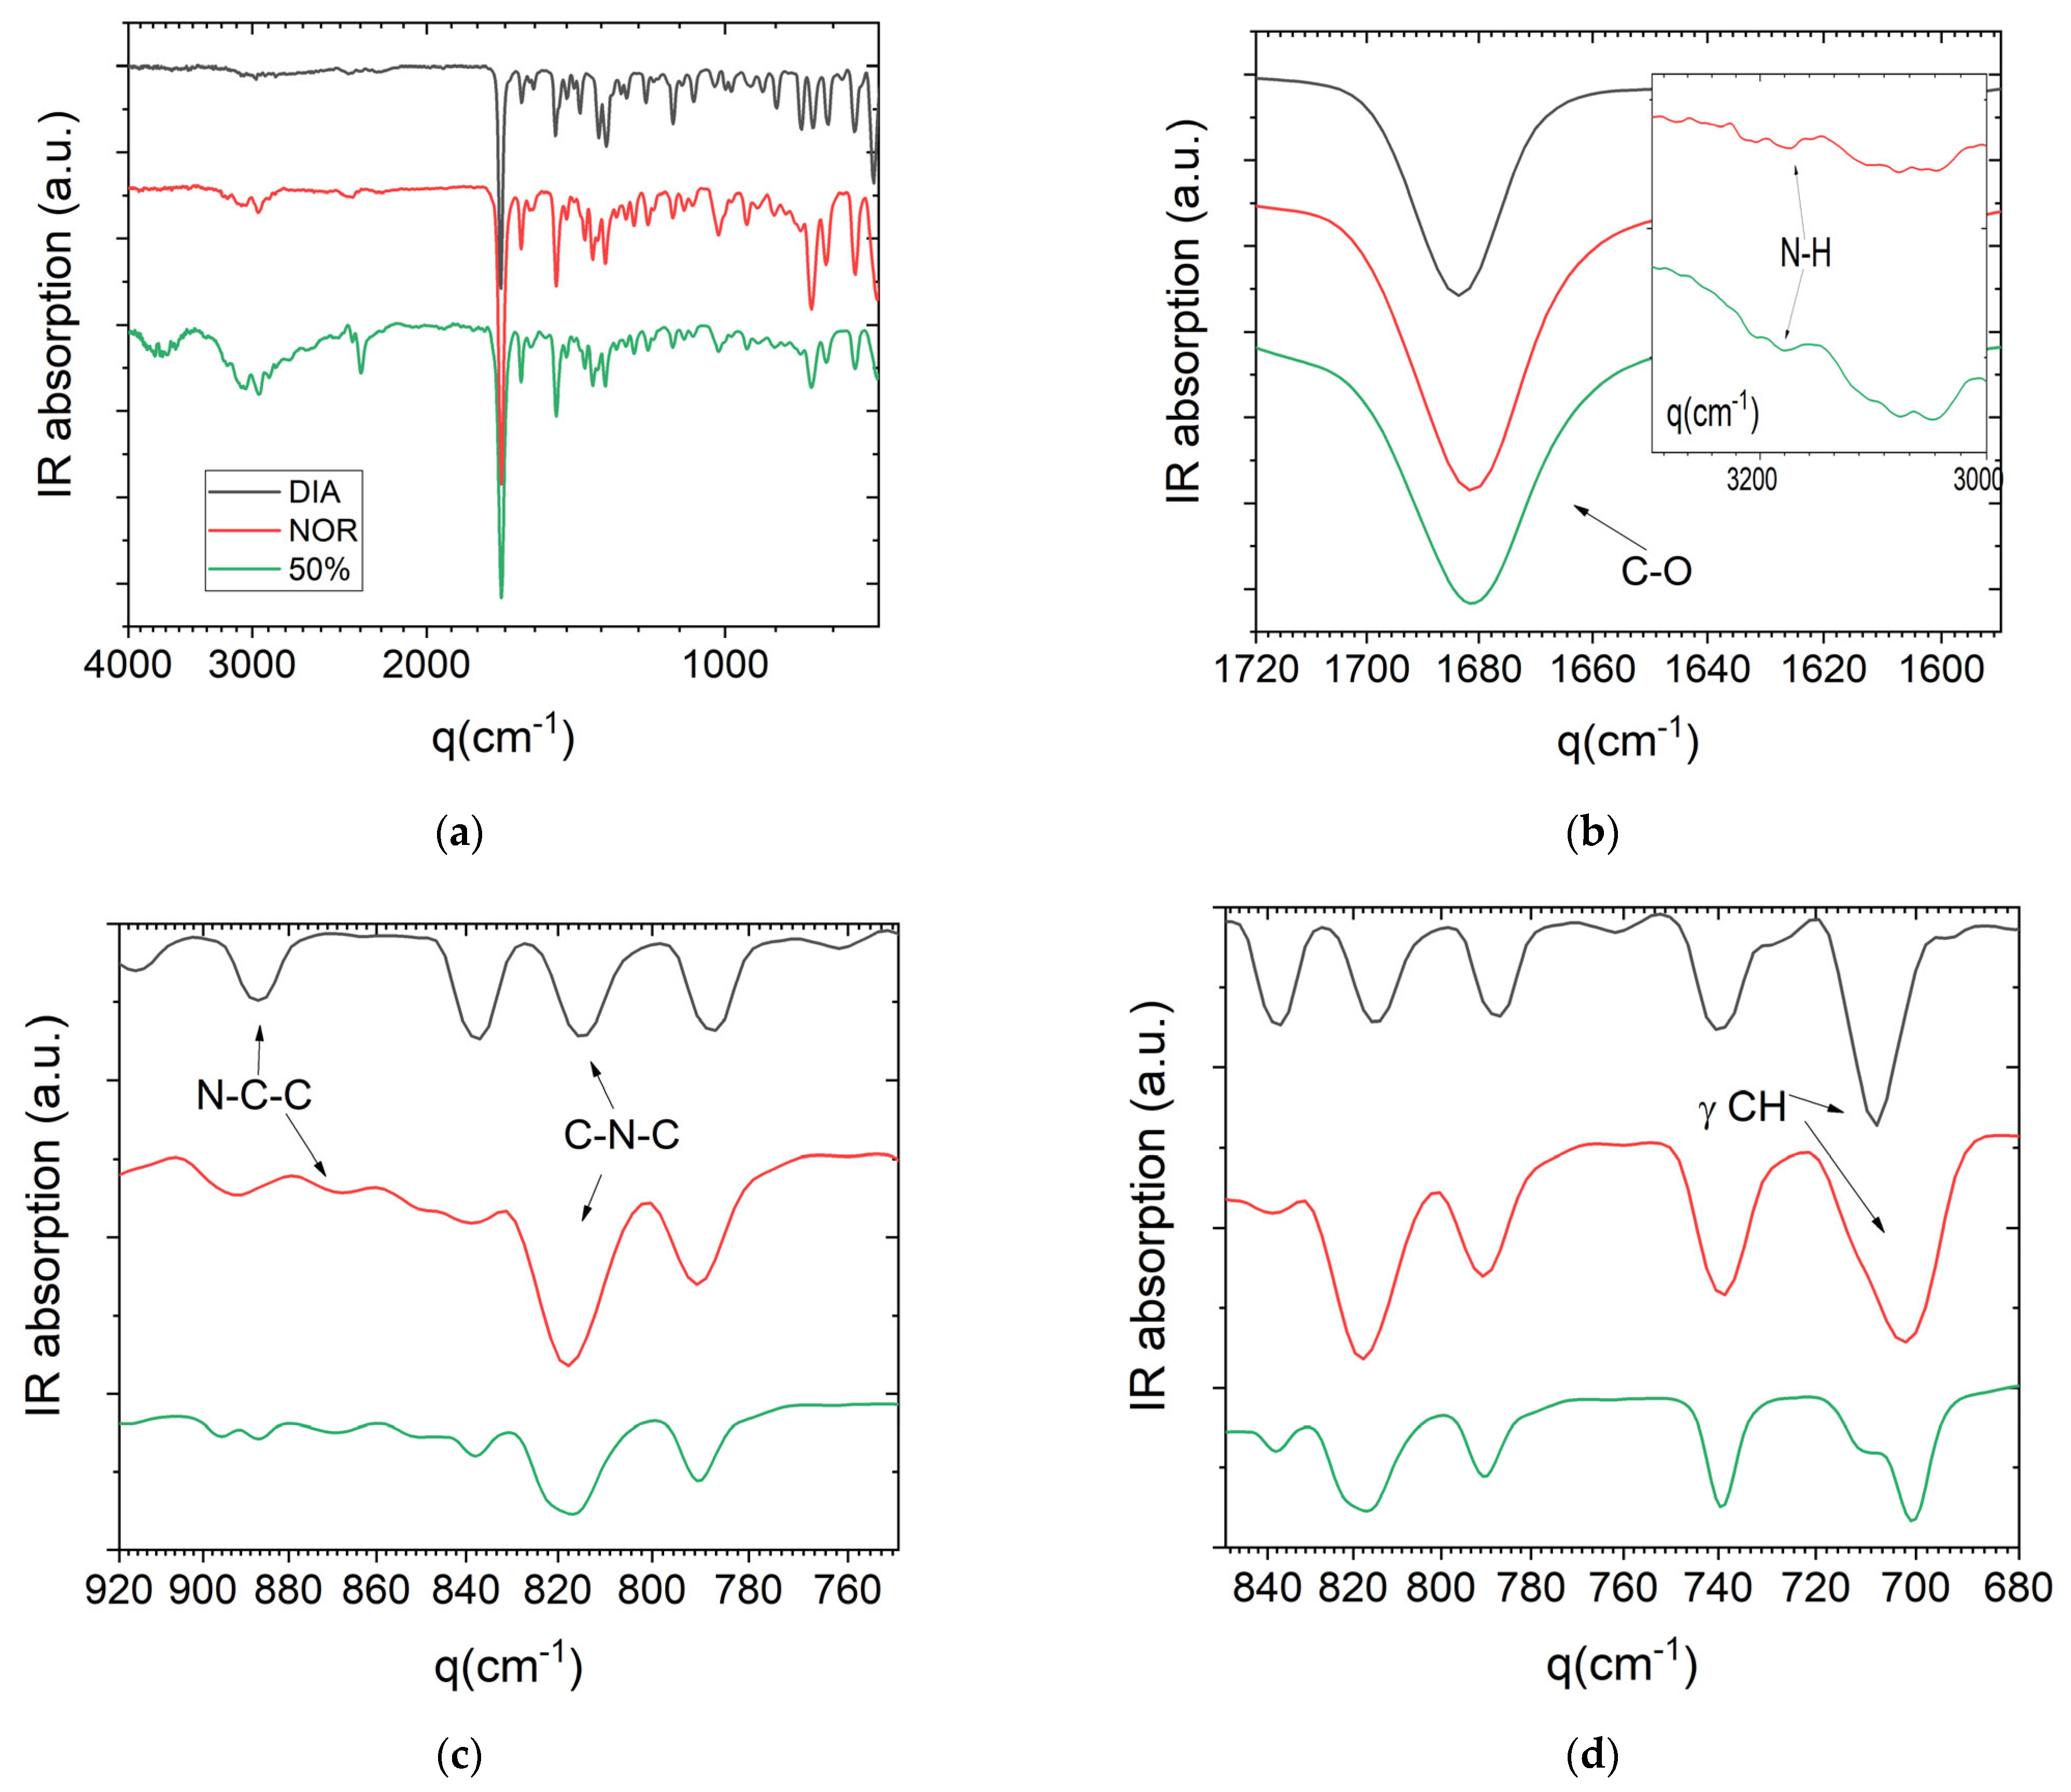
Figure 6 shows the room-temperature FTIR spectra of the pure DIA and NOR powders and of the 50% glassy binary mixture acquired in reflection geometry (ATR). Overall, the spectrum of the 50% mixture appears rather similar to both pure components, and in particular to that of NOR. This is confirmed by the frequencies of the assigned bands, when compared to the bands of the pure APIs (we followed the assignment provided by Neville et al. [
43]).
Table 2 lists some selected bands and their corresponding assignments. In the amorphous 50% mixture, the most intense feature of the spectrum is the carbonyl stretch at 1680 cm
−1. This wavenumber is very similar to that of the same vibrational mode in NOR and slightly lower than that of DIA (1683 cm
−1). Neville et al. [
43] suggested that the change in frequency between NOR and DIA, and the larger width of the peak in NOR, are both due to the hydrogen bonding between the carbonyl and the amide group of NOR in the crystalline compound (hydrogen bonds are obviously absent in crystalline DIA). The presence of such H-bonds in crystalline NOR was confirmed experimentally [
23]. It is possible that a similar interaction is present also in a fraction of the molecules in the equimolar mixture, where it arguably also involves the carbonyl group of DIA molecules. The C=O band is rather broad in all samples, and this does not allow us to rule out the presence of distinct spectral components (for example, in the binary mixture at the frequency of the non-hydrogen-bonded C=O stretch of pure DIA).
The amidic nitrogen of NOR is the only H-bond donor group in either molecule, and both of the dilutions of NOR species in the amorphous binary mixtures and their intrinsic disordered nature indicate that H-bonding interactions are necessarily weaker in the amorphous mixtures than in pure crystalline NOR. Pure NOR displays a weak band corresponding to the stretching of the N–H bond at 3174 cm
−1 (inset to
Figure 5b), which is typical of amides. The same band is also observed, but with a higher intensity and slightly shifted, in the glassy 50% mixture (3176 cm
−1), while it is absent (as expected) in DIA. It is possible that the shift of the N–H vibration in the liquid binary sample is due to a lower impact of hydrogen bonding, as may be expected from the intrinsic disorder of an amorphous phase. Correspondingly, non-directional (e.g., van der Waals) interactions are expected to play an important role in the liquid mixture.
The N–C–C stretching bands of the pristine compounds (observed at 887 cm−1 in DIA and 867 cm−1 in NOR, respectively), appear at the same frequency in the binary mixture. The band attributed to the CH3 twisting in DIA is also preserved, even though it is found to be less intense, likely due to the lower amount of DIA. On the other hand, the 50% mixture displays two bands at 815 and 821 cm−1 in the region of the C–N–C stretching, which are observed, respectively, at 815 cm−1 in pure DIA and 818 cm−1 in NOR. The change in C–N–C stretching between pure NOR and the 50% mixture suggests that intermolecular interactions in the equimolar DIA–NOR mixture may involve also the diazepinic skeletal nitrogen (which is characterized by an excess local negative charge due to the presence of a lone electron pair, which may be involved in hydrogen bonding but also in ring–ring interactions involving diazepinic moieties and/or the electron-rich π orbital of the conjugated benzene rings). In the spectra of the 50% mixture, the two strong IR bands near 700 cm−1 and the weaker band at 896 cm−1 were observed to be significantly shifted with respect to the corresponding features in the two pure crystalline compounds. These bands are assigned to out-of-plane CH bending modes characteristic of monosubstituted benzene derivatives, and their shift with respect to the pure compounds provides support for the occurrence of interactions involving π benzene electrons in the binary amorphous mixture.
First-principles simulations based on van der Waals–corrected density functional theory (vdW-DFT) calculations were performed to theoretically characterize the interactions and vibrational modes of the heteromolecular dimer (see
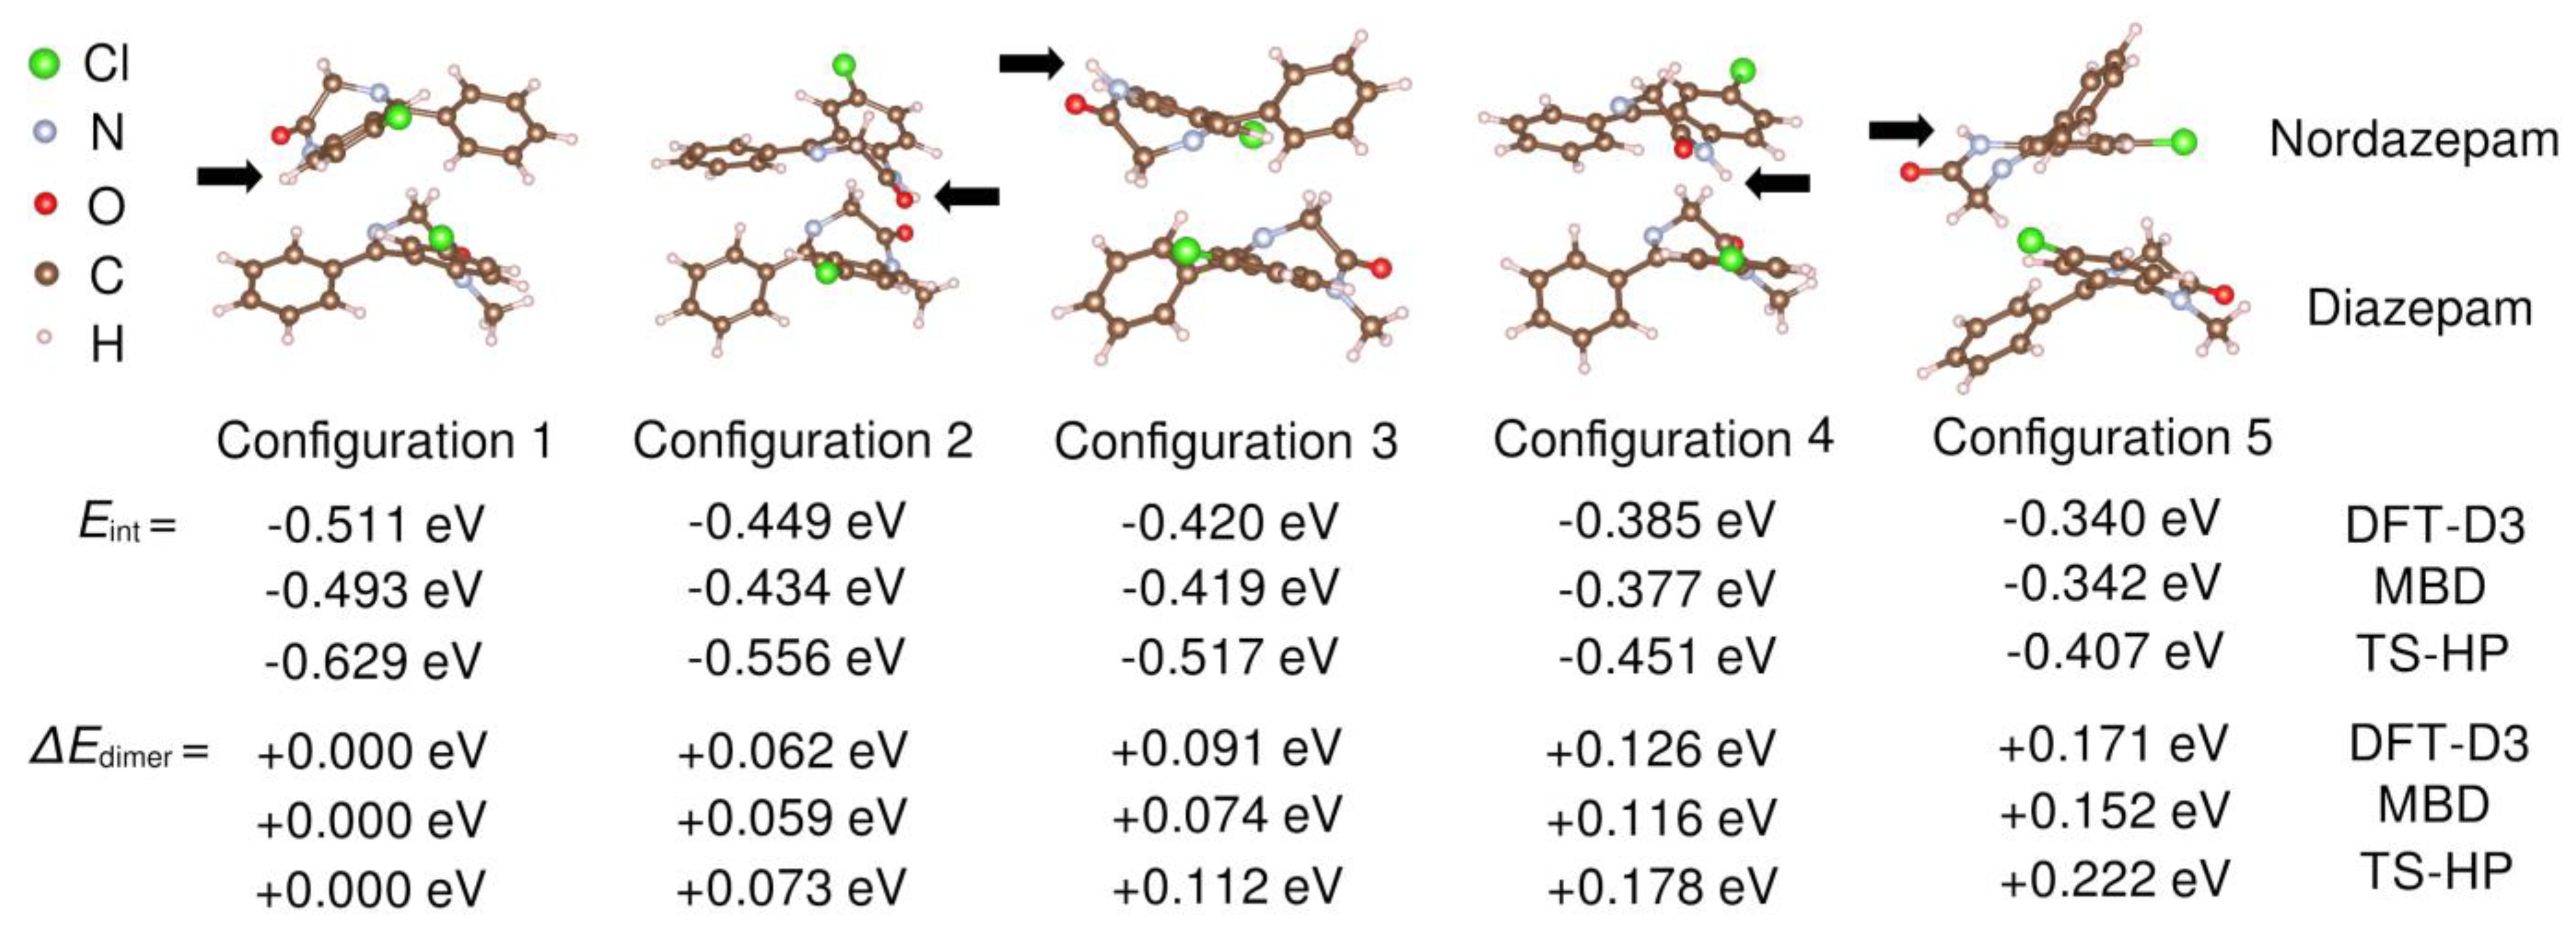
Section 2 for technical details). Since the FTIR results, as well as the chemical structure of the molecules, suggest the possible existence of important dispersion interactions between ring moieties, we started from arrangements of a NOR–DIA dimer with a rough coplanarity of at least some rings. After allowing these arrangements to relax into local energy minima, we identified five distinct molecular dimer arrangements of minimal energy (
Figure 7), in which the nordazepam amidic nitrogen (N–H) either faced (Configurations 1, 2, and 4) or opposed (Configurations 3 and 5) the diazepam framework. In all the analyzed cases, the calculated (relaxed) heteromolecular dimer interaction energy,
Eint (see Equation (3) in
Section 2), was of negative sign and equal to several tenths of an eV in absolute value. For instance, with the TS–HP van der Waals approach, we estimated an
Eint of −0.629 and −0.407 eV for Configurations 1 and 5, respectively. The origin of such large and negative interaction energies in our vdW-DFT simulations is purely electrostatic (see below). Our computational results clearly indicate the presence of relatively strong attractive forces among the ring moieties of NOR and DIA molecules. The five heteromolecular dimer configurations shown in
Figure 7 are ordered according to their zero-temperature energy: “Configuration 1” was systematically found to be the most stable, and “Configuration 5” the least stable, with the dimer energy of the latter being about 0.2 eV larger than that of the former. In the two energetically most favorable dimer configurations, the amidic nitrogen of NOR faces the DIA molecule (“Configuration 1 and 2”), thus giving plausibility to the formation H bonds between the two molecules; on the other hand, in the energetically less favorable dimer configuration (“Configuration 5”), the amidic nitrogen opposes the DIA moiety, hence precluding the formation of H bonds among the two molecules. Our simulations do not provide explicit evidence for H bonding in the heteromolecular dimer; in particular, in the relaxed geometries, the Nordazepam amidic nitrogen always was located at distances larger than 3–4 Å from the diazepam carbonyl oxygen and skeletal nitrogen. This might be due to the well-known limitations of DFT methods in accurately describing H-bonding interactions in small molecules [
44,
45], but it could also indicate that directional H-bonds are not the dominant interactions between the benzodiazepine moieties in the liquid phase. In either case, the formation of (dynamic) heteromolecular dimers as those reported by our DFT study confirms the chemical affinity of the two benzodiazepine derivatives, which is likely partially responsible for the observed physical stability of the amorphous DIA–NOR mixtures.
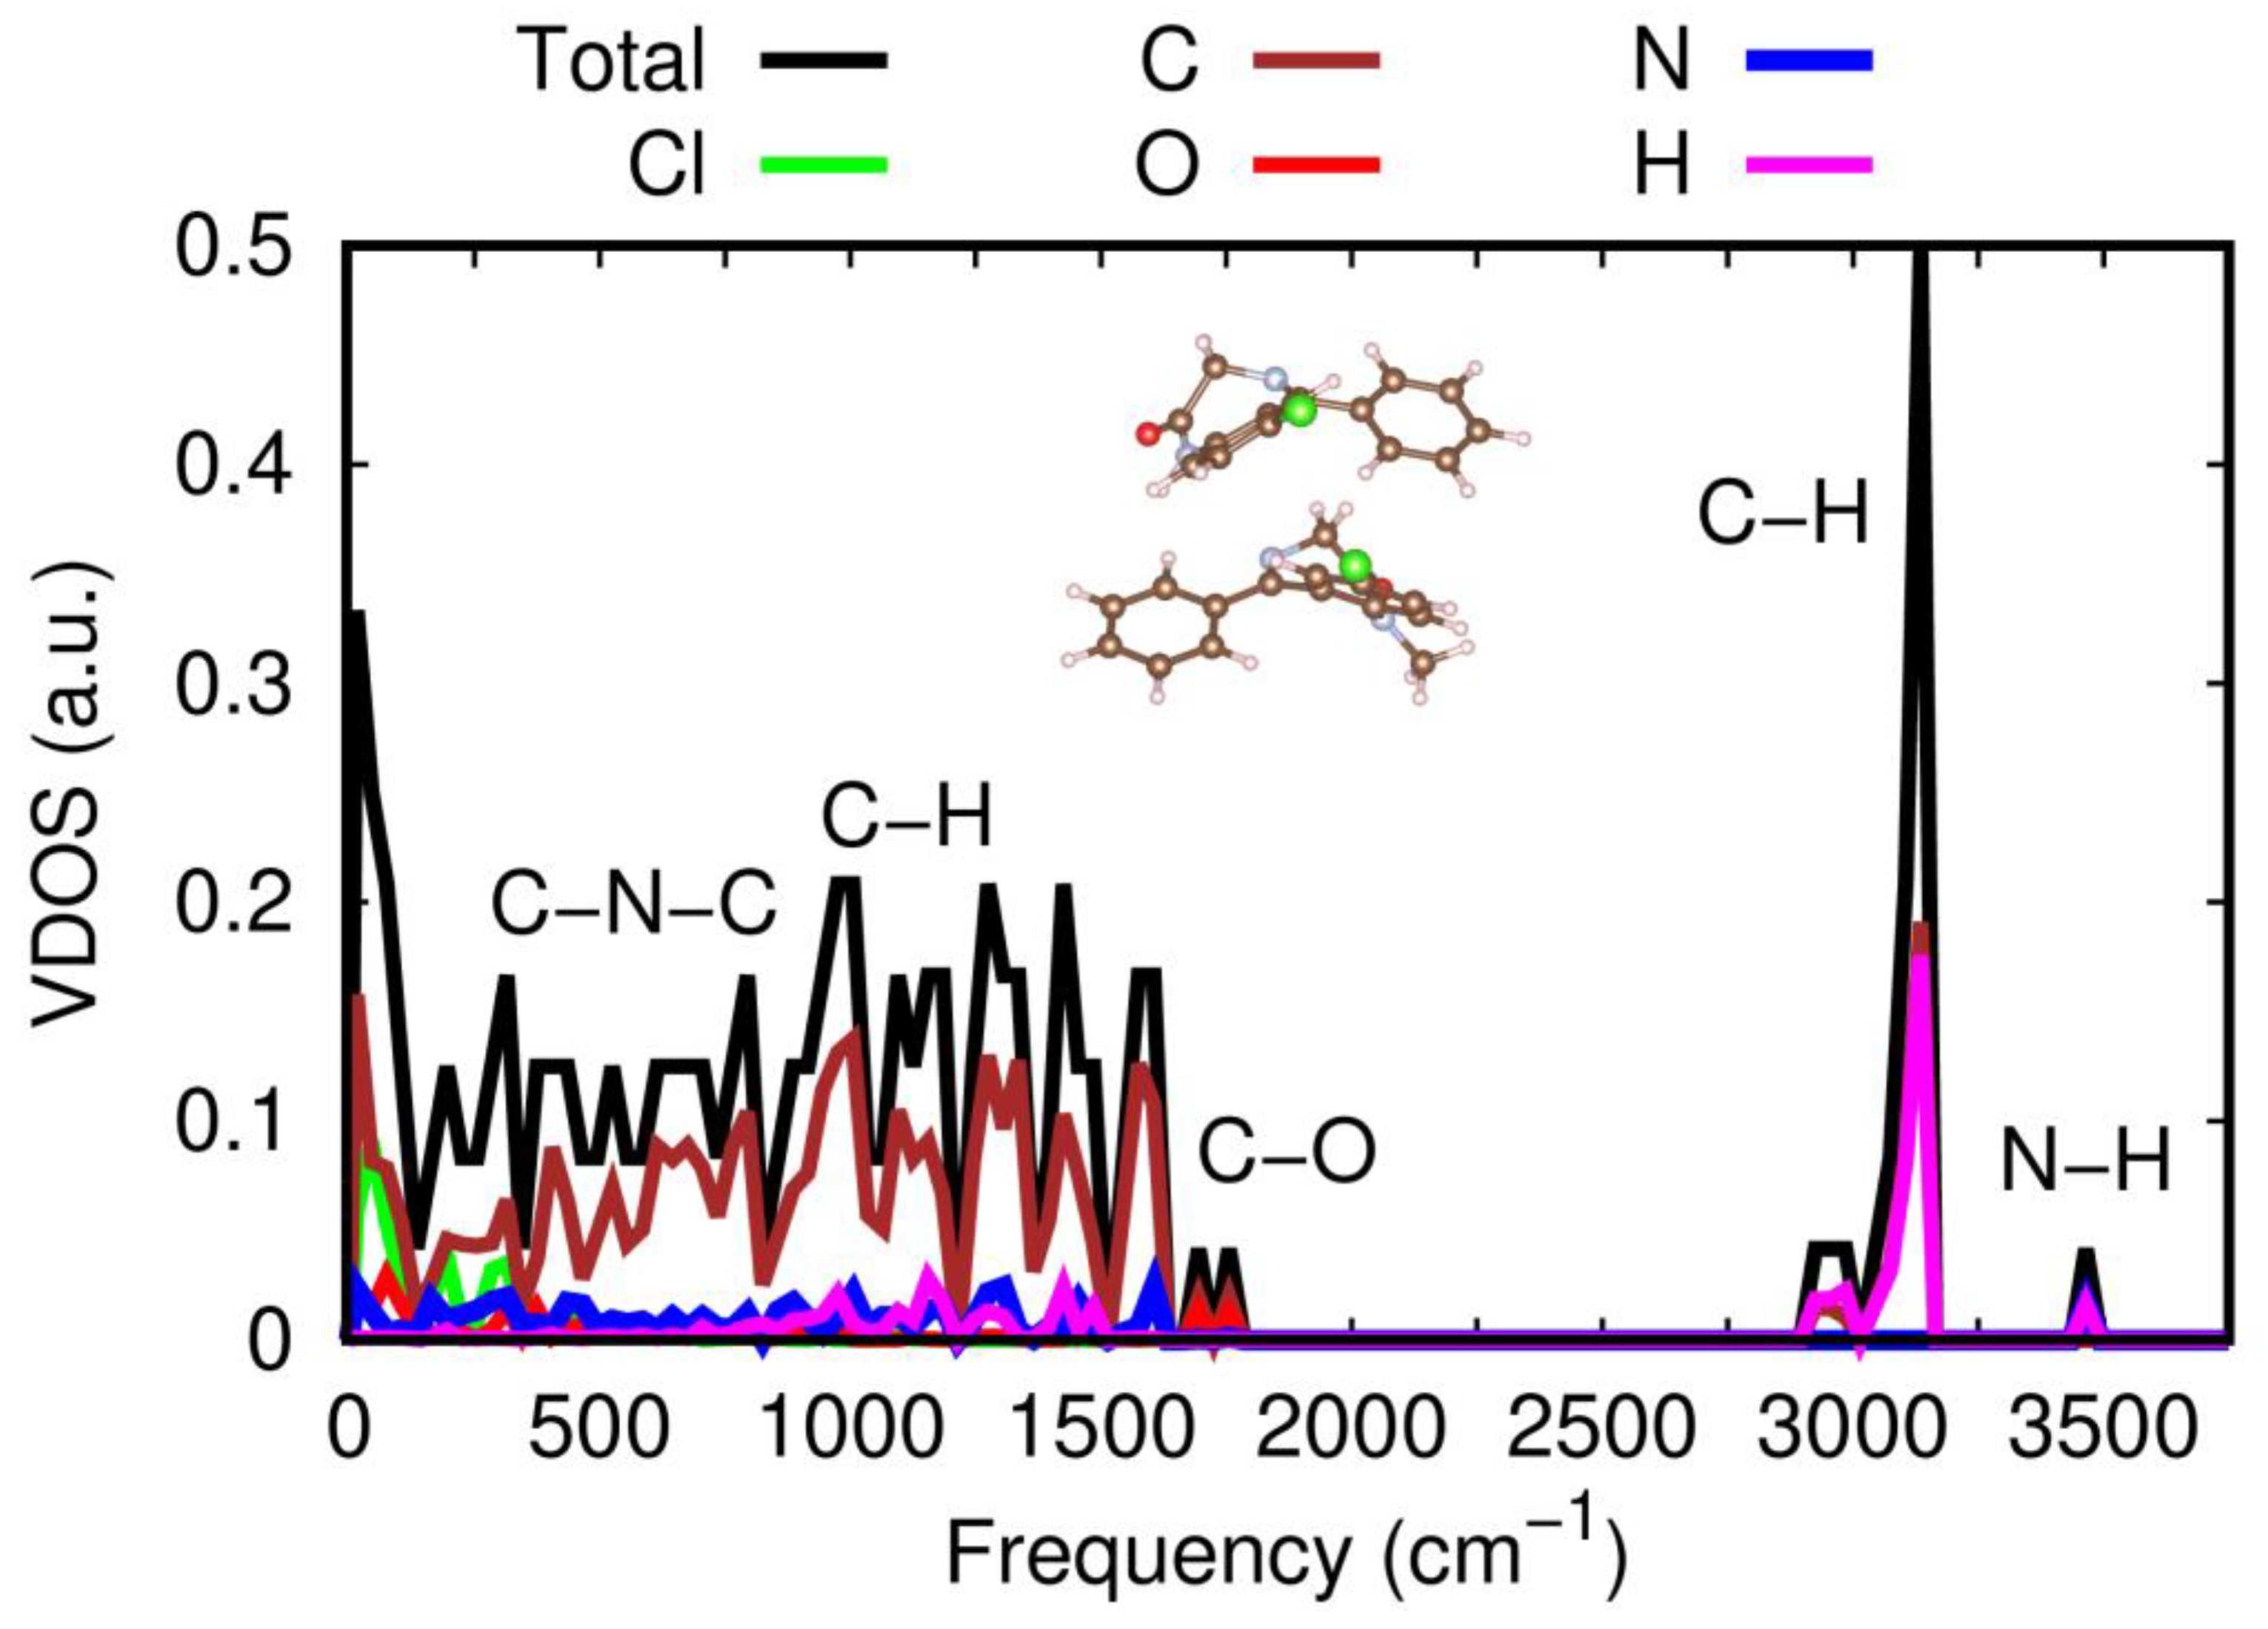
The full vibrational density of states, VDOS, of the energetically most favorable heteromolecular dimer was also computed with theoretical vdW-DFT methods, as shown in
Figure 8. We were able to determine the relative contribution of each atomic species to the molecular vibrations by inspecting the corresponding eigenmodes and making use of their orthonormal relations [
46]. The same calculations were repeated for the heteromolecular dimer in the “Configuration 2” arrangement, obtaining identical results (not shown here); therefore, the theoretical conclusions explained in what follows do not appear to be critically dependent on the relative molecular orientation of NOR and DIA molecules. As depicted in
Figure 8, five clearly differentiable regions appear in the estimated dimer vibrational spectrum at frequencies higher than 500 cm
−1 (below this threshold frequency, the vibrational modes are mostly governed by Cl and C atoms). The first region encompasses the frequency range 500 cm
−1 ≤ ω ≤ 800 cm
−1, in which a large concentration of molecular vibrations dominated by C and N atoms and, thus, related to C–N–C stretching modes are observed. Next, in the frequency interval 800 cm
−1 ≤ ω ≤ 1500 cm
−1, the total VDOS is moderately large and uniform with the hydrogen atoms taking on a leading vibrational role along with the carbon atoms. Then three narrow VDOS domains emerge around the frequencies 1700, 3100, and 3500 cm
−1, which are dominated by O–H, C–H, and N–H atoms, respectively. The first of these peaks can be identified with carbonyl C=O stretching modes within each of the two molecules conforming the dimer, while the latter can be identified with intramolecular N–H stretching modes of NOR species. As regards the agreement with the experimental measurements, while the vdW-DFT calculations fail to reproduce N–H stretching frequency experimentally determined at 3175 cm
−1, possibly due to the abovementioned limitations to reproduce features directly related to H-bonding interactions, intramolecular vibrations such as the carbonyl stretching mode around 1700 cm
−1 are well reproduced.

